Garretts Mill, MD Map & Demographics
Garretts Mill Map
Garretts Mill Overview
$58,195
PER CAPITA INCOME
$144,952
AVG FAMILY INCOME
0.34
INEQUALITY / GINI INDEX
314
TOTAL POPULATION
151
MALE POPULATION
163
FEMALE POPULATION
92.64
MALES / 100 FEMALES
107.95
FEMALES / 100 MALES
49.6
MEDIAN AGE
2.3
AVG FAMILY SIZE
1.8
AVG HOUSEHOLD SIZE
167
LABOR FORCE [ PEOPLE ]
53.2%
PERCENT IN LABOR FORCE
Income in Garretts Mill
Income Overview in Garretts Mill
| Characteristic | Number | Measure |
| Per Capita Income | 314 | $58,195 |
| Median Family Income | 77 | $144,952 |
| Mean Family Income | 77 | $146,860 |
| Median Household Income | 177 | $0 |
| Mean Household Income | 177 | $100,792 |
| Income Deficit | 77 | $0 |
| Wage / Income Gap (%) | 314 | 0.00% |
| Wage / Income Gap ($) | 314 | 100.00¢ per $1 |
| Gini / Inequality Index | 314 | 0.34 |
Earnings by Sex in Garretts Mill
| Sex | Number | Average Earnings |
| Male | 81 (38.4%) | $0 |
| Female | 130 (61.6%) | $0 |
| Total | 211 (100.0%) | $0 |
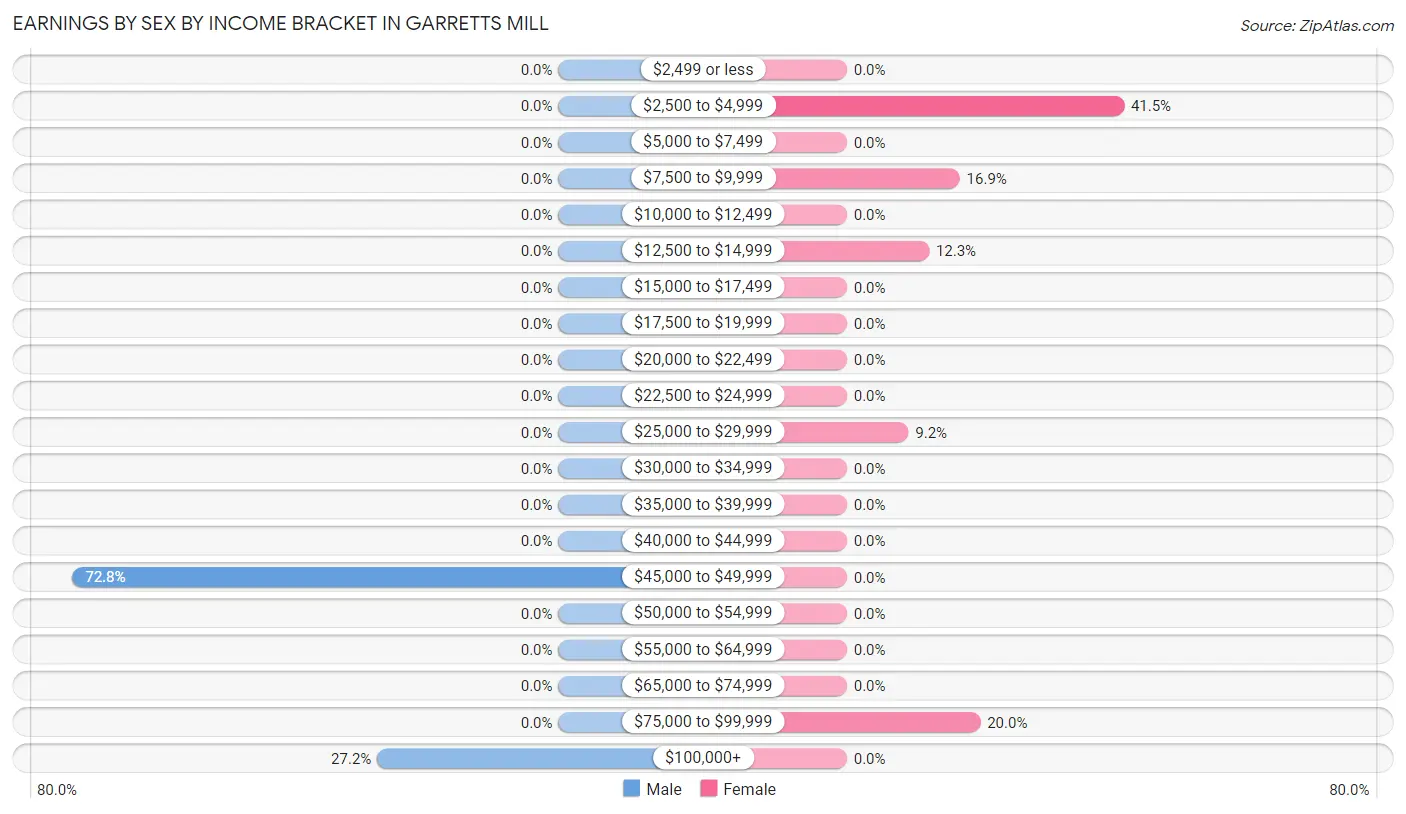
Earnings by Sex by Income Bracket in Garretts Mill
The most common earnings brackets in Garretts Mill are $45,000 to $49,999 for men (59 | 72.8%) and $2,500 to $4,999 for women (54 | 41.5%).
| Income | Male | Female |
| $2,499 or less | 0 (0.0%) | 0 (0.0%) |
| $2,500 to $4,999 | 0 (0.0%) | 54 (41.5%) |
| $5,000 to $7,499 | 0 (0.0%) | 0 (0.0%) |
| $7,500 to $9,999 | 0 (0.0%) | 22 (16.9%) |
| $10,000 to $12,499 | 0 (0.0%) | 0 (0.0%) |
| $12,500 to $14,999 | 0 (0.0%) | 16 (12.3%) |
| $15,000 to $17,499 | 0 (0.0%) | 0 (0.0%) |
| $17,500 to $19,999 | 0 (0.0%) | 0 (0.0%) |
| $20,000 to $22,499 | 0 (0.0%) | 0 (0.0%) |
| $22,500 to $24,999 | 0 (0.0%) | 0 (0.0%) |
| $25,000 to $29,999 | 0 (0.0%) | 12 (9.2%) |
| $30,000 to $34,999 | 0 (0.0%) | 0 (0.0%) |
| $35,000 to $39,999 | 0 (0.0%) | 0 (0.0%) |
| $40,000 to $44,999 | 0 (0.0%) | 0 (0.0%) |
| $45,000 to $49,999 | 59 (72.8%) | 0 (0.0%) |
| $50,000 to $54,999 | 0 (0.0%) | 0 (0.0%) |
| $55,000 to $64,999 | 0 (0.0%) | 0 (0.0%) |
| $65,000 to $74,999 | 0 (0.0%) | 0 (0.0%) |
| $75,000 to $99,999 | 0 (0.0%) | 26 (20.0%) |
| $100,000+ | 22 (27.2%) | 0 (0.0%) |
| Total | 81 (100.0%) | 130 (100.0%) |
Earnings by Sex by Educational Attainment in Garretts Mill
| Educational Attainment | Male Income | Female Income |
| Less than High School | - | - |
| High School Diploma | - | - |
| College or Associate's Degree | - | - |
| Bachelor's Degree | - | - |
| Graduate Degree | - | - |
| Total | - | - |
Family Income in Garretts Mill
Family Income Brackets in Garretts Mill
According to the Garretts Mill family income data, there are 38 families falling into the $150,000 to $199,999 income range, which is the most common income bracket and makes up 49.3% of all families.
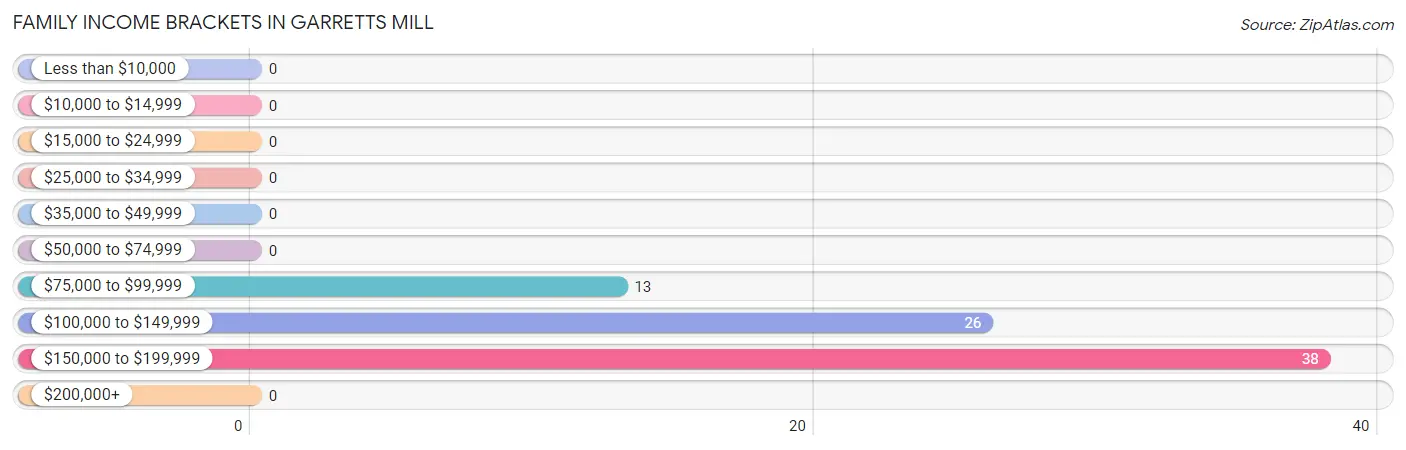
| Income Bracket | # Families | % Families |
| Less than $10,000 | 0 | 0.0% |
| $10,000 to $14,999 | 0 | 0.0% |
| $15,000 to $24,999 | 0 | 0.0% |
| $25,000 to $34,999 | 0 | 0.0% |
| $35,000 to $49,999 | 0 | 0.0% |
| $50,000 to $74,999 | 0 | 0.0% |
| $75,000 to $99,999 | 13 | 16.9% |
| $100,000 to $149,999 | 26 | 33.8% |
| $150,000 to $199,999 | 38 | 49.4% |
| $200,000+ | 0 | 0.0% |
Family Income by Famaliy Size in Garretts Mill
2-person families (55 | 71.4%) account for the highest median family income in Garretts Mill with $143,894 per family, while 2-person families (55 | 71.4%) have the highest median income of $71,947 per family member.
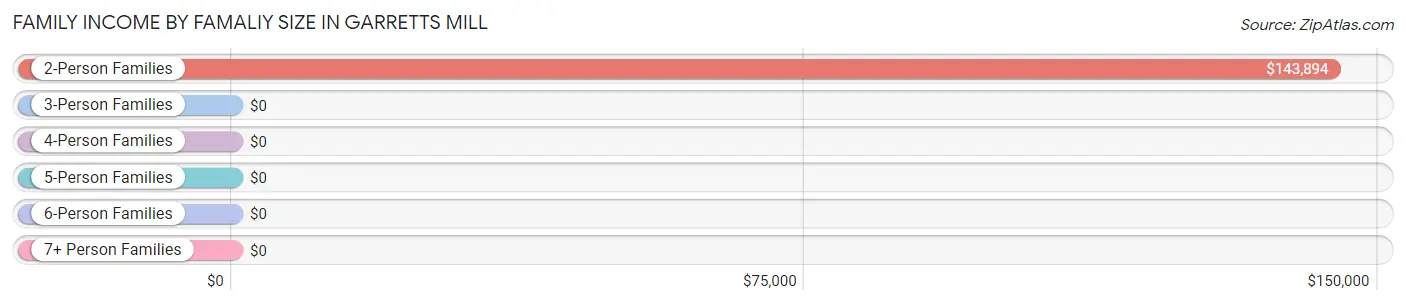
| Income Bracket | # Families | Median Income |
| 2-Person Families | 55 (71.4%) | $143,894 |
| 3-Person Families | 22 (28.6%) | $0 |
| 4-Person Families | 0 (0.0%) | $0 |
| 5-Person Families | 0 (0.0%) | $0 |
| 6-Person Families | 0 (0.0%) | $0 |
| 7+ Person Families | 0 (0.0%) | $0 |
| Total | 77 (100.0%) | $144,952 |
Family Income by Number of Earners in Garretts Mill
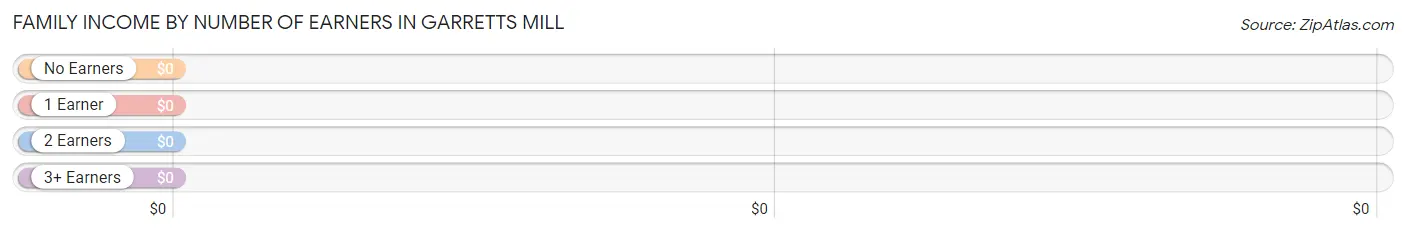
| Number of Earners | # Families | Median Income |
| No Earners | 0 (0.0%) | $0 |
| 1 Earner | 29 (37.7%) | $0 |
| 2 Earners | 48 (62.3%) | $0 |
| 3+ Earners | 0 (0.0%) | $0 |
| Total | 77 (100.0%) | $144,952 |
Household Income in Garretts Mill
Household Income Brackets in Garretts Mill
With 77 households falling in the category, the $50,000 to $74,999 income range is the most frequent in Garretts Mill, accounting for 43.5% of all households.
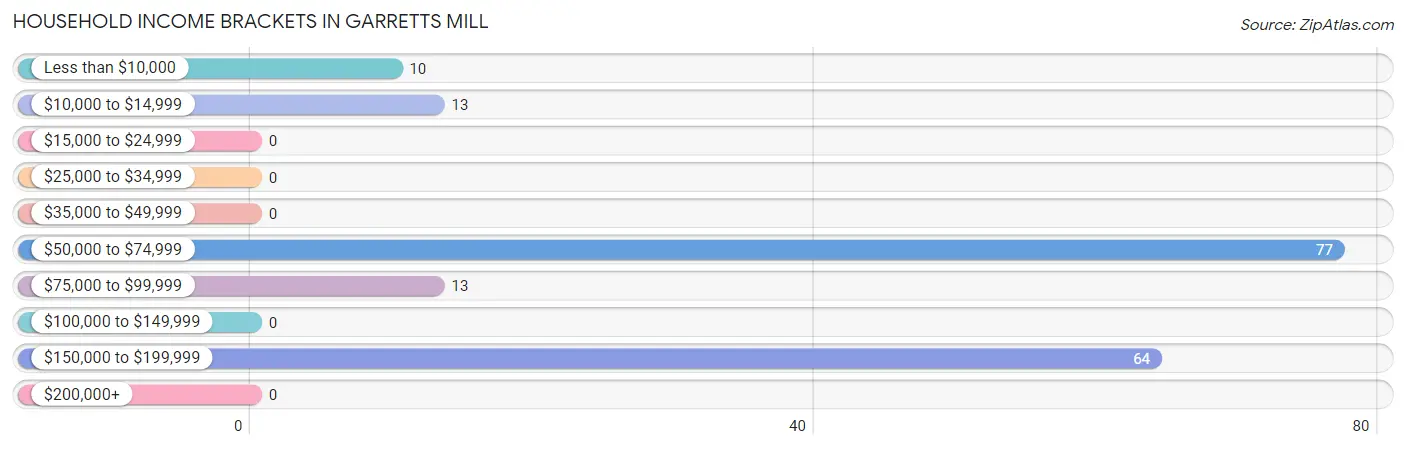
| Income Bracket | # Households | % Households |
| Less than $10,000 | 10 | 5.6% |
| $10,000 to $14,999 | 13 | 7.3% |
| $15,000 to $24,999 | 0 | 0.0% |
| $25,000 to $34,999 | 0 | 0.0% |
| $35,000 to $49,999 | 0 | 0.0% |
| $50,000 to $74,999 | 77 | 43.5% |
| $75,000 to $99,999 | 13 | 7.3% |
| $100,000 to $149,999 | 0 | 0.0% |
| $150,000 to $199,999 | 64 | 36.2% |
| $200,000+ | 0 | 0.0% |
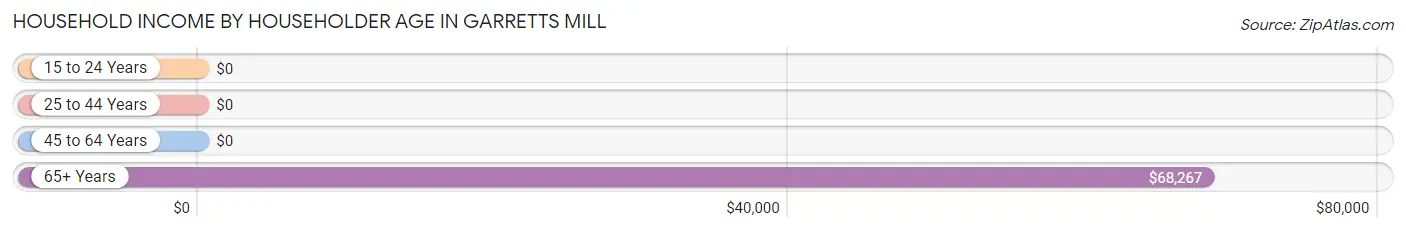
Household Income by Householder Age in Garretts Mill
The median household income in Garretts Mill is $0, with the highest median household income of $68,267 found in the 65+ years age bracket for the primary householder. A total of 119 households (67.2%) fall into this category.
| Income Bracket | # Households | Median Income |
| 15 to 24 Years | 0 (0.0%) | $0 |
| 25 to 44 Years | 36 (20.3%) | $0 |
| 45 to 64 Years | 22 (12.4%) | $0 |
| 65+ Years | 119 (67.2%) | $68,267 |
| Total | 177 (100.0%) | $0 |
Poverty in Garretts Mill
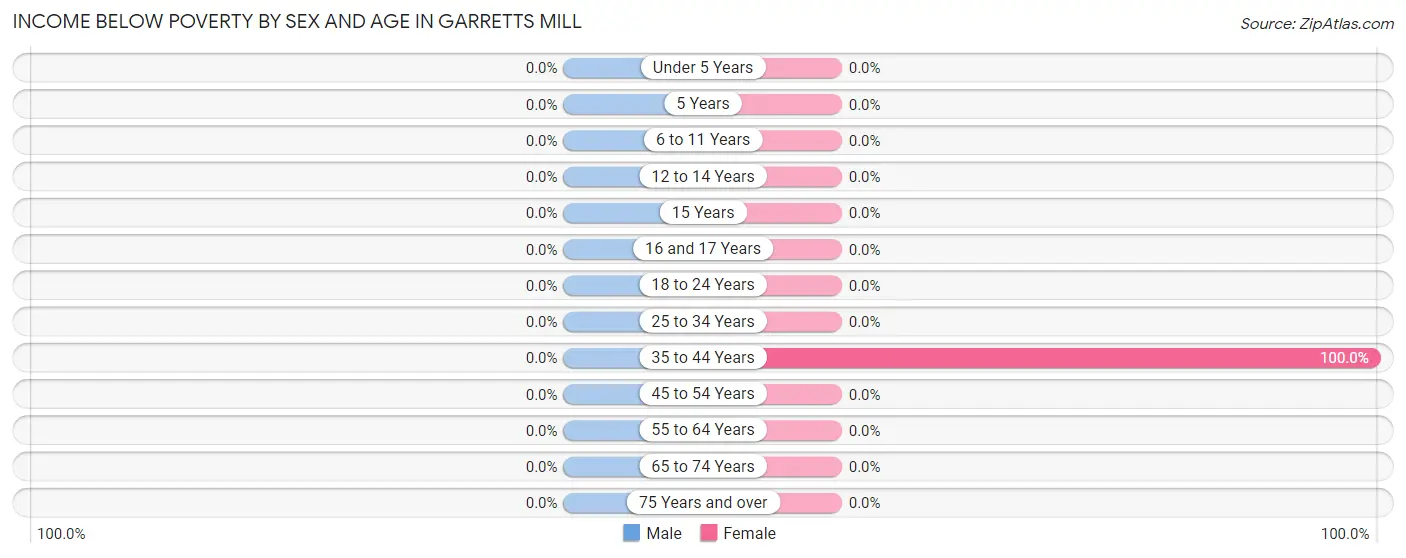
Income Below Poverty by Sex and Age in Garretts Mill
| Age Bracket | Male | Female |
| Under 5 Years | 0 (0.0%) | 0 (0.0%) |
| 5 Years | 0 (0.0%) | 0 (0.0%) |
| 6 to 11 Years | 0 (0.0%) | 0 (0.0%) |
| 12 to 14 Years | 0 (0.0%) | 0 (0.0%) |
| 15 Years | 0 (0.0%) | 0 (0.0%) |
| 16 and 17 Years | 0 (0.0%) | 0 (0.0%) |
| 18 to 24 Years | 0 (0.0%) | 0 (0.0%) |
| 25 to 34 Years | 0 (0.0%) | 0 (0.0%) |
| 35 to 44 Years | 0 (0.0%) | 10 (100.0%) |
| 45 to 54 Years | 0 (0.0%) | 0 (0.0%) |
| 55 to 64 Years | 0 (0.0%) | 0 (0.0%) |
| 65 to 74 Years | 0 (0.0%) | 0 (0.0%) |
| 75 Years and over | 0 (0.0%) | 0 (0.0%) |
| Total | 0 (0.0%) | 10 (6.1%) |
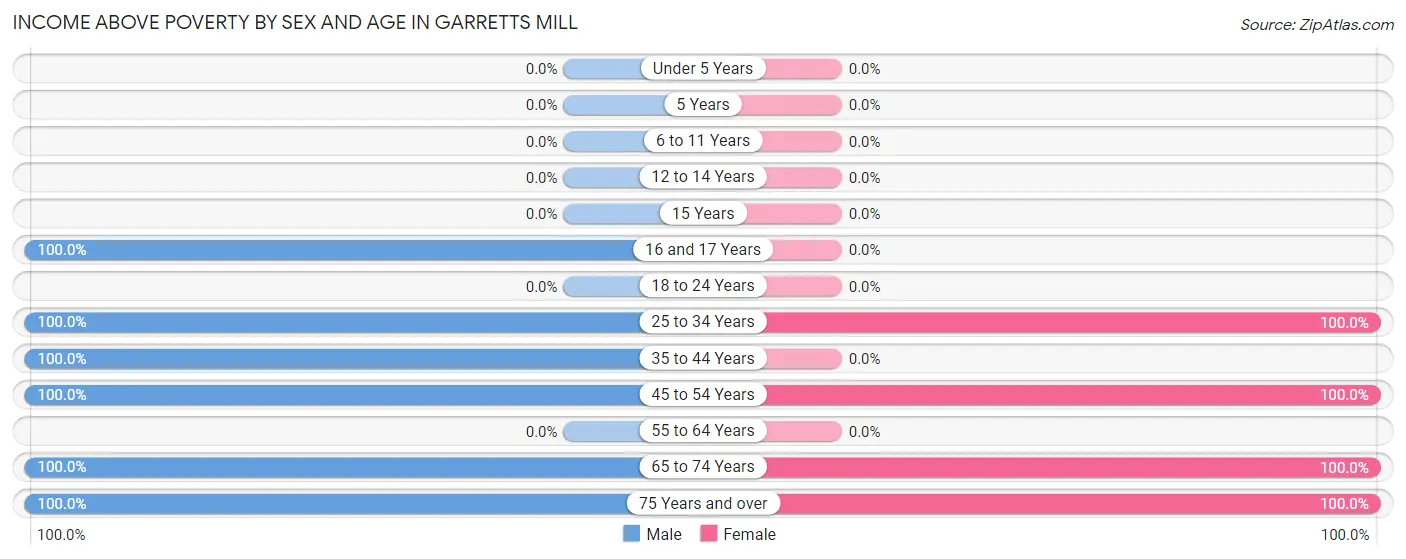
Income Above Poverty by Sex and Age in Garretts Mill
According to the poverty statistics in Garretts Mill, males aged 16 and 17 years and females aged 25 to 34 years are the age groups that are most secure financially, with 100.0% of males and 100.0% of females in these age groups living above the poverty line.
| Age Bracket | Male | Female |
| Under 5 Years | 0 (0.0%) | 0 (0.0%) |
| 5 Years | 0 (0.0%) | 0 (0.0%) |
| 6 to 11 Years | 0 (0.0%) | 0 (0.0%) |
| 12 to 14 Years | 0 (0.0%) | 0 (0.0%) |
| 15 Years | 0 (0.0%) | 0 (0.0%) |
| 16 and 17 Years | 27 (100.0%) | 0 (0.0%) |
| 18 to 24 Years | 0 (0.0%) | 0 (0.0%) |
| 25 to 34 Years | 23 (100.0%) | 26 (100.0%) |
| 35 to 44 Years | 36 (100.0%) | 0 (0.0%) |
| 45 to 54 Years | 22 (100.0%) | 22 (100.0%) |
| 55 to 64 Years | 0 (0.0%) | 0 (0.0%) |
| 65 to 74 Years | 30 (100.0%) | 72 (100.0%) |
| 75 Years and over | 13 (100.0%) | 33 (100.0%) |
| Total | 151 (100.0%) | 153 (93.9%) |
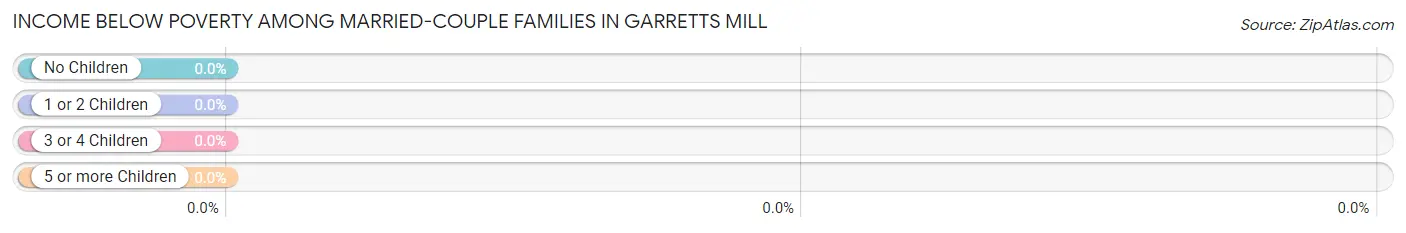
Income Below Poverty Among Married-Couple Families in Garretts Mill
| Children | Above Poverty | Below Poverty |
| No Children | 55 (100.0%) | 0 (0.0%) |
| 1 or 2 Children | 22 (100.0%) | 0 (0.0%) |
| 3 or 4 Children | 0 (0.0%) | 0 (0.0%) |
| 5 or more Children | 0 (0.0%) | 0 (0.0%) |
| Total | 77 (100.0%) | 0 (0.0%) |
Income Below Poverty Among Single-Parent Households in Garretts Mill
| Children | Single Father | Single Mother |
| No Children | 0 (0.0%) | 0 (0.0%) |
| 1 or 2 Children | 0 (0.0%) | 0 (0.0%) |
| 3 or 4 Children | 0 (0.0%) | 0 (0.0%) |
| 5 or more Children | 0 (0.0%) | 0 (0.0%) |
| Total | 0 (0.0%) | 0 (0.0%) |
Income Below Poverty Among Married-Couple vs Single-Parent Households in Garretts Mill
| Children | Married-Couple Families | Single-Parent Households |
| No Children | 0 (0.0%) | 0 (0.0%) |
| 1 or 2 Children | 0 (0.0%) | 0 (0.0%) |
| 3 or 4 Children | 0 (0.0%) | 0 (0.0%) |
| 5 or more Children | 0 (0.0%) | 0 (0.0%) |
| Total | 0 (0.0%) | 0 (0.0%) |
Race in Garretts Mill
The most populous races in Garretts Mill are , and White / Caucasian (314 | 100.0%).
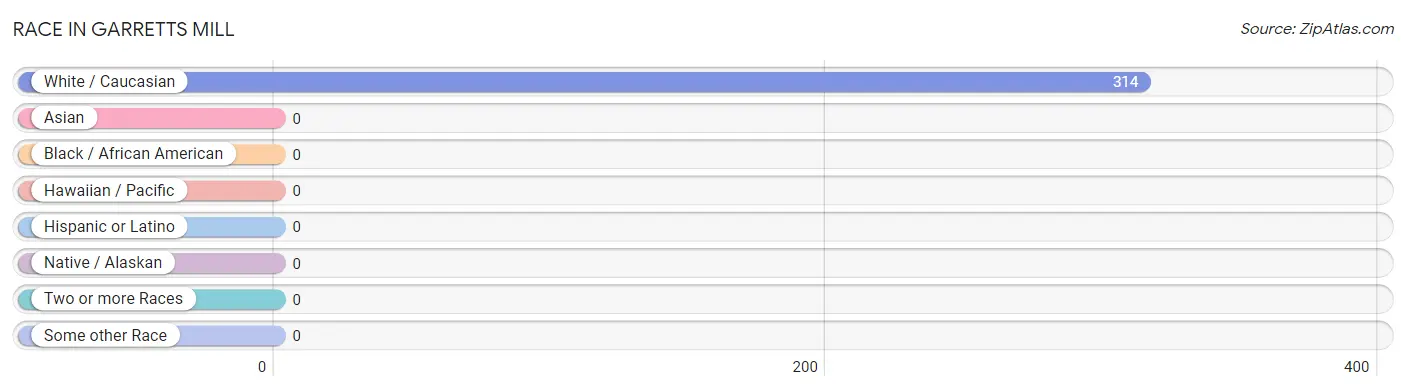
| Race | # Population | % Population |
| Asian | 0 | 0.0% |
| Black / African American | 0 | 0.0% |
| Hawaiian / Pacific | 0 | 0.0% |
| Hispanic or Latino | 0 | 0.0% |
| Native / Alaskan | 0 | 0.0% |
| White / Caucasian | 314 | 100.0% |
| Two or more Races | 0 | 0.0% |
| Some other Race | 0 | 0.0% |
| Total | 314 | 100.0% |
Ancestry in Garretts Mill
The most populous ancestries reported in Garretts Mill are Northern European (44 | 14.0%), German (42 | 13.4%), Arab (36 | 11.5%), Moroccan (36 | 11.5%), and English (33 | 10.5%), together accounting for 60.8% of all Garretts Mill residents.
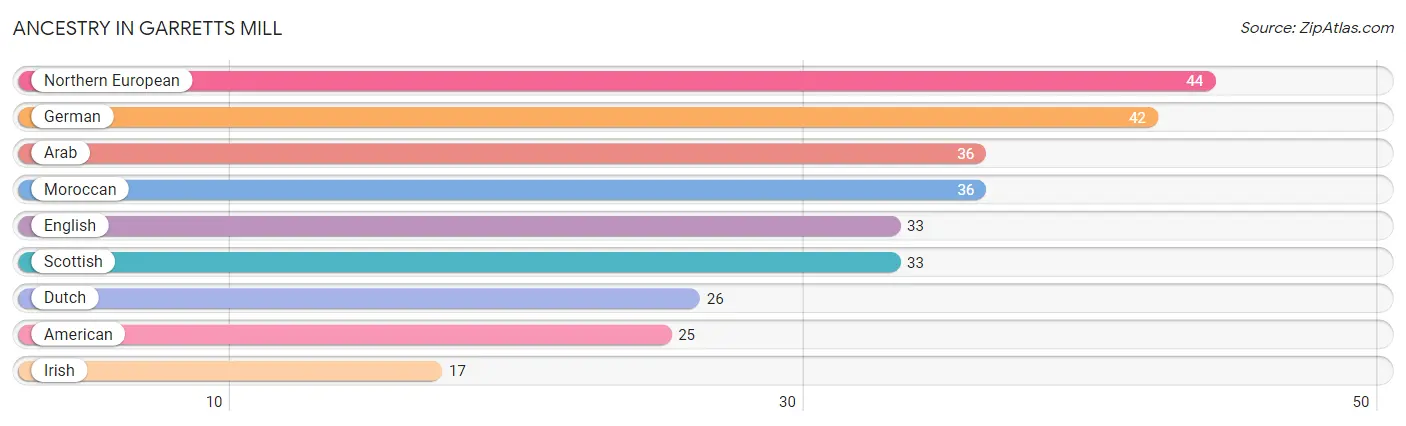
| Ancestry | # Population | % Population |
| American | 25 | 8.0% |
| Arab | 36 | 11.5% |
| Dutch | 26 | 8.3% |
| English | 33 | 10.5% |
| German | 42 | 13.4% |
| Irish | 17 | 5.4% |
| Moroccan | 36 | 11.5% |
| Northern European | 44 | 14.0% |
| Scottish | 33 | 10.5% | View All 9 Rows |
Immigrants in Garretts Mill

| Immigration Origin | # Population | % Population | View All 0 Rows |
Sex and Age in Garretts Mill
Sex and Age in Garretts Mill
The most populous age groups in Garretts Mill are 35 to 39 Years (36 | 23.8%) for men and 65 to 69 Years (60 | 36.8%) for women.
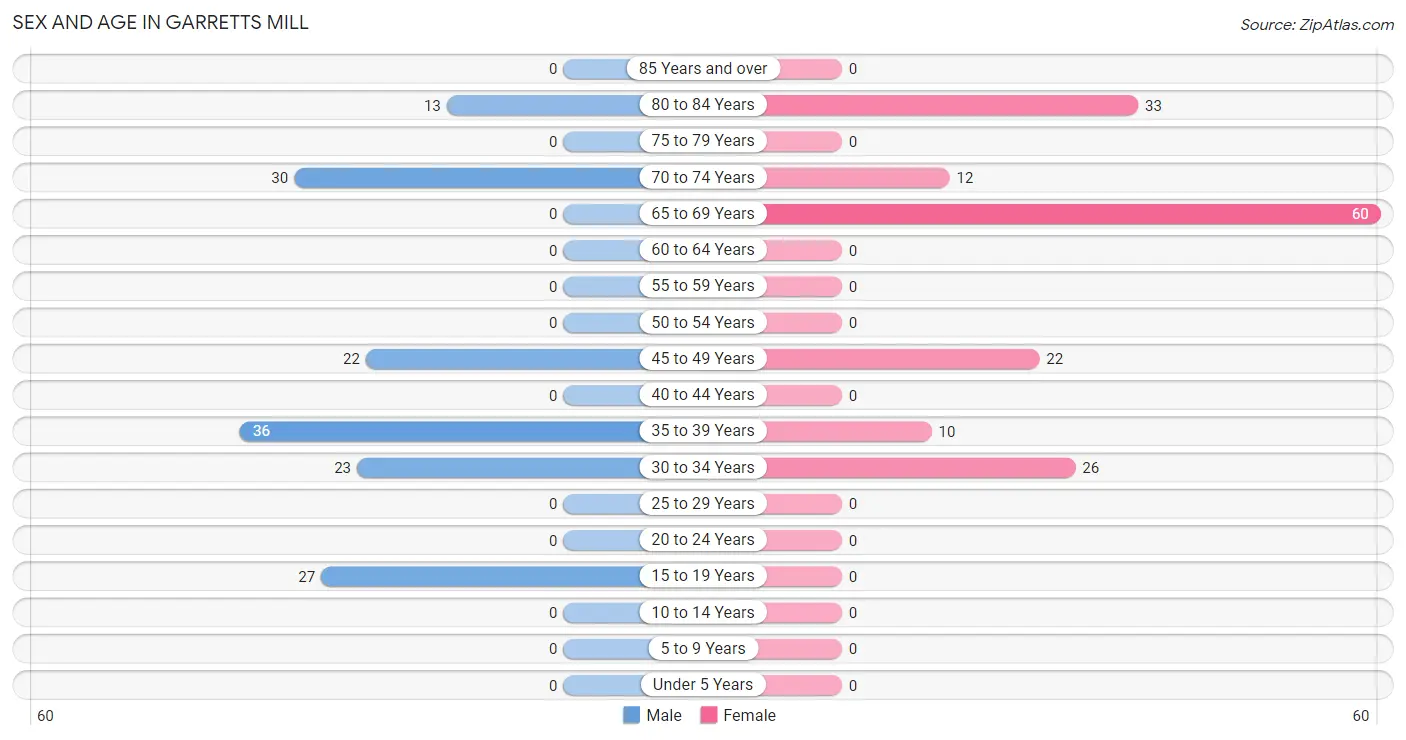
| Age Bracket | Male | Female |
| Under 5 Years | 0 (0.0%) | 0 (0.0%) |
| 5 to 9 Years | 0 (0.0%) | 0 (0.0%) |
| 10 to 14 Years | 0 (0.0%) | 0 (0.0%) |
| 15 to 19 Years | 27 (17.9%) | 0 (0.0%) |
| 20 to 24 Years | 0 (0.0%) | 0 (0.0%) |
| 25 to 29 Years | 0 (0.0%) | 0 (0.0%) |
| 30 to 34 Years | 23 (15.2%) | 26 (16.0%) |
| 35 to 39 Years | 36 (23.8%) | 10 (6.1%) |
| 40 to 44 Years | 0 (0.0%) | 0 (0.0%) |
| 45 to 49 Years | 22 (14.6%) | 22 (13.5%) |
| 50 to 54 Years | 0 (0.0%) | 0 (0.0%) |
| 55 to 59 Years | 0 (0.0%) | 0 (0.0%) |
| 60 to 64 Years | 0 (0.0%) | 0 (0.0%) |
| 65 to 69 Years | 0 (0.0%) | 60 (36.8%) |
| 70 to 74 Years | 30 (19.9%) | 12 (7.4%) |
| 75 to 79 Years | 0 (0.0%) | 0 (0.0%) |
| 80 to 84 Years | 13 (8.6%) | 33 (20.3%) |
| 85 Years and over | 0 (0.0%) | 0 (0.0%) |
| Total | 151 (100.0%) | 163 (100.0%) |
Families and Households in Garretts Mill
Median Family Size in Garretts Mill
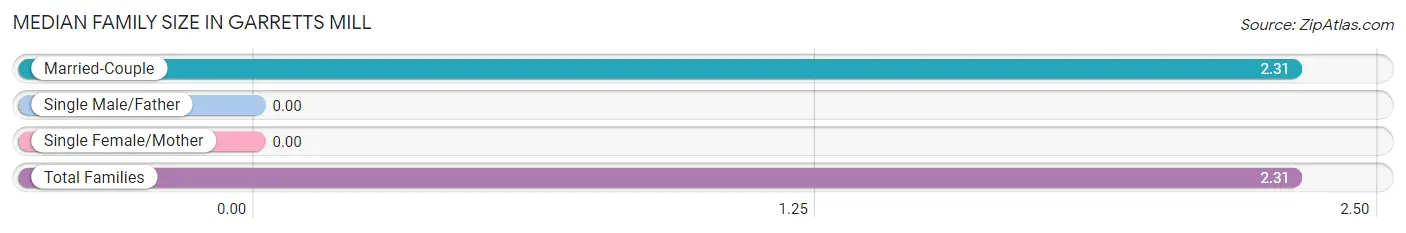
| Family Type | # Families | Family Size |
| Married-Couple | 77 (100.0%) | 2.31 |
| Single Male/Father | 0 (0.0%) | - |
| Single Female/Mother | 0 (0.0%) | - |
| Total Families | 77 (100.0%) | 2.31 |
Median Household Size in Garretts Mill
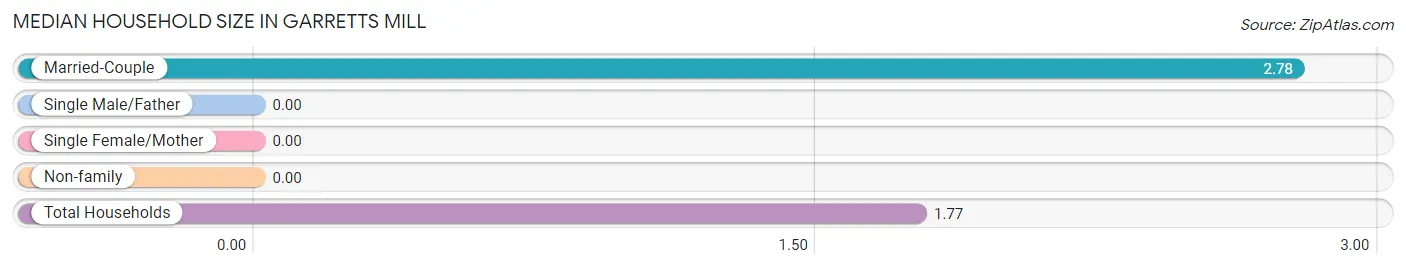
| Household Type | # Households | Household Size |
| Married-Couple | 77 (43.5%) | 2.78 |
| Single Male/Father | 0 (0.0%) | - |
| Single Female/Mother | 0 (0.0%) | - |
| Non-family | 100 (56.5%) | - |
| Total Households | 177 (100.0%) | 1.77 |
Household Size by Marriage Status in Garretts Mill
Out of a total of 177 households in Garretts Mill, 77 (43.5%) are family households, while 100 (56.5%) are nonfamily households. The most numerous type of family households are 3-person households, comprising 48, and the most common type of nonfamily households are 1-person households, comprising 100.
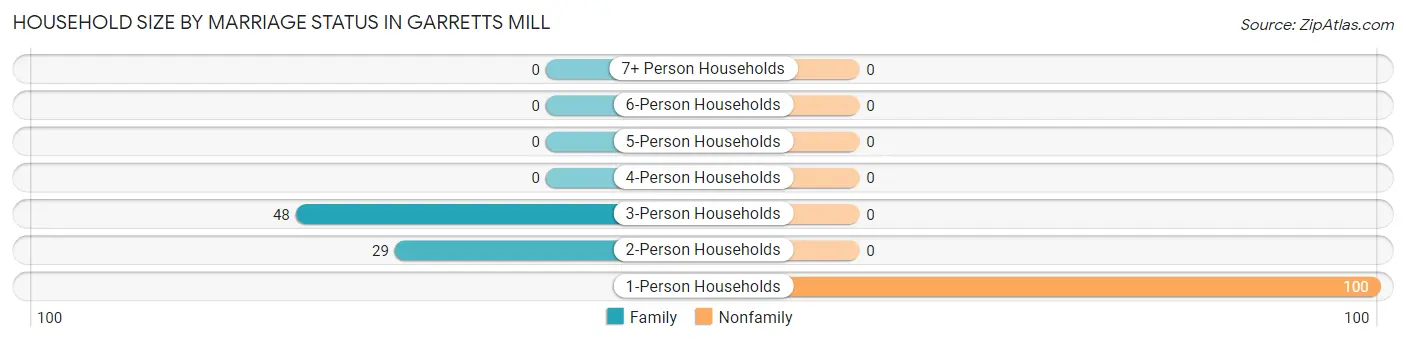
| Household Size | Family Households | Nonfamily Households |
| 1-Person Households | - | 100 (56.5%) |
| 2-Person Households | 29 (16.4%) | 0 (0.0%) |
| 3-Person Households | 48 (27.1%) | 0 (0.0%) |
| 4-Person Households | 0 (0.0%) | 0 (0.0%) |
| 5-Person Households | 0 (0.0%) | 0 (0.0%) |
| 6-Person Households | 0 (0.0%) | 0 (0.0%) |
| 7+ Person Households | 0 (0.0%) | 0 (0.0%) |
| Total | 77 (43.5%) | 100 (56.5%) |
Female Fertility in Garretts Mill
Fertility by Age in Garretts Mill
| Age Bracket | Women with Births | Births / 1,000 Women |
| 15 to 19 years | 0 (0.0%) | 0.0 |
| 20 to 34 years | 0 (0.0%) | 0.0 |
| 35 to 50 years | 0 (0.0%) | 0.0 |
| Total | 0 (0.0%) | 0.0 |
Fertility by Age by Marriage Status in Garretts Mill
| Age Bracket | Married | Unmarried |
| 15 to 19 years | 0 (0.0%) | 0 (0.0%) |
| 20 to 34 years | 0 (0.0%) | 0 (0.0%) |
| 35 to 50 years | 0 (0.0%) | 0 (0.0%) |
| Total | 0 (0.0%) | 0 (0.0%) |
Fertility by Education in Garretts Mill
| Educational Attainment | Women with Births | Births / 1,000 Women |
| Less than High School | 0 (0.0%) | 0.0 |
| High School Diploma | 0 (0.0%) | 0.0 |
| College or Associate's Degree | 0 (0.0%) | 0.0 |
| Bachelor's Degree | 0 (0.0%) | 0.0 |
| Graduate Degree | 0 (0.0%) | 0.0 |
| Total | 0 (0.0%) | 0.0 |
Fertility by Education by Marriage Status in Garretts Mill
| Educational Attainment | Married | Unmarried |
| Less than High School | 0 (0.0%) | 0 (0.0%) |
| High School Diploma | 0 (0.0%) | 0 (0.0%) |
| College or Associate's Degree | 0 (0.0%) | 0 (0.0%) |
| Bachelor's Degree | 0 (0.0%) | 0 (0.0%) |
| Graduate Degree | 0 (0.0%) | 0 (0.0%) |
| Total | 0 (0.0%) | 0 (0.0%) |
Employment Characteristics in Garretts Mill
Employment by Class of Employer in Garretts Mill
Among the 167 employed individuals in Garretts Mill, private company employees (135 | 80.8%), self-employed (incorporated) (22 | 13.2%), and local government employees (10 | 6.0%) make up the most common classes of employment.
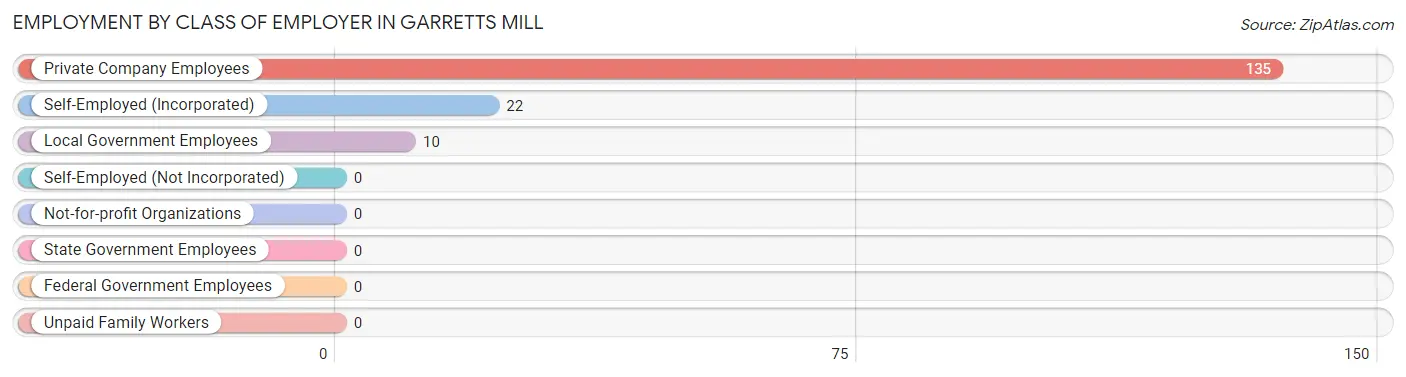
| Employer Class | # Employees | % Employees |
| Private Company Employees | 135 | 80.8% |
| Self-Employed (Incorporated) | 22 | 13.2% |
| Self-Employed (Not Incorporated) | 0 | 0.0% |
| Not-for-profit Organizations | 0 | 0.0% |
| Local Government Employees | 10 | 6.0% |
| State Government Employees | 0 | 0.0% |
| Federal Government Employees | 0 | 0.0% |
| Unpaid Family Workers | 0 | 0.0% |
| Total | 167 | 100.0% |
Employment Status by Age in Garretts Mill
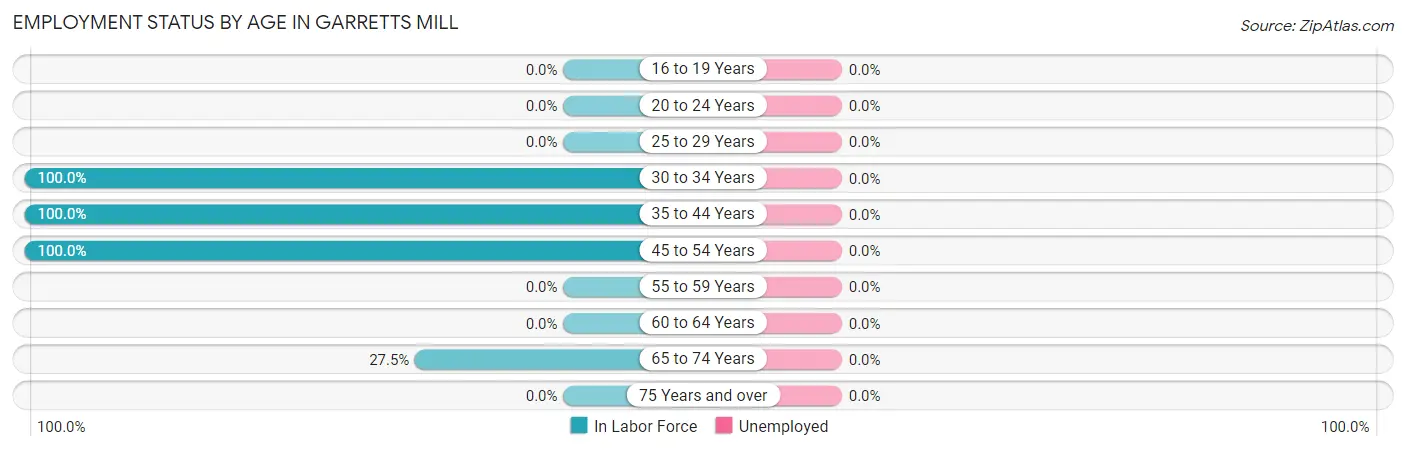
| Age Bracket | In Labor Force | Unemployed |
| 16 to 19 Years | 0 (0.0%) | 0 (0.0%) |
| 20 to 24 Years | 0 (0.0%) | 0 (0.0%) |
| 25 to 29 Years | 0 (0.0%) | 0 (0.0%) |
| 30 to 34 Years | 49 (100.0%) | 0 (0.0%) |
| 35 to 44 Years | 46 (100.0%) | 0 (0.0%) |
| 45 to 54 Years | 44 (100.0%) | 0 (0.0%) |
| 55 to 59 Years | 0 (0.0%) | 0 (0.0%) |
| 60 to 64 Years | 0 (0.0%) | 0 (0.0%) |
| 65 to 74 Years | 28 (27.5%) | 0 (0.0%) |
| 75 Years and over | 0 (0.0%) | 0 (0.0%) |
| Total | 167 (53.2%) | 0 (0.0%) |
Employment Status by Educational Attainment in Garretts Mill
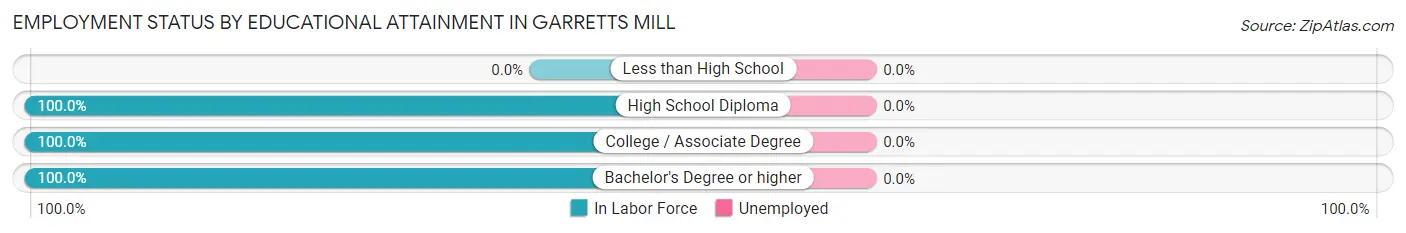
| Educational Attainment | In Labor Force | Unemployed |
| Less than High School | 0 (0.0%) | 0 (0.0%) |
| High School Diploma | 45 (100.0%) | 0 (0.0%) |
| College / Associate Degree | 10 (100.0%) | 0 (0.0%) |
| Bachelor's Degree or higher | 84 (100.0%) | 0 (0.0%) |
| Total | 139 (100.0%) | 0 (0.0%) |
Employment Occupations by Sex in Garretts Mill
Management, Business, Science and Arts Occupations
The most common Management, Business, Science and Arts occupations in Garretts Mill are , and Management (62 | 37.1%).
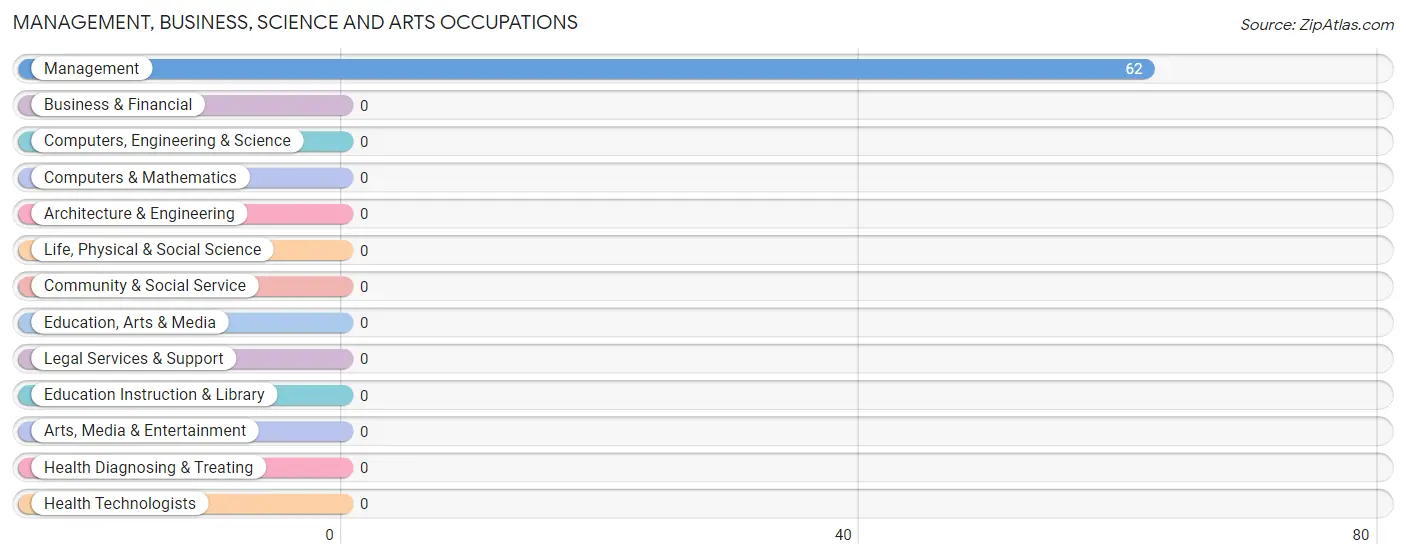
Management, Business, Science and Arts Occupations by Sex
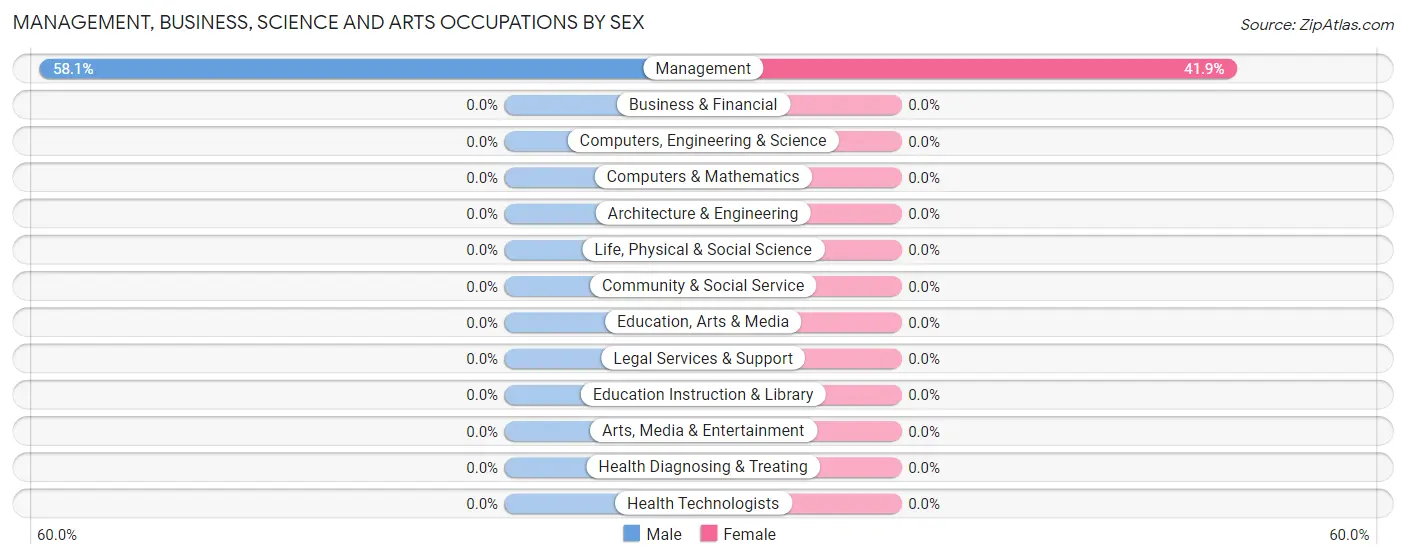
| Occupation | Male | Female |
| Management | 36 (58.1%) | 26 (41.9%) |
| Business & Financial | 0 (0.0%) | 0 (0.0%) |
| Computers, Engineering & Science | 0 (0.0%) | 0 (0.0%) |
| Computers & Mathematics | 0 (0.0%) | 0 (0.0%) |
| Architecture & Engineering | 0 (0.0%) | 0 (0.0%) |
| Life, Physical & Social Science | 0 (0.0%) | 0 (0.0%) |
| Community & Social Service | 0 (0.0%) | 0 (0.0%) |
| Education, Arts & Media | 0 (0.0%) | 0 (0.0%) |
| Legal Services & Support | 0 (0.0%) | 0 (0.0%) |
| Education Instruction & Library | 0 (0.0%) | 0 (0.0%) |
| Arts, Media & Entertainment | 0 (0.0%) | 0 (0.0%) |
| Health Diagnosing & Treating | 0 (0.0%) | 0 (0.0%) |
| Health Technologists | 0 (0.0%) | 0 (0.0%) |
| Total (Category) | 36 (58.1%) | 26 (41.9%) |
| Total (Overall) | 81 (48.5%) | 86 (51.5%) |
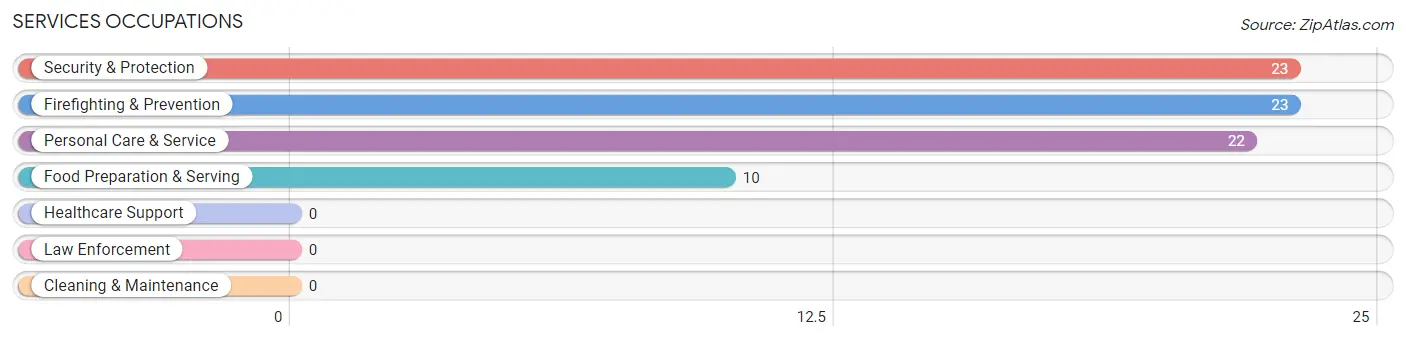
Services Occupations
The most common Services occupations in Garretts Mill are Security & Protection (23 | 13.8%), Firefighting & Prevention (23 | 13.8%), Personal Care & Service (22 | 13.2%), and Food Preparation & Serving (10 | 6.0%).
Services Occupations by Sex
Within the Services occupations in Garretts Mill, the most male-oriented occupations are Security & Protection (100.0%), and Firefighting & Prevention (100.0%), while the most female-oriented occupations are Food Preparation & Serving (100.0%), and Personal Care & Service (100.0%).
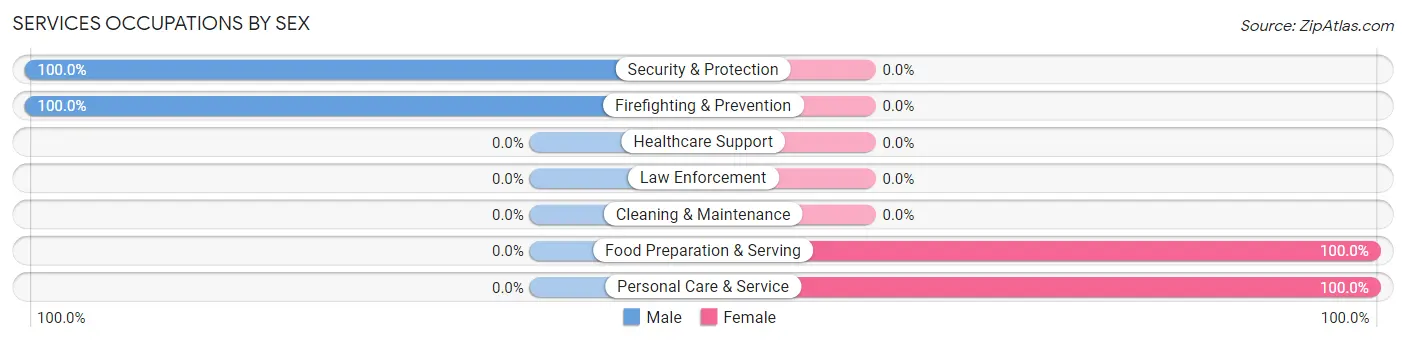
| Occupation | Male | Female |
| Healthcare Support | 0 (0.0%) | 0 (0.0%) |
| Security & Protection | 23 (100.0%) | 0 (0.0%) |
| Firefighting & Prevention | 23 (100.0%) | 0 (0.0%) |
| Law Enforcement | 0 (0.0%) | 0 (0.0%) |
| Food Preparation & Serving | 0 (0.0%) | 10 (100.0%) |
| Cleaning & Maintenance | 0 (0.0%) | 0 (0.0%) |
| Personal Care & Service | 0 (0.0%) | 22 (100.0%) |
| Total (Category) | 23 (41.8%) | 32 (58.2%) |
| Total (Overall) | 81 (48.5%) | 86 (51.5%) |
Sales and Office Occupations
The most common Sales and Office occupations in Garretts Mill are , and Office & Administration (16 | 9.6%).
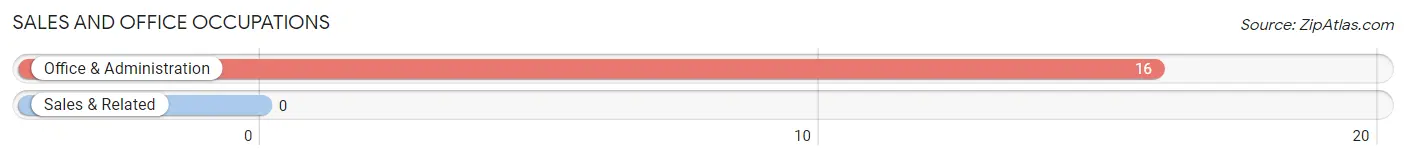
Sales and Office Occupations by Sex
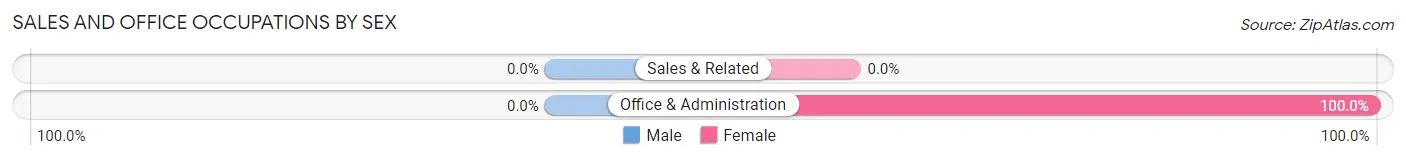
| Occupation | Male | Female |
| Sales & Related | 0 (0.0%) | 0 (0.0%) |
| Office & Administration | 0 (0.0%) | 16 (100.0%) |
| Total (Category) | 0 (0.0%) | 16 (100.0%) |
| Total (Overall) | 81 (48.5%) | 86 (51.5%) |
Natural Resources, Construction and Maintenance Occupations
The most common Natural Resources, Construction and Maintenance occupations in Garretts Mill are , and Installation, Maintenance & Repair (22 | 13.2%).
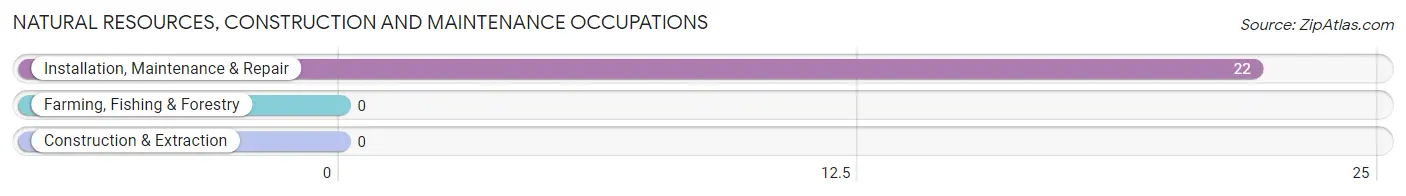
Natural Resources, Construction and Maintenance Occupations by Sex
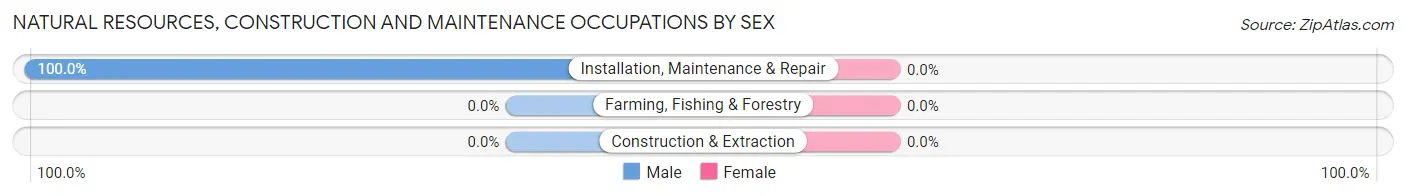
| Occupation | Male | Female |
| Farming, Fishing & Forestry | 0 (0.0%) | 0 (0.0%) |
| Construction & Extraction | 0 (0.0%) | 0 (0.0%) |
| Installation, Maintenance & Repair | 22 (100.0%) | 0 (0.0%) |
| Total (Category) | 22 (100.0%) | 0 (0.0%) |
| Total (Overall) | 81 (48.5%) | 86 (51.5%) |
Production, Transportation and Moving Occupations
The most common Production, Transportation and Moving occupations in Garretts Mill are , and Production (12 | 7.2%).
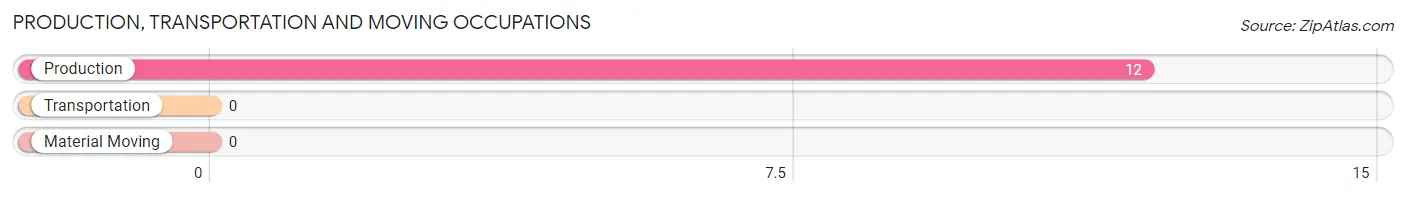
Production, Transportation and Moving Occupations by Sex
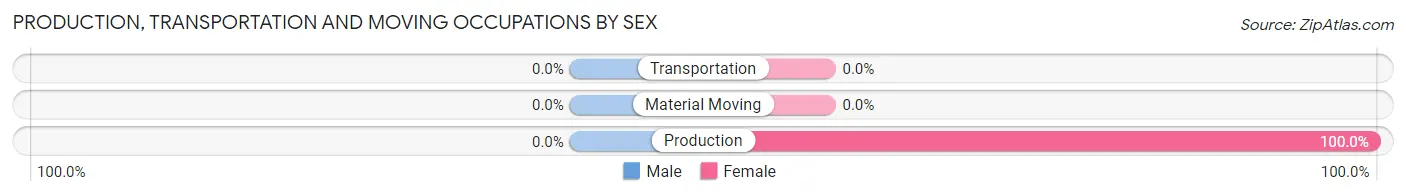
| Occupation | Male | Female |
| Production | 0 (0.0%) | 12 (100.0%) |
| Transportation | 0 (0.0%) | 0 (0.0%) |
| Material Moving | 0 (0.0%) | 0 (0.0%) |
| Total (Category) | 0 (0.0%) | 12 (100.0%) |
| Total (Overall) | 81 (48.5%) | 86 (51.5%) |
Employment Industries by Sex in Garretts Mill
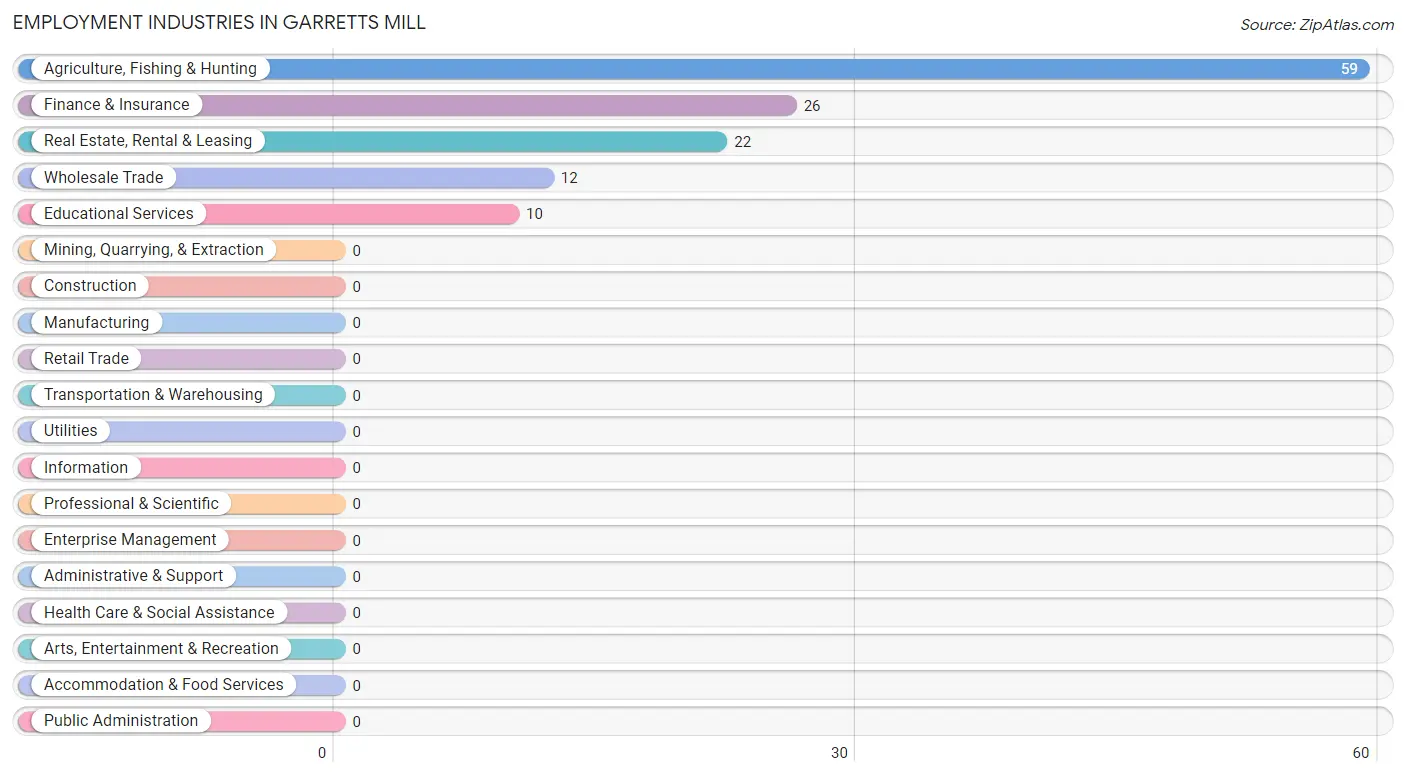
Employment Industries in Garretts Mill
The major employment industries in Garretts Mill include Agriculture, Fishing & Hunting (59 | 35.3%), Finance & Insurance (26 | 15.6%), Real Estate, Rental & Leasing (22 | 13.2%), Wholesale Trade (12 | 7.2%), and Educational Services (10 | 6.0%).
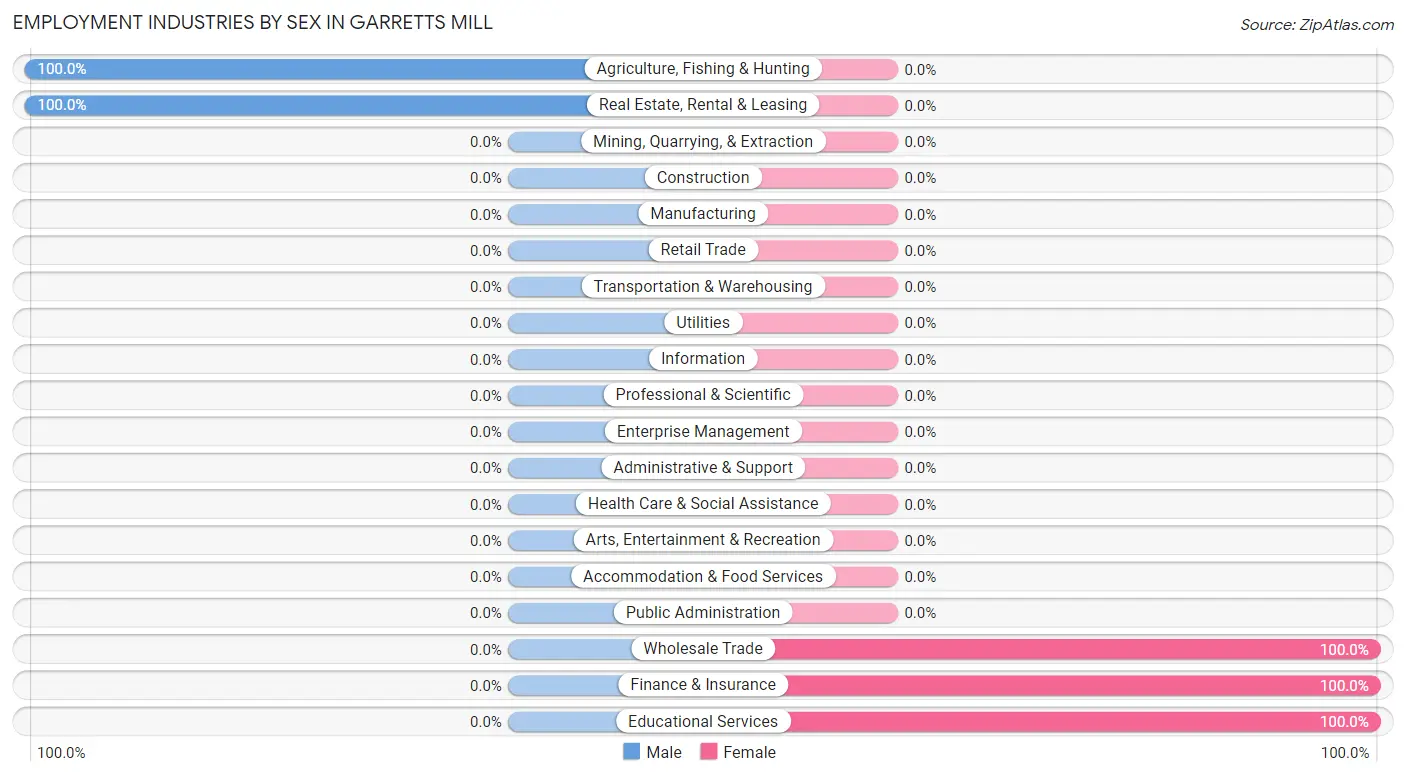
Employment Industries by Sex in Garretts Mill
The Garretts Mill industries that see more men than women are Agriculture, Fishing & Hunting (100.0%), and Real Estate, Rental & Leasing (100.0%), whereas the industries that tend to have a higher number of women are Wholesale Trade (100.0%), Finance & Insurance (100.0%), and Educational Services (100.0%).
| Industry | Male | Female |
| Agriculture, Fishing & Hunting | 59 (100.0%) | 0 (0.0%) |
| Mining, Quarrying, & Extraction | 0 (0.0%) | 0 (0.0%) |
| Construction | 0 (0.0%) | 0 (0.0%) |
| Manufacturing | 0 (0.0%) | 0 (0.0%) |
| Wholesale Trade | 0 (0.0%) | 12 (100.0%) |
| Retail Trade | 0 (0.0%) | 0 (0.0%) |
| Transportation & Warehousing | 0 (0.0%) | 0 (0.0%) |
| Utilities | 0 (0.0%) | 0 (0.0%) |
| Information | 0 (0.0%) | 0 (0.0%) |
| Finance & Insurance | 0 (0.0%) | 26 (100.0%) |
| Real Estate, Rental & Leasing | 22 (100.0%) | 0 (0.0%) |
| Professional & Scientific | 0 (0.0%) | 0 (0.0%) |
| Enterprise Management | 0 (0.0%) | 0 (0.0%) |
| Administrative & Support | 0 (0.0%) | 0 (0.0%) |
| Educational Services | 0 (0.0%) | 10 (100.0%) |
| Health Care & Social Assistance | 0 (0.0%) | 0 (0.0%) |
| Arts, Entertainment & Recreation | 0 (0.0%) | 0 (0.0%) |
| Accommodation & Food Services | 0 (0.0%) | 0 (0.0%) |
| Public Administration | 0 (0.0%) | 0 (0.0%) |
| Total | 81 (48.5%) | 86 (51.5%) |
Education in Garretts Mill
School Enrollment in Garretts Mill
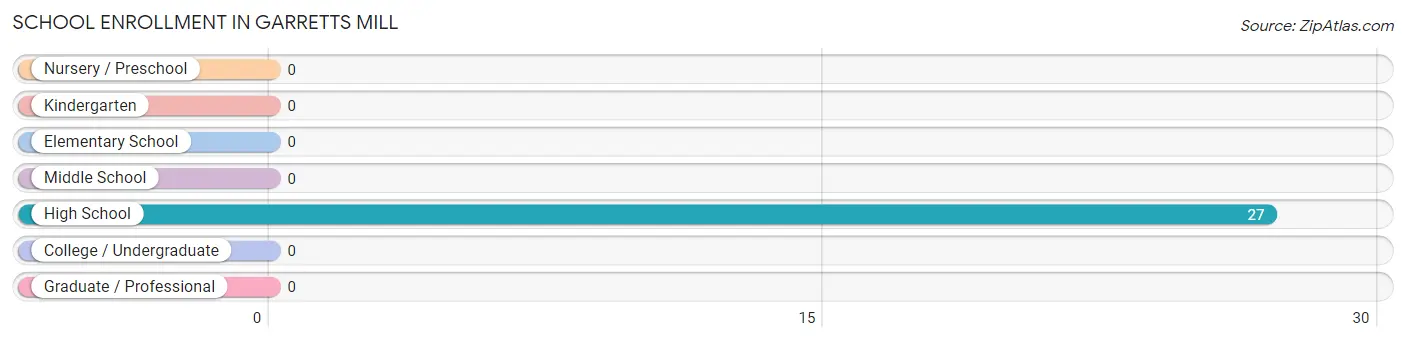
| School Level | # Students | % Students |
| Nursery / Preschool | 0 | 0.0% |
| Kindergarten | 0 | 0.0% |
| Elementary School | 0 | 0.0% |
| Middle School | 0 | 0.0% |
| High School | 27 | 100.0% |
| College / Undergraduate | 0 | 0.0% |
| Graduate / Professional | 0 | 0.0% |
| Total | 27 | 100.0% |
School Enrollment by Age by Funding Source in Garretts Mill
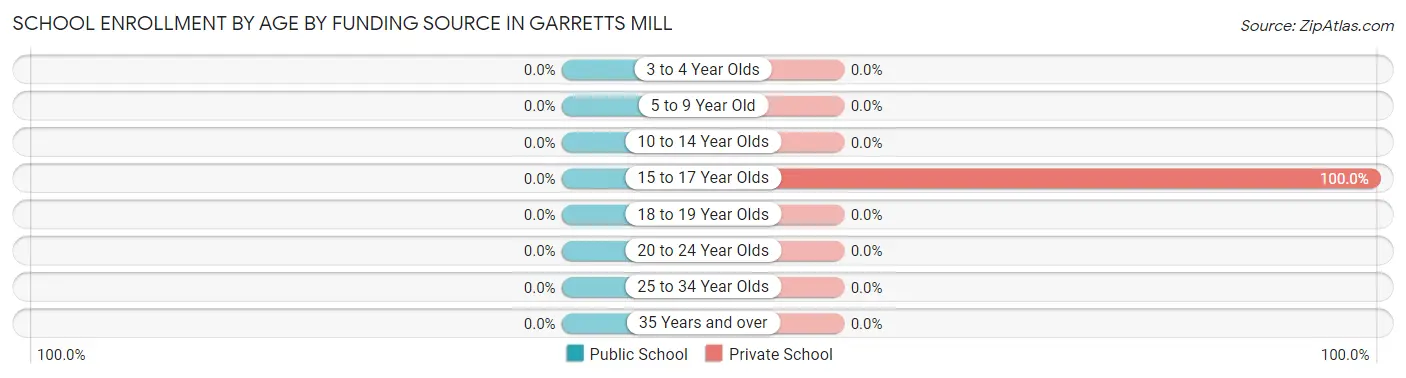
| Age Bracket | Public School | Private School |
| 3 to 4 Year Olds | 0 (0.0%) | 0 (0.0%) |
| 5 to 9 Year Old | 0 (0.0%) | 0 (0.0%) |
| 10 to 14 Year Olds | 0 (0.0%) | 0 (0.0%) |
| 15 to 17 Year Olds | 0 (0.0%) | 27 (100.0%) |
| 18 to 19 Year Olds | 0 (0.0%) | 0 (0.0%) |
| 20 to 24 Year Olds | 0 (0.0%) | 0 (0.0%) |
| 25 to 34 Year Olds | 0 (0.0%) | 0 (0.0%) |
| 35 Years and over | 0 (0.0%) | 0 (0.0%) |
| Total | 0 (0.0%) | 27 (100.0%) |
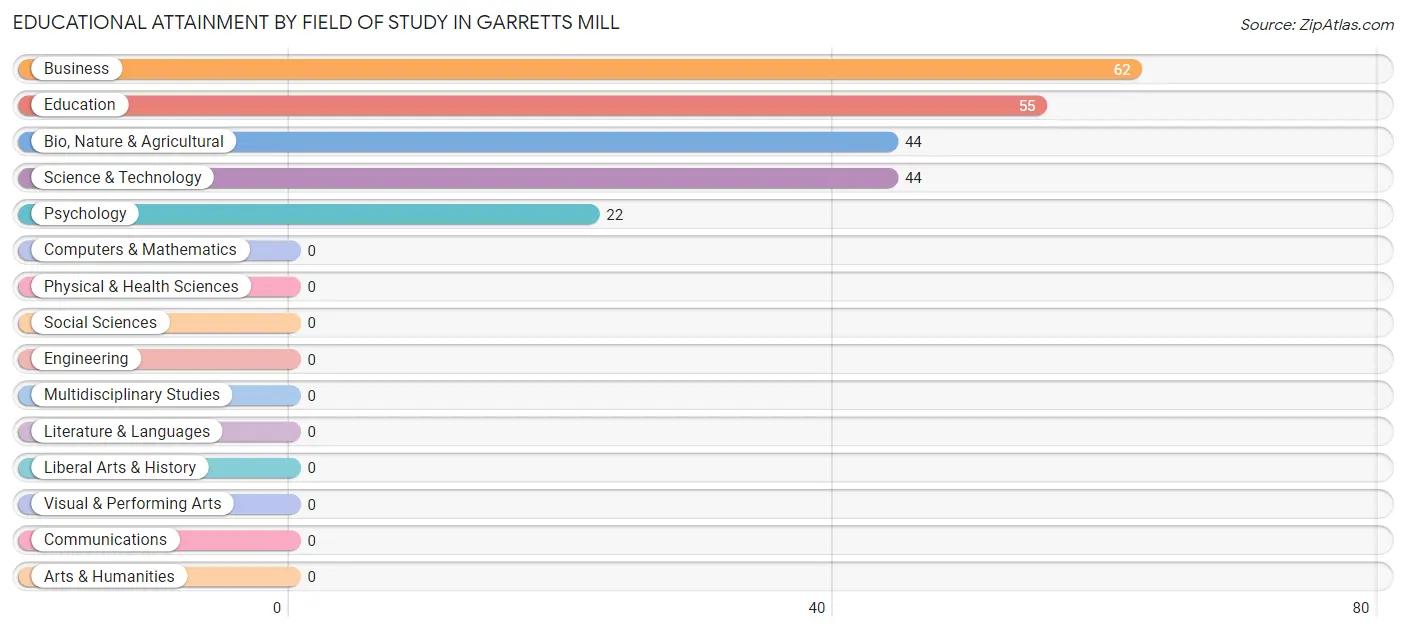
Educational Attainment by Field of Study in Garretts Mill
Business (62 | 27.3%), education (55 | 24.2%), bio, nature & agricultural (44 | 19.4%), science & technology (44 | 19.4%), and psychology (22 | 9.7%) are the most common fields of study among 227 individuals in Garretts Mill who have obtained a bachelor's degree or higher.
| Field of Study | # Graduates | % Graduates |
| Computers & Mathematics | 0 | 0.0% |
| Bio, Nature & Agricultural | 44 | 19.4% |
| Physical & Health Sciences | 0 | 0.0% |
| Psychology | 22 | 9.7% |
| Social Sciences | 0 | 0.0% |
| Engineering | 0 | 0.0% |
| Multidisciplinary Studies | 0 | 0.0% |
| Science & Technology | 44 | 19.4% |
| Business | 62 | 27.3% |
| Education | 55 | 24.2% |
| Literature & Languages | 0 | 0.0% |
| Liberal Arts & History | 0 | 0.0% |
| Visual & Performing Arts | 0 | 0.0% |
| Communications | 0 | 0.0% |
| Arts & Humanities | 0 | 0.0% |
| Total | 227 | 100.0% |
Transportation & Commute in Garretts Mill
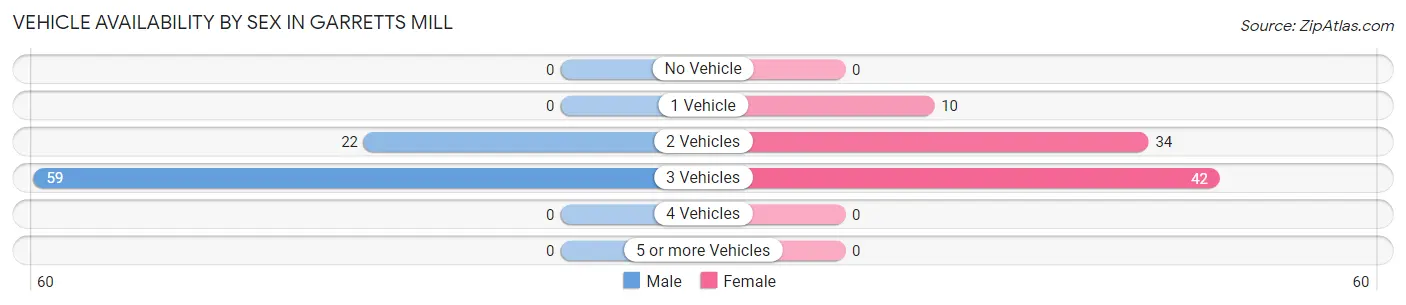
Vehicle Availability by Sex in Garretts Mill
The most prevalent vehicle ownership categories in Garretts Mill are males with 3 vehicles (59, accounting for 72.8%) and females with 3 vehicles (42, making up 68.6%).
| Vehicles Available | Male | Female |
| No Vehicle | 0 (0.0%) | 0 (0.0%) |
| 1 Vehicle | 0 (0.0%) | 10 (11.6%) |
| 2 Vehicles | 22 (27.2%) | 34 (39.5%) |
| 3 Vehicles | 59 (72.8%) | 42 (48.8%) |
| 4 Vehicles | 0 (0.0%) | 0 (0.0%) |
| 5 or more Vehicles | 0 (0.0%) | 0 (0.0%) |
| Total | 81 (100.0%) | 86 (100.0%) |
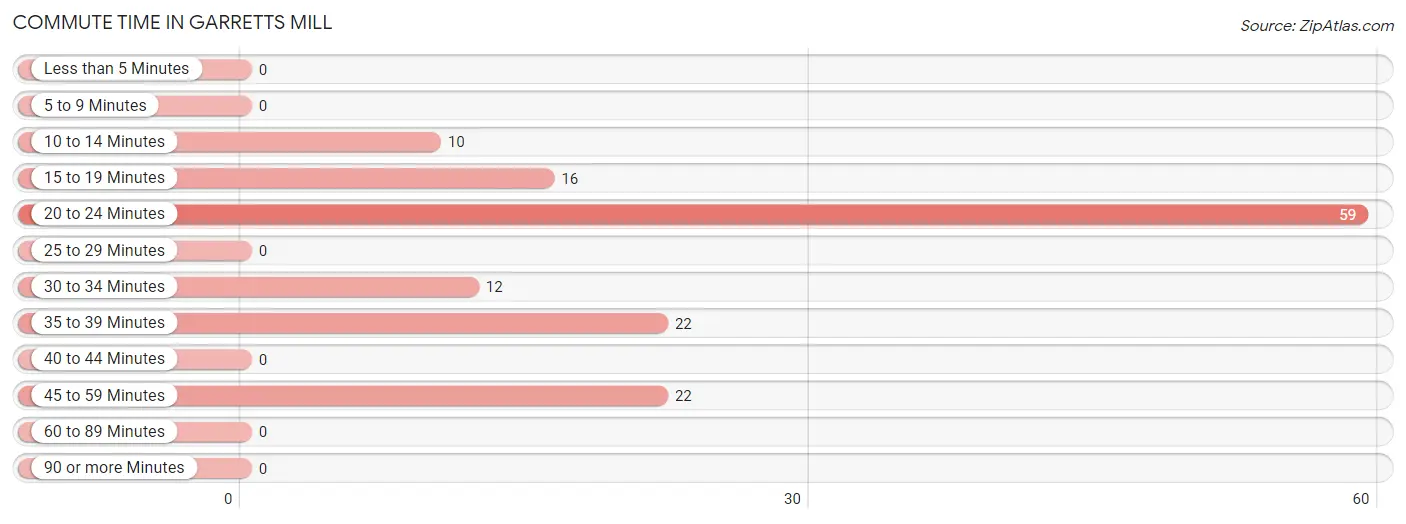
Commute Time in Garretts Mill
The most frequently occuring commute durations in Garretts Mill are 20 to 24 minutes (59 commuters, 41.8%), 35 to 39 minutes (22 commuters, 15.6%), and 45 to 59 minutes (22 commuters, 15.6%).
| Commute Time | # Commuters | % Commuters |
| Less than 5 Minutes | 0 | 0.0% |
| 5 to 9 Minutes | 0 | 0.0% |
| 10 to 14 Minutes | 10 | 7.1% |
| 15 to 19 Minutes | 16 | 11.4% |
| 20 to 24 Minutes | 59 | 41.8% |
| 25 to 29 Minutes | 0 | 0.0% |
| 30 to 34 Minutes | 12 | 8.5% |
| 35 to 39 Minutes | 22 | 15.6% |
| 40 to 44 Minutes | 0 | 0.0% |
| 45 to 59 Minutes | 22 | 15.6% |
| 60 to 89 Minutes | 0 | 0.0% |
| 90 or more Minutes | 0 | 0.0% |
Commute Time by Sex in Garretts Mill
The most common commute times in Garretts Mill are 20 to 24 minutes (59 commuters, 72.8%) for males and 45 to 59 minutes (22 commuters, 36.7%) for females.
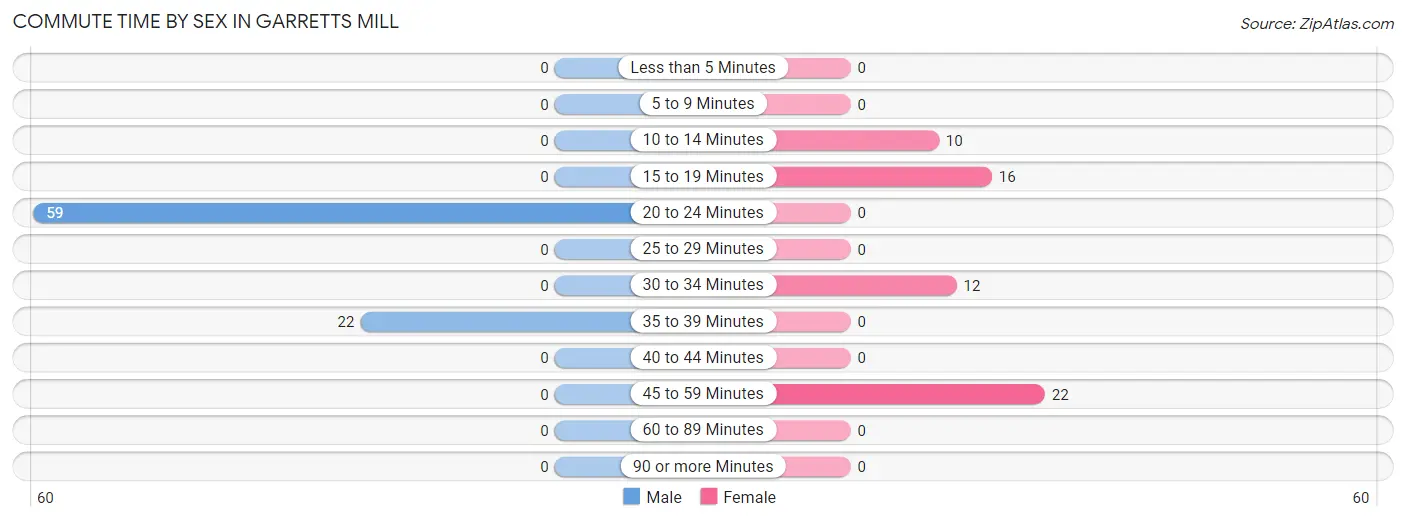
| Commute Time | Male | Female |
| Less than 5 Minutes | 0 (0.0%) | 0 (0.0%) |
| 5 to 9 Minutes | 0 (0.0%) | 0 (0.0%) |
| 10 to 14 Minutes | 0 (0.0%) | 10 (16.7%) |
| 15 to 19 Minutes | 0 (0.0%) | 16 (26.7%) |
| 20 to 24 Minutes | 59 (72.8%) | 0 (0.0%) |
| 25 to 29 Minutes | 0 (0.0%) | 0 (0.0%) |
| 30 to 34 Minutes | 0 (0.0%) | 12 (20.0%) |
| 35 to 39 Minutes | 22 (27.2%) | 0 (0.0%) |
| 40 to 44 Minutes | 0 (0.0%) | 0 (0.0%) |
| 45 to 59 Minutes | 0 (0.0%) | 22 (36.7%) |
| 60 to 89 Minutes | 0 (0.0%) | 0 (0.0%) |
| 90 or more Minutes | 0 (0.0%) | 0 (0.0%) |
Time of Departure to Work by Sex in Garretts Mill
The most frequent times of departure to work in Garretts Mill are 6:00 AM to 6:29 AM (59, 72.8%) for males and 6:00 AM to 6:29 AM (22, 36.7%) for females.
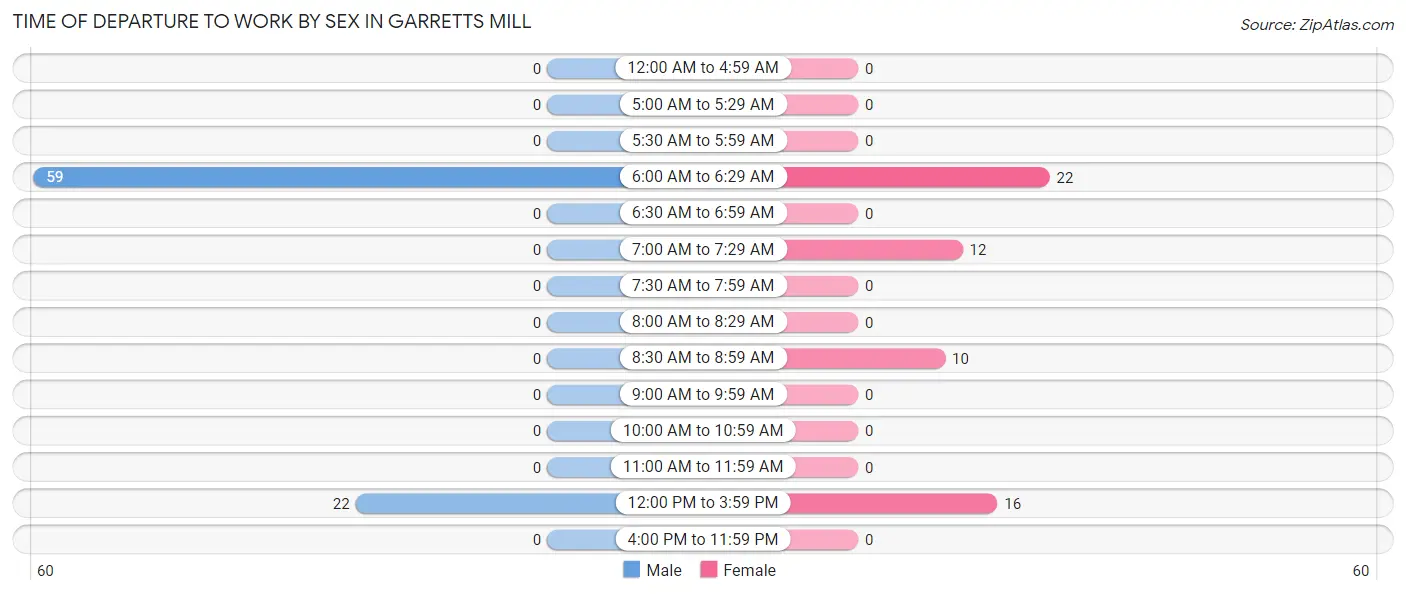
| Time of Departure | Male | Female |
| 12:00 AM to 4:59 AM | 0 (0.0%) | 0 (0.0%) |
| 5:00 AM to 5:29 AM | 0 (0.0%) | 0 (0.0%) |
| 5:30 AM to 5:59 AM | 0 (0.0%) | 0 (0.0%) |
| 6:00 AM to 6:29 AM | 59 (72.8%) | 22 (36.7%) |
| 6:30 AM to 6:59 AM | 0 (0.0%) | 0 (0.0%) |
| 7:00 AM to 7:29 AM | 0 (0.0%) | 12 (20.0%) |
| 7:30 AM to 7:59 AM | 0 (0.0%) | 0 (0.0%) |
| 8:00 AM to 8:29 AM | 0 (0.0%) | 0 (0.0%) |
| 8:30 AM to 8:59 AM | 0 (0.0%) | 10 (16.7%) |
| 9:00 AM to 9:59 AM | 0 (0.0%) | 0 (0.0%) |
| 10:00 AM to 10:59 AM | 0 (0.0%) | 0 (0.0%) |
| 11:00 AM to 11:59 AM | 0 (0.0%) | 0 (0.0%) |
| 12:00 PM to 3:59 PM | 22 (27.2%) | 16 (26.7%) |
| 4:00 PM to 11:59 PM | 0 (0.0%) | 0 (0.0%) |
| Total | 81 (100.0%) | 60 (100.0%) |
Housing Occupancy in Garretts Mill
Occupancy by Ownership in Garretts Mill
Of the total 177 dwellings in Garretts Mill, owner-occupied units account for 96 (54.2%), while renter-occupied units make up 81 (45.8%).
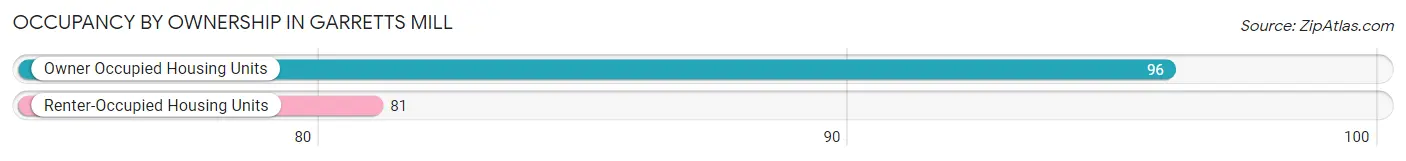
| Occupancy | # Housing Units | % Housing Units |
| Owner Occupied Housing Units | 96 | 54.2% |
| Renter-Occupied Housing Units | 81 | 45.8% |
| Total Occupied Housing Units | 177 | 100.0% |
Occupancy by Household Size in Garretts Mill
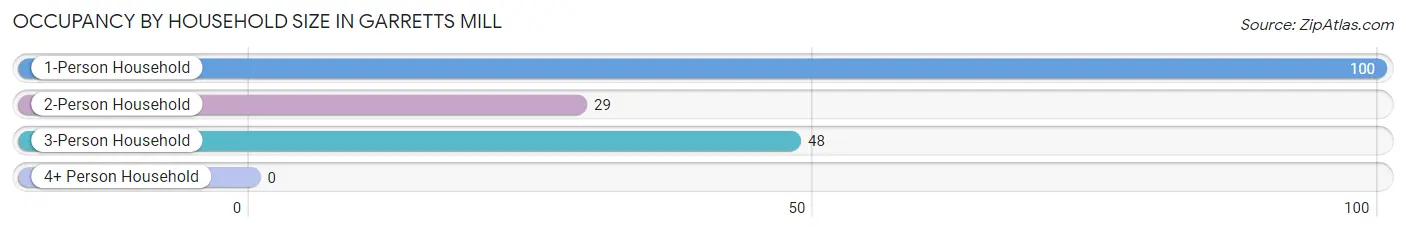
| Household Size | # Housing Units | % Housing Units |
| 1-Person Household | 100 | 56.5% |
| 2-Person Household | 29 | 16.4% |
| 3-Person Household | 48 | 27.1% |
| 4+ Person Household | 0 | 0.0% |
| Total Housing Units | 177 | 100.0% |
Occupancy by Ownership by Household Size in Garretts Mill
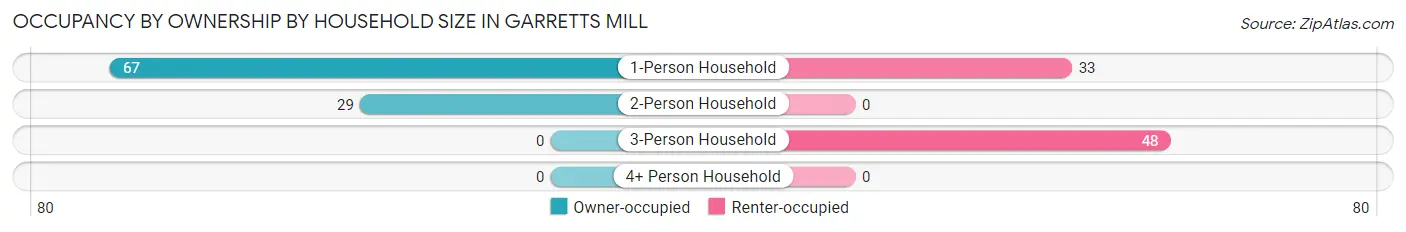
| Household Size | Owner-occupied | Renter-occupied |
| 1-Person Household | 67 (67.0%) | 33 (33.0%) |
| 2-Person Household | 29 (100.0%) | 0 (0.0%) |
| 3-Person Household | 0 (0.0%) | 48 (100.0%) |
| 4+ Person Household | 0 (0.0%) | 0 (0.0%) |
| Total Housing Units | 96 (54.2%) | 81 (45.8%) |
Occupancy by Educational Attainment in Garretts Mill
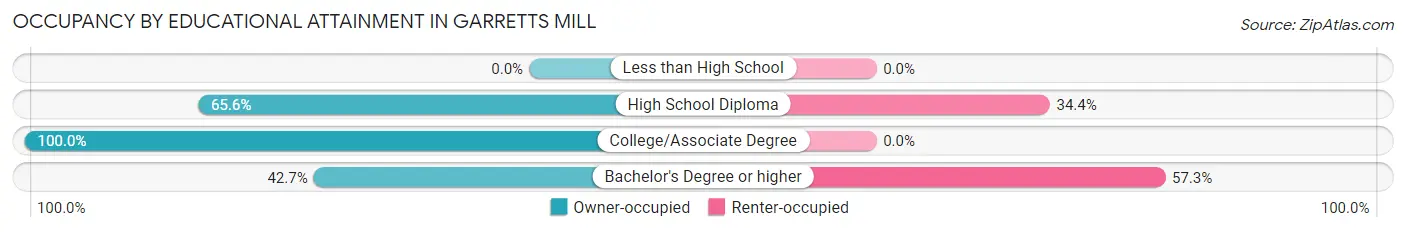
| Household Size | Owner-occupied | Renter-occupied |
| Less than High School | 0 (0.0%) | 0 (0.0%) |
| High School Diploma | 42 (65.6%) | 22 (34.4%) |
| College/Associate Degree | 10 (100.0%) | 0 (0.0%) |
| Bachelor's Degree or higher | 44 (42.7%) | 59 (57.3%) |
Occupancy by Age of Householder in Garretts Mill
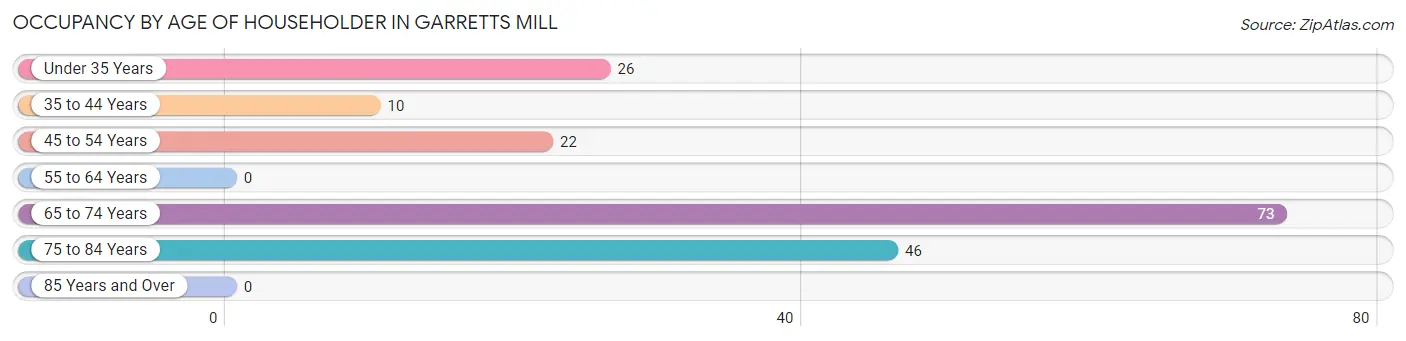
| Age Bracket | # Households | % Households |
| Under 35 Years | 26 | 14.7% |
| 35 to 44 Years | 10 | 5.7% |
| 45 to 54 Years | 22 | 12.4% |
| 55 to 64 Years | 0 | 0.0% |
| 65 to 74 Years | 73 | 41.2% |
| 75 to 84 Years | 46 | 26.0% |
| 85 Years and Over | 0 | 0.0% |
| Total | 177 | 100.0% |
Housing Finances in Garretts Mill
Median Income by Occupancy in Garretts Mill
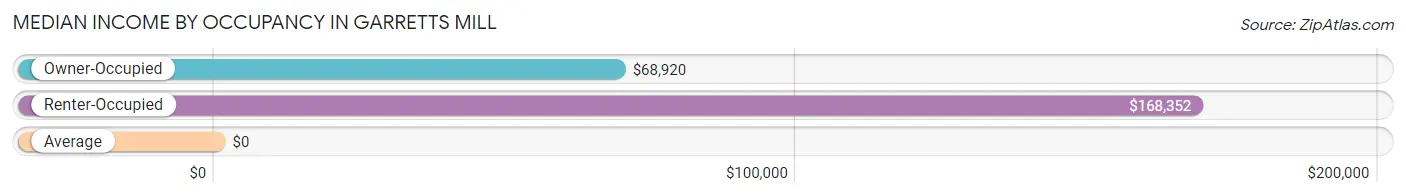
| Occupancy Type | # Households | Median Income |
| Owner-Occupied | 96 (54.2%) | $68,920 |
| Renter-Occupied | 81 (45.8%) | $168,352 |
| Average | 177 (100.0%) | $0 |
Occupancy by Householder Income Bracket in Garretts Mill
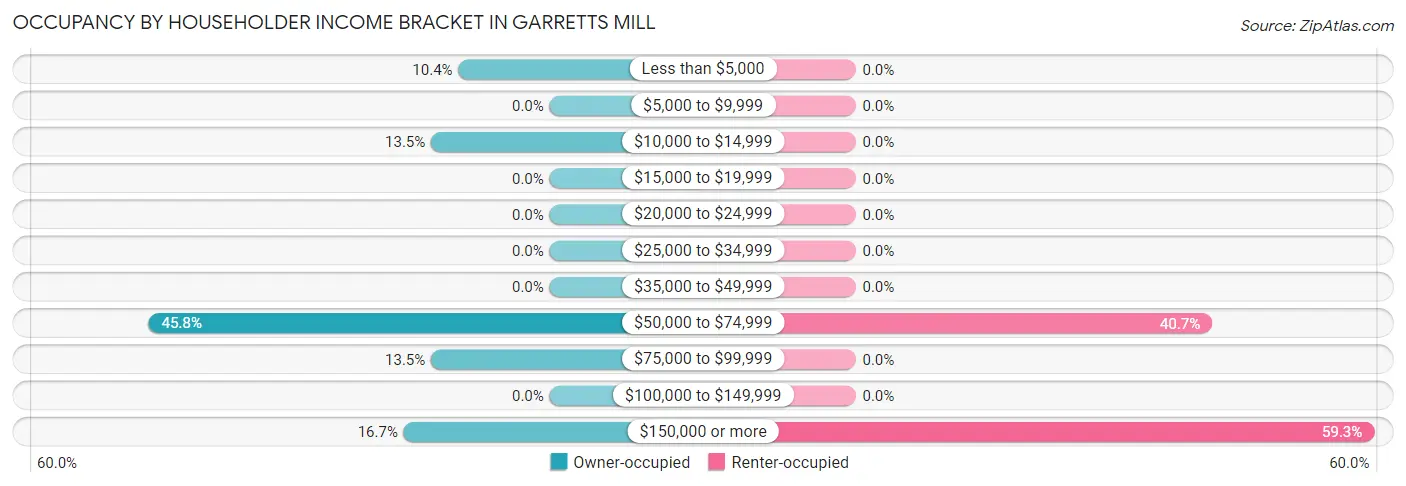
| Income Bracket | Owner-occupied | Renter-occupied |
| Less than $5,000 | 10 (10.4%) | 0 (0.0%) |
| $5,000 to $9,999 | 0 (0.0%) | 0 (0.0%) |
| $10,000 to $14,999 | 13 (13.5%) | 0 (0.0%) |
| $15,000 to $19,999 | 0 (0.0%) | 0 (0.0%) |
| $20,000 to $24,999 | 0 (0.0%) | 0 (0.0%) |
| $25,000 to $34,999 | 0 (0.0%) | 0 (0.0%) |
| $35,000 to $49,999 | 0 (0.0%) | 0 (0.0%) |
| $50,000 to $74,999 | 44 (45.8%) | 33 (40.7%) |
| $75,000 to $99,999 | 13 (13.5%) | 0 (0.0%) |
| $100,000 to $149,999 | 0 (0.0%) | 0 (0.0%) |
| $150,000 or more | 16 (16.7%) | 48 (59.3%) |
| Total | 96 (100.0%) | 81 (100.0%) |
Monthly Housing Cost Tiers in Garretts Mill
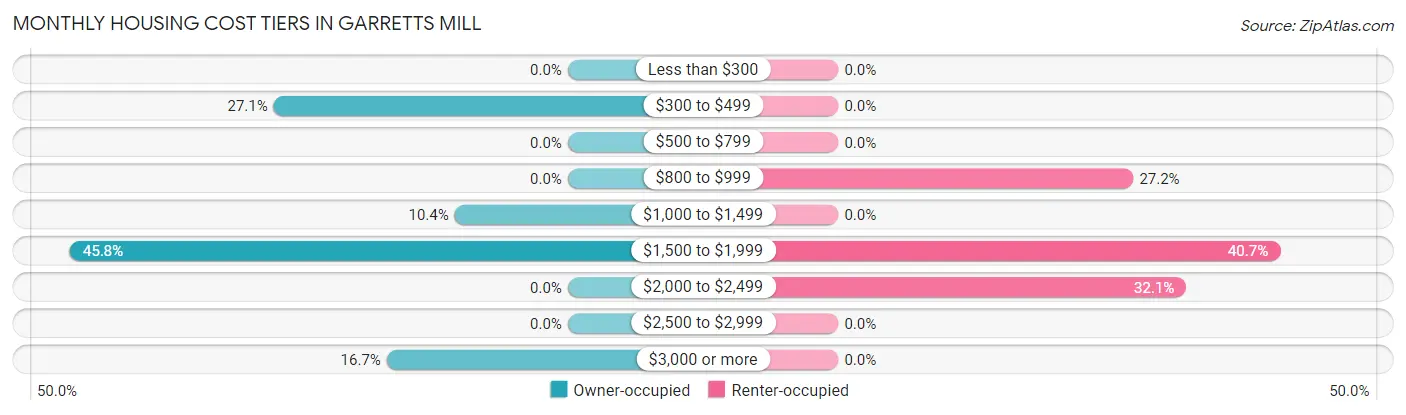
| Monthly Cost | Owner-occupied | Renter-occupied |
| Less than $300 | 0 (0.0%) | 0 (0.0%) |
| $300 to $499 | 26 (27.1%) | 0 (0.0%) |
| $500 to $799 | 0 (0.0%) | 0 (0.0%) |
| $800 to $999 | 0 (0.0%) | 22 (27.2%) |
| $1,000 to $1,499 | 10 (10.4%) | 0 (0.0%) |
| $1,500 to $1,999 | 44 (45.8%) | 33 (40.7%) |
| $2,000 to $2,499 | 0 (0.0%) | 26 (32.1%) |
| $2,500 to $2,999 | 0 (0.0%) | 0 (0.0%) |
| $3,000 or more | 16 (16.7%) | 0 (0.0%) |
| Total | 96 (100.0%) | 81 (100.0%) |
Physical Housing Characteristics in Garretts Mill
Housing Structures in Garretts Mill
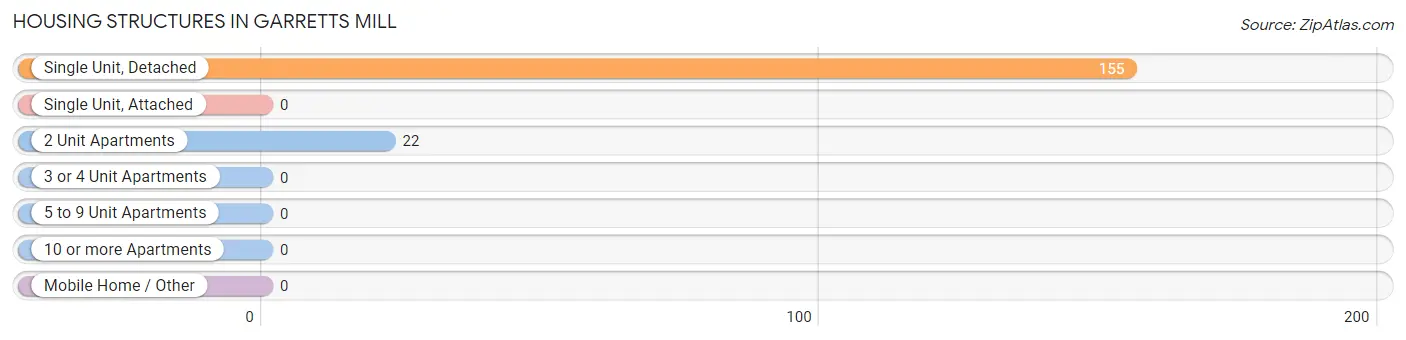
| Structure Type | # Housing Units | % Housing Units |
| Single Unit, Detached | 155 | 87.6% |
| Single Unit, Attached | 0 | 0.0% |
| 2 Unit Apartments | 22 | 12.4% |
| 3 or 4 Unit Apartments | 0 | 0.0% |
| 5 to 9 Unit Apartments | 0 | 0.0% |
| 10 or more Apartments | 0 | 0.0% |
| Mobile Home / Other | 0 | 0.0% |
| Total | 177 | 100.0% |
Housing Structures by Occupancy in Garretts Mill
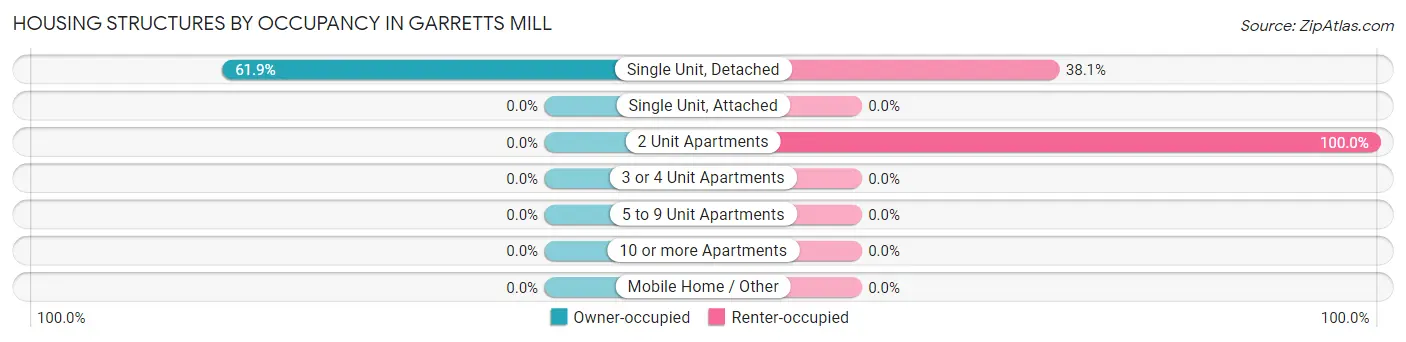
| Structure Type | Owner-occupied | Renter-occupied |
| Single Unit, Detached | 96 (61.9%) | 59 (38.1%) |
| Single Unit, Attached | 0 (0.0%) | 0 (0.0%) |
| 2 Unit Apartments | 0 (0.0%) | 22 (100.0%) |
| 3 or 4 Unit Apartments | 0 (0.0%) | 0 (0.0%) |
| 5 to 9 Unit Apartments | 0 (0.0%) | 0 (0.0%) |
| 10 or more Apartments | 0 (0.0%) | 0 (0.0%) |
| Mobile Home / Other | 0 (0.0%) | 0 (0.0%) |
| Total | 96 (54.2%) | 81 (45.8%) |
Housing Structures by Number of Rooms in Garretts Mill
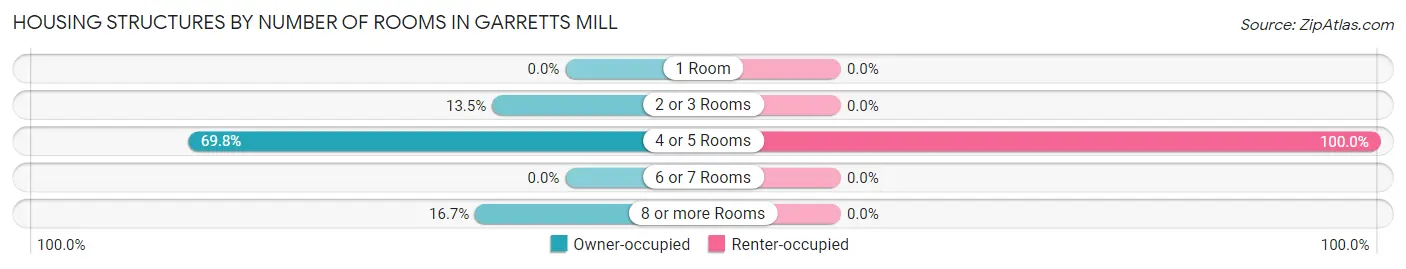
| Number of Rooms | Owner-occupied | Renter-occupied |
| 1 Room | 0 (0.0%) | 0 (0.0%) |
| 2 or 3 Rooms | 13 (13.5%) | 0 (0.0%) |
| 4 or 5 Rooms | 67 (69.8%) | 81 (100.0%) |
| 6 or 7 Rooms | 0 (0.0%) | 0 (0.0%) |
| 8 or more Rooms | 16 (16.7%) | 0 (0.0%) |
| Total | 96 (100.0%) | 81 (100.0%) |
Housing Structure by Heating Type in Garretts Mill
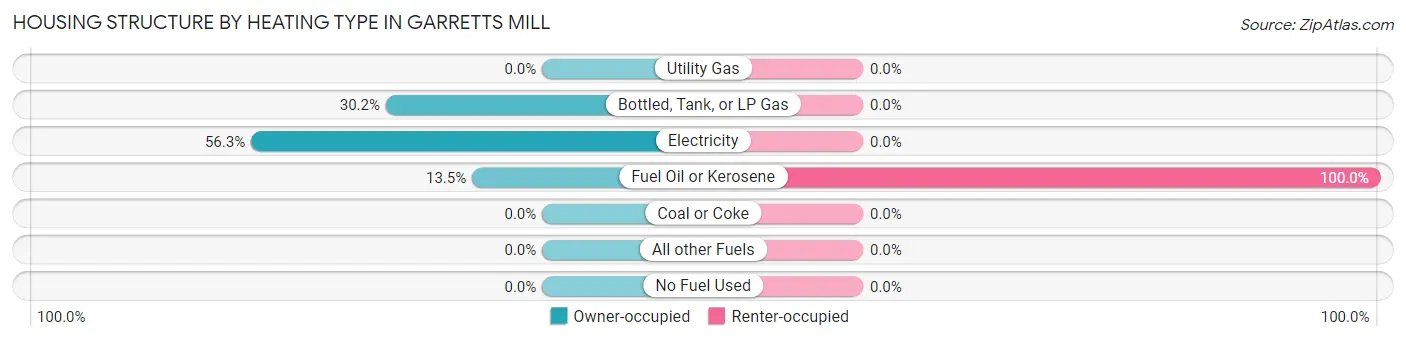
| Heating Type | Owner-occupied | Renter-occupied |
| Utility Gas | 0 (0.0%) | 0 (0.0%) |
| Bottled, Tank, or LP Gas | 29 (30.2%) | 0 (0.0%) |
| Electricity | 54 (56.2%) | 0 (0.0%) |
| Fuel Oil or Kerosene | 13 (13.5%) | 81 (100.0%) |
| Coal or Coke | 0 (0.0%) | 0 (0.0%) |
| All other Fuels | 0 (0.0%) | 0 (0.0%) |
| No Fuel Used | 0 (0.0%) | 0 (0.0%) |
| Total | 96 (100.0%) | 81 (100.0%) |
Household Vehicle Usage in Garretts Mill
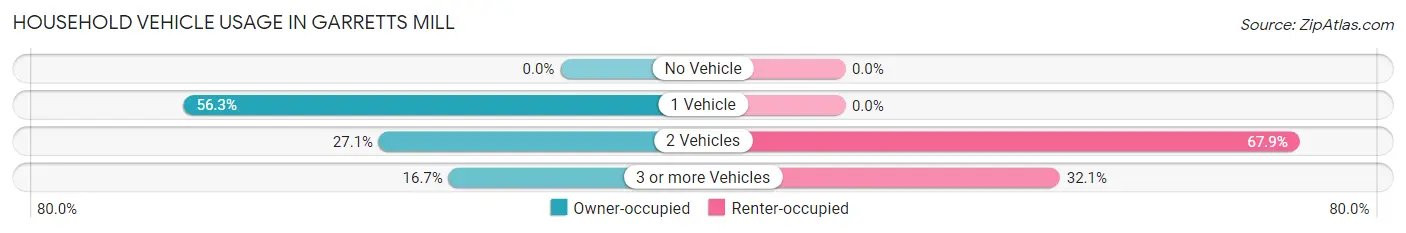
| Vehicles per Household | Owner-occupied | Renter-occupied |
| No Vehicle | 0 (0.0%) | 0 (0.0%) |
| 1 Vehicle | 54 (56.2%) | 0 (0.0%) |
| 2 Vehicles | 26 (27.1%) | 55 (67.9%) |
| 3 or more Vehicles | 16 (16.7%) | 26 (32.1%) |
| Total | 96 (100.0%) | 81 (100.0%) |
Real Estate & Mortgages in Garretts Mill
Real Estate and Mortgage Overview in Garretts Mill
| Characteristic | Without Mortgage | With Mortgage |
| Housing Units | 26 | 70 |
| Median Property Value | - | - |
| Median Household Income | - | - |
| Monthly Housing Costs | - | - |
| Real Estate Taxes | - | - |
Property Value by Mortgage Status in Garretts Mill
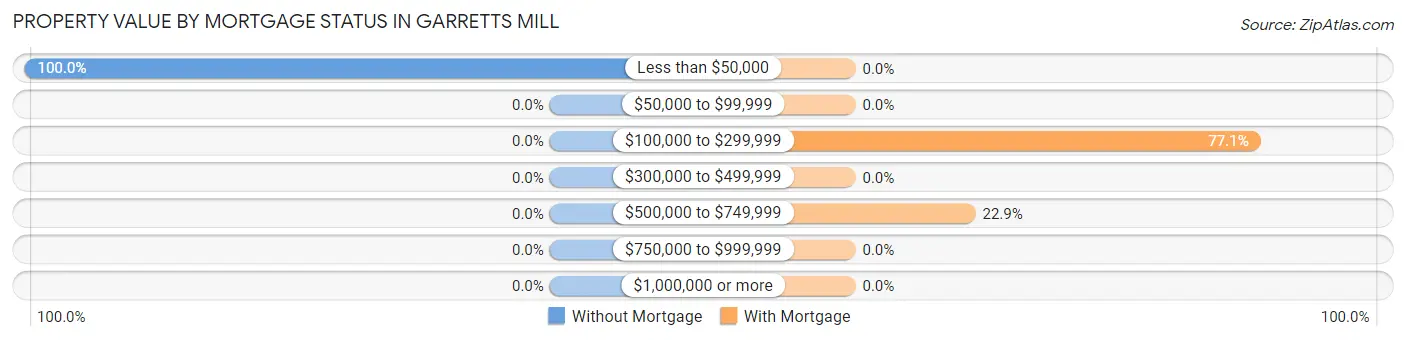
| Property Value | Without Mortgage | With Mortgage |
| Less than $50,000 | 26 (100.0%) | 0 (0.0%) |
| $50,000 to $99,999 | 0 (0.0%) | 0 (0.0%) |
| $100,000 to $299,999 | 0 (0.0%) | 54 (77.1%) |
| $300,000 to $499,999 | 0 (0.0%) | 0 (0.0%) |
| $500,000 to $749,999 | 0 (0.0%) | 16 (22.9%) |
| $750,000 to $999,999 | 0 (0.0%) | 0 (0.0%) |
| $1,000,000 or more | 0 (0.0%) | 0 (0.0%) |
| Total | 26 (100.0%) | 70 (100.0%) |
Household Income by Mortgage Status in Garretts Mill
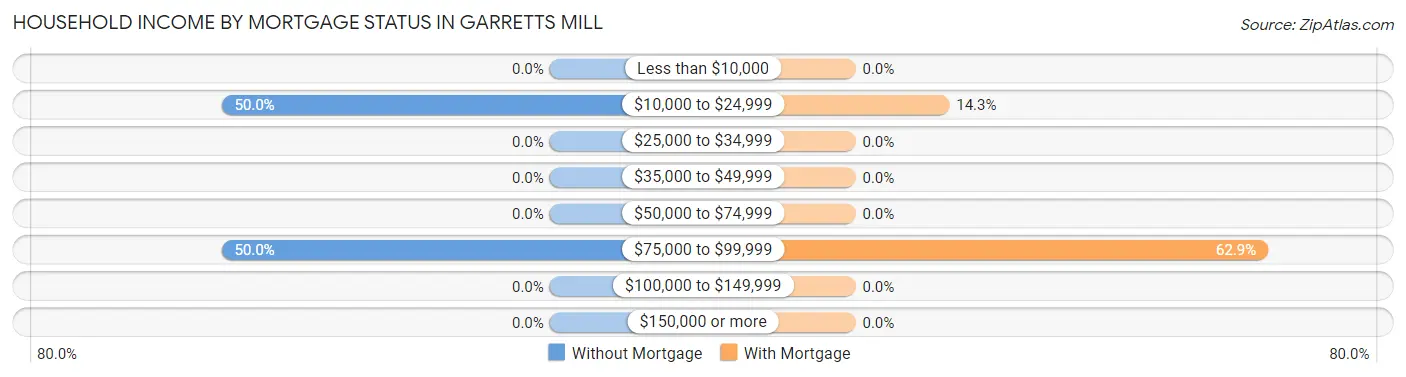
| Household Income | Without Mortgage | With Mortgage |
| Less than $10,000 | 0 (0.0%) | 0 (0.0%) |
| $10,000 to $24,999 | 13 (50.0%) | 10 (14.3%) |
| $25,000 to $34,999 | 0 (0.0%) | 0 (0.0%) |
| $35,000 to $49,999 | 0 (0.0%) | 0 (0.0%) |
| $50,000 to $74,999 | 0 (0.0%) | 0 (0.0%) |
| $75,000 to $99,999 | 13 (50.0%) | 44 (62.9%) |
| $100,000 to $149,999 | 0 (0.0%) | 0 (0.0%) |
| $150,000 or more | 0 (0.0%) | 0 (0.0%) |
| Total | 26 (100.0%) | 70 (100.0%) |
Property Value to Household Income Ratio in Garretts Mill
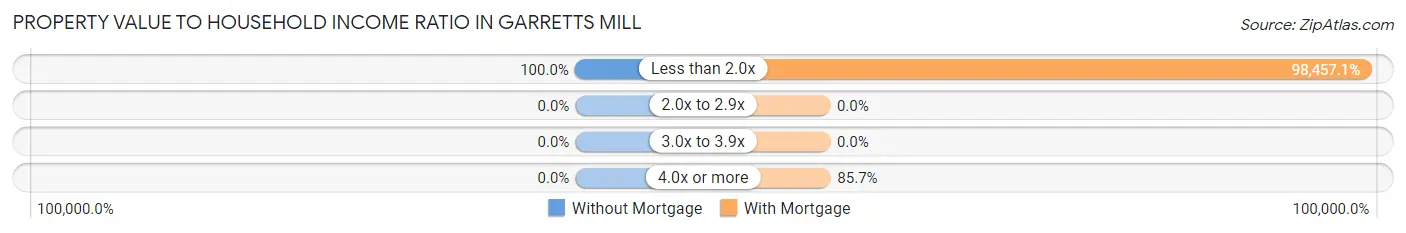
| Value-to-Income Ratio | Without Mortgage | With Mortgage |
| Less than 2.0x | 26 (100.0%) | 68,920 (98,457.1%) |
| 2.0x to 2.9x | 0 (0.0%) | 0 (0.0%) |
| 3.0x to 3.9x | 0 (0.0%) | 0 (0.0%) |
| 4.0x or more | 0 (0.0%) | 60 (85.7%) |
| Total | 26 (100.0%) | 70 (100.0%) |
Real Estate Taxes by Mortgage Status in Garretts Mill
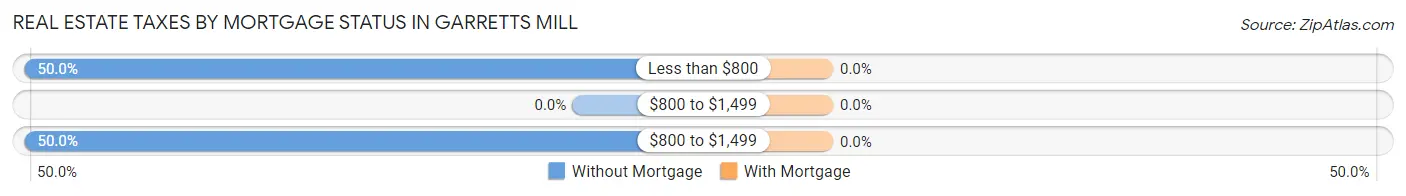
| Property Taxes | Without Mortgage | With Mortgage |
| Less than $800 | 13 (50.0%) | 0 (0.0%) |
| $800 to $1,499 | 0 (0.0%) | 0 (0.0%) |
| $800 to $1,499 | 13 (50.0%) | 0 (0.0%) |
| Total | 26 (100.0%) | 70 (100.0%) |
Health & Disability in Garretts Mill
Health Insurance Coverage by Age in Garretts Mill
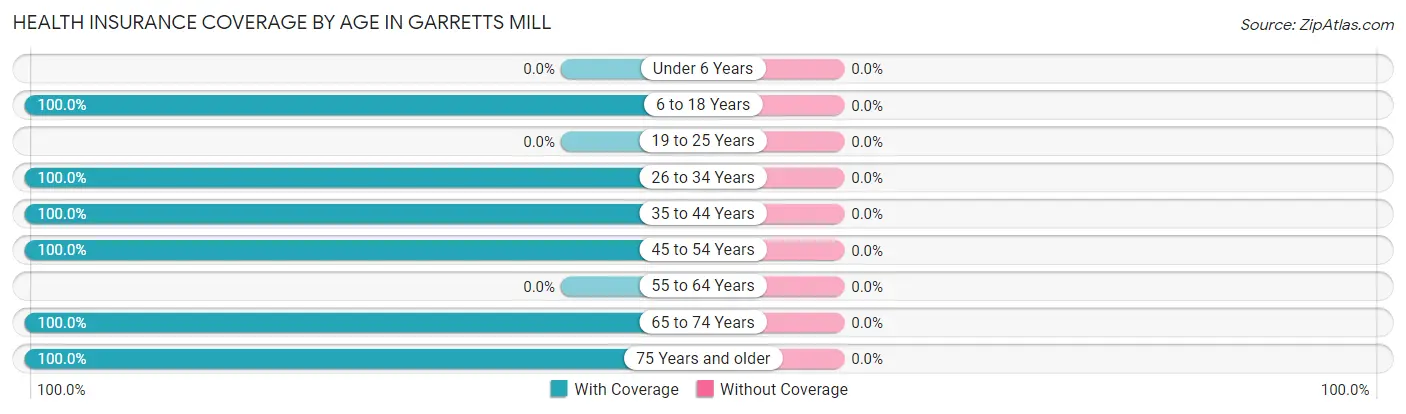
| Age Bracket | With Coverage | Without Coverage |
| Under 6 Years | 0 (0.0%) | 0 (0.0%) |
| 6 to 18 Years | 27 (100.0%) | 0 (0.0%) |
| 19 to 25 Years | 0 (0.0%) | 0 (0.0%) |
| 26 to 34 Years | 49 (100.0%) | 0 (0.0%) |
| 35 to 44 Years | 46 (100.0%) | 0 (0.0%) |
| 45 to 54 Years | 44 (100.0%) | 0 (0.0%) |
| 55 to 64 Years | 0 (0.0%) | 0 (0.0%) |
| 65 to 74 Years | 102 (100.0%) | 0 (0.0%) |
| 75 Years and older | 46 (100.0%) | 0 (0.0%) |
| Total | 314 (100.0%) | 0 (0.0%) |
Health Insurance Coverage by Citizenship Status in Garretts Mill
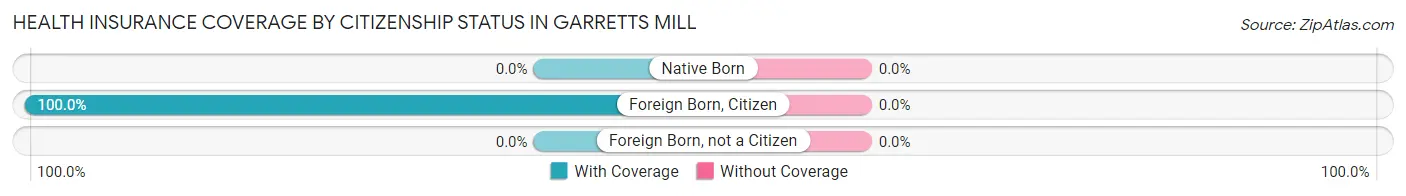
| Citizenship Status | With Coverage | Without Coverage |
| Native Born | 0 (0.0%) | 0 (0.0%) |
| Foreign Born, Citizen | 27 (100.0%) | 0 (0.0%) |
| Foreign Born, not a Citizen | 0 (0.0%) | 0 (0.0%) |
Health Insurance Coverage by Household Income in Garretts Mill
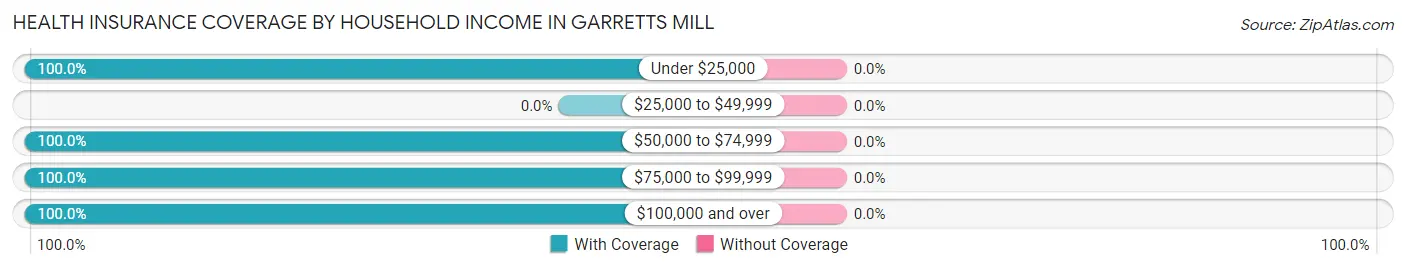
| Household Income | With Coverage | Without Coverage |
| Under $25,000 | 23 (100.0%) | 0 (0.0%) |
| $25,000 to $49,999 | 0 (0.0%) | 0 (0.0%) |
| $50,000 to $74,999 | 77 (100.0%) | 0 (0.0%) |
| $75,000 to $99,999 | 25 (100.0%) | 0 (0.0%) |
| $100,000 and over | 189 (100.0%) | 0 (0.0%) |
Public vs Private Health Insurance Coverage by Age in Garretts Mill
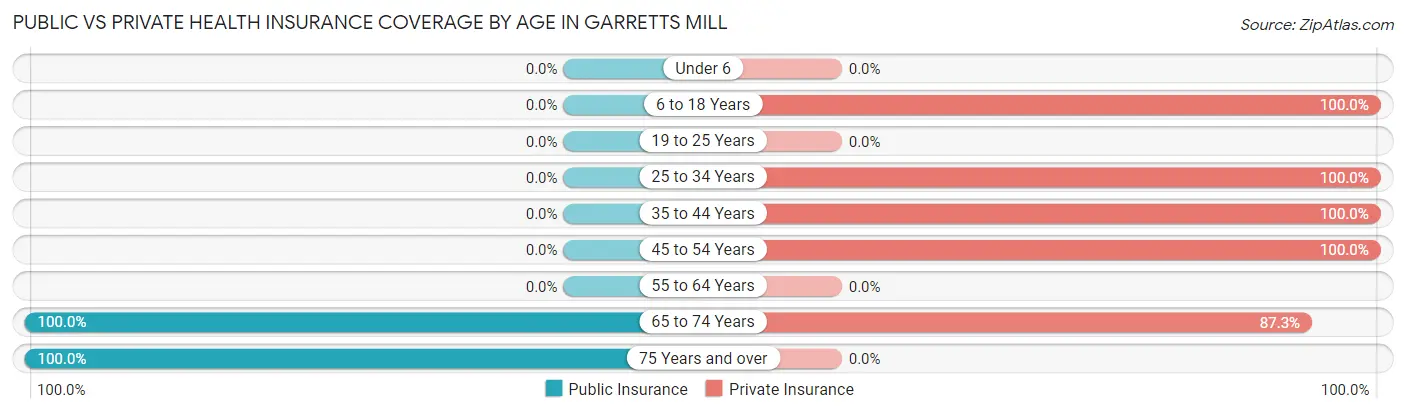
| Age Bracket | Public Insurance | Private Insurance |
| Under 6 | 0 (0.0%) | 0 (0.0%) |
| 6 to 18 Years | 0 (0.0%) | 27 (100.0%) |
| 19 to 25 Years | 0 (0.0%) | 0 (0.0%) |
| 25 to 34 Years | 0 (0.0%) | 49 (100.0%) |
| 35 to 44 Years | 0 (0.0%) | 46 (100.0%) |
| 45 to 54 Years | 0 (0.0%) | 44 (100.0%) |
| 55 to 64 Years | 0 (0.0%) | 0 (0.0%) |
| 65 to 74 Years | 102 (100.0%) | 89 (87.3%) |
| 75 Years and over | 46 (100.0%) | 0 (0.0%) |
| Total | 148 (47.1%) | 255 (81.2%) |
Disability Status by Sex by Age in Garretts Mill
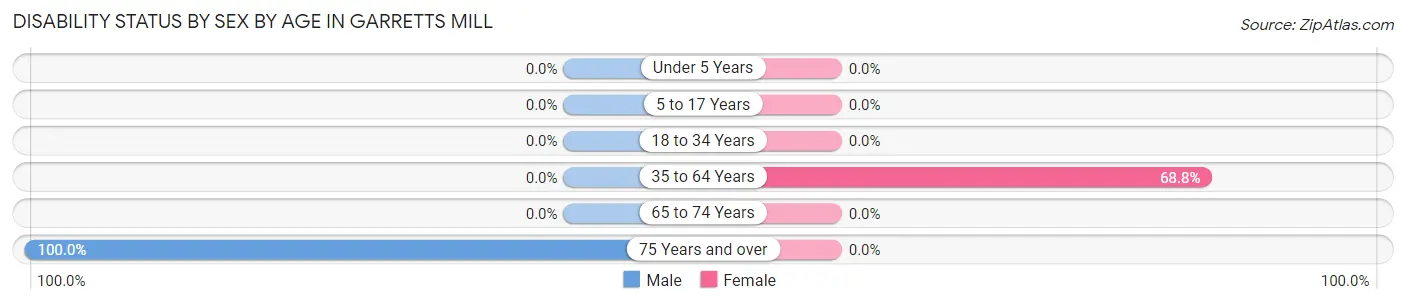
| Age Bracket | Male | Female |
| Under 5 Years | 0 (0.0%) | 0 (0.0%) |
| 5 to 17 Years | 0 (0.0%) | 0 (0.0%) |
| 18 to 34 Years | 0 (0.0%) | 0 (0.0%) |
| 35 to 64 Years | 0 (0.0%) | 22 (68.8%) |
| 65 to 74 Years | 0 (0.0%) | 0 (0.0%) |
| 75 Years and over | 13 (100.0%) | 0 (0.0%) |
Disability Class by Sex by Age in Garretts Mill
Disability Class: Hearing Difficulty
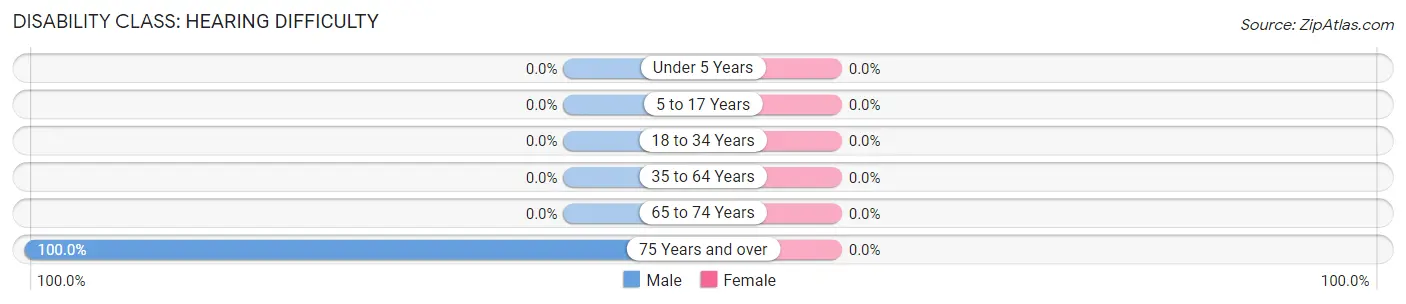
| Age Bracket | Male | Female |
| Under 5 Years | 0 (0.0%) | 0 (0.0%) |
| 5 to 17 Years | 0 (0.0%) | 0 (0.0%) |
| 18 to 34 Years | 0 (0.0%) | 0 (0.0%) |
| 35 to 64 Years | 0 (0.0%) | 0 (0.0%) |
| 65 to 74 Years | 0 (0.0%) | 0 (0.0%) |
| 75 Years and over | 13 (100.0%) | 0 (0.0%) |
Disability Class: Vision Difficulty
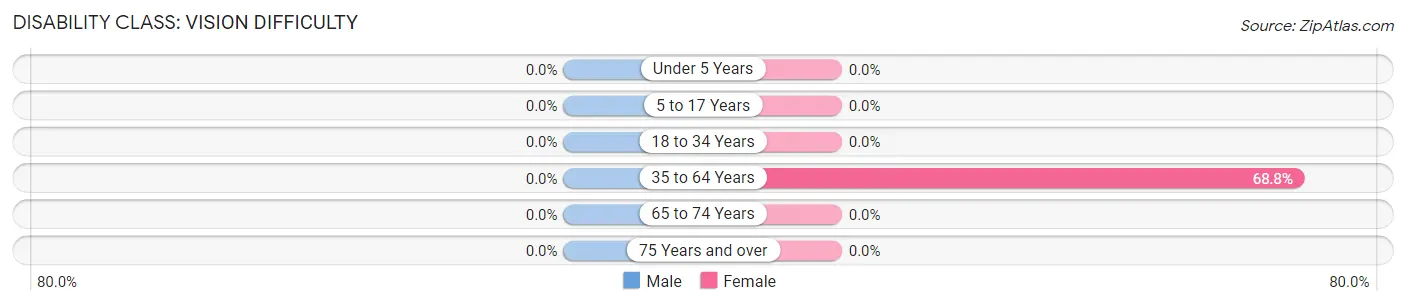
| Age Bracket | Male | Female |
| Under 5 Years | 0 (0.0%) | 0 (0.0%) |
| 5 to 17 Years | 0 (0.0%) | 0 (0.0%) |
| 18 to 34 Years | 0 (0.0%) | 0 (0.0%) |
| 35 to 64 Years | 0 (0.0%) | 22 (68.8%) |
| 65 to 74 Years | 0 (0.0%) | 0 (0.0%) |
| 75 Years and over | 0 (0.0%) | 0 (0.0%) |
Disability Class: Cognitive Difficulty
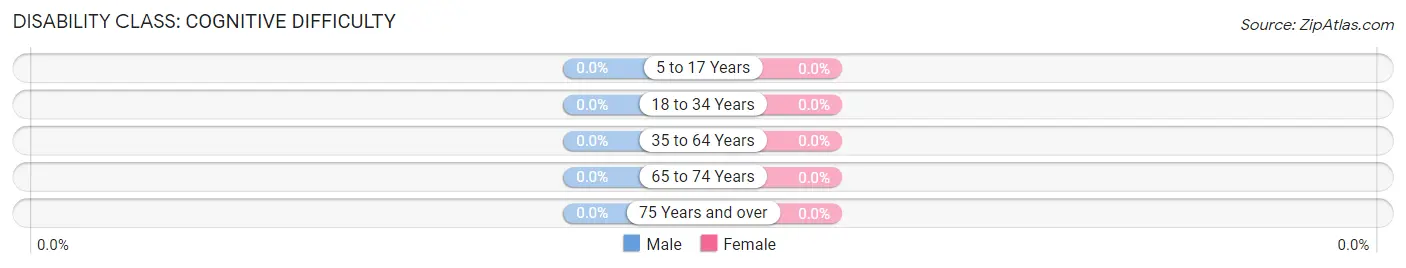
| Age Bracket | Male | Female |
| 5 to 17 Years | 0 (0.0%) | 0 (0.0%) |
| 18 to 34 Years | 0 (0.0%) | 0 (0.0%) |
| 35 to 64 Years | 0 (0.0%) | 0 (0.0%) |
| 65 to 74 Years | 0 (0.0%) | 0 (0.0%) |
| 75 Years and over | 0 (0.0%) | 0 (0.0%) |
Disability Class: Ambulatory Difficulty
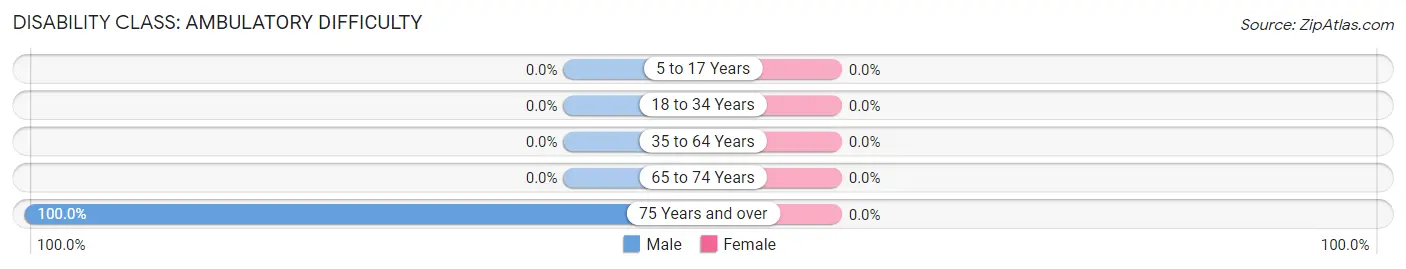
| Age Bracket | Male | Female |
| 5 to 17 Years | 0 (0.0%) | 0 (0.0%) |
| 18 to 34 Years | 0 (0.0%) | 0 (0.0%) |
| 35 to 64 Years | 0 (0.0%) | 0 (0.0%) |
| 65 to 74 Years | 0 (0.0%) | 0 (0.0%) |
| 75 Years and over | 13 (100.0%) | 0 (0.0%) |
Disability Class: Self-Care Difficulty
| Age Bracket | Male | Female |
| 5 to 17 Years | 0 (0.0%) | 0 (0.0%) |
| 18 to 34 Years | 0 (0.0%) | 0 (0.0%) |
| 35 to 64 Years | 0 (0.0%) | 0 (0.0%) |
| 65 to 74 Years | 0 (0.0%) | 0 (0.0%) |
| 75 Years and over | 0 (0.0%) | 0 (0.0%) |
Technology Access in Garretts Mill
Computing Device Access in Garretts Mill
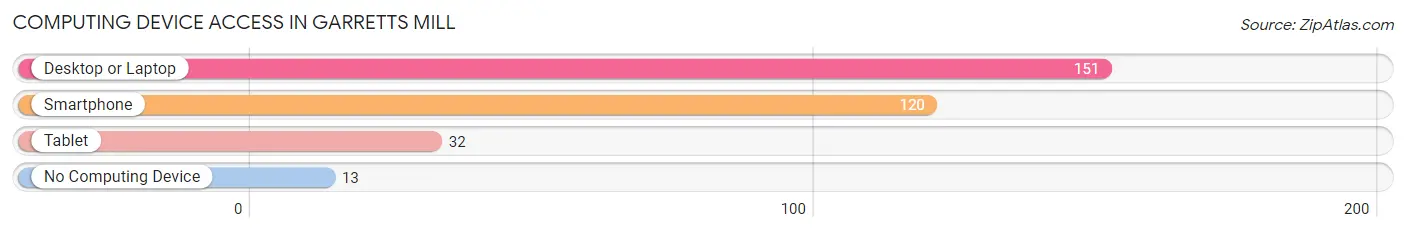
| Device Type | # Households | % Households |
| Desktop or Laptop | 151 | 85.3% |
| Smartphone | 120 | 67.8% |
| Tablet | 32 | 18.1% |
| No Computing Device | 13 | 7.3% |
| Total | 177 | 100.0% |
Internet Access in Garretts Mill
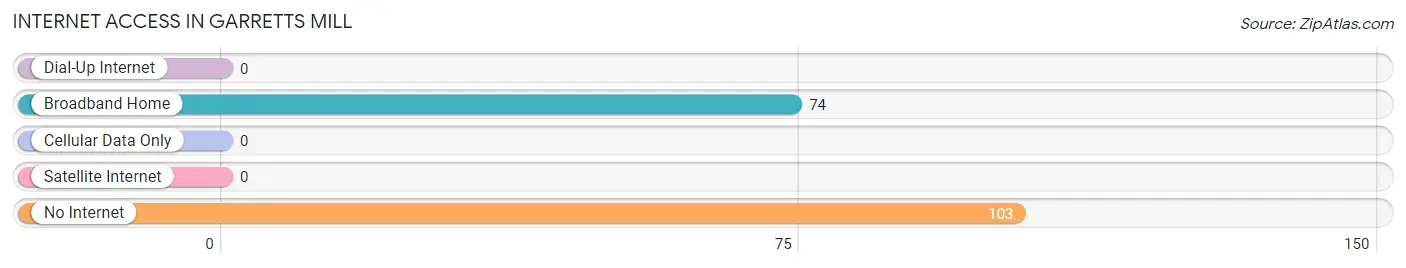
| Internet Type | # Households | % Households |
| Dial-Up Internet | 0 | 0.0% |
| Broadband Home | 74 | 41.8% |
| Cellular Data Only | 0 | 0.0% |
| Satellite Internet | 0 | 0.0% |
| No Internet | 103 | 58.2% |
| Total | 177 | 100.0% |
Garretts Mill Summary
Garretts Mill, Maryland is a small unincorporated community located in Montgomery County, Maryland. It is situated in the northern part of the county, just south of the Potomac River. The community is bordered by the towns of Poolesville and Dickerson to the north, and the city of Gaithersburg to the south.
History
Garretts Mill was first settled in the late 1700s by the Garrett family, who owned a mill on the site. The mill was used to grind grain and other products for the local community. The mill was destroyed by fire in 1845, but the Garrett family rebuilt it and continued to operate it until the early 1900s.
The community was officially established in 1887, when the Garrett family donated land for a post office and a school. The post office was named after the family, and the school was named after the mill.
Geography
Garretts Mill is located in northern Montgomery County, Maryland. It is situated in the Potomac River Valley, just south of the Potomac River. The community is bordered by the towns of Poolesville and Dickerson to the north, and the city of Gaithersburg to the south.
The terrain of the area is mostly flat, with some rolling hills. The climate is temperate, with hot summers and cold winters.
Economy
Garretts Mill is a small, rural community with a limited economy. The main industry in the area is agriculture, with many local farms producing a variety of crops. There are also some small businesses in the area, including a few restaurants and stores.
Demographics
As of the 2010 census, the population of Garretts Mill was 1,845. The racial makeup of the community was 94.3% White, 2.2% African American, 0.7% Asian, 0.3% Native American, and 2.5% from other races. The median household income was $90,945, and the median home value was $521,000.
Conclusion
Garretts Mill is a small, rural community located in Montgomery County, Maryland. It was first settled in the late 1700s by the Garrett family, who owned a mill on the site. The community was officially established in 1887, when the Garrett family donated land for a post office and a school. The economy of the area is mostly based on agriculture, with some small businesses in the area. As of the 2010 census, the population of Garretts Mill was 1,845.
Common Questions
What is Per Capita Income in Garretts Mill?
Per Capita income in Garretts Mill is $58,195.
What is the Median Family Income in Garretts Mill?
Median Family Income in Garretts Mill is $144,952.
What is Inequality or Gini Index in Garretts Mill?
Inequality or Gini Index in Garretts Mill is 0.34.
What is the Total Population of Garretts Mill?
Total Population of Garretts Mill is 314.
What is the Total Male Population of Garretts Mill?
Total Male Population of Garretts Mill is 151.
What is the Total Female Population of Garretts Mill?
Total Female Population of Garretts Mill is 163.
What is the Ratio of Males per 100 Females in Garretts Mill?
There are 92.64 Males per 100 Females in Garretts Mill.
What is the Ratio of Females per 100 Males in Garretts Mill?
There are 107.95 Females per 100 Males in Garretts Mill.
What is the Median Population Age in Garretts Mill?
Median Population Age in Garretts Mill is 49.6 Years.
What is the Average Family Size in Garretts Mill
Average Family Size in Garretts Mill is 2.3 People.
What is the Average Household Size in Garretts Mill
Average Household Size in Garretts Mill is 1.8 People.
How Large is the Labor Force in Garretts Mill?
There are 167 People in the Labor Forcein in Garretts Mill.
What is the Percentage of People in the Labor Force in Garretts Mill?
53.2% of People are in the Labor Force in Garretts Mill.