Bensville, MD Map & Demographics
Bensville Map
Bensville Overview
$52,289
PER CAPITA INCOME
$154,792
AVG FAMILY INCOME
$145,769
AVG HOUSEHOLD INCOME
24.6%
WAGE / INCOME GAP [ % ]
75.4¢/ $1
WAGE / INCOME GAP [ $ ]
$13,790
FAMILY INCOME DEFICIT
0.36
INEQUALITY / GINI INDEX
14,202
TOTAL POPULATION
7,201
MALE POPULATION
7,001
FEMALE POPULATION
102.86
MALES / 100 FEMALES
97.22
FEMALES / 100 MALES
39.5
MEDIAN AGE
3.5
AVG FAMILY SIZE
3.2
AVG HOUSEHOLD SIZE
7,386
LABOR FORCE [ PEOPLE ]
66.5%
PERCENT IN LABOR FORCE
4.3%
UNEMPLOYMENT RATE
Income in Bensville
Income Overview in Bensville
Per Capita Income in Bensville is $52,289, while median incomes of families and households are $154,792 and $145,769 respectively.
| Characteristic | Number | Measure |
| Per Capita Income | 14,202 | $52,289 |
| Median Family Income | 3,674 | $154,792 |
| Mean Family Income | 3,674 | $172,330 |
| Median Household Income | 4,446 | $145,769 |
| Mean Household Income | 4,446 | $161,980 |
| Income Deficit | 3,674 | $13,790 |
| Wage / Income Gap (%) | 14,202 | 24.63% |
| Wage / Income Gap ($) | 14,202 | 75.37¢ per $1 |
| Gini / Inequality Index | 14,202 | 0.36 |
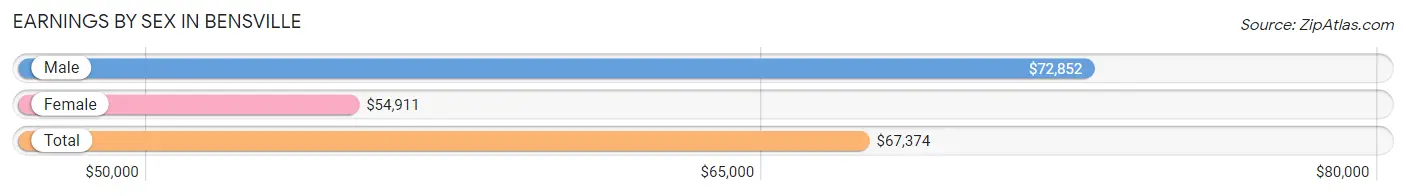
Earnings by Sex in Bensville
Average Earnings in Bensville are $67,374, $72,852 for men and $54,911 for women, a difference of 24.6%.
| Sex | Number | Average Earnings |
| Male | 3,767 (48.4%) | $72,852 |
| Female | 4,018 (51.6%) | $54,911 |
| Total | 7,785 (100.0%) | $67,374 |
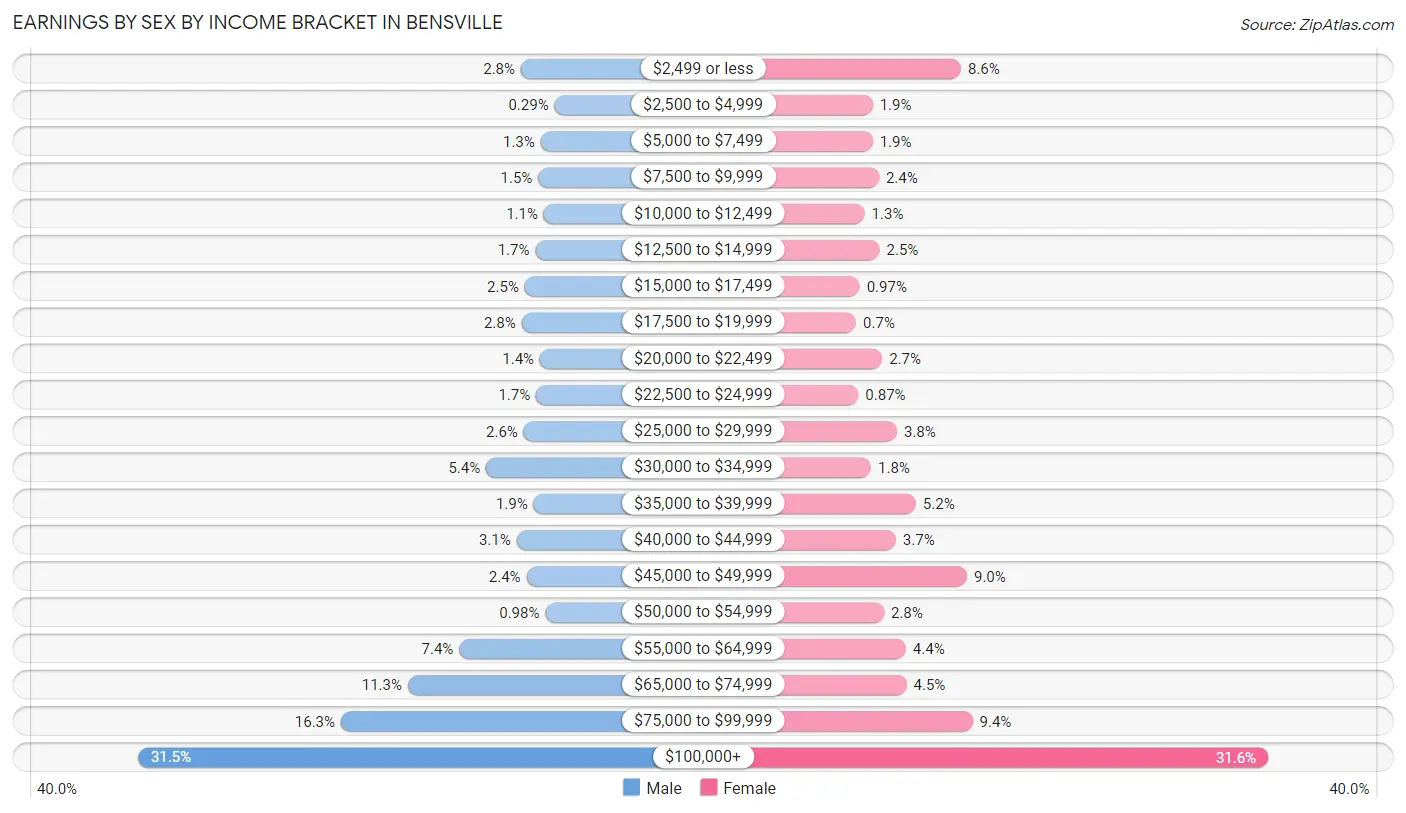
Earnings by Sex by Income Bracket in Bensville
The most common earnings brackets in Bensville are $100,000+ for men (1,187 | 31.5%) and $100,000+ for women (1,268 | 31.6%).
| Income | Male | Female |
| $2,499 or less | 106 (2.8%) | 344 (8.6%) |
| $2,500 to $4,999 | 11 (0.3%) | 78 (1.9%) |
| $5,000 to $7,499 | 50 (1.3%) | 78 (1.9%) |
| $7,500 to $9,999 | 57 (1.5%) | 97 (2.4%) |
| $10,000 to $12,499 | 41 (1.1%) | 54 (1.3%) |
| $12,500 to $14,999 | 65 (1.7%) | 99 (2.5%) |
| $15,000 to $17,499 | 95 (2.5%) | 39 (1.0%) |
| $17,500 to $19,999 | 104 (2.8%) | 28 (0.7%) |
| $20,000 to $22,499 | 52 (1.4%) | 107 (2.7%) |
| $22,500 to $24,999 | 63 (1.7%) | 35 (0.9%) |
| $25,000 to $29,999 | 98 (2.6%) | 151 (3.8%) |
| $30,000 to $34,999 | 204 (5.4%) | 73 (1.8%) |
| $35,000 to $39,999 | 70 (1.9%) | 208 (5.2%) |
| $40,000 to $44,999 | 118 (3.1%) | 148 (3.7%) |
| $45,000 to $49,999 | 90 (2.4%) | 362 (9.0%) |
| $50,000 to $54,999 | 37 (1.0%) | 112 (2.8%) |
| $55,000 to $64,999 | 280 (7.4%) | 178 (4.4%) |
| $65,000 to $74,999 | 425 (11.3%) | 180 (4.5%) |
| $75,000 to $99,999 | 614 (16.3%) | 379 (9.4%) |
| $100,000+ | 1,187 (31.5%) | 1,268 (31.6%) |
| Total | 3,767 (100.0%) | 4,018 (100.0%) |
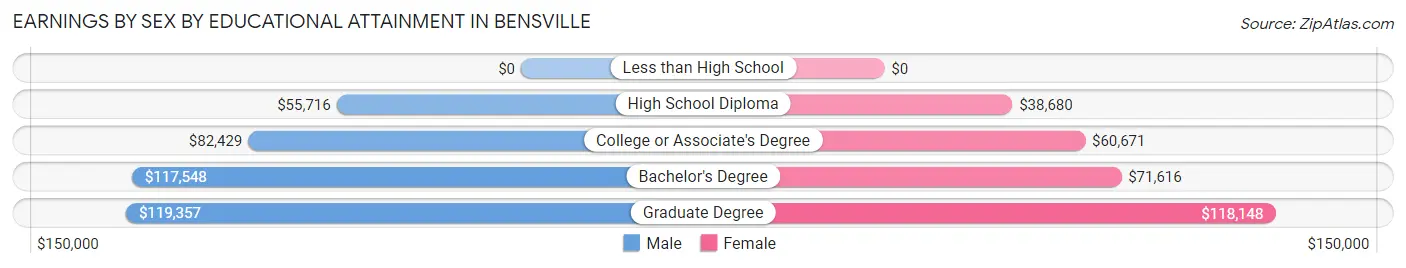
Earnings by Sex by Educational Attainment in Bensville
Average earnings in Bensville are $77,691 for men and $70,449 for women, a difference of 9.3%. Men with an educational attainment of graduate degree enjoy the highest average annual earnings of $119,357, while those with high school diploma education earn the least with $55,716. Women with an educational attainment of graduate degree earn the most with the average annual earnings of $118,148, while those with high school diploma education have the smallest earnings of $38,680.
| Educational Attainment | Male Income | Female Income |
| Less than High School | - | - |
| High School Diploma | $55,716 | $38,680 |
| College or Associate's Degree | $82,429 | $60,671 |
| Bachelor's Degree | $117,548 | $71,616 |
| Graduate Degree | $119,357 | $118,148 |
| Total | $77,691 | $70,449 |
Family Income in Bensville
Family Income Brackets in Bensville
According to the Bensville family income data, there are 1,143 families falling into the $200,000+ income range, which is the most common income bracket and makes up 31.1% of all families. Conversely, the $10,000 to $14,999 income bracket is the least frequent group with only 40 families (1.1%) belonging to this category.
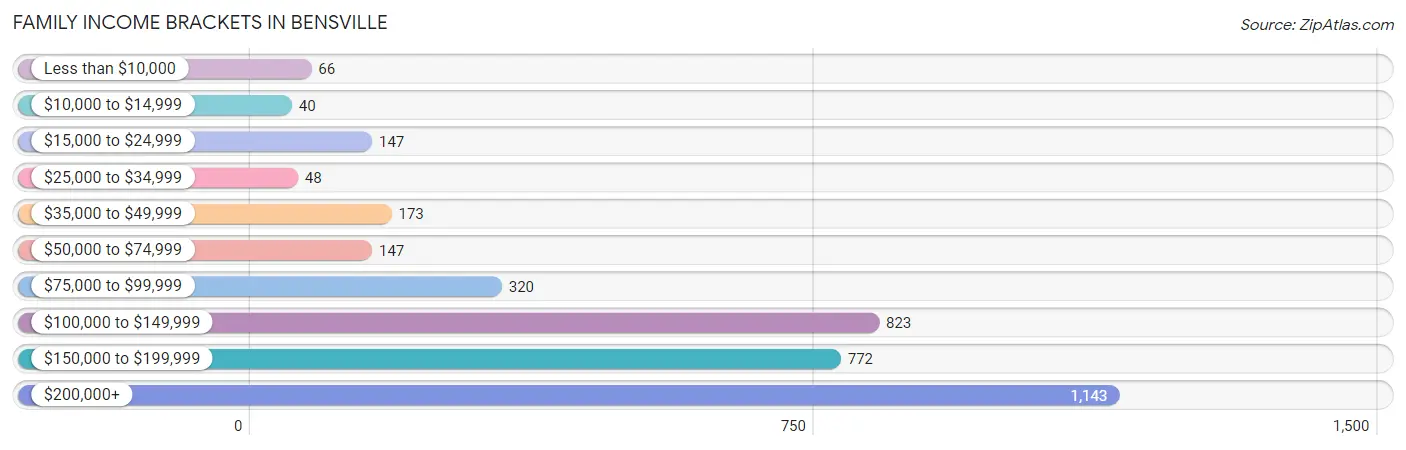
| Income Bracket | # Families | % Families |
| Less than $10,000 | 66 | 1.8% |
| $10,000 to $14,999 | 40 | 1.1% |
| $15,000 to $24,999 | 147 | 4.0% |
| $25,000 to $34,999 | 48 | 1.3% |
| $35,000 to $49,999 | 173 | 4.7% |
| $50,000 to $74,999 | 147 | 4.0% |
| $75,000 to $99,999 | 320 | 8.7% |
| $100,000 to $149,999 | 823 | 22.4% |
| $150,000 to $199,999 | 772 | 21.0% |
| $200,000+ | 1,143 | 31.1% |
Family Income by Famaliy Size in Bensville
6-person families (151 | 4.1%) account for the highest median family income in Bensville with $218,680 per family, while 2-person families (1,281 | 34.9%) have the highest median income of $68,784 per family member.
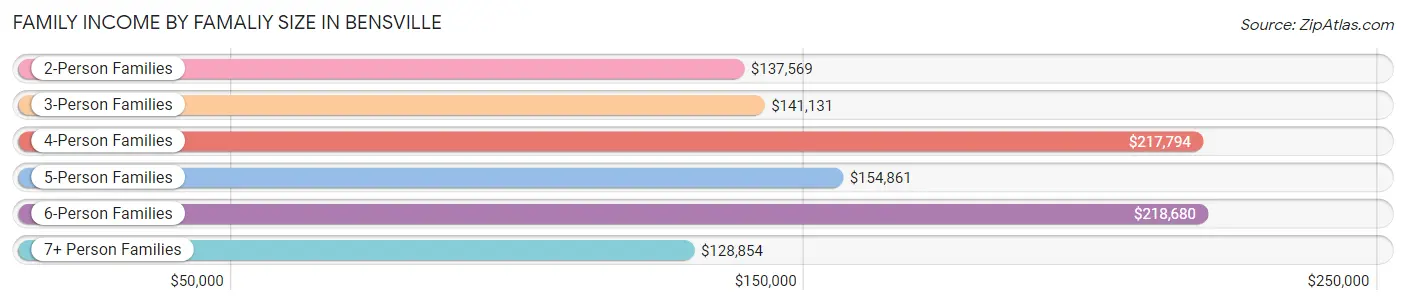
| Income Bracket | # Families | Median Income |
| 2-Person Families | 1,281 (34.9%) | $137,569 |
| 3-Person Families | 1,037 (28.2%) | $141,131 |
| 4-Person Families | 598 (16.3%) | $217,794 |
| 5-Person Families | 499 (13.6%) | $154,861 |
| 6-Person Families | 151 (4.1%) | $218,680 |
| 7+ Person Families | 108 (2.9%) | $128,854 |
| Total | 3,674 (100.0%) | $154,792 |
Family Income by Number of Earners in Bensville
The median family income in Bensville is $154,792, with families comprising 3+ earners (499) having the highest median family income of $187,337, while families with no earners (246) have the lowest median family income of $93,750, accounting for 13.6% and 6.7% of families, respectively.
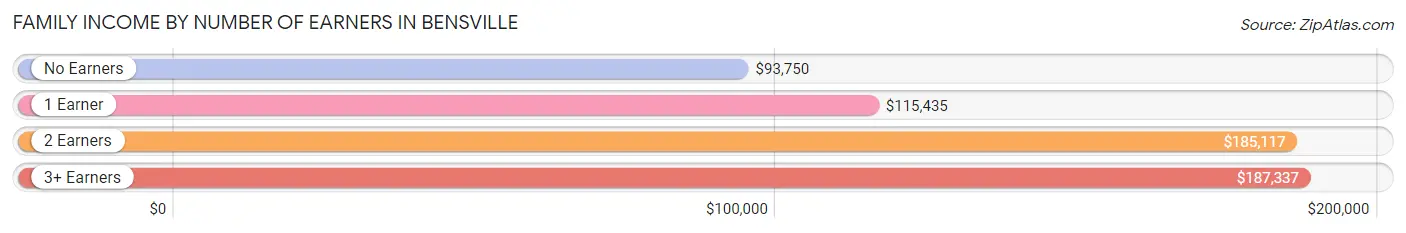
| Number of Earners | # Families | Median Income |
| No Earners | 246 (6.7%) | $93,750 |
| 1 Earner | 1,126 (30.6%) | $115,435 |
| 2 Earners | 1,803 (49.1%) | $185,117 |
| 3+ Earners | 499 (13.6%) | $187,337 |
| Total | 3,674 (100.0%) | $154,792 |
Household Income in Bensville
Household Income Brackets in Bensville
With 1,263 households falling in the category, the $200,000+ income range is the most frequent in Bensville, accounting for 28.4% of all households. In contrast, only 53 households (1.2%) fall into the $10,000 to $14,999 income bracket, making it the least populous group.
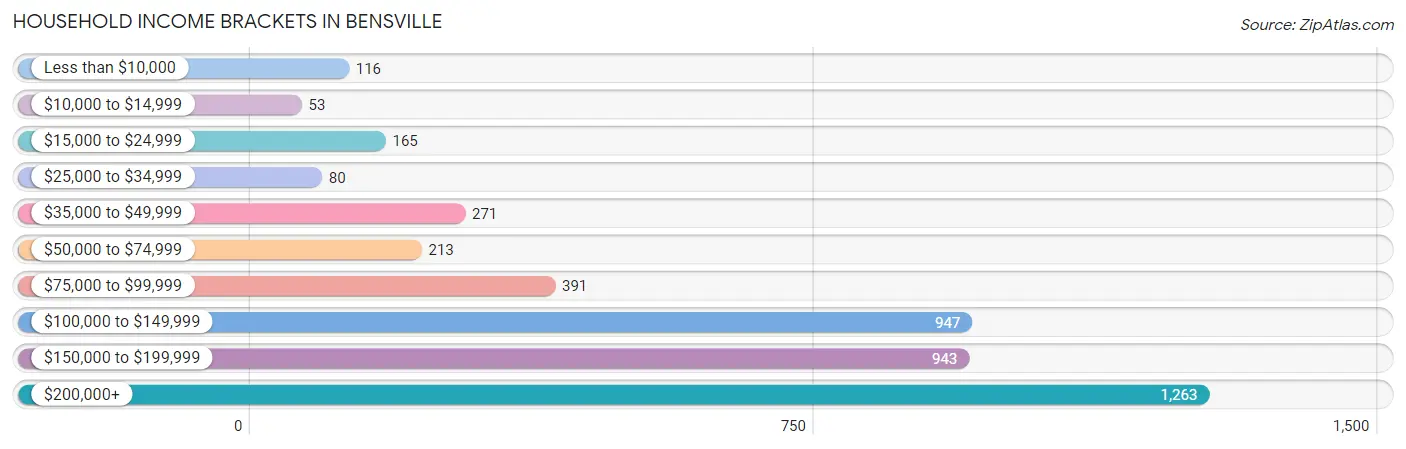
| Income Bracket | # Households | % Households |
| Less than $10,000 | 116 | 2.6% |
| $10,000 to $14,999 | 53 | 1.2% |
| $15,000 to $24,999 | 165 | 3.7% |
| $25,000 to $34,999 | 80 | 1.8% |
| $35,000 to $49,999 | 271 | 6.1% |
| $50,000 to $74,999 | 213 | 4.8% |
| $75,000 to $99,999 | 391 | 8.8% |
| $100,000 to $149,999 | 947 | 21.3% |
| $150,000 to $199,999 | 943 | 21.2% |
| $200,000+ | 1,263 | 28.4% |
Household Income by Householder Age in Bensville
The median household income in Bensville is $145,769, with the highest median household income of $159,293 found in the 45 to 64 years age bracket for the primary householder. A total of 2,465 households (55.4%) fall into this category. Meanwhile, the 15 to 24 years age bracket for the primary householder has the lowest median household income of $0, with 46 households (1.0%) in this group.
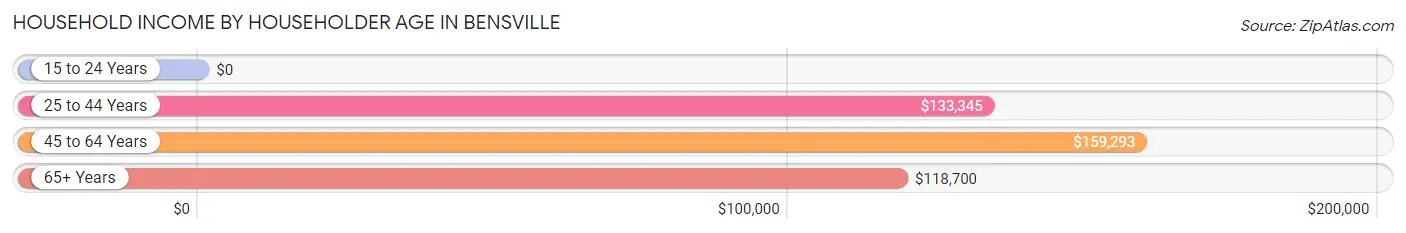
| Income Bracket | # Households | Median Income |
| 15 to 24 Years | 46 (1.0%) | $0 |
| 25 to 44 Years | 1,213 (27.3%) | $133,345 |
| 45 to 64 Years | 2,465 (55.4%) | $159,293 |
| 65+ Years | 722 (16.2%) | $118,700 |
| Total | 4,446 (100.0%) | $145,769 |
Poverty in Bensville
Income Below Poverty by Sex and Age in Bensville
With 12.0% poverty level for males and 6.6% for females among the residents of Bensville, 12 to 14 year old males and 15 year old females are the most vulnerable to poverty, with 160 males (30.3%) and 26 females (24.3%) in their respective age groups living below the poverty level.
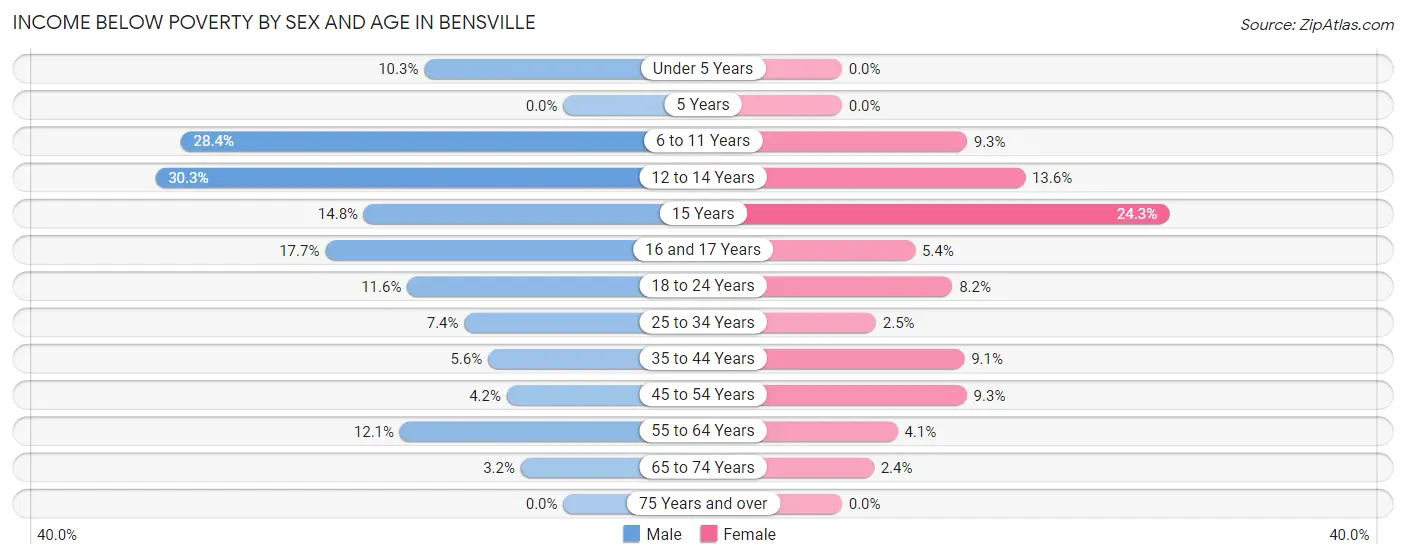
| Age Bracket | Male | Female |
| Under 5 Years | 44 (10.3%) | 0 (0.0%) |
| 5 Years | 0 (0.0%) | 0 (0.0%) |
| 6 to 11 Years | 221 (28.4%) | 36 (9.3%) |
| 12 to 14 Years | 160 (30.3%) | 34 (13.6%) |
| 15 Years | 24 (14.8%) | 26 (24.3%) |
| 16 and 17 Years | 29 (17.7%) | 12 (5.4%) |
| 18 to 24 Years | 56 (11.6%) | 68 (8.2%) |
| 25 to 34 Years | 66 (7.3%) | 15 (2.5%) |
| 35 to 44 Years | 50 (5.6%) | 80 (9.1%) |
| 45 to 54 Years | 38 (4.2%) | 131 (9.3%) |
| 55 to 64 Years | 155 (12.1%) | 44 (4.1%) |
| 65 to 74 Years | 16 (3.2%) | 16 (2.4%) |
| 75 Years and over | 0 (0.0%) | 0 (0.0%) |
| Total | 859 (12.0%) | 462 (6.6%) |
Income Above Poverty by Sex and Age in Bensville
According to the poverty statistics in Bensville, males aged 5 years and females aged under 5 years are the age groups that are most secure financially, with 100.0% of males and 100.0% of females in these age groups living above the poverty line.
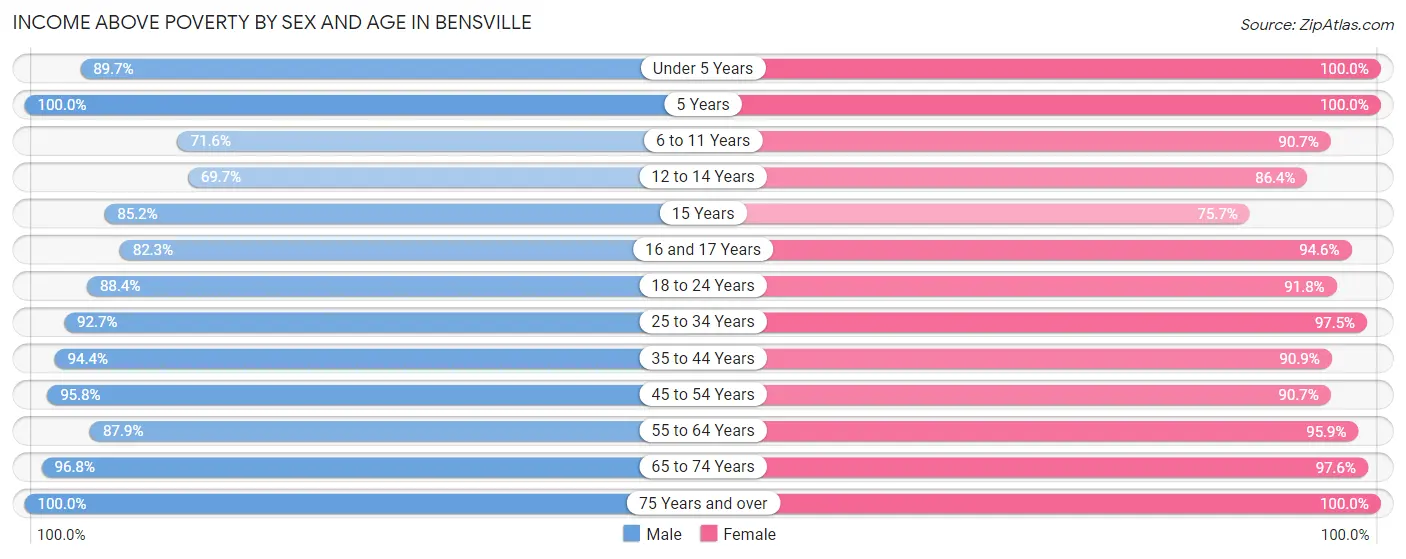
| Age Bracket | Male | Female |
| Under 5 Years | 382 (89.7%) | 277 (100.0%) |
| 5 Years | 12 (100.0%) | 105 (100.0%) |
| 6 to 11 Years | 557 (71.6%) | 352 (90.7%) |
| 12 to 14 Years | 368 (69.7%) | 216 (86.4%) |
| 15 Years | 138 (85.2%) | 81 (75.7%) |
| 16 and 17 Years | 135 (82.3%) | 209 (94.6%) |
| 18 to 24 Years | 427 (88.4%) | 761 (91.8%) |
| 25 to 34 Years | 832 (92.6%) | 577 (97.5%) |
| 35 to 44 Years | 845 (94.4%) | 800 (90.9%) |
| 45 to 54 Years | 866 (95.8%) | 1,282 (90.7%) |
| 55 to 64 Years | 1,122 (87.9%) | 1,022 (95.9%) |
| 65 to 74 Years | 490 (96.8%) | 659 (97.6%) |
| 75 Years and over | 106 (100.0%) | 198 (100.0%) |
| Total | 6,280 (88.0%) | 6,539 (93.4%) |
Income Below Poverty Among Married-Couple Families in Bensville
The poverty statistics for married-couple families in Bensville show that 6.1% or 181 of the total 2,963 families live below the poverty line. Families with 3 or 4 children have the highest poverty rate of 36.0%, comprising of 128 families. On the other hand, families with 5 or more children have the lowest poverty rate of 0.0%, which includes 0 families.
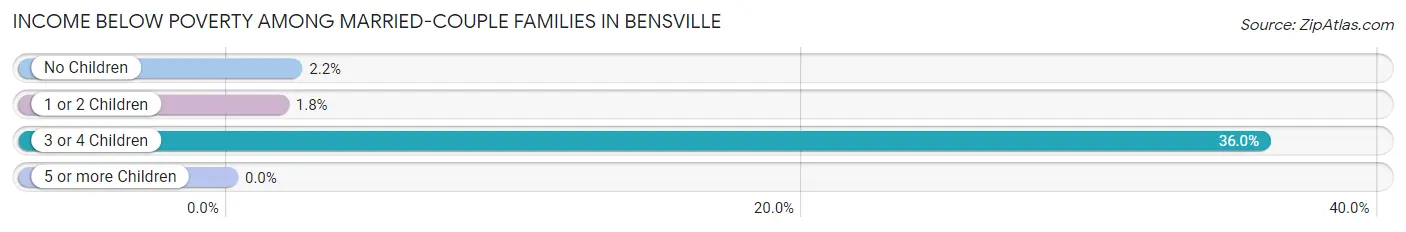
| Children | Above Poverty | Below Poverty |
| No Children | 1,617 (97.8%) | 37 (2.2%) |
| 1 or 2 Children | 890 (98.2%) | 16 (1.8%) |
| 3 or 4 Children | 228 (64.0%) | 128 (36.0%) |
| 5 or more Children | 47 (100.0%) | 0 (0.0%) |
| Total | 2,782 (93.9%) | 181 (6.1%) |
Income Below Poverty Among Single-Parent Households in Bensville
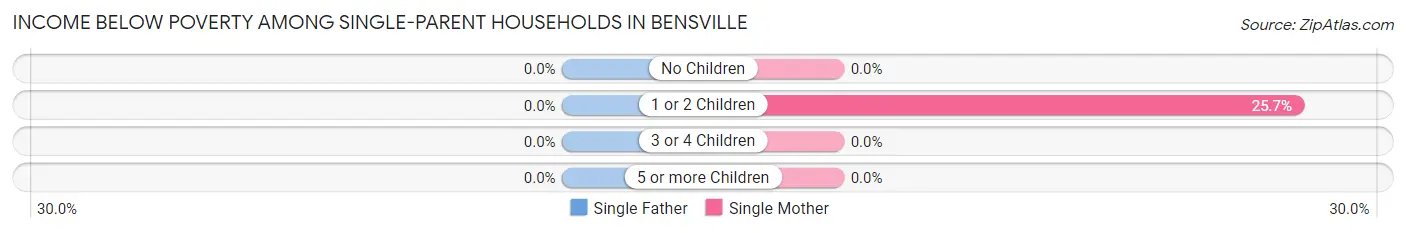
| Children | Single Father | Single Mother |
| No Children | 0 (0.0%) | 0 (0.0%) |
| 1 or 2 Children | 0 (0.0%) | 82 (25.7%) |
| 3 or 4 Children | 0 (0.0%) | 0 (0.0%) |
| 5 or more Children | 0 (0.0%) | 0 (0.0%) |
| Total | 0 (0.0%) | 82 (13.5%) |
Income Below Poverty Among Married-Couple vs Single-Parent Households in Bensville
The poverty data for Bensville shows that 181 of the married-couple family households (6.1%) and 82 of the single-parent households (11.5%) are living below the poverty level. Within the married-couple family households, those with 3 or 4 children have the highest poverty rate, with 128 households (36.0%) falling below the poverty line. Among the single-parent households, those with 1 or 2 children have the highest poverty rate, with 82 household (23.7%) living below poverty.
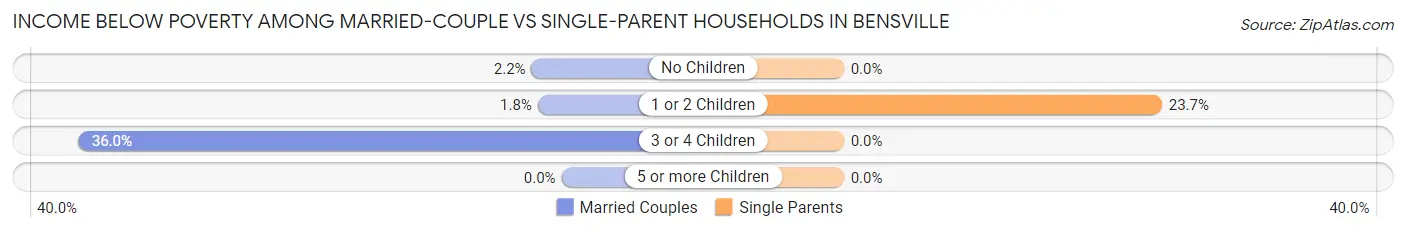
| Children | Married-Couple Families | Single-Parent Households |
| No Children | 37 (2.2%) | 0 (0.0%) |
| 1 or 2 Children | 16 (1.8%) | 82 (23.7%) |
| 3 or 4 Children | 128 (36.0%) | 0 (0.0%) |
| 5 or more Children | 0 (0.0%) | 0 (0.0%) |
| Total | 181 (6.1%) | 82 (11.5%) |
Race in Bensville
The most populous races in Bensville are Black / African American (7,957 | 56.0%), White / Caucasian (3,854 | 27.1%), and Two or more Races (1,418 | 10.0%).
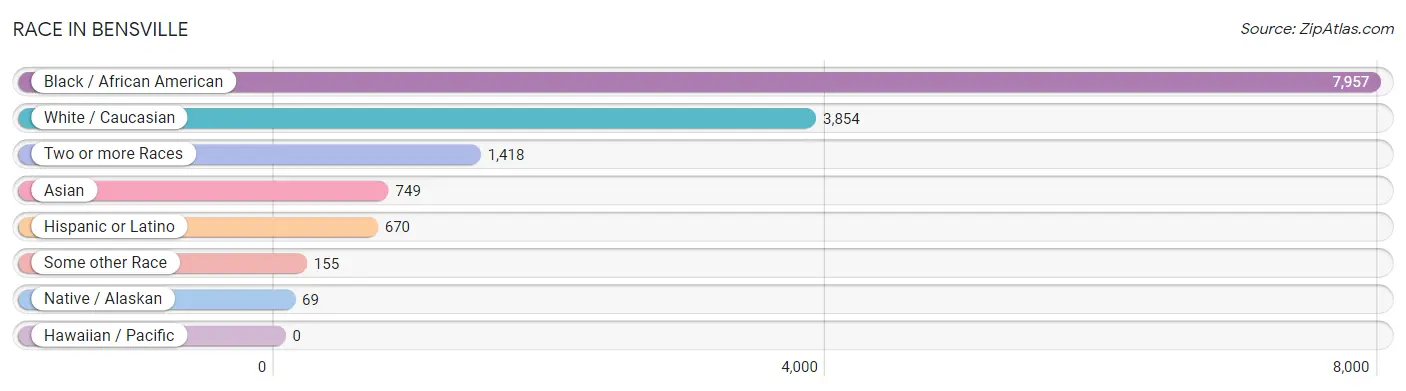
| Race | # Population | % Population |
| Asian | 749 | 5.3% |
| Black / African American | 7,957 | 56.0% |
| Hawaiian / Pacific | 0 | 0.0% |
| Hispanic or Latino | 670 | 4.7% |
| Native / Alaskan | 69 | 0.5% |
| White / Caucasian | 3,854 | 27.1% |
| Two or more Races | 1,418 | 10.0% |
| Some other Race | 155 | 1.1% |
| Total | 14,202 | 100.0% |
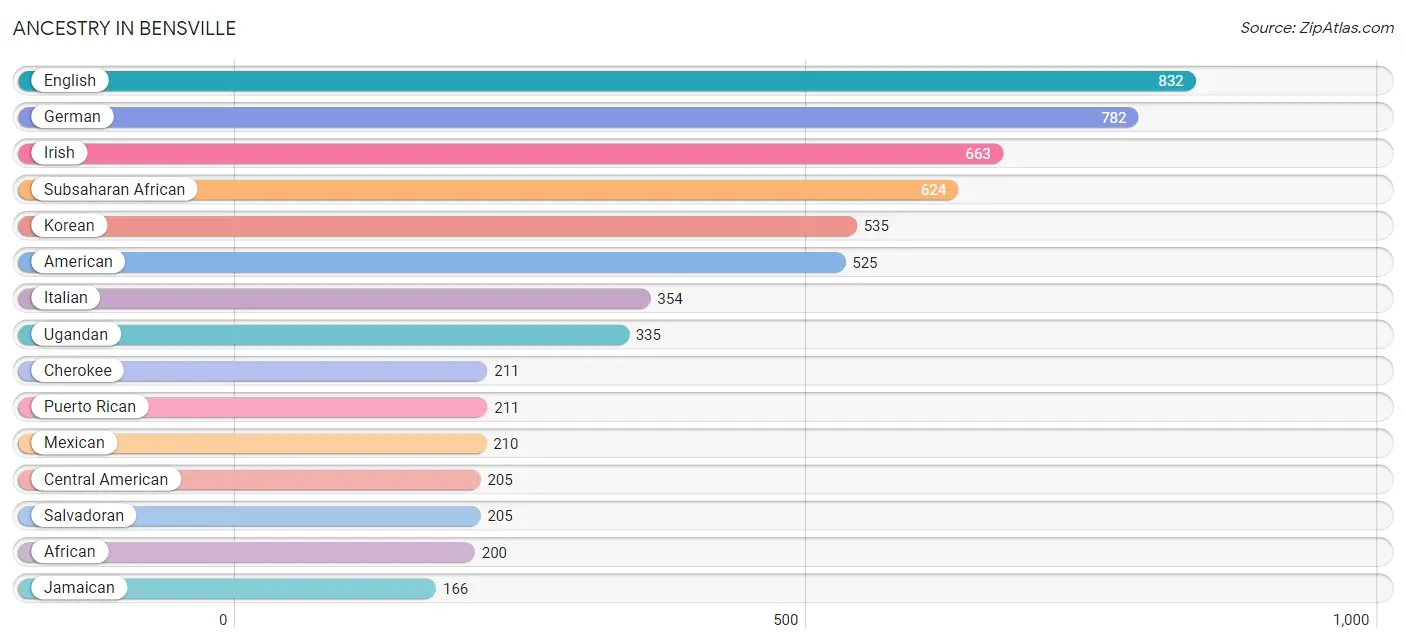
Ancestry in Bensville
The most populous ancestries reported in Bensville are English (832 | 5.9%), German (782 | 5.5%), Irish (663 | 4.7%), Subsaharan African (624 | 4.4%), and Korean (535 | 3.8%), together accounting for 24.2% of all Bensville residents.
| Ancestry | # Population | % Population |
| African | 200 | 1.4% |
| American | 525 | 3.7% |
| Arab | 19 | 0.1% |
| Belizean | 8 | 0.1% |
| Bhutanese | 129 | 0.9% |
| British | 121 | 0.9% |
| Burmese | 48 | 0.3% |
| Canadian | 60 | 0.4% |
| Central American | 205 | 1.4% |
| Cherokee | 211 | 1.5% |
| Choctaw | 2 | 0.0% |
| Cuban | 44 | 0.3% |
| Czech | 74 | 0.5% |
| Dutch | 38 | 0.3% |
| Eastern European | 13 | 0.1% |
| English | 832 | 5.9% |
| European | 76 | 0.5% |
| Finnish | 21 | 0.2% |
| French | 115 | 0.8% |
| German | 782 | 5.5% |
| Greek | 20 | 0.1% |
| Haitian | 134 | 0.9% |
| Indian (Asian) | 164 | 1.1% |
| Irish | 663 | 4.7% |
| Italian | 354 | 2.5% |
| Jamaican | 166 | 1.2% |
| Japanese | 16 | 0.1% |
| Korean | 535 | 3.8% |
| Mexican | 210 | 1.5% |
| Nigerian | 21 | 0.2% |
| Northern European | 16 | 0.1% |
| Norwegian | 95 | 0.7% |
| Polish | 149 | 1.1% |
| Portuguese | 45 | 0.3% |
| Puerto Rican | 211 | 1.5% |
| Russian | 6 | 0.0% |
| Salvadoran | 205 | 1.4% |
| Samoan | 19 | 0.1% |
| Scotch-Irish | 49 | 0.4% |
| Scottish | 117 | 0.8% |
| Sierra Leonean | 37 | 0.3% |
| Slovene | 48 | 0.3% |
| Sri Lankan | 19 | 0.1% |
| Subsaharan African | 624 | 4.4% |
| Swiss | 20 | 0.1% |
| Thai | 114 | 0.8% |
| Ugandan | 335 | 2.4% |
| Welsh | 108 | 0.8% | View All 48 Rows |
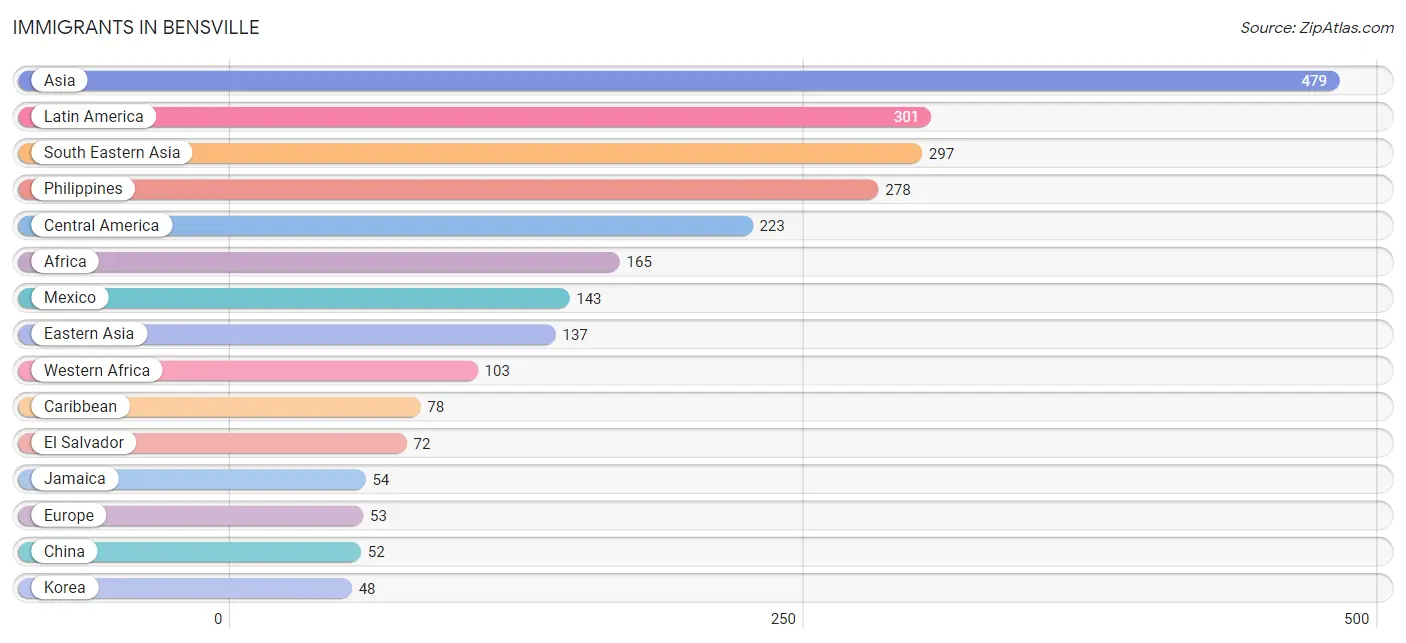
Immigrants in Bensville
The most numerous immigrant groups reported in Bensville came from Asia (479 | 3.4%), Latin America (301 | 2.1%), South Eastern Asia (297 | 2.1%), Philippines (278 | 2.0%), and Central America (223 | 1.6%), together accounting for 11.1% of all Bensville residents.
| Immigration Origin | # Population | % Population |
| Africa | 165 | 1.2% |
| Asia | 479 | 3.4% |
| Belize | 8 | 0.1% |
| Cameroon | 32 | 0.2% |
| Caribbean | 78 | 0.5% |
| Central America | 223 | 1.6% |
| China | 52 | 0.4% |
| Eastern Asia | 137 | 1.0% |
| El Salvador | 72 | 0.5% |
| England | 31 | 0.2% |
| Europe | 53 | 0.4% |
| Germany | 22 | 0.2% |
| Ghana | 14 | 0.1% |
| Haiti | 24 | 0.2% |
| Jamaica | 54 | 0.4% |
| Japan | 37 | 0.3% |
| Korea | 48 | 0.3% |
| Latin America | 301 | 2.1% |
| Mexico | 143 | 1.0% |
| Middle Africa | 32 | 0.2% |
| Nepal | 45 | 0.3% |
| Northern Europe | 31 | 0.2% |
| Philippines | 278 | 2.0% |
| Sierra Leone | 37 | 0.3% |
| South Africa | 30 | 0.2% |
| South Central Asia | 45 | 0.3% |
| South Eastern Asia | 297 | 2.1% |
| Vietnam | 19 | 0.1% |
| Western Africa | 103 | 0.7% |
| Western Europe | 22 | 0.2% | View All 30 Rows |
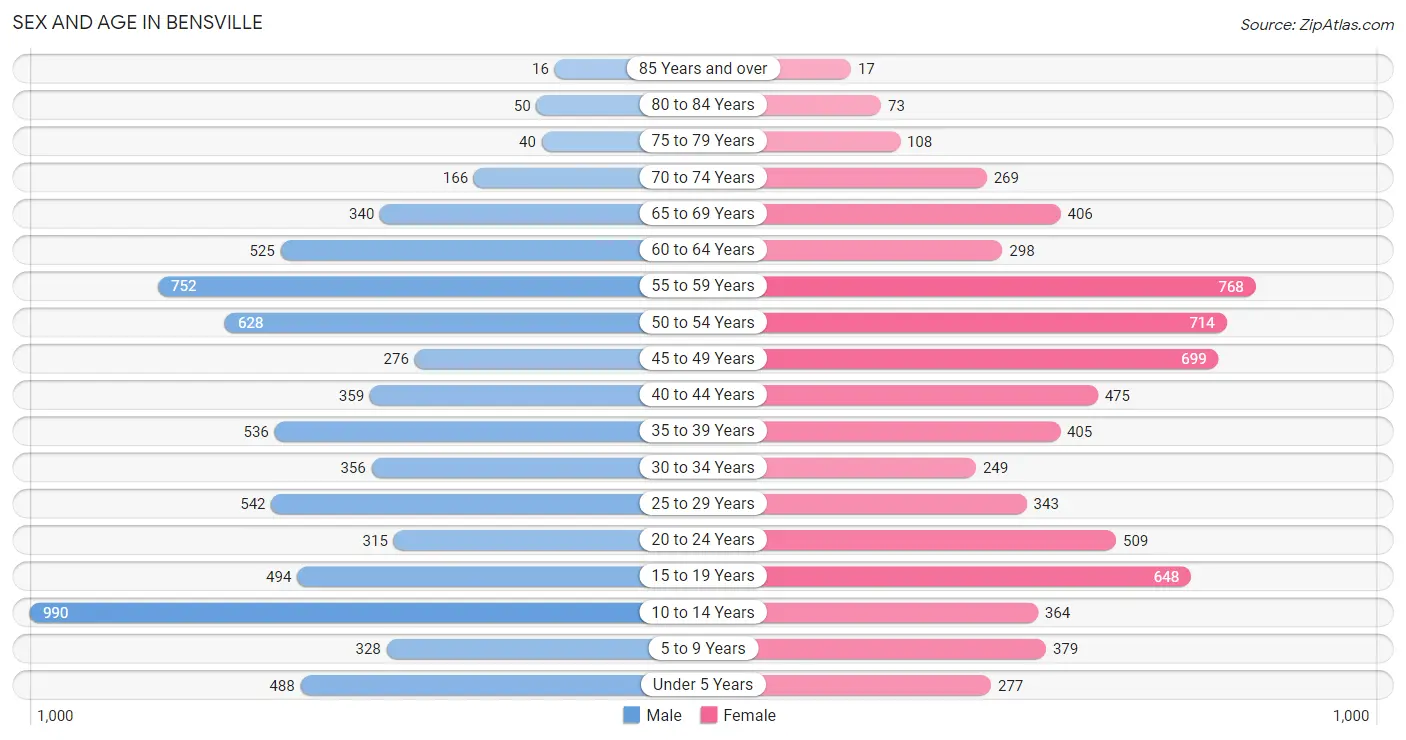
Sex and Age in Bensville
Sex and Age in Bensville
The most populous age groups in Bensville are 10 to 14 Years (990 | 13.8%) for men and 55 to 59 Years (768 | 11.0%) for women.
| Age Bracket | Male | Female |
| Under 5 Years | 488 (6.8%) | 277 (4.0%) |
| 5 to 9 Years | 328 (4.5%) | 379 (5.4%) |
| 10 to 14 Years | 990 (13.8%) | 364 (5.2%) |
| 15 to 19 Years | 494 (6.9%) | 648 (9.3%) |
| 20 to 24 Years | 315 (4.4%) | 509 (7.3%) |
| 25 to 29 Years | 542 (7.5%) | 343 (4.9%) |
| 30 to 34 Years | 356 (4.9%) | 249 (3.6%) |
| 35 to 39 Years | 536 (7.4%) | 405 (5.8%) |
| 40 to 44 Years | 359 (5.0%) | 475 (6.8%) |
| 45 to 49 Years | 276 (3.8%) | 699 (10.0%) |
| 50 to 54 Years | 628 (8.7%) | 714 (10.2%) |
| 55 to 59 Years | 752 (10.4%) | 768 (11.0%) |
| 60 to 64 Years | 525 (7.3%) | 298 (4.3%) |
| 65 to 69 Years | 340 (4.7%) | 406 (5.8%) |
| 70 to 74 Years | 166 (2.3%) | 269 (3.8%) |
| 75 to 79 Years | 40 (0.6%) | 108 (1.5%) |
| 80 to 84 Years | 50 (0.7%) | 73 (1.0%) |
| 85 Years and over | 16 (0.2%) | 17 (0.2%) |
| Total | 7,201 (100.0%) | 7,001 (100.0%) |
Families and Households in Bensville
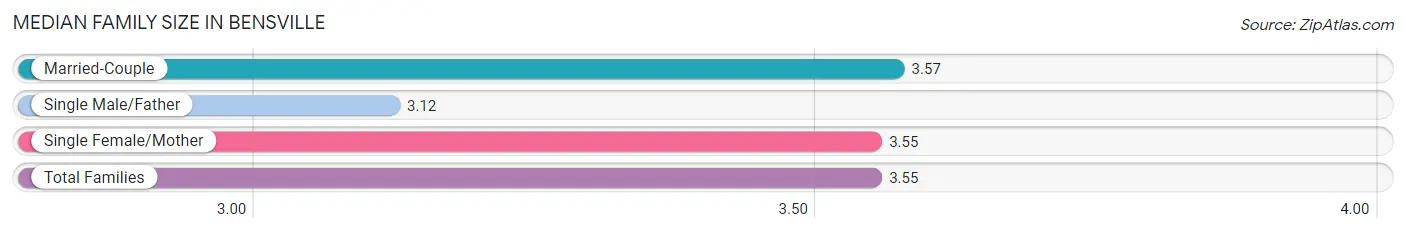
Median Family Size in Bensville
The median family size in Bensville is 3.55 persons per family, with married-couple families (2,963 | 80.6%) accounting for the largest median family size of 3.57 persons per family. On the other hand, single male/father families (104 | 2.8%) represent the smallest median family size with 3.12 persons per family.
| Family Type | # Families | Family Size |
| Married-Couple | 2,963 (80.6%) | 3.57 |
| Single Male/Father | 104 (2.8%) | 3.12 |
| Single Female/Mother | 607 (16.5%) | 3.55 |
| Total Families | 3,674 (100.0%) | 3.55 |
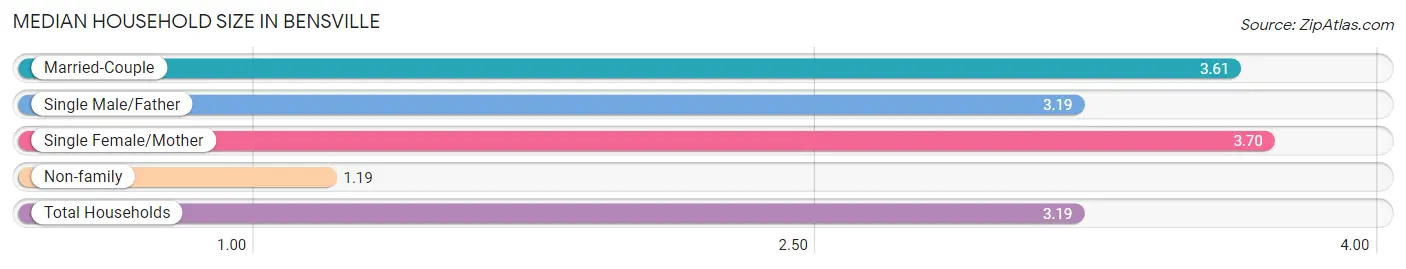
Median Household Size in Bensville
The median household size in Bensville is 3.19 persons per household, with single female/mother households (607 | 13.7%) accounting for the largest median household size of 3.7 persons per household. non-family households (772 | 17.4%) represent the smallest median household size with 1.19 persons per household.
| Household Type | # Households | Household Size |
| Married-Couple | 2,963 (66.6%) | 3.61 |
| Single Male/Father | 104 (2.3%) | 3.19 |
| Single Female/Mother | 607 (13.7%) | 3.70 |
| Non-family | 772 (17.4%) | 1.19 |
| Total Households | 4,446 (100.0%) | 3.19 |
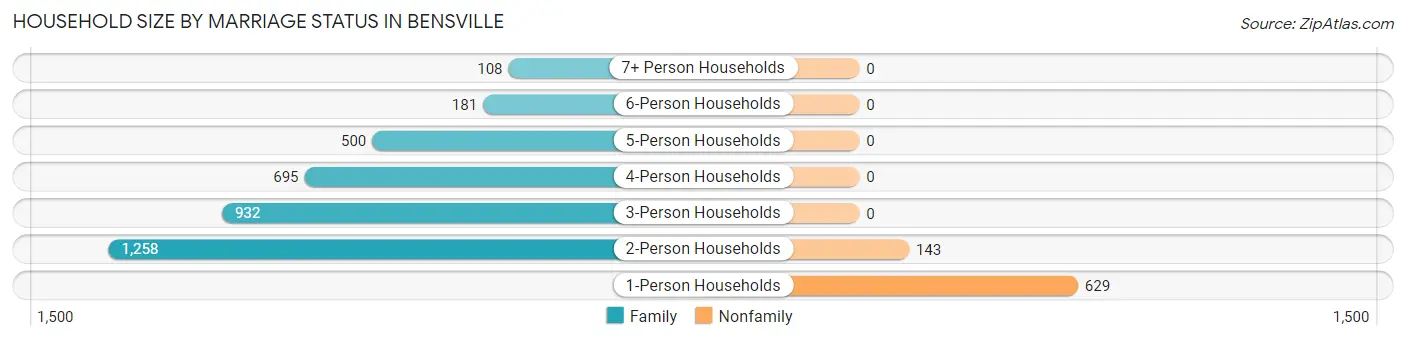
Household Size by Marriage Status in Bensville
Out of a total of 4,446 households in Bensville, 3,674 (82.6%) are family households, while 772 (17.4%) are nonfamily households. The most numerous type of family households are 2-person households, comprising 1,258, and the most common type of nonfamily households are 1-person households, comprising 629.
| Household Size | Family Households | Nonfamily Households |
| 1-Person Households | - | 629 (14.1%) |
| 2-Person Households | 1,258 (28.3%) | 143 (3.2%) |
| 3-Person Households | 932 (21.0%) | 0 (0.0%) |
| 4-Person Households | 695 (15.6%) | 0 (0.0%) |
| 5-Person Households | 500 (11.3%) | 0 (0.0%) |
| 6-Person Households | 181 (4.1%) | 0 (0.0%) |
| 7+ Person Households | 108 (2.4%) | 0 (0.0%) |
| Total | 3,674 (82.6%) | 772 (17.4%) |
Female Fertility in Bensville
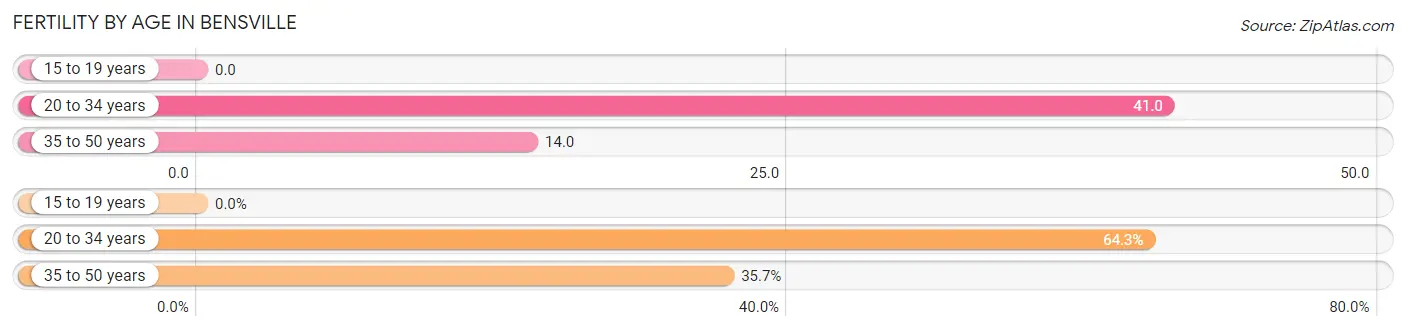
Fertility by Age in Bensville
Average fertility rate in Bensville is 20.0 births per 1,000 women. Women in the age bracket of 20 to 34 years have the highest fertility rate with 41.0 births per 1,000 women. Women in the age bracket of 20 to 34 years acount for 64.3% of all women with births.
| Age Bracket | Women with Births | Births / 1,000 Women |
| 15 to 19 years | 0 (0.0%) | 0.0 |
| 20 to 34 years | 45 (64.3%) | 41.0 |
| 35 to 50 years | 25 (35.7%) | 14.0 |
| Total | 70 (100.0%) | 20.0 |
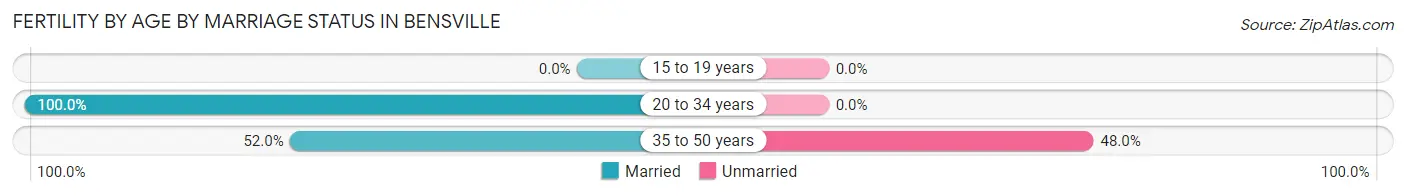
Fertility by Age by Marriage Status in Bensville
82.9% of women with births (70) in Bensville are married. The highest percentage of unmarried women with births falls into 35 to 50 years age bracket with 48.0% of them unmarried at the time of birth, while the lowest percentage of unmarried women with births belong to 20 to 34 years age bracket with 0.0% of them unmarried.
| Age Bracket | Married | Unmarried |
| 15 to 19 years | 0 (0.0%) | 0 (0.0%) |
| 20 to 34 years | 45 (100.0%) | 0 (0.0%) |
| 35 to 50 years | 13 (52.0%) | 12 (48.0%) |
| Total | 58 (82.9%) | 12 (17.1%) |
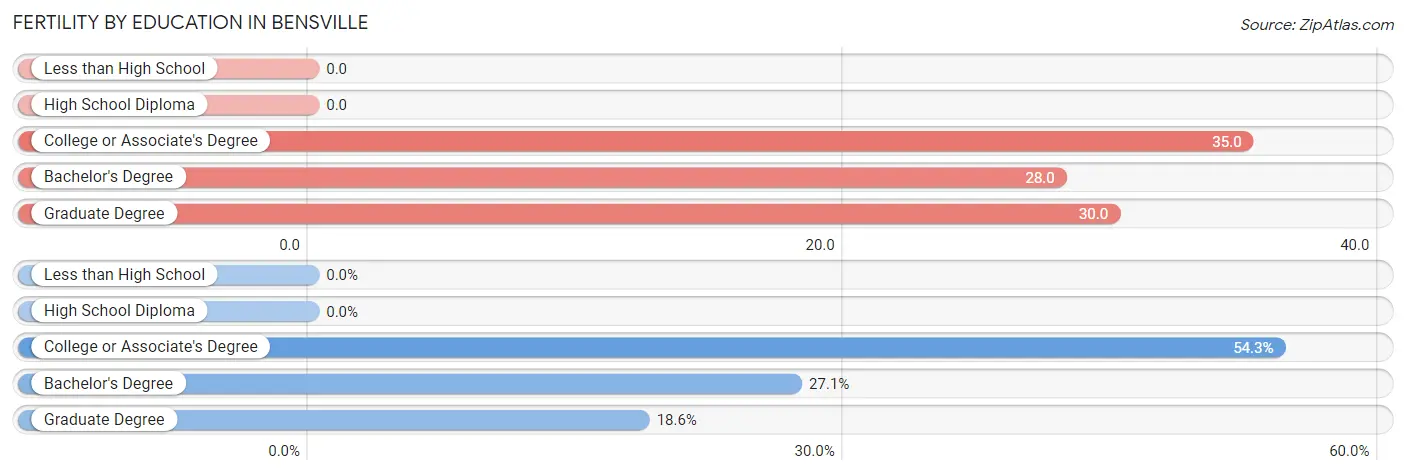
Fertility by Education in Bensville
| Educational Attainment | Women with Births | Births / 1,000 Women |
| Less than High School | 0 (0.0%) | 0.0 |
| High School Diploma | 0 (0.0%) | 0.0 |
| College or Associate's Degree | 38 (54.3%) | 35.0 |
| Bachelor's Degree | 19 (27.1%) | 28.0 |
| Graduate Degree | 13 (18.6%) | 30.0 |
| Total | 70 (100.0%) | 20.0 |
Fertility by Education by Marriage Status in Bensville
17.1% of women with births in Bensville are unmarried. Women with the educational attainment of bachelor's degree are most likely to be married with 100.0% of them married at childbirth, while women with the educational attainment of college or associate's degree are least likely to be married with 31.6% of them unmarried at childbirth.
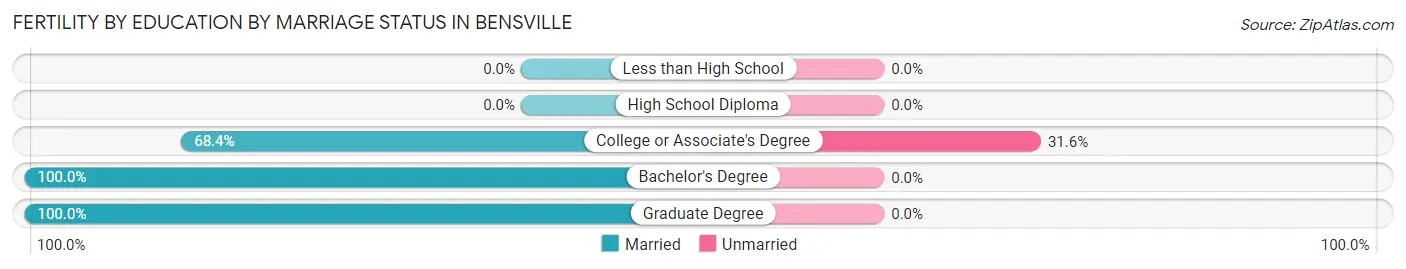
| Educational Attainment | Married | Unmarried |
| Less than High School | 0 (0.0%) | 0 (0.0%) |
| High School Diploma | 0 (0.0%) | 0 (0.0%) |
| College or Associate's Degree | 26 (68.4%) | 12 (31.6%) |
| Bachelor's Degree | 19 (100.0%) | 0 (0.0%) |
| Graduate Degree | 13 (100.0%) | 0 (0.0%) |
| Total | 58 (82.9%) | 12 (17.1%) |
Employment Characteristics in Bensville
Employment by Class of Employer in Bensville
Among the 6,976 employed individuals in Bensville, private company employees (2,912 | 41.7%), federal government employees (1,832 | 26.3%), and local government employees (968 | 13.9%) make up the most common classes of employment.
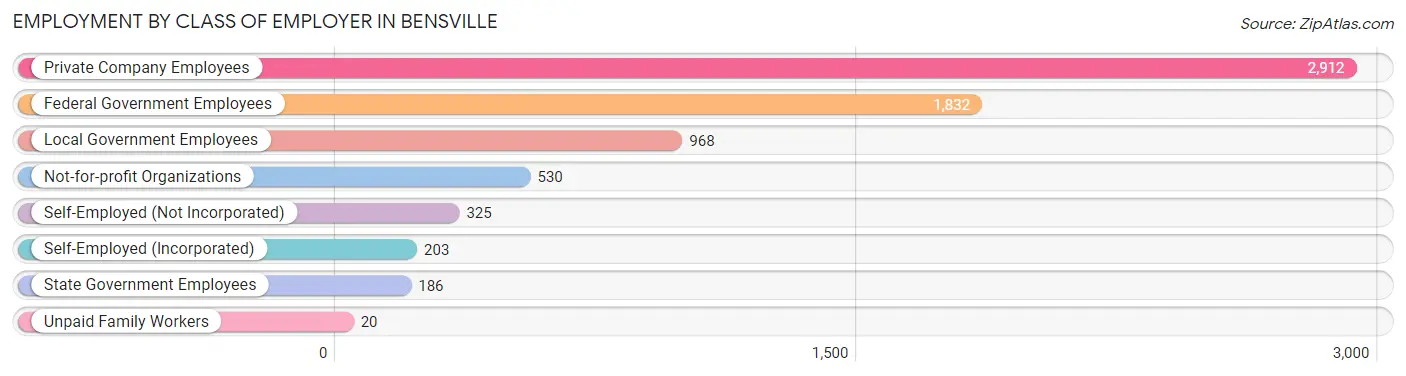
| Employer Class | # Employees | % Employees |
| Private Company Employees | 2,912 | 41.7% |
| Self-Employed (Incorporated) | 203 | 2.9% |
| Self-Employed (Not Incorporated) | 325 | 4.7% |
| Not-for-profit Organizations | 530 | 7.6% |
| Local Government Employees | 968 | 13.9% |
| State Government Employees | 186 | 2.7% |
| Federal Government Employees | 1,832 | 26.3% |
| Unpaid Family Workers | 20 | 0.3% |
| Total | 6,976 | 100.0% |
Employment Status by Age in Bensville
According to the labor force statistics for Bensville, out of the total population over 16 years of age (11,107), 66.5% or 7,386 individuals are in the labor force, with 4.3% or 318 of them unemployed. The age group with the highest labor force participation rate is 45 to 54 years, with 90.3% or 2,092 individuals in the labor force. Within the labor force, the 20 to 24 years age range has the highest percentage of unemployed individuals, with 16.7% or 101 of them being unemployed.
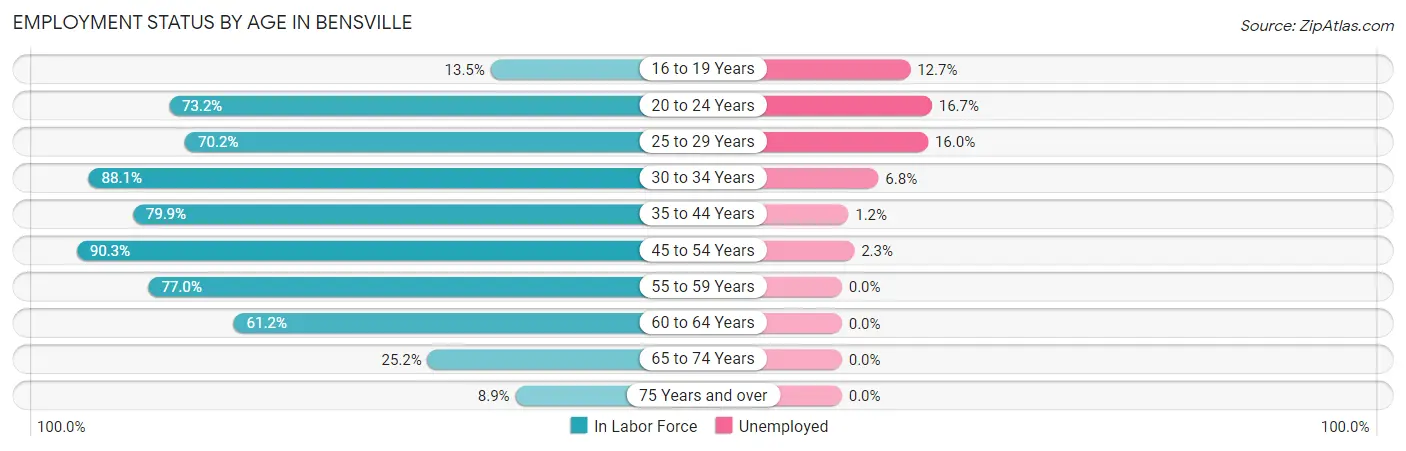
| Age Bracket | In Labor Force | Unemployed |
| 16 to 19 Years | 118 (13.5%) | 15 (12.7%) |
| 20 to 24 Years | 603 (73.2%) | 101 (16.7%) |
| 25 to 29 Years | 621 (70.2%) | 99 (16.0%) |
| 30 to 34 Years | 533 (88.1%) | 36 (6.8%) |
| 35 to 44 Years | 1,418 (79.9%) | 17 (1.2%) |
| 45 to 54 Years | 2,092 (90.3%) | 48 (2.3%) |
| 55 to 59 Years | 1,170 (77.0%) | 0 (0.0%) |
| 60 to 64 Years | 504 (61.2%) | 0 (0.0%) |
| 65 to 74 Years | 298 (25.2%) | 0 (0.0%) |
| 75 Years and over | 27 (8.9%) | 0 (0.0%) |
| Total | 7,386 (66.5%) | 318 (4.3%) |
Employment Status by Educational Attainment in Bensville
According to labor force statistics for Bensville, 80.0% of individuals (6,340) out of the total population between 25 and 64 years of age (7,925) are in the labor force, with 3.1% or 197 of them being unemployed. The group with the highest labor force participation rate are those with the educational attainment of bachelor's degree or higher, with 89.0% or 2,660 individuals in the labor force. Within the labor force, individuals with less than high school education have the highest percentage of unemployment, with 11.8% or 36 of them being unemployed.
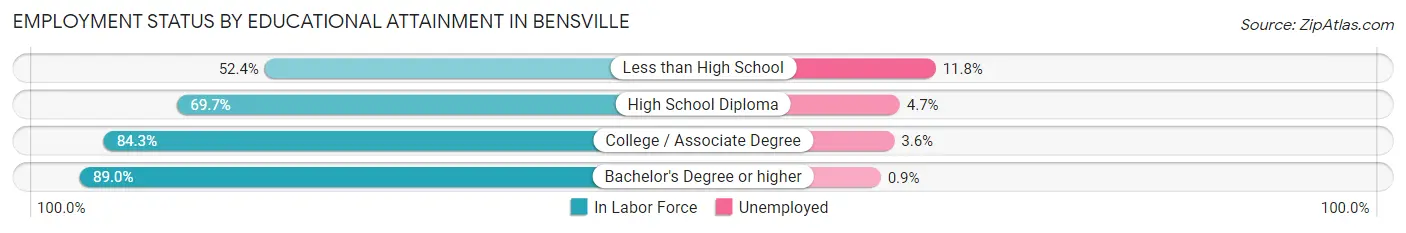
| Educational Attainment | In Labor Force | Unemployed |
| Less than High School | 306 (52.4%) | 69 (11.8%) |
| High School Diploma | 1,400 (69.7%) | 94 (4.7%) |
| College / Associate Degree | 1,976 (84.3%) | 84 (3.6%) |
| Bachelor's Degree or higher | 2,660 (89.0%) | 27 (0.9%) |
| Total | 6,340 (80.0%) | 246 (3.1%) |
Employment Occupations by Sex in Bensville
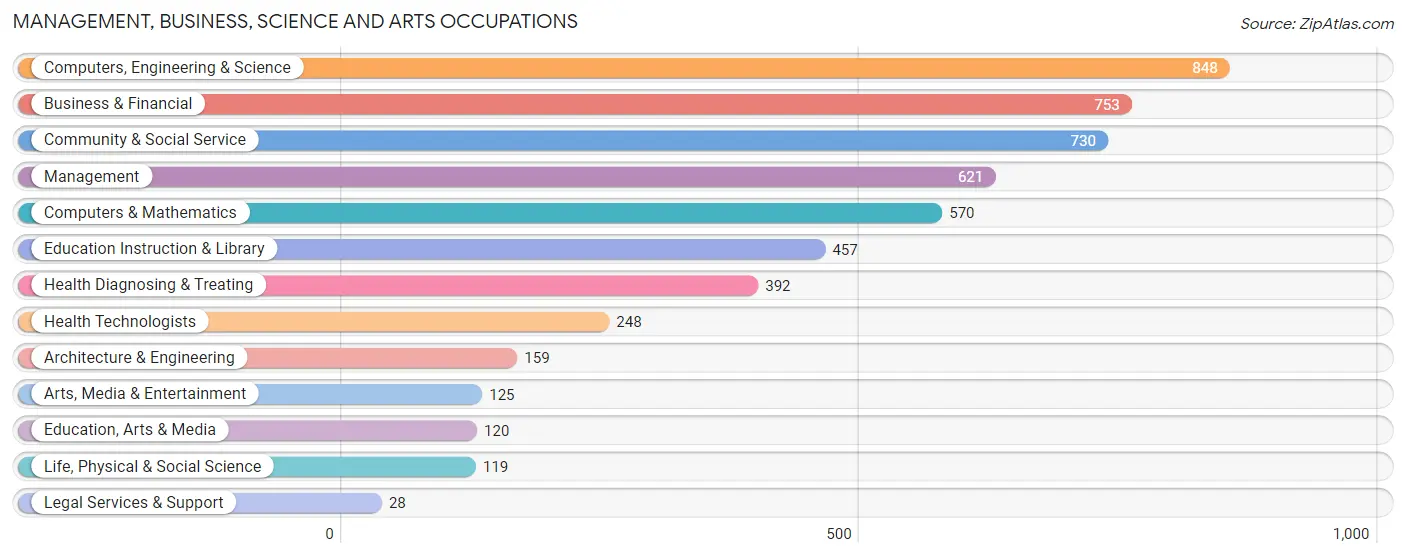
Management, Business, Science and Arts Occupations
The most common Management, Business, Science and Arts occupations in Bensville are Computers, Engineering & Science (848 | 12.1%), Business & Financial (753 | 10.8%), Community & Social Service (730 | 10.5%), Management (621 | 8.9%), and Computers & Mathematics (570 | 8.2%).
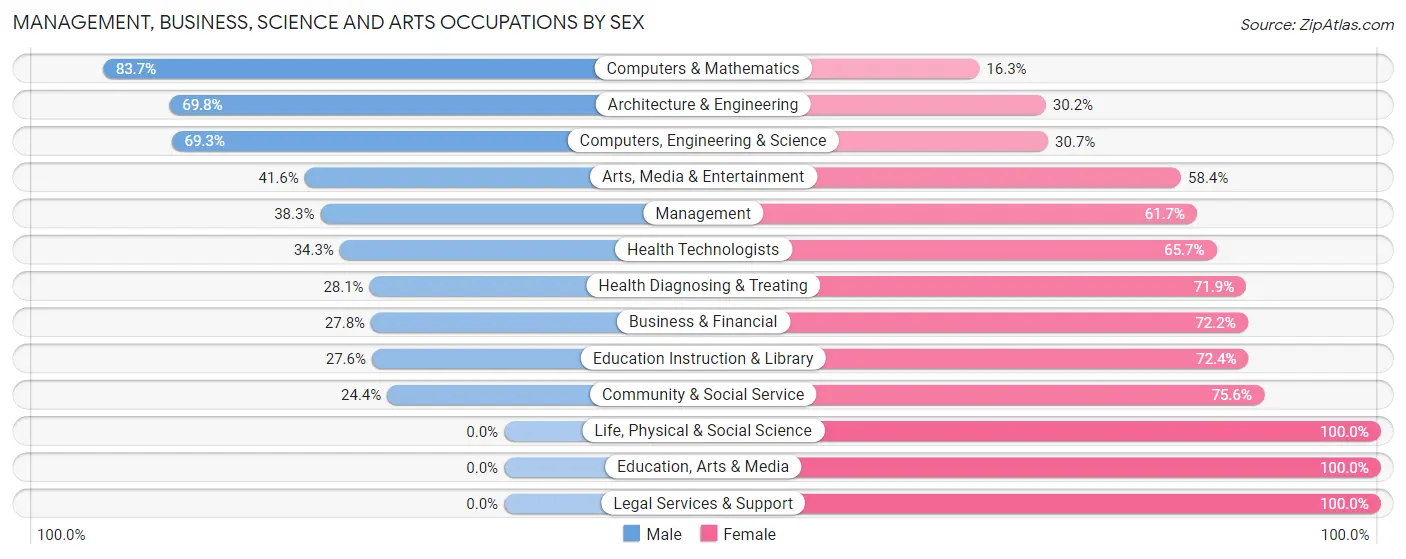
Management, Business, Science and Arts Occupations by Sex
Within the Management, Business, Science and Arts occupations in Bensville, the most male-oriented occupations are Computers & Mathematics (83.7%), Architecture & Engineering (69.8%), and Computers, Engineering & Science (69.3%), while the most female-oriented occupations are Life, Physical & Social Science (100.0%), Education, Arts & Media (100.0%), and Legal Services & Support (100.0%).
| Occupation | Male | Female |
| Management | 238 (38.3%) | 383 (61.7%) |
| Business & Financial | 209 (27.8%) | 544 (72.2%) |
| Computers, Engineering & Science | 588 (69.3%) | 260 (30.7%) |
| Computers & Mathematics | 477 (83.7%) | 93 (16.3%) |
| Architecture & Engineering | 111 (69.8%) | 48 (30.2%) |
| Life, Physical & Social Science | 0 (0.0%) | 119 (100.0%) |
| Community & Social Service | 178 (24.4%) | 552 (75.6%) |
| Education, Arts & Media | 0 (0.0%) | 120 (100.0%) |
| Legal Services & Support | 0 (0.0%) | 28 (100.0%) |
| Education Instruction & Library | 126 (27.6%) | 331 (72.4%) |
| Arts, Media & Entertainment | 52 (41.6%) | 73 (58.4%) |
| Health Diagnosing & Treating | 110 (28.1%) | 282 (71.9%) |
| Health Technologists | 85 (34.3%) | 163 (65.7%) |
| Total (Category) | 1,323 (39.6%) | 2,021 (60.4%) |
| Total (Overall) | 3,393 (48.6%) | 3,586 (51.4%) |
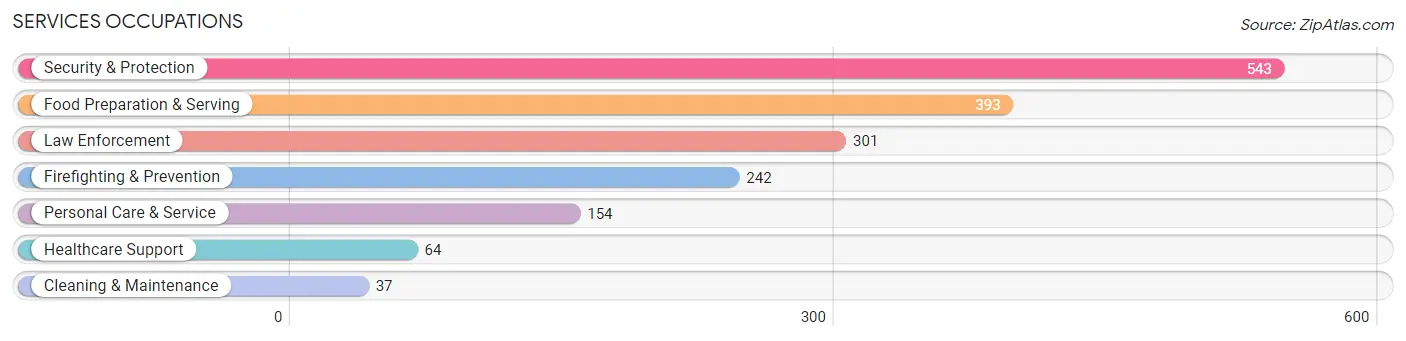
Services Occupations
The most common Services occupations in Bensville are Security & Protection (543 | 7.8%), Food Preparation & Serving (393 | 5.6%), Law Enforcement (301 | 4.3%), Firefighting & Prevention (242 | 3.5%), and Personal Care & Service (154 | 2.2%).
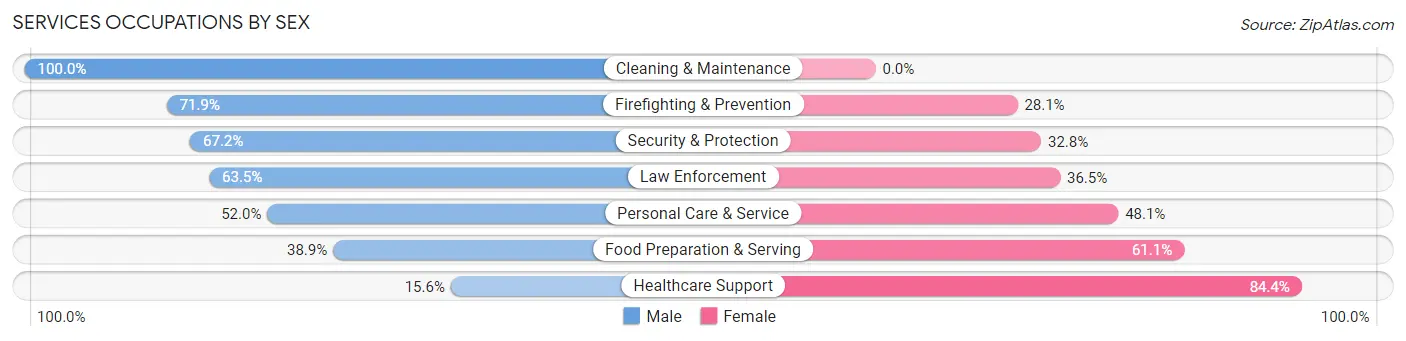
Services Occupations by Sex
Within the Services occupations in Bensville, the most male-oriented occupations are Cleaning & Maintenance (100.0%), Firefighting & Prevention (71.9%), and Security & Protection (67.2%), while the most female-oriented occupations are Healthcare Support (84.4%), Food Preparation & Serving (61.1%), and Personal Care & Service (48.0%).
| Occupation | Male | Female |
| Healthcare Support | 10 (15.6%) | 54 (84.4%) |
| Security & Protection | 365 (67.2%) | 178 (32.8%) |
| Firefighting & Prevention | 174 (71.9%) | 68 (28.1%) |
| Law Enforcement | 191 (63.5%) | 110 (36.5%) |
| Food Preparation & Serving | 153 (38.9%) | 240 (61.1%) |
| Cleaning & Maintenance | 37 (100.0%) | 0 (0.0%) |
| Personal Care & Service | 80 (51.9%) | 74 (48.0%) |
| Total (Category) | 645 (54.2%) | 546 (45.8%) |
| Total (Overall) | 3,393 (48.6%) | 3,586 (51.4%) |
Sales and Office Occupations
The most common Sales and Office occupations in Bensville are Office & Administration (665 | 9.5%), and Sales & Related (594 | 8.5%).

Sales and Office Occupations by Sex
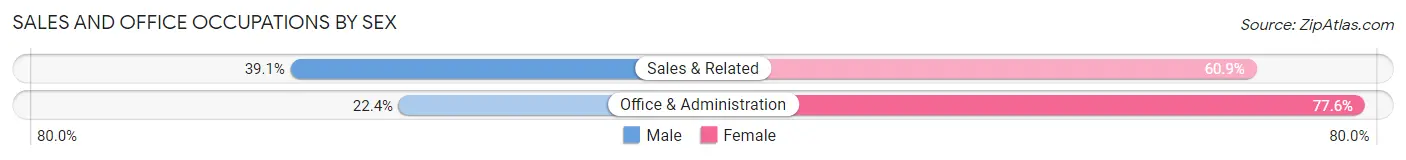
| Occupation | Male | Female |
| Sales & Related | 232 (39.1%) | 362 (60.9%) |
| Office & Administration | 149 (22.4%) | 516 (77.6%) |
| Total (Category) | 381 (30.3%) | 878 (69.7%) |
| Total (Overall) | 3,393 (48.6%) | 3,586 (51.4%) |
Natural Resources, Construction and Maintenance Occupations
The most common Natural Resources, Construction and Maintenance occupations in Bensville are Installation, Maintenance & Repair (329 | 4.7%), and Construction & Extraction (251 | 3.6%).

Natural Resources, Construction and Maintenance Occupations by Sex
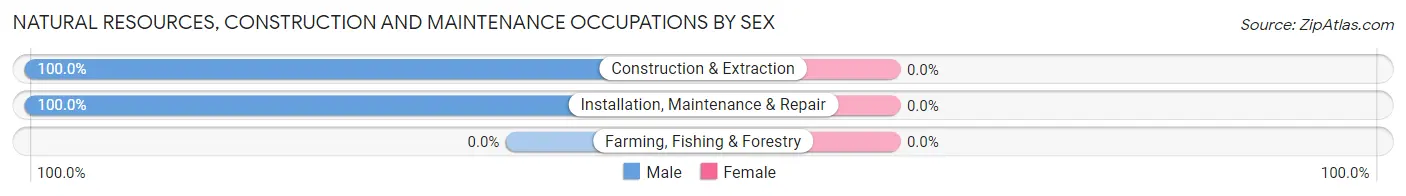
| Occupation | Male | Female |
| Farming, Fishing & Forestry | 0 (0.0%) | 0 (0.0%) |
| Construction & Extraction | 251 (100.0%) | 0 (0.0%) |
| Installation, Maintenance & Repair | 329 (100.0%) | 0 (0.0%) |
| Total (Category) | 580 (100.0%) | 0 (0.0%) |
| Total (Overall) | 3,393 (48.6%) | 3,586 (51.4%) |
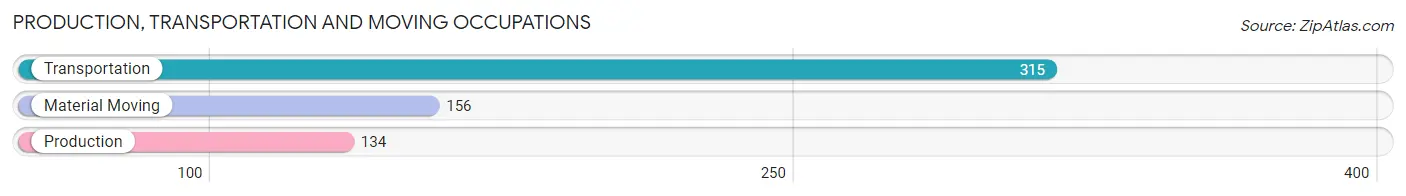
Production, Transportation and Moving Occupations
The most common Production, Transportation and Moving occupations in Bensville are Transportation (315 | 4.5%), Material Moving (156 | 2.2%), and Production (134 | 1.9%).
Production, Transportation and Moving Occupations by Sex
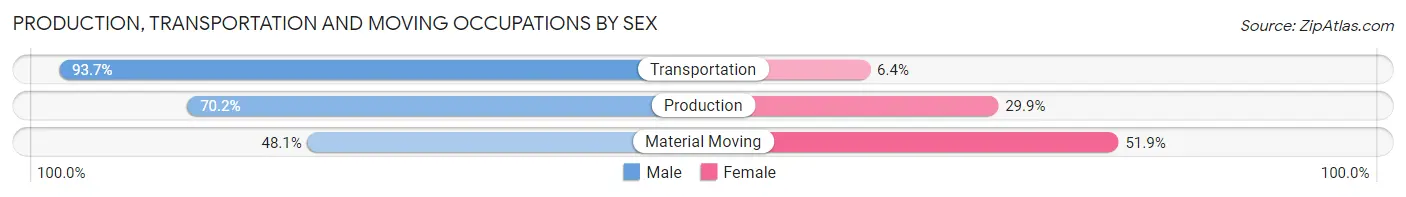
| Occupation | Male | Female |
| Production | 94 (70.2%) | 40 (29.8%) |
| Transportation | 295 (93.6%) | 20 (6.4%) |
| Material Moving | 75 (48.1%) | 81 (51.9%) |
| Total (Category) | 464 (76.7%) | 141 (23.3%) |
| Total (Overall) | 3,393 (48.6%) | 3,586 (51.4%) |
Employment Industries by Sex in Bensville
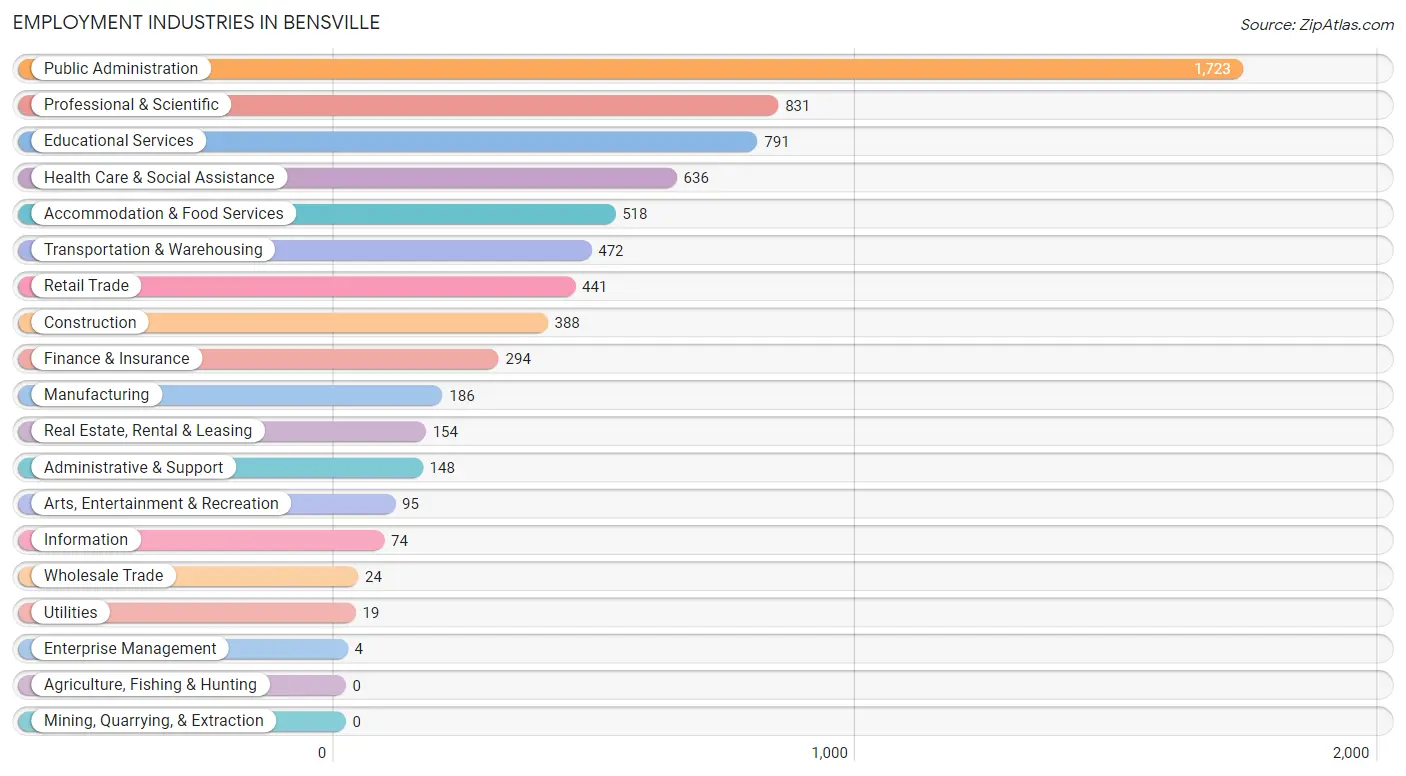
Employment Industries in Bensville
The major employment industries in Bensville include Public Administration (1,723 | 24.7%), Professional & Scientific (831 | 11.9%), Educational Services (791 | 11.3%), Health Care & Social Assistance (636 | 9.1%), and Accommodation & Food Services (518 | 7.4%).
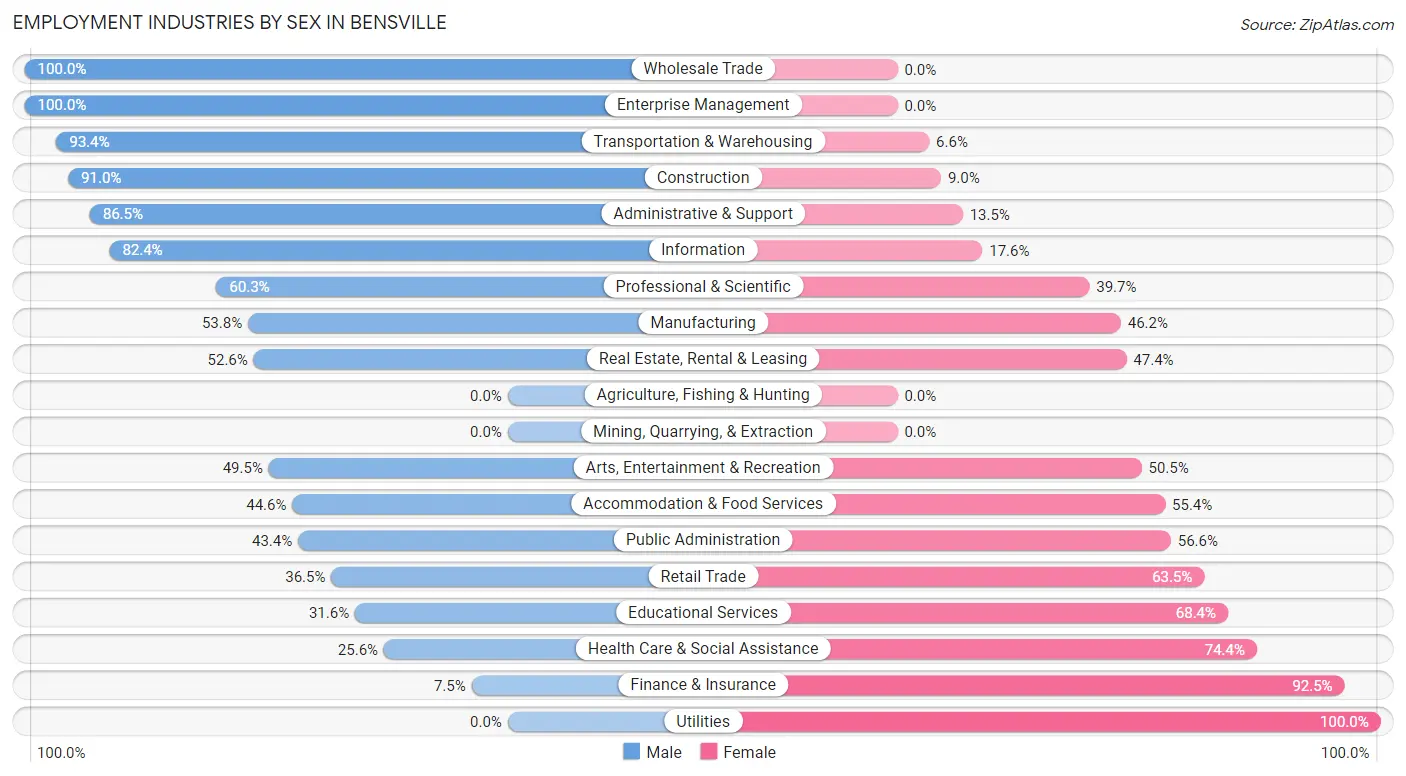
Employment Industries by Sex in Bensville
The Bensville industries that see more men than women are Wholesale Trade (100.0%), Enterprise Management (100.0%), and Transportation & Warehousing (93.4%), whereas the industries that tend to have a higher number of women are Utilities (100.0%), Finance & Insurance (92.5%), and Health Care & Social Assistance (74.4%).
| Industry | Male | Female |
| Agriculture, Fishing & Hunting | 0 (0.0%) | 0 (0.0%) |
| Mining, Quarrying, & Extraction | 0 (0.0%) | 0 (0.0%) |
| Construction | 353 (91.0%) | 35 (9.0%) |
| Manufacturing | 100 (53.8%) | 86 (46.2%) |
| Wholesale Trade | 24 (100.0%) | 0 (0.0%) |
| Retail Trade | 161 (36.5%) | 280 (63.5%) |
| Transportation & Warehousing | 441 (93.4%) | 31 (6.6%) |
| Utilities | 0 (0.0%) | 19 (100.0%) |
| Information | 61 (82.4%) | 13 (17.6%) |
| Finance & Insurance | 22 (7.5%) | 272 (92.5%) |
| Real Estate, Rental & Leasing | 81 (52.6%) | 73 (47.4%) |
| Professional & Scientific | 501 (60.3%) | 330 (39.7%) |
| Enterprise Management | 4 (100.0%) | 0 (0.0%) |
| Administrative & Support | 128 (86.5%) | 20 (13.5%) |
| Educational Services | 250 (31.6%) | 541 (68.4%) |
| Health Care & Social Assistance | 163 (25.6%) | 473 (74.4%) |
| Arts, Entertainment & Recreation | 47 (49.5%) | 48 (50.5%) |
| Accommodation & Food Services | 231 (44.6%) | 287 (55.4%) |
| Public Administration | 748 (43.4%) | 975 (56.6%) |
| Total | 3,393 (48.6%) | 3,586 (51.4%) |
Education in Bensville
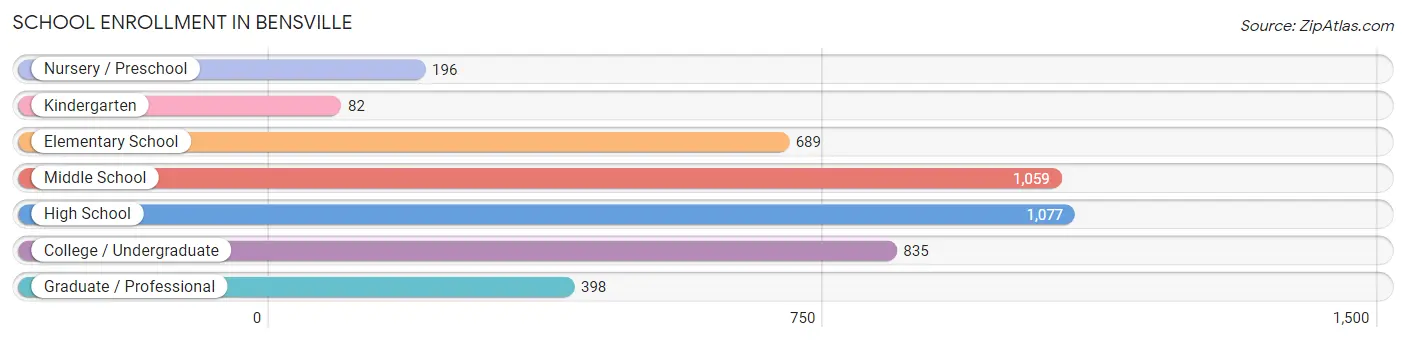
School Enrollment in Bensville
The most common levels of schooling among the 4,336 students in Bensville are high school (1,077 | 24.8%), middle school (1,059 | 24.4%), and college / undergraduate (835 | 19.3%).
| School Level | # Students | % Students |
| Nursery / Preschool | 196 | 4.5% |
| Kindergarten | 82 | 1.9% |
| Elementary School | 689 | 15.9% |
| Middle School | 1,059 | 24.4% |
| High School | 1,077 | 24.8% |
| College / Undergraduate | 835 | 19.3% |
| Graduate / Professional | 398 | 9.2% |
| Total | 4,336 | 100.0% |
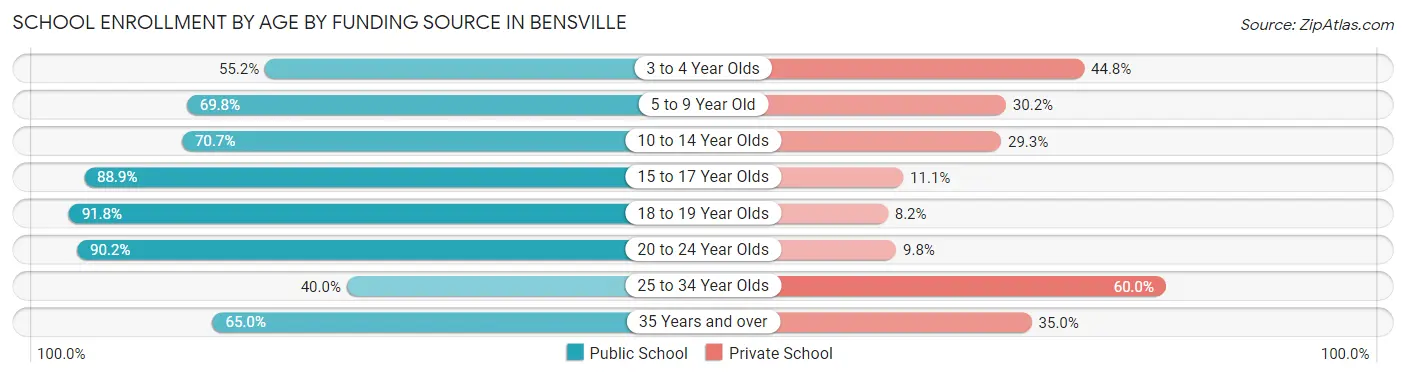
School Enrollment by Age by Funding Source in Bensville
Out of a total of 4,336 students who are enrolled in schools in Bensville, 1,153 (26.6%) attend a private institution, while the remaining 3,183 (73.4%) are enrolled in public schools. The age group of 25 to 34 year olds has the highest likelihood of being enrolled in private schools, with 141 (60.0% in the age bracket) enrolled. Conversely, the age group of 18 to 19 year olds has the lowest likelihood of being enrolled in a private school, with 324 (91.8% in the age bracket) attending a public institution.
| Age Bracket | Public School | Private School |
| 3 to 4 Year Olds | 74 (55.2%) | 60 (44.8%) |
| 5 to 9 Year Old | 485 (69.8%) | 210 (30.2%) |
| 10 to 14 Year Olds | 957 (70.7%) | 397 (29.3%) |
| 15 to 17 Year Olds | 570 (88.9%) | 71 (11.1%) |
| 18 to 19 Year Olds | 324 (91.8%) | 29 (8.2%) |
| 20 to 24 Year Olds | 277 (90.2%) | 30 (9.8%) |
| 25 to 34 Year Olds | 94 (40.0%) | 141 (60.0%) |
| 35 Years and over | 401 (65.0%) | 216 (35.0%) |
| Total | 3,183 (73.4%) | 1,153 (26.6%) |
Educational Attainment by Field of Study in Bensville
Business (993 | 28.9%), arts & humanities (375 | 10.9%), education (366 | 10.7%), social sciences (348 | 10.1%), and science & technology (271 | 7.9%) are the most common fields of study among 3,435 individuals in Bensville who have obtained a bachelor's degree or higher.
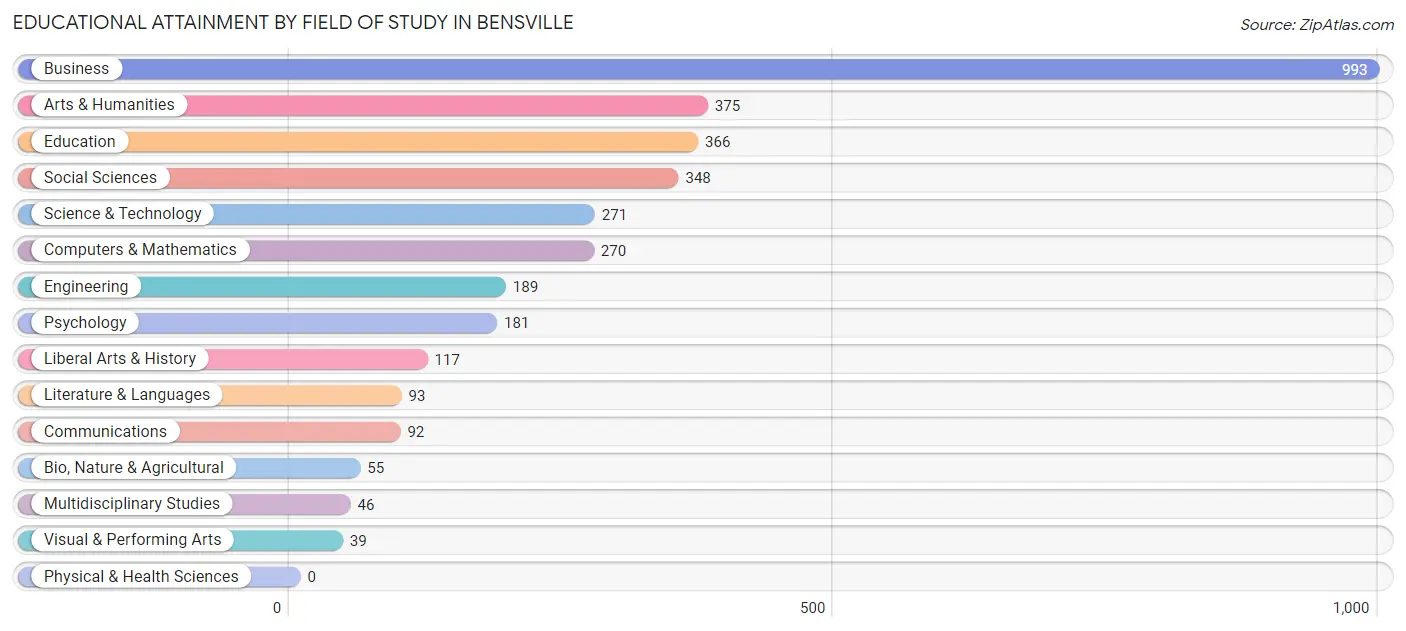
| Field of Study | # Graduates | % Graduates |
| Computers & Mathematics | 270 | 7.9% |
| Bio, Nature & Agricultural | 55 | 1.6% |
| Physical & Health Sciences | 0 | 0.0% |
| Psychology | 181 | 5.3% |
| Social Sciences | 348 | 10.1% |
| Engineering | 189 | 5.5% |
| Multidisciplinary Studies | 46 | 1.3% |
| Science & Technology | 271 | 7.9% |
| Business | 993 | 28.9% |
| Education | 366 | 10.7% |
| Literature & Languages | 93 | 2.7% |
| Liberal Arts & History | 117 | 3.4% |
| Visual & Performing Arts | 39 | 1.1% |
| Communications | 92 | 2.7% |
| Arts & Humanities | 375 | 10.9% |
| Total | 3,435 | 100.0% |
Transportation & Commute in Bensville
Vehicle Availability by Sex in Bensville
The most prevalent vehicle ownership categories in Bensville are males with 2 vehicles (1,243, accounting for 36.4%) and females with 2 vehicles (1,121, making up 34.9%).
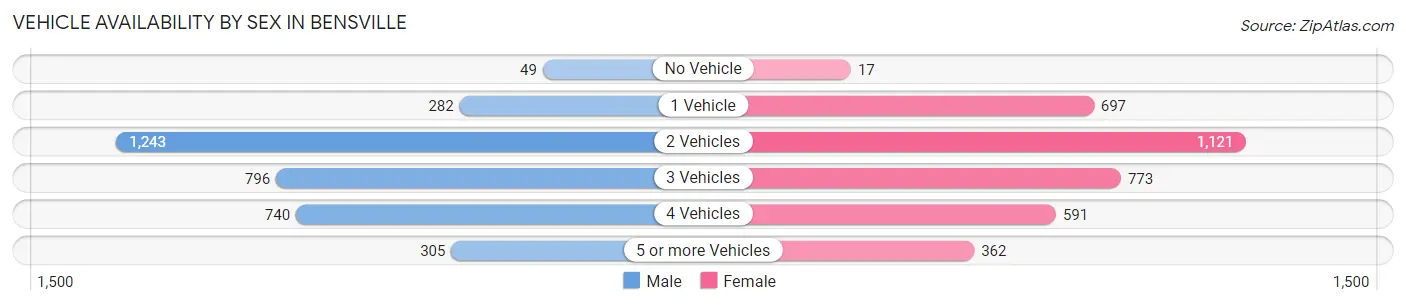
| Vehicles Available | Male | Female |
| No Vehicle | 49 (1.4%) | 17 (0.5%) |
| 1 Vehicle | 282 (8.3%) | 697 (19.6%) |
| 2 Vehicles | 1,243 (36.4%) | 1,121 (31.5%) |
| 3 Vehicles | 796 (23.3%) | 773 (21.7%) |
| 4 Vehicles | 740 (21.7%) | 591 (16.6%) |
| 5 or more Vehicles | 305 (8.9%) | 362 (10.2%) |
| Total | 3,415 (100.0%) | 3,561 (100.0%) |
Commute Time in Bensville
The most frequently occuring commute durations in Bensville are 60 to 89 minutes (1,456 commuters, 22.9%), 45 to 59 minutes (871 commuters, 13.7%), and 90 or more minutes (845 commuters, 13.3%).
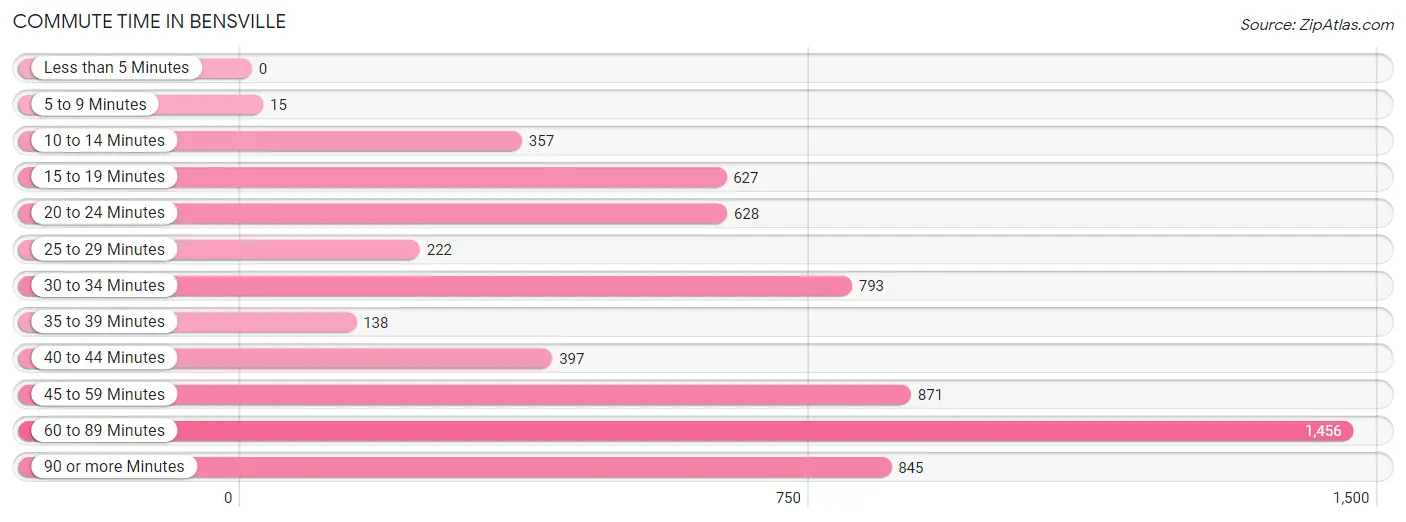
| Commute Time | # Commuters | % Commuters |
| Less than 5 Minutes | 0 | 0.0% |
| 5 to 9 Minutes | 15 | 0.2% |
| 10 to 14 Minutes | 357 | 5.6% |
| 15 to 19 Minutes | 627 | 9.9% |
| 20 to 24 Minutes | 628 | 9.9% |
| 25 to 29 Minutes | 222 | 3.5% |
| 30 to 34 Minutes | 793 | 12.5% |
| 35 to 39 Minutes | 138 | 2.2% |
| 40 to 44 Minutes | 397 | 6.2% |
| 45 to 59 Minutes | 871 | 13.7% |
| 60 to 89 Minutes | 1,456 | 22.9% |
| 90 or more Minutes | 845 | 13.3% |
Commute Time by Sex in Bensville
The most common commute times in Bensville are 60 to 89 minutes (860 commuters, 26.2%) for males and 60 to 89 minutes (596 commuters, 19.4%) for females.
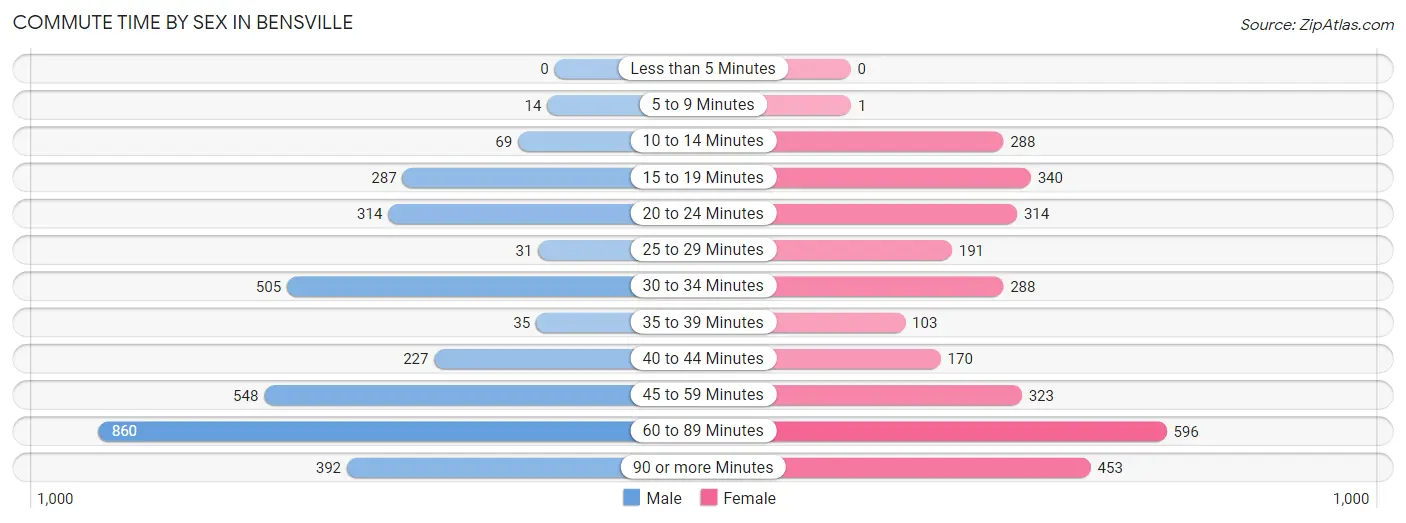
| Commute Time | Male | Female |
| Less than 5 Minutes | 0 (0.0%) | 0 (0.0%) |
| 5 to 9 Minutes | 14 (0.4%) | 1 (0.0%) |
| 10 to 14 Minutes | 69 (2.1%) | 288 (9.4%) |
| 15 to 19 Minutes | 287 (8.7%) | 340 (11.1%) |
| 20 to 24 Minutes | 314 (9.6%) | 314 (10.2%) |
| 25 to 29 Minutes | 31 (0.9%) | 191 (6.2%) |
| 30 to 34 Minutes | 505 (15.4%) | 288 (9.4%) |
| 35 to 39 Minutes | 35 (1.1%) | 103 (3.4%) |
| 40 to 44 Minutes | 227 (6.9%) | 170 (5.5%) |
| 45 to 59 Minutes | 548 (16.7%) | 323 (10.5%) |
| 60 to 89 Minutes | 860 (26.2%) | 596 (19.4%) |
| 90 or more Minutes | 392 (11.9%) | 453 (14.8%) |
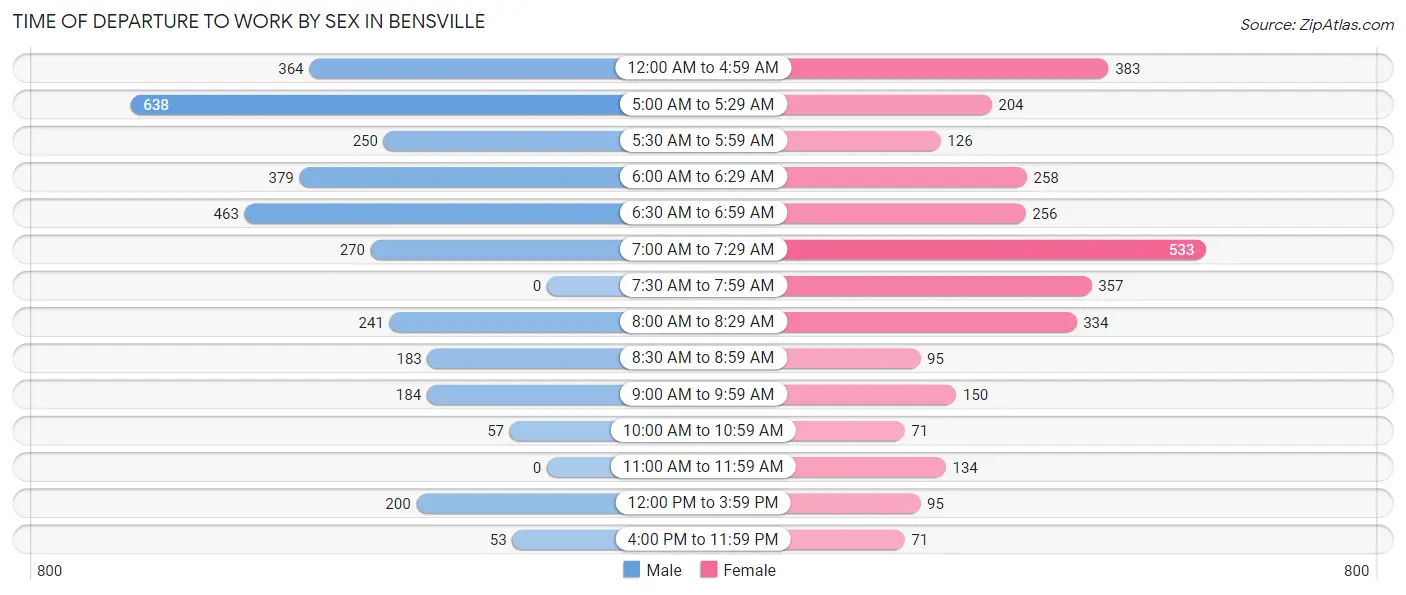
Time of Departure to Work by Sex in Bensville
The most frequent times of departure to work in Bensville are 5:00 AM to 5:29 AM (638, 19.4%) for males and 7:00 AM to 7:29 AM (533, 17.4%) for females.
| Time of Departure | Male | Female |
| 12:00 AM to 4:59 AM | 364 (11.1%) | 383 (12.5%) |
| 5:00 AM to 5:29 AM | 638 (19.4%) | 204 (6.7%) |
| 5:30 AM to 5:59 AM | 250 (7.6%) | 126 (4.1%) |
| 6:00 AM to 6:29 AM | 379 (11.6%) | 258 (8.4%) |
| 6:30 AM to 6:59 AM | 463 (14.1%) | 256 (8.4%) |
| 7:00 AM to 7:29 AM | 270 (8.2%) | 533 (17.4%) |
| 7:30 AM to 7:59 AM | 0 (0.0%) | 357 (11.6%) |
| 8:00 AM to 8:29 AM | 241 (7.3%) | 334 (10.9%) |
| 8:30 AM to 8:59 AM | 183 (5.6%) | 95 (3.1%) |
| 9:00 AM to 9:59 AM | 184 (5.6%) | 150 (4.9%) |
| 10:00 AM to 10:59 AM | 57 (1.7%) | 71 (2.3%) |
| 11:00 AM to 11:59 AM | 0 (0.0%) | 134 (4.4%) |
| 12:00 PM to 3:59 PM | 200 (6.1%) | 95 (3.1%) |
| 4:00 PM to 11:59 PM | 53 (1.6%) | 71 (2.3%) |
| Total | 3,282 (100.0%) | 3,067 (100.0%) |
Housing Occupancy in Bensville
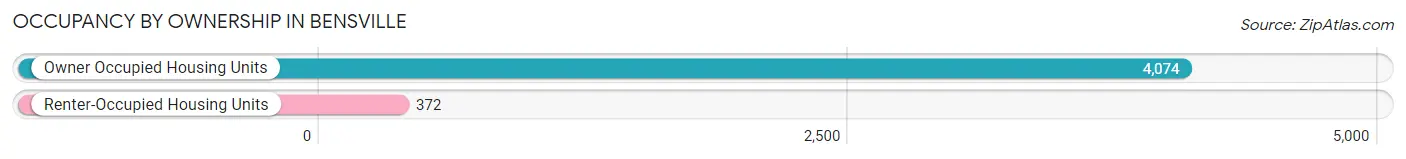
Occupancy by Ownership in Bensville
Of the total 4,446 dwellings in Bensville, owner-occupied units account for 4,074 (91.6%), while renter-occupied units make up 372 (8.4%).
| Occupancy | # Housing Units | % Housing Units |
| Owner Occupied Housing Units | 4,074 | 91.6% |
| Renter-Occupied Housing Units | 372 | 8.4% |
| Total Occupied Housing Units | 4,446 | 100.0% |
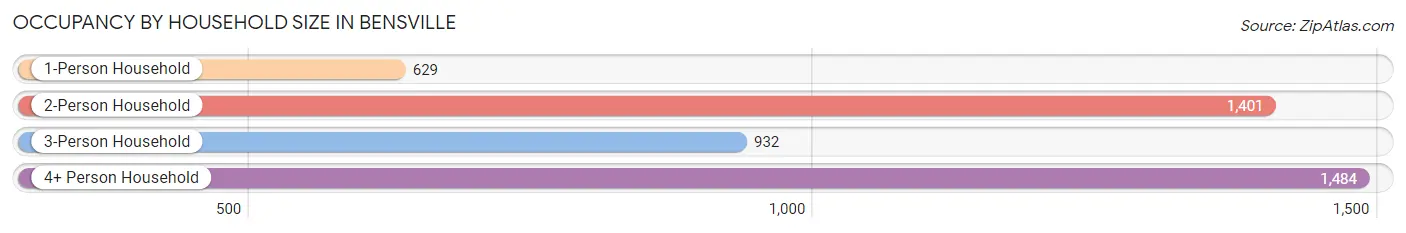
Occupancy by Household Size in Bensville
| Household Size | # Housing Units | % Housing Units |
| 1-Person Household | 629 | 14.1% |
| 2-Person Household | 1,401 | 31.5% |
| 3-Person Household | 932 | 21.0% |
| 4+ Person Household | 1,484 | 33.4% |
| Total Housing Units | 4,446 | 100.0% |
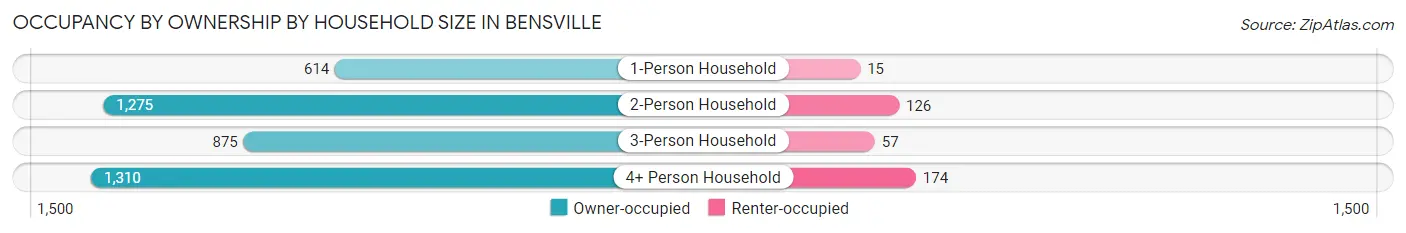
Occupancy by Ownership by Household Size in Bensville
| Household Size | Owner-occupied | Renter-occupied |
| 1-Person Household | 614 (97.6%) | 15 (2.4%) |
| 2-Person Household | 1,275 (91.0%) | 126 (9.0%) |
| 3-Person Household | 875 (93.9%) | 57 (6.1%) |
| 4+ Person Household | 1,310 (88.3%) | 174 (11.7%) |
| Total Housing Units | 4,074 (91.6%) | 372 (8.4%) |
Occupancy by Educational Attainment in Bensville
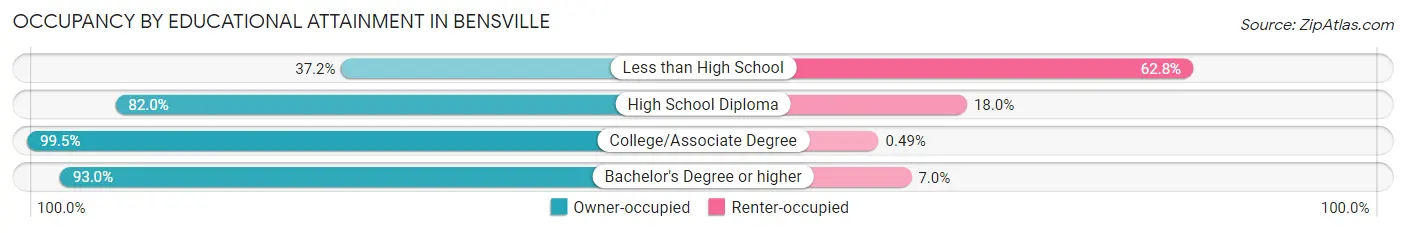
| Household Size | Owner-occupied | Renter-occupied |
| Less than High School | 48 (37.2%) | 81 (62.8%) |
| High School Diploma | 701 (82.0%) | 154 (18.0%) |
| College/Associate Degree | 1,611 (99.5%) | 8 (0.5%) |
| Bachelor's Degree or higher | 1,714 (93.0%) | 129 (7.0%) |
Occupancy by Age of Householder in Bensville
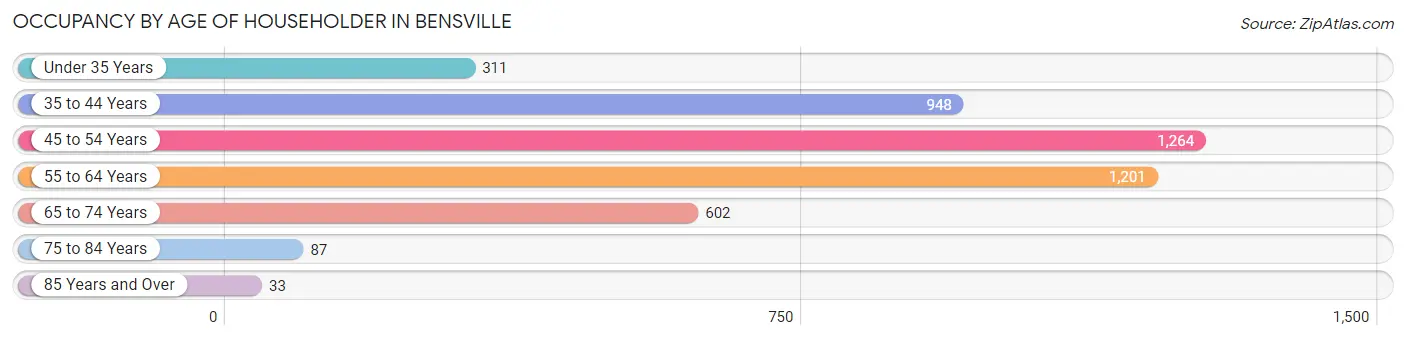
| Age Bracket | # Households | % Households |
| Under 35 Years | 311 | 7.0% |
| 35 to 44 Years | 948 | 21.3% |
| 45 to 54 Years | 1,264 | 28.4% |
| 55 to 64 Years | 1,201 | 27.0% |
| 65 to 74 Years | 602 | 13.5% |
| 75 to 84 Years | 87 | 2.0% |
| 85 Years and Over | 33 | 0.7% |
| Total | 4,446 | 100.0% |
Housing Finances in Bensville
Median Income by Occupancy in Bensville
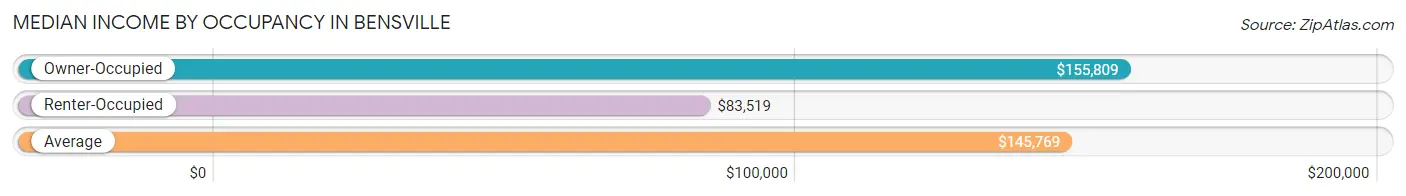
| Occupancy Type | # Households | Median Income |
| Owner-Occupied | 4,074 (91.6%) | $155,809 |
| Renter-Occupied | 372 (8.4%) | $83,519 |
| Average | 4,446 (100.0%) | $145,769 |
Occupancy by Householder Income Bracket in Bensville
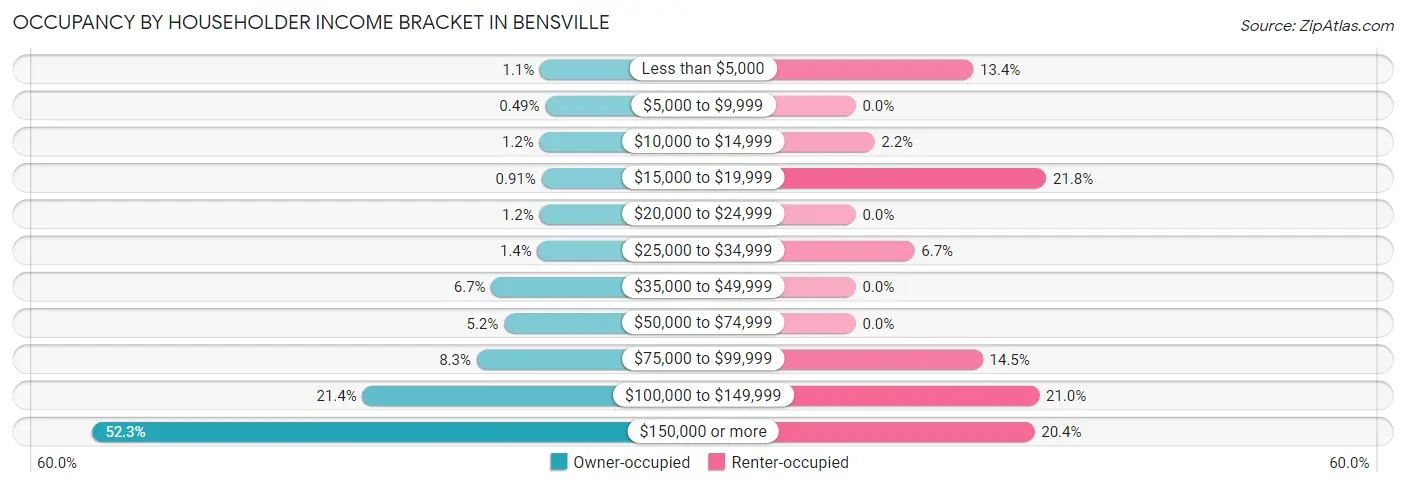
| Income Bracket | Owner-occupied | Renter-occupied |
| Less than $5,000 | 45 (1.1%) | 50 (13.4%) |
| $5,000 to $9,999 | 20 (0.5%) | 0 (0.0%) |
| $10,000 to $14,999 | 47 (1.1%) | 8 (2.1%) |
| $15,000 to $19,999 | 37 (0.9%) | 81 (21.8%) |
| $20,000 to $24,999 | 47 (1.1%) | 0 (0.0%) |
| $25,000 to $34,999 | 56 (1.4%) | 25 (6.7%) |
| $35,000 to $49,999 | 271 (6.7%) | 0 (0.0%) |
| $50,000 to $74,999 | 212 (5.2%) | 0 (0.0%) |
| $75,000 to $99,999 | 339 (8.3%) | 54 (14.5%) |
| $100,000 to $149,999 | 871 (21.4%) | 78 (21.0%) |
| $150,000 or more | 2,129 (52.3%) | 76 (20.4%) |
| Total | 4,074 (100.0%) | 372 (100.0%) |
Monthly Housing Cost Tiers in Bensville
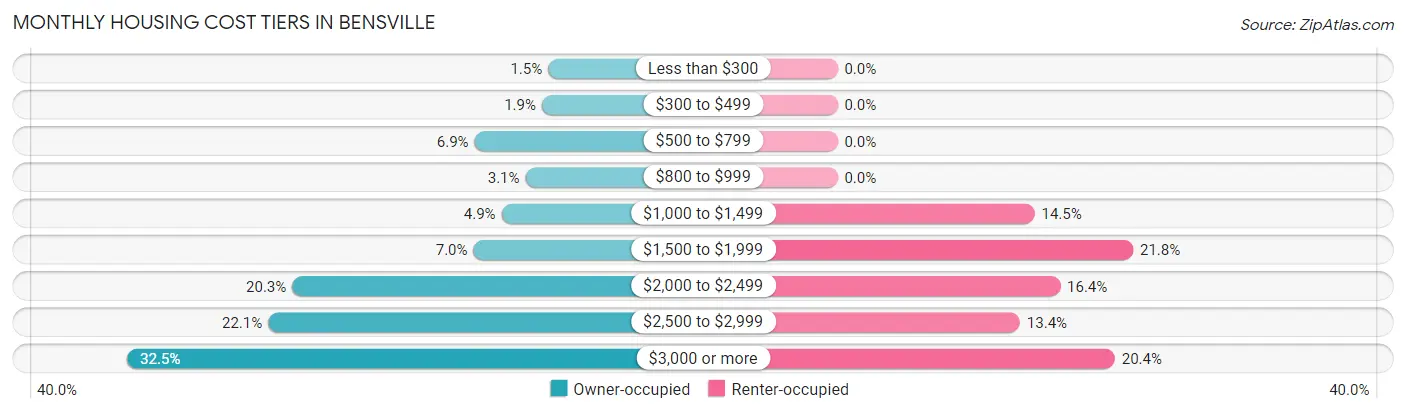
| Monthly Cost | Owner-occupied | Renter-occupied |
| Less than $300 | 59 (1.5%) | 0 (0.0%) |
| $300 to $499 | 78 (1.9%) | 0 (0.0%) |
| $500 to $799 | 280 (6.9%) | 0 (0.0%) |
| $800 to $999 | 127 (3.1%) | 0 (0.0%) |
| $1,000 to $1,499 | 199 (4.9%) | 54 (14.5%) |
| $1,500 to $1,999 | 283 (7.0%) | 81 (21.8%) |
| $2,000 to $2,499 | 827 (20.3%) | 61 (16.4%) |
| $2,500 to $2,999 | 899 (22.1%) | 50 (13.4%) |
| $3,000 or more | 1,322 (32.5%) | 76 (20.4%) |
| Total | 4,074 (100.0%) | 372 (100.0%) |
Physical Housing Characteristics in Bensville
Housing Structures in Bensville
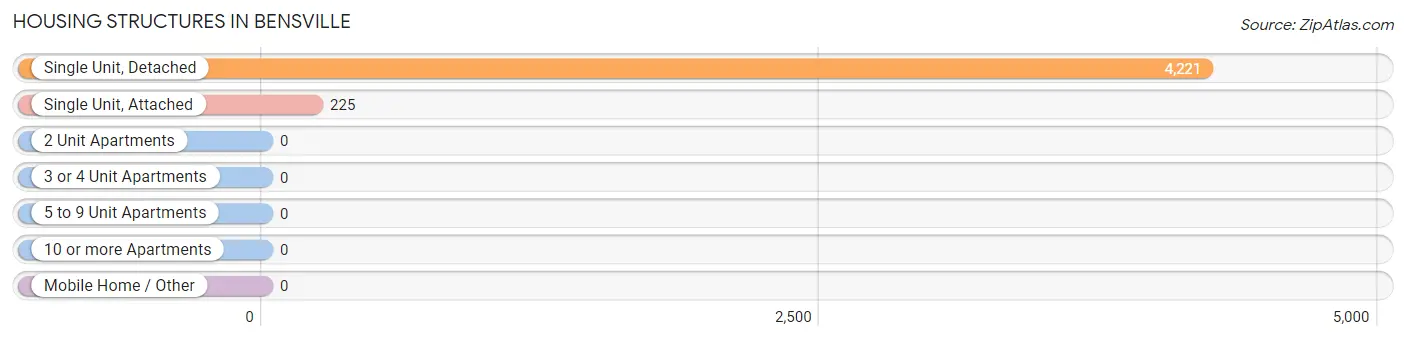
| Structure Type | # Housing Units | % Housing Units |
| Single Unit, Detached | 4,221 | 94.9% |
| Single Unit, Attached | 225 | 5.1% |
| 2 Unit Apartments | 0 | 0.0% |
| 3 or 4 Unit Apartments | 0 | 0.0% |
| 5 to 9 Unit Apartments | 0 | 0.0% |
| 10 or more Apartments | 0 | 0.0% |
| Mobile Home / Other | 0 | 0.0% |
| Total | 4,446 | 100.0% |
Housing Structures by Occupancy in Bensville
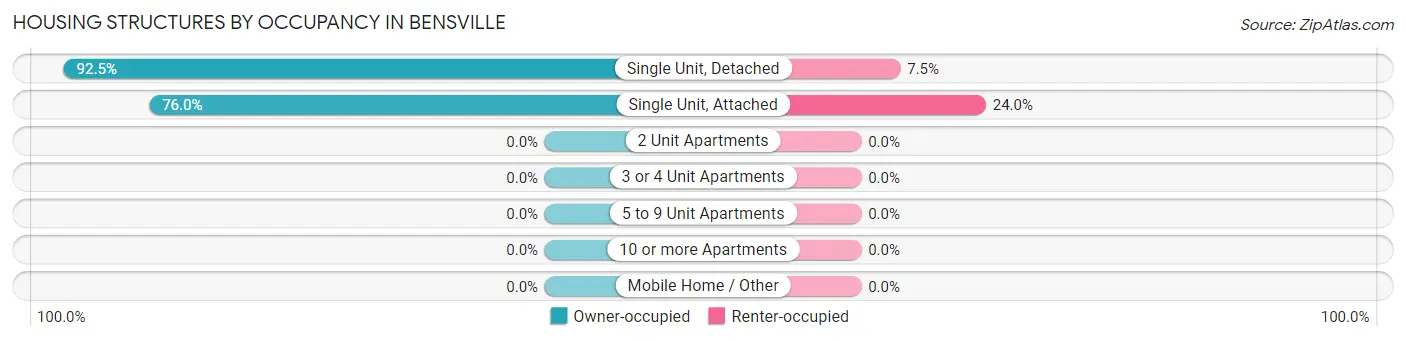
| Structure Type | Owner-occupied | Renter-occupied |
| Single Unit, Detached | 3,903 (92.5%) | 318 (7.5%) |
| Single Unit, Attached | 171 (76.0%) | 54 (24.0%) |
| 2 Unit Apartments | 0 (0.0%) | 0 (0.0%) |
| 3 or 4 Unit Apartments | 0 (0.0%) | 0 (0.0%) |
| 5 to 9 Unit Apartments | 0 (0.0%) | 0 (0.0%) |
| 10 or more Apartments | 0 (0.0%) | 0 (0.0%) |
| Mobile Home / Other | 0 (0.0%) | 0 (0.0%) |
| Total | 4,074 (91.6%) | 372 (8.4%) |
Housing Structures by Number of Rooms in Bensville
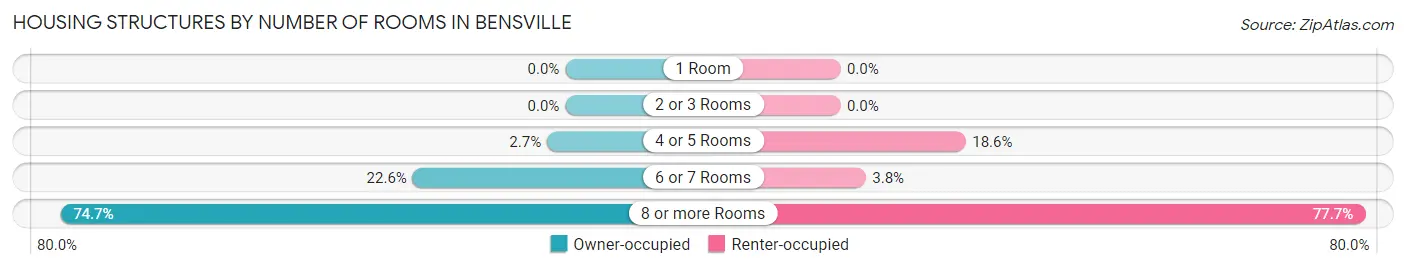
| Number of Rooms | Owner-occupied | Renter-occupied |
| 1 Room | 0 (0.0%) | 0 (0.0%) |
| 2 or 3 Rooms | 0 (0.0%) | 0 (0.0%) |
| 4 or 5 Rooms | 110 (2.7%) | 69 (18.5%) |
| 6 or 7 Rooms | 920 (22.6%) | 14 (3.8%) |
| 8 or more Rooms | 3,044 (74.7%) | 289 (77.7%) |
| Total | 4,074 (100.0%) | 372 (100.0%) |
Housing Structure by Heating Type in Bensville

| Heating Type | Owner-occupied | Renter-occupied |
| Utility Gas | 2,155 (52.9%) | 113 (30.4%) |
| Bottled, Tank, or LP Gas | 96 (2.4%) | 0 (0.0%) |
| Electricity | 1,415 (34.7%) | 124 (33.3%) |
| Fuel Oil or Kerosene | 302 (7.4%) | 135 (36.3%) |
| Coal or Coke | 0 (0.0%) | 0 (0.0%) |
| All other Fuels | 106 (2.6%) | 0 (0.0%) |
| No Fuel Used | 0 (0.0%) | 0 (0.0%) |
| Total | 4,074 (100.0%) | 372 (100.0%) |
Household Vehicle Usage in Bensville
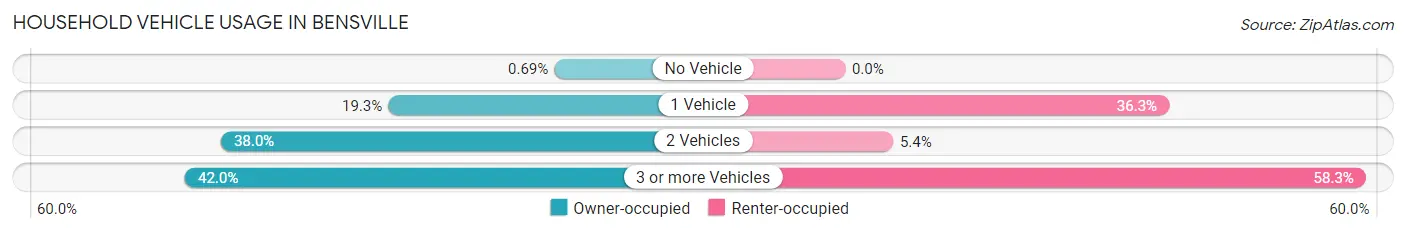
| Vehicles per Household | Owner-occupied | Renter-occupied |
| No Vehicle | 28 (0.7%) | 0 (0.0%) |
| 1 Vehicle | 786 (19.3%) | 135 (36.3%) |
| 2 Vehicles | 1,548 (38.0%) | 20 (5.4%) |
| 3 or more Vehicles | 1,712 (42.0%) | 217 (58.3%) |
| Total | 4,074 (100.0%) | 372 (100.0%) |
Real Estate & Mortgages in Bensville
Real Estate and Mortgage Overview in Bensville
| Characteristic | Without Mortgage | With Mortgage |
| Housing Units | 578 | 3,496 |
| Median Property Value | $429,400 | $442,200 |
| Median Household Income | $161,063 | $1,823 |
| Monthly Housing Costs | $711 | $1,322 |
| Real Estate Taxes | $4,468 | $140 |
Property Value by Mortgage Status in Bensville
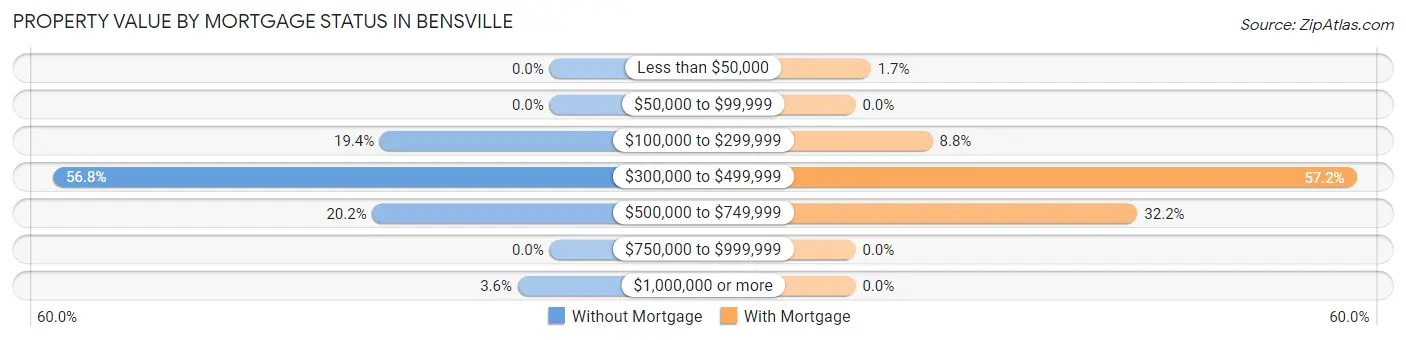
| Property Value | Without Mortgage | With Mortgage |
| Less than $50,000 | 0 (0.0%) | 61 (1.7%) |
| $50,000 to $99,999 | 0 (0.0%) | 0 (0.0%) |
| $100,000 to $299,999 | 112 (19.4%) | 308 (8.8%) |
| $300,000 to $499,999 | 328 (56.8%) | 2,001 (57.2%) |
| $500,000 to $749,999 | 117 (20.2%) | 1,126 (32.2%) |
| $750,000 to $999,999 | 0 (0.0%) | 0 (0.0%) |
| $1,000,000 or more | 21 (3.6%) | 0 (0.0%) |
| Total | 578 (100.0%) | 3,496 (100.0%) |
Household Income by Mortgage Status in Bensville
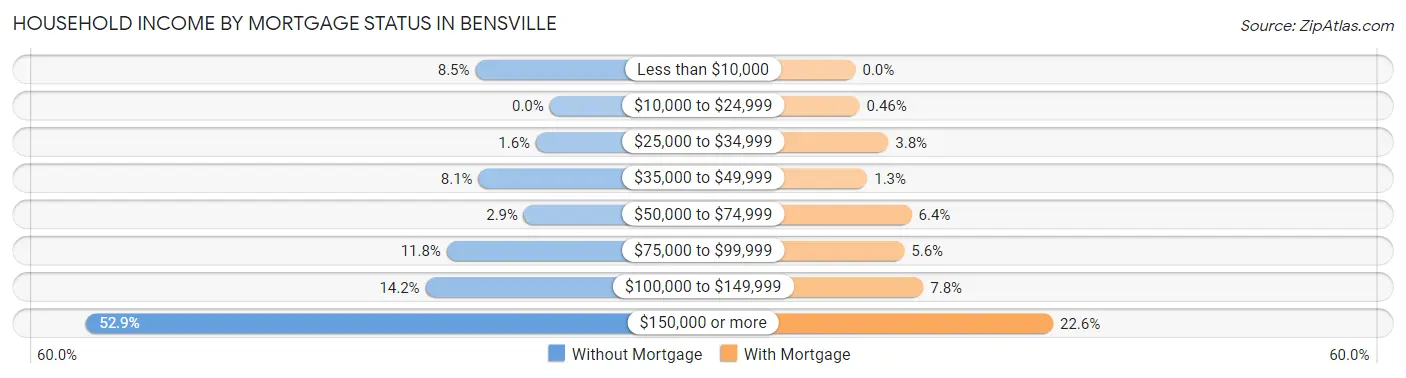
| Household Income | Without Mortgage | With Mortgage |
| Less than $10,000 | 49 (8.5%) | 0 (0.0%) |
| $10,000 to $24,999 | 0 (0.0%) | 16 (0.5%) |
| $25,000 to $34,999 | 9 (1.6%) | 131 (3.7%) |
| $35,000 to $49,999 | 47 (8.1%) | 47 (1.3%) |
| $50,000 to $74,999 | 17 (2.9%) | 224 (6.4%) |
| $75,000 to $99,999 | 68 (11.8%) | 195 (5.6%) |
| $100,000 to $149,999 | 82 (14.2%) | 271 (7.7%) |
| $150,000 or more | 306 (52.9%) | 789 (22.6%) |
| Total | 578 (100.0%) | 3,496 (100.0%) |
Property Value to Household Income Ratio in Bensville
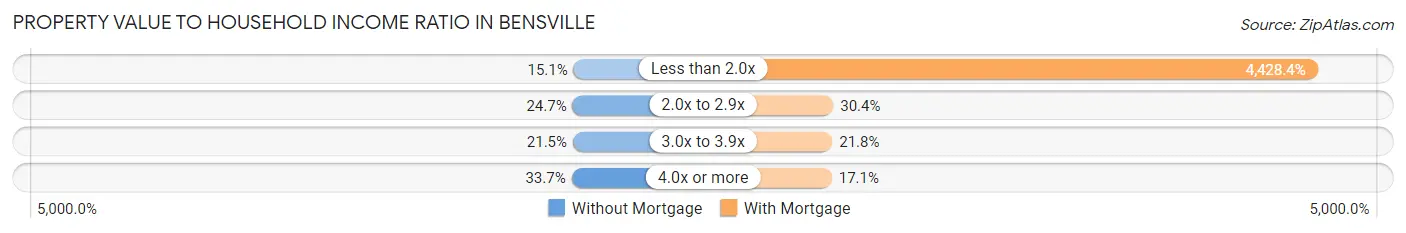
| Value-to-Income Ratio | Without Mortgage | With Mortgage |
| Less than 2.0x | 87 (15.0%) | 154,815 (4,428.3%) |
| 2.0x to 2.9x | 143 (24.7%) | 1,061 (30.3%) |
| 3.0x to 3.9x | 124 (21.4%) | 763 (21.8%) |
| 4.0x or more | 195 (33.7%) | 596 (17.1%) |
| Total | 578 (100.0%) | 3,496 (100.0%) |
Real Estate Taxes by Mortgage Status in Bensville
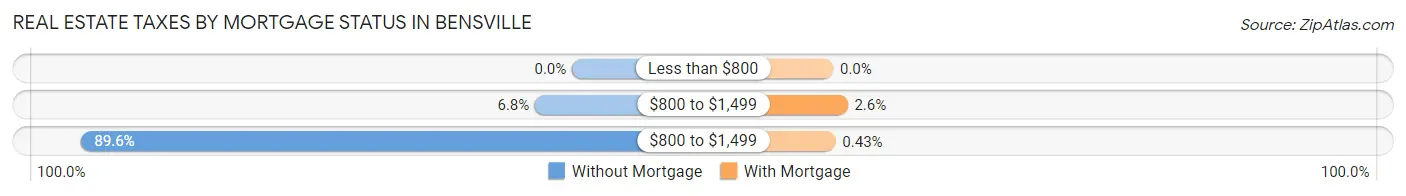
| Property Taxes | Without Mortgage | With Mortgage |
| Less than $800 | 0 (0.0%) | 0 (0.0%) |
| $800 to $1,499 | 39 (6.8%) | 92 (2.6%) |
| $800 to $1,499 | 518 (89.6%) | 15 (0.4%) |
| Total | 578 (100.0%) | 3,496 (100.0%) |
Health & Disability in Bensville
Health Insurance Coverage by Age in Bensville
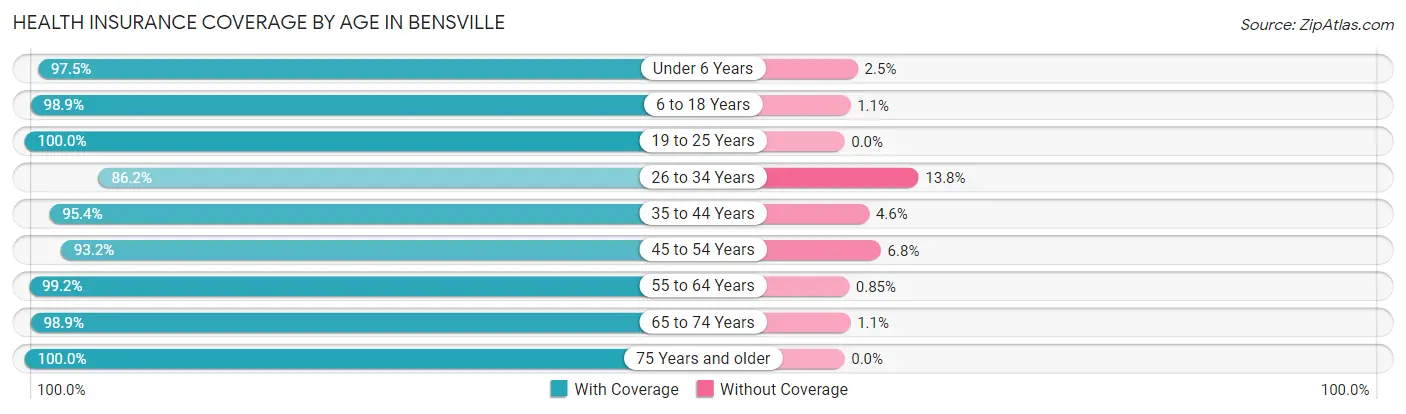
| Age Bracket | With Coverage | Without Coverage |
| Under 6 Years | 860 (97.5%) | 22 (2.5%) |
| 6 to 18 Years | 2,933 (98.9%) | 33 (1.1%) |
| 19 to 25 Years | 1,164 (100.0%) | 0 (0.0%) |
| 26 to 34 Years | 1,061 (86.2%) | 170 (13.8%) |
| 35 to 44 Years | 1,638 (95.4%) | 79 (4.6%) |
| 45 to 54 Years | 2,160 (93.2%) | 157 (6.8%) |
| 55 to 64 Years | 2,323 (99.2%) | 20 (0.9%) |
| 65 to 74 Years | 1,168 (98.9%) | 13 (1.1%) |
| 75 Years and older | 304 (100.0%) | 0 (0.0%) |
| Total | 13,611 (96.5%) | 494 (3.5%) |
Health Insurance Coverage by Citizenship Status in Bensville
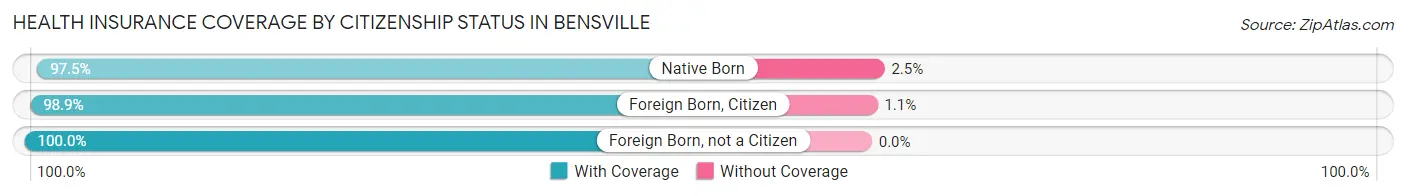
| Citizenship Status | With Coverage | Without Coverage |
| Native Born | 860 (97.5%) | 22 (2.5%) |
| Foreign Born, Citizen | 2,933 (98.9%) | 33 (1.1%) |
| Foreign Born, not a Citizen | 1,164 (100.0%) | 0 (0.0%) |
Health Insurance Coverage by Household Income in Bensville
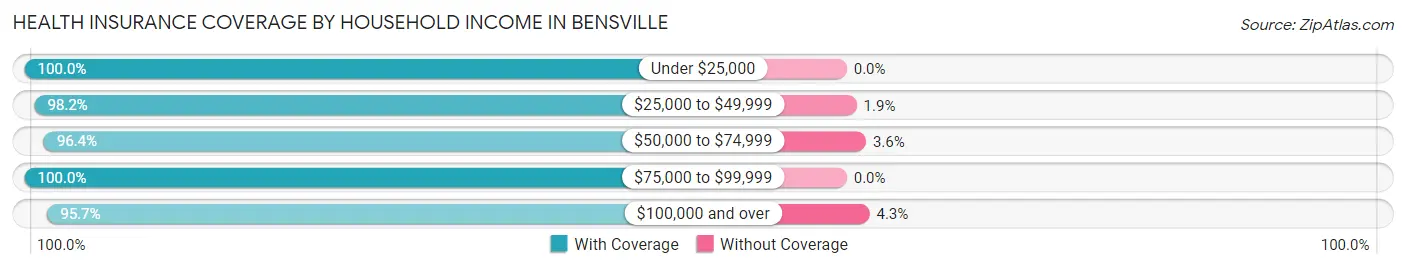
| Household Income | With Coverage | Without Coverage |
| Under $25,000 | 1,160 (100.0%) | 0 (0.0%) |
| $25,000 to $49,999 | 797 (98.2%) | 15 (1.8%) |
| $50,000 to $74,999 | 589 (96.4%) | 22 (3.6%) |
| $75,000 to $99,999 | 799 (100.0%) | 0 (0.0%) |
| $100,000 and over | 10,260 (95.7%) | 457 (4.3%) |
Public vs Private Health Insurance Coverage by Age in Bensville
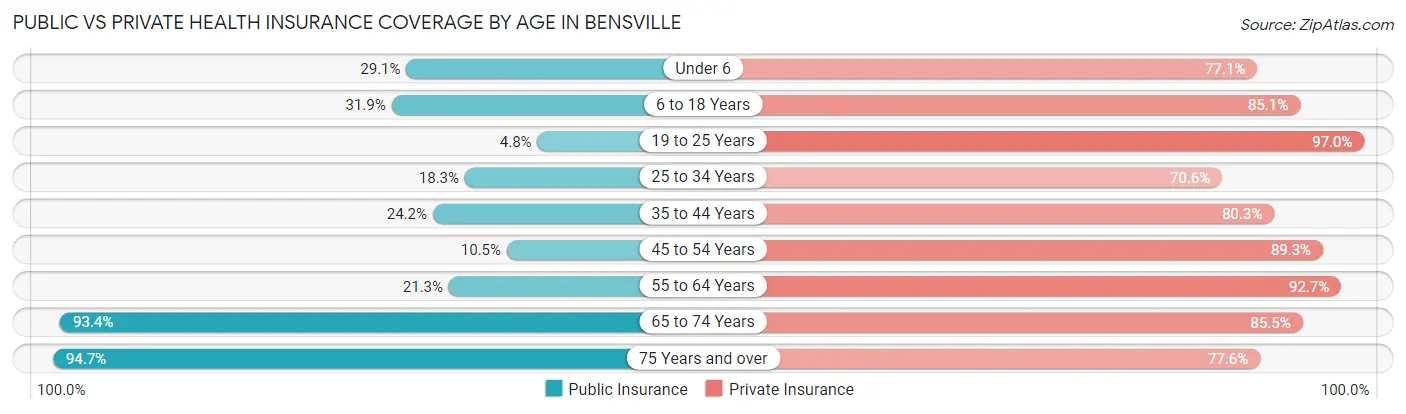
| Age Bracket | Public Insurance | Private Insurance |
| Under 6 | 257 (29.1%) | 680 (77.1%) |
| 6 to 18 Years | 946 (31.9%) | 2,523 (85.1%) |
| 19 to 25 Years | 56 (4.8%) | 1,129 (97.0%) |
| 25 to 34 Years | 225 (18.3%) | 869 (70.6%) |
| 35 to 44 Years | 416 (24.2%) | 1,378 (80.3%) |
| 45 to 54 Years | 243 (10.5%) | 2,069 (89.3%) |
| 55 to 64 Years | 498 (21.2%) | 2,171 (92.7%) |
| 65 to 74 Years | 1,103 (93.4%) | 1,010 (85.5%) |
| 75 Years and over | 288 (94.7%) | 236 (77.6%) |
| Total | 4,032 (28.6%) | 12,065 (85.5%) |
Disability Status by Sex by Age in Bensville
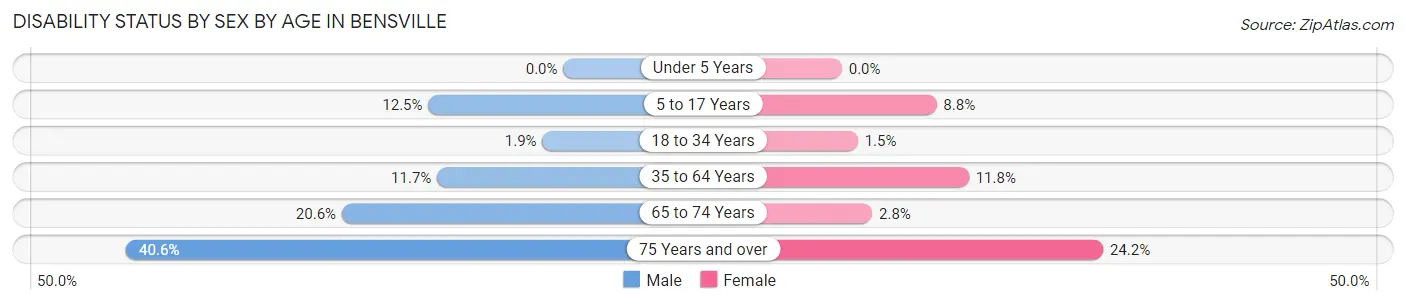
| Age Bracket | Male | Female |
| Under 5 Years | 0 (0.0%) | 0 (0.0%) |
| 5 to 17 Years | 206 (12.5%) | 94 (8.8%) |
| 18 to 34 Years | 26 (1.9%) | 21 (1.5%) |
| 35 to 64 Years | 355 (11.7%) | 394 (11.8%) |
| 65 to 74 Years | 104 (20.5%) | 19 (2.8%) |
| 75 Years and over | 43 (40.6%) | 48 (24.2%) |
Disability Class by Sex by Age in Bensville
Disability Class: Hearing Difficulty
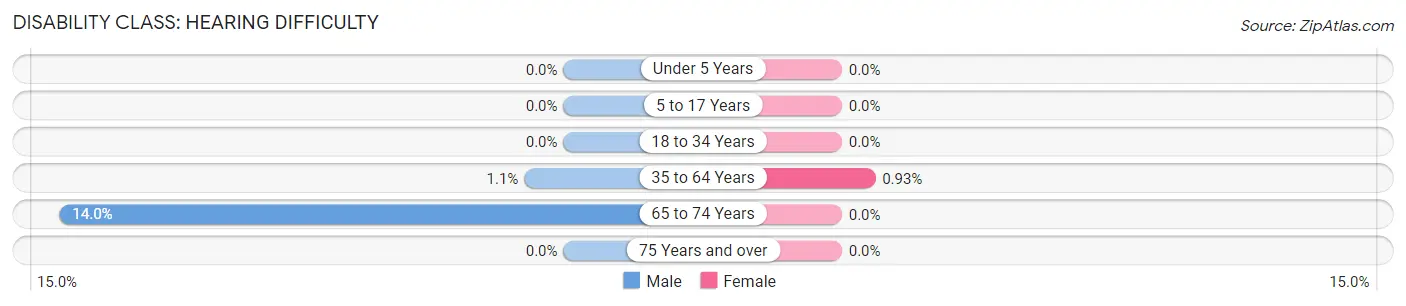
| Age Bracket | Male | Female |
| Under 5 Years | 0 (0.0%) | 0 (0.0%) |
| 5 to 17 Years | 0 (0.0%) | 0 (0.0%) |
| 18 to 34 Years | 0 (0.0%) | 0 (0.0%) |
| 35 to 64 Years | 33 (1.1%) | 31 (0.9%) |
| 65 to 74 Years | 71 (14.0%) | 0 (0.0%) |
| 75 Years and over | 0 (0.0%) | 0 (0.0%) |
Disability Class: Vision Difficulty
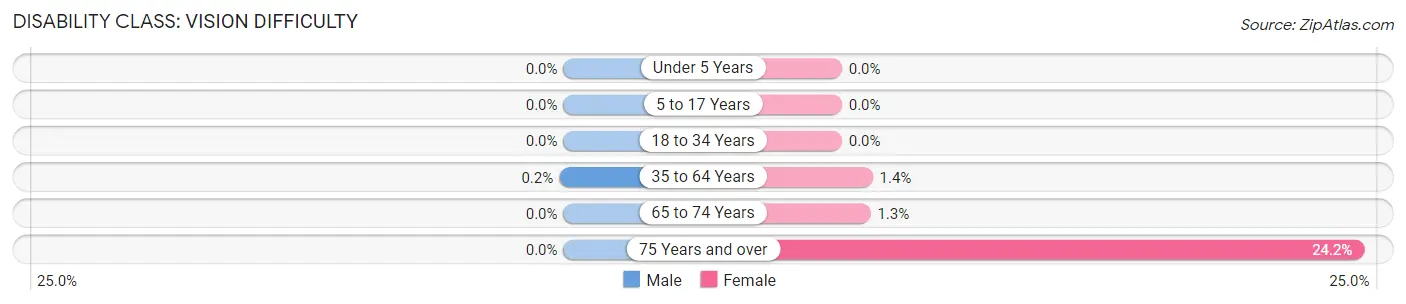
| Age Bracket | Male | Female |
| Under 5 Years | 0 (0.0%) | 0 (0.0%) |
| 5 to 17 Years | 0 (0.0%) | 0 (0.0%) |
| 18 to 34 Years | 0 (0.0%) | 0 (0.0%) |
| 35 to 64 Years | 6 (0.2%) | 48 (1.4%) |
| 65 to 74 Years | 0 (0.0%) | 9 (1.3%) |
| 75 Years and over | 0 (0.0%) | 48 (24.2%) |
Disability Class: Cognitive Difficulty
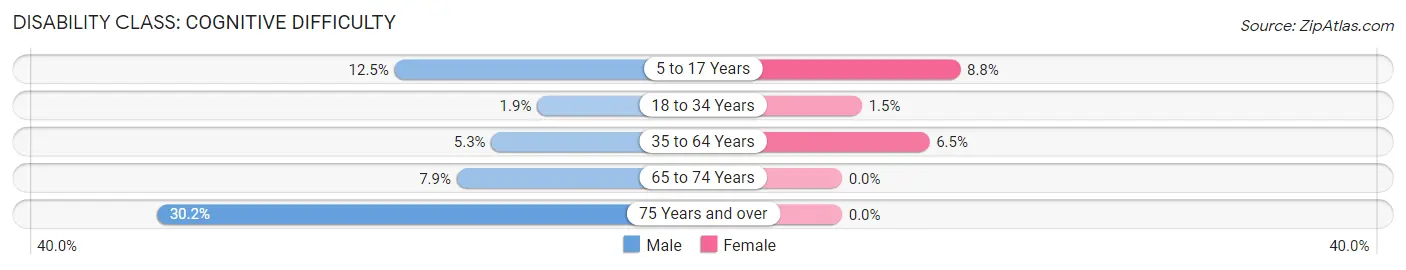
| Age Bracket | Male | Female |
| 5 to 17 Years | 206 (12.5%) | 94 (8.8%) |
| 18 to 34 Years | 26 (1.9%) | 21 (1.5%) |
| 35 to 64 Years | 162 (5.3%) | 217 (6.5%) |
| 65 to 74 Years | 40 (7.9%) | 0 (0.0%) |
| 75 Years and over | 32 (30.2%) | 0 (0.0%) |
Disability Class: Ambulatory Difficulty
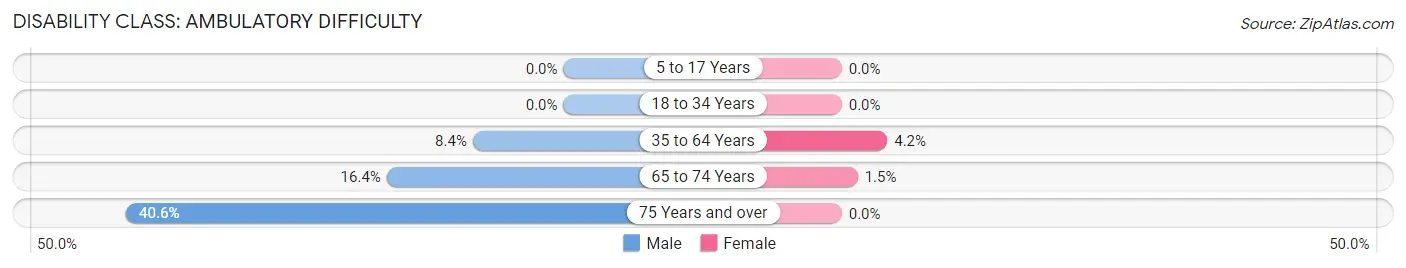
| Age Bracket | Male | Female |
| 5 to 17 Years | 0 (0.0%) | 0 (0.0%) |
| 18 to 34 Years | 0 (0.0%) | 0 (0.0%) |
| 35 to 64 Years | 255 (8.4%) | 141 (4.2%) |
| 65 to 74 Years | 83 (16.4%) | 10 (1.5%) |
| 75 Years and over | 43 (40.6%) | 0 (0.0%) |
Disability Class: Self-Care Difficulty
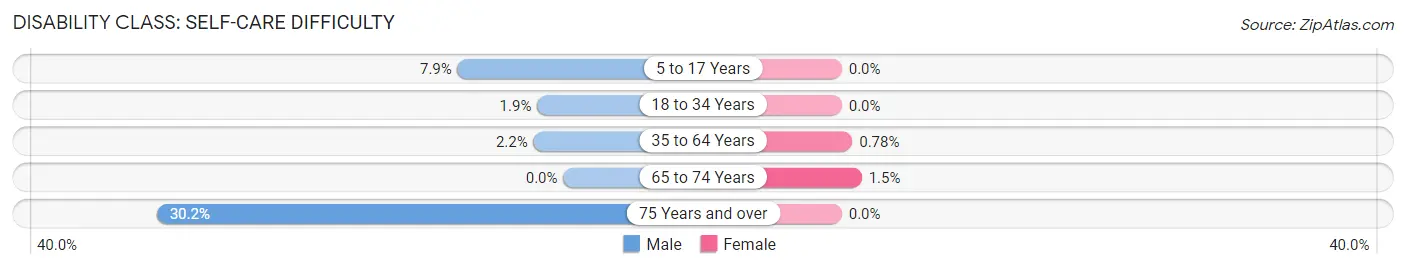
| Age Bracket | Male | Female |
| 5 to 17 Years | 129 (7.9%) | 0 (0.0%) |
| 18 to 34 Years | 26 (1.9%) | 0 (0.0%) |
| 35 to 64 Years | 67 (2.2%) | 26 (0.8%) |
| 65 to 74 Years | 0 (0.0%) | 10 (1.5%) |
| 75 Years and over | 32 (30.2%) | 0 (0.0%) |
Technology Access in Bensville
Computing Device Access in Bensville
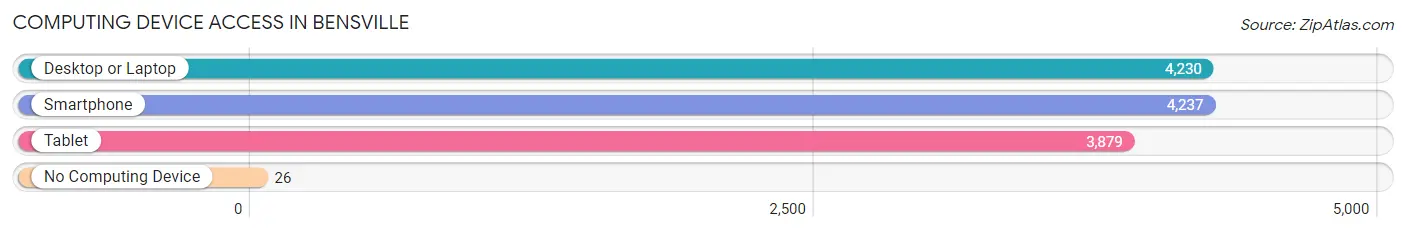
| Device Type | # Households | % Households |
| Desktop or Laptop | 4,230 | 95.1% |
| Smartphone | 4,237 | 95.3% |
| Tablet | 3,879 | 87.3% |
| No Computing Device | 26 | 0.6% |
| Total | 4,446 | 100.0% |
Internet Access in Bensville
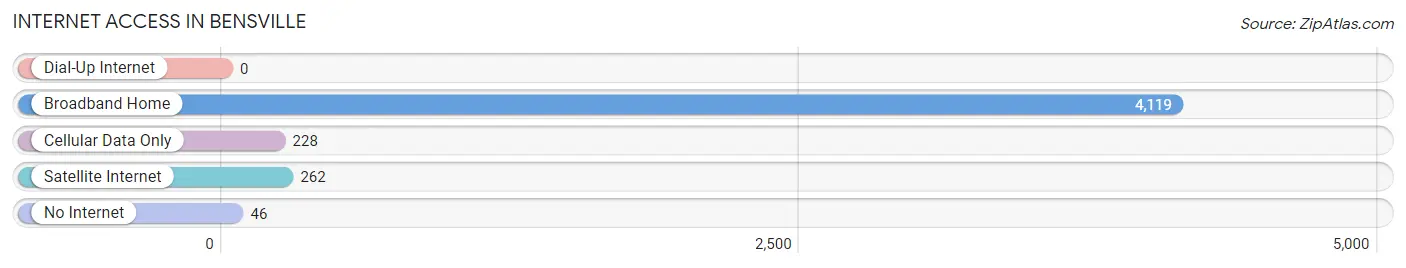
| Internet Type | # Households | % Households |
| Dial-Up Internet | 0 | 0.0% |
| Broadband Home | 4,119 | 92.6% |
| Cellular Data Only | 228 | 5.1% |
| Satellite Internet | 262 | 5.9% |
| No Internet | 46 | 1.0% |
| Total | 4,446 | 100.0% |
Bensville Summary
Bensville, Maryland is a small town located in Charles County, Maryland. It is situated on the banks of the Potomac River, approximately 25 miles south of Washington, D.C. The town has a population of approximately 1,500 people and is part of the Washington Metropolitan Area.
History
Bensville was founded in 1790 by William Ben, a Quaker from Pennsylvania. Ben purchased the land from the local Native Americans and established a small trading post. The town was named after him and grew slowly over the years. In 1820, the town was incorporated and the first post office was established.
In the mid-1800s, Bensville became a popular destination for wealthy Washingtonians looking to escape the hustle and bustle of the city. The town was known for its beautiful scenery and peaceful atmosphere.
In the late 1800s, the town began to experience a period of growth and development. The railroad was extended to Bensville in 1887, and the town became a popular stop for travelers. The town also became a popular destination for summer vacationers.
In the early 1900s, Bensville experienced a period of decline. The railroad was discontinued in the 1920s, and the town’s population began to decline. In the 1950s, the town was revitalized with the construction of a new highway and the opening of a new shopping center.
Geography
Bensville is located in Charles County, Maryland. It is situated on the banks of the Potomac River, approximately 25 miles south of Washington, D.C. The town is surrounded by rolling hills and wooded areas. The climate is temperate, with hot summers and mild winters.
Economy
Bensville’s economy is largely based on tourism and agriculture. The town is home to several wineries and vineyards, as well as a number of small businesses. The town also has a thriving arts and culture scene, with several galleries and museums.
Demographics
As of the 2010 census, Bensville had a population of 1,500 people. The racial makeup of the town was 94.7% White, 1.7% African American, 0.7% Native American, 0.7% Asian, 0.3% from other races, and 2.6% from two or more races. Hispanic or Latino of any race were 1.3% of the population.
The median income for a household in Bensville was $50,000, and the median income for a family was $60,000. The per capita income for the town was $25,000. About 8.3% of families and 10.7% of the population were below the poverty line, including 14.3% of those under age 18 and 6.7% of those age 65 or over.
Conclusion
Bensville, Maryland is a small town located in Charles County, Maryland. It is situated on the banks of the Potomac River, approximately 25 miles south of Washington, D.C. The town has a population of approximately 1,500 people and is part of the Washington Metropolitan Area. Bensville has a long and rich history, and its economy is largely based on tourism and agriculture. The town is home to several wineries and vineyards, as well as a number of small businesses. The racial makeup of the town is 94.7% White, 1.7% African American, 0.7% Native American, 0.7% Asian, 0.3% from other races, and 2.6% from two or more races. The median income for a household in Bensville was $50,000, and the median income for a family was $60,000.
Common Questions
What is Per Capita Income in Bensville?
Per Capita income in Bensville is $52,289.
What is the Median Family Income in Bensville?
Median Family Income in Bensville is $154,792.
What is the Median Household income in Bensville?
Median Household Income in Bensville is $145,769.
What is Income or Wage Gap in Bensville?
Income or Wage Gap in Bensville is 24.6%.
Women in Bensville earn 75.4 cents for every dollar earned by a man.
What is Family Income Deficit in Bensville?
Family Income Deficit in Bensville is $13,790.
Families that are below poverty line in Bensville earn $13,790 less on average than the poverty threshold level.
What is Inequality or Gini Index in Bensville?
Inequality or Gini Index in Bensville is 0.36.
What is the Total Population of Bensville?
Total Population of Bensville is 14,202.
What is the Total Male Population of Bensville?
Total Male Population of Bensville is 7,201.
What is the Total Female Population of Bensville?
Total Female Population of Bensville is 7,001.
What is the Ratio of Males per 100 Females in Bensville?
There are 102.86 Males per 100 Females in Bensville.
What is the Ratio of Females per 100 Males in Bensville?
There are 97.22 Females per 100 Males in Bensville.
What is the Median Population Age in Bensville?
Median Population Age in Bensville is 39.5 Years.
What is the Average Family Size in Bensville
Average Family Size in Bensville is 3.5 People.
What is the Average Household Size in Bensville
Average Household Size in Bensville is 3.2 People.
How Large is the Labor Force in Bensville?
There are 7,386 People in the Labor Forcein in Bensville.
What is the Percentage of People in the Labor Force in Bensville?
66.5% of People are in the Labor Force in Bensville.
What is the Unemployment Rate in Bensville?
Unemployment Rate in Bensville is 4.3%.