Charlton, MD Map & Demographics
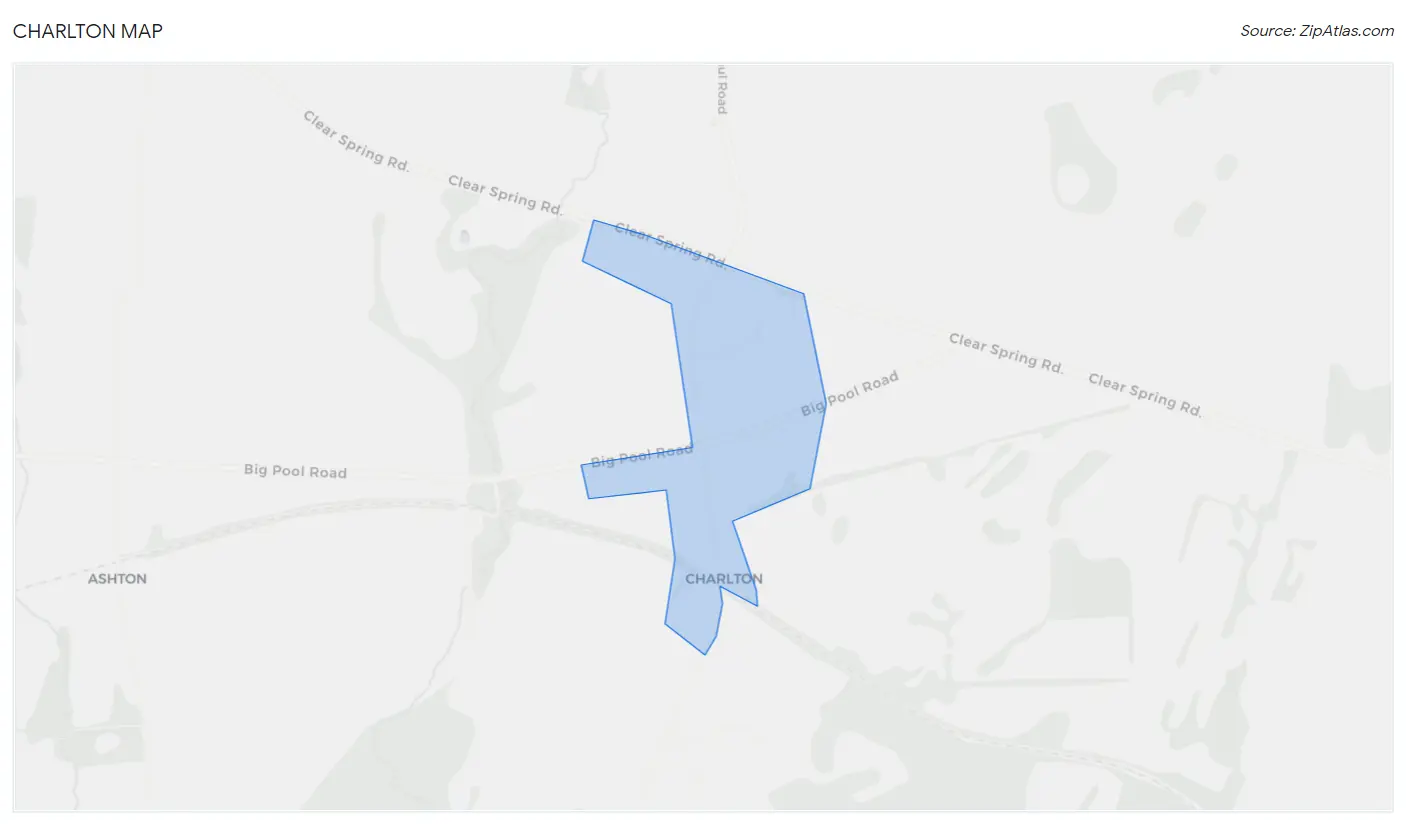
Charlton Map
Charlton Overview
$64,039
PER CAPITA INCOME
$250,001
AVG FAMILY INCOME
$250,001
AVG HOUSEHOLD INCOME
0.23
INEQUALITY / GINI INDEX
323
TOTAL POPULATION
173
MALE POPULATION
150
FEMALE POPULATION
115.33
MALES / 100 FEMALES
86.71
FEMALES / 100 MALES
47.5
MEDIAN AGE
3.3
AVG FAMILY SIZE
3.4
AVG HOUSEHOLD SIZE
217
LABOR FORCE [ PEOPLE ]
67.2%
PERCENT IN LABOR FORCE
Income in Charlton
Income Overview in Charlton
Per Capita Income in Charlton is $64,039, while median incomes of families and households are $250,001 and $250,001 respectively.
| Characteristic | Number | Measure |
| Per Capita Income | 323 | $64,039 |
| Median Family Income | 96 | $250,001 |
| Mean Family Income | 96 | $209,225 |
| Median Household Income | 96 | $250,001 |
| Mean Household Income | 96 | $210,694 |
| Income Deficit | 96 | $0 |
| Wage / Income Gap (%) | 323 | 0.00% |
| Wage / Income Gap ($) | 323 | 100.00¢ per $1 |
| Gini / Inequality Index | 323 | 0.23 |
Earnings by Sex in Charlton
| Sex | Number | Average Earnings |
| Male | 117 (53.9%) | $0 |
| Female | 100 (46.1%) | $0 |
| Total | 217 (100.0%) | $0 |
Earnings by Sex by Income Bracket in Charlton
The most common earnings brackets in Charlton are $100,000+ for men (69 | 59.0%) and $100,000+ for women (56 | 56.0%).
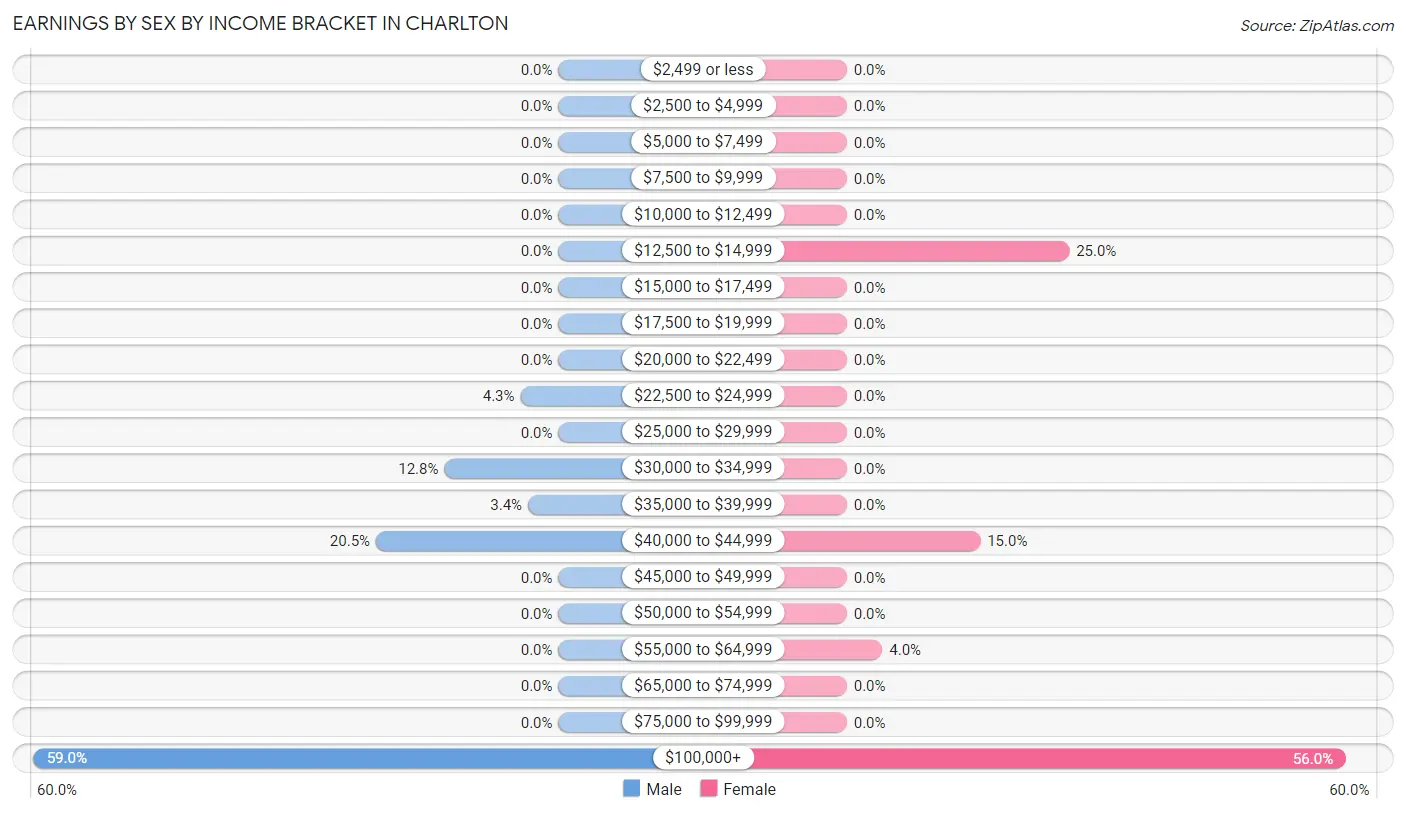
| Income | Male | Female |
| $2,499 or less | 0 (0.0%) | 0 (0.0%) |
| $2,500 to $4,999 | 0 (0.0%) | 0 (0.0%) |
| $5,000 to $7,499 | 0 (0.0%) | 0 (0.0%) |
| $7,500 to $9,999 | 0 (0.0%) | 0 (0.0%) |
| $10,000 to $12,499 | 0 (0.0%) | 0 (0.0%) |
| $12,500 to $14,999 | 0 (0.0%) | 25 (25.0%) |
| $15,000 to $17,499 | 0 (0.0%) | 0 (0.0%) |
| $17,500 to $19,999 | 0 (0.0%) | 0 (0.0%) |
| $20,000 to $22,499 | 0 (0.0%) | 0 (0.0%) |
| $22,500 to $24,999 | 5 (4.3%) | 0 (0.0%) |
| $25,000 to $29,999 | 0 (0.0%) | 0 (0.0%) |
| $30,000 to $34,999 | 15 (12.8%) | 0 (0.0%) |
| $35,000 to $39,999 | 4 (3.4%) | 0 (0.0%) |
| $40,000 to $44,999 | 24 (20.5%) | 15 (15.0%) |
| $45,000 to $49,999 | 0 (0.0%) | 0 (0.0%) |
| $50,000 to $54,999 | 0 (0.0%) | 0 (0.0%) |
| $55,000 to $64,999 | 0 (0.0%) | 4 (4.0%) |
| $65,000 to $74,999 | 0 (0.0%) | 0 (0.0%) |
| $75,000 to $99,999 | 0 (0.0%) | 0 (0.0%) |
| $100,000+ | 69 (59.0%) | 56 (56.0%) |
| Total | 117 (100.0%) | 100 (100.0%) |
Earnings by Sex by Educational Attainment in Charlton
| Educational Attainment | Male Income | Female Income |
| Less than High School | - | - |
| High School Diploma | - | - |
| College or Associate's Degree | - | - |
| Bachelor's Degree | - | - |
| Graduate Degree | - | - |
| Total | $133,467 | $0 |
Family Income in Charlton
Family Income Brackets in Charlton
According to the Charlton family income data, there are 68 families falling into the $200,000+ income range, which is the most common income bracket and makes up 70.8% of all families.
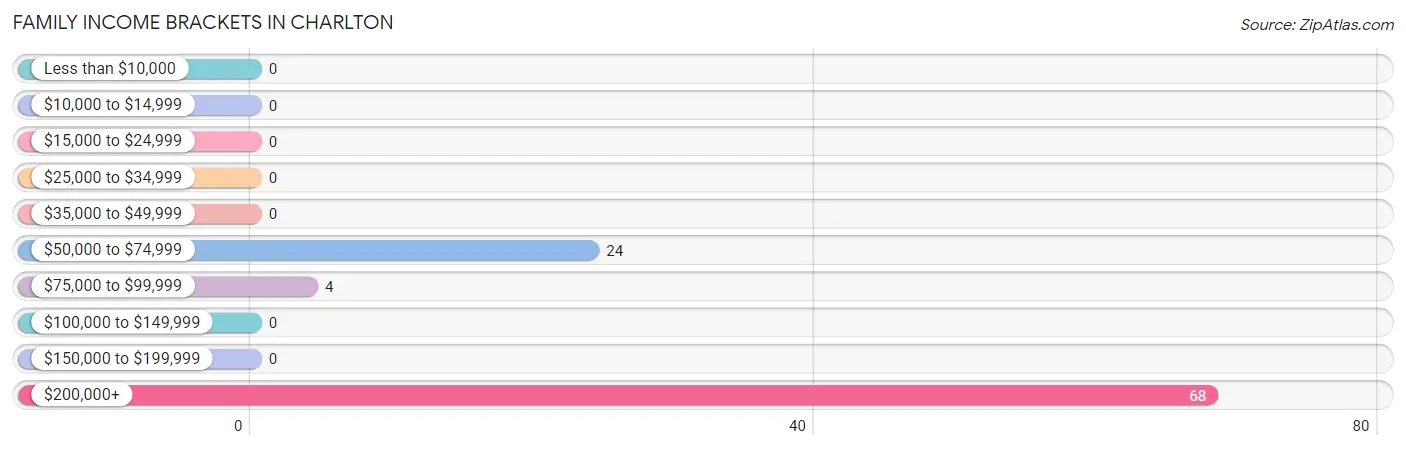
| Income Bracket | # Families | % Families |
| Less than $10,000 | 0 | 0.0% |
| $10,000 to $14,999 | 0 | 0.0% |
| $15,000 to $24,999 | 0 | 0.0% |
| $25,000 to $34,999 | 0 | 0.0% |
| $35,000 to $49,999 | 0 | 0.0% |
| $50,000 to $74,999 | 24 | 25.0% |
| $75,000 to $99,999 | 4 | 4.2% |
| $100,000 to $149,999 | 0 | 0.0% |
| $150,000 to $199,999 | 0 | 0.0% |
| $200,000+ | 68 | 70.8% |
Family Income by Famaliy Size in Charlton
| Income Bracket | # Families | Median Income |
| 2-Person Families | 28 (29.2%) | $0 |
| 3-Person Families | 15 (15.6%) | $0 |
| 4-Person Families | 53 (55.2%) | $0 |
| 5-Person Families | 0 (0.0%) | $0 |
| 6-Person Families | 0 (0.0%) | $0 |
| 7+ Person Families | 0 (0.0%) | $0 |
| Total | 96 (100.0%) | $250,001 |
Family Income by Number of Earners in Charlton
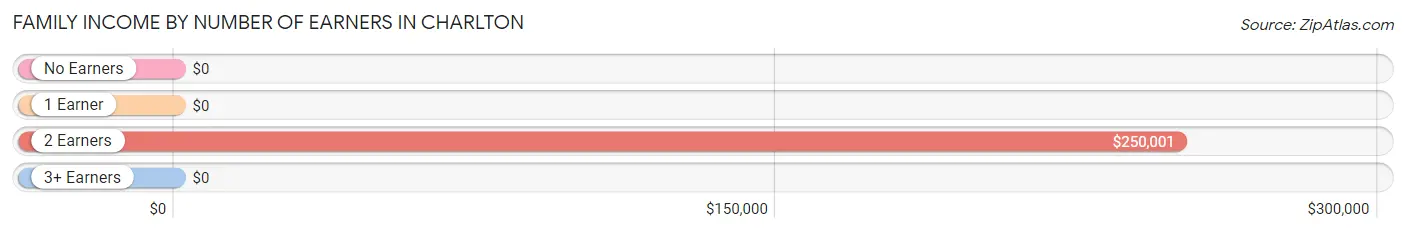
| Number of Earners | # Families | Median Income |
| No Earners | 0 (0.0%) | $0 |
| 1 Earner | 0 (0.0%) | $0 |
| 2 Earners | 81 (84.4%) | $250,001 |
| 3+ Earners | 15 (15.6%) | $0 |
| Total | 96 (100.0%) | $250,001 |
Household Income in Charlton
Household Income Brackets in Charlton
With 68 households falling in the category, the $200,000+ income range is the most frequent in Charlton, accounting for 70.8% of all households.
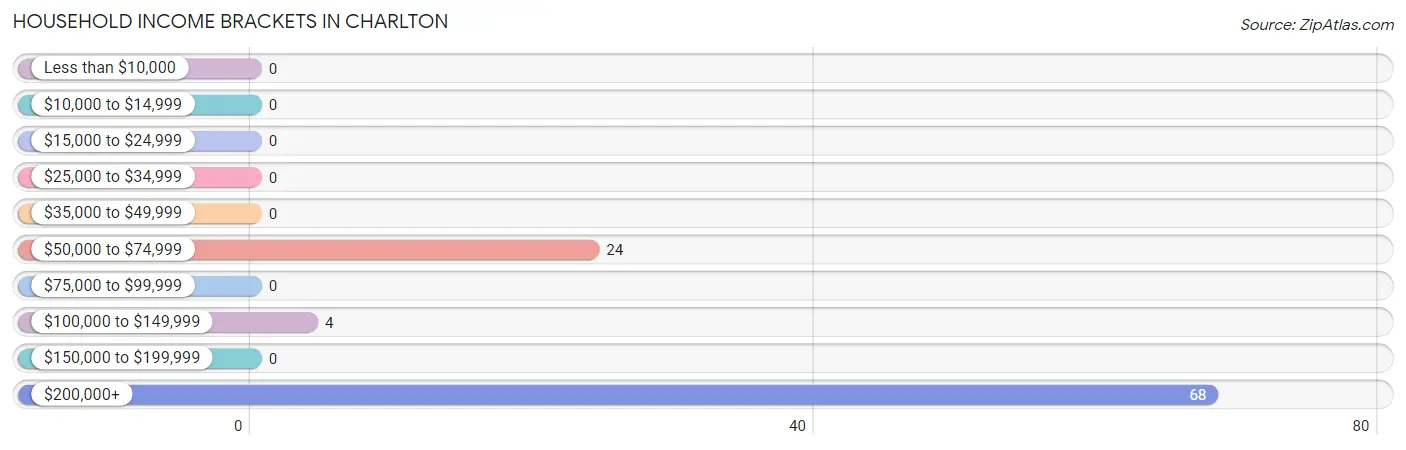
| Income Bracket | # Households | % Households |
| Less than $10,000 | 0 | 0.0% |
| $10,000 to $14,999 | 0 | 0.0% |
| $15,000 to $24,999 | 0 | 0.0% |
| $25,000 to $34,999 | 0 | 0.0% |
| $35,000 to $49,999 | 0 | 0.0% |
| $50,000 to $74,999 | 24 | 25.0% |
| $75,000 to $99,999 | 0 | 0.0% |
| $100,000 to $149,999 | 4 | 4.2% |
| $150,000 to $199,999 | 0 | 0.0% |
| $200,000+ | 68 | 70.8% |
Household Income by Householder Age in Charlton
The median household income in Charlton is $250,001, with the highest median household income of $250,001 found in the 45 to 64 years age bracket for the primary householder. A total of 92 households (95.8%) fall into this category.
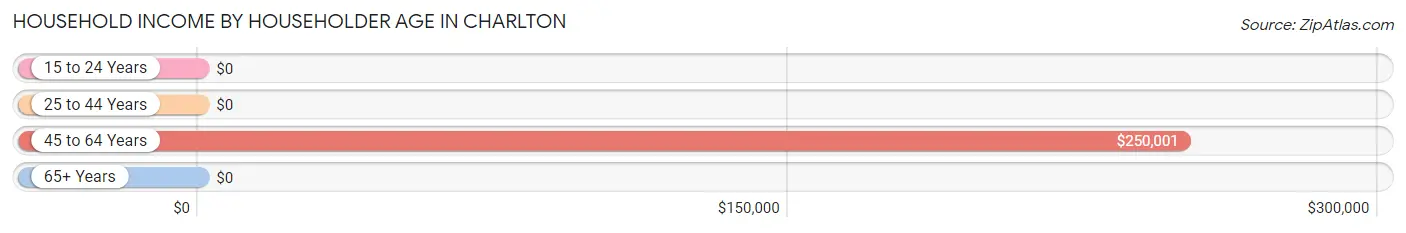
| Income Bracket | # Households | Median Income |
| 15 to 24 Years | 0 (0.0%) | $0 |
| 25 to 44 Years | 4 (4.2%) | $0 |
| 45 to 64 Years | 92 (95.8%) | $250,001 |
| 65+ Years | 0 (0.0%) | $0 |
| Total | 96 (100.0%) | $250,001 |
Poverty in Charlton
Income Below Poverty by Sex and Age in Charlton
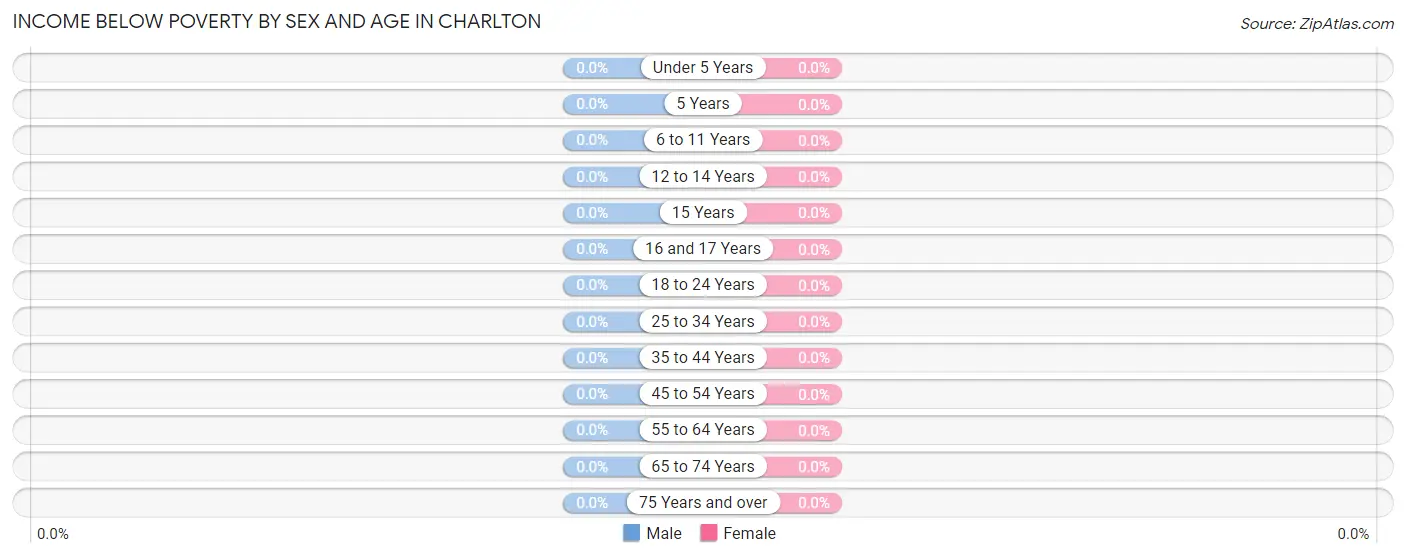
| Age Bracket | Male | Female |
| Under 5 Years | 0 (0.0%) | 0 (0.0%) |
| 5 Years | 0 (0.0%) | 0 (0.0%) |
| 6 to 11 Years | 0 (0.0%) | 0 (0.0%) |
| 12 to 14 Years | 0 (0.0%) | 0 (0.0%) |
| 15 Years | 0 (0.0%) | 0 (0.0%) |
| 16 and 17 Years | 0 (0.0%) | 0 (0.0%) |
| 18 to 24 Years | 0 (0.0%) | 0 (0.0%) |
| 25 to 34 Years | 0 (0.0%) | 0 (0.0%) |
| 35 to 44 Years | 0 (0.0%) | 0 (0.0%) |
| 45 to 54 Years | 0 (0.0%) | 0 (0.0%) |
| 55 to 64 Years | 0 (0.0%) | 0 (0.0%) |
| 65 to 74 Years | 0 (0.0%) | 0 (0.0%) |
| 75 Years and over | 0 (0.0%) | 0 (0.0%) |
| Total | 0 (0.0%) | 0 (0.0%) |
Income Above Poverty by Sex and Age in Charlton
According to the poverty statistics in Charlton, males aged 18 to 24 years and females aged 35 to 44 years are the age groups that are most secure financially, with 100.0% of males and 100.0% of females in these age groups living above the poverty line.
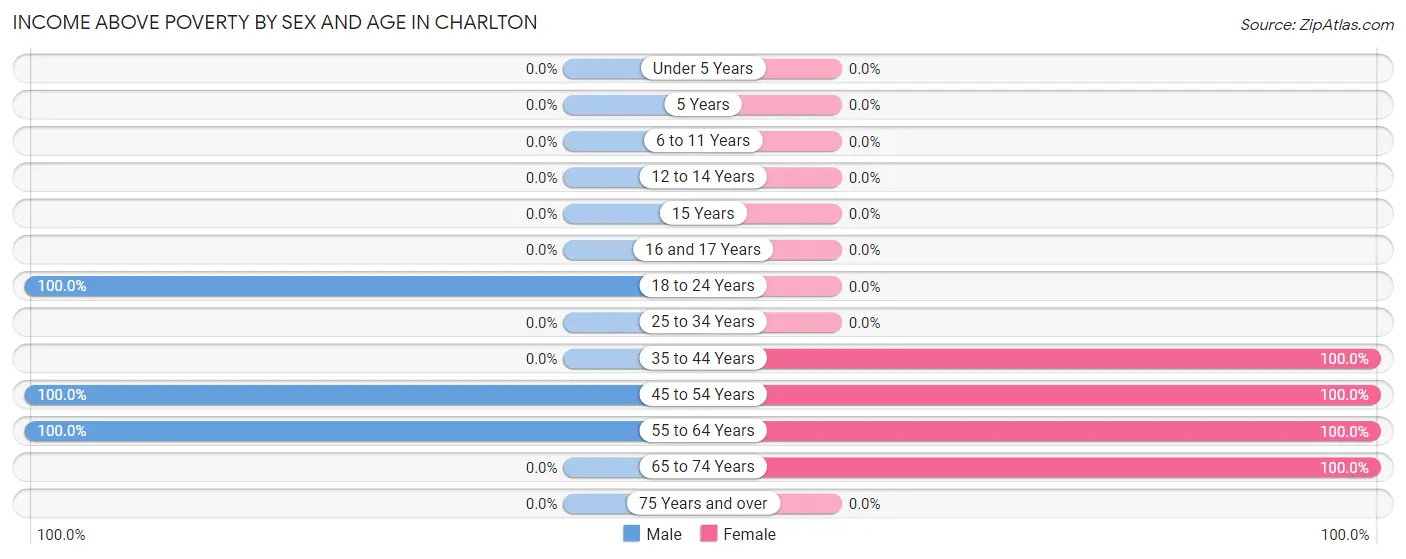
| Age Bracket | Male | Female |
| Under 5 Years | 0 (0.0%) | 0 (0.0%) |
| 5 Years | 0 (0.0%) | 0 (0.0%) |
| 6 to 11 Years | 0 (0.0%) | 0 (0.0%) |
| 12 to 14 Years | 0 (0.0%) | 0 (0.0%) |
| 15 Years | 0 (0.0%) | 0 (0.0%) |
| 16 and 17 Years | 0 (0.0%) | 0 (0.0%) |
| 18 to 24 Years | 76 (100.0%) | 0 (0.0%) |
| 25 to 34 Years | 0 (0.0%) | 0 (0.0%) |
| 35 to 44 Years | 0 (0.0%) | 4 (100.0%) |
| 45 to 54 Years | 73 (100.0%) | 71 (100.0%) |
| 55 to 64 Years | 24 (100.0%) | 25 (100.0%) |
| 65 to 74 Years | 0 (0.0%) | 50 (100.0%) |
| 75 Years and over | 0 (0.0%) | 0 (0.0%) |
| Total | 173 (100.0%) | 150 (100.0%) |
Income Below Poverty Among Married-Couple Families in Charlton
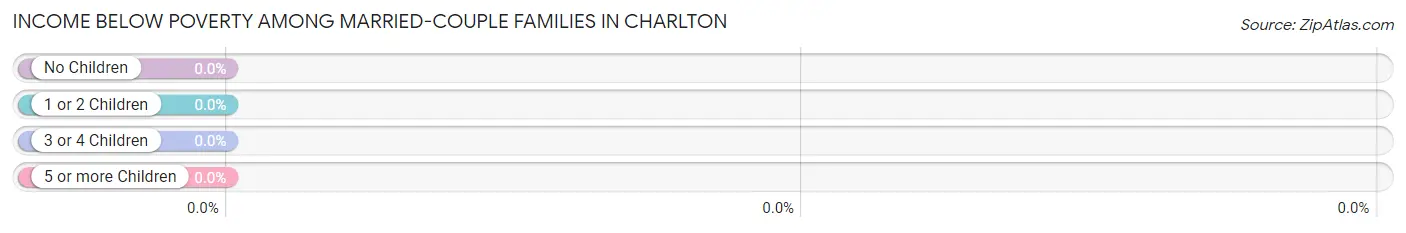
| Children | Above Poverty | Below Poverty |
| No Children | 92 (100.0%) | 0 (0.0%) |
| 1 or 2 Children | 0 (0.0%) | 0 (0.0%) |
| 3 or 4 Children | 0 (0.0%) | 0 (0.0%) |
| 5 or more Children | 0 (0.0%) | 0 (0.0%) |
| Total | 92 (100.0%) | 0 (0.0%) |
Income Below Poverty Among Single-Parent Households in Charlton
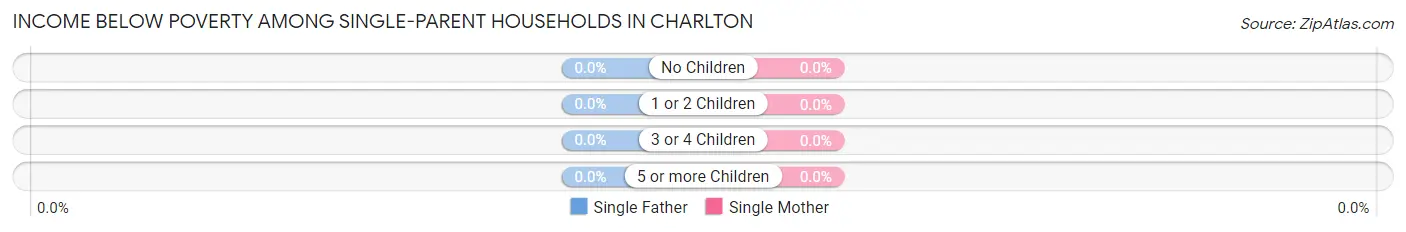
| Children | Single Father | Single Mother |
| No Children | 0 (0.0%) | 0 (0.0%) |
| 1 or 2 Children | 0 (0.0%) | 0 (0.0%) |
| 3 or 4 Children | 0 (0.0%) | 0 (0.0%) |
| 5 or more Children | 0 (0.0%) | 0 (0.0%) |
| Total | 0 (0.0%) | 0 (0.0%) |
Income Below Poverty Among Married-Couple vs Single-Parent Households in Charlton
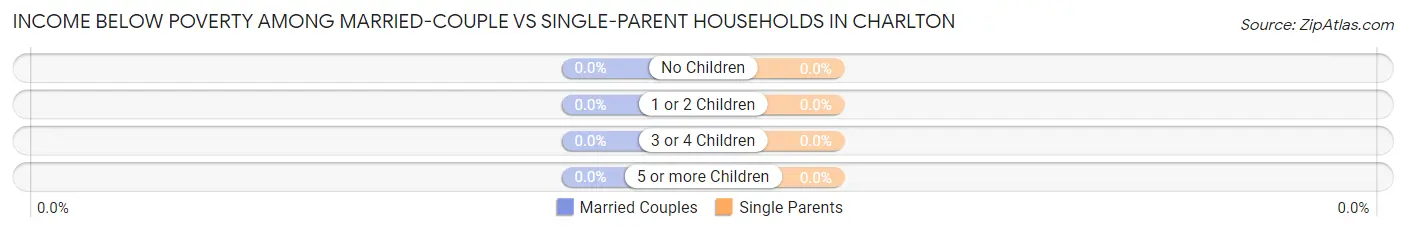
| Children | Married-Couple Families | Single-Parent Households |
| No Children | 0 (0.0%) | 0 (0.0%) |
| 1 or 2 Children | 0 (0.0%) | 0 (0.0%) |
| 3 or 4 Children | 0 (0.0%) | 0 (0.0%) |
| 5 or more Children | 0 (0.0%) | 0 (0.0%) |
| Total | 0 (0.0%) | 0 (0.0%) |
Race in Charlton
The most populous races in Charlton are , and White / Caucasian (323 | 100.0%).
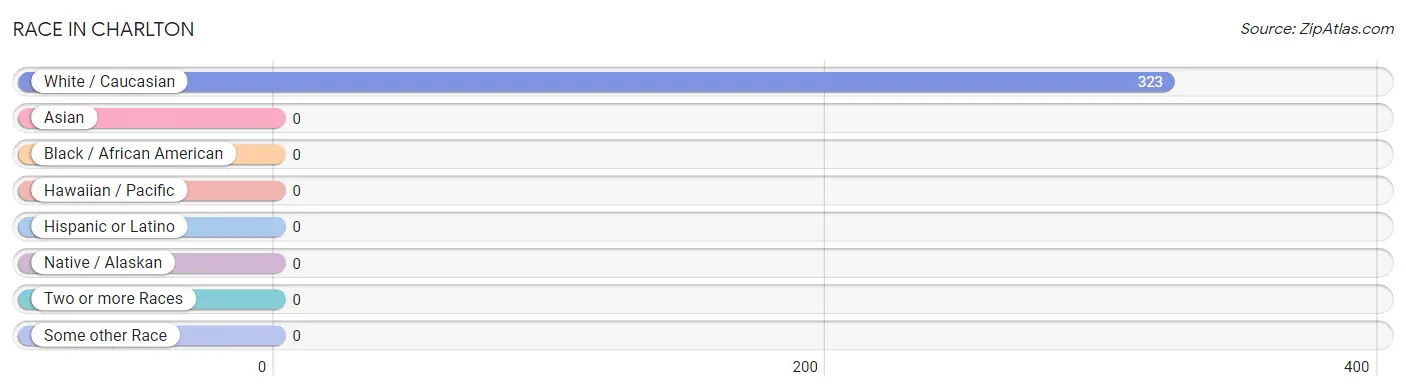
| Race | # Population | % Population |
| Asian | 0 | 0.0% |
| Black / African American | 0 | 0.0% |
| Hawaiian / Pacific | 0 | 0.0% |
| Hispanic or Latino | 0 | 0.0% |
| Native / Alaskan | 0 | 0.0% |
| White / Caucasian | 323 | 100.0% |
| Two or more Races | 0 | 0.0% |
| Some other Race | 0 | 0.0% |
| Total | 323 | 100.0% |
Ancestry in Charlton
The most populous ancestries reported in Charlton are , and Italian (16 | 5.0%), together accounting for 5.0% of all Charlton residents.

| Ancestry | # Population | % Population |
| Italian | 16 | 5.0% | View All 1 Rows |
Immigrants in Charlton

| Immigration Origin | # Population | % Population | View All 0 Rows |
Sex and Age in Charlton
Sex and Age in Charlton
The most populous age groups in Charlton are 45 to 49 Years (73 | 42.2%) for men and 45 to 49 Years (71 | 47.3%) for women.
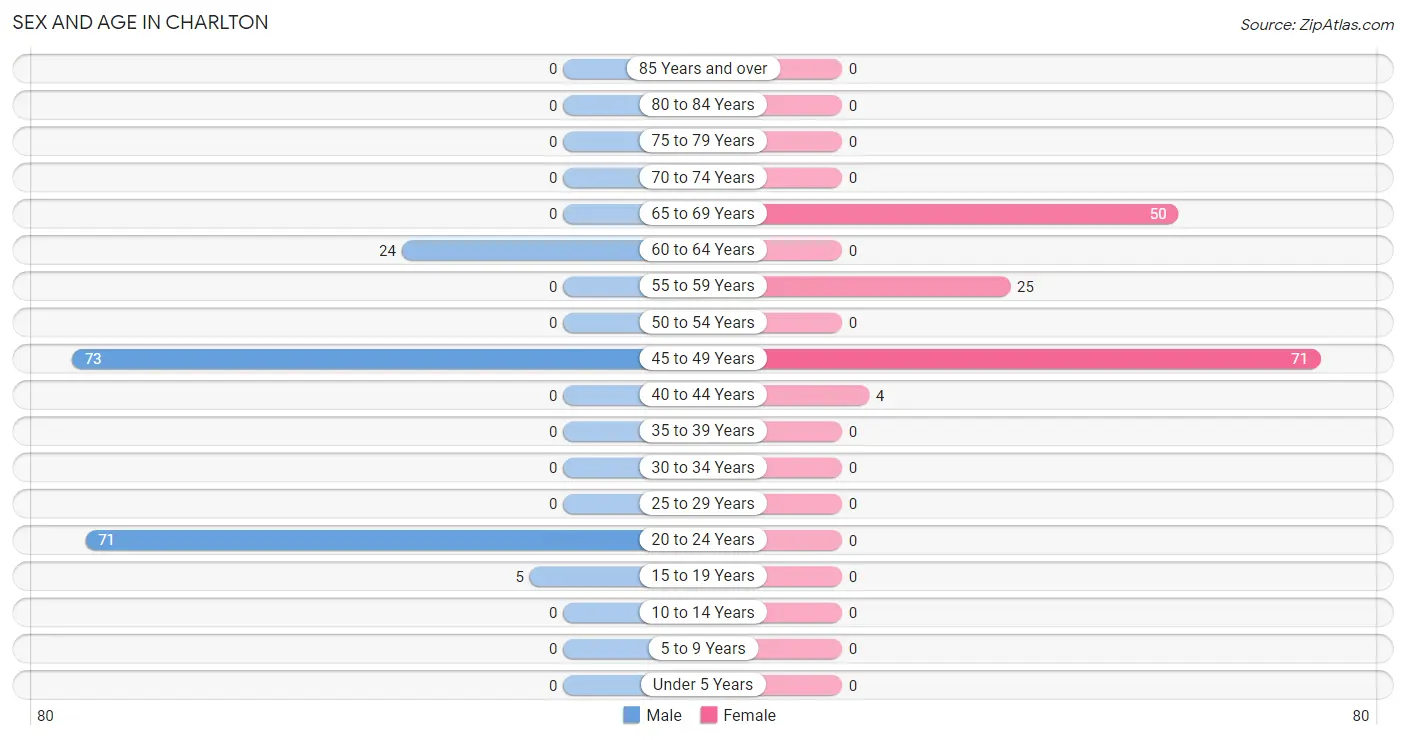
| Age Bracket | Male | Female |
| Under 5 Years | 0 (0.0%) | 0 (0.0%) |
| 5 to 9 Years | 0 (0.0%) | 0 (0.0%) |
| 10 to 14 Years | 0 (0.0%) | 0 (0.0%) |
| 15 to 19 Years | 5 (2.9%) | 0 (0.0%) |
| 20 to 24 Years | 71 (41.0%) | 0 (0.0%) |
| 25 to 29 Years | 0 (0.0%) | 0 (0.0%) |
| 30 to 34 Years | 0 (0.0%) | 0 (0.0%) |
| 35 to 39 Years | 0 (0.0%) | 0 (0.0%) |
| 40 to 44 Years | 0 (0.0%) | 4 (2.7%) |
| 45 to 49 Years | 73 (42.2%) | 71 (47.3%) |
| 50 to 54 Years | 0 (0.0%) | 0 (0.0%) |
| 55 to 59 Years | 0 (0.0%) | 25 (16.7%) |
| 60 to 64 Years | 24 (13.9%) | 0 (0.0%) |
| 65 to 69 Years | 0 (0.0%) | 50 (33.3%) |
| 70 to 74 Years | 0 (0.0%) | 0 (0.0%) |
| 75 to 79 Years | 0 (0.0%) | 0 (0.0%) |
| 80 to 84 Years | 0 (0.0%) | 0 (0.0%) |
| 85 Years and over | 0 (0.0%) | 0 (0.0%) |
| Total | 173 (100.0%) | 150 (100.0%) |
Families and Households in Charlton
Median Family Size in Charlton
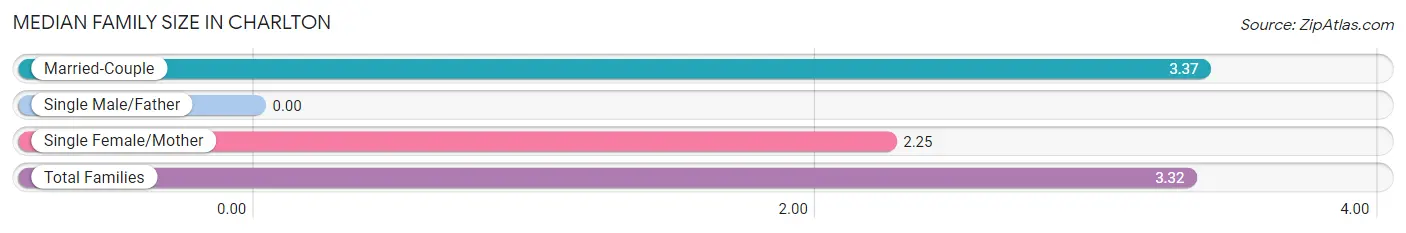
| Family Type | # Families | Family Size |
| Married-Couple | 92 (95.8%) | 3.37 |
| Single Male/Father | 0 (0.0%) | - |
| Single Female/Mother | 4 (4.2%) | 2.25 |
| Total Families | 96 (100.0%) | 3.32 |
Median Household Size in Charlton
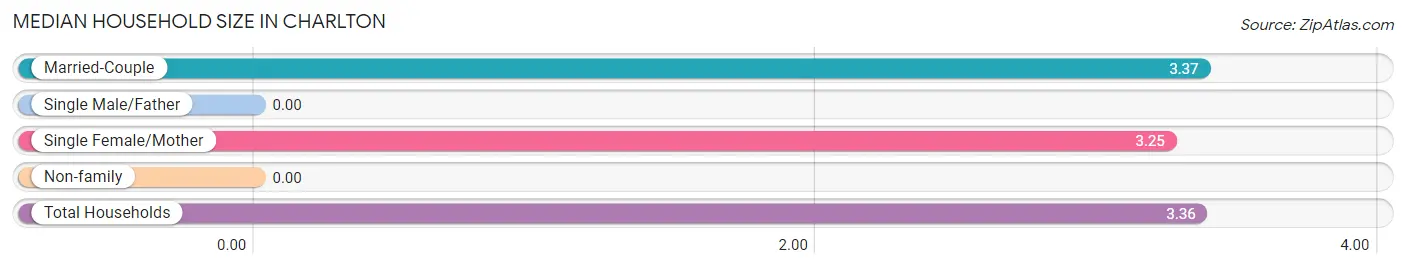
| Household Type | # Households | Household Size |
| Married-Couple | 92 (95.8%) | 3.37 |
| Single Male/Father | 0 (0.0%) | - |
| Single Female/Mother | 4 (4.2%) | 3.25 |
| Non-family | 0 (0.0%) | - |
| Total Households | 96 (100.0%) | 3.36 |
Household Size by Marriage Status in Charlton
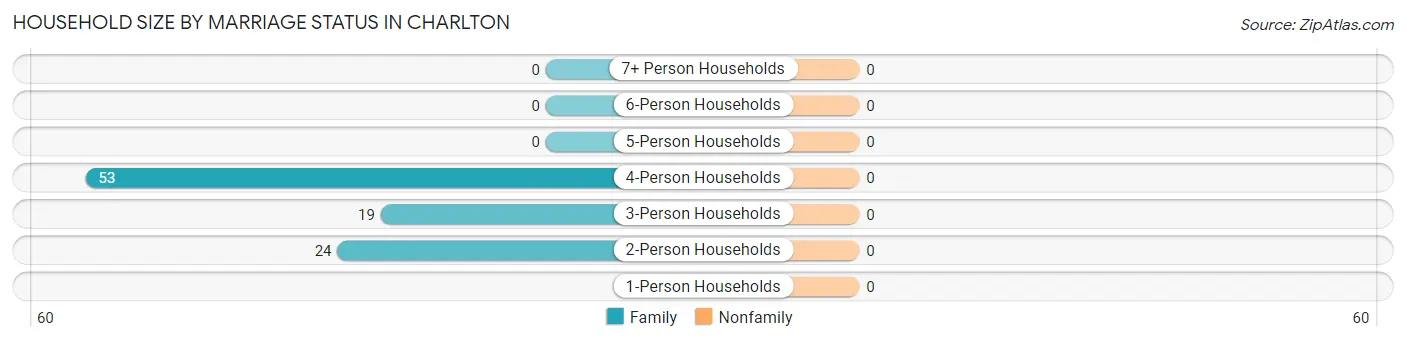
| Household Size | Family Households | Nonfamily Households |
| 1-Person Households | - | 0 (0.0%) |
| 2-Person Households | 24 (25.0%) | 0 (0.0%) |
| 3-Person Households | 19 (19.8%) | 0 (0.0%) |
| 4-Person Households | 53 (55.2%) | 0 (0.0%) |
| 5-Person Households | 0 (0.0%) | 0 (0.0%) |
| 6-Person Households | 0 (0.0%) | 0 (0.0%) |
| 7+ Person Households | 0 (0.0%) | 0 (0.0%) |
| Total | 96 (100.0%) | 0 (0.0%) |
Female Fertility in Charlton
Fertility by Age in Charlton
| Age Bracket | Women with Births | Births / 1,000 Women |
| 15 to 19 years | 0 (0.0%) | 0.0 |
| 20 to 34 years | 0 (0.0%) | 0.0 |
| 35 to 50 years | 0 (0.0%) | 0.0 |
| Total | 0 (0.0%) | 0.0 |
Fertility by Age by Marriage Status in Charlton
| Age Bracket | Married | Unmarried |
| 15 to 19 years | 0 (0.0%) | 0 (0.0%) |
| 20 to 34 years | 0 (0.0%) | 0 (0.0%) |
| 35 to 50 years | 0 (0.0%) | 0 (0.0%) |
| Total | 0 (0.0%) | 0 (0.0%) |
Fertility by Education in Charlton
| Educational Attainment | Women with Births | Births / 1,000 Women |
| Less than High School | 0 (0.0%) | 0.0 |
| High School Diploma | 0 (0.0%) | 0.0 |
| College or Associate's Degree | 0 (0.0%) | 0.0 |
| Bachelor's Degree | 0 (0.0%) | 0.0 |
| Graduate Degree | 0 (0.0%) | 0.0 |
| Total | 0 (0.0%) | 0.0 |
Fertility by Education by Marriage Status in Charlton
| Educational Attainment | Married | Unmarried |
| Less than High School | 0 (0.0%) | 0 (0.0%) |
| High School Diploma | 0 (0.0%) | 0 (0.0%) |
| College or Associate's Degree | 0 (0.0%) | 0 (0.0%) |
| Bachelor's Degree | 0 (0.0%) | 0 (0.0%) |
| Graduate Degree | 0 (0.0%) | 0 (0.0%) |
| Total | 0 (0.0%) | 0 (0.0%) |
Employment Characteristics in Charlton
Employment by Class of Employer in Charlton
Among the 217 employed individuals in Charlton, private company employees (96 | 44.2%), state government employees (68 | 31.3%), and local government employees (53 | 24.4%) make up the most common classes of employment.
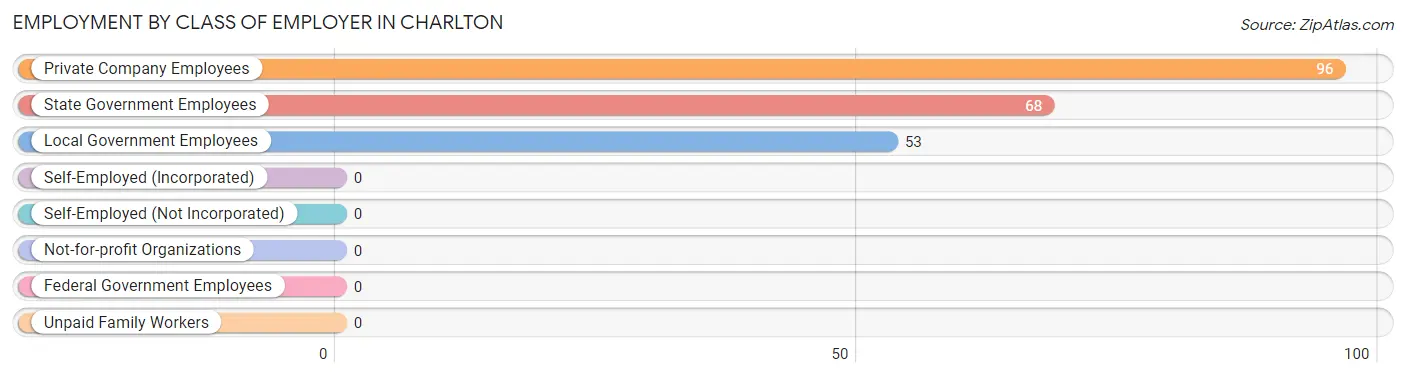
| Employer Class | # Employees | % Employees |
| Private Company Employees | 96 | 44.2% |
| Self-Employed (Incorporated) | 0 | 0.0% |
| Self-Employed (Not Incorporated) | 0 | 0.0% |
| Not-for-profit Organizations | 0 | 0.0% |
| Local Government Employees | 53 | 24.4% |
| State Government Employees | 68 | 31.3% |
| Federal Government Employees | 0 | 0.0% |
| Unpaid Family Workers | 0 | 0.0% |
| Total | 217 | 100.0% |
Employment Status by Age in Charlton
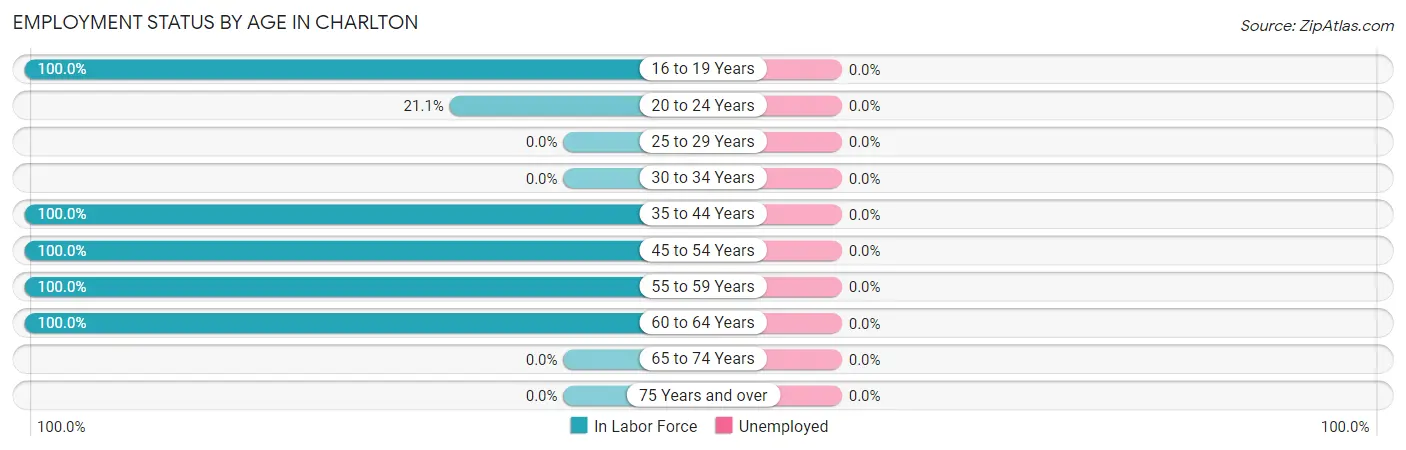
| Age Bracket | In Labor Force | Unemployed |
| 16 to 19 Years | 5 (100.0%) | 0 (0.0%) |
| 20 to 24 Years | 15 (21.1%) | 0 (0.0%) |
| 25 to 29 Years | 0 (0.0%) | 0 (0.0%) |
| 30 to 34 Years | 0 (0.0%) | 0 (0.0%) |
| 35 to 44 Years | 4 (100.0%) | 0 (0.0%) |
| 45 to 54 Years | 144 (100.0%) | 0 (0.0%) |
| 55 to 59 Years | 25 (100.0%) | 0 (0.0%) |
| 60 to 64 Years | 24 (100.0%) | 0 (0.0%) |
| 65 to 74 Years | 0 (0.0%) | 0 (0.0%) |
| 75 Years and over | 0 (0.0%) | 0 (0.0%) |
| Total | 217 (67.2%) | 0 (0.0%) |
Employment Status by Educational Attainment in Charlton
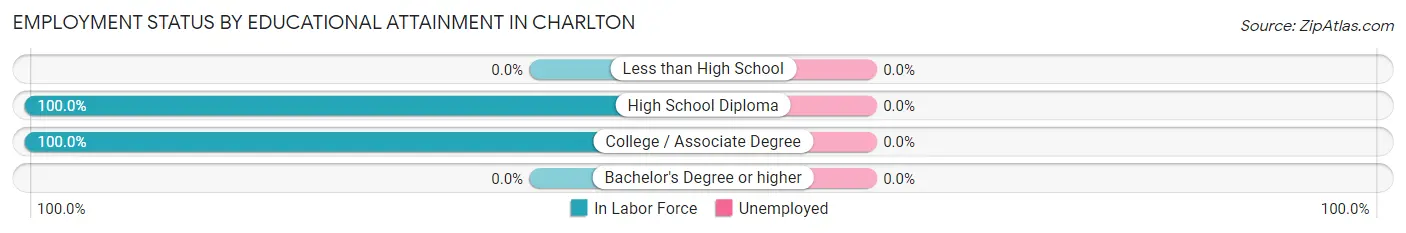
| Educational Attainment | In Labor Force | Unemployed |
| Less than High School | 0 (0.0%) | 0 (0.0%) |
| High School Diploma | 120 (100.0%) | 0 (0.0%) |
| College / Associate Degree | 77 (100.0%) | 0 (0.0%) |
| Bachelor's Degree or higher | 0 (0.0%) | 0 (0.0%) |
| Total | 197 (100.0%) | 0 (0.0%) |
Employment Occupations by Sex in Charlton
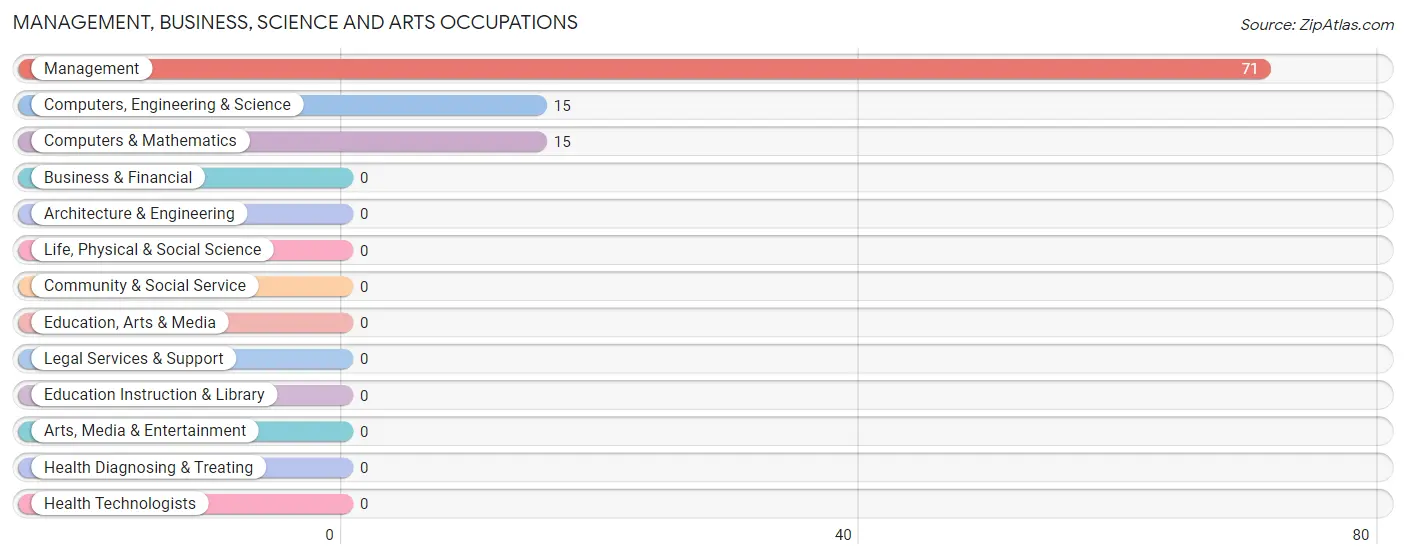
Management, Business, Science and Arts Occupations
The most common Management, Business, Science and Arts occupations in Charlton are Management (71 | 32.7%), Computers, Engineering & Science (15 | 6.9%), and Computers & Mathematics (15 | 6.9%).
Management, Business, Science and Arts Occupations by Sex
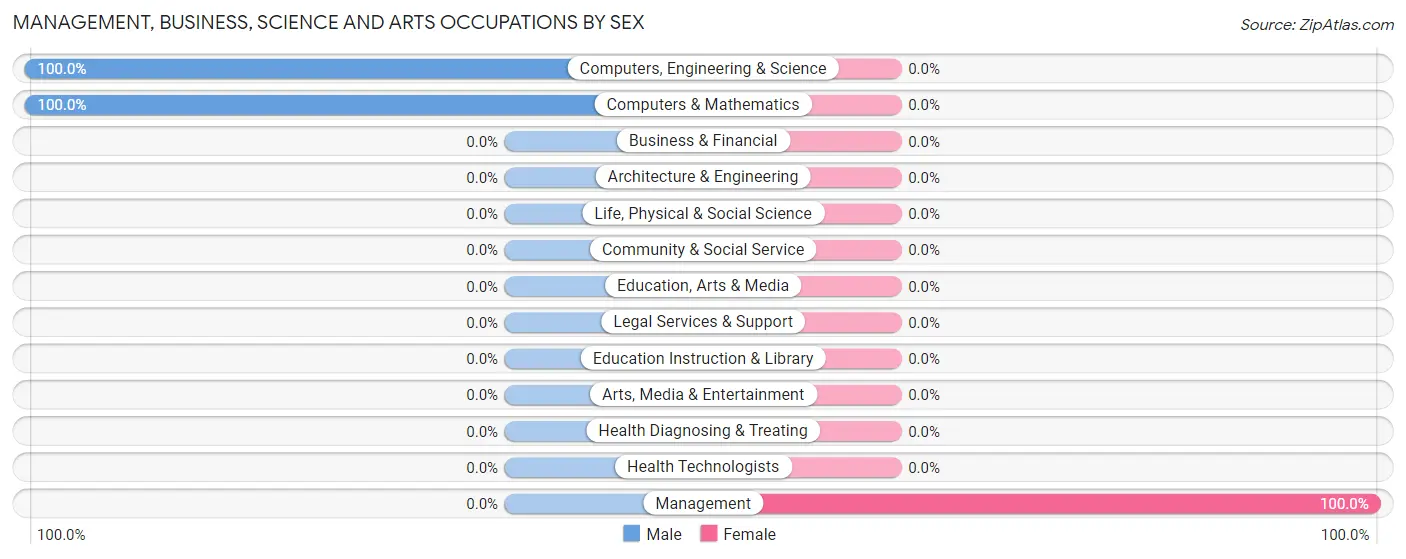
| Occupation | Male | Female |
| Management | 0 (0.0%) | 71 (100.0%) |
| Business & Financial | 0 (0.0%) | 0 (0.0%) |
| Computers, Engineering & Science | 15 (100.0%) | 0 (0.0%) |
| Computers & Mathematics | 15 (100.0%) | 0 (0.0%) |
| Architecture & Engineering | 0 (0.0%) | 0 (0.0%) |
| Life, Physical & Social Science | 0 (0.0%) | 0 (0.0%) |
| Community & Social Service | 0 (0.0%) | 0 (0.0%) |
| Education, Arts & Media | 0 (0.0%) | 0 (0.0%) |
| Legal Services & Support | 0 (0.0%) | 0 (0.0%) |
| Education Instruction & Library | 0 (0.0%) | 0 (0.0%) |
| Arts, Media & Entertainment | 0 (0.0%) | 0 (0.0%) |
| Health Diagnosing & Treating | 0 (0.0%) | 0 (0.0%) |
| Health Technologists | 0 (0.0%) | 0 (0.0%) |
| Total (Category) | 15 (17.4%) | 71 (82.6%) |
| Total (Overall) | 117 (53.9%) | 100 (46.1%) |
Services Occupations
The most common Services occupations in Charlton are Security & Protection (53 | 24.4%), Law Enforcement (53 | 24.4%), Cleaning & Maintenance (24 | 11.1%), and Food Preparation & Serving (4 | 1.8%).
Services Occupations by Sex
| Occupation | Male | Female |
| Healthcare Support | 0 (0.0%) | 0 (0.0%) |
| Security & Protection | 53 (100.0%) | 0 (0.0%) |
| Firefighting & Prevention | 0 (0.0%) | 0 (0.0%) |
| Law Enforcement | 53 (100.0%) | 0 (0.0%) |
| Food Preparation & Serving | 4 (100.0%) | 0 (0.0%) |
| Cleaning & Maintenance | 24 (100.0%) | 0 (0.0%) |
| Personal Care & Service | 0 (0.0%) | 0 (0.0%) |
| Total (Category) | 81 (100.0%) | 0 (0.0%) |
| Total (Overall) | 117 (53.9%) | 100 (46.1%) |
Sales and Office Occupations
The most common Sales and Office occupations in Charlton are , and Office & Administration (4 | 1.8%).
Sales and Office Occupations by Sex
| Occupation | Male | Female |
| Sales & Related | 0 (0.0%) | 0 (0.0%) |
| Office & Administration | 0 (0.0%) | 4 (100.0%) |
| Total (Category) | 0 (0.0%) | 4 (100.0%) |
| Total (Overall) | 117 (53.9%) | 100 (46.1%) |
Natural Resources, Construction and Maintenance Occupations
The most common Natural Resources, Construction and Maintenance occupations in Charlton are , and Installation, Maintenance & Repair (16 | 7.4%).
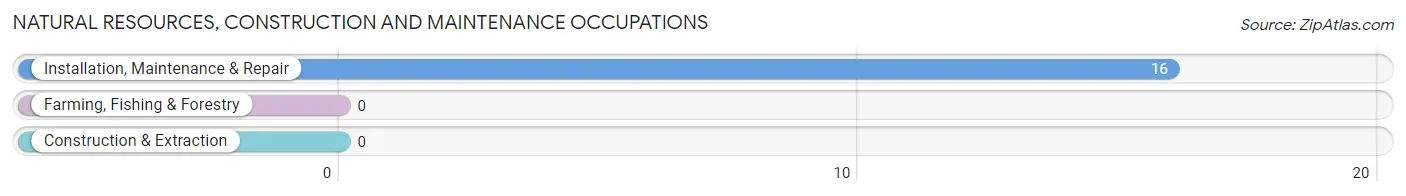
Natural Resources, Construction and Maintenance Occupations by Sex
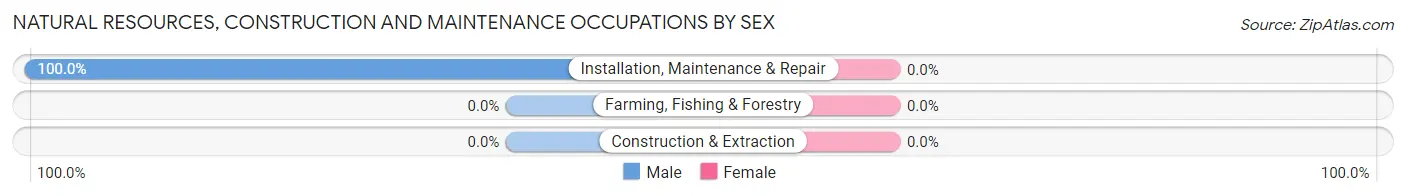
| Occupation | Male | Female |
| Farming, Fishing & Forestry | 0 (0.0%) | 0 (0.0%) |
| Construction & Extraction | 0 (0.0%) | 0 (0.0%) |
| Installation, Maintenance & Repair | 16 (100.0%) | 0 (0.0%) |
| Total (Category) | 16 (100.0%) | 0 (0.0%) |
| Total (Overall) | 117 (53.9%) | 100 (46.1%) |
Production, Transportation and Moving Occupations
The most common Production, Transportation and Moving occupations in Charlton are Transportation (25 | 11.5%), and Production (5 | 2.3%).
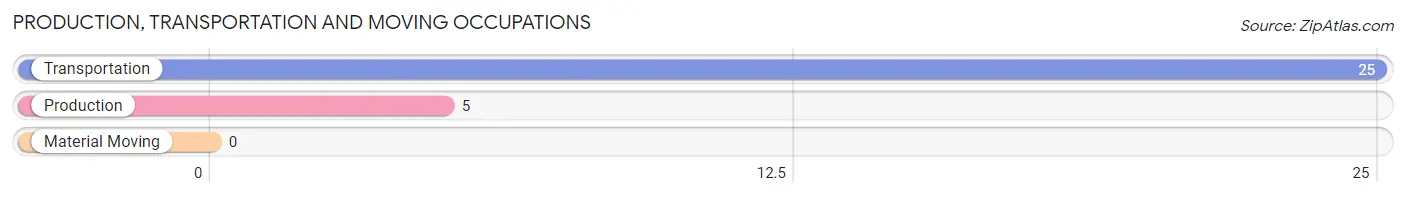
Production, Transportation and Moving Occupations by Sex
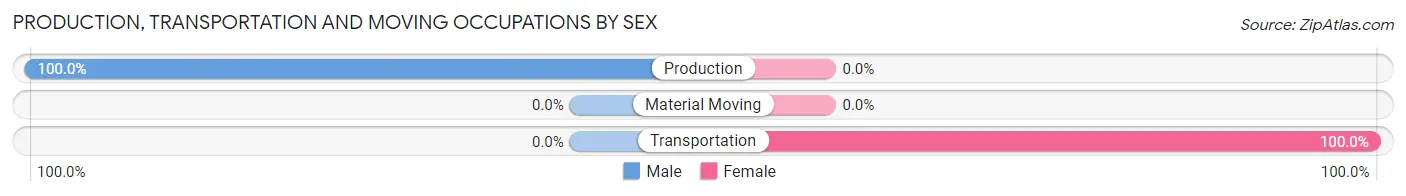
| Occupation | Male | Female |
| Production | 5 (100.0%) | 0 (0.0%) |
| Transportation | 0 (0.0%) | 25 (100.0%) |
| Material Moving | 0 (0.0%) | 0 (0.0%) |
| Total (Category) | 5 (16.7%) | 25 (83.3%) |
| Total (Overall) | 117 (53.9%) | 100 (46.1%) |
Employment Industries by Sex in Charlton
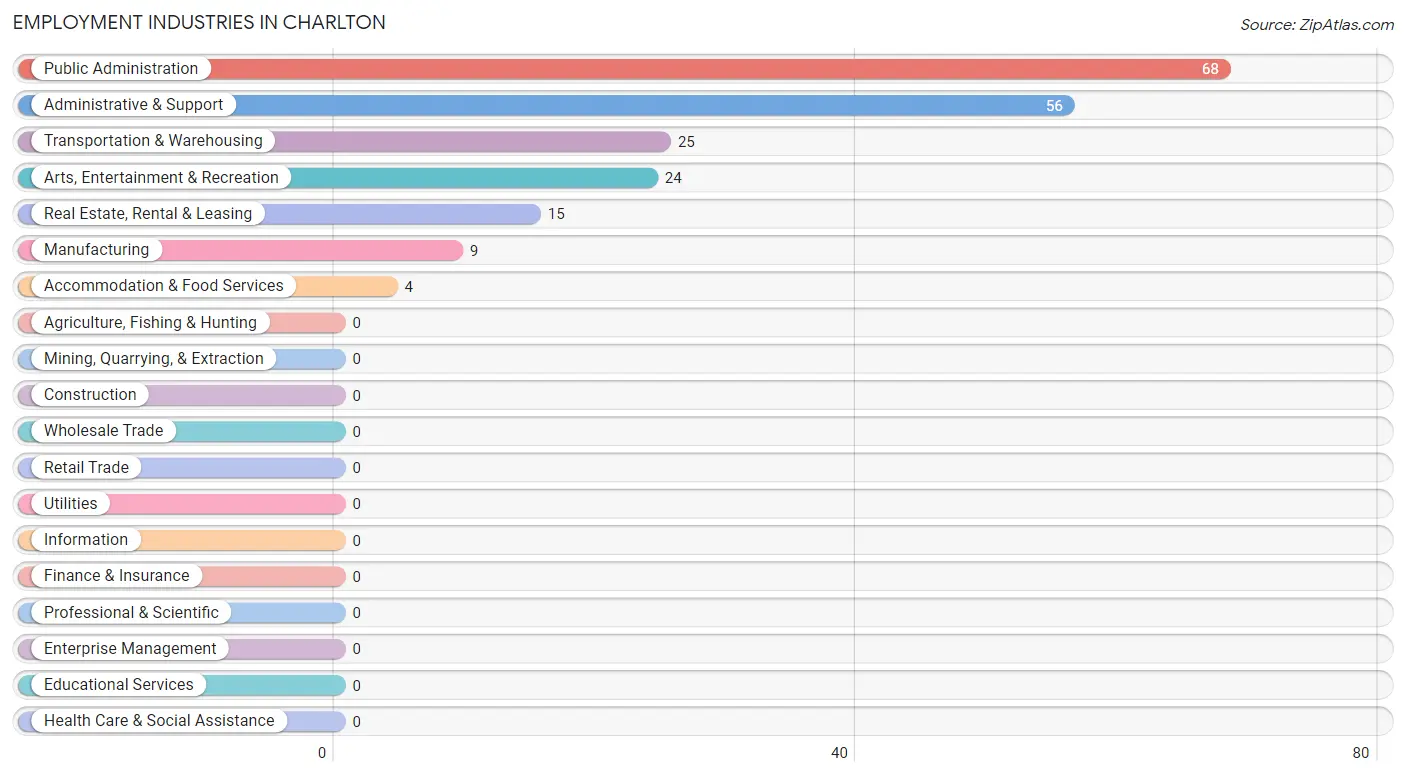
Employment Industries in Charlton
The major employment industries in Charlton include Public Administration (68 | 31.3%), Administrative & Support (56 | 25.8%), Transportation & Warehousing (25 | 11.5%), Arts, Entertainment & Recreation (24 | 11.1%), and Real Estate, Rental & Leasing (15 | 6.9%).
Employment Industries by Sex in Charlton
The Charlton industries that see more men than women are Arts, Entertainment & Recreation (100.0%), Accommodation & Food Services (100.0%), and Public Administration (100.0%), whereas the industries that tend to have a higher number of women are Transportation & Warehousing (100.0%), Real Estate, Rental & Leasing (100.0%), and Administrative & Support (100.0%).
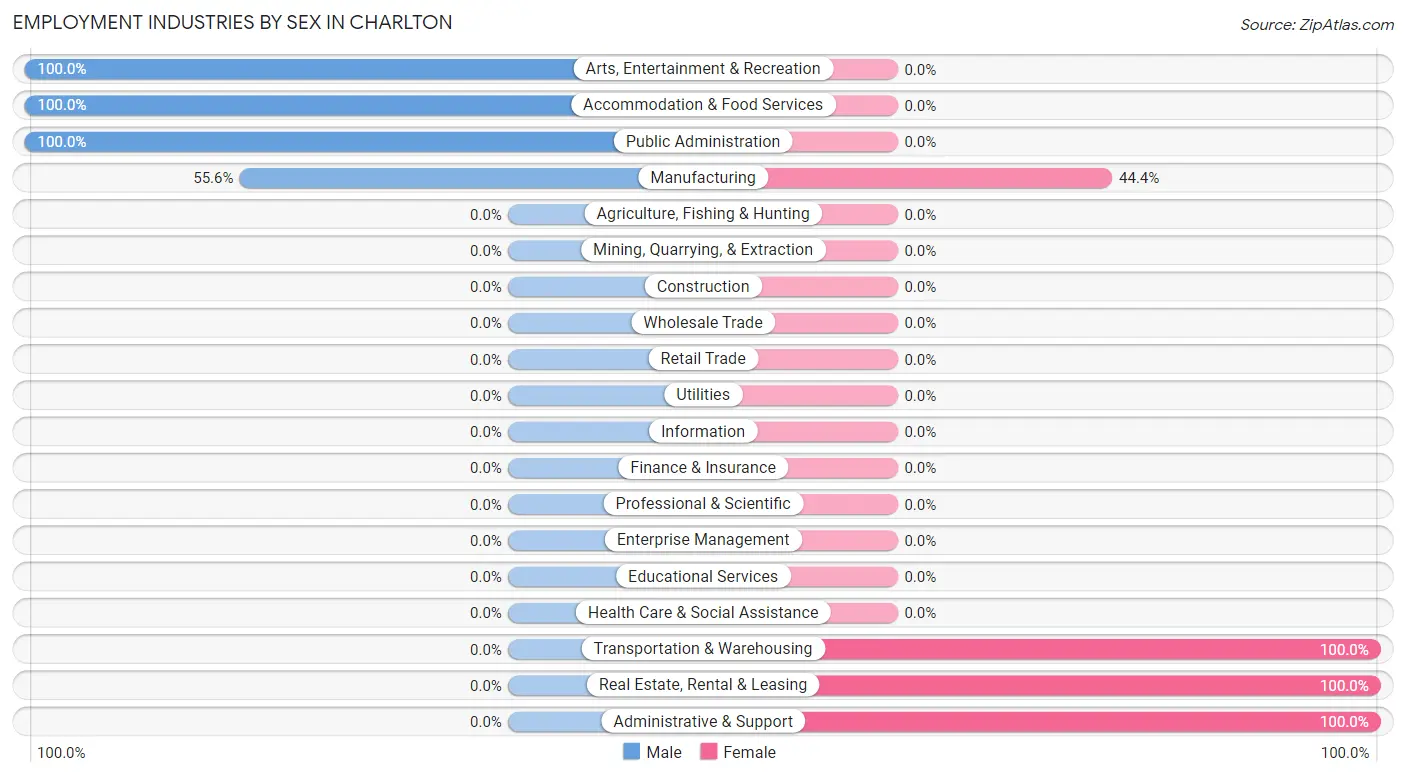
| Industry | Male | Female |
| Agriculture, Fishing & Hunting | 0 (0.0%) | 0 (0.0%) |
| Mining, Quarrying, & Extraction | 0 (0.0%) | 0 (0.0%) |
| Construction | 0 (0.0%) | 0 (0.0%) |
| Manufacturing | 5 (55.6%) | 4 (44.4%) |
| Wholesale Trade | 0 (0.0%) | 0 (0.0%) |
| Retail Trade | 0 (0.0%) | 0 (0.0%) |
| Transportation & Warehousing | 0 (0.0%) | 25 (100.0%) |
| Utilities | 0 (0.0%) | 0 (0.0%) |
| Information | 0 (0.0%) | 0 (0.0%) |
| Finance & Insurance | 0 (0.0%) | 0 (0.0%) |
| Real Estate, Rental & Leasing | 0 (0.0%) | 15 (100.0%) |
| Professional & Scientific | 0 (0.0%) | 0 (0.0%) |
| Enterprise Management | 0 (0.0%) | 0 (0.0%) |
| Administrative & Support | 0 (0.0%) | 56 (100.0%) |
| Educational Services | 0 (0.0%) | 0 (0.0%) |
| Health Care & Social Assistance | 0 (0.0%) | 0 (0.0%) |
| Arts, Entertainment & Recreation | 24 (100.0%) | 0 (0.0%) |
| Accommodation & Food Services | 4 (100.0%) | 0 (0.0%) |
| Public Administration | 68 (100.0%) | 0 (0.0%) |
| Total | 117 (53.9%) | 100 (46.1%) |
Education in Charlton
School Enrollment in Charlton
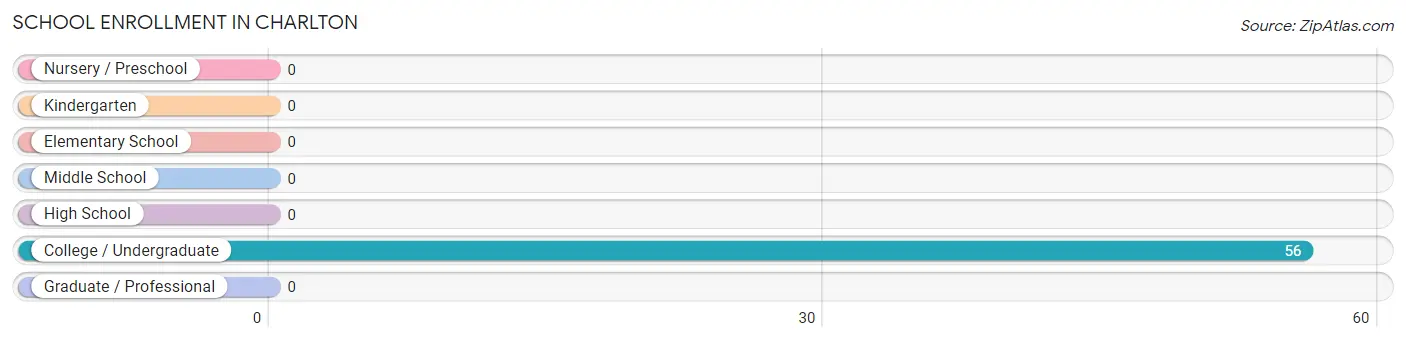
| School Level | # Students | % Students |
| Nursery / Preschool | 0 | 0.0% |
| Kindergarten | 0 | 0.0% |
| Elementary School | 0 | 0.0% |
| Middle School | 0 | 0.0% |
| High School | 0 | 0.0% |
| College / Undergraduate | 56 | 100.0% |
| Graduate / Professional | 0 | 0.0% |
| Total | 56 | 100.0% |
School Enrollment by Age by Funding Source in Charlton
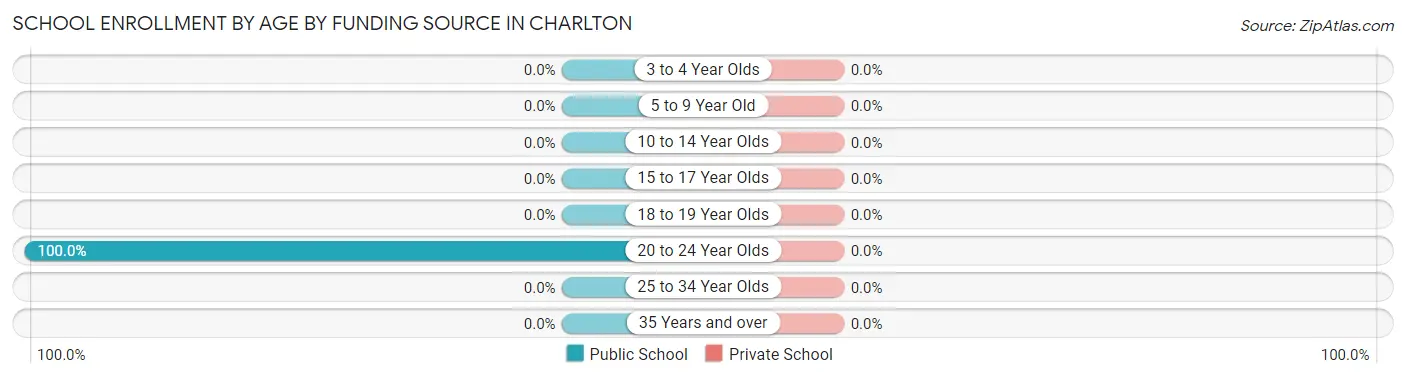
| Age Bracket | Public School | Private School |
| 3 to 4 Year Olds | 0 (0.0%) | 0 (0.0%) |
| 5 to 9 Year Old | 0 (0.0%) | 0 (0.0%) |
| 10 to 14 Year Olds | 0 (0.0%) | 0 (0.0%) |
| 15 to 17 Year Olds | 0 (0.0%) | 0 (0.0%) |
| 18 to 19 Year Olds | 0 (0.0%) | 0 (0.0%) |
| 20 to 24 Year Olds | 56 (100.0%) | 0 (0.0%) |
| 25 to 34 Year Olds | 0 (0.0%) | 0 (0.0%) |
| 35 Years and over | 0 (0.0%) | 0 (0.0%) |
| Total | 56 (100.0%) | 0 (0.0%) |
Educational Attainment by Field of Study in Charlton
| Field of Study | # Graduates | % Graduates |
| Computers & Mathematics | 0 | 0.0% |
| Bio, Nature & Agricultural | 0 | 0.0% |
| Physical & Health Sciences | 0 | 0.0% |
| Psychology | 0 | 0.0% |
| Social Sciences | 0 | 0.0% |
| Engineering | 0 | 0.0% |
| Multidisciplinary Studies | 0 | 0.0% |
| Science & Technology | 0 | 0.0% |
| Business | 0 | 0.0% |
| Education | 0 | 0.0% |
| Literature & Languages | 0 | 0.0% |
| Liberal Arts & History | 0 | 0.0% |
| Visual & Performing Arts | 0 | 0.0% |
| Communications | 0 | 0.0% |
| Arts & Humanities | 0 | 0.0% |
| Total | 0 | 0.0% |
Transportation & Commute in Charlton
Vehicle Availability by Sex in Charlton
The most prevalent vehicle ownership categories in Charlton are males with 5 or more vehicles (84, accounting for 71.8%) and females with 5 or more vehicles (71, making up 84.0%).
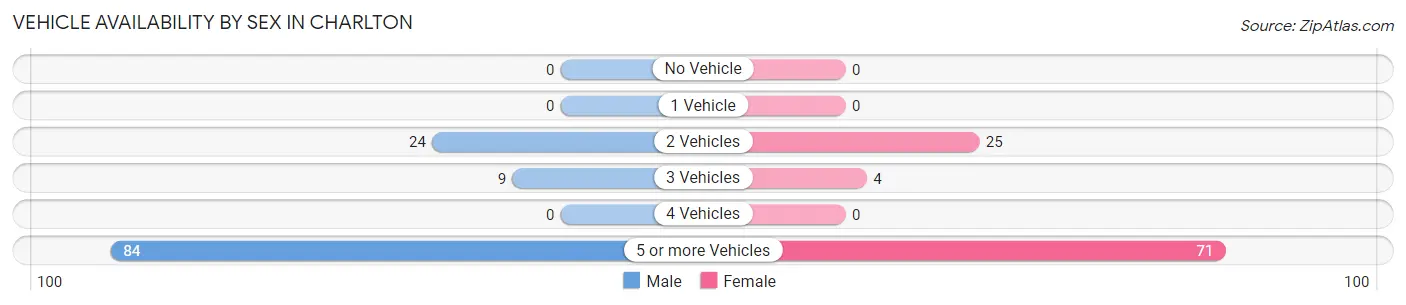
| Vehicles Available | Male | Female |
| No Vehicle | 0 (0.0%) | 0 (0.0%) |
| 1 Vehicle | 0 (0.0%) | 0 (0.0%) |
| 2 Vehicles | 24 (20.5%) | 25 (25.0%) |
| 3 Vehicles | 9 (7.7%) | 4 (4.0%) |
| 4 Vehicles | 0 (0.0%) | 0 (0.0%) |
| 5 or more Vehicles | 84 (71.8%) | 71 (71.0%) |
| Total | 117 (100.0%) | 100 (100.0%) |
Commute Time in Charlton
The most frequently occuring commute durations in Charlton are 15 to 19 minutes (109 commuters, 50.2%), 30 to 34 minutes (40 commuters, 18.4%), and 5 to 9 minutes (25 commuters, 11.5%).
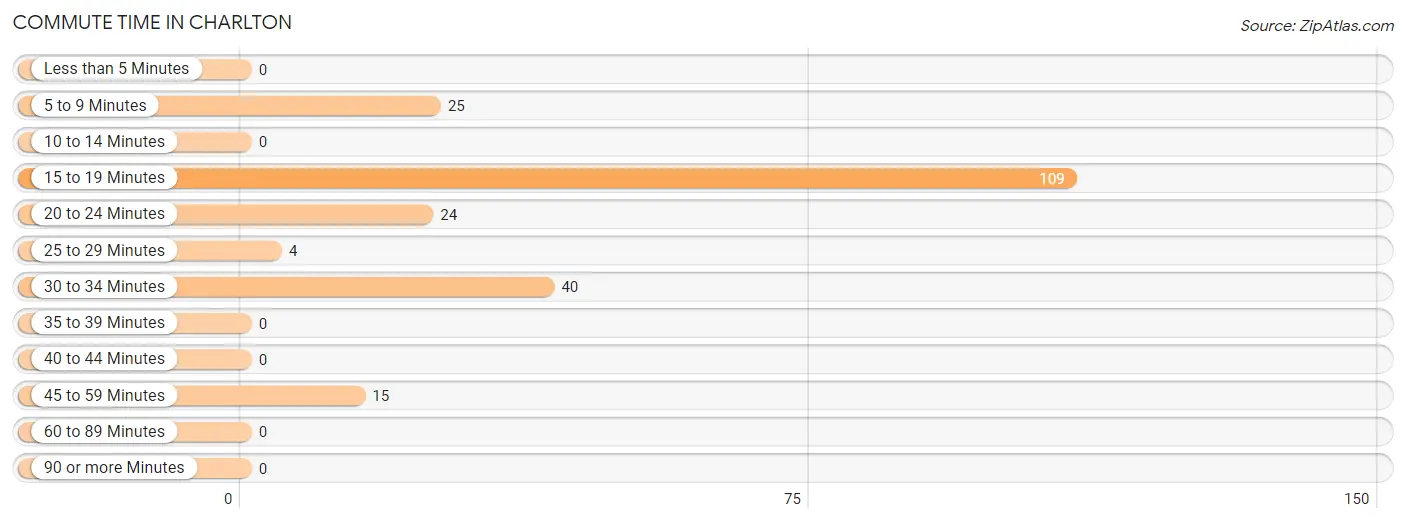
| Commute Time | # Commuters | % Commuters |
| Less than 5 Minutes | 0 | 0.0% |
| 5 to 9 Minutes | 25 | 11.5% |
| 10 to 14 Minutes | 0 | 0.0% |
| 15 to 19 Minutes | 109 | 50.2% |
| 20 to 24 Minutes | 24 | 11.1% |
| 25 to 29 Minutes | 4 | 1.8% |
| 30 to 34 Minutes | 40 | 18.4% |
| 35 to 39 Minutes | 0 | 0.0% |
| 40 to 44 Minutes | 0 | 0.0% |
| 45 to 59 Minutes | 15 | 6.9% |
| 60 to 89 Minutes | 0 | 0.0% |
| 90 or more Minutes | 0 | 0.0% |
Commute Time by Sex in Charlton
The most common commute times in Charlton are 15 to 19 minutes (53 commuters, 45.3%) for males and 15 to 19 minutes (56 commuters, 56.0%) for females.
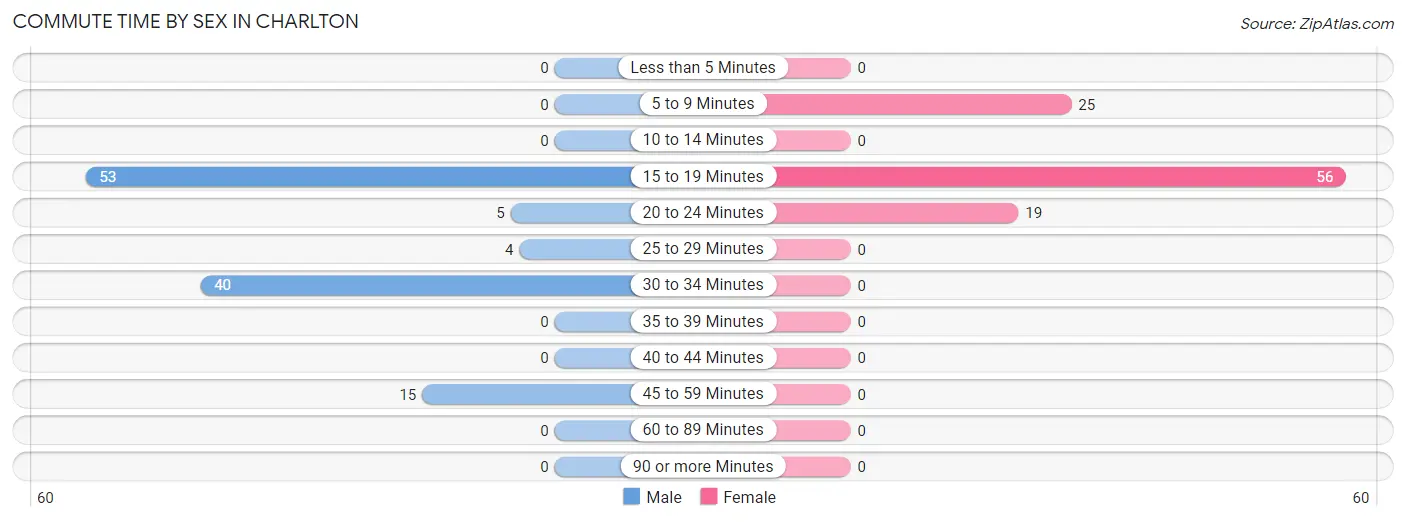
| Commute Time | Male | Female |
| Less than 5 Minutes | 0 (0.0%) | 0 (0.0%) |
| 5 to 9 Minutes | 0 (0.0%) | 25 (25.0%) |
| 10 to 14 Minutes | 0 (0.0%) | 0 (0.0%) |
| 15 to 19 Minutes | 53 (45.3%) | 56 (56.0%) |
| 20 to 24 Minutes | 5 (4.3%) | 19 (19.0%) |
| 25 to 29 Minutes | 4 (3.4%) | 0 (0.0%) |
| 30 to 34 Minutes | 40 (34.2%) | 0 (0.0%) |
| 35 to 39 Minutes | 0 (0.0%) | 0 (0.0%) |
| 40 to 44 Minutes | 0 (0.0%) | 0 (0.0%) |
| 45 to 59 Minutes | 15 (12.8%) | 0 (0.0%) |
| 60 to 89 Minutes | 0 (0.0%) | 0 (0.0%) |
| 90 or more Minutes | 0 (0.0%) | 0 (0.0%) |
Time of Departure to Work by Sex in Charlton
The most frequent times of departure to work in Charlton are 8:30 AM to 8:59 AM (53, 45.3%) for males and 7:30 AM to 7:59 AM (71, 71.0%) for females.
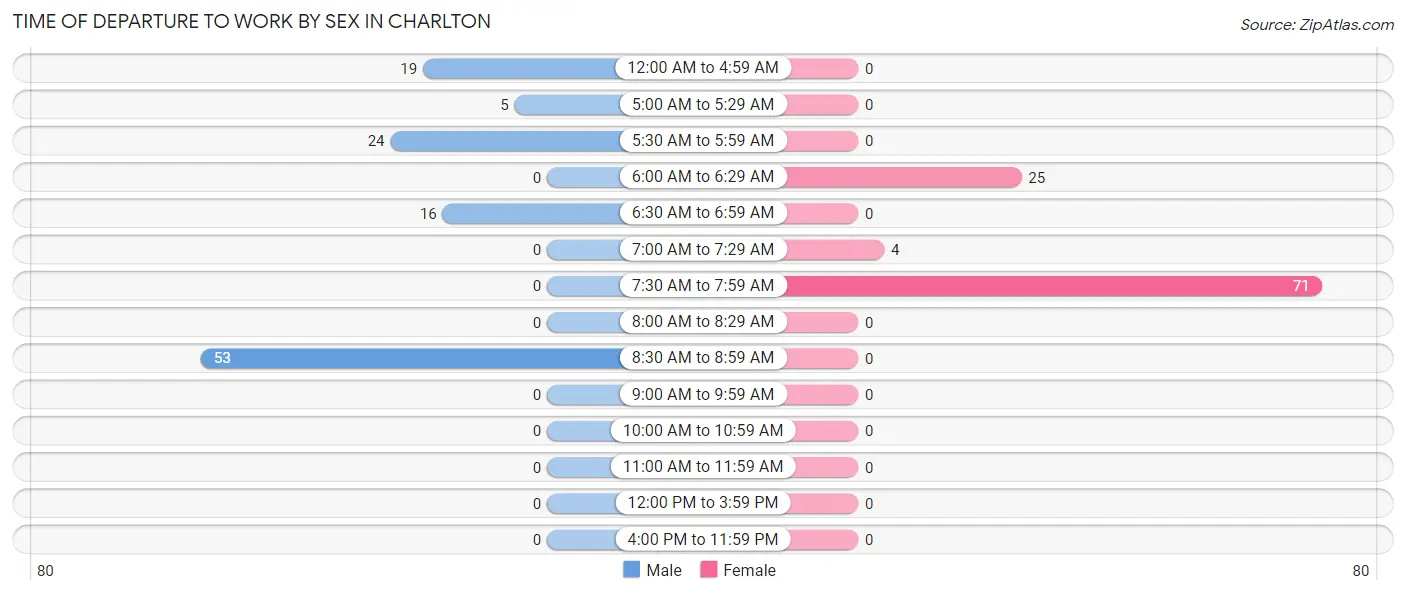
| Time of Departure | Male | Female |
| 12:00 AM to 4:59 AM | 19 (16.2%) | 0 (0.0%) |
| 5:00 AM to 5:29 AM | 5 (4.3%) | 0 (0.0%) |
| 5:30 AM to 5:59 AM | 24 (20.5%) | 0 (0.0%) |
| 6:00 AM to 6:29 AM | 0 (0.0%) | 25 (25.0%) |
| 6:30 AM to 6:59 AM | 16 (13.7%) | 0 (0.0%) |
| 7:00 AM to 7:29 AM | 0 (0.0%) | 4 (4.0%) |
| 7:30 AM to 7:59 AM | 0 (0.0%) | 71 (71.0%) |
| 8:00 AM to 8:29 AM | 0 (0.0%) | 0 (0.0%) |
| 8:30 AM to 8:59 AM | 53 (45.3%) | 0 (0.0%) |
| 9:00 AM to 9:59 AM | 0 (0.0%) | 0 (0.0%) |
| 10:00 AM to 10:59 AM | 0 (0.0%) | 0 (0.0%) |
| 11:00 AM to 11:59 AM | 0 (0.0%) | 0 (0.0%) |
| 12:00 PM to 3:59 PM | 0 (0.0%) | 0 (0.0%) |
| 4:00 PM to 11:59 PM | 0 (0.0%) | 0 (0.0%) |
| Total | 117 (100.0%) | 100 (100.0%) |
Housing Occupancy in Charlton
Occupancy by Ownership in Charlton
Of the total 96 dwellings in Charlton, owner-occupied units account for 96 (100.0%), while renter-occupied units make up 0 (0.0%).
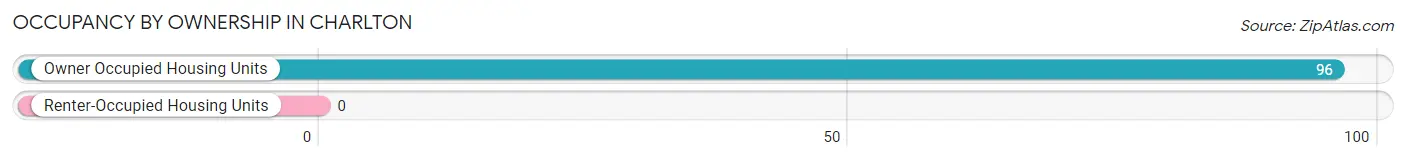
| Occupancy | # Housing Units | % Housing Units |
| Owner Occupied Housing Units | 96 | 100.0% |
| Renter-Occupied Housing Units | 0 | 0.0% |
| Total Occupied Housing Units | 96 | 100.0% |
Occupancy by Household Size in Charlton
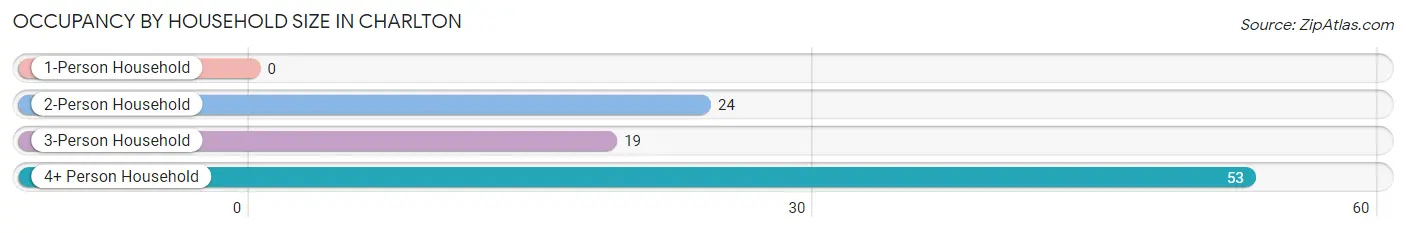
| Household Size | # Housing Units | % Housing Units |
| 1-Person Household | 0 | 0.0% |
| 2-Person Household | 24 | 25.0% |
| 3-Person Household | 19 | 19.8% |
| 4+ Person Household | 53 | 55.2% |
| Total Housing Units | 96 | 100.0% |
Occupancy by Ownership by Household Size in Charlton
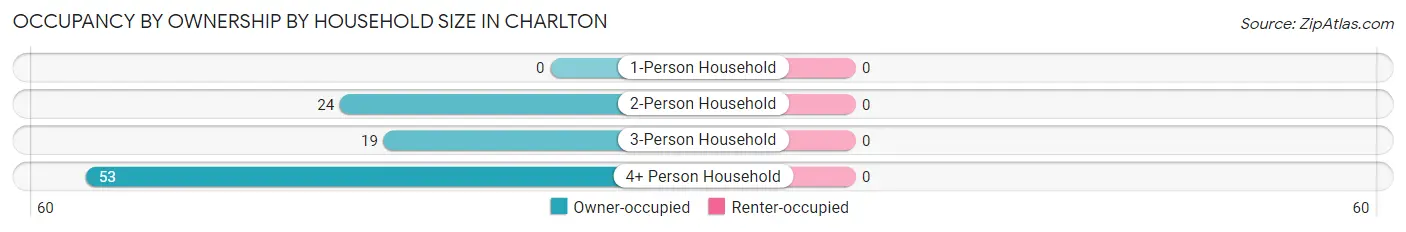
| Household Size | Owner-occupied | Renter-occupied |
| 1-Person Household | 0 (0.0%) | 0 (0.0%) |
| 2-Person Household | 24 (100.0%) | 0 (0.0%) |
| 3-Person Household | 19 (100.0%) | 0 (0.0%) |
| 4+ Person Household | 53 (100.0%) | 0 (0.0%) |
| Total Housing Units | 96 (100.0%) | 0 (0.0%) |
Occupancy by Educational Attainment in Charlton
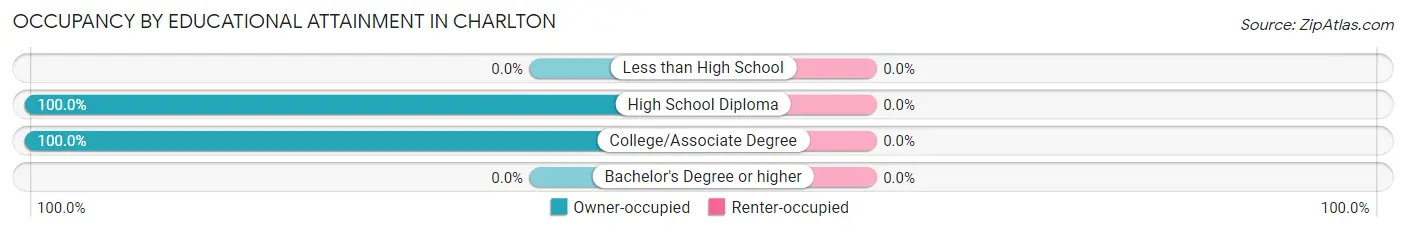
| Household Size | Owner-occupied | Renter-occupied |
| Less than High School | 0 (0.0%) | 0 (0.0%) |
| High School Diploma | 19 (100.0%) | 0 (0.0%) |
| College/Associate Degree | 77 (100.0%) | 0 (0.0%) |
| Bachelor's Degree or higher | 0 (0.0%) | 0 (0.0%) |
Occupancy by Age of Householder in Charlton
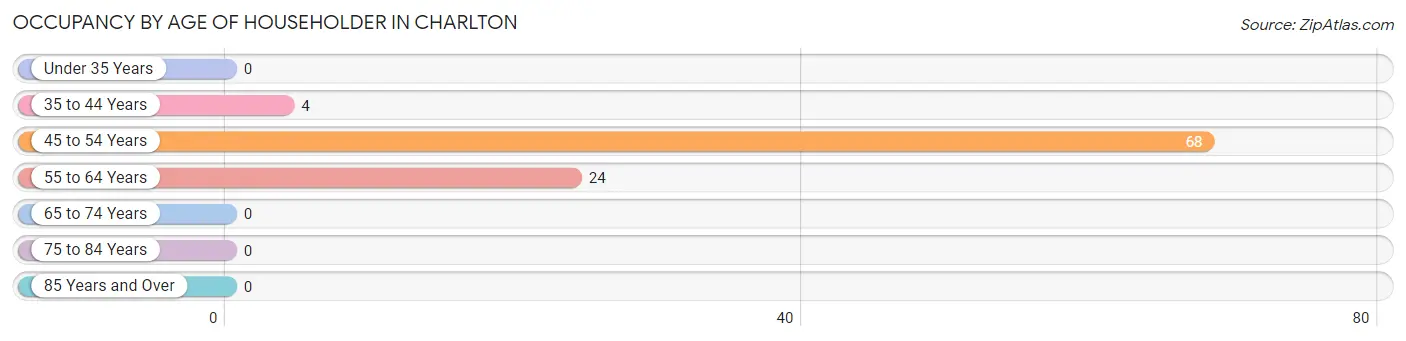
| Age Bracket | # Households | % Households |
| Under 35 Years | 0 | 0.0% |
| 35 to 44 Years | 4 | 4.2% |
| 45 to 54 Years | 68 | 70.8% |
| 55 to 64 Years | 24 | 25.0% |
| 65 to 74 Years | 0 | 0.0% |
| 75 to 84 Years | 0 | 0.0% |
| 85 Years and Over | 0 | 0.0% |
| Total | 96 | 100.0% |
Housing Finances in Charlton
Median Income by Occupancy in Charlton
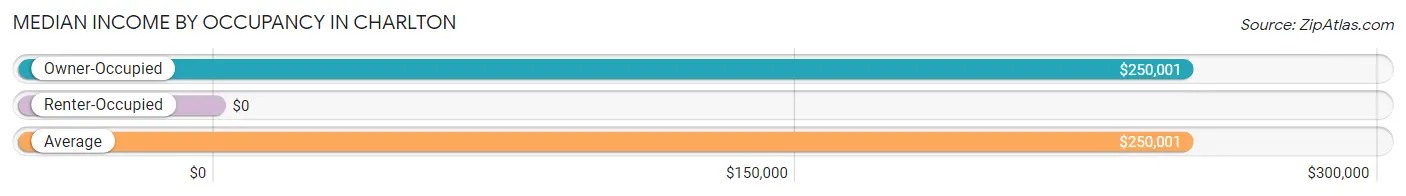
| Occupancy Type | # Households | Median Income |
| Owner-Occupied | 96 (100.0%) | $250,001 |
| Renter-Occupied | 0 (0.0%) | $0 |
| Average | 96 (100.0%) | $250,001 |
Occupancy by Householder Income Bracket in Charlton
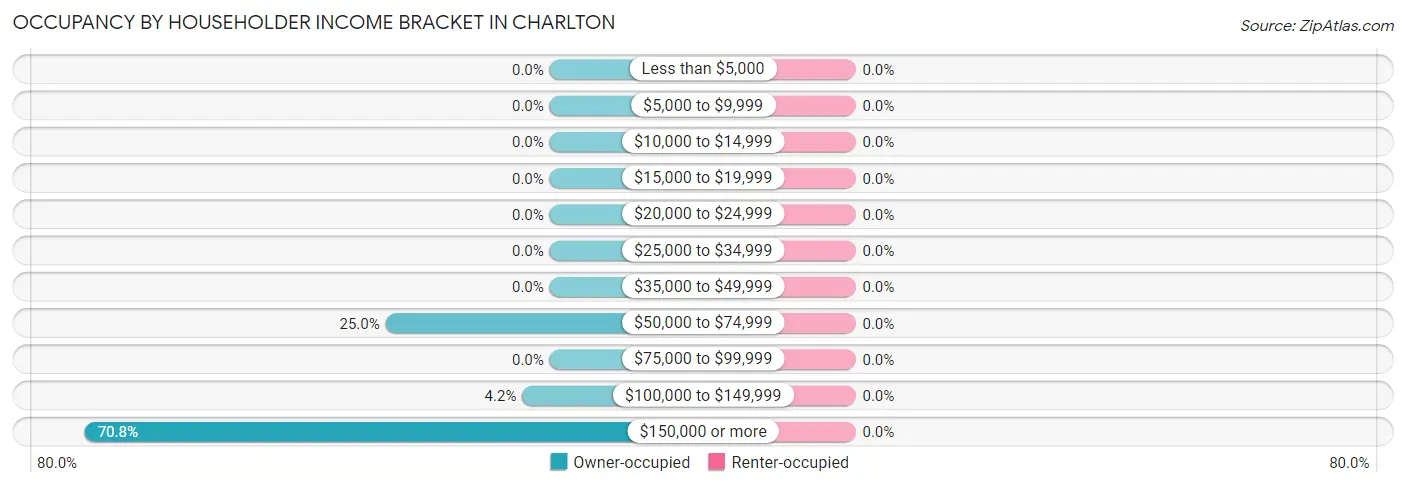
| Income Bracket | Owner-occupied | Renter-occupied |
| Less than $5,000 | 0 (0.0%) | 0 (0.0%) |
| $5,000 to $9,999 | 0 (0.0%) | 0 (0.0%) |
| $10,000 to $14,999 | 0 (0.0%) | 0 (0.0%) |
| $15,000 to $19,999 | 0 (0.0%) | 0 (0.0%) |
| $20,000 to $24,999 | 0 (0.0%) | 0 (0.0%) |
| $25,000 to $34,999 | 0 (0.0%) | 0 (0.0%) |
| $35,000 to $49,999 | 0 (0.0%) | 0 (0.0%) |
| $50,000 to $74,999 | 24 (25.0%) | 0 (0.0%) |
| $75,000 to $99,999 | 0 (0.0%) | 0 (0.0%) |
| $100,000 to $149,999 | 4 (4.2%) | 0 (0.0%) |
| $150,000 or more | 68 (70.8%) | 0 (0.0%) |
| Total | 96 (100.0%) | 0 (0.0%) |
Monthly Housing Cost Tiers in Charlton
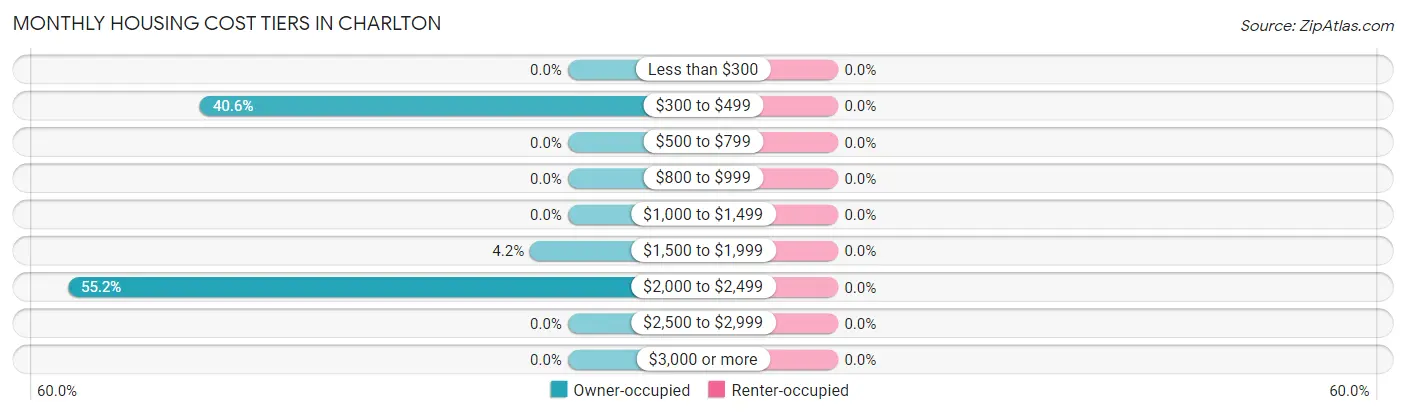
| Monthly Cost | Owner-occupied | Renter-occupied |
| Less than $300 | 0 (0.0%) | 0 (0.0%) |
| $300 to $499 | 39 (40.6%) | 0 (0.0%) |
| $500 to $799 | 0 (0.0%) | 0 (0.0%) |
| $800 to $999 | 0 (0.0%) | 0 (0.0%) |
| $1,000 to $1,499 | 0 (0.0%) | 0 (0.0%) |
| $1,500 to $1,999 | 4 (4.2%) | 0 (0.0%) |
| $2,000 to $2,499 | 53 (55.2%) | 0 (0.0%) |
| $2,500 to $2,999 | 0 (0.0%) | 0 (0.0%) |
| $3,000 or more | 0 (0.0%) | 0 (0.0%) |
| Total | 96 (100.0%) | 0 (0.0%) |
Physical Housing Characteristics in Charlton
Housing Structures in Charlton
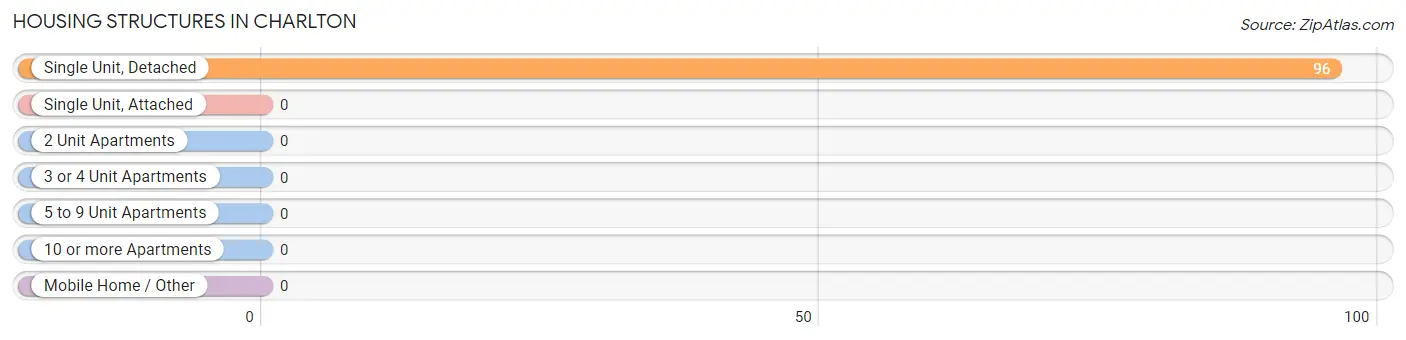
| Structure Type | # Housing Units | % Housing Units |
| Single Unit, Detached | 96 | 100.0% |
| Single Unit, Attached | 0 | 0.0% |
| 2 Unit Apartments | 0 | 0.0% |
| 3 or 4 Unit Apartments | 0 | 0.0% |
| 5 to 9 Unit Apartments | 0 | 0.0% |
| 10 or more Apartments | 0 | 0.0% |
| Mobile Home / Other | 0 | 0.0% |
| Total | 96 | 100.0% |
Housing Structures by Occupancy in Charlton
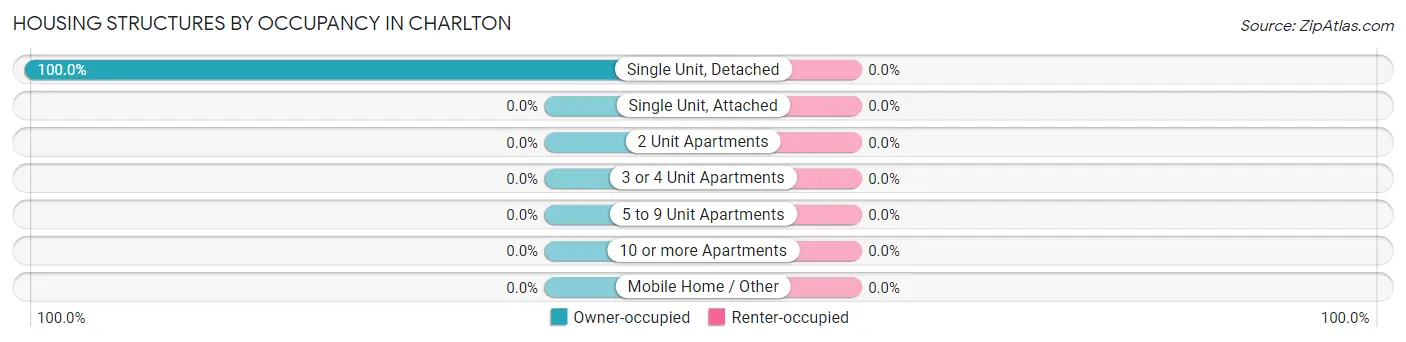
| Structure Type | Owner-occupied | Renter-occupied |
| Single Unit, Detached | 96 (100.0%) | 0 (0.0%) |
| Single Unit, Attached | 0 (0.0%) | 0 (0.0%) |
| 2 Unit Apartments | 0 (0.0%) | 0 (0.0%) |
| 3 or 4 Unit Apartments | 0 (0.0%) | 0 (0.0%) |
| 5 to 9 Unit Apartments | 0 (0.0%) | 0 (0.0%) |
| 10 or more Apartments | 0 (0.0%) | 0 (0.0%) |
| Mobile Home / Other | 0 (0.0%) | 0 (0.0%) |
| Total | 96 (100.0%) | 0 (0.0%) |
Housing Structures by Number of Rooms in Charlton
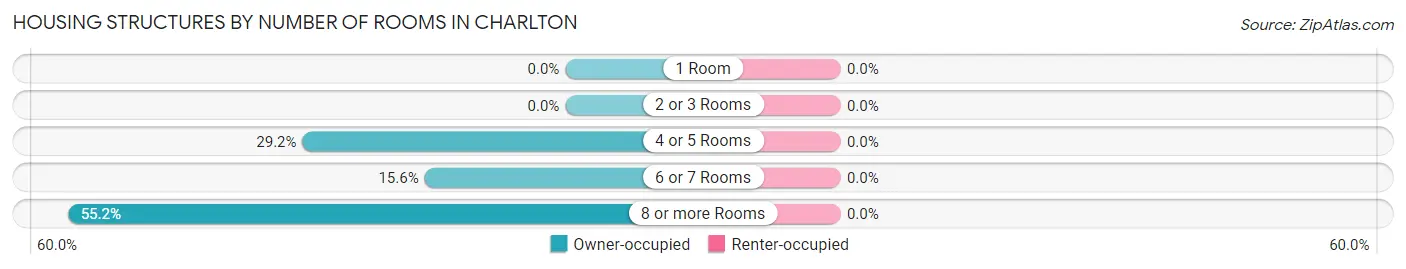
| Number of Rooms | Owner-occupied | Renter-occupied |
| 1 Room | 0 (0.0%) | 0 (0.0%) |
| 2 or 3 Rooms | 0 (0.0%) | 0 (0.0%) |
| 4 or 5 Rooms | 28 (29.2%) | 0 (0.0%) |
| 6 or 7 Rooms | 15 (15.6%) | 0 (0.0%) |
| 8 or more Rooms | 53 (55.2%) | 0 (0.0%) |
| Total | 96 (100.0%) | 0 (0.0%) |
Housing Structure by Heating Type in Charlton
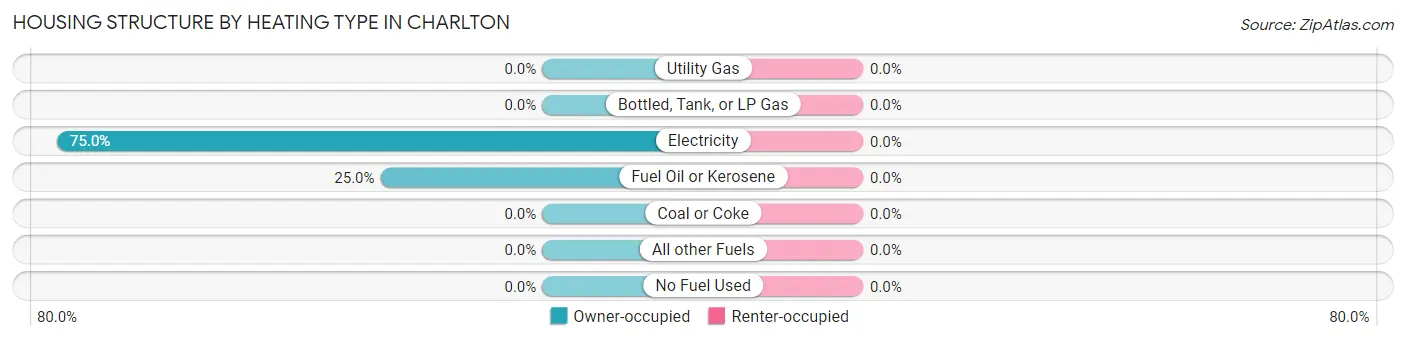
| Heating Type | Owner-occupied | Renter-occupied |
| Utility Gas | 0 (0.0%) | 0 (0.0%) |
| Bottled, Tank, or LP Gas | 0 (0.0%) | 0 (0.0%) |
| Electricity | 72 (75.0%) | 0 (0.0%) |
| Fuel Oil or Kerosene | 24 (25.0%) | 0 (0.0%) |
| Coal or Coke | 0 (0.0%) | 0 (0.0%) |
| All other Fuels | 0 (0.0%) | 0 (0.0%) |
| No Fuel Used | 0 (0.0%) | 0 (0.0%) |
| Total | 96 (100.0%) | 0 (0.0%) |
Household Vehicle Usage in Charlton
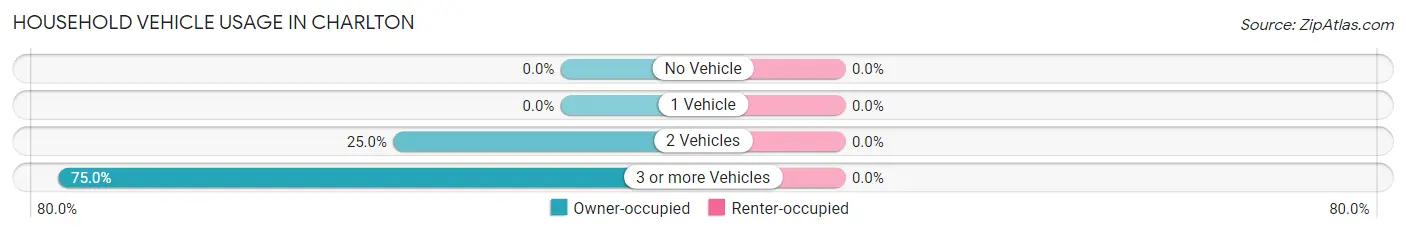
| Vehicles per Household | Owner-occupied | Renter-occupied |
| No Vehicle | 0 (0.0%) | 0 (0.0%) |
| 1 Vehicle | 0 (0.0%) | 0 (0.0%) |
| 2 Vehicles | 24 (25.0%) | 0 (0.0%) |
| 3 or more Vehicles | 72 (75.0%) | 0 (0.0%) |
| Total | 96 (100.0%) | 0 (0.0%) |
Real Estate & Mortgages in Charlton
Real Estate and Mortgage Overview in Charlton
| Characteristic | Without Mortgage | With Mortgage |
| Housing Units | 39 | 57 |
| Median Property Value | - | - |
| Median Household Income | - | - |
| Monthly Housing Costs | - | - |
| Real Estate Taxes | - | - |
Property Value by Mortgage Status in Charlton
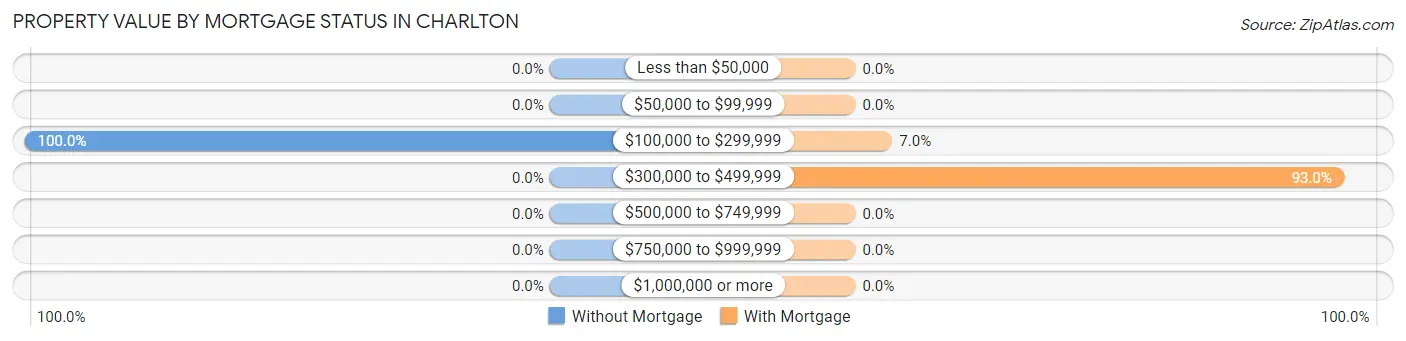
| Property Value | Without Mortgage | With Mortgage |
| Less than $50,000 | 0 (0.0%) | 0 (0.0%) |
| $50,000 to $99,999 | 0 (0.0%) | 0 (0.0%) |
| $100,000 to $299,999 | 39 (100.0%) | 4 (7.0%) |
| $300,000 to $499,999 | 0 (0.0%) | 53 (93.0%) |
| $500,000 to $749,999 | 0 (0.0%) | 0 (0.0%) |
| $750,000 to $999,999 | 0 (0.0%) | 0 (0.0%) |
| $1,000,000 or more | 0 (0.0%) | 0 (0.0%) |
| Total | 39 (100.0%) | 57 (100.0%) |
Household Income by Mortgage Status in Charlton
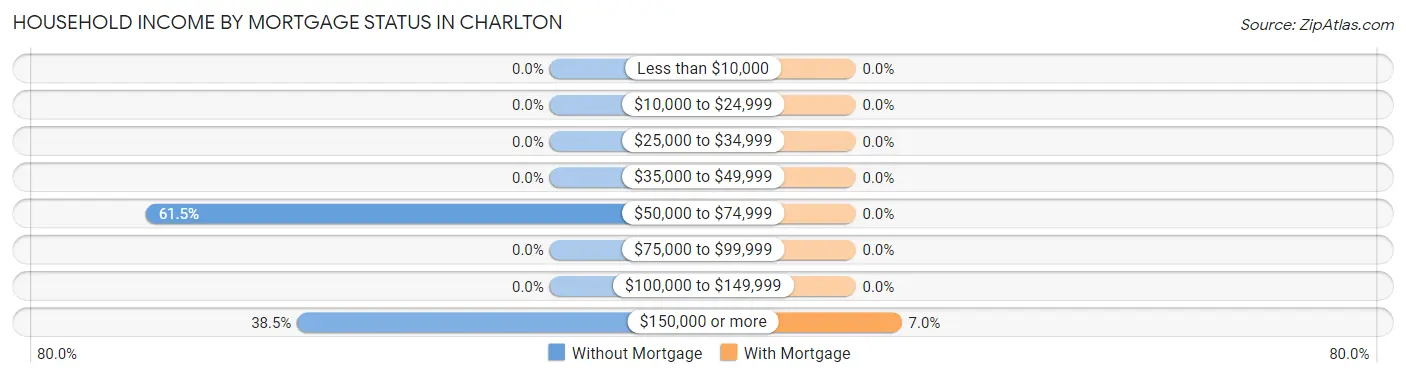
| Household Income | Without Mortgage | With Mortgage |
| Less than $10,000 | 0 (0.0%) | 0 (0.0%) |
| $10,000 to $24,999 | 0 (0.0%) | 0 (0.0%) |
| $25,000 to $34,999 | 0 (0.0%) | 0 (0.0%) |
| $35,000 to $49,999 | 0 (0.0%) | 0 (0.0%) |
| $50,000 to $74,999 | 24 (61.5%) | 0 (0.0%) |
| $75,000 to $99,999 | 0 (0.0%) | 0 (0.0%) |
| $100,000 to $149,999 | 0 (0.0%) | 0 (0.0%) |
| $150,000 or more | 15 (38.5%) | 4 (7.0%) |
| Total | 39 (100.0%) | 57 (100.0%) |
Property Value to Household Income Ratio in Charlton
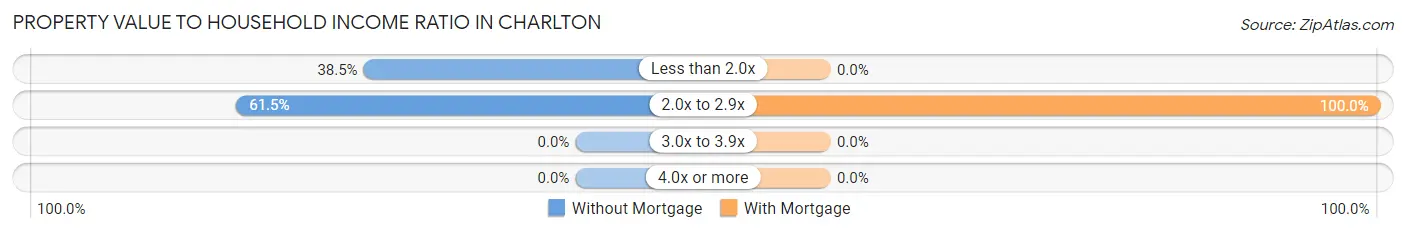
| Value-to-Income Ratio | Without Mortgage | With Mortgage |
| Less than 2.0x | 15 (38.5%) | 0 (0.0%) |
| 2.0x to 2.9x | 24 (61.5%) | 57 (100.0%) |
| 3.0x to 3.9x | 0 (0.0%) | 0 (0.0%) |
| 4.0x or more | 0 (0.0%) | 0 (0.0%) |
| Total | 39 (100.0%) | 57 (100.0%) |
Real Estate Taxes by Mortgage Status in Charlton
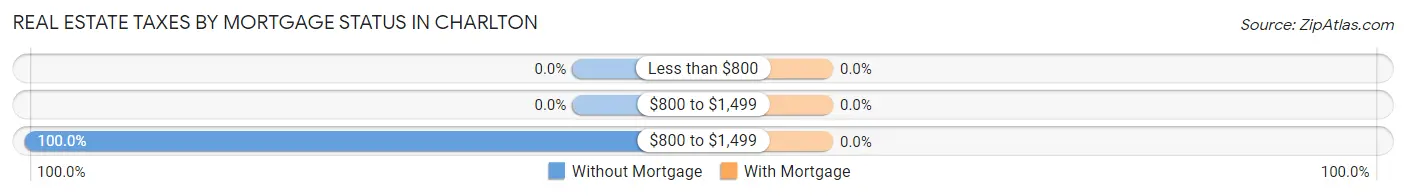
| Property Taxes | Without Mortgage | With Mortgage |
| Less than $800 | 0 (0.0%) | 0 (0.0%) |
| $800 to $1,499 | 0 (0.0%) | 0 (0.0%) |
| $800 to $1,499 | 39 (100.0%) | 0 (0.0%) |
| Total | 39 (100.0%) | 57 (100.0%) |
Health & Disability in Charlton
Health Insurance Coverage by Age in Charlton
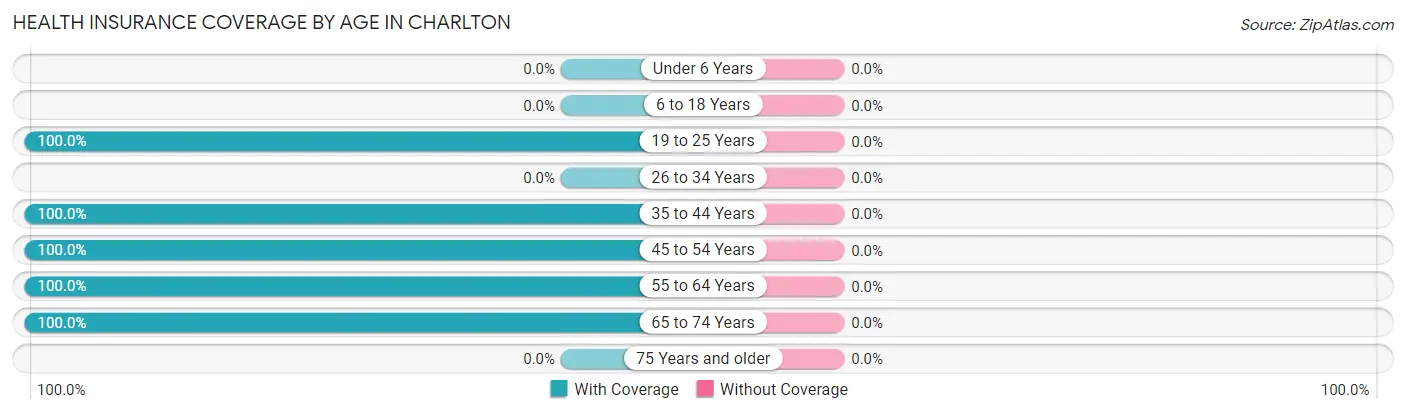
| Age Bracket | With Coverage | Without Coverage |
| Under 6 Years | 0 (0.0%) | 0 (0.0%) |
| 6 to 18 Years | 0 (0.0%) | 0 (0.0%) |
| 19 to 25 Years | 76 (100.0%) | 0 (0.0%) |
| 26 to 34 Years | 0 (0.0%) | 0 (0.0%) |
| 35 to 44 Years | 4 (100.0%) | 0 (0.0%) |
| 45 to 54 Years | 144 (100.0%) | 0 (0.0%) |
| 55 to 64 Years | 49 (100.0%) | 0 (0.0%) |
| 65 to 74 Years | 50 (100.0%) | 0 (0.0%) |
| 75 Years and older | 0 (0.0%) | 0 (0.0%) |
| Total | 323 (100.0%) | 0 (0.0%) |
Health Insurance Coverage by Citizenship Status in Charlton
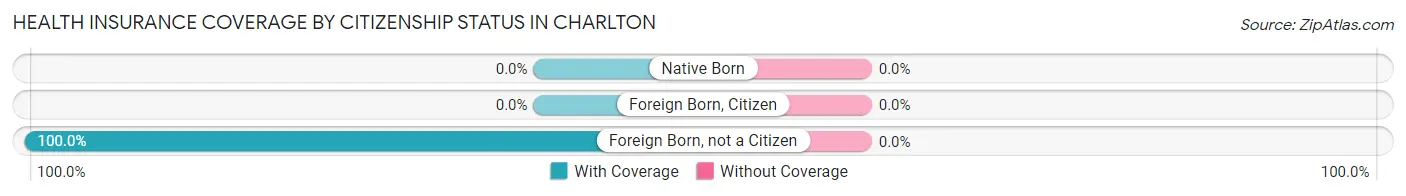
| Citizenship Status | With Coverage | Without Coverage |
| Native Born | 0 (0.0%) | 0 (0.0%) |
| Foreign Born, Citizen | 0 (0.0%) | 0 (0.0%) |
| Foreign Born, not a Citizen | 76 (100.0%) | 0 (0.0%) |
Health Insurance Coverage by Household Income in Charlton
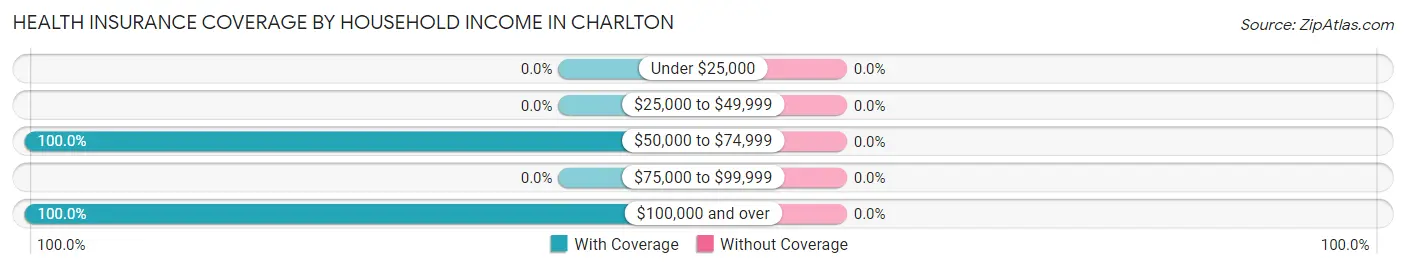
| Household Income | With Coverage | Without Coverage |
| Under $25,000 | 0 (0.0%) | 0 (0.0%) |
| $25,000 to $49,999 | 0 (0.0%) | 0 (0.0%) |
| $50,000 to $74,999 | 49 (100.0%) | 0 (0.0%) |
| $75,000 to $99,999 | 0 (0.0%) | 0 (0.0%) |
| $100,000 and over | 274 (100.0%) | 0 (0.0%) |
Public vs Private Health Insurance Coverage by Age in Charlton
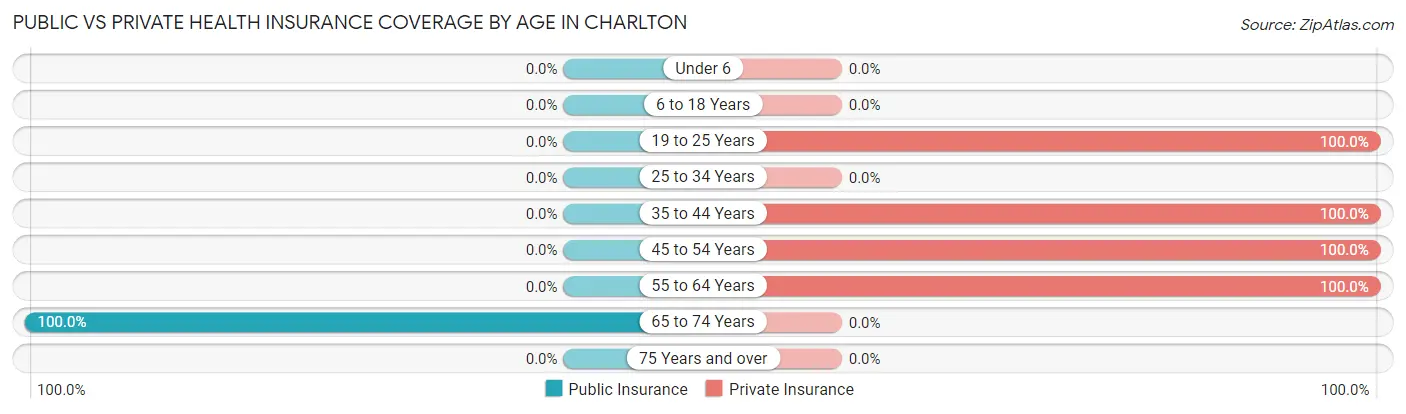
| Age Bracket | Public Insurance | Private Insurance |
| Under 6 | 0 (0.0%) | 0 (0.0%) |
| 6 to 18 Years | 0 (0.0%) | 0 (0.0%) |
| 19 to 25 Years | 0 (0.0%) | 76 (100.0%) |
| 25 to 34 Years | 0 (0.0%) | 0 (0.0%) |
| 35 to 44 Years | 0 (0.0%) | 4 (100.0%) |
| 45 to 54 Years | 0 (0.0%) | 144 (100.0%) |
| 55 to 64 Years | 0 (0.0%) | 49 (100.0%) |
| 65 to 74 Years | 50 (100.0%) | 0 (0.0%) |
| 75 Years and over | 0 (0.0%) | 0 (0.0%) |
| Total | 50 (15.5%) | 273 (84.5%) |
Disability Status by Sex by Age in Charlton
| Age Bracket | Male | Female |
| Under 5 Years | 0 (0.0%) | 0 (0.0%) |
| 5 to 17 Years | 0 (0.0%) | 0 (0.0%) |
| 18 to 34 Years | 0 (0.0%) | 0 (0.0%) |
| 35 to 64 Years | 0 (0.0%) | 0 (0.0%) |
| 65 to 74 Years | 0 (0.0%) | 0 (0.0%) |
| 75 Years and over | 0 (0.0%) | 0 (0.0%) |
Disability Class by Sex by Age in Charlton
Disability Class: Hearing Difficulty
| Age Bracket | Male | Female |
| Under 5 Years | 0 (0.0%) | 0 (0.0%) |
| 5 to 17 Years | 0 (0.0%) | 0 (0.0%) |
| 18 to 34 Years | 0 (0.0%) | 0 (0.0%) |
| 35 to 64 Years | 0 (0.0%) | 0 (0.0%) |
| 65 to 74 Years | 0 (0.0%) | 0 (0.0%) |
| 75 Years and over | 0 (0.0%) | 0 (0.0%) |
Disability Class: Vision Difficulty
| Age Bracket | Male | Female |
| Under 5 Years | 0 (0.0%) | 0 (0.0%) |
| 5 to 17 Years | 0 (0.0%) | 0 (0.0%) |
| 18 to 34 Years | 0 (0.0%) | 0 (0.0%) |
| 35 to 64 Years | 0 (0.0%) | 0 (0.0%) |
| 65 to 74 Years | 0 (0.0%) | 0 (0.0%) |
| 75 Years and over | 0 (0.0%) | 0 (0.0%) |
Disability Class: Cognitive Difficulty
| Age Bracket | Male | Female |
| 5 to 17 Years | 0 (0.0%) | 0 (0.0%) |
| 18 to 34 Years | 0 (0.0%) | 0 (0.0%) |
| 35 to 64 Years | 0 (0.0%) | 0 (0.0%) |
| 65 to 74 Years | 0 (0.0%) | 0 (0.0%) |
| 75 Years and over | 0 (0.0%) | 0 (0.0%) |
Disability Class: Ambulatory Difficulty
| Age Bracket | Male | Female |
| 5 to 17 Years | 0 (0.0%) | 0 (0.0%) |
| 18 to 34 Years | 0 (0.0%) | 0 (0.0%) |
| 35 to 64 Years | 0 (0.0%) | 0 (0.0%) |
| 65 to 74 Years | 0 (0.0%) | 0 (0.0%) |
| 75 Years and over | 0 (0.0%) | 0 (0.0%) |
Disability Class: Self-Care Difficulty
| Age Bracket | Male | Female |
| 5 to 17 Years | 0 (0.0%) | 0 (0.0%) |
| 18 to 34 Years | 0 (0.0%) | 0 (0.0%) |
| 35 to 64 Years | 0 (0.0%) | 0 (0.0%) |
| 65 to 74 Years | 0 (0.0%) | 0 (0.0%) |
| 75 Years and over | 0 (0.0%) | 0 (0.0%) |
Technology Access in Charlton
Computing Device Access in Charlton
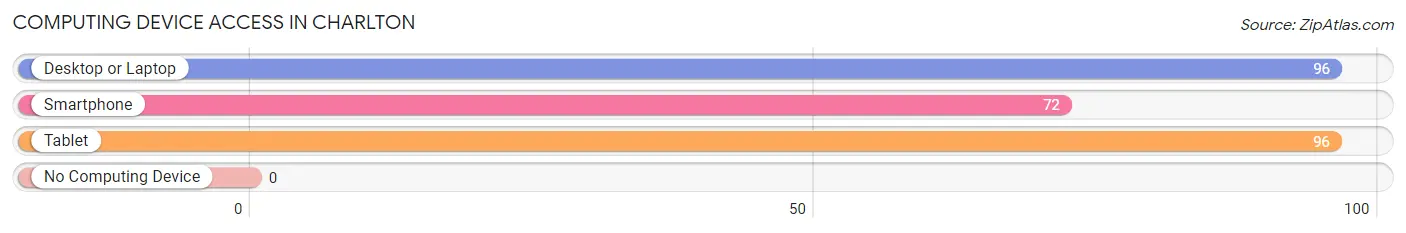
| Device Type | # Households | % Households |
| Desktop or Laptop | 96 | 100.0% |
| Smartphone | 72 | 75.0% |
| Tablet | 96 | 100.0% |
| No Computing Device | 0 | 0.0% |
| Total | 96 | 100.0% |
Internet Access in Charlton
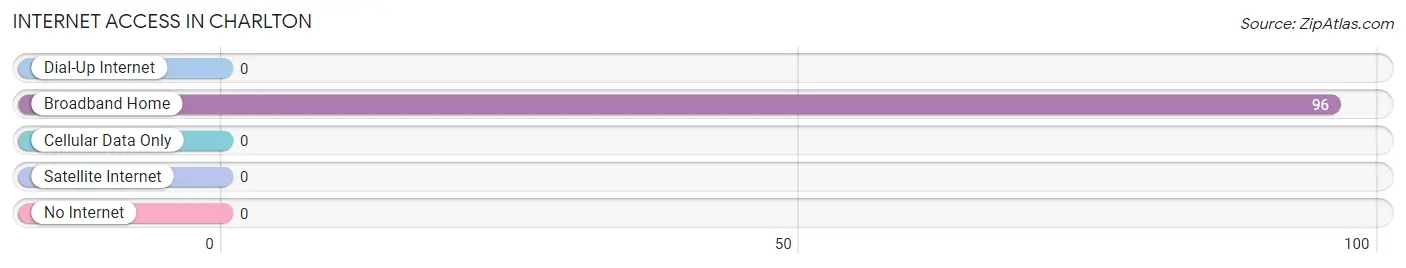
| Internet Type | # Households | % Households |
| Dial-Up Internet | 0 | 0.0% |
| Broadband Home | 96 | 100.0% |
| Cellular Data Only | 0 | 0.0% |
| Satellite Internet | 0 | 0.0% |
| No Internet | 0 | 0.0% |
| Total | 96 | 100.0% |
Charlton Summary
Charlton, Maryland is a small town located in Charles County, Maryland. It is situated on the banks of the Potomac River, approximately 25 miles south of Washington, D.C. The town has a population of approximately 1,000 people and is part of the Washington Metropolitan Area.
Geography
Charlton is located in the southern part of Charles County, Maryland. It is situated on the banks of the Potomac River, approximately 25 miles south of Washington, D.C. The town is bordered by the towns of La Plata, Hughesville, and Bryantown. The town is located in a rural area and is surrounded by farmland and wooded areas. The town is located in a humid subtropical climate zone, with hot, humid summers and mild winters.
History
Charlton was first settled in the early 1700s by English settlers. The town was originally known as “Charlestown” and was named after Charles Calvert, the third Lord Baltimore. The town was incorporated in 1872 and was named after the Calvert family. The town was a small farming community until the 1950s, when it began to experience rapid growth due to its proximity to Washington, D.C.
Economy
The economy of Charlton is largely based on agriculture and tourism. The town is home to several farms, which produce a variety of crops, including corn, soybeans, wheat, and hay. The town is also home to several wineries, which produce a variety of wines. The town is also home to several small businesses, including restaurants, shops, and other services.
Demographics
As of the 2010 census, the population of Charlton was 1,000 people. The racial makeup of the town was 94.2% White, 2.2% African American, 0.2% Native American, 0.8% Asian, 0.2% from other races, and 2.4% from two or more races. The median household income was $60,000, and the median family income was $68,000. The per capita income was $25,000.
Conclusion
Charlton, Maryland is a small town located in Charles County, Maryland. It is situated on the banks of the Potomac River, approximately 25 miles south of Washington, D.C. The town has a population of approximately 1,000 people and is part of the Washington Metropolitan Area. The economy of Charlton is largely based on agriculture and tourism. The town is home to several farms, which produce a variety of crops, and several wineries, which produce a variety of wines. The town is also home to several small businesses, including restaurants, shops, and other services. The racial makeup of the town is 94.2% White, 2.2% African American, 0.2% Native American, 0.8% Asian, 0.2% from other races, and 2.4% from two or more races. The median household income was $60,000, and the median family income was $68,000. The per capita income was $25,000.
Common Questions
What is Per Capita Income in Charlton?
Per Capita income in Charlton is $64,039.
What is the Median Family Income in Charlton?
Median Family Income in Charlton is $250,001.
What is the Median Household income in Charlton?
Median Household Income in Charlton is $250,001.
What is Inequality or Gini Index in Charlton?
Inequality or Gini Index in Charlton is 0.23.
What is the Total Population of Charlton?
Total Population of Charlton is 323.
What is the Total Male Population of Charlton?
Total Male Population of Charlton is 173.
What is the Total Female Population of Charlton?
Total Female Population of Charlton is 150.
What is the Ratio of Males per 100 Females in Charlton?
There are 115.33 Males per 100 Females in Charlton.
What is the Ratio of Females per 100 Males in Charlton?
There are 86.71 Females per 100 Males in Charlton.
What is the Median Population Age in Charlton?
Median Population Age in Charlton is 47.5 Years.
What is the Average Family Size in Charlton
Average Family Size in Charlton is 3.3 People.
What is the Average Household Size in Charlton
Average Household Size in Charlton is 3.4 People.
How Large is the Labor Force in Charlton?
There are 217 People in the Labor Forcein in Charlton.
What is the Percentage of People in the Labor Force in Charlton?
67.2% of People are in the Labor Force in Charlton.