Kent Narrows, MD Map & Demographics
Kent Narrows Map
Kent Narrows Overview
$91,376
PER CAPITA INCOME
$128,073
AVG FAMILY INCOME
$127,760
AVG HOUSEHOLD INCOME
77.9%
WAGE / INCOME GAP [ % ]
22.1¢/ $1
WAGE / INCOME GAP [ $ ]
0.43
INEQUALITY / GINI INDEX
578
TOTAL POPULATION
313
MALE POPULATION
265
FEMALE POPULATION
118.11
MALES / 100 FEMALES
84.66
FEMALES / 100 MALES
66.5
MEDIAN AGE
2.4
AVG FAMILY SIZE
1.9
AVG HOUSEHOLD SIZE
246
LABOR FORCE [ PEOPLE ]
47.8%
PERCENT IN LABOR FORCE
Income in Kent Narrows
Income Overview in Kent Narrows
Per Capita Income in Kent Narrows is $91,376, while median incomes of families and households are $128,073 and $127,760 respectively.
| Characteristic | Number | Measure |
| Per Capita Income | 578 | $91,376 |
| Median Family Income | 191 | $128,073 |
| Mean Family Income | 191 | $174,831 |
| Median Household Income | 297 | $127,760 |
| Mean Household Income | 297 | $174,952 |
| Income Deficit | 191 | $0 |
| Wage / Income Gap (%) | 578 | 77.92% |
| Wage / Income Gap ($) | 578 | 22.08¢ per $1 |
| Gini / Inequality Index | 578 | 0.43 |
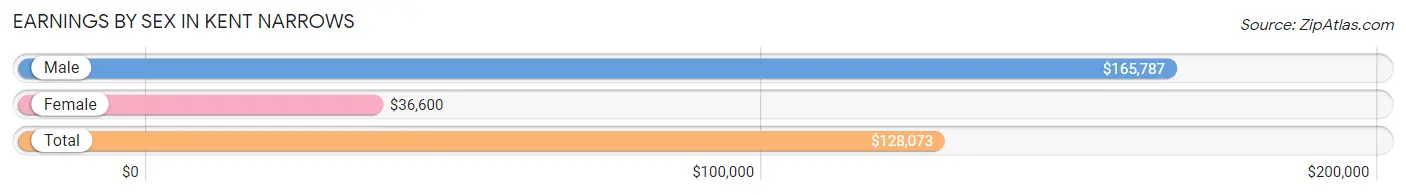
Earnings by Sex in Kent Narrows
Average Earnings in Kent Narrows are $128,073, $165,787 for men and $36,600 for women, a difference of 77.9%.
| Sex | Number | Average Earnings |
| Male | 161 (63.1%) | $165,787 |
| Female | 94 (36.9%) | $36,600 |
| Total | 255 (100.0%) | $128,073 |
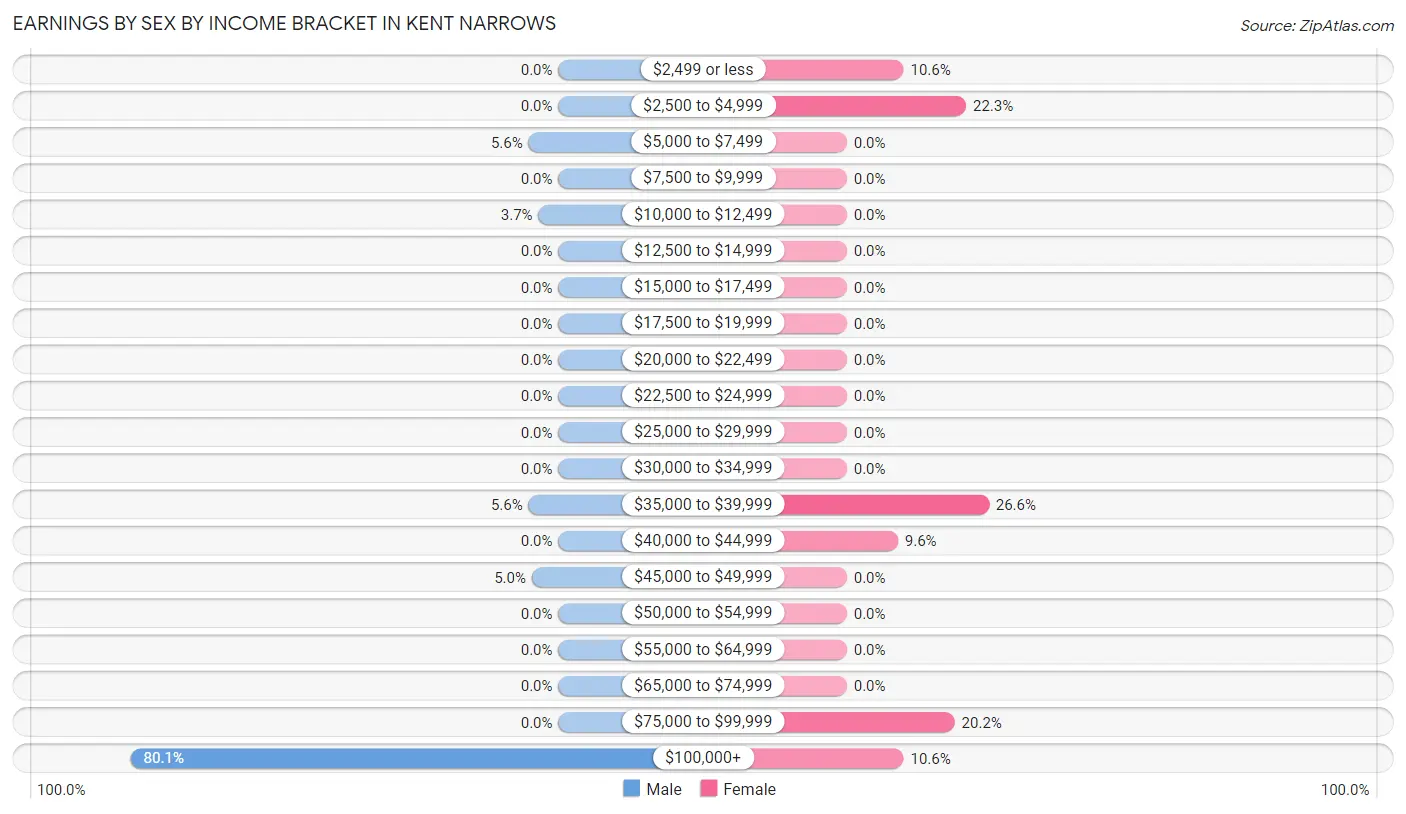
Earnings by Sex by Income Bracket in Kent Narrows
The most common earnings brackets in Kent Narrows are $100,000+ for men (129 | 80.1%) and $35,000 to $39,999 for women (25 | 26.6%).
| Income | Male | Female |
| $2,499 or less | 0 (0.0%) | 10 (10.6%) |
| $2,500 to $4,999 | 0 (0.0%) | 21 (22.3%) |
| $5,000 to $7,499 | 9 (5.6%) | 0 (0.0%) |
| $7,500 to $9,999 | 0 (0.0%) | 0 (0.0%) |
| $10,000 to $12,499 | 6 (3.7%) | 0 (0.0%) |
| $12,500 to $14,999 | 0 (0.0%) | 0 (0.0%) |
| $15,000 to $17,499 | 0 (0.0%) | 0 (0.0%) |
| $17,500 to $19,999 | 0 (0.0%) | 0 (0.0%) |
| $20,000 to $22,499 | 0 (0.0%) | 0 (0.0%) |
| $22,500 to $24,999 | 0 (0.0%) | 0 (0.0%) |
| $25,000 to $29,999 | 0 (0.0%) | 0 (0.0%) |
| $30,000 to $34,999 | 0 (0.0%) | 0 (0.0%) |
| $35,000 to $39,999 | 9 (5.6%) | 25 (26.6%) |
| $40,000 to $44,999 | 0 (0.0%) | 9 (9.6%) |
| $45,000 to $49,999 | 8 (5.0%) | 0 (0.0%) |
| $50,000 to $54,999 | 0 (0.0%) | 0 (0.0%) |
| $55,000 to $64,999 | 0 (0.0%) | 0 (0.0%) |
| $65,000 to $74,999 | 0 (0.0%) | 0 (0.0%) |
| $75,000 to $99,999 | 0 (0.0%) | 19 (20.2%) |
| $100,000+ | 129 (80.1%) | 10 (10.6%) |
| Total | 161 (100.0%) | 94 (100.0%) |
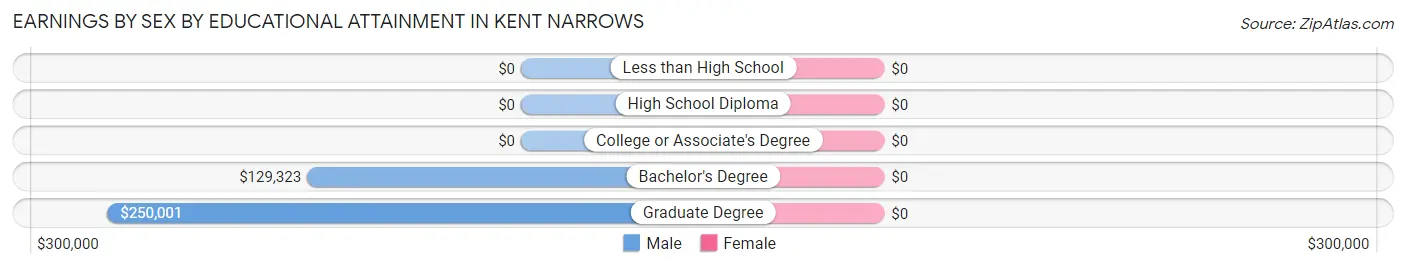
Earnings by Sex by Educational Attainment in Kent Narrows
| Educational Attainment | Male Income | Female Income |
| Less than High School | - | - |
| High School Diploma | - | - |
| College or Associate's Degree | - | - |
| Bachelor's Degree | $129,323 | $0 |
| Graduate Degree | $250,001 | $0 |
| Total | $165,787 | $0 |
Family Income in Kent Narrows
Family Income Brackets in Kent Narrows
According to the Kent Narrows family income data, there are 63 families falling into the $200,000+ income range, which is the most common income bracket and makes up 33.0% of all families.
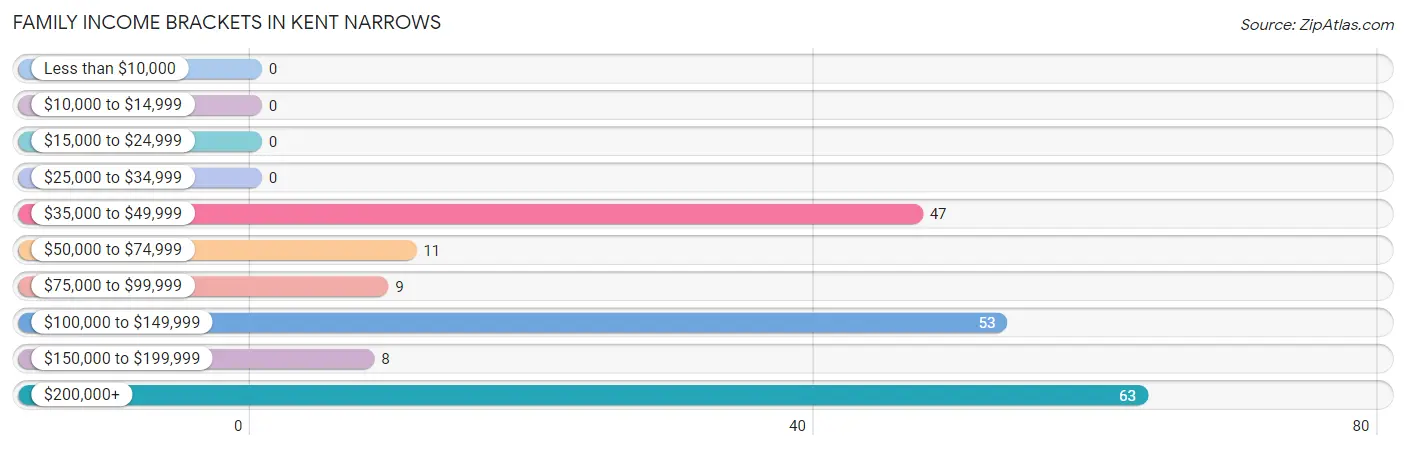
| Income Bracket | # Families | % Families |
| Less than $10,000 | 0 | 0.0% |
| $10,000 to $14,999 | 0 | 0.0% |
| $15,000 to $24,999 | 0 | 0.0% |
| $25,000 to $34,999 | 0 | 0.0% |
| $35,000 to $49,999 | 47 | 24.6% |
| $50,000 to $74,999 | 11 | 5.8% |
| $75,000 to $99,999 | 9 | 4.7% |
| $100,000 to $149,999 | 53 | 27.7% |
| $150,000 to $199,999 | 8 | 4.2% |
| $200,000+ | 63 | 33.0% |
Family Income by Famaliy Size in Kent Narrows
2-person families (151 | 79.1%) account for the highest median family income in Kent Narrows with $112,125 per family, while 2-person families (151 | 79.1%) have the highest median income of $56,062 per family member.
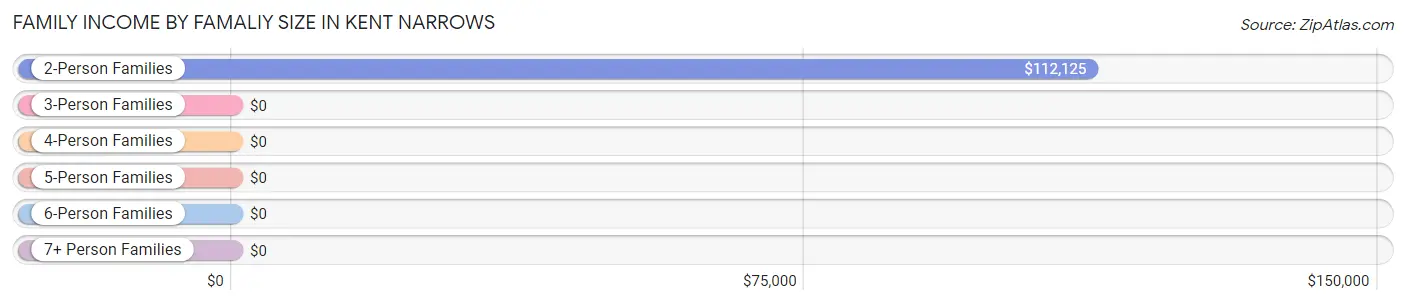
| Income Bracket | # Families | Median Income |
| 2-Person Families | 151 (79.1%) | $112,125 |
| 3-Person Families | 16 (8.4%) | $0 |
| 4-Person Families | 0 (0.0%) | $0 |
| 5-Person Families | 24 (12.6%) | $0 |
| 6-Person Families | 0 (0.0%) | $0 |
| 7+ Person Families | 0 (0.0%) | $0 |
| Total | 191 (100.0%) | $128,073 |
Family Income by Number of Earners in Kent Narrows
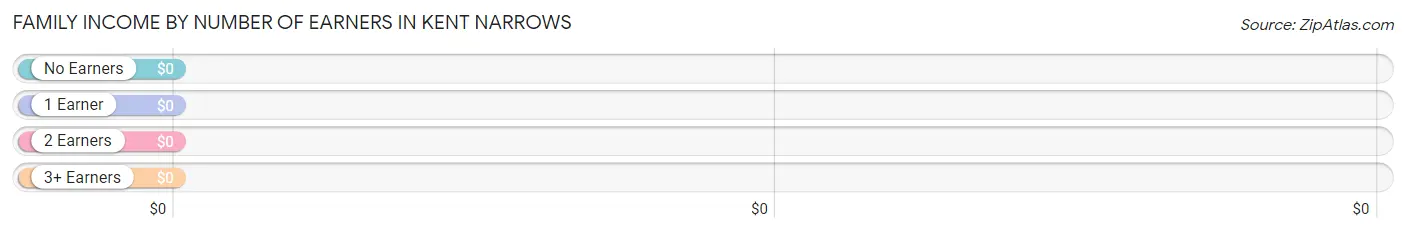
| Number of Earners | # Families | Median Income |
| No Earners | 62 (32.5%) | $0 |
| 1 Earner | 78 (40.8%) | $0 |
| 2 Earners | 45 (23.6%) | $0 |
| 3+ Earners | 6 (3.1%) | $0 |
| Total | 191 (100.0%) | $128,073 |
Household Income in Kent Narrows
Household Income Brackets in Kent Narrows
With 107 households falling in the category, the $200,000+ income range is the most frequent in Kent Narrows, accounting for 36.0% of all households.
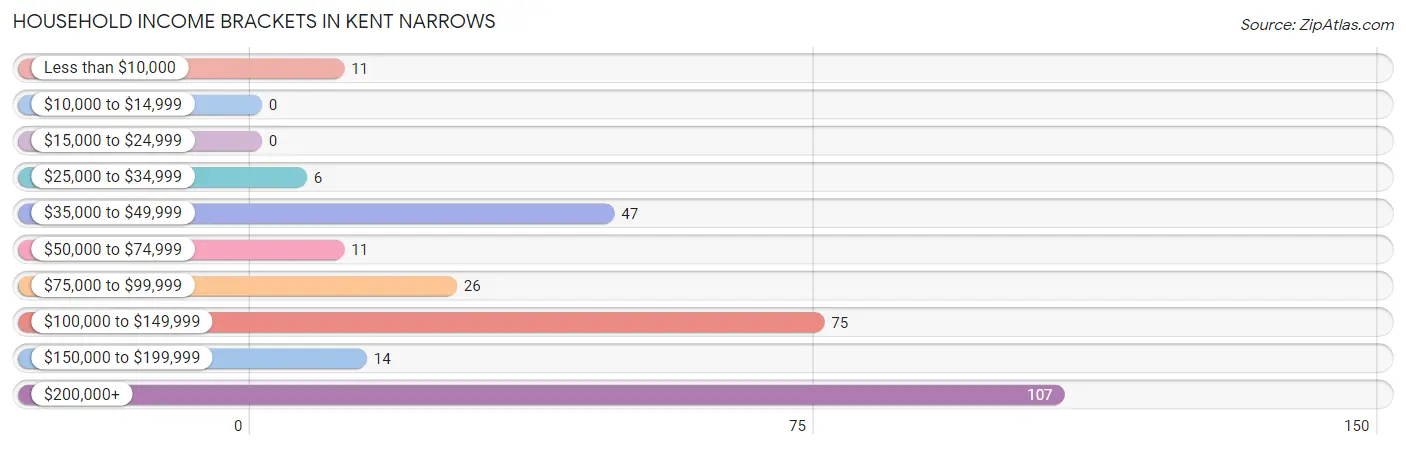
| Income Bracket | # Households | % Households |
| Less than $10,000 | 11 | 3.7% |
| $10,000 to $14,999 | 0 | 0.0% |
| $15,000 to $24,999 | 0 | 0.0% |
| $25,000 to $34,999 | 6 | 2.0% |
| $35,000 to $49,999 | 47 | 15.8% |
| $50,000 to $74,999 | 11 | 3.7% |
| $75,000 to $99,999 | 26 | 8.8% |
| $100,000 to $149,999 | 75 | 25.3% |
| $150,000 to $199,999 | 14 | 4.7% |
| $200,000+ | 107 | 36.0% |
Household Income by Householder Age in Kent Narrows
The median household income in Kent Narrows is $127,760, with the highest median household income of $111,750 found in the 65+ years age bracket for the primary householder. A total of 172 households (57.9%) fall into this category.
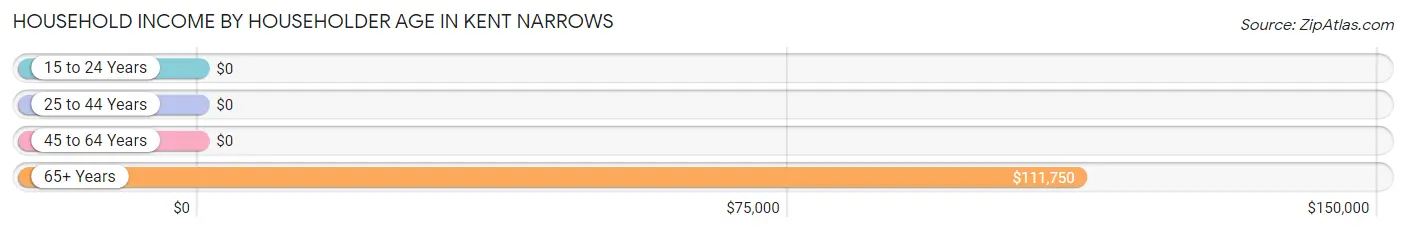
| Income Bracket | # Households | Median Income |
| 15 to 24 Years | 0 (0.0%) | $0 |
| 25 to 44 Years | 58 (19.5%) | $0 |
| 45 to 64 Years | 67 (22.6%) | $0 |
| 65+ Years | 172 (57.9%) | $111,750 |
| Total | 297 (100.0%) | $127,760 |
Poverty in Kent Narrows
Income Below Poverty by Sex and Age in Kent Narrows
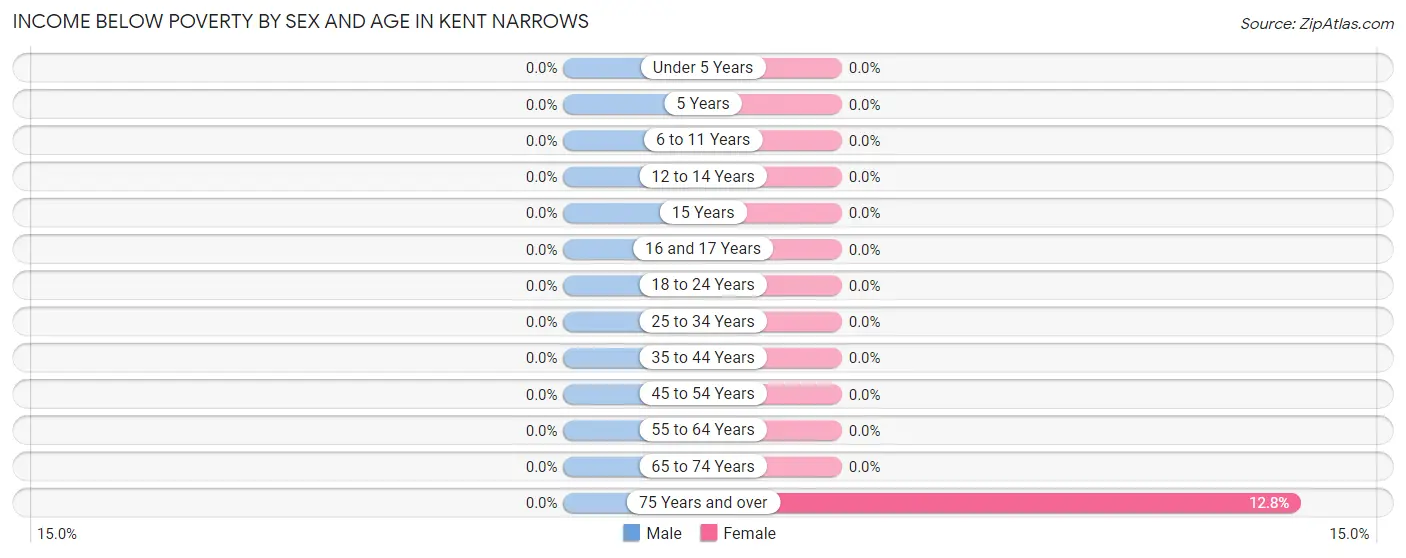
| Age Bracket | Male | Female |
| Under 5 Years | 0 (0.0%) | 0 (0.0%) |
| 5 Years | 0 (0.0%) | 0 (0.0%) |
| 6 to 11 Years | 0 (0.0%) | 0 (0.0%) |
| 12 to 14 Years | 0 (0.0%) | 0 (0.0%) |
| 15 Years | 0 (0.0%) | 0 (0.0%) |
| 16 and 17 Years | 0 (0.0%) | 0 (0.0%) |
| 18 to 24 Years | 0 (0.0%) | 0 (0.0%) |
| 25 to 34 Years | 0 (0.0%) | 0 (0.0%) |
| 35 to 44 Years | 0 (0.0%) | 0 (0.0%) |
| 45 to 54 Years | 0 (0.0%) | 0 (0.0%) |
| 55 to 64 Years | 0 (0.0%) | 0 (0.0%) |
| 65 to 74 Years | 0 (0.0%) | 0 (0.0%) |
| 75 Years and over | 0 (0.0%) | 11 (12.8%) |
| Total | 0 (0.0%) | 11 (4.2%) |
Income Above Poverty by Sex and Age in Kent Narrows
According to the poverty statistics in Kent Narrows, males aged under 5 years and females aged 16 and 17 years are the age groups that are most secure financially, with 100.0% of males and 100.0% of females in these age groups living above the poverty line.
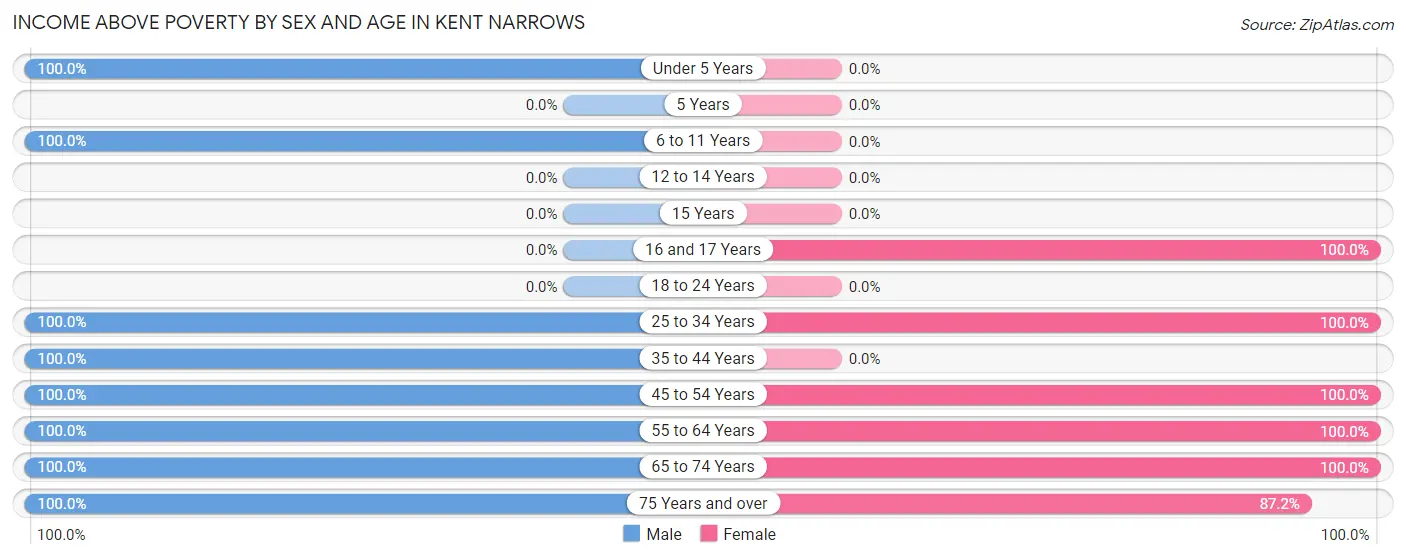
| Age Bracket | Male | Female |
| Under 5 Years | 40 (100.0%) | 0 (0.0%) |
| 5 Years | 0 (0.0%) | 0 (0.0%) |
| 6 to 11 Years | 23 (100.0%) | 0 (0.0%) |
| 12 to 14 Years | 0 (0.0%) | 0 (0.0%) |
| 15 Years | 0 (0.0%) | 0 (0.0%) |
| 16 and 17 Years | 0 (0.0%) | 30 (100.0%) |
| 18 to 24 Years | 0 (0.0%) | 0 (0.0%) |
| 25 to 34 Years | 8 (100.0%) | 18 (100.0%) |
| 35 to 44 Years | 58 (100.0%) | 0 (0.0%) |
| 45 to 54 Years | 15 (100.0%) | 7 (100.0%) |
| 55 to 64 Years | 30 (100.0%) | 51 (100.0%) |
| 65 to 74 Years | 61 (100.0%) | 73 (100.0%) |
| 75 Years and over | 78 (100.0%) | 75 (87.2%) |
| Total | 313 (100.0%) | 254 (95.9%) |
Income Below Poverty Among Married-Couple Families in Kent Narrows
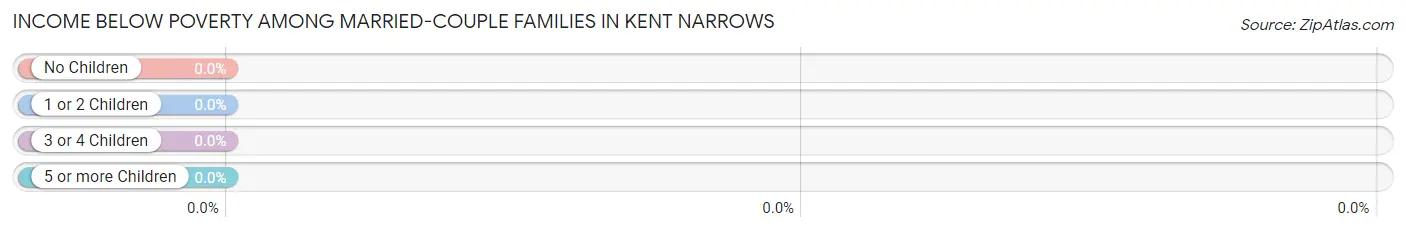
| Children | Above Poverty | Below Poverty |
| No Children | 132 (100.0%) | 0 (0.0%) |
| 1 or 2 Children | 10 (100.0%) | 0 (0.0%) |
| 3 or 4 Children | 24 (100.0%) | 0 (0.0%) |
| 5 or more Children | 0 (0.0%) | 0 (0.0%) |
| Total | 166 (100.0%) | 0 (0.0%) |
Income Below Poverty Among Single-Parent Households in Kent Narrows
| Children | Single Father | Single Mother |
| No Children | 0 (0.0%) | 0 (0.0%) |
| 1 or 2 Children | 0 (0.0%) | 0 (0.0%) |
| 3 or 4 Children | 0 (0.0%) | 0 (0.0%) |
| 5 or more Children | 0 (0.0%) | 0 (0.0%) |
| Total | 0 (0.0%) | 0 (0.0%) |
Income Below Poverty Among Married-Couple vs Single-Parent Households in Kent Narrows
| Children | Married-Couple Families | Single-Parent Households |
| No Children | 0 (0.0%) | 0 (0.0%) |
| 1 or 2 Children | 0 (0.0%) | 0 (0.0%) |
| 3 or 4 Children | 0 (0.0%) | 0 (0.0%) |
| 5 or more Children | 0 (0.0%) | 0 (0.0%) |
| Total | 0 (0.0%) | 0 (0.0%) |
Race in Kent Narrows
The most populous races in Kent Narrows are White / Caucasian (544 | 94.1%), and Black / African American (34 | 5.9%).
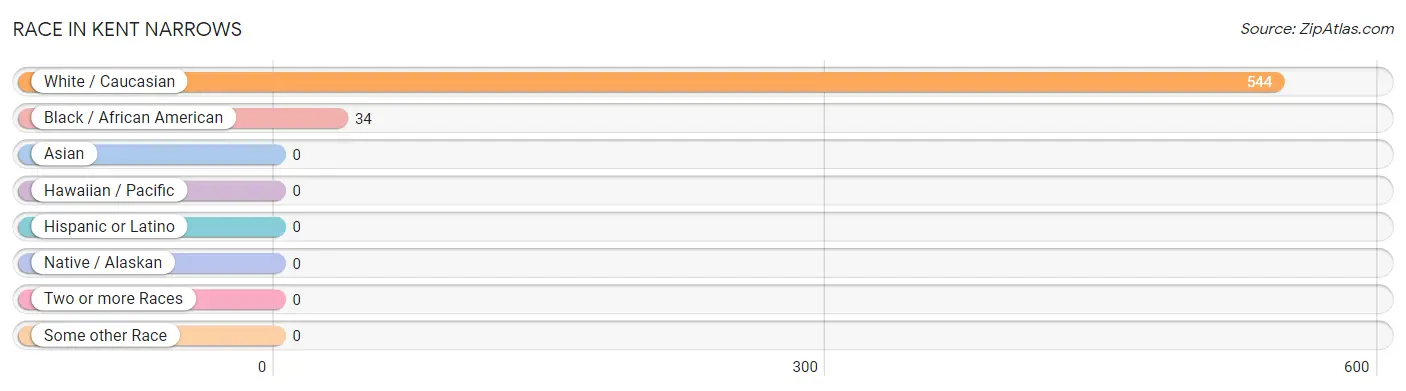
| Race | # Population | % Population |
| Asian | 0 | 0.0% |
| Black / African American | 34 | 5.9% |
| Hawaiian / Pacific | 0 | 0.0% |
| Hispanic or Latino | 0 | 0.0% |
| Native / Alaskan | 0 | 0.0% |
| White / Caucasian | 544 | 94.1% |
| Two or more Races | 0 | 0.0% |
| Some other Race | 0 | 0.0% |
| Total | 578 | 100.0% |
Ancestry in Kent Narrows
The most populous ancestries reported in Kent Narrows are Irish (221 | 38.2%), Italian (122 | 21.1%), German (121 | 20.9%), English (83 | 14.4%), and Polish (26 | 4.5%), together accounting for 99.1% of all Kent Narrows residents.
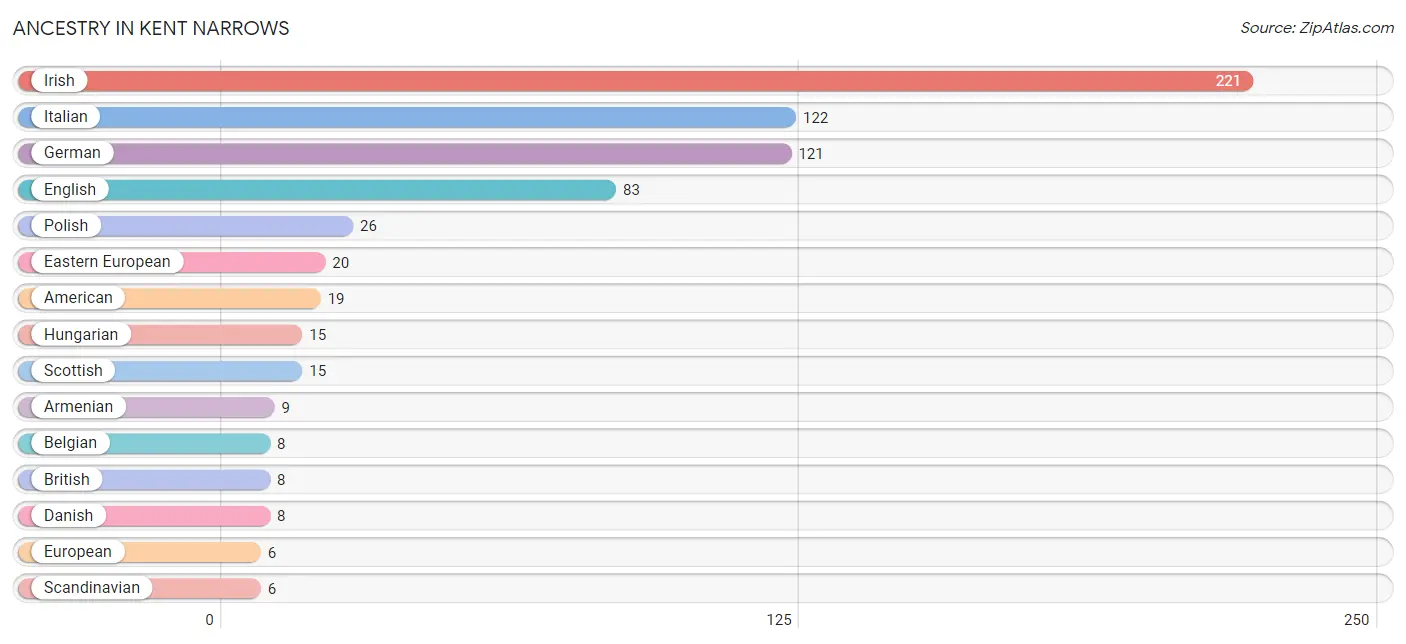
| Ancestry | # Population | % Population |
| American | 19 | 3.3% |
| Armenian | 9 | 1.6% |
| Belgian | 8 | 1.4% |
| British | 8 | 1.4% |
| Danish | 8 | 1.4% |
| Eastern European | 20 | 3.5% |
| English | 83 | 14.4% |
| European | 6 | 1.0% |
| German | 121 | 20.9% |
| Hungarian | 15 | 2.6% |
| Irish | 221 | 38.2% |
| Italian | 122 | 21.1% |
| Norwegian | 4 | 0.7% |
| Polish | 26 | 4.5% |
| Scandinavian | 6 | 1.0% |
| Scottish | 15 | 2.6% | View All 16 Rows |
Immigrants in Kent Narrows
The most numerous immigrant groups reported in Kent Narrows came from Denmark (6 | 1.0%), Europe (6 | 1.0%), and Northern Europe (6 | 1.0%), together accounting for 3.1% of all Kent Narrows residents.
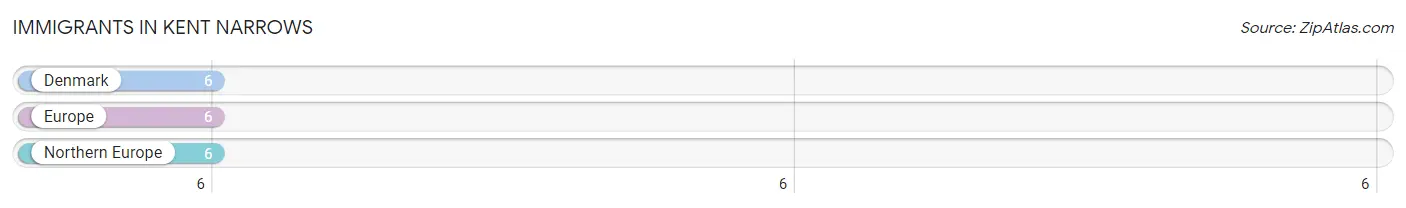
| Immigration Origin | # Population | % Population |
| Denmark | 6 | 1.0% |
| Europe | 6 | 1.0% |
| Northern Europe | 6 | 1.0% | View All 3 Rows |
Sex and Age in Kent Narrows
Sex and Age in Kent Narrows
The most populous age groups in Kent Narrows are 35 to 39 Years (58 | 18.5%) for men and 70 to 74 Years (56 | 21.1%) for women.
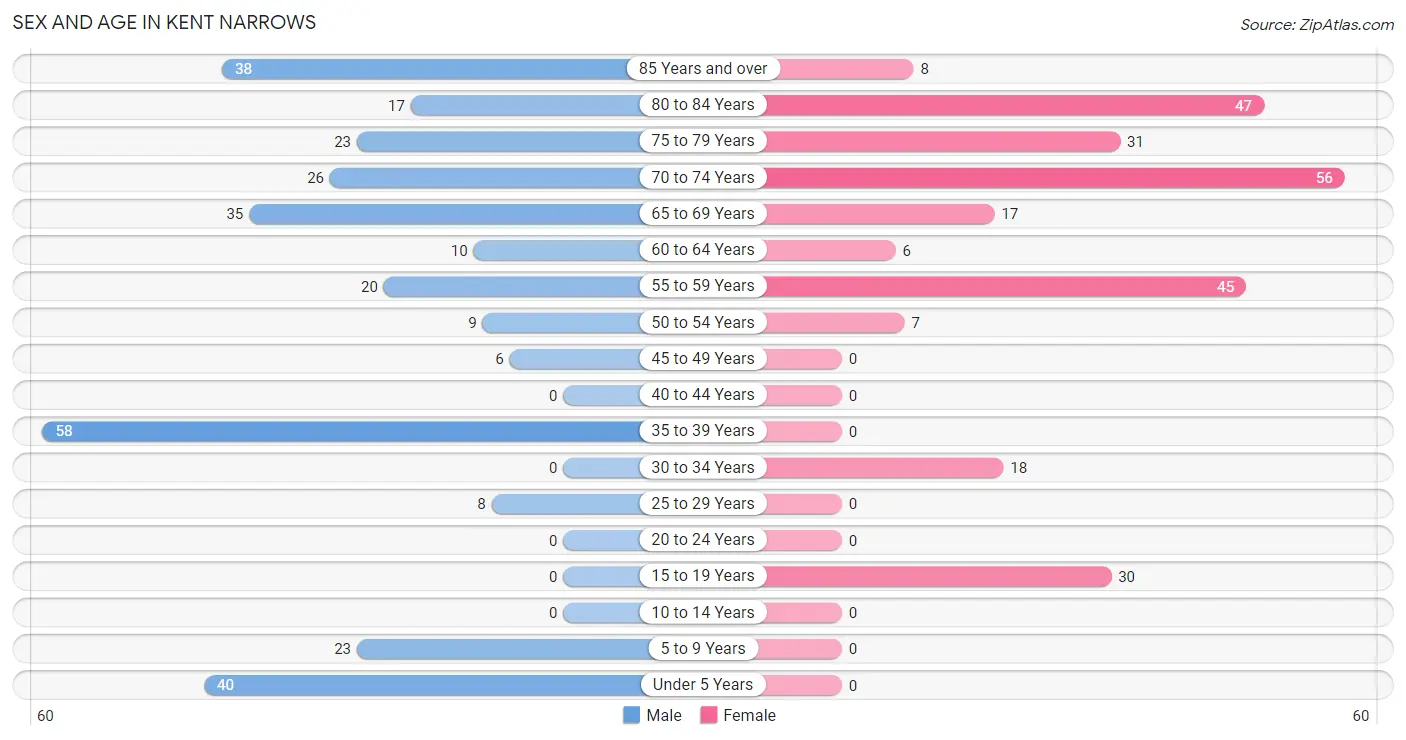
| Age Bracket | Male | Female |
| Under 5 Years | 40 (12.8%) | 0 (0.0%) |
| 5 to 9 Years | 23 (7.3%) | 0 (0.0%) |
| 10 to 14 Years | 0 (0.0%) | 0 (0.0%) |
| 15 to 19 Years | 0 (0.0%) | 30 (11.3%) |
| 20 to 24 Years | 0 (0.0%) | 0 (0.0%) |
| 25 to 29 Years | 8 (2.6%) | 0 (0.0%) |
| 30 to 34 Years | 0 (0.0%) | 18 (6.8%) |
| 35 to 39 Years | 58 (18.5%) | 0 (0.0%) |
| 40 to 44 Years | 0 (0.0%) | 0 (0.0%) |
| 45 to 49 Years | 6 (1.9%) | 0 (0.0%) |
| 50 to 54 Years | 9 (2.9%) | 7 (2.6%) |
| 55 to 59 Years | 20 (6.4%) | 45 (17.0%) |
| 60 to 64 Years | 10 (3.2%) | 6 (2.3%) |
| 65 to 69 Years | 35 (11.2%) | 17 (6.4%) |
| 70 to 74 Years | 26 (8.3%) | 56 (21.1%) |
| 75 to 79 Years | 23 (7.3%) | 31 (11.7%) |
| 80 to 84 Years | 17 (5.4%) | 47 (17.7%) |
| 85 Years and over | 38 (12.1%) | 8 (3.0%) |
| Total | 313 (100.0%) | 265 (100.0%) |
Families and Households in Kent Narrows
Median Family Size in Kent Narrows
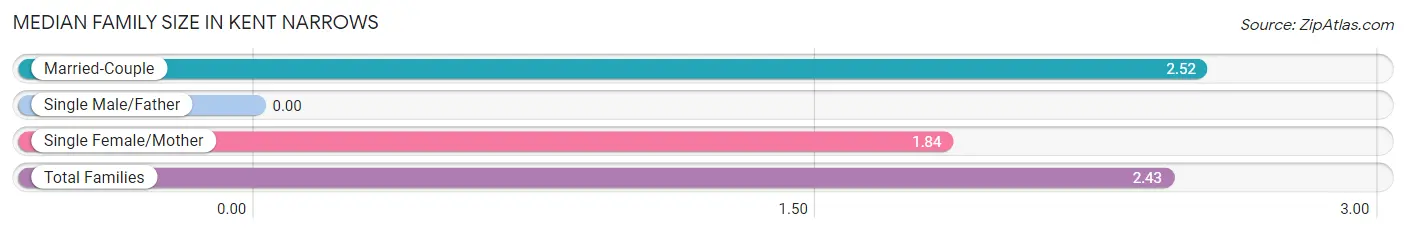
| Family Type | # Families | Family Size |
| Married-Couple | 166 (86.9%) | 2.52 |
| Single Male/Father | 0 (0.0%) | - |
| Single Female/Mother | 25 (13.1%) | 1.84 |
| Total Families | 191 (100.0%) | 2.43 |
Median Household Size in Kent Narrows
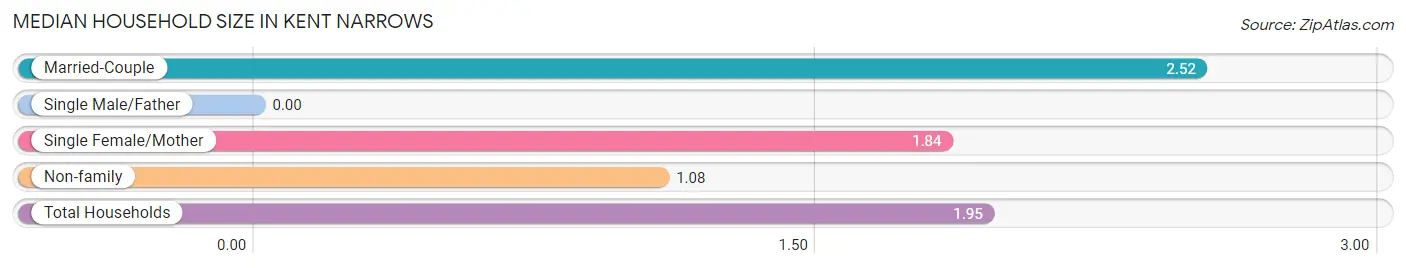
| Household Type | # Households | Household Size |
| Married-Couple | 166 (55.9%) | 2.52 |
| Single Male/Father | 0 (0.0%) | - |
| Single Female/Mother | 25 (8.4%) | 1.84 |
| Non-family | 106 (35.7%) | 1.08 |
| Total Households | 297 (100.0%) | 1.95 |
Household Size by Marriage Status in Kent Narrows
Out of a total of 297 households in Kent Narrows, 191 (64.3%) are family households, while 106 (35.7%) are nonfamily households. The most numerous type of family households are 2-person households, comprising 151, and the most common type of nonfamily households are 1-person households, comprising 100.
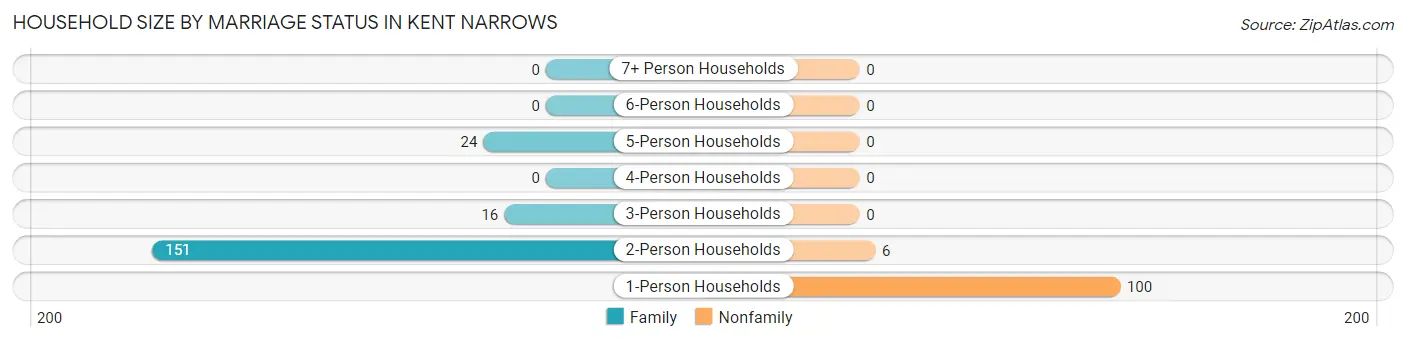
| Household Size | Family Households | Nonfamily Households |
| 1-Person Households | - | 100 (33.7%) |
| 2-Person Households | 151 (50.8%) | 6 (2.0%) |
| 3-Person Households | 16 (5.4%) | 0 (0.0%) |
| 4-Person Households | 0 (0.0%) | 0 (0.0%) |
| 5-Person Households | 24 (8.1%) | 0 (0.0%) |
| 6-Person Households | 0 (0.0%) | 0 (0.0%) |
| 7+ Person Households | 0 (0.0%) | 0 (0.0%) |
| Total | 191 (64.3%) | 106 (35.7%) |
Female Fertility in Kent Narrows
Fertility by Age in Kent Narrows
| Age Bracket | Women with Births | Births / 1,000 Women |
| 15 to 19 years | 0 (0.0%) | 0.0 |
| 20 to 34 years | 0 (0.0%) | 0.0 |
| 35 to 50 years | 0 (0.0%) | 0.0 |
| Total | 0 (0.0%) | 0.0 |
Fertility by Age by Marriage Status in Kent Narrows
| Age Bracket | Married | Unmarried |
| 15 to 19 years | 0 (0.0%) | 0 (0.0%) |
| 20 to 34 years | 0 (0.0%) | 0 (0.0%) |
| 35 to 50 years | 0 (0.0%) | 0 (0.0%) |
| Total | 0 (0.0%) | 0 (0.0%) |
Fertility by Education in Kent Narrows
| Educational Attainment | Women with Births | Births / 1,000 Women |
| Less than High School | 0 (0.0%) | 0.0 |
| High School Diploma | 0 (0.0%) | 0.0 |
| College or Associate's Degree | 0 (0.0%) | 0.0 |
| Bachelor's Degree | 0 (0.0%) | 0.0 |
| Graduate Degree | 0 (0.0%) | 0.0 |
| Total | 0 (0.0%) | 0.0 |
Fertility by Education by Marriage Status in Kent Narrows
| Educational Attainment | Married | Unmarried |
| Less than High School | 0 (0.0%) | 0 (0.0%) |
| High School Diploma | 0 (0.0%) | 0 (0.0%) |
| College or Associate's Degree | 0 (0.0%) | 0 (0.0%) |
| Bachelor's Degree | 0 (0.0%) | 0 (0.0%) |
| Graduate Degree | 0 (0.0%) | 0 (0.0%) |
| Total | 0 (0.0%) | 0 (0.0%) |
Employment Characteristics in Kent Narrows
Employment by Class of Employer in Kent Narrows
Among the 246 employed individuals in Kent Narrows, private company employees (103 | 41.9%), not-for-profit organizations (50 | 20.3%), and local government employees (37 | 15.0%) make up the most common classes of employment.
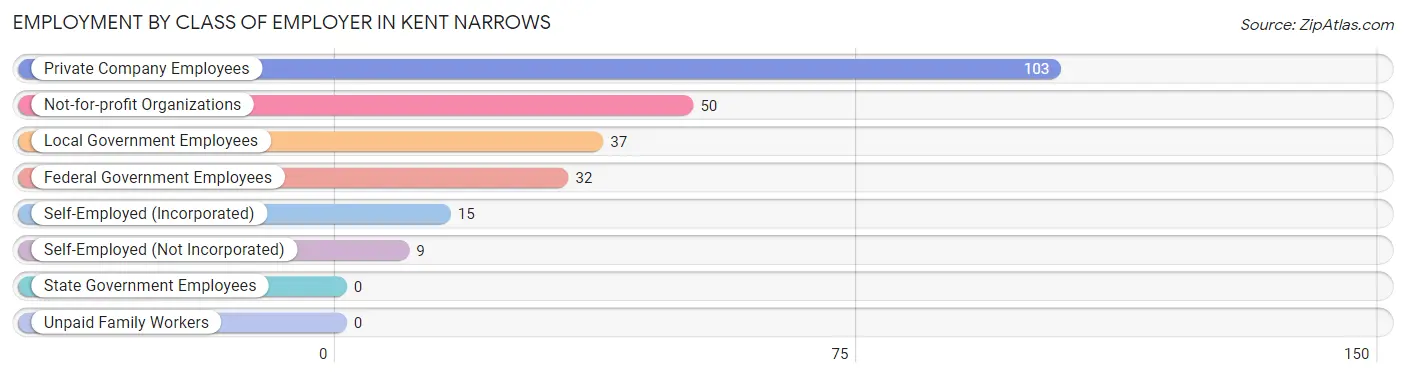
| Employer Class | # Employees | % Employees |
| Private Company Employees | 103 | 41.9% |
| Self-Employed (Incorporated) | 15 | 6.1% |
| Self-Employed (Not Incorporated) | 9 | 3.7% |
| Not-for-profit Organizations | 50 | 20.3% |
| Local Government Employees | 37 | 15.0% |
| State Government Employees | 0 | 0.0% |
| Federal Government Employees | 32 | 13.0% |
| Unpaid Family Workers | 0 | 0.0% |
| Total | 246 | 100.0% |
Employment Status by Age in Kent Narrows
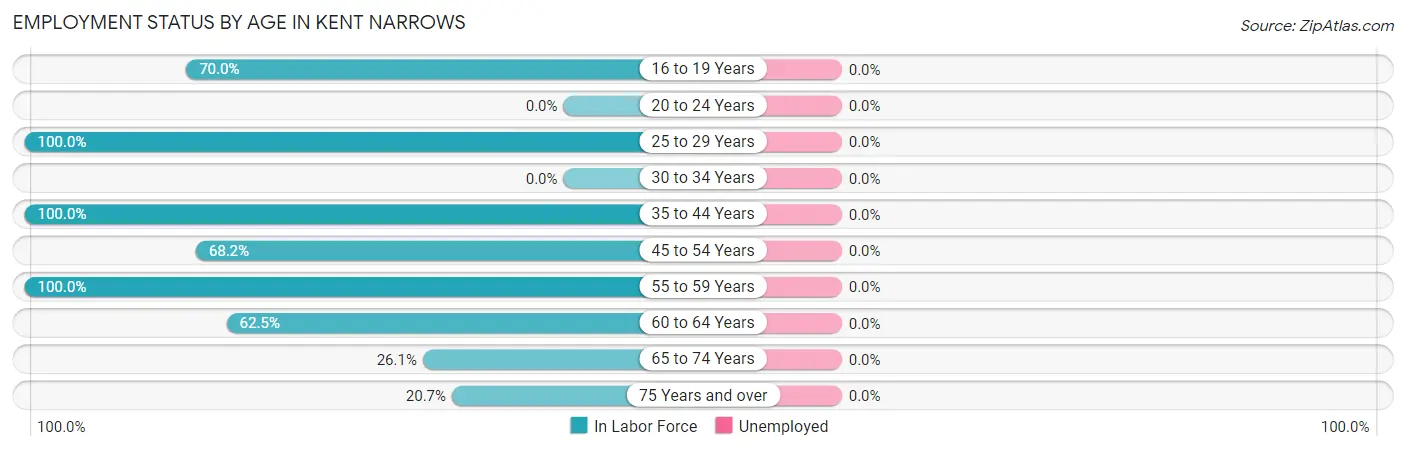
| Age Bracket | In Labor Force | Unemployed |
| 16 to 19 Years | 21 (70.0%) | 0 (0.0%) |
| 20 to 24 Years | 0 (0.0%) | 0 (0.0%) |
| 25 to 29 Years | 8 (100.0%) | 0 (0.0%) |
| 30 to 34 Years | 0 (0.0%) | 0 (0.0%) |
| 35 to 44 Years | 58 (100.0%) | 0 (0.0%) |
| 45 to 54 Years | 15 (68.2%) | 0 (0.0%) |
| 55 to 59 Years | 65 (100.0%) | 0 (0.0%) |
| 60 to 64 Years | 10 (62.5%) | 0 (0.0%) |
| 65 to 74 Years | 35 (26.1%) | 0 (0.0%) |
| 75 Years and over | 34 (20.7%) | 0 (0.0%) |
| Total | 246 (47.8%) | 0 (0.0%) |
Employment Status by Educational Attainment in Kent Narrows
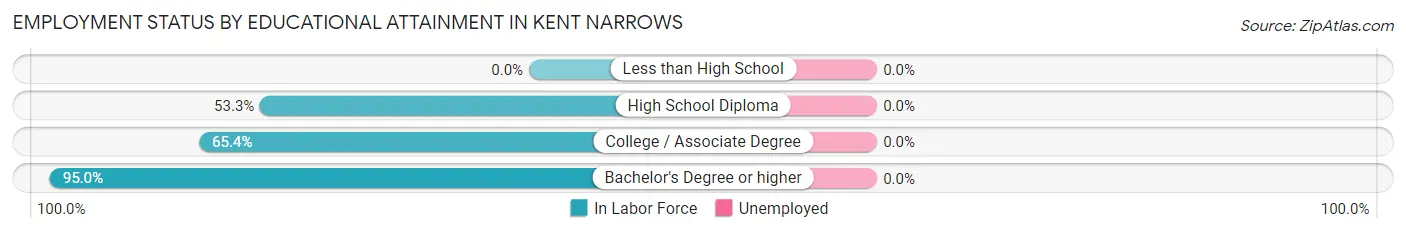
| Educational Attainment | In Labor Force | Unemployed |
| Less than High School | 0 (0.0%) | 0 (0.0%) |
| High School Diploma | 8 (53.3%) | 0 (0.0%) |
| College / Associate Degree | 34 (65.4%) | 0 (0.0%) |
| Bachelor's Degree or higher | 114 (95.0%) | 0 (0.0%) |
| Total | 156 (83.4%) | 0 (0.0%) |
Employment Occupations by Sex in Kent Narrows
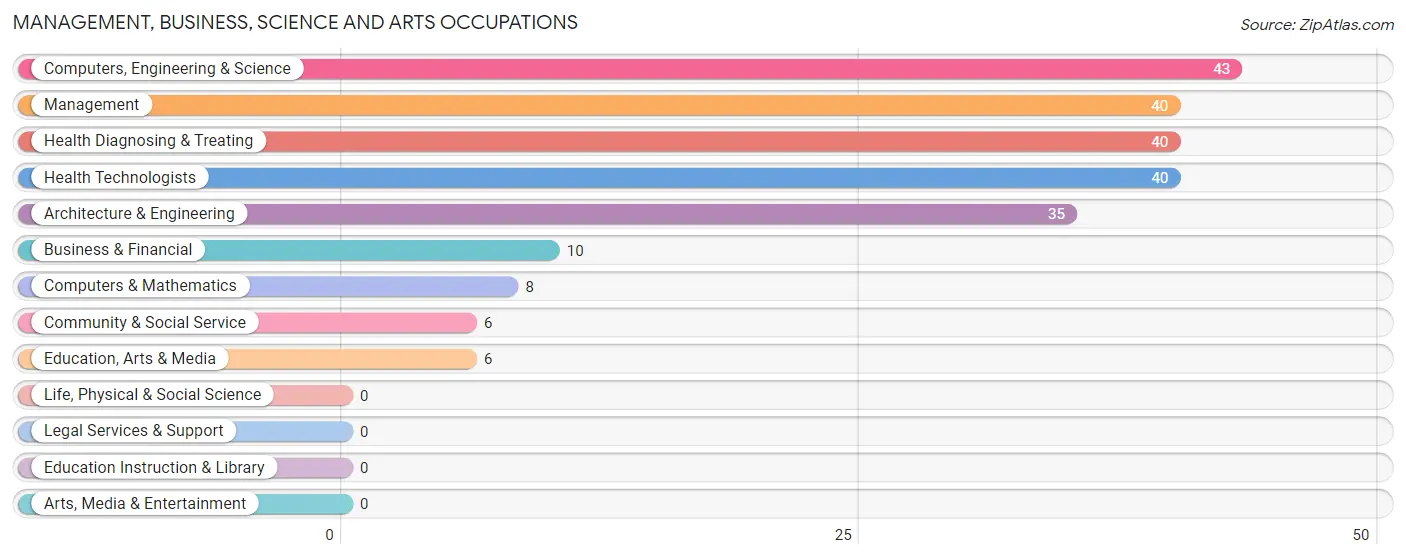
Management, Business, Science and Arts Occupations
The most common Management, Business, Science and Arts occupations in Kent Narrows are Computers, Engineering & Science (43 | 17.5%), Management (40 | 16.3%), Health Diagnosing & Treating (40 | 16.3%), Health Technologists (40 | 16.3%), and Architecture & Engineering (35 | 14.2%).
Management, Business, Science and Arts Occupations by Sex
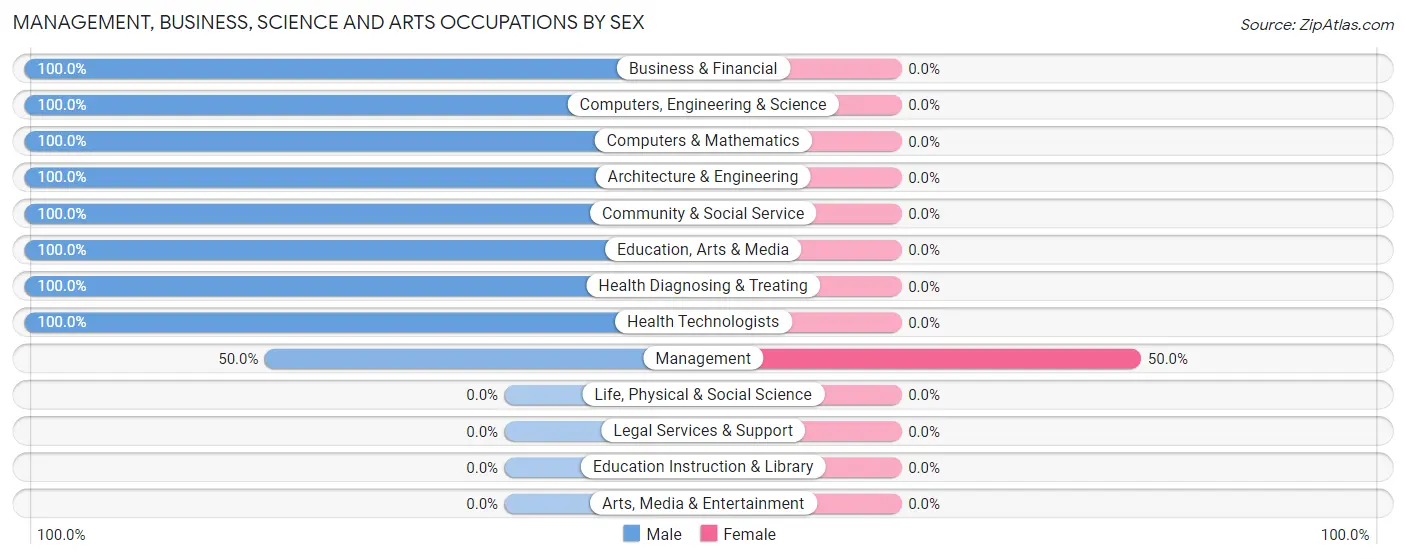
| Occupation | Male | Female |
| Management | 20 (50.0%) | 20 (50.0%) |
| Business & Financial | 10 (100.0%) | 0 (0.0%) |
| Computers, Engineering & Science | 43 (100.0%) | 0 (0.0%) |
| Computers & Mathematics | 8 (100.0%) | 0 (0.0%) |
| Architecture & Engineering | 35 (100.0%) | 0 (0.0%) |
| Life, Physical & Social Science | 0 (0.0%) | 0 (0.0%) |
| Community & Social Service | 6 (100.0%) | 0 (0.0%) |
| Education, Arts & Media | 6 (100.0%) | 0 (0.0%) |
| Legal Services & Support | 0 (0.0%) | 0 (0.0%) |
| Education Instruction & Library | 0 (0.0%) | 0 (0.0%) |
| Arts, Media & Entertainment | 0 (0.0%) | 0 (0.0%) |
| Health Diagnosing & Treating | 40 (100.0%) | 0 (0.0%) |
| Health Technologists | 40 (100.0%) | 0 (0.0%) |
| Total (Category) | 119 (85.6%) | 20 (14.4%) |
| Total (Overall) | 161 (65.4%) | 85 (34.5%) |
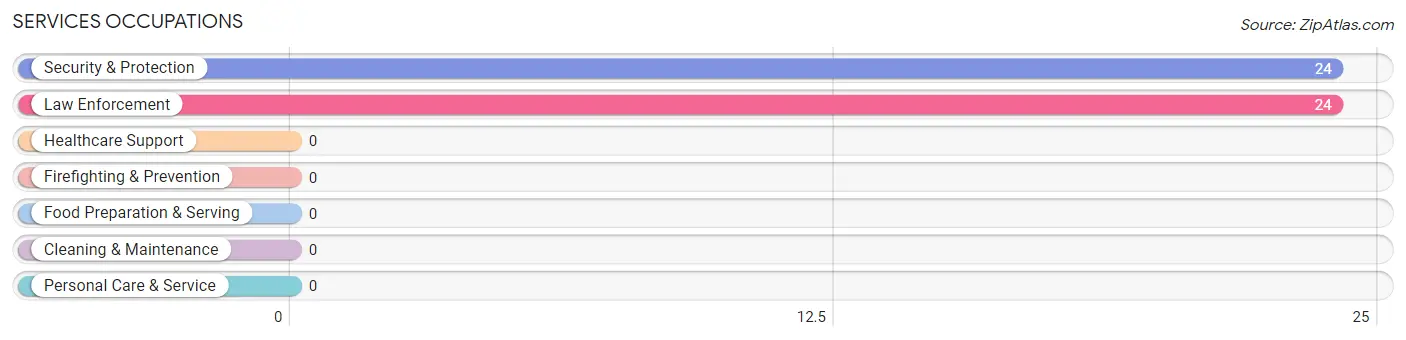
Services Occupations
The most common Services occupations in Kent Narrows are Security & Protection (24 | 9.8%), and Law Enforcement (24 | 9.8%).
Services Occupations by Sex
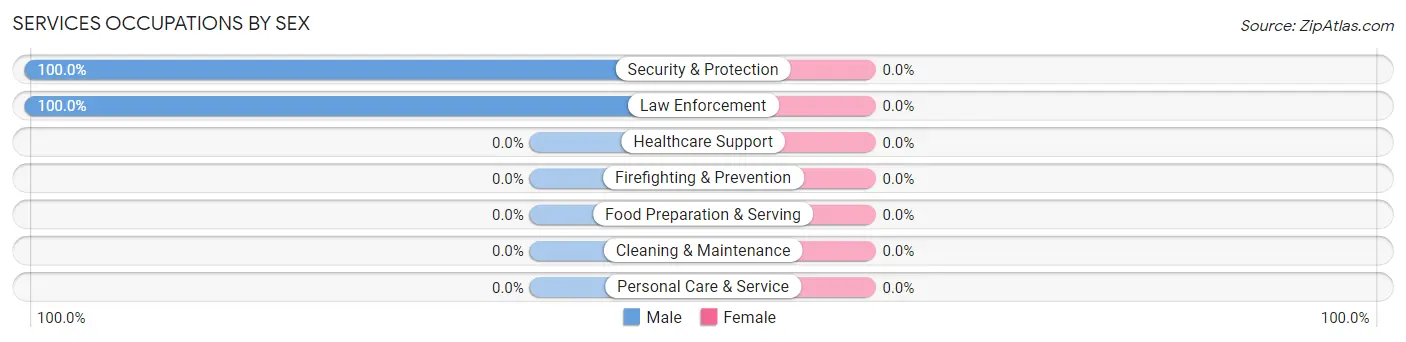
| Occupation | Male | Female |
| Healthcare Support | 0 (0.0%) | 0 (0.0%) |
| Security & Protection | 24 (100.0%) | 0 (0.0%) |
| Firefighting & Prevention | 0 (0.0%) | 0 (0.0%) |
| Law Enforcement | 24 (100.0%) | 0 (0.0%) |
| Food Preparation & Serving | 0 (0.0%) | 0 (0.0%) |
| Cleaning & Maintenance | 0 (0.0%) | 0 (0.0%) |
| Personal Care & Service | 0 (0.0%) | 0 (0.0%) |
| Total (Category) | 24 (100.0%) | 0 (0.0%) |
| Total (Overall) | 161 (65.4%) | 85 (34.5%) |
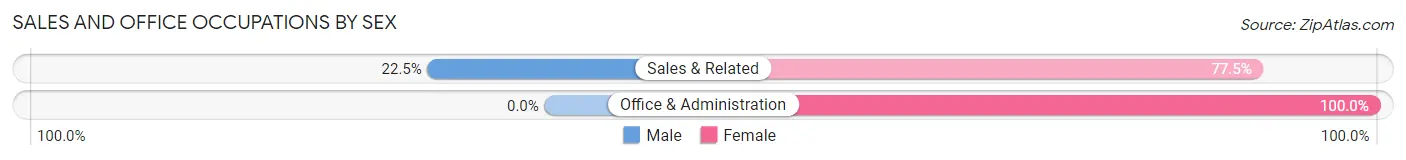
Sales and Office Occupations
The most common Sales and Office occupations in Kent Narrows are Sales & Related (40 | 16.3%), and Office & Administration (34 | 13.8%).
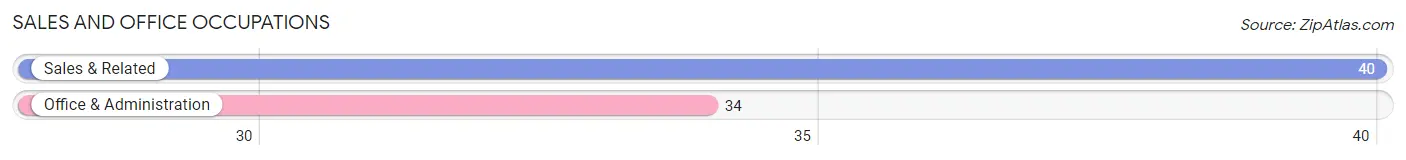
Sales and Office Occupations by Sex
| Occupation | Male | Female |
| Sales & Related | 9 (22.5%) | 31 (77.5%) |
| Office & Administration | 0 (0.0%) | 34 (100.0%) |
| Total (Category) | 9 (12.2%) | 65 (87.8%) |
| Total (Overall) | 161 (65.4%) | 85 (34.5%) |
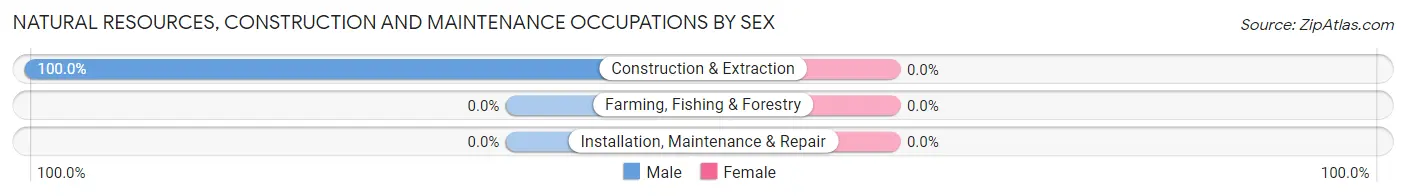
Natural Resources, Construction and Maintenance Occupations
The most common Natural Resources, Construction and Maintenance occupations in Kent Narrows are , and Construction & Extraction (9 | 3.7%).
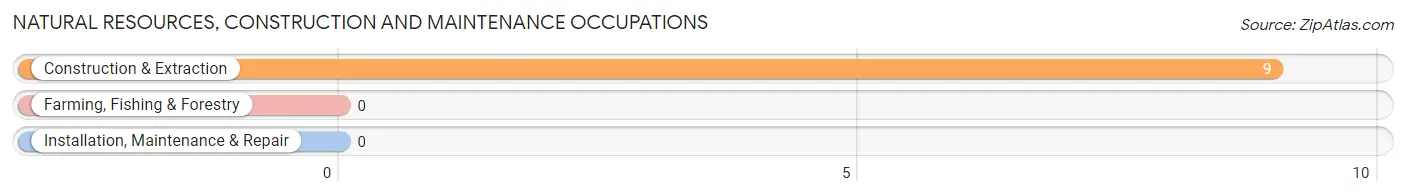
Natural Resources, Construction and Maintenance Occupations by Sex
| Occupation | Male | Female |
| Farming, Fishing & Forestry | 0 (0.0%) | 0 (0.0%) |
| Construction & Extraction | 9 (100.0%) | 0 (0.0%) |
| Installation, Maintenance & Repair | 0 (0.0%) | 0 (0.0%) |
| Total (Category) | 9 (100.0%) | 0 (0.0%) |
| Total (Overall) | 161 (65.4%) | 85 (34.5%) |
Production, Transportation and Moving Occupations
Production, Transportation and Moving Occupations by Sex
| Occupation | Male | Female |
| Production | 0 (0.0%) | 0 (0.0%) |
| Transportation | 0 (0.0%) | 0 (0.0%) |
| Material Moving | 0 (0.0%) | 0 (0.0%) |
| Total (Category) | 0 (0.0%) | 0 (0.0%) |
| Total (Overall) | 161 (65.4%) | 85 (34.5%) |
Employment Industries by Sex in Kent Narrows
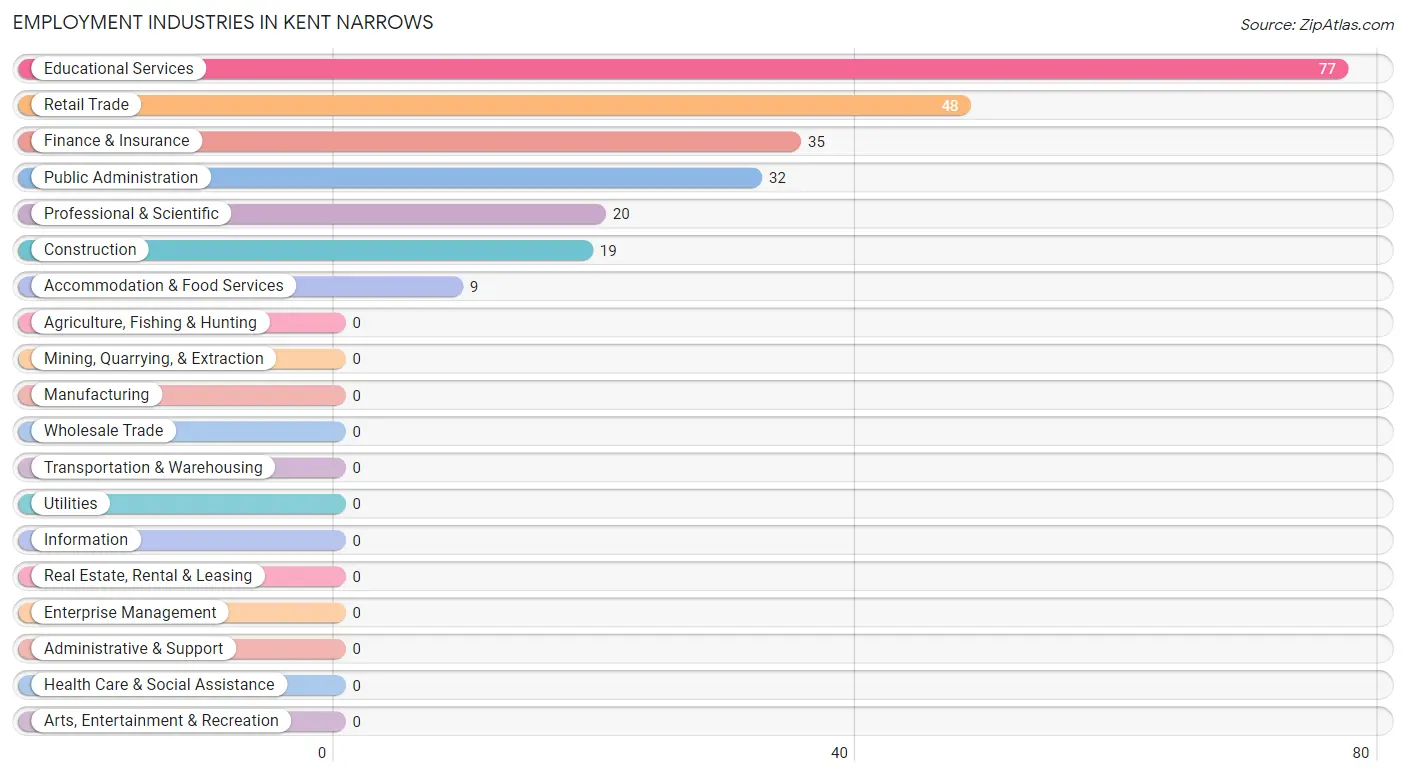
Employment Industries in Kent Narrows
The major employment industries in Kent Narrows include Educational Services (77 | 31.3%), Retail Trade (48 | 19.5%), Finance & Insurance (35 | 14.2%), Public Administration (32 | 13.0%), and Professional & Scientific (20 | 8.1%).
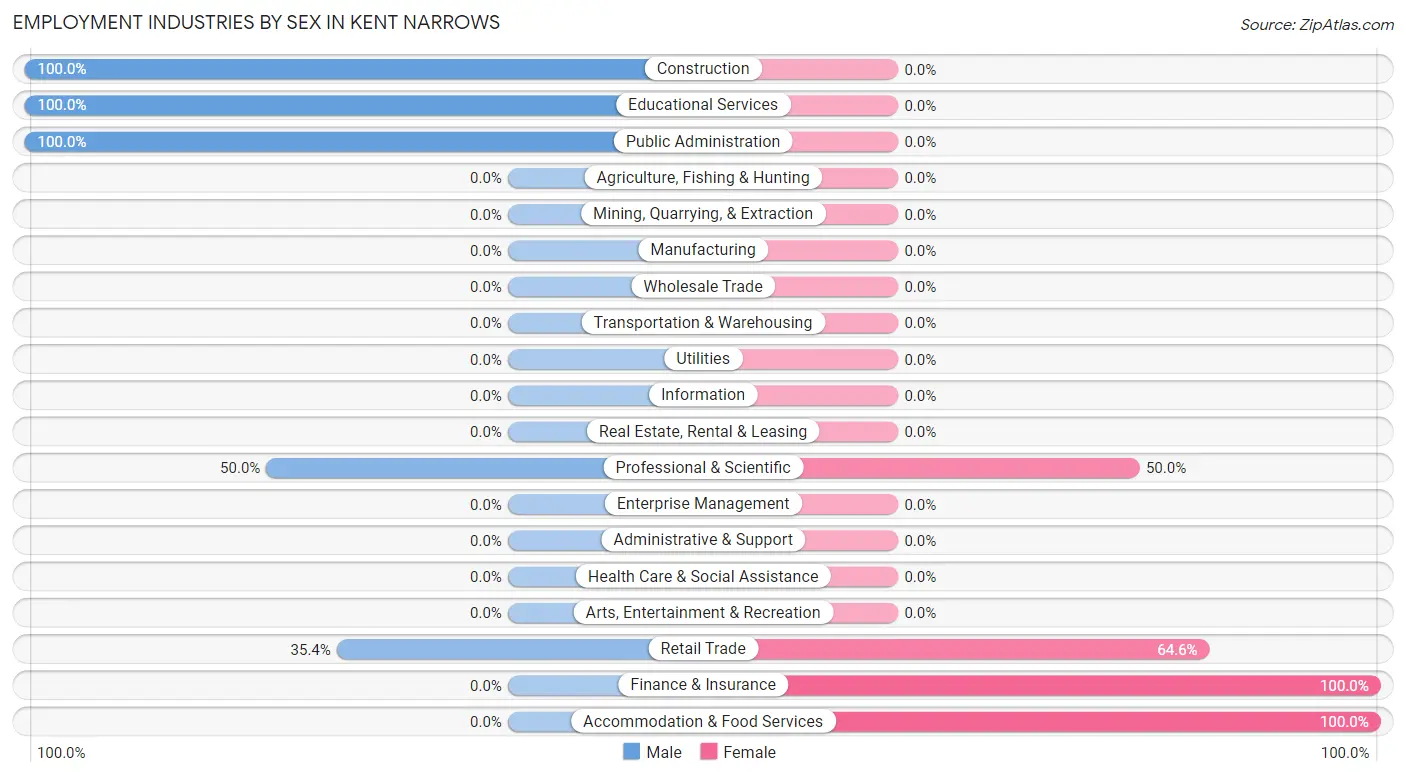
Employment Industries by Sex in Kent Narrows
The Kent Narrows industries that see more men than women are Construction (100.0%), Educational Services (100.0%), and Public Administration (100.0%), whereas the industries that tend to have a higher number of women are Finance & Insurance (100.0%), Accommodation & Food Services (100.0%), and Retail Trade (64.6%).
| Industry | Male | Female |
| Agriculture, Fishing & Hunting | 0 (0.0%) | 0 (0.0%) |
| Mining, Quarrying, & Extraction | 0 (0.0%) | 0 (0.0%) |
| Construction | 19 (100.0%) | 0 (0.0%) |
| Manufacturing | 0 (0.0%) | 0 (0.0%) |
| Wholesale Trade | 0 (0.0%) | 0 (0.0%) |
| Retail Trade | 17 (35.4%) | 31 (64.6%) |
| Transportation & Warehousing | 0 (0.0%) | 0 (0.0%) |
| Utilities | 0 (0.0%) | 0 (0.0%) |
| Information | 0 (0.0%) | 0 (0.0%) |
| Finance & Insurance | 0 (0.0%) | 35 (100.0%) |
| Real Estate, Rental & Leasing | 0 (0.0%) | 0 (0.0%) |
| Professional & Scientific | 10 (50.0%) | 10 (50.0%) |
| Enterprise Management | 0 (0.0%) | 0 (0.0%) |
| Administrative & Support | 0 (0.0%) | 0 (0.0%) |
| Educational Services | 77 (100.0%) | 0 (0.0%) |
| Health Care & Social Assistance | 0 (0.0%) | 0 (0.0%) |
| Arts, Entertainment & Recreation | 0 (0.0%) | 0 (0.0%) |
| Accommodation & Food Services | 0 (0.0%) | 9 (100.0%) |
| Public Administration | 32 (100.0%) | 0 (0.0%) |
| Total | 161 (65.4%) | 85 (34.5%) |
Education in Kent Narrows
School Enrollment in Kent Narrows
The most common levels of schooling among the 79 students in Kent Narrows are high school (30 | 38.0%), elementary school (23 | 29.1%), and nursery / preschool (20 | 25.3%).
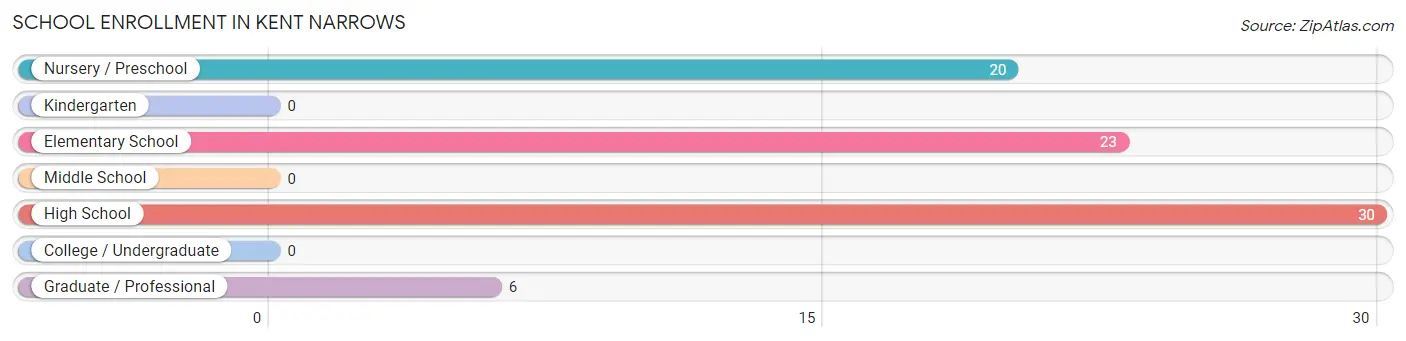
| School Level | # Students | % Students |
| Nursery / Preschool | 20 | 25.3% |
| Kindergarten | 0 | 0.0% |
| Elementary School | 23 | 29.1% |
| Middle School | 0 | 0.0% |
| High School | 30 | 38.0% |
| College / Undergraduate | 0 | 0.0% |
| Graduate / Professional | 6 | 7.6% |
| Total | 79 | 100.0% |
School Enrollment by Age by Funding Source in Kent Narrows
Out of a total of 79 students who are enrolled in schools in Kent Narrows, 6 (7.6%) attend a private institution, while the remaining 73 (92.4%) are enrolled in public schools. The age group of 35 years and over has the highest likelihood of being enrolled in private schools, with 6 (100.0% in the age bracket) enrolled. Conversely, the age group of 3 to 4 year olds has the lowest likelihood of being enrolled in a private school, with 20 (100.0% in the age bracket) attending a public institution.
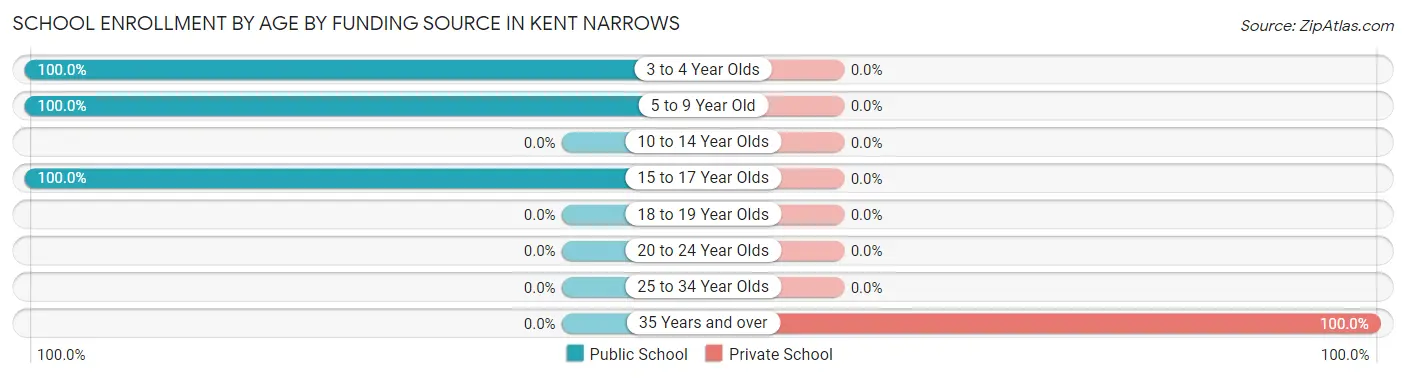
| Age Bracket | Public School | Private School |
| 3 to 4 Year Olds | 20 (100.0%) | 0 (0.0%) |
| 5 to 9 Year Old | 23 (100.0%) | 0 (0.0%) |
| 10 to 14 Year Olds | 0 (0.0%) | 0 (0.0%) |
| 15 to 17 Year Olds | 30 (100.0%) | 0 (0.0%) |
| 18 to 19 Year Olds | 0 (0.0%) | 0 (0.0%) |
| 20 to 24 Year Olds | 0 (0.0%) | 0 (0.0%) |
| 25 to 34 Year Olds | 0 (0.0%) | 0 (0.0%) |
| 35 Years and over | 0 (0.0%) | 6 (100.0%) |
| Total | 73 (92.4%) | 6 (7.6%) |
Educational Attainment by Field of Study in Kent Narrows
Computers & mathematics (52 | 19.1%), engineering (48 | 17.6%), bio, nature & agricultural (34 | 12.4%), education (30 | 11.0%), and business (25 | 9.2%) are the most common fields of study among 273 individuals in Kent Narrows who have obtained a bachelor's degree or higher.
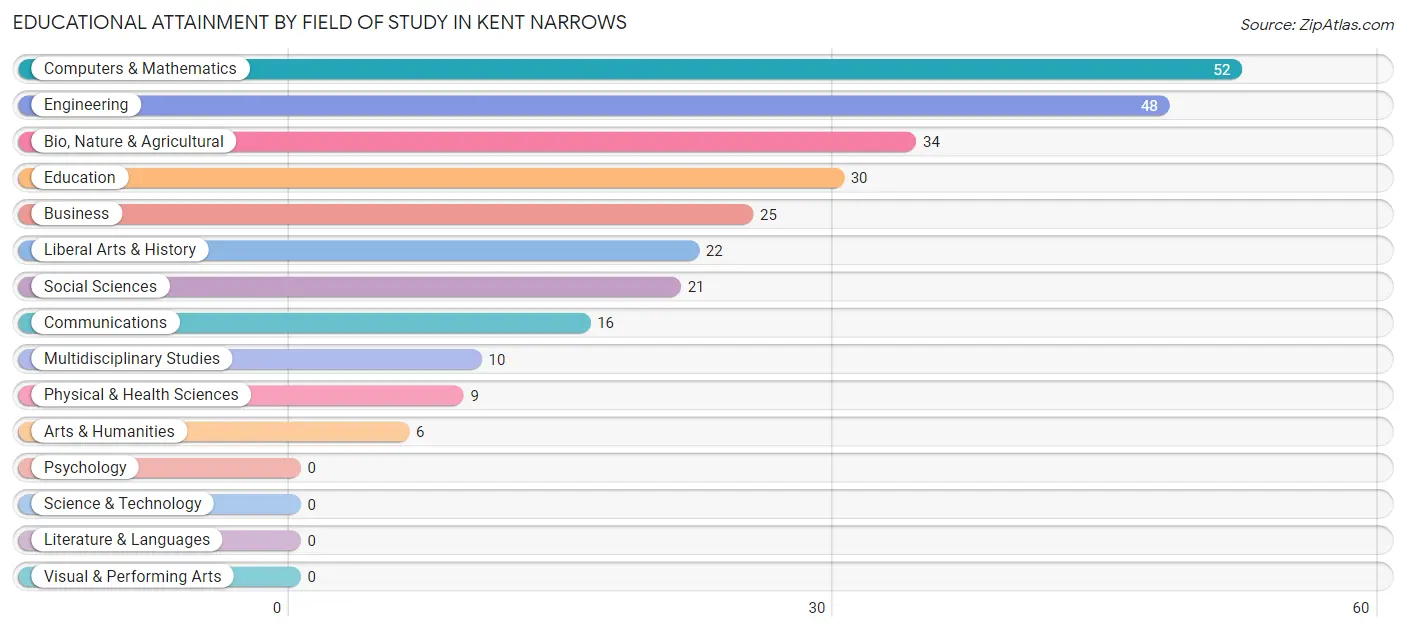
| Field of Study | # Graduates | % Graduates |
| Computers & Mathematics | 52 | 19.1% |
| Bio, Nature & Agricultural | 34 | 12.4% |
| Physical & Health Sciences | 9 | 3.3% |
| Psychology | 0 | 0.0% |
| Social Sciences | 21 | 7.7% |
| Engineering | 48 | 17.6% |
| Multidisciplinary Studies | 10 | 3.7% |
| Science & Technology | 0 | 0.0% |
| Business | 25 | 9.2% |
| Education | 30 | 11.0% |
| Literature & Languages | 0 | 0.0% |
| Liberal Arts & History | 22 | 8.1% |
| Visual & Performing Arts | 0 | 0.0% |
| Communications | 16 | 5.9% |
| Arts & Humanities | 6 | 2.2% |
| Total | 273 | 100.0% |
Transportation & Commute in Kent Narrows
Vehicle Availability by Sex in Kent Narrows
The most prevalent vehicle ownership categories in Kent Narrows are males with 3 vehicles (57, accounting for 35.4%) and females with 3 vehicles (19, making up 67.1%).
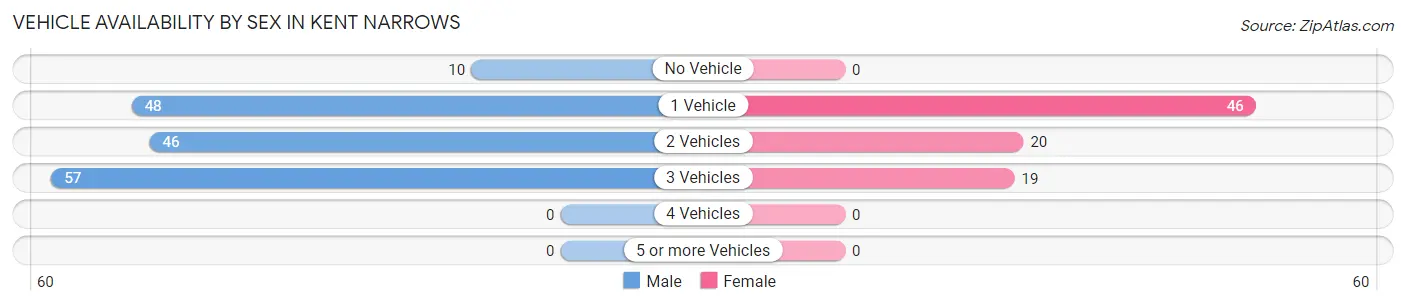
| Vehicles Available | Male | Female |
| No Vehicle | 10 (6.2%) | 0 (0.0%) |
| 1 Vehicle | 48 (29.8%) | 46 (54.1%) |
| 2 Vehicles | 46 (28.6%) | 20 (23.5%) |
| 3 Vehicles | 57 (35.4%) | 19 (22.4%) |
| 4 Vehicles | 0 (0.0%) | 0 (0.0%) |
| 5 or more Vehicles | 0 (0.0%) | 0 (0.0%) |
| Total | 161 (100.0%) | 85 (100.0%) |
Commute Time in Kent Narrows
The most frequently occuring commute durations in Kent Narrows are 10 to 14 minutes (70 commuters, 38.0%), 60 to 89 minutes (51 commuters, 27.7%), and 25 to 29 minutes (34 commuters, 18.5%).
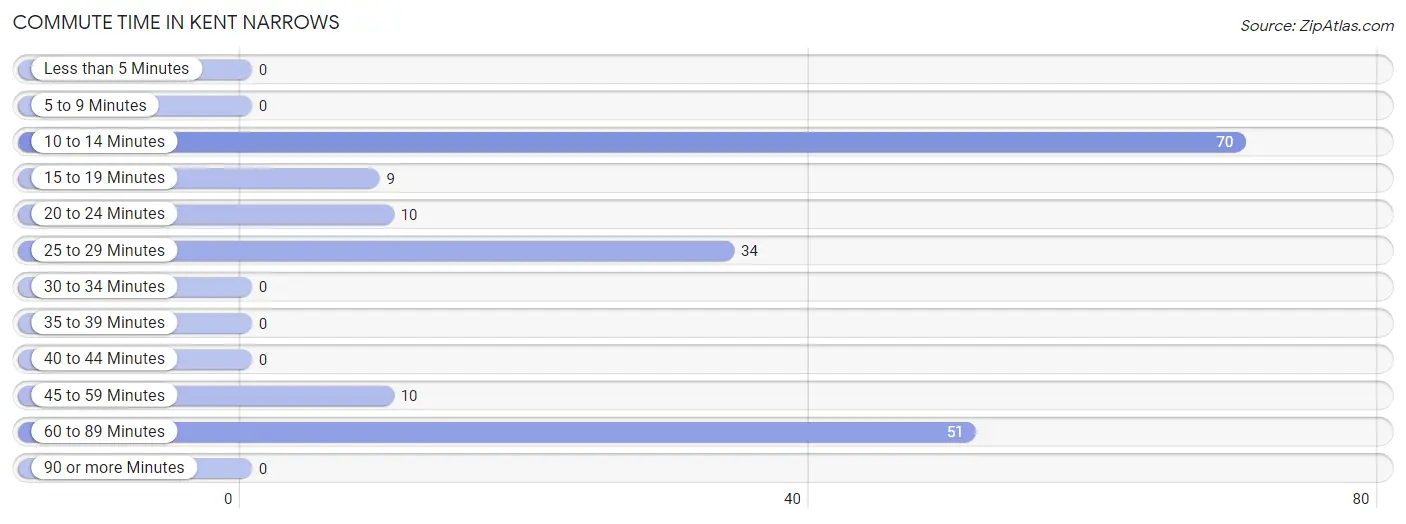
| Commute Time | # Commuters | % Commuters |
| Less than 5 Minutes | 0 | 0.0% |
| 5 to 9 Minutes | 0 | 0.0% |
| 10 to 14 Minutes | 70 | 38.0% |
| 15 to 19 Minutes | 9 | 4.9% |
| 20 to 24 Minutes | 10 | 5.4% |
| 25 to 29 Minutes | 34 | 18.5% |
| 30 to 34 Minutes | 0 | 0.0% |
| 35 to 39 Minutes | 0 | 0.0% |
| 40 to 44 Minutes | 0 | 0.0% |
| 45 to 59 Minutes | 10 | 5.4% |
| 60 to 89 Minutes | 51 | 27.7% |
| 90 or more Minutes | 0 | 0.0% |
Commute Time by Sex in Kent Narrows
The most common commute times in Kent Narrows are 60 to 89 minutes (51 commuters, 39.8%) for males and 10 to 14 minutes (46 commuters, 82.1%) for females.
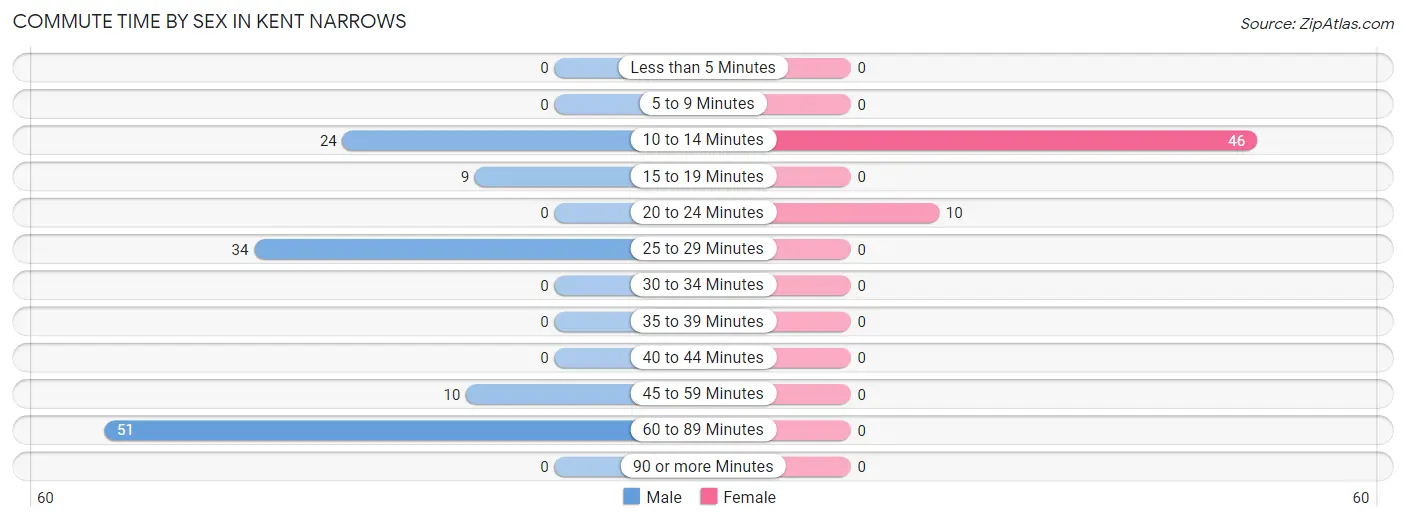
| Commute Time | Male | Female |
| Less than 5 Minutes | 0 (0.0%) | 0 (0.0%) |
| 5 to 9 Minutes | 0 (0.0%) | 0 (0.0%) |
| 10 to 14 Minutes | 24 (18.8%) | 46 (82.1%) |
| 15 to 19 Minutes | 9 (7.0%) | 0 (0.0%) |
| 20 to 24 Minutes | 0 (0.0%) | 10 (17.9%) |
| 25 to 29 Minutes | 34 (26.6%) | 0 (0.0%) |
| 30 to 34 Minutes | 0 (0.0%) | 0 (0.0%) |
| 35 to 39 Minutes | 0 (0.0%) | 0 (0.0%) |
| 40 to 44 Minutes | 0 (0.0%) | 0 (0.0%) |
| 45 to 59 Minutes | 10 (7.8%) | 0 (0.0%) |
| 60 to 89 Minutes | 51 (39.8%) | 0 (0.0%) |
| 90 or more Minutes | 0 (0.0%) | 0 (0.0%) |
Time of Departure to Work by Sex in Kent Narrows
The most frequent times of departure to work in Kent Narrows are 4:00 PM to 11:59 PM (34, 26.6%) for males and 9:00 AM to 9:59 AM (46, 82.1%) for females.
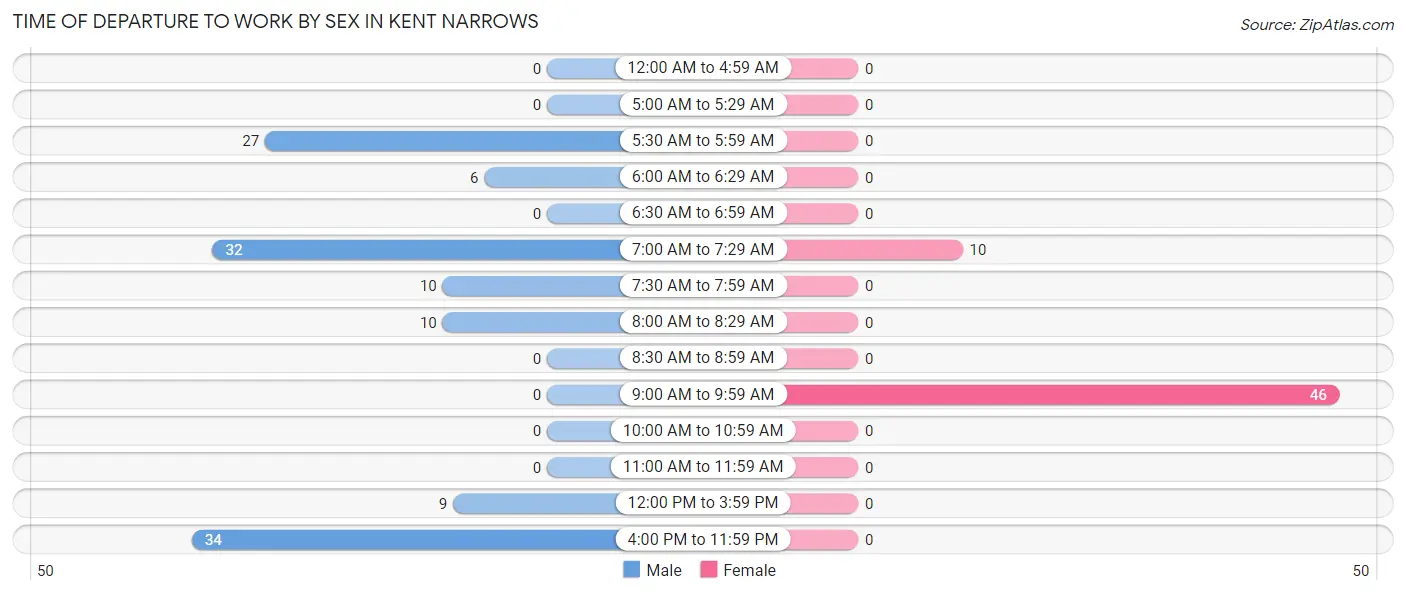
| Time of Departure | Male | Female |
| 12:00 AM to 4:59 AM | 0 (0.0%) | 0 (0.0%) |
| 5:00 AM to 5:29 AM | 0 (0.0%) | 0 (0.0%) |
| 5:30 AM to 5:59 AM | 27 (21.1%) | 0 (0.0%) |
| 6:00 AM to 6:29 AM | 6 (4.7%) | 0 (0.0%) |
| 6:30 AM to 6:59 AM | 0 (0.0%) | 0 (0.0%) |
| 7:00 AM to 7:29 AM | 32 (25.0%) | 10 (17.9%) |
| 7:30 AM to 7:59 AM | 10 (7.8%) | 0 (0.0%) |
| 8:00 AM to 8:29 AM | 10 (7.8%) | 0 (0.0%) |
| 8:30 AM to 8:59 AM | 0 (0.0%) | 0 (0.0%) |
| 9:00 AM to 9:59 AM | 0 (0.0%) | 46 (82.1%) |
| 10:00 AM to 10:59 AM | 0 (0.0%) | 0 (0.0%) |
| 11:00 AM to 11:59 AM | 0 (0.0%) | 0 (0.0%) |
| 12:00 PM to 3:59 PM | 9 (7.0%) | 0 (0.0%) |
| 4:00 PM to 11:59 PM | 34 (26.6%) | 0 (0.0%) |
| Total | 128 (100.0%) | 56 (100.0%) |
Housing Occupancy in Kent Narrows
Occupancy by Ownership in Kent Narrows
Of the total 297 dwellings in Kent Narrows, owner-occupied units account for 239 (80.5%), while renter-occupied units make up 58 (19.5%).
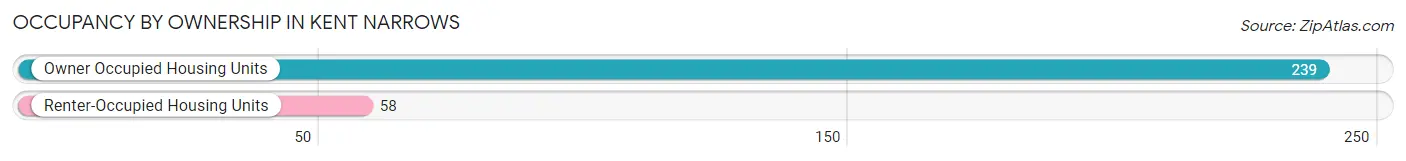
| Occupancy | # Housing Units | % Housing Units |
| Owner Occupied Housing Units | 239 | 80.5% |
| Renter-Occupied Housing Units | 58 | 19.5% |
| Total Occupied Housing Units | 297 | 100.0% |
Occupancy by Household Size in Kent Narrows
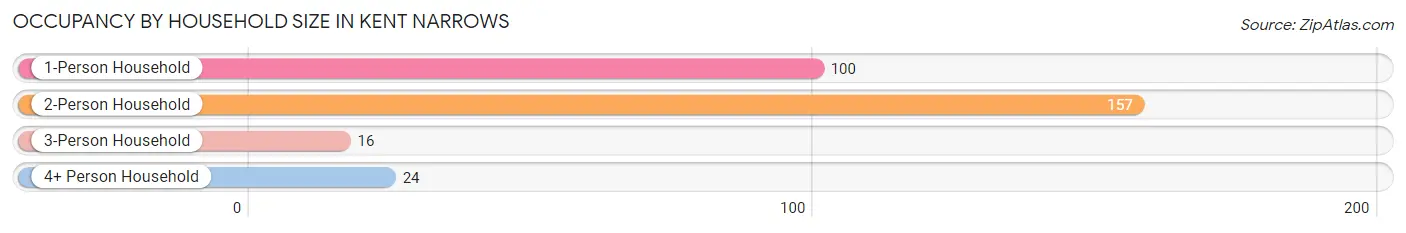
| Household Size | # Housing Units | % Housing Units |
| 1-Person Household | 100 | 33.7% |
| 2-Person Household | 157 | 52.9% |
| 3-Person Household | 16 | 5.4% |
| 4+ Person Household | 24 | 8.1% |
| Total Housing Units | 297 | 100.0% |
Occupancy by Ownership by Household Size in Kent Narrows
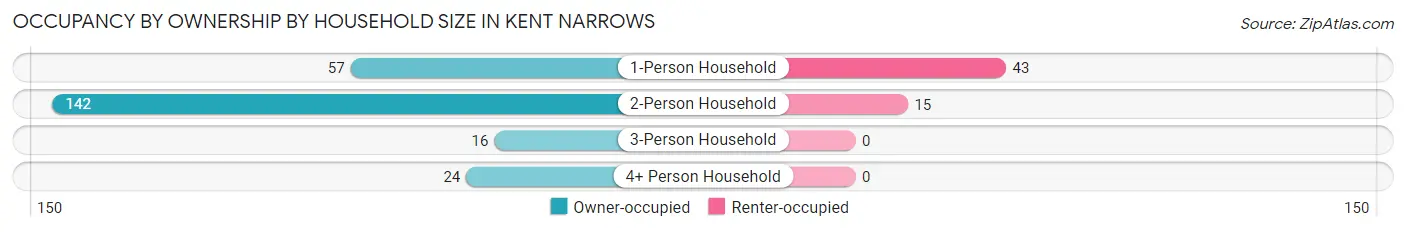
| Household Size | Owner-occupied | Renter-occupied |
| 1-Person Household | 57 (57.0%) | 43 (43.0%) |
| 2-Person Household | 142 (90.4%) | 15 (9.6%) |
| 3-Person Household | 16 (100.0%) | 0 (0.0%) |
| 4+ Person Household | 24 (100.0%) | 0 (0.0%) |
| Total Housing Units | 239 (80.5%) | 58 (19.5%) |
Occupancy by Educational Attainment in Kent Narrows
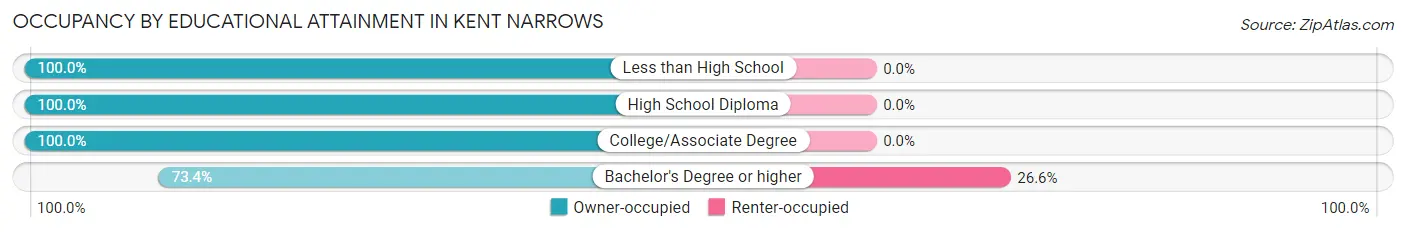
| Household Size | Owner-occupied | Renter-occupied |
| Less than High School | 6 (100.0%) | 0 (0.0%) |
| High School Diploma | 22 (100.0%) | 0 (0.0%) |
| College/Associate Degree | 51 (100.0%) | 0 (0.0%) |
| Bachelor's Degree or higher | 160 (73.4%) | 58 (26.6%) |
Occupancy by Age of Householder in Kent Narrows
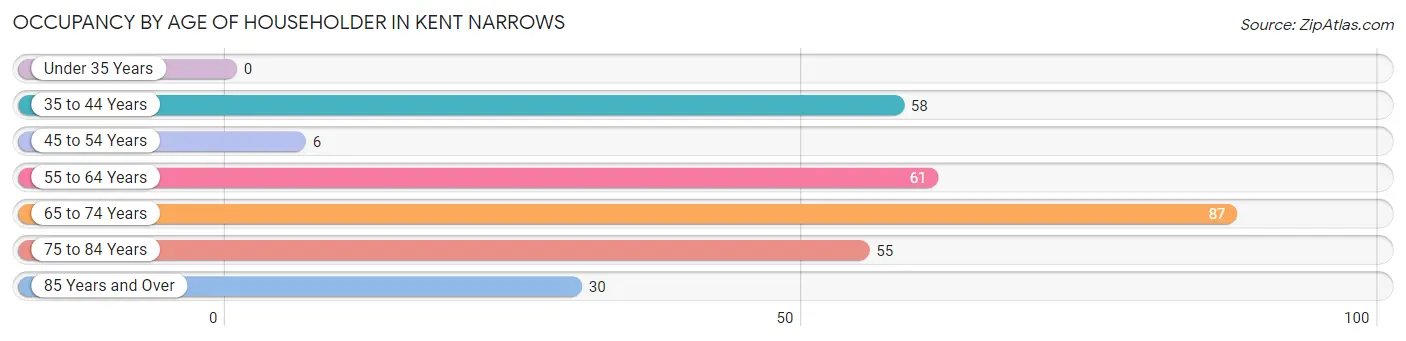
| Age Bracket | # Households | % Households |
| Under 35 Years | 0 | 0.0% |
| 35 to 44 Years | 58 | 19.5% |
| 45 to 54 Years | 6 | 2.0% |
| 55 to 64 Years | 61 | 20.5% |
| 65 to 74 Years | 87 | 29.3% |
| 75 to 84 Years | 55 | 18.5% |
| 85 Years and Over | 30 | 10.1% |
| Total | 297 | 100.0% |
Housing Finances in Kent Narrows
Median Income by Occupancy in Kent Narrows
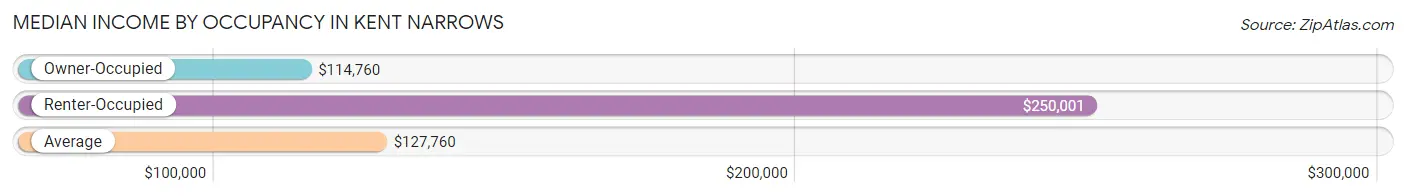
| Occupancy Type | # Households | Median Income |
| Owner-Occupied | 239 (80.5%) | $114,760 |
| Renter-Occupied | 58 (19.5%) | $250,001 |
| Average | 297 (100.0%) | $127,760 |
Occupancy by Householder Income Bracket in Kent Narrows
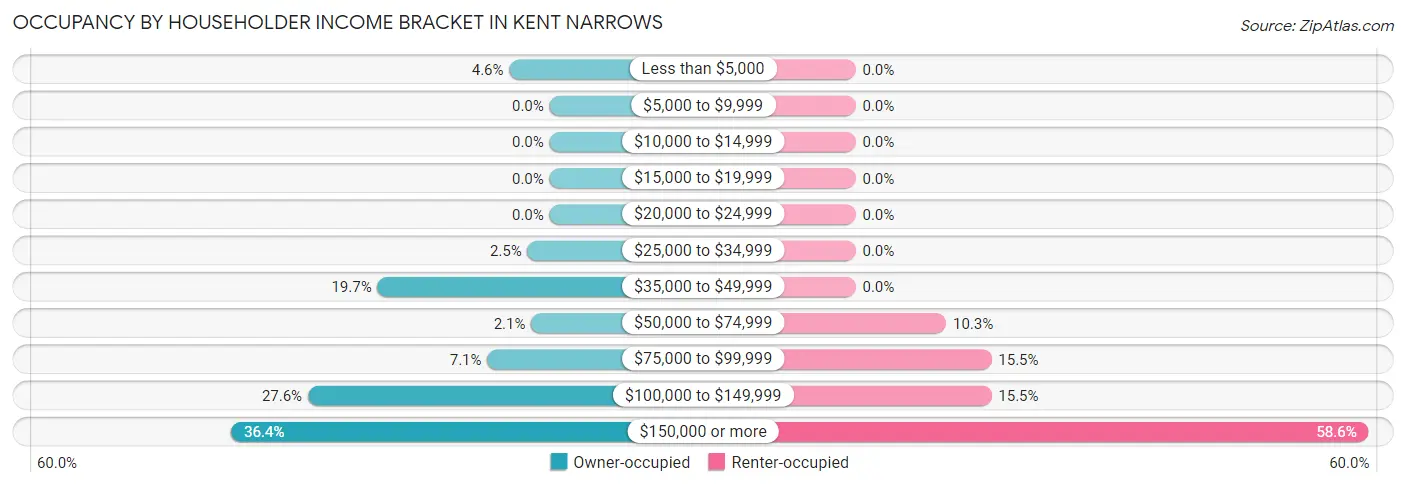
| Income Bracket | Owner-occupied | Renter-occupied |
| Less than $5,000 | 11 (4.6%) | 0 (0.0%) |
| $5,000 to $9,999 | 0 (0.0%) | 0 (0.0%) |
| $10,000 to $14,999 | 0 (0.0%) | 0 (0.0%) |
| $15,000 to $19,999 | 0 (0.0%) | 0 (0.0%) |
| $20,000 to $24,999 | 0 (0.0%) | 0 (0.0%) |
| $25,000 to $34,999 | 6 (2.5%) | 0 (0.0%) |
| $35,000 to $49,999 | 47 (19.7%) | 0 (0.0%) |
| $50,000 to $74,999 | 5 (2.1%) | 6 (10.3%) |
| $75,000 to $99,999 | 17 (7.1%) | 9 (15.5%) |
| $100,000 to $149,999 | 66 (27.6%) | 9 (15.5%) |
| $150,000 or more | 87 (36.4%) | 34 (58.6%) |
| Total | 239 (100.0%) | 58 (100.0%) |
Monthly Housing Cost Tiers in Kent Narrows
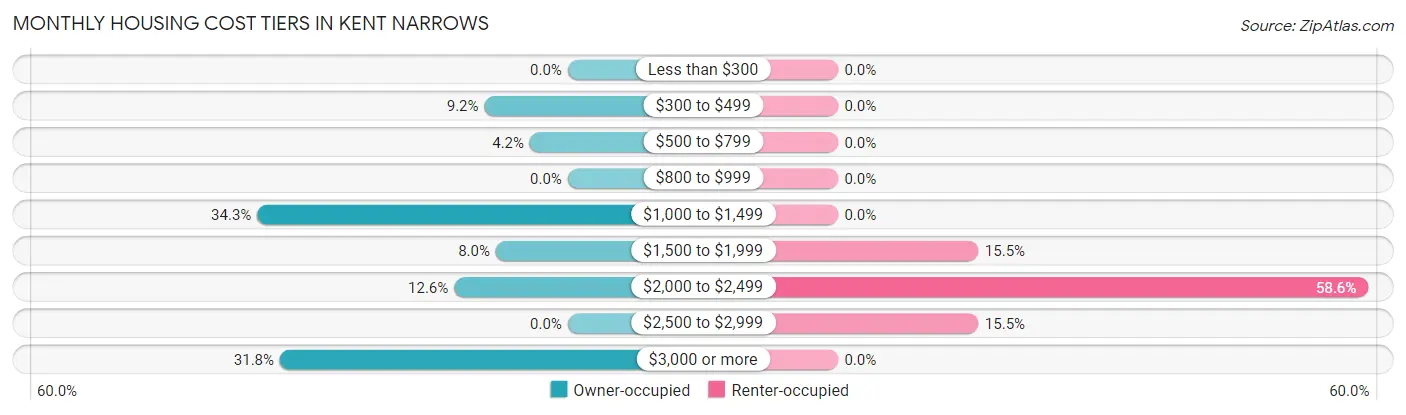
| Monthly Cost | Owner-occupied | Renter-occupied |
| Less than $300 | 0 (0.0%) | 0 (0.0%) |
| $300 to $499 | 22 (9.2%) | 0 (0.0%) |
| $500 to $799 | 10 (4.2%) | 0 (0.0%) |
| $800 to $999 | 0 (0.0%) | 0 (0.0%) |
| $1,000 to $1,499 | 82 (34.3%) | 0 (0.0%) |
| $1,500 to $1,999 | 19 (8.0%) | 9 (15.5%) |
| $2,000 to $2,499 | 30 (12.6%) | 34 (58.6%) |
| $2,500 to $2,999 | 0 (0.0%) | 9 (15.5%) |
| $3,000 or more | 76 (31.8%) | 0 (0.0%) |
| Total | 239 (100.0%) | 58 (100.0%) |
Physical Housing Characteristics in Kent Narrows
Housing Structures in Kent Narrows
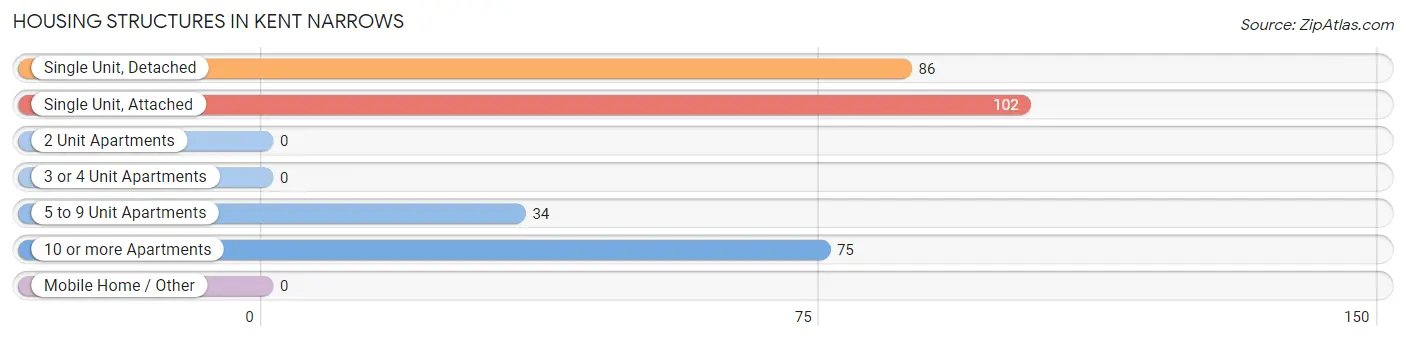
| Structure Type | # Housing Units | % Housing Units |
| Single Unit, Detached | 86 | 29.0% |
| Single Unit, Attached | 102 | 34.3% |
| 2 Unit Apartments | 0 | 0.0% |
| 3 or 4 Unit Apartments | 0 | 0.0% |
| 5 to 9 Unit Apartments | 34 | 11.5% |
| 10 or more Apartments | 75 | 25.3% |
| Mobile Home / Other | 0 | 0.0% |
| Total | 297 | 100.0% |
Housing Structures by Occupancy in Kent Narrows
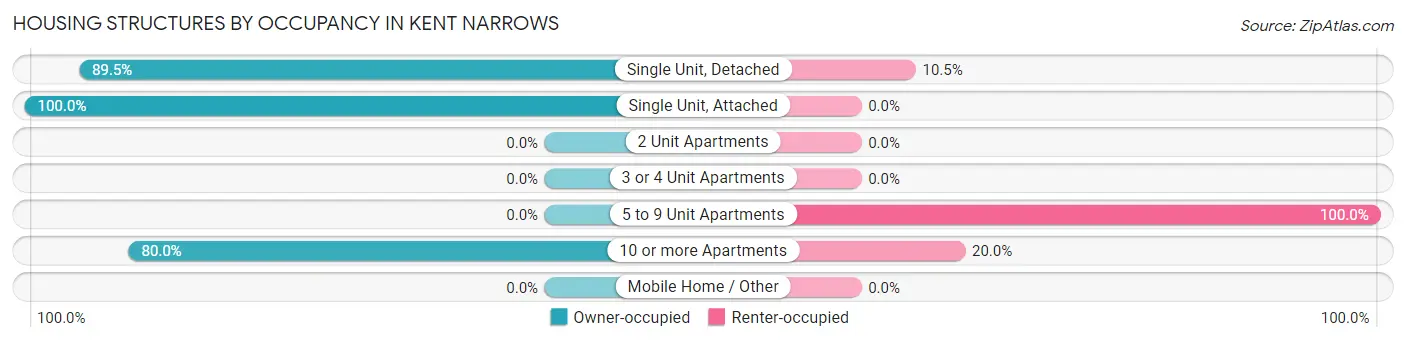
| Structure Type | Owner-occupied | Renter-occupied |
| Single Unit, Detached | 77 (89.5%) | 9 (10.5%) |
| Single Unit, Attached | 102 (100.0%) | 0 (0.0%) |
| 2 Unit Apartments | 0 (0.0%) | 0 (0.0%) |
| 3 or 4 Unit Apartments | 0 (0.0%) | 0 (0.0%) |
| 5 to 9 Unit Apartments | 0 (0.0%) | 34 (100.0%) |
| 10 or more Apartments | 60 (80.0%) | 15 (20.0%) |
| Mobile Home / Other | 0 (0.0%) | 0 (0.0%) |
| Total | 239 (80.5%) | 58 (19.5%) |
Housing Structures by Number of Rooms in Kent Narrows
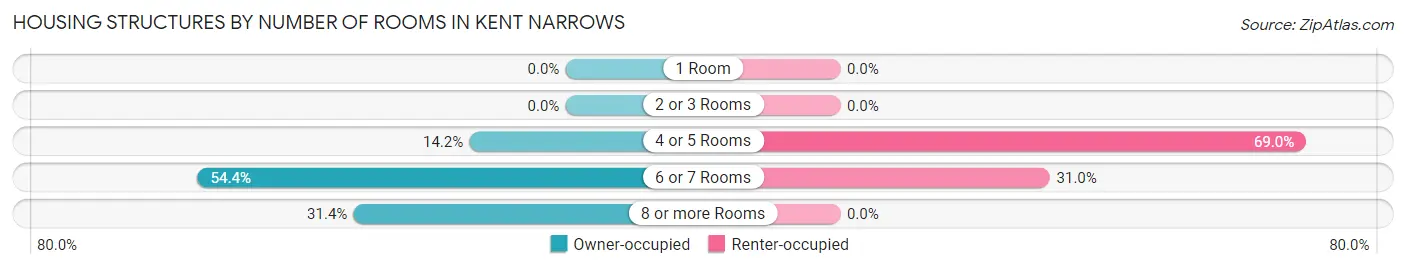
| Number of Rooms | Owner-occupied | Renter-occupied |
| 1 Room | 0 (0.0%) | 0 (0.0%) |
| 2 or 3 Rooms | 0 (0.0%) | 0 (0.0%) |
| 4 or 5 Rooms | 34 (14.2%) | 40 (69.0%) |
| 6 or 7 Rooms | 130 (54.4%) | 18 (31.0%) |
| 8 or more Rooms | 75 (31.4%) | 0 (0.0%) |
| Total | 239 (100.0%) | 58 (100.0%) |
Housing Structure by Heating Type in Kent Narrows
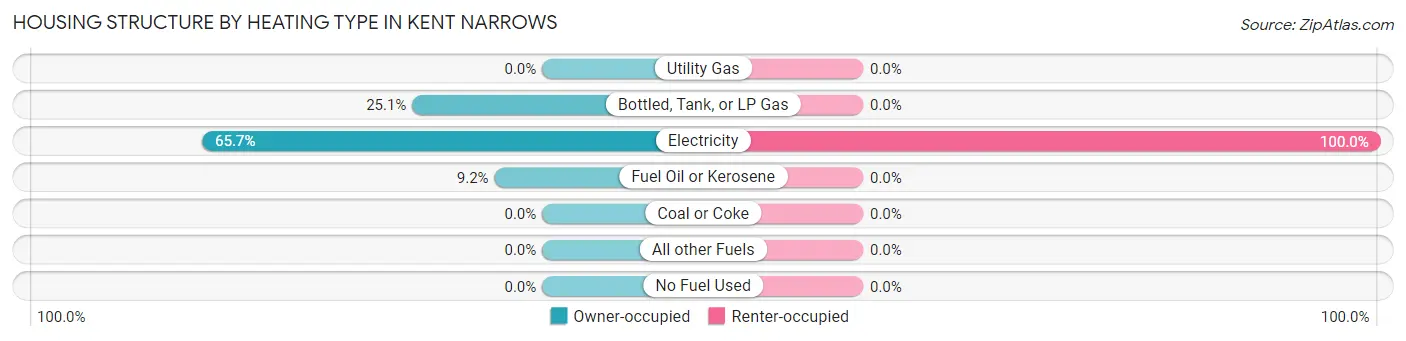
| Heating Type | Owner-occupied | Renter-occupied |
| Utility Gas | 0 (0.0%) | 0 (0.0%) |
| Bottled, Tank, or LP Gas | 60 (25.1%) | 0 (0.0%) |
| Electricity | 157 (65.7%) | 58 (100.0%) |
| Fuel Oil or Kerosene | 22 (9.2%) | 0 (0.0%) |
| Coal or Coke | 0 (0.0%) | 0 (0.0%) |
| All other Fuels | 0 (0.0%) | 0 (0.0%) |
| No Fuel Used | 0 (0.0%) | 0 (0.0%) |
| Total | 239 (100.0%) | 58 (100.0%) |
Household Vehicle Usage in Kent Narrows
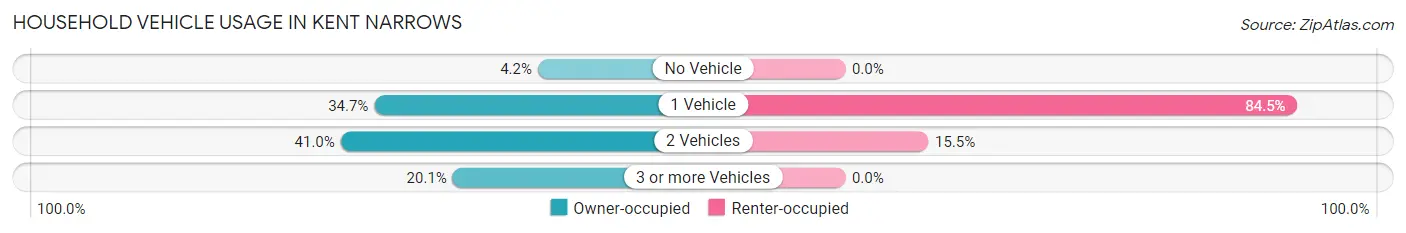
| Vehicles per Household | Owner-occupied | Renter-occupied |
| No Vehicle | 10 (4.2%) | 0 (0.0%) |
| 1 Vehicle | 83 (34.7%) | 49 (84.5%) |
| 2 Vehicles | 98 (41.0%) | 9 (15.5%) |
| 3 or more Vehicles | 48 (20.1%) | 0 (0.0%) |
| Total | 239 (100.0%) | 58 (100.0%) |
Real Estate & Mortgages in Kent Narrows
Real Estate and Mortgage Overview in Kent Narrows
| Characteristic | Without Mortgage | With Mortgage |
| Housing Units | 100 | 139 |
| Median Property Value | $472,500 | $637,500 |
| Median Household Income | - | - |
| Monthly Housing Costs | $1,200 | $76 |
| Real Estate Taxes | $4,469 | $0 |
Property Value by Mortgage Status in Kent Narrows
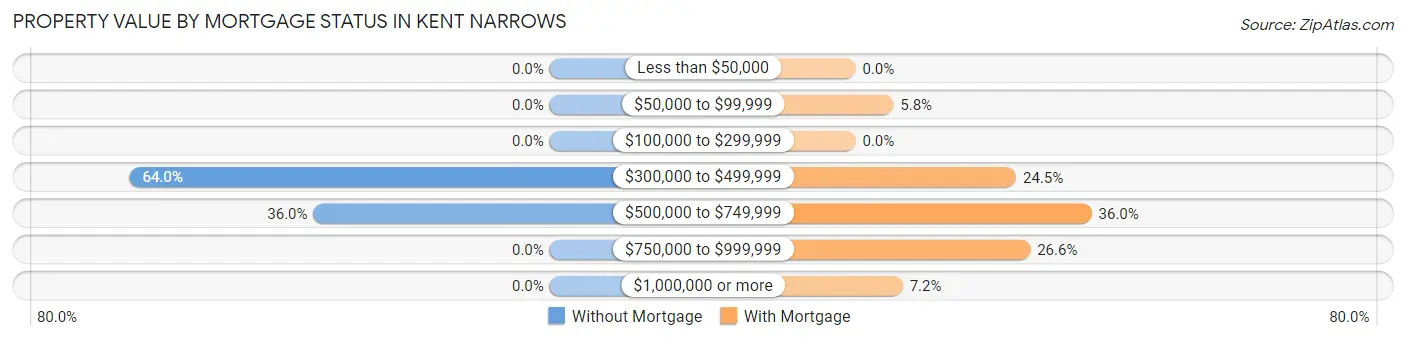
| Property Value | Without Mortgage | With Mortgage |
| Less than $50,000 | 0 (0.0%) | 0 (0.0%) |
| $50,000 to $99,999 | 0 (0.0%) | 8 (5.8%) |
| $100,000 to $299,999 | 0 (0.0%) | 0 (0.0%) |
| $300,000 to $499,999 | 64 (64.0%) | 34 (24.5%) |
| $500,000 to $749,999 | 36 (36.0%) | 50 (36.0%) |
| $750,000 to $999,999 | 0 (0.0%) | 37 (26.6%) |
| $1,000,000 or more | 0 (0.0%) | 10 (7.2%) |
| Total | 100 (100.0%) | 139 (100.0%) |
Household Income by Mortgage Status in Kent Narrows
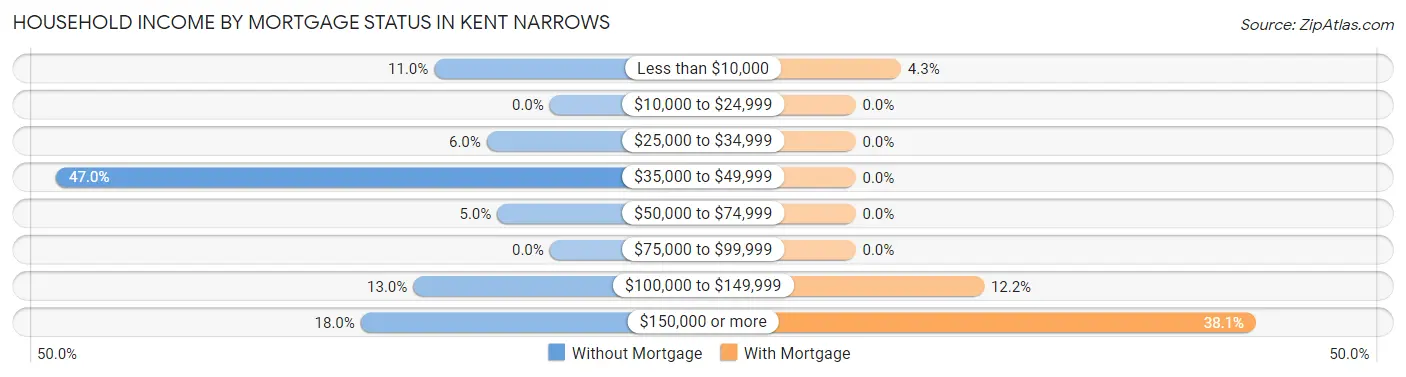
| Household Income | Without Mortgage | With Mortgage |
| Less than $10,000 | 11 (11.0%) | 6 (4.3%) |
| $10,000 to $24,999 | 0 (0.0%) | 0 (0.0%) |
| $25,000 to $34,999 | 6 (6.0%) | 0 (0.0%) |
| $35,000 to $49,999 | 47 (47.0%) | 0 (0.0%) |
| $50,000 to $74,999 | 5 (5.0%) | 0 (0.0%) |
| $75,000 to $99,999 | 0 (0.0%) | 0 (0.0%) |
| $100,000 to $149,999 | 13 (13.0%) | 17 (12.2%) |
| $150,000 or more | 18 (18.0%) | 53 (38.1%) |
| Total | 100 (100.0%) | 139 (100.0%) |
Property Value to Household Income Ratio in Kent Narrows
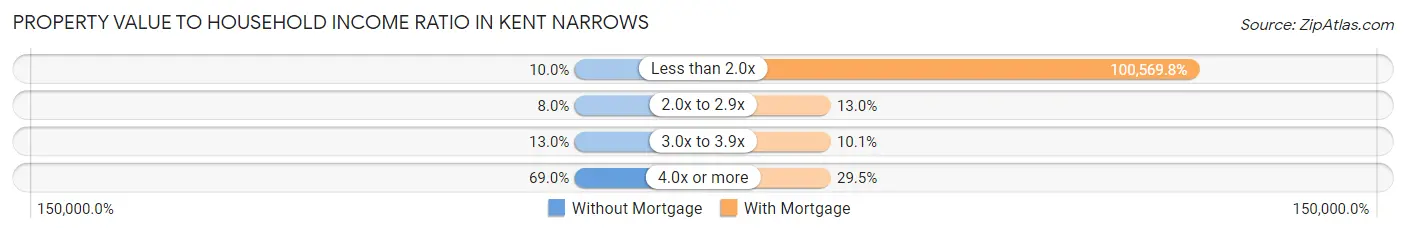
| Value-to-Income Ratio | Without Mortgage | With Mortgage |
| Less than 2.0x | 10 (10.0%) | 139,792 (100,569.8%) |
| 2.0x to 2.9x | 8 (8.0%) | 18 (13.0%) |
| 3.0x to 3.9x | 13 (13.0%) | 14 (10.1%) |
| 4.0x or more | 69 (69.0%) | 41 (29.5%) |
| Total | 100 (100.0%) | 139 (100.0%) |
Real Estate Taxes by Mortgage Status in Kent Narrows
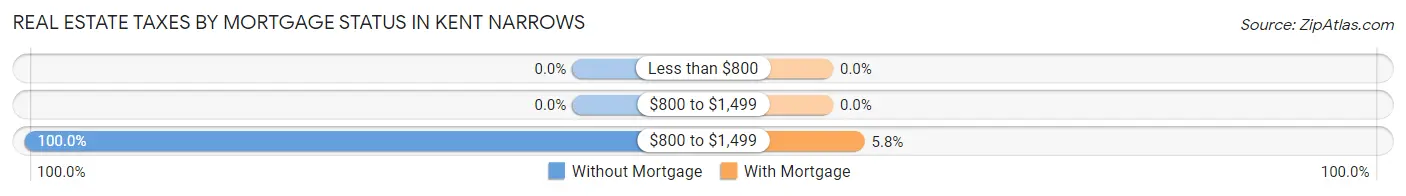
| Property Taxes | Without Mortgage | With Mortgage |
| Less than $800 | 0 (0.0%) | 0 (0.0%) |
| $800 to $1,499 | 0 (0.0%) | 0 (0.0%) |
| $800 to $1,499 | 100 (100.0%) | 8 (5.8%) |
| Total | 100 (100.0%) | 139 (100.0%) |
Health & Disability in Kent Narrows
Health Insurance Coverage by Age in Kent Narrows
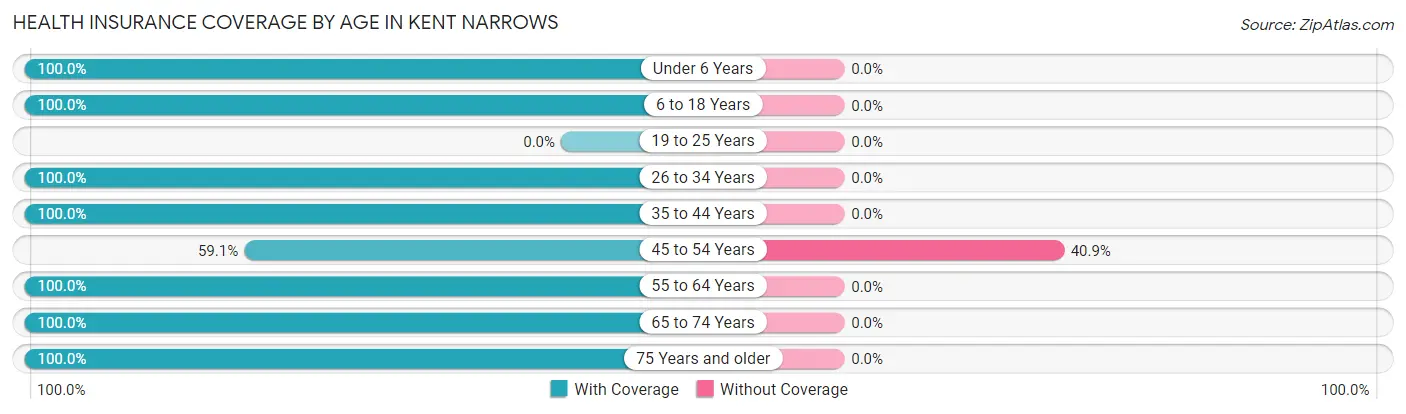
| Age Bracket | With Coverage | Without Coverage |
| Under 6 Years | 40 (100.0%) | 0 (0.0%) |
| 6 to 18 Years | 53 (100.0%) | 0 (0.0%) |
| 19 to 25 Years | 0 (0.0%) | 0 (0.0%) |
| 26 to 34 Years | 26 (100.0%) | 0 (0.0%) |
| 35 to 44 Years | 58 (100.0%) | 0 (0.0%) |
| 45 to 54 Years | 13 (59.1%) | 9 (40.9%) |
| 55 to 64 Years | 81 (100.0%) | 0 (0.0%) |
| 65 to 74 Years | 134 (100.0%) | 0 (0.0%) |
| 75 Years and older | 164 (100.0%) | 0 (0.0%) |
| Total | 569 (98.4%) | 9 (1.6%) |
Health Insurance Coverage by Citizenship Status in Kent Narrows
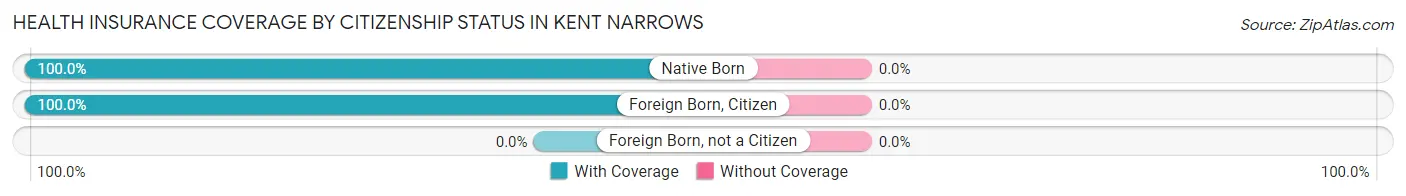
| Citizenship Status | With Coverage | Without Coverage |
| Native Born | 40 (100.0%) | 0 (0.0%) |
| Foreign Born, Citizen | 53 (100.0%) | 0 (0.0%) |
| Foreign Born, not a Citizen | 0 (0.0%) | 0 (0.0%) |
Health Insurance Coverage by Household Income in Kent Narrows
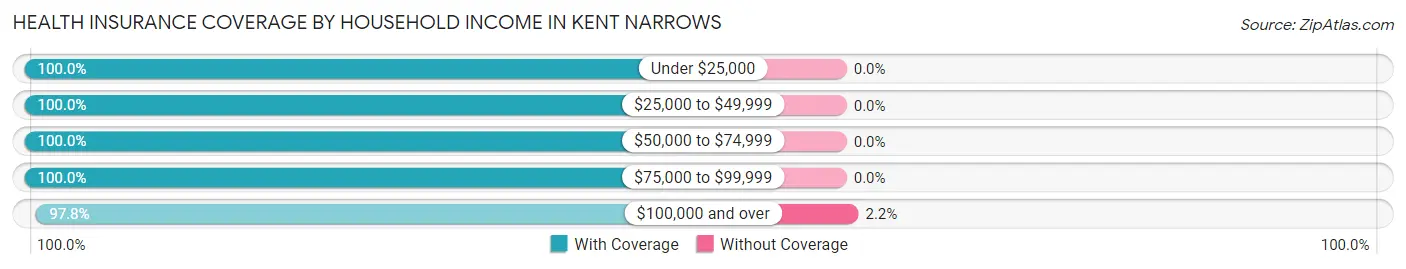
| Household Income | With Coverage | Without Coverage |
| Under $25,000 | 11 (100.0%) | 0 (0.0%) |
| $25,000 to $49,999 | 100 (100.0%) | 0 (0.0%) |
| $50,000 to $74,999 | 21 (100.0%) | 0 (0.0%) |
| $75,000 to $99,999 | 36 (100.0%) | 0 (0.0%) |
| $100,000 and over | 401 (97.8%) | 9 (2.2%) |
Public vs Private Health Insurance Coverage by Age in Kent Narrows
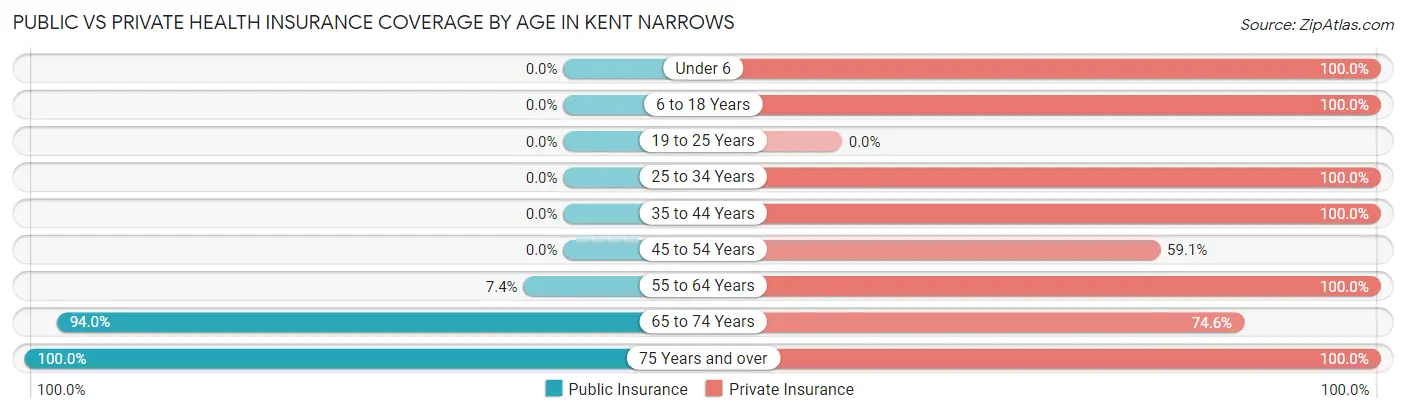
| Age Bracket | Public Insurance | Private Insurance |
| Under 6 | 0 (0.0%) | 40 (100.0%) |
| 6 to 18 Years | 0 (0.0%) | 53 (100.0%) |
| 19 to 25 Years | 0 (0.0%) | 0 (0.0%) |
| 25 to 34 Years | 0 (0.0%) | 26 (100.0%) |
| 35 to 44 Years | 0 (0.0%) | 58 (100.0%) |
| 45 to 54 Years | 0 (0.0%) | 13 (59.1%) |
| 55 to 64 Years | 6 (7.4%) | 81 (100.0%) |
| 65 to 74 Years | 126 (94.0%) | 100 (74.6%) |
| 75 Years and over | 164 (100.0%) | 164 (100.0%) |
| Total | 296 (51.2%) | 535 (92.6%) |
Disability Status by Sex by Age in Kent Narrows
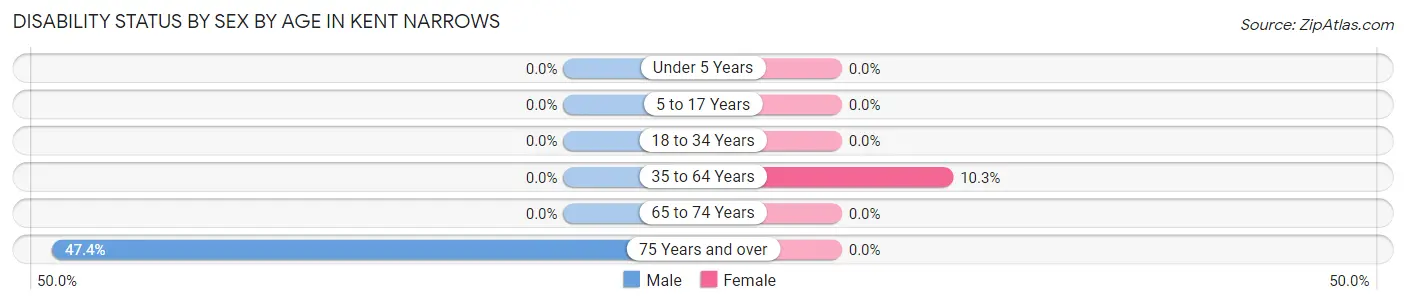
| Age Bracket | Male | Female |
| Under 5 Years | 0 (0.0%) | 0 (0.0%) |
| 5 to 17 Years | 0 (0.0%) | 0 (0.0%) |
| 18 to 34 Years | 0 (0.0%) | 0 (0.0%) |
| 35 to 64 Years | 0 (0.0%) | 6 (10.3%) |
| 65 to 74 Years | 0 (0.0%) | 0 (0.0%) |
| 75 Years and over | 37 (47.4%) | 0 (0.0%) |
Disability Class by Sex by Age in Kent Narrows
Disability Class: Hearing Difficulty
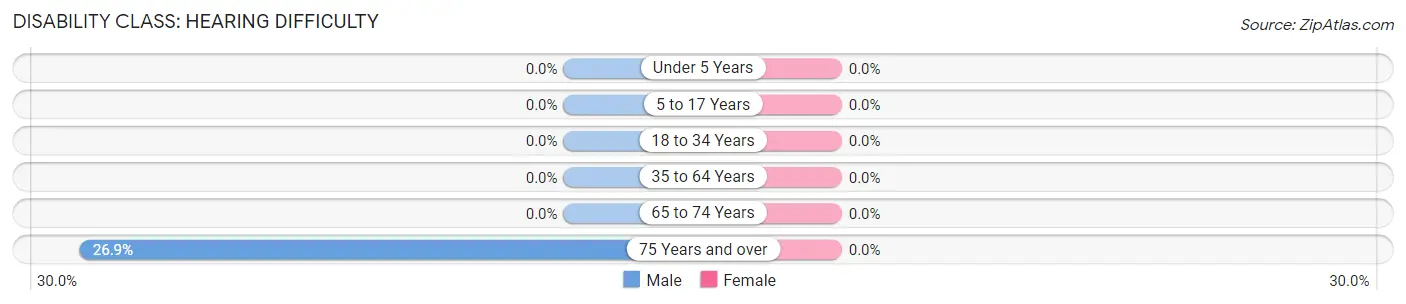
| Age Bracket | Male | Female |
| Under 5 Years | 0 (0.0%) | 0 (0.0%) |
| 5 to 17 Years | 0 (0.0%) | 0 (0.0%) |
| 18 to 34 Years | 0 (0.0%) | 0 (0.0%) |
| 35 to 64 Years | 0 (0.0%) | 0 (0.0%) |
| 65 to 74 Years | 0 (0.0%) | 0 (0.0%) |
| 75 Years and over | 21 (26.9%) | 0 (0.0%) |
Disability Class: Vision Difficulty
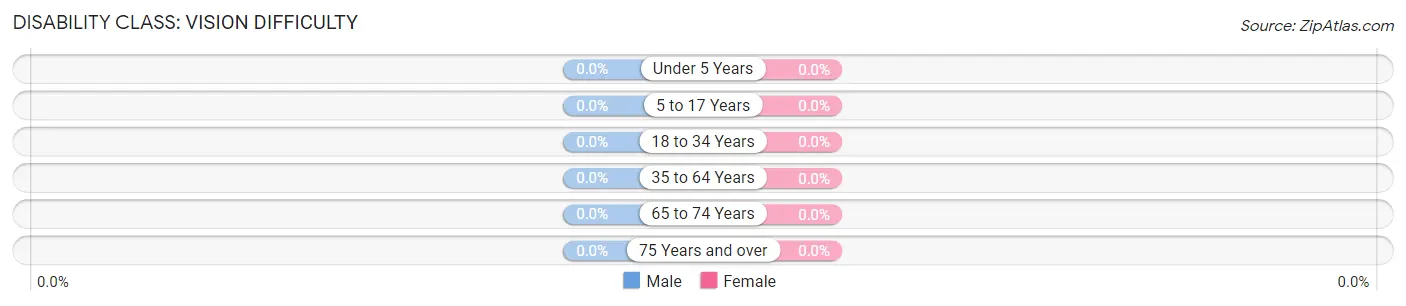
| Age Bracket | Male | Female |
| Under 5 Years | 0 (0.0%) | 0 (0.0%) |
| 5 to 17 Years | 0 (0.0%) | 0 (0.0%) |
| 18 to 34 Years | 0 (0.0%) | 0 (0.0%) |
| 35 to 64 Years | 0 (0.0%) | 0 (0.0%) |
| 65 to 74 Years | 0 (0.0%) | 0 (0.0%) |
| 75 Years and over | 0 (0.0%) | 0 (0.0%) |
Disability Class: Cognitive Difficulty
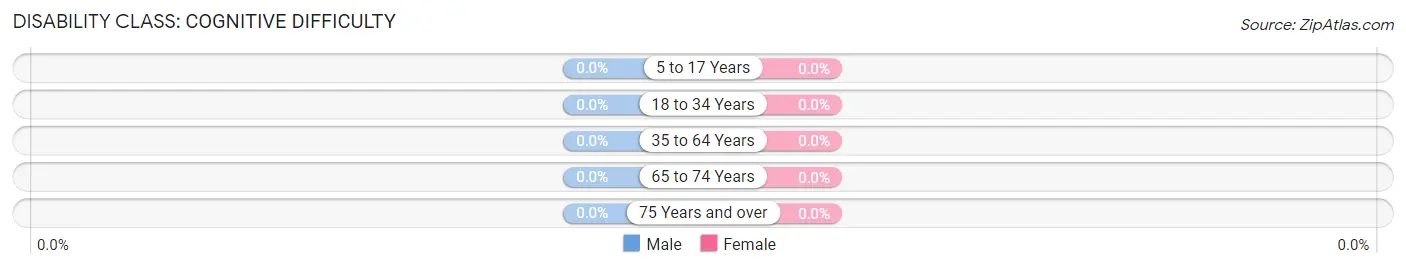
| Age Bracket | Male | Female |
| 5 to 17 Years | 0 (0.0%) | 0 (0.0%) |
| 18 to 34 Years | 0 (0.0%) | 0 (0.0%) |
| 35 to 64 Years | 0 (0.0%) | 0 (0.0%) |
| 65 to 74 Years | 0 (0.0%) | 0 (0.0%) |
| 75 Years and over | 0 (0.0%) | 0 (0.0%) |
Disability Class: Ambulatory Difficulty
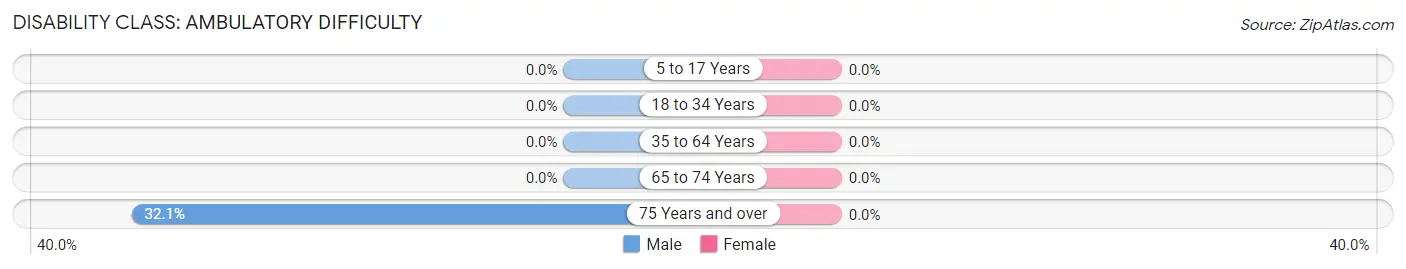
| Age Bracket | Male | Female |
| 5 to 17 Years | 0 (0.0%) | 0 (0.0%) |
| 18 to 34 Years | 0 (0.0%) | 0 (0.0%) |
| 35 to 64 Years | 0 (0.0%) | 0 (0.0%) |
| 65 to 74 Years | 0 (0.0%) | 0 (0.0%) |
| 75 Years and over | 25 (32.1%) | 0 (0.0%) |
Disability Class: Self-Care Difficulty
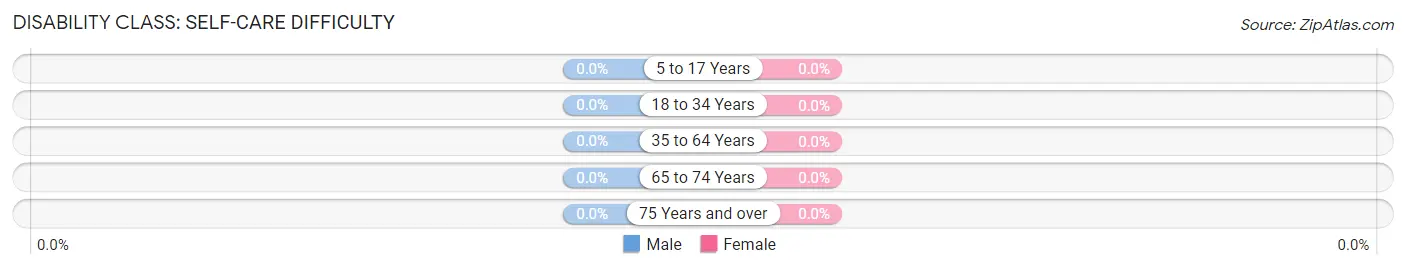
| Age Bracket | Male | Female |
| 5 to 17 Years | 0 (0.0%) | 0 (0.0%) |
| 18 to 34 Years | 0 (0.0%) | 0 (0.0%) |
| 35 to 64 Years | 0 (0.0%) | 0 (0.0%) |
| 65 to 74 Years | 0 (0.0%) | 0 (0.0%) |
| 75 Years and over | 0 (0.0%) | 0 (0.0%) |
Technology Access in Kent Narrows
Computing Device Access in Kent Narrows
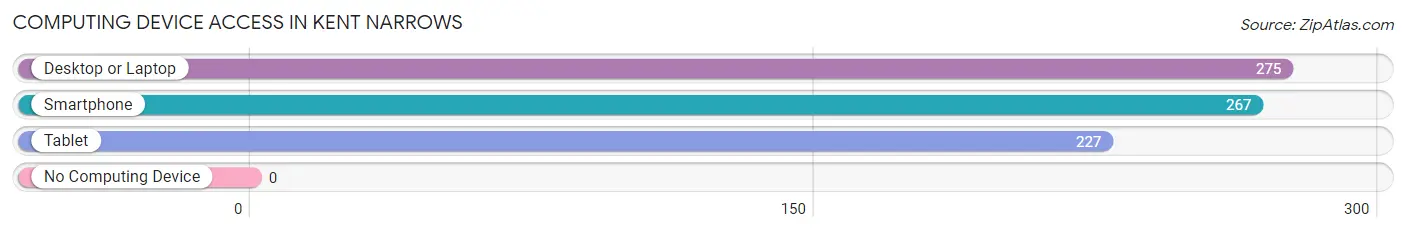
| Device Type | # Households | % Households |
| Desktop or Laptop | 275 | 92.6% |
| Smartphone | 267 | 89.9% |
| Tablet | 227 | 76.4% |
| No Computing Device | 0 | 0.0% |
| Total | 297 | 100.0% |
Internet Access in Kent Narrows
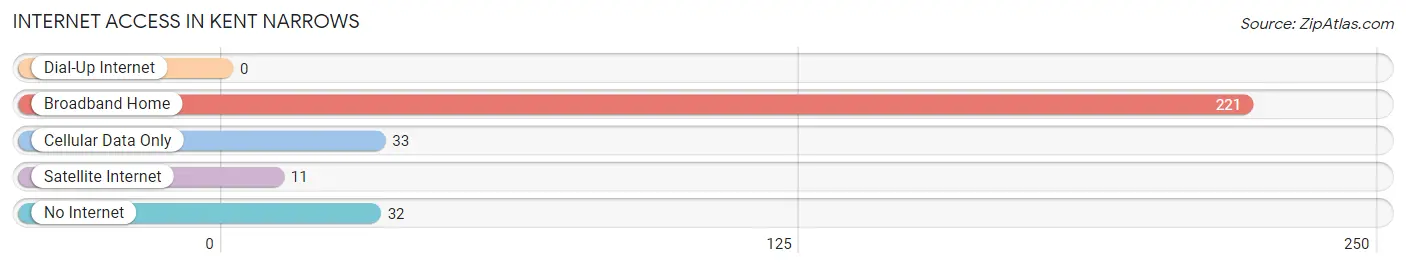
| Internet Type | # Households | % Households |
| Dial-Up Internet | 0 | 0.0% |
| Broadband Home | 221 | 74.4% |
| Cellular Data Only | 33 | 11.1% |
| Satellite Internet | 11 | 3.7% |
| No Internet | 32 | 10.8% |
| Total | 297 | 100.0% |
Kent Narrows Summary
Kent Narrows is a small community located in Queen Anne’s County, Maryland. It is situated on the western shore of the Chesapeake Bay, just south of the town of Grasonville. The area is known for its picturesque views of the bay and its abundance of wildlife.
History
The area now known as Kent Narrows has a long and varied history. The first settlers arrived in the area in the late 1600s, and the area was known as “The Narrows” due to its narrow strip of land between the Chesapeake Bay and the Chester River. The area was used for fishing and farming, and the first recorded land grant in the area was given to William Kent in 1702.
The area was a popular spot for recreational activities, and in the late 1800s, the area was developed as a resort community. The Kent Narrows Hotel was built in 1891, and the area became a popular destination for vacationers. The hotel was destroyed by fire in the early 1900s, but the area remained a popular spot for fishing and boating.
In the mid-1900s, the area began to develop as a residential community. The Kent Narrows Bridge was built in the 1950s, connecting the area to the mainland. The bridge was replaced in the late 1990s, and the area has continued to grow as a residential community.
Geography
Kent Narrows is located on the western shore of the Chesapeake Bay, just south of the town of Grasonville. The area is bordered by the Chester River to the north and the Kent Narrows Bridge to the south. The area is known for its picturesque views of the bay and its abundance of wildlife.
The area is mostly flat, with some low hills in the northern part of the area. The area is mostly covered in marshland and wetlands, and there are several small creeks and streams that flow through the area. The area is home to a variety of wildlife, including deer, foxes, and a variety of birds.
Economy
The economy of Kent Narrows is largely based on tourism and recreation. The area is known for its picturesque views of the bay and its abundance of wildlife, and it is a popular destination for fishing, boating, and other outdoor activities. The area is also home to several marinas, restaurants, and other businesses that cater to tourists and locals alike.
The area is also home to several manufacturing and industrial businesses, including a boat manufacturing plant and a seafood processing plant. The area is also home to several small businesses, including retail stores, restaurants, and other services.
Demographics
As of the 2010 census, the population of Kent Narrows was 2,845. The population is mostly white (90.3%), with a small percentage of African Americans (4.2%) and Hispanics (2.2%). The median household income in the area is $63,917, and the median home value is $310,000.
The area is served by the Queen Anne’s County Public Schools system, and there are several private schools in the area as well. The area is also home to several churches, including the Kent Narrows United Methodist Church and the Kent Narrows Baptist Church.
Conclusion
Kent Narrows is a small community located on the western shore of the Chesapeake Bay in Queen Anne’s County, Maryland. The area is known for its picturesque views of the bay and its abundance of wildlife, and it is a popular destination for fishing, boating, and other outdoor activities. The area is mostly white, with a small percentage of African Americans and Hispanics. The economy of the area is largely based on tourism and recreation, and there are several small businesses in the area as well. The area is served by the Queen Anne’s County Public Schools system, and there are several churches in the area as well.
Common Questions
What is Per Capita Income in Kent Narrows?
Per Capita income in Kent Narrows is $91,376.
What is the Median Family Income in Kent Narrows?
Median Family Income in Kent Narrows is $128,073.
What is the Median Household income in Kent Narrows?
Median Household Income in Kent Narrows is $127,760.
What is Income or Wage Gap in Kent Narrows?
Income or Wage Gap in Kent Narrows is 77.9%.
Women in Kent Narrows earn 22.1 cents for every dollar earned by a man.
What is Inequality or Gini Index in Kent Narrows?
Inequality or Gini Index in Kent Narrows is 0.43.
What is the Total Population of Kent Narrows?
Total Population of Kent Narrows is 578.
What is the Total Male Population of Kent Narrows?
Total Male Population of Kent Narrows is 313.
What is the Total Female Population of Kent Narrows?
Total Female Population of Kent Narrows is 265.
What is the Ratio of Males per 100 Females in Kent Narrows?
There are 118.11 Males per 100 Females in Kent Narrows.
What is the Ratio of Females per 100 Males in Kent Narrows?
There are 84.66 Females per 100 Males in Kent Narrows.
What is the Median Population Age in Kent Narrows?
Median Population Age in Kent Narrows is 66.5 Years.
What is the Average Family Size in Kent Narrows
Average Family Size in Kent Narrows is 2.4 People.
What is the Average Household Size in Kent Narrows
Average Household Size in Kent Narrows is 1.9 People.
How Large is the Labor Force in Kent Narrows?
There are 246 People in the Labor Forcein in Kent Narrows.
What is the Percentage of People in the Labor Force in Kent Narrows?
47.8% of People are in the Labor Force in Kent Narrows.