Clear Spring, MD Map & Demographics
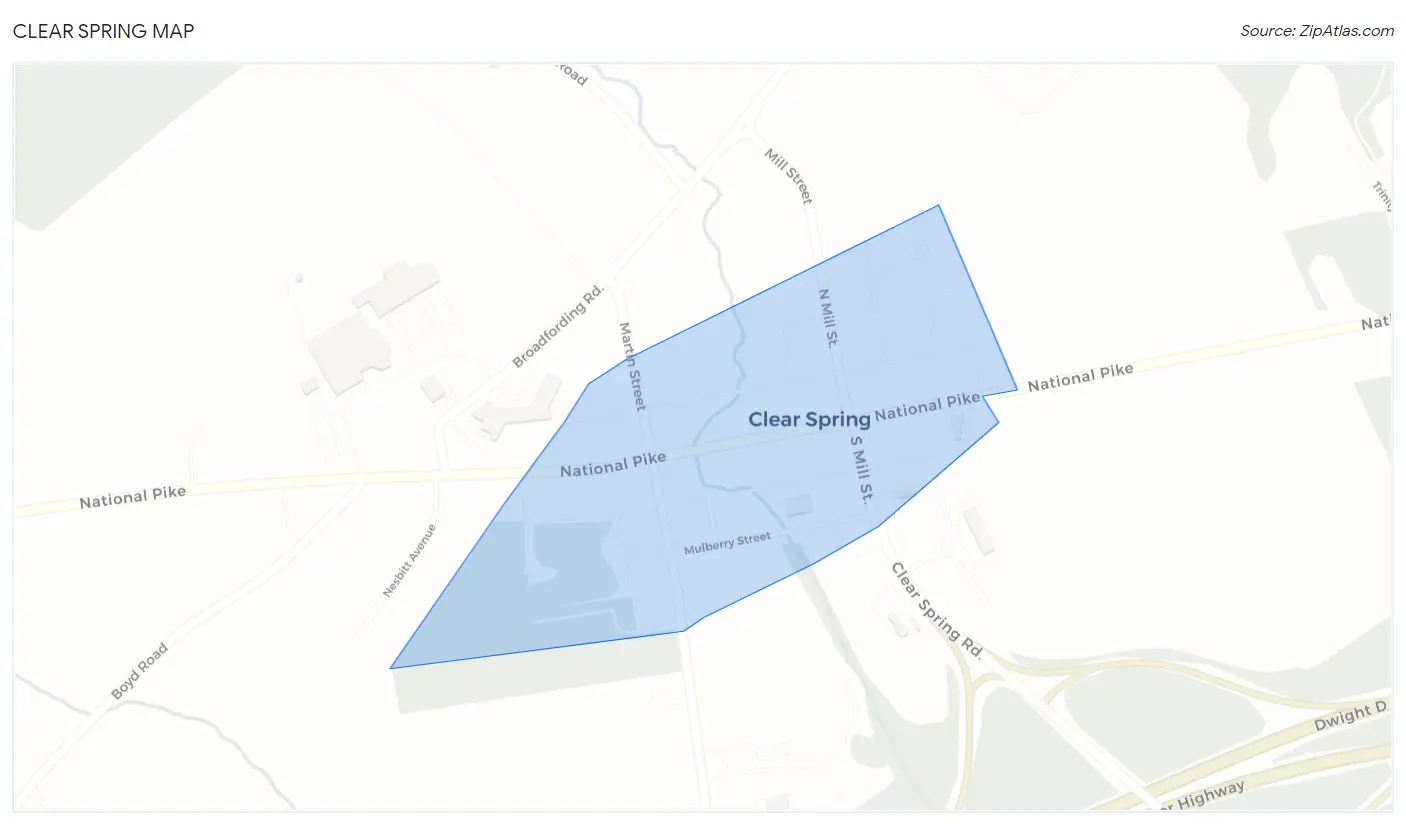
Clear Spring Map
Clear Spring Overview
$40,065
PER CAPITA INCOME
$54,375
AVG FAMILY INCOME
$58,000
AVG HOUSEHOLD INCOME
33.3%
WAGE / INCOME GAP [ % ]
66.7¢/ $1
WAGE / INCOME GAP [ $ ]
0.49
INEQUALITY / GINI INDEX
411
TOTAL POPULATION
170
MALE POPULATION
241
FEMALE POPULATION
70.54
MALES / 100 FEMALES
141.76
FEMALES / 100 MALES
35.8
MEDIAN AGE
3.0
AVG FAMILY SIZE
2.5
AVG HOUSEHOLD SIZE
224
LABOR FORCE [ PEOPLE ]
71.8%
PERCENT IN LABOR FORCE
1.3%
UNEMPLOYMENT RATE
Clear Spring Zip Codes
Clear Spring Area Codes
Income in Clear Spring
Income Overview in Clear Spring
Per Capita Income in Clear Spring is $40,065, while median incomes of families and households are $54,375 and $58,000 respectively.
| Characteristic | Number | Measure |
| Per Capita Income | 411 | $40,065 |
| Median Family Income | 107 | $54,375 |
| Mean Family Income | 107 | $94,876 |
| Median Household Income | 164 | $58,000 |
| Mean Household Income | 164 | $98,446 |
| Income Deficit | 107 | $0 |
| Wage / Income Gap (%) | 411 | 33.33% |
| Wage / Income Gap ($) | 411 | 66.67¢ per $1 |
| Gini / Inequality Index | 411 | 0.49 |
Earnings by Sex in Clear Spring
Average Earnings in Clear Spring are $42,188, $53,750 for men and $35,833 for women, a difference of 33.3%.
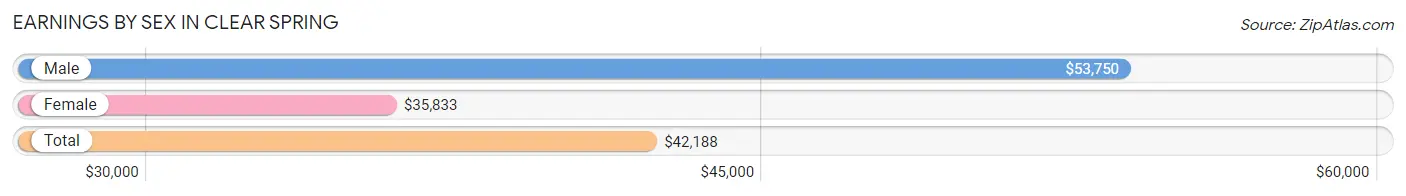
| Sex | Number | Average Earnings |
| Male | 93 (42.1%) | $53,750 |
| Female | 128 (57.9%) | $35,833 |
| Total | 221 (100.0%) | $42,188 |
Earnings by Sex by Income Bracket in Clear Spring
The most common earnings brackets in Clear Spring are $75,000 to $99,999 for men (14 | 15.0%) and $22,500 to $24,999 for women (20 | 15.6%).
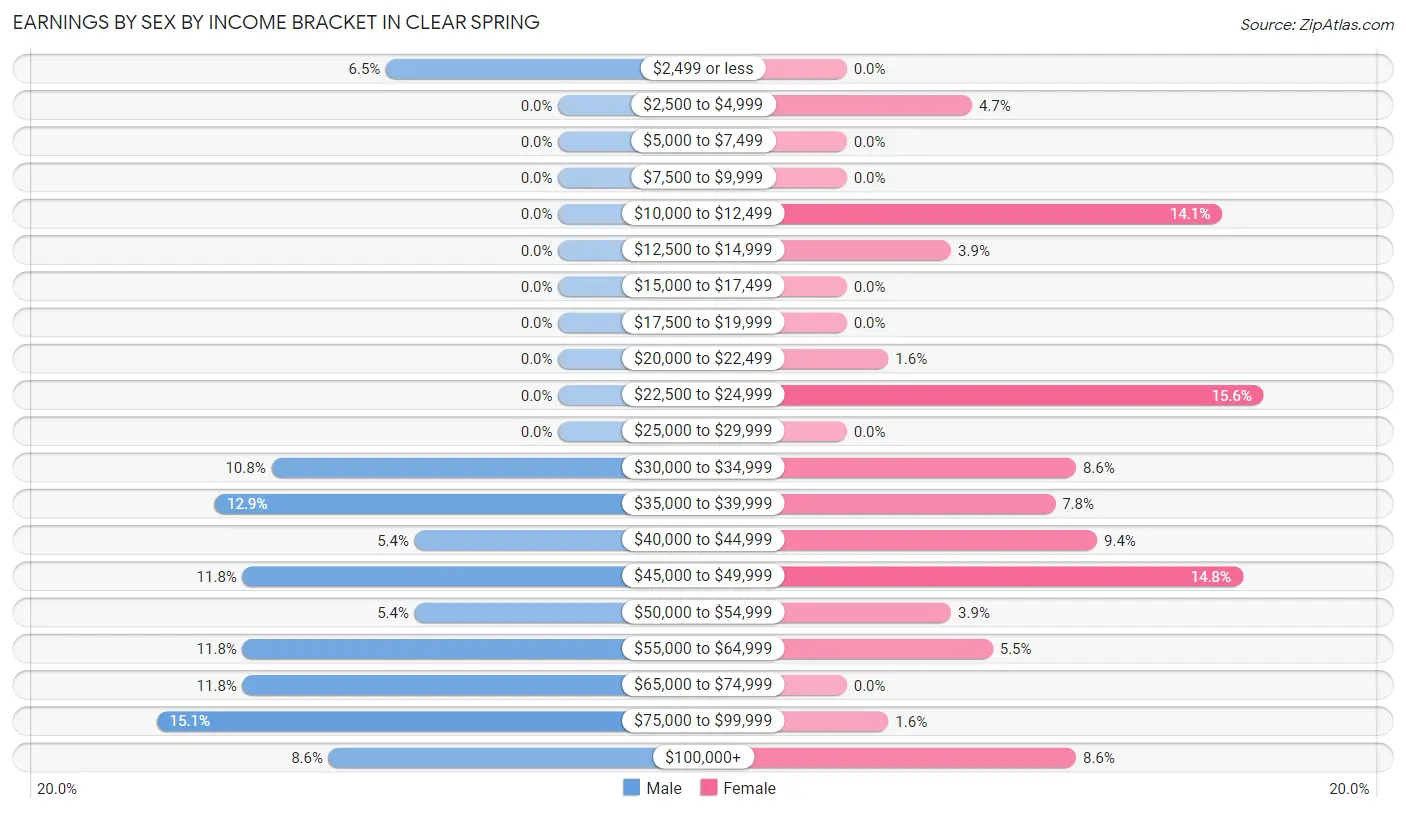
| Income | Male | Female |
| $2,499 or less | 6 (6.5%) | 0 (0.0%) |
| $2,500 to $4,999 | 0 (0.0%) | 6 (4.7%) |
| $5,000 to $7,499 | 0 (0.0%) | 0 (0.0%) |
| $7,500 to $9,999 | 0 (0.0%) | 0 (0.0%) |
| $10,000 to $12,499 | 0 (0.0%) | 18 (14.1%) |
| $12,500 to $14,999 | 0 (0.0%) | 5 (3.9%) |
| $15,000 to $17,499 | 0 (0.0%) | 0 (0.0%) |
| $17,500 to $19,999 | 0 (0.0%) | 0 (0.0%) |
| $20,000 to $22,499 | 0 (0.0%) | 2 (1.6%) |
| $22,500 to $24,999 | 0 (0.0%) | 20 (15.6%) |
| $25,000 to $29,999 | 0 (0.0%) | 0 (0.0%) |
| $30,000 to $34,999 | 10 (10.7%) | 11 (8.6%) |
| $35,000 to $39,999 | 12 (12.9%) | 10 (7.8%) |
| $40,000 to $44,999 | 5 (5.4%) | 12 (9.4%) |
| $45,000 to $49,999 | 11 (11.8%) | 19 (14.8%) |
| $50,000 to $54,999 | 5 (5.4%) | 5 (3.9%) |
| $55,000 to $64,999 | 11 (11.8%) | 7 (5.5%) |
| $65,000 to $74,999 | 11 (11.8%) | 0 (0.0%) |
| $75,000 to $99,999 | 14 (15.0%) | 2 (1.6%) |
| $100,000+ | 8 (8.6%) | 11 (8.6%) |
| Total | 93 (100.0%) | 128 (100.0%) |
Earnings by Sex by Educational Attainment in Clear Spring
Average earnings in Clear Spring are $56,250 for men and $40,714 for women, a difference of 27.6%. Men with an educational attainment of high school diploma enjoy the highest average annual earnings of $59,500, while those with college or associate's degree education earn the least with $47,000. Women with an educational attainment of graduate degree earn the most with the average annual earnings of $45,625, while those with high school diploma education have the smallest earnings of $41,500.
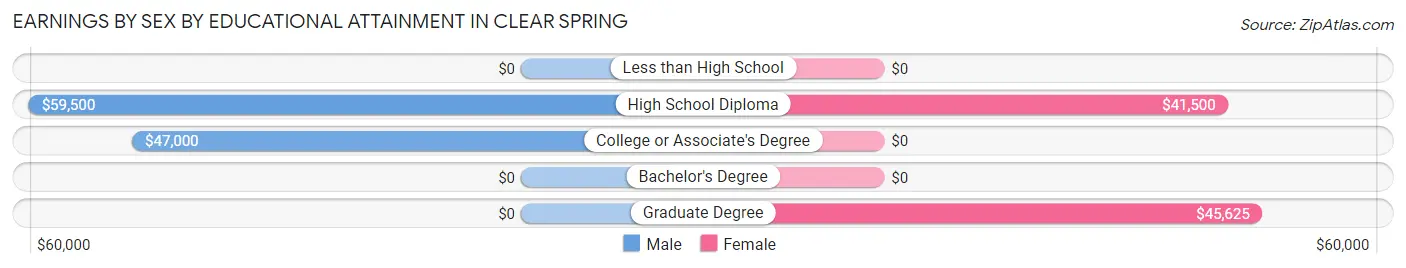
| Educational Attainment | Male Income | Female Income |
| Less than High School | - | - |
| High School Diploma | $59,500 | $41,500 |
| College or Associate's Degree | $47,000 | $0 |
| Bachelor's Degree | - | - |
| Graduate Degree | - | - |
| Total | $56,250 | $40,714 |
Family Income in Clear Spring
Family Income Brackets in Clear Spring
According to the Clear Spring family income data, there are 27 families falling into the $35,000 to $49,999 income range, which is the most common income bracket and makes up 25.2% of all families.
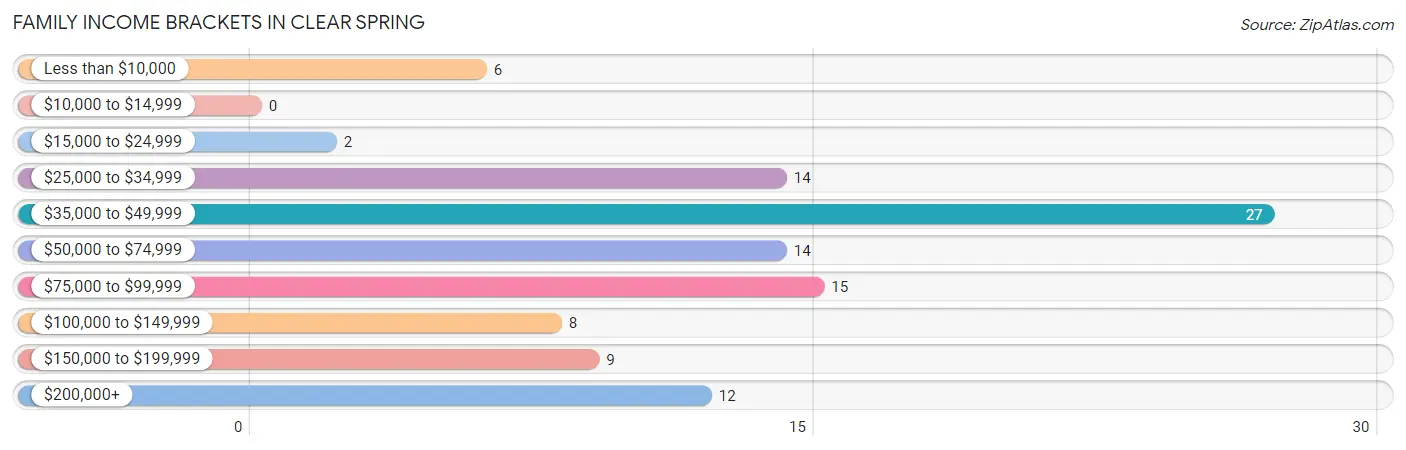
| Income Bracket | # Families | % Families |
| Less than $10,000 | 6 | 5.6% |
| $10,000 to $14,999 | 0 | 0.0% |
| $15,000 to $24,999 | 2 | 1.9% |
| $25,000 to $34,999 | 14 | 13.1% |
| $35,000 to $49,999 | 27 | 25.2% |
| $50,000 to $74,999 | 14 | 13.1% |
| $75,000 to $99,999 | 15 | 14.0% |
| $100,000 to $149,999 | 8 | 7.5% |
| $150,000 to $199,999 | 9 | 8.4% |
| $200,000+ | 12 | 11.2% |
Family Income by Famaliy Size in Clear Spring
2-person families (55 | 51.4%) account for the highest median family income in Clear Spring with $77,750 per family, while 2-person families (55 | 51.4%) have the highest median income of $38,875 per family member.
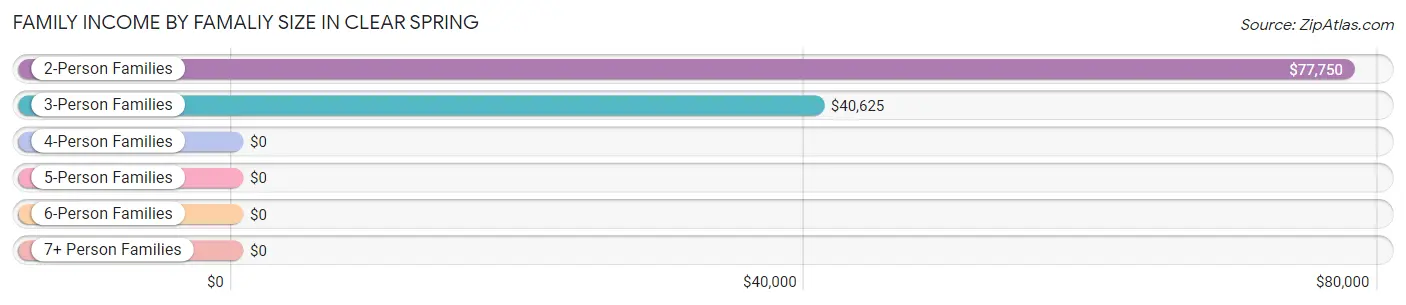
| Income Bracket | # Families | Median Income |
| 2-Person Families | 55 (51.4%) | $77,750 |
| 3-Person Families | 39 (36.4%) | $40,625 |
| 4-Person Families | 2 (1.9%) | $0 |
| 5-Person Families | 0 (0.0%) | $0 |
| 6-Person Families | 11 (10.3%) | $0 |
| 7+ Person Families | 0 (0.0%) | $0 |
| Total | 107 (100.0%) | $54,375 |
Family Income by Number of Earners in Clear Spring
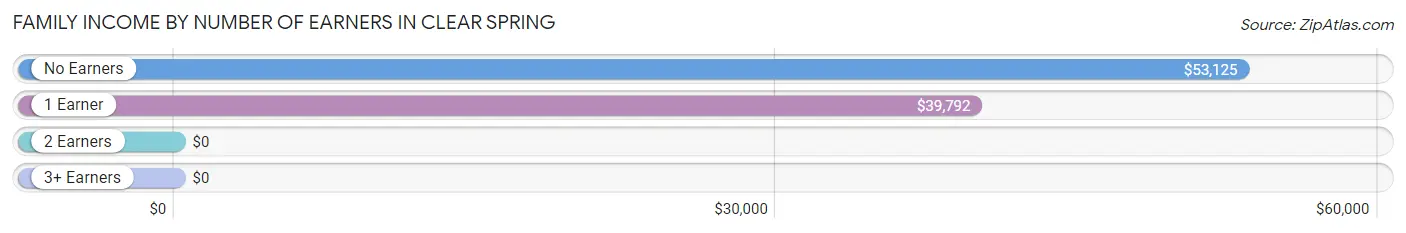
| Number of Earners | # Families | Median Income |
| No Earners | 11 (10.3%) | $53,125 |
| 1 Earner | 65 (60.8%) | $39,792 |
| 2 Earners | 22 (20.6%) | $0 |
| 3+ Earners | 9 (8.4%) | $0 |
| Total | 107 (100.0%) | $54,375 |
Household Income in Clear Spring
Household Income Brackets in Clear Spring
With 40 households falling in the category, the $35,000 to $49,999 income range is the most frequent in Clear Spring, accounting for 24.4% of all households. In contrast, only 3 households (1.8%) fall into the $10,000 to $14,999 income bracket, making it the least populous group.
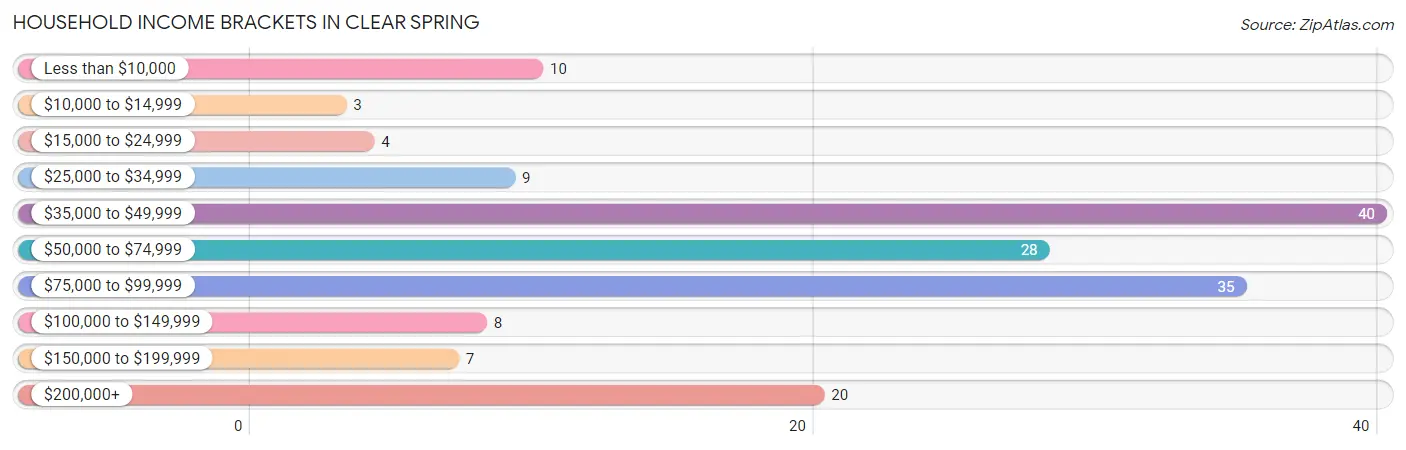
| Income Bracket | # Households | % Households |
| Less than $10,000 | 10 | 6.1% |
| $10,000 to $14,999 | 3 | 1.8% |
| $15,000 to $24,999 | 4 | 2.4% |
| $25,000 to $34,999 | 9 | 5.5% |
| $35,000 to $49,999 | 40 | 24.4% |
| $50,000 to $74,999 | 28 | 17.1% |
| $75,000 to $99,999 | 35 | 21.3% |
| $100,000 to $149,999 | 8 | 4.9% |
| $150,000 to $199,999 | 7 | 4.3% |
| $200,000+ | 20 | 12.2% |
Household Income by Householder Age in Clear Spring
The median household income in Clear Spring is $58,000, with the highest median household income of $103,594 found in the 45 to 64 years age bracket for the primary householder. A total of 63 households (38.4%) fall into this category.
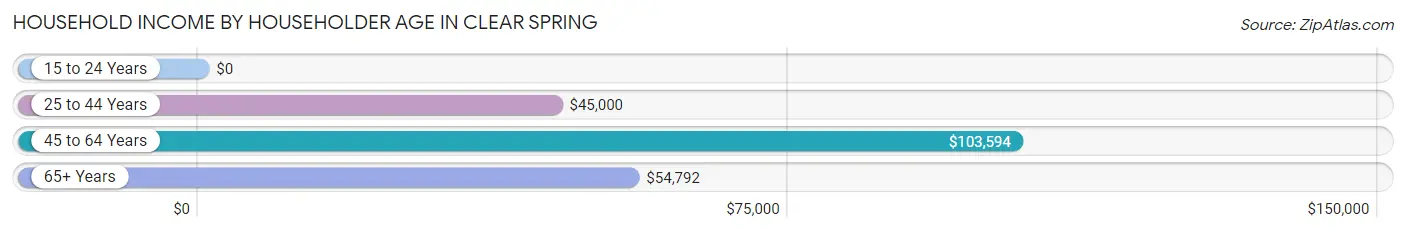
| Income Bracket | # Households | Median Income |
| 15 to 24 Years | 0 (0.0%) | $0 |
| 25 to 44 Years | 58 (35.4%) | $45,000 |
| 45 to 64 Years | 63 (38.4%) | $103,594 |
| 65+ Years | 43 (26.2%) | $54,792 |
| Total | 164 (100.0%) | $58,000 |
Poverty in Clear Spring
Income Below Poverty by Sex and Age in Clear Spring
With 10.1% poverty level for males and 6.2% for females among the residents of Clear Spring, 6 to 11 year old males and 75 year old and over females are the most vulnerable to poverty, with 5 males (45.5%) and 4 females (25.0%) in their respective age groups living below the poverty level.
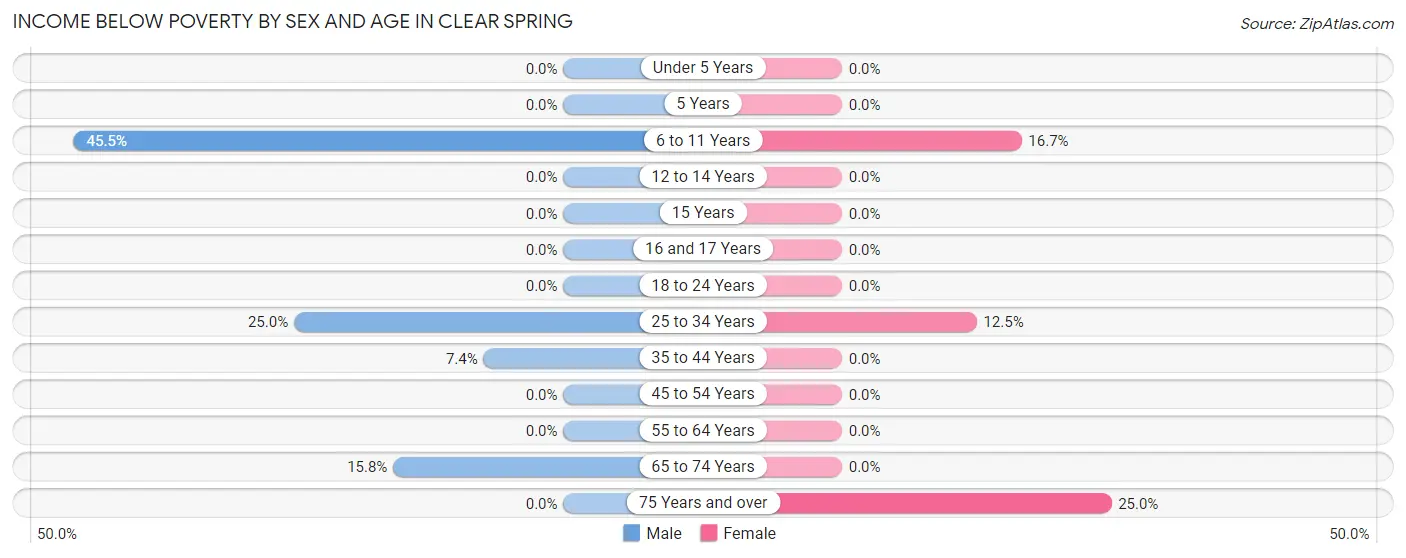
| Age Bracket | Male | Female |
| Under 5 Years | 0 (0.0%) | 0 (0.0%) |
| 5 Years | 0 (0.0%) | 0 (0.0%) |
| 6 to 11 Years | 5 (45.5%) | 5 (16.7%) |
| 12 to 14 Years | 0 (0.0%) | 0 (0.0%) |
| 15 Years | 0 (0.0%) | 0 (0.0%) |
| 16 and 17 Years | 0 (0.0%) | 0 (0.0%) |
| 18 to 24 Years | 0 (0.0%) | 0 (0.0%) |
| 25 to 34 Years | 6 (25.0%) | 6 (12.5%) |
| 35 to 44 Years | 2 (7.4%) | 0 (0.0%) |
| 45 to 54 Years | 0 (0.0%) | 0 (0.0%) |
| 55 to 64 Years | 0 (0.0%) | 0 (0.0%) |
| 65 to 74 Years | 3 (15.8%) | 0 (0.0%) |
| 75 Years and over | 0 (0.0%) | 4 (25.0%) |
| Total | 16 (10.1%) | 15 (6.2%) |
Income Above Poverty by Sex and Age in Clear Spring
According to the poverty statistics in Clear Spring, males aged under 5 years and females aged under 5 years are the age groups that are most secure financially, with 100.0% of males and 100.0% of females in these age groups living above the poverty line.
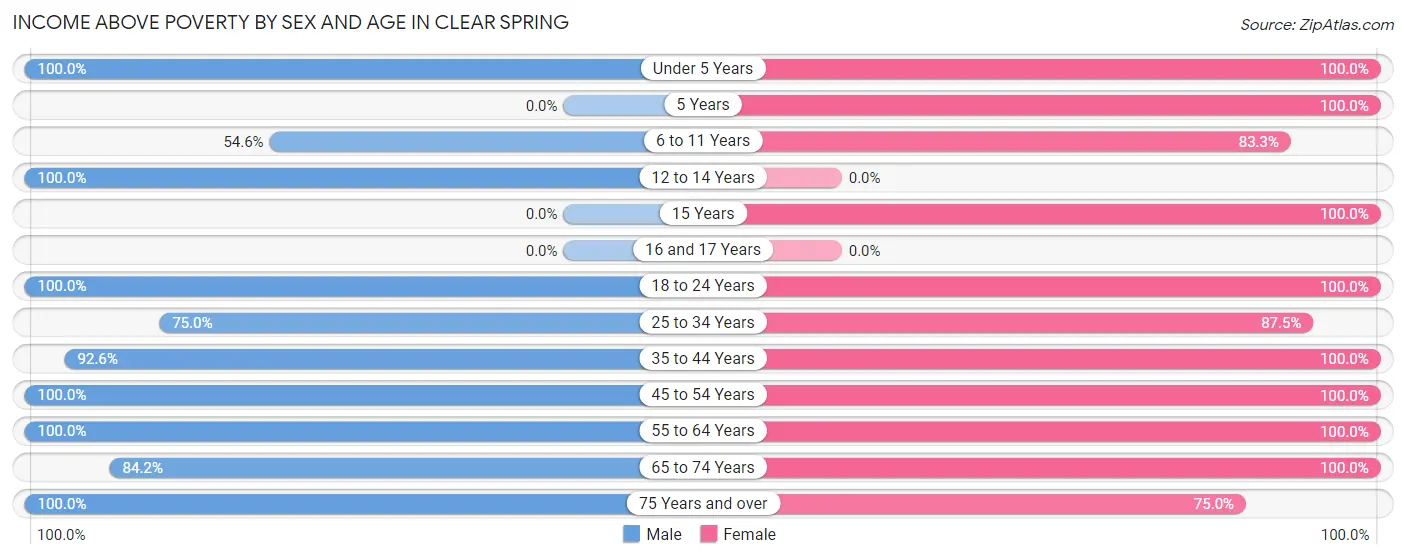
| Age Bracket | Male | Female |
| Under 5 Years | 11 (100.0%) | 9 (100.0%) |
| 5 Years | 0 (0.0%) | 6 (100.0%) |
| 6 to 11 Years | 6 (54.5%) | 25 (83.3%) |
| 12 to 14 Years | 5 (100.0%) | 0 (0.0%) |
| 15 Years | 0 (0.0%) | 16 (100.0%) |
| 16 and 17 Years | 0 (0.0%) | 0 (0.0%) |
| 18 to 24 Years | 5 (100.0%) | 25 (100.0%) |
| 25 to 34 Years | 18 (75.0%) | 42 (87.5%) |
| 35 to 44 Years | 25 (92.6%) | 14 (100.0%) |
| 45 to 54 Years | 26 (100.0%) | 24 (100.0%) |
| 55 to 64 Years | 22 (100.0%) | 31 (100.0%) |
| 65 to 74 Years | 16 (84.2%) | 22 (100.0%) |
| 75 Years and over | 9 (100.0%) | 12 (75.0%) |
| Total | 143 (89.9%) | 226 (93.8%) |
Income Below Poverty Among Married-Couple Families in Clear Spring
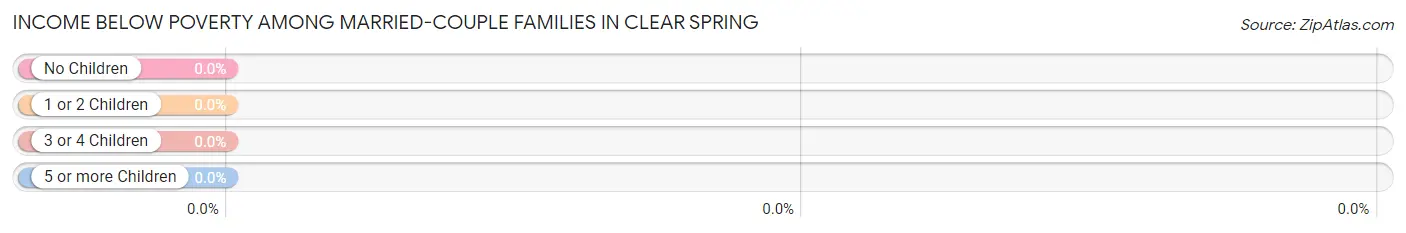
| Children | Above Poverty | Below Poverty |
| No Children | 34 (100.0%) | 0 (0.0%) |
| 1 or 2 Children | 16 (100.0%) | 0 (0.0%) |
| 3 or 4 Children | 0 (0.0%) | 0 (0.0%) |
| 5 or more Children | 0 (0.0%) | 0 (0.0%) |
| Total | 50 (100.0%) | 0 (0.0%) |
Income Below Poverty Among Single-Parent Households in Clear Spring
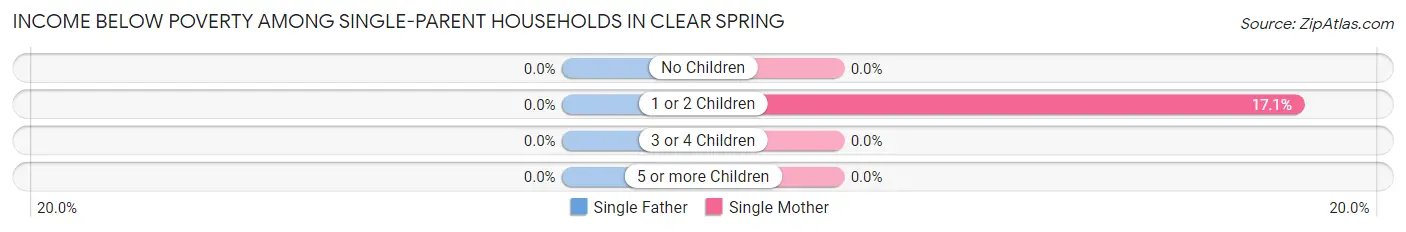
| Children | Single Father | Single Mother |
| No Children | 0 (0.0%) | 0 (0.0%) |
| 1 or 2 Children | 0 (0.0%) | 6 (17.1%) |
| 3 or 4 Children | 0 (0.0%) | 0 (0.0%) |
| 5 or more Children | 0 (0.0%) | 0 (0.0%) |
| Total | 0 (0.0%) | 6 (11.5%) |
Income Below Poverty Among Married-Couple vs Single-Parent Households in Clear Spring
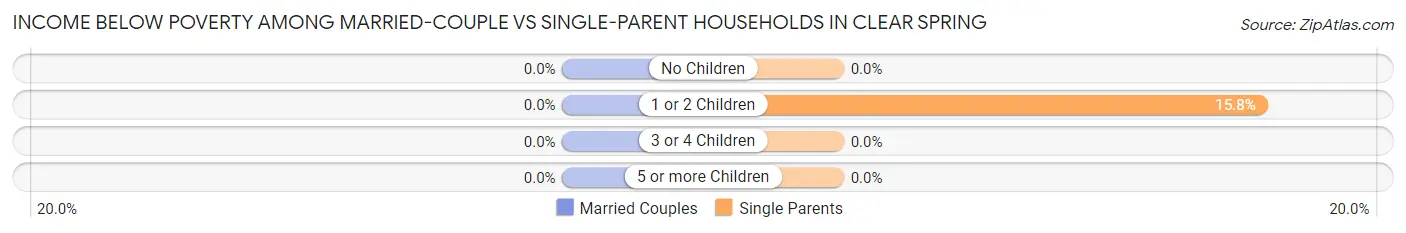
| Children | Married-Couple Families | Single-Parent Households |
| No Children | 0 (0.0%) | 0 (0.0%) |
| 1 or 2 Children | 0 (0.0%) | 6 (15.8%) |
| 3 or 4 Children | 0 (0.0%) | 0 (0.0%) |
| 5 or more Children | 0 (0.0%) | 0 (0.0%) |
| Total | 0 (0.0%) | 6 (10.5%) |
Race in Clear Spring
The most populous races in Clear Spring are White / Caucasian (341 | 83.0%), Asian (67 | 16.3%), and Two or more Races (3 | 0.7%).
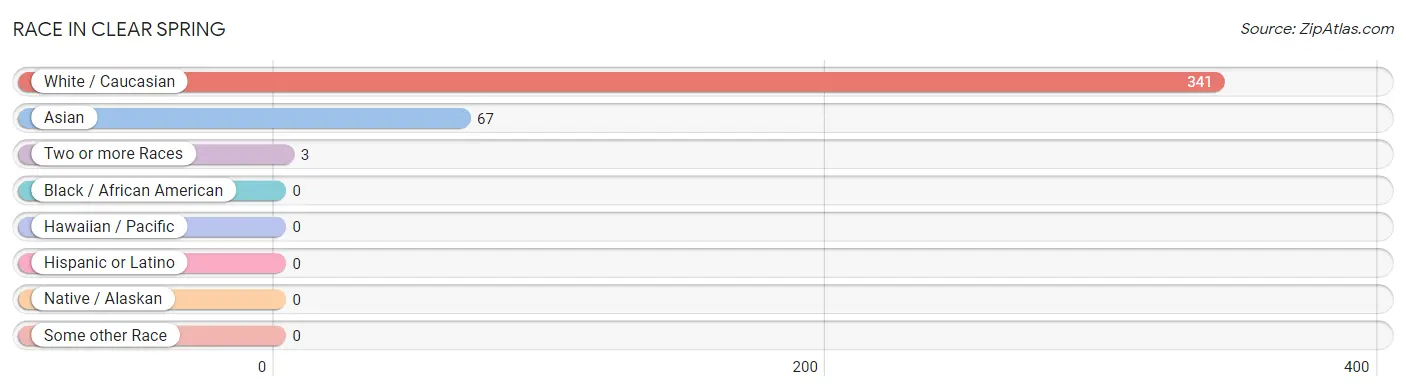
| Race | # Population | % Population |
| Asian | 67 | 16.3% |
| Black / African American | 0 | 0.0% |
| Hawaiian / Pacific | 0 | 0.0% |
| Hispanic or Latino | 0 | 0.0% |
| Native / Alaskan | 0 | 0.0% |
| White / Caucasian | 341 | 83.0% |
| Two or more Races | 3 | 0.7% |
| Some other Race | 0 | 0.0% |
| Total | 411 | 100.0% |
Ancestry in Clear Spring
The most populous ancestries reported in Clear Spring are Japanese (67 | 16.3%), German (66 | 16.1%), English (51 | 12.4%), Italian (22 | 5.3%), and Scottish (19 | 4.6%), together accounting for 54.7% of all Clear Spring residents.
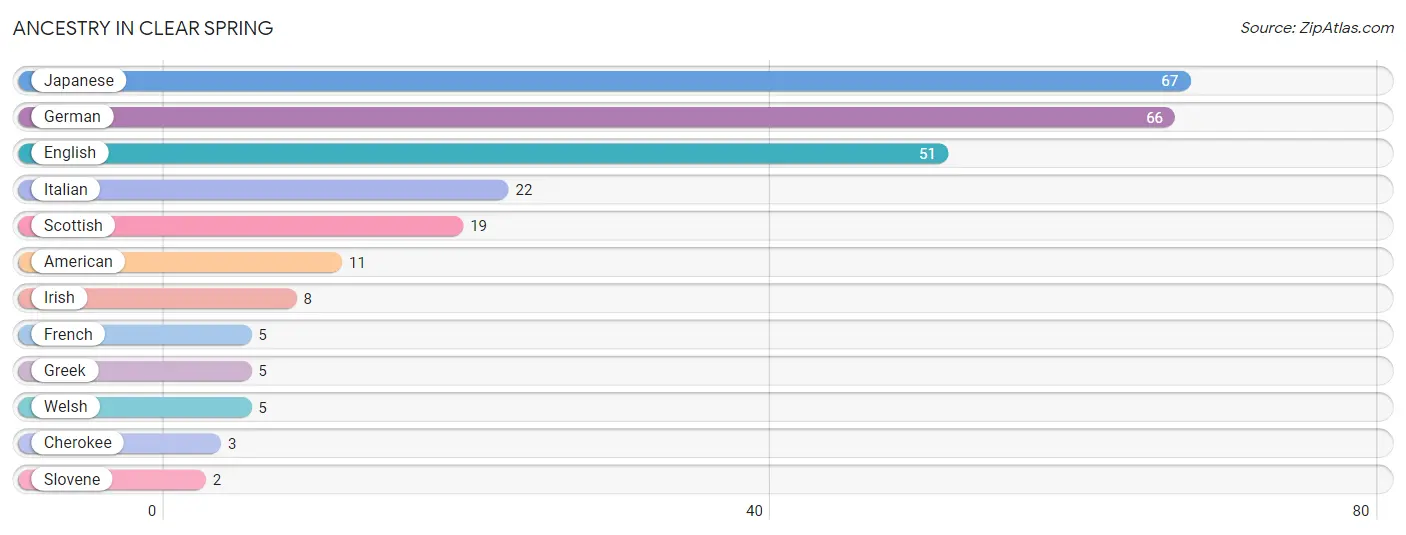
| Ancestry | # Population | % Population |
| American | 11 | 2.7% |
| Cherokee | 3 | 0.7% |
| English | 51 | 12.4% |
| French | 5 | 1.2% |
| German | 66 | 16.1% |
| Greek | 5 | 1.2% |
| Irish | 8 | 1.9% |
| Italian | 22 | 5.3% |
| Japanese | 67 | 16.3% |
| Scottish | 19 | 4.6% |
| Slovene | 2 | 0.5% |
| Welsh | 5 | 1.2% | View All 12 Rows |
Immigrants in Clear Spring
The most numerous immigrant groups reported in Clear Spring came from Asia (29 | 7.1%), Cambodia (29 | 7.1%), and South Eastern Asia (29 | 7.1%), together accounting for 21.2% of all Clear Spring residents.
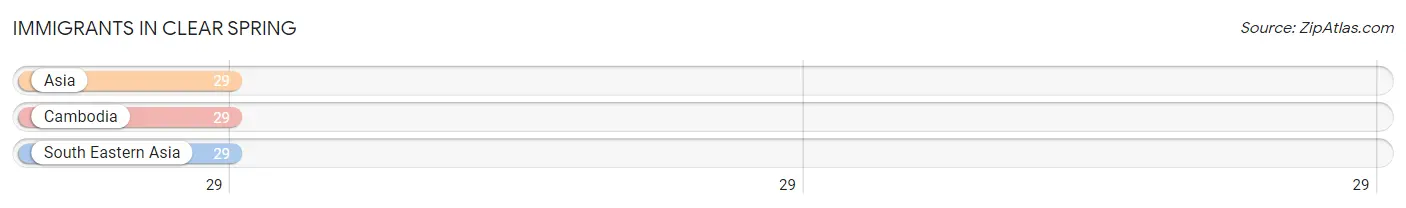
| Immigration Origin | # Population | % Population |
| Asia | 29 | 7.1% |
| Cambodia | 29 | 7.1% |
| South Eastern Asia | 29 | 7.1% | View All 3 Rows |
Sex and Age in Clear Spring
Sex and Age in Clear Spring
The most populous age groups in Clear Spring are 5 to 9 Years (21 | 12.3%) for men and 15 to 19 Years (32 | 13.3%) for women.
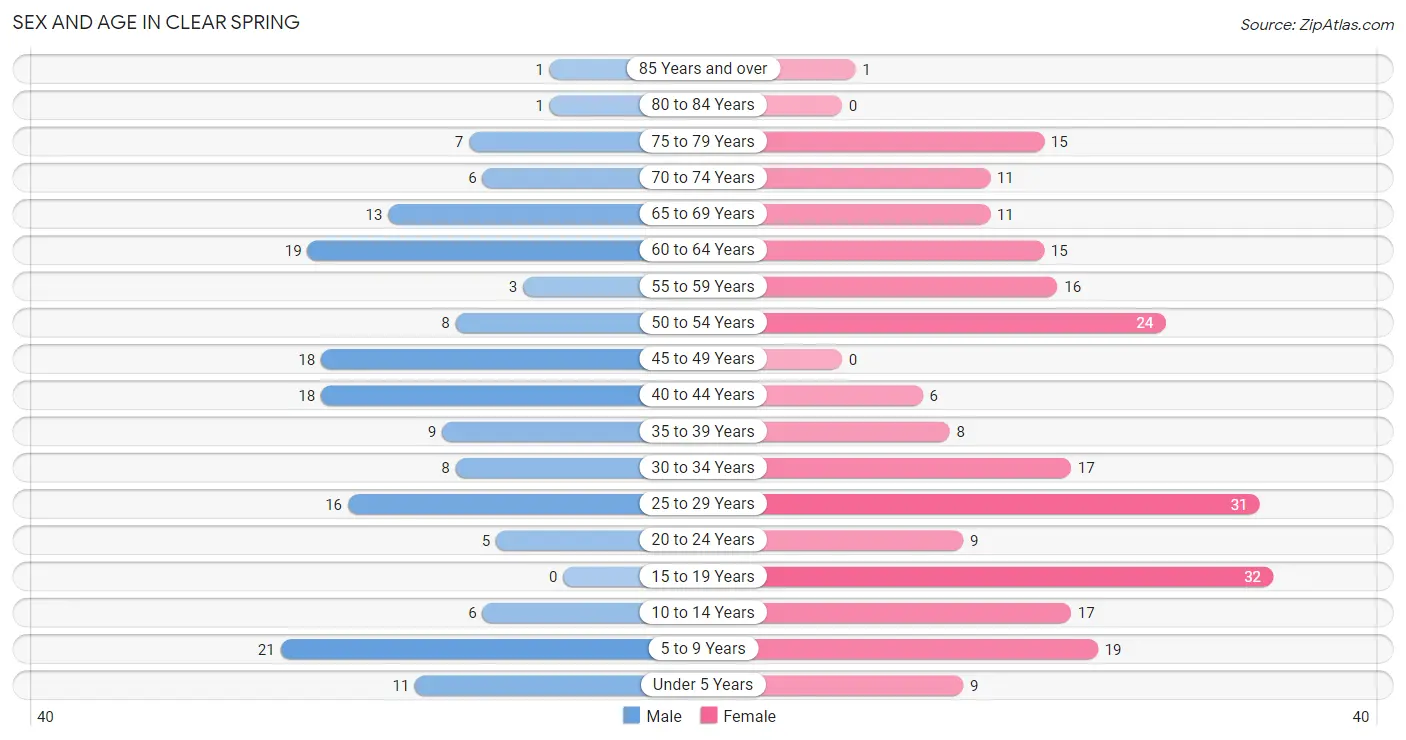
| Age Bracket | Male | Female |
| Under 5 Years | 11 (6.5%) | 9 (3.7%) |
| 5 to 9 Years | 21 (12.3%) | 19 (7.9%) |
| 10 to 14 Years | 6 (3.5%) | 17 (7.0%) |
| 15 to 19 Years | 0 (0.0%) | 32 (13.3%) |
| 20 to 24 Years | 5 (2.9%) | 9 (3.7%) |
| 25 to 29 Years | 16 (9.4%) | 31 (12.9%) |
| 30 to 34 Years | 8 (4.7%) | 17 (7.0%) |
| 35 to 39 Years | 9 (5.3%) | 8 (3.3%) |
| 40 to 44 Years | 18 (10.6%) | 6 (2.5%) |
| 45 to 49 Years | 18 (10.6%) | 0 (0.0%) |
| 50 to 54 Years | 8 (4.7%) | 24 (10.0%) |
| 55 to 59 Years | 3 (1.8%) | 16 (6.6%) |
| 60 to 64 Years | 19 (11.2%) | 15 (6.2%) |
| 65 to 69 Years | 13 (7.6%) | 11 (4.6%) |
| 70 to 74 Years | 6 (3.5%) | 11 (4.6%) |
| 75 to 79 Years | 7 (4.1%) | 15 (6.2%) |
| 80 to 84 Years | 1 (0.6%) | 0 (0.0%) |
| 85 Years and over | 1 (0.6%) | 1 (0.4%) |
| Total | 170 (100.0%) | 241 (100.0%) |
Families and Households in Clear Spring
Median Family Size in Clear Spring
The median family size in Clear Spring is 2.98 persons per family, with married-couple families (50 | 46.7%) accounting for the largest median family size of 3.84 persons per family. On the other hand, single male/father families (5 | 4.7%) represent the smallest median family size with 2.20 persons per family.
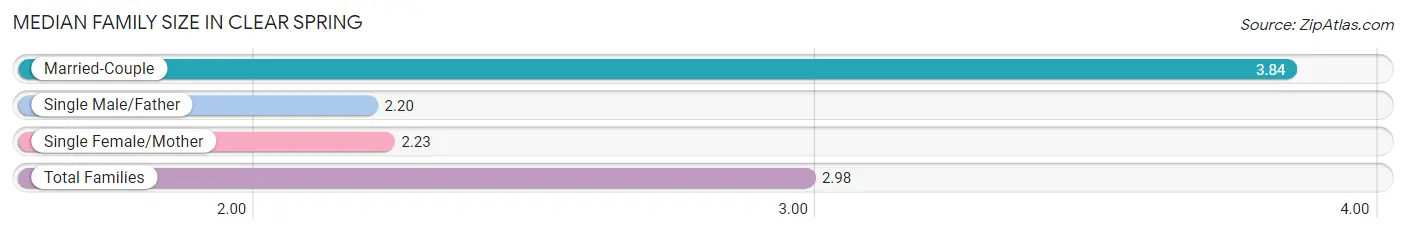
| Family Type | # Families | Family Size |
| Married-Couple | 50 (46.7%) | 3.84 |
| Single Male/Father | 5 (4.7%) | 2.20 |
| Single Female/Mother | 52 (48.6%) | 2.23 |
| Total Families | 107 (100.0%) | 2.98 |
Median Household Size in Clear Spring
The median household size in Clear Spring is 2.51 persons per household, with married-couple households (50 | 30.5%) accounting for the largest median household size of 3.84 persons per household. non-family households (57 | 34.8%) represent the smallest median household size with 1.07 persons per household.
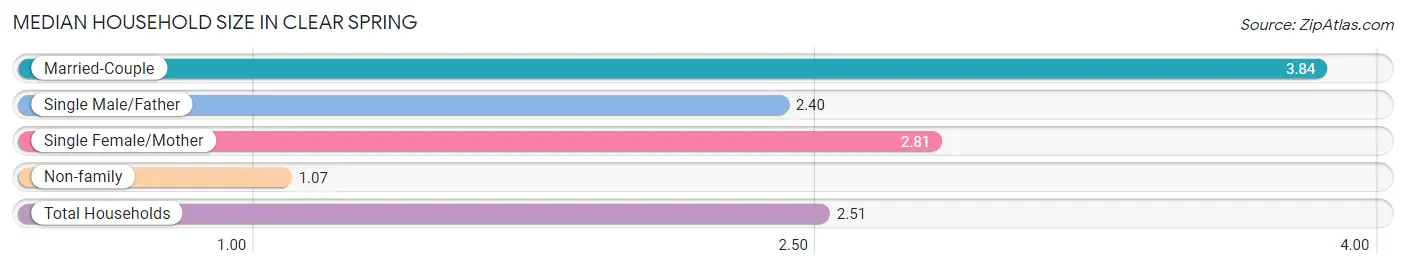
| Household Type | # Households | Household Size |
| Married-Couple | 50 (30.5%) | 3.84 |
| Single Male/Father | 5 (3.0%) | 2.40 |
| Single Female/Mother | 52 (31.7%) | 2.81 |
| Non-family | 57 (34.8%) | 1.07 |
| Total Households | 164 (100.0%) | 2.51 |
Household Size by Marriage Status in Clear Spring
Out of a total of 164 households in Clear Spring, 107 (65.2%) are family households, while 57 (34.8%) are nonfamily households. The most numerous type of family households are 2-person households, comprising 50, and the most common type of nonfamily households are 1-person households, comprising 54.
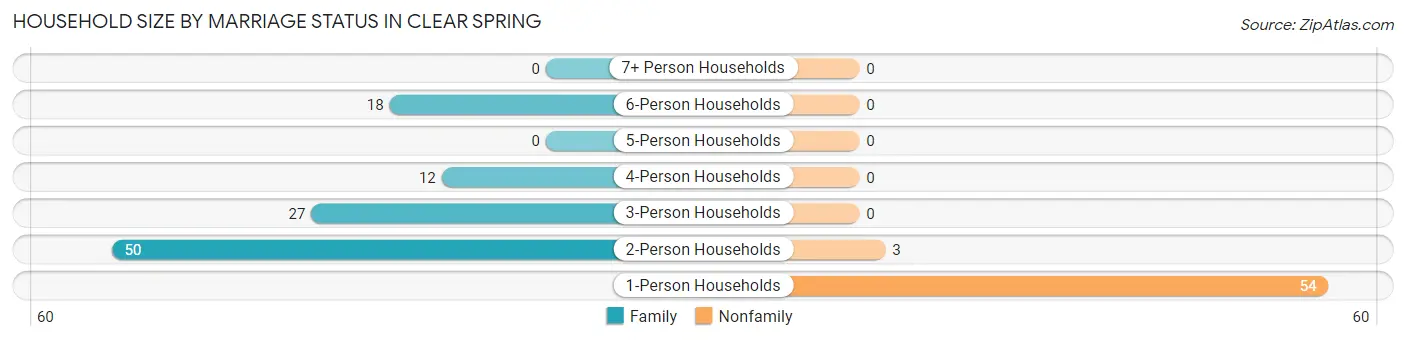
| Household Size | Family Households | Nonfamily Households |
| 1-Person Households | - | 54 (32.9%) |
| 2-Person Households | 50 (30.5%) | 3 (1.8%) |
| 3-Person Households | 27 (16.5%) | 0 (0.0%) |
| 4-Person Households | 12 (7.3%) | 0 (0.0%) |
| 5-Person Households | 0 (0.0%) | 0 (0.0%) |
| 6-Person Households | 18 (11.0%) | 0 (0.0%) |
| 7+ Person Households | 0 (0.0%) | 0 (0.0%) |
| Total | 107 (65.2%) | 57 (34.8%) |
Female Fertility in Clear Spring
Fertility by Age in Clear Spring
Average fertility rate in Clear Spring is 45.0 births per 1,000 women. Women in the age bracket of 20 to 34 years have the highest fertility rate with 88.0 births per 1,000 women. Women in the age bracket of 20 to 34 years acount for 100.0% of all women with births.
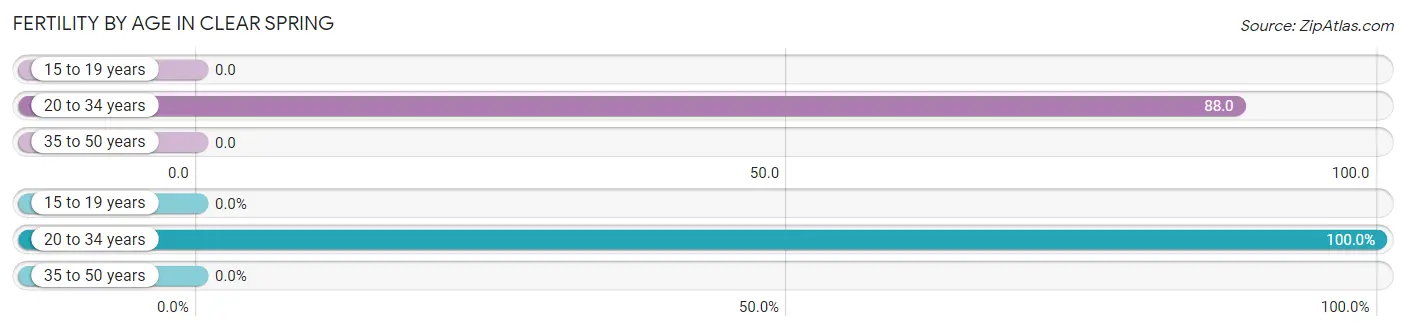
| Age Bracket | Women with Births | Births / 1,000 Women |
| 15 to 19 years | 0 (0.0%) | 0.0 |
| 20 to 34 years | 5 (100.0%) | 88.0 |
| 35 to 50 years | 0 (0.0%) | 0.0 |
| Total | 5 (100.0%) | 45.0 |
Fertility by Age by Marriage Status in Clear Spring
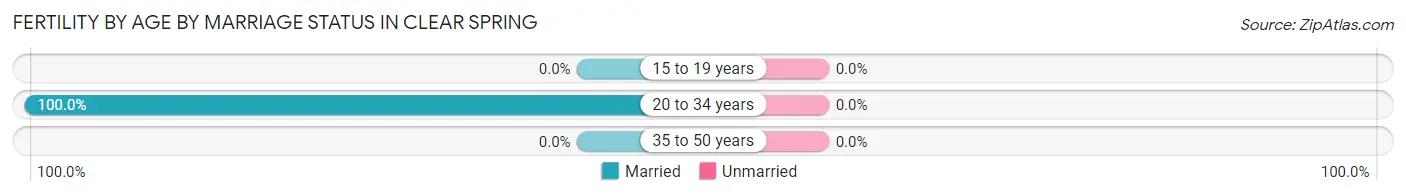
| Age Bracket | Married | Unmarried |
| 15 to 19 years | 0 (0.0%) | 0 (0.0%) |
| 20 to 34 years | 5 (100.0%) | 0 (0.0%) |
| 35 to 50 years | 0 (0.0%) | 0 (0.0%) |
| Total | 5 (100.0%) | 0 (0.0%) |
Fertility by Education in Clear Spring
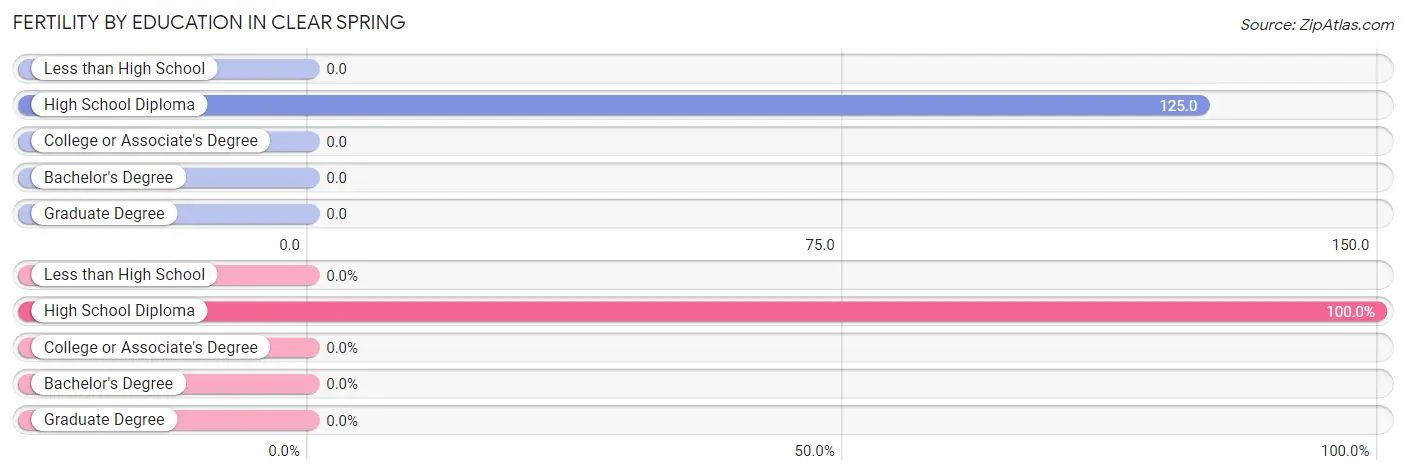
| Educational Attainment | Women with Births | Births / 1,000 Women |
| Less than High School | 0 (0.0%) | 0.0 |
| High School Diploma | 5 (100.0%) | 125.0 |
| College or Associate's Degree | 0 (0.0%) | 0.0 |
| Bachelor's Degree | 0 (0.0%) | 0.0 |
| Graduate Degree | 0 (0.0%) | 0.0 |
| Total | 5 (100.0%) | 45.0 |
Fertility by Education by Marriage Status in Clear Spring
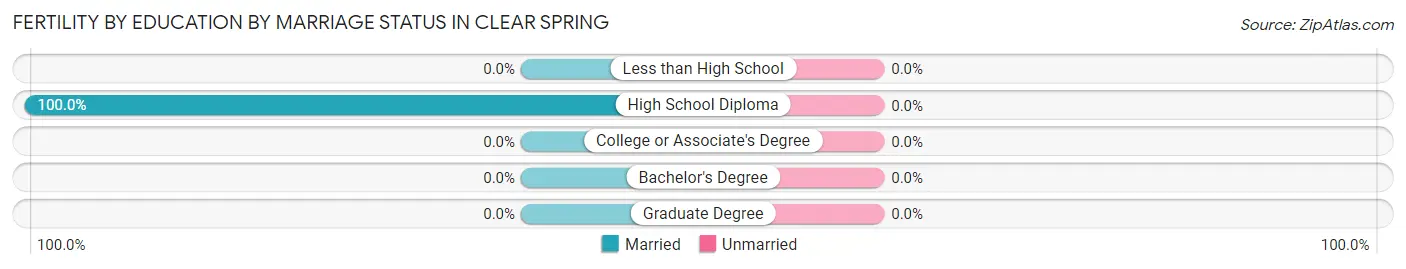
| Educational Attainment | Married | Unmarried |
| Less than High School | 0 (0.0%) | 0 (0.0%) |
| High School Diploma | 5 (100.0%) | 0 (0.0%) |
| College or Associate's Degree | 0 (0.0%) | 0 (0.0%) |
| Bachelor's Degree | 0 (0.0%) | 0 (0.0%) |
| Graduate Degree | 0 (0.0%) | 0 (0.0%) |
| Total | 5 (100.0%) | 0 (0.0%) |
Employment Characteristics in Clear Spring
Employment by Class of Employer in Clear Spring
Among the 221 employed individuals in Clear Spring, private company employees (151 | 68.3%), local government employees (28 | 12.7%), and federal government employees (18 | 8.1%) make up the most common classes of employment.
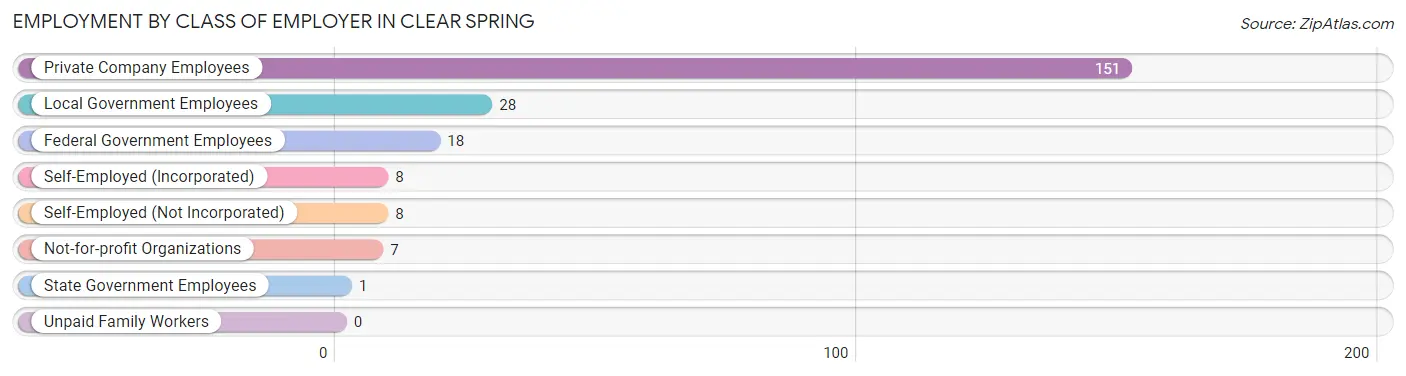
| Employer Class | # Employees | % Employees |
| Private Company Employees | 151 | 68.3% |
| Self-Employed (Incorporated) | 8 | 3.6% |
| Self-Employed (Not Incorporated) | 8 | 3.6% |
| Not-for-profit Organizations | 7 | 3.2% |
| Local Government Employees | 28 | 12.7% |
| State Government Employees | 1 | 0.4% |
| Federal Government Employees | 18 | 8.1% |
| Unpaid Family Workers | 0 | 0.0% |
| Total | 221 | 100.0% |
Employment Status by Age in Clear Spring
According to the labor force statistics for Clear Spring, out of the total population over 16 years of age (312), 71.8% or 224 individuals are in the labor force, with 1.3% or 3 of them unemployed. The age group with the highest labor force participation rate is 16 to 19 years, with 100.0% or 16 individuals in the labor force. Within the labor force, the 65 to 74 years age range has the highest percentage of unemployed individuals, with 37.5% or 3 of them being unemployed.
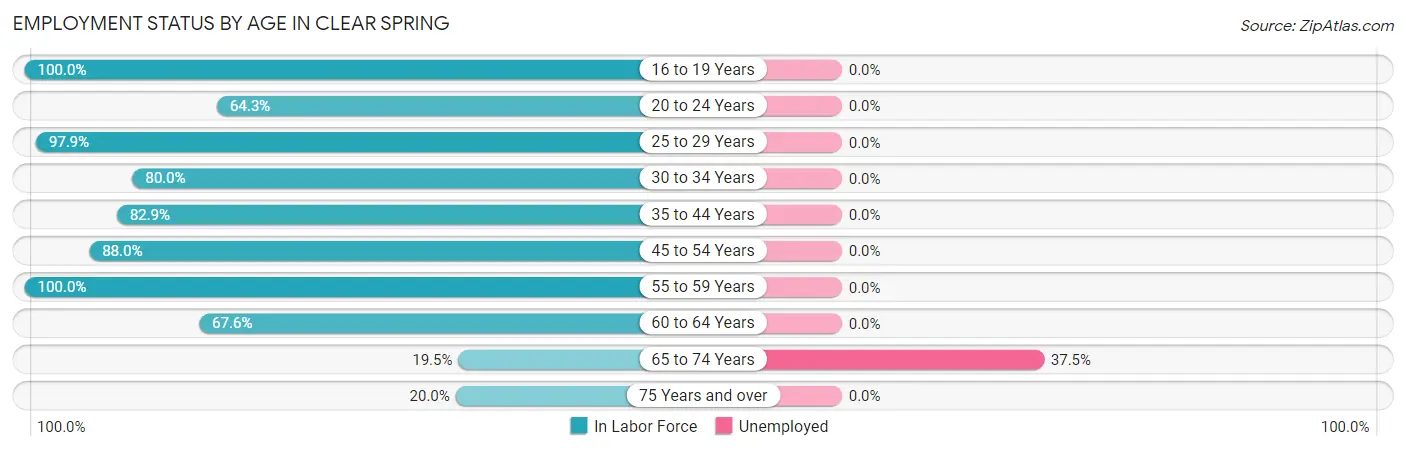
| Age Bracket | In Labor Force | Unemployed |
| 16 to 19 Years | 16 (100.0%) | 0 (0.0%) |
| 20 to 24 Years | 9 (64.3%) | 0 (0.0%) |
| 25 to 29 Years | 46 (97.9%) | 0 (0.0%) |
| 30 to 34 Years | 20 (80.0%) | 0 (0.0%) |
| 35 to 44 Years | 34 (82.9%) | 0 (0.0%) |
| 45 to 54 Years | 44 (88.0%) | 0 (0.0%) |
| 55 to 59 Years | 19 (100.0%) | 0 (0.0%) |
| 60 to 64 Years | 23 (67.6%) | 0 (0.0%) |
| 65 to 74 Years | 8 (19.5%) | 3 (37.5%) |
| 75 Years and over | 5 (20.0%) | 0 (0.0%) |
| Total | 224 (71.8%) | 3 (1.3%) |
Employment Status by Educational Attainment in Clear Spring
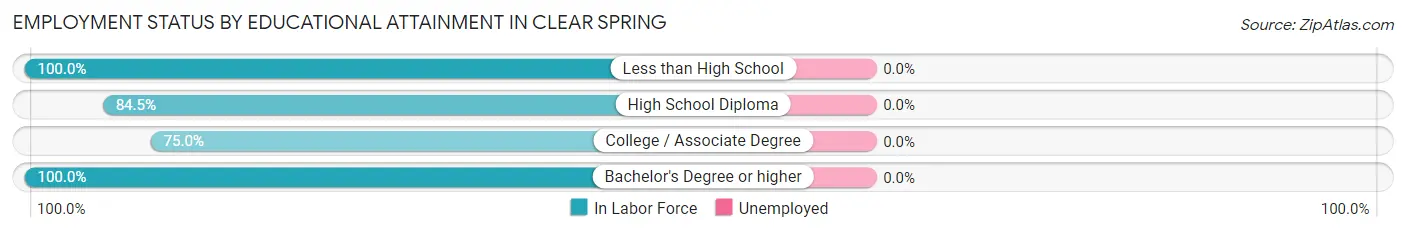
| Educational Attainment | In Labor Force | Unemployed |
| Less than High School | 11 (100.0%) | 0 (0.0%) |
| High School Diploma | 98 (84.5%) | 0 (0.0%) |
| College / Associate Degree | 36 (75.0%) | 0 (0.0%) |
| Bachelor's Degree or higher | 41 (100.0%) | 0 (0.0%) |
| Total | 186 (86.1%) | 0 (0.0%) |
Employment Occupations by Sex in Clear Spring
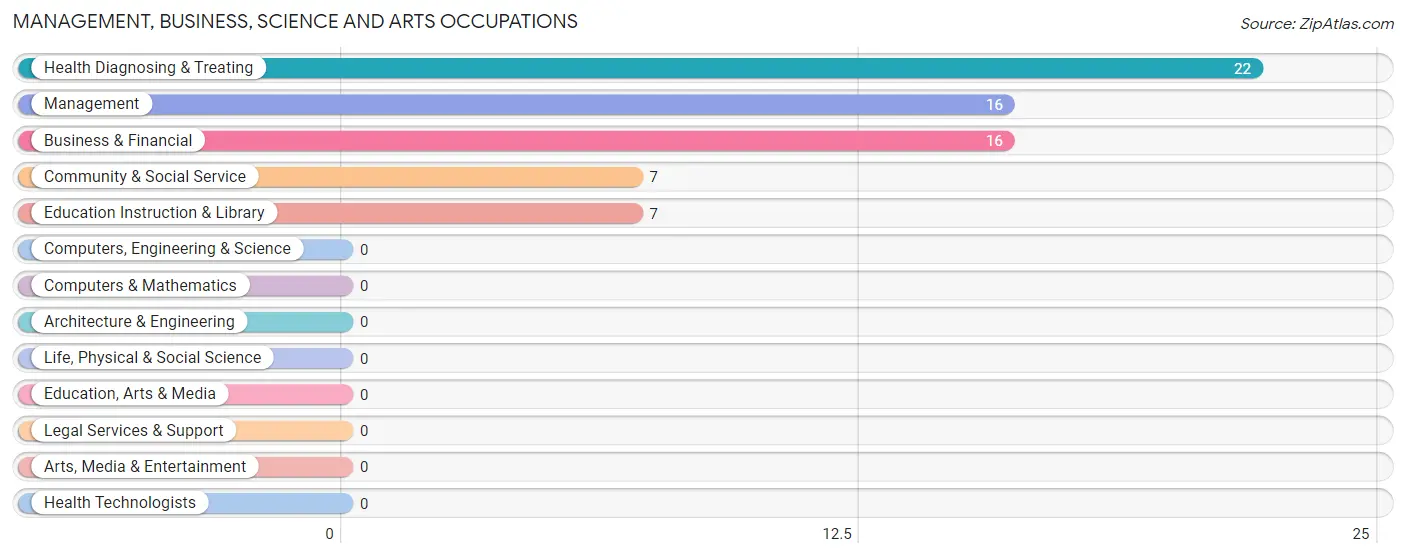
Management, Business, Science and Arts Occupations
The most common Management, Business, Science and Arts occupations in Clear Spring are Health Diagnosing & Treating (22 | 10.0%), Management (16 | 7.2%), Business & Financial (16 | 7.2%), Community & Social Service (7 | 3.2%), and Education Instruction & Library (7 | 3.2%).
Management, Business, Science and Arts Occupations by Sex
Within the Management, Business, Science and Arts occupations in Clear Spring, the most male-oriented occupations are Community & Social Service (100.0%), Education Instruction & Library (100.0%), and Health Diagnosing & Treating (68.2%), while the most female-oriented occupations are Business & Financial (100.0%), Management (43.8%), and Health Diagnosing & Treating (31.8%).
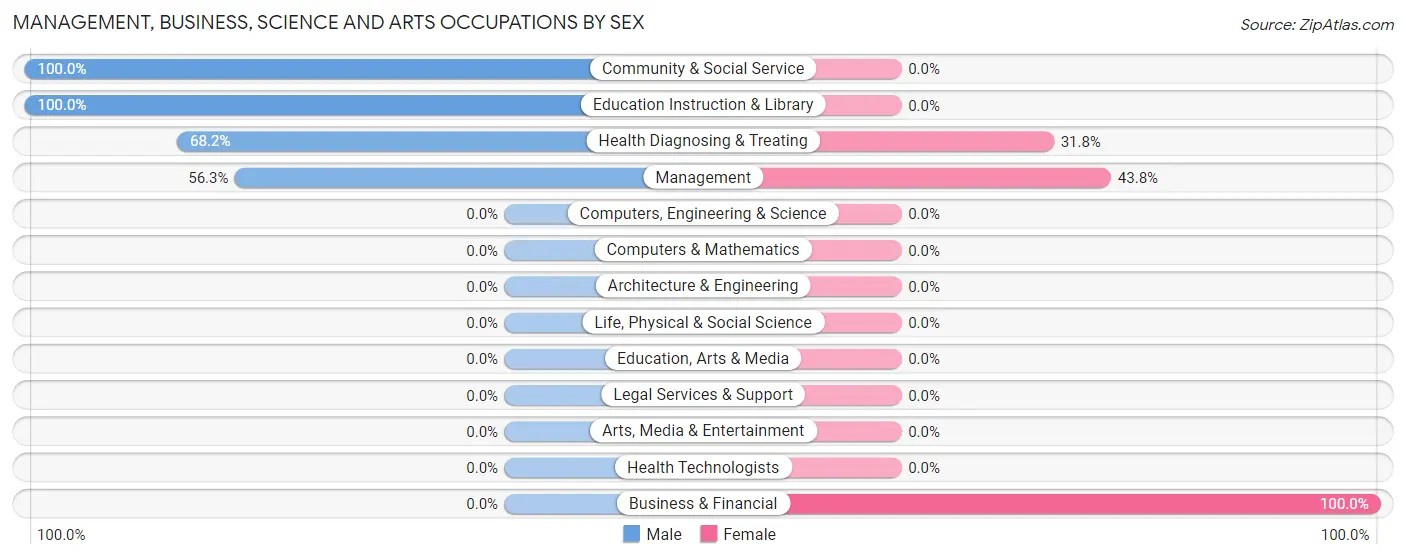
| Occupation | Male | Female |
| Management | 9 (56.2%) | 7 (43.8%) |
| Business & Financial | 0 (0.0%) | 16 (100.0%) |
| Computers, Engineering & Science | 0 (0.0%) | 0 (0.0%) |
| Computers & Mathematics | 0 (0.0%) | 0 (0.0%) |
| Architecture & Engineering | 0 (0.0%) | 0 (0.0%) |
| Life, Physical & Social Science | 0 (0.0%) | 0 (0.0%) |
| Community & Social Service | 7 (100.0%) | 0 (0.0%) |
| Education, Arts & Media | 0 (0.0%) | 0 (0.0%) |
| Legal Services & Support | 0 (0.0%) | 0 (0.0%) |
| Education Instruction & Library | 7 (100.0%) | 0 (0.0%) |
| Arts, Media & Entertainment | 0 (0.0%) | 0 (0.0%) |
| Health Diagnosing & Treating | 15 (68.2%) | 7 (31.8%) |
| Health Technologists | 0 (0.0%) | 0 (0.0%) |
| Total (Category) | 31 (50.8%) | 30 (49.2%) |
| Total (Overall) | 93 (42.1%) | 128 (57.9%) |
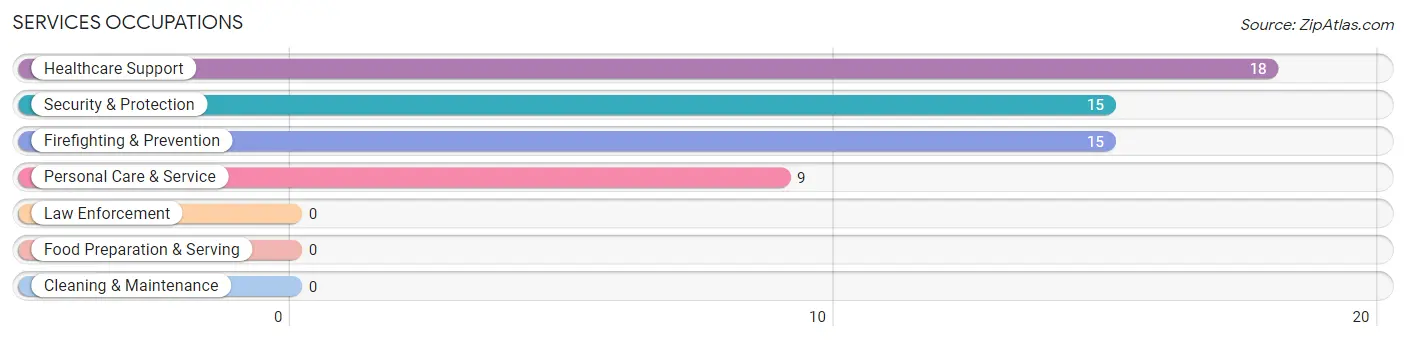
Services Occupations
The most common Services occupations in Clear Spring are Healthcare Support (18 | 8.1%), Security & Protection (15 | 6.8%), Firefighting & Prevention (15 | 6.8%), and Personal Care & Service (9 | 4.1%).
Services Occupations by Sex
Within the Services occupations in Clear Spring, the most male-oriented occupations are Security & Protection (100.0%), and Firefighting & Prevention (100.0%), while the most female-oriented occupations are Healthcare Support (100.0%), and Personal Care & Service (100.0%).
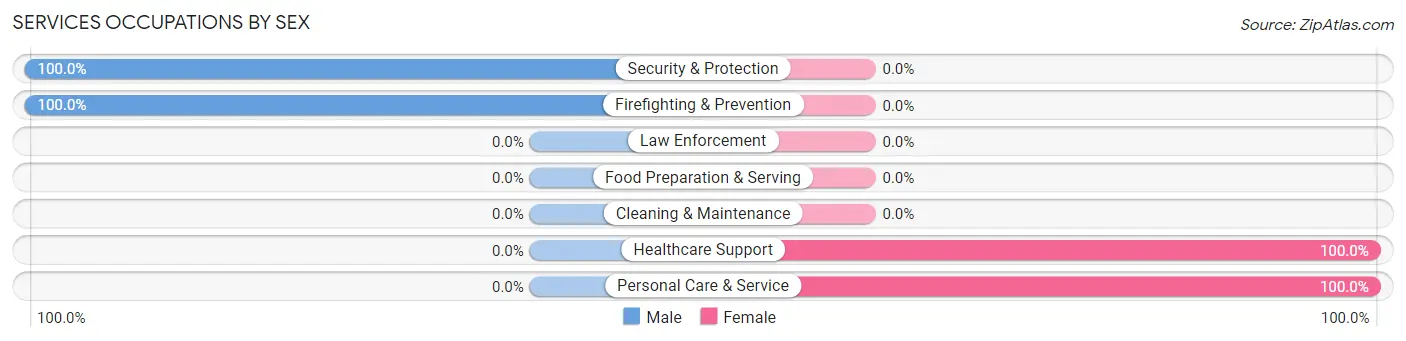
| Occupation | Male | Female |
| Healthcare Support | 0 (0.0%) | 18 (100.0%) |
| Security & Protection | 15 (100.0%) | 0 (0.0%) |
| Firefighting & Prevention | 15 (100.0%) | 0 (0.0%) |
| Law Enforcement | 0 (0.0%) | 0 (0.0%) |
| Food Preparation & Serving | 0 (0.0%) | 0 (0.0%) |
| Cleaning & Maintenance | 0 (0.0%) | 0 (0.0%) |
| Personal Care & Service | 0 (0.0%) | 9 (100.0%) |
| Total (Category) | 15 (35.7%) | 27 (64.3%) |
| Total (Overall) | 93 (42.1%) | 128 (57.9%) |
Sales and Office Occupations
The most common Sales and Office occupations in Clear Spring are Office & Administration (44 | 19.9%), and Sales & Related (22 | 10.0%).
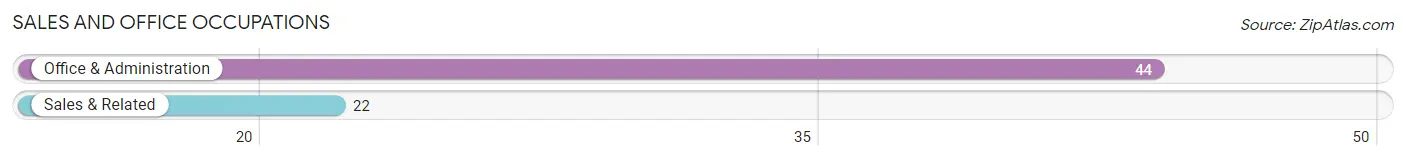
Sales and Office Occupations by Sex
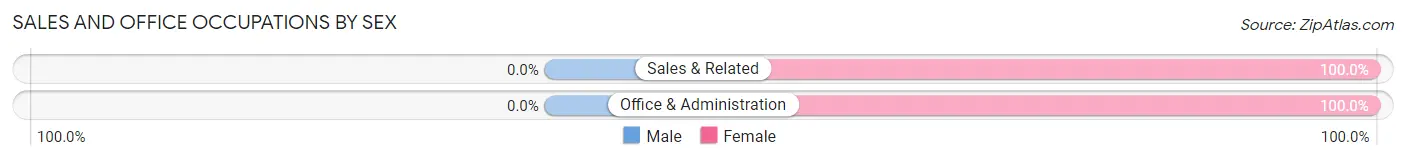
| Occupation | Male | Female |
| Sales & Related | 0 (0.0%) | 22 (100.0%) |
| Office & Administration | 0 (0.0%) | 44 (100.0%) |
| Total (Category) | 0 (0.0%) | 66 (100.0%) |
| Total (Overall) | 93 (42.1%) | 128 (57.9%) |
Natural Resources, Construction and Maintenance Occupations
The most common Natural Resources, Construction and Maintenance occupations in Clear Spring are Farming, Fishing & Forestry (8 | 3.6%), Installation, Maintenance & Repair (5 | 2.3%), and Construction & Extraction (2 | 0.9%).
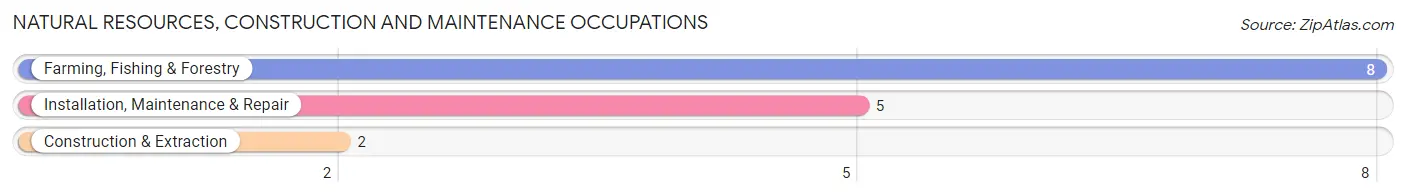
Natural Resources, Construction and Maintenance Occupations by Sex
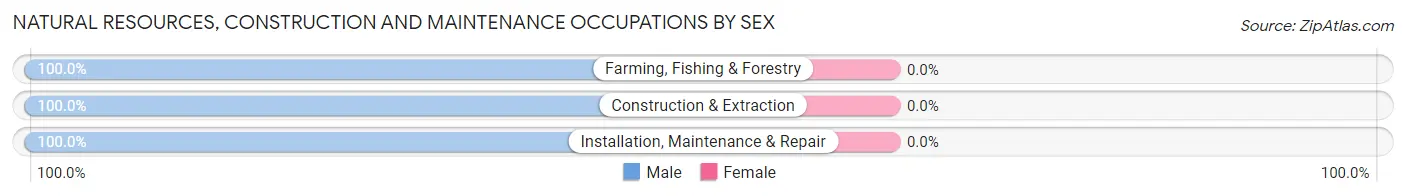
| Occupation | Male | Female |
| Farming, Fishing & Forestry | 8 (100.0%) | 0 (0.0%) |
| Construction & Extraction | 2 (100.0%) | 0 (0.0%) |
| Installation, Maintenance & Repair | 5 (100.0%) | 0 (0.0%) |
| Total (Category) | 15 (100.0%) | 0 (0.0%) |
| Total (Overall) | 93 (42.1%) | 128 (57.9%) |
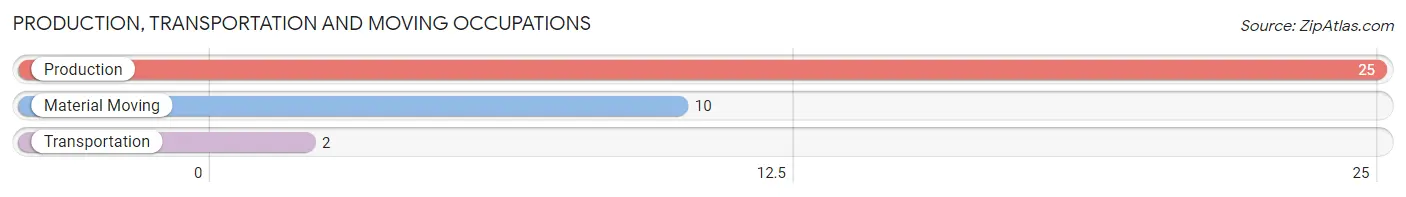
Production, Transportation and Moving Occupations
The most common Production, Transportation and Moving occupations in Clear Spring are Production (25 | 11.3%), Material Moving (10 | 4.5%), and Transportation (2 | 0.9%).
Production, Transportation and Moving Occupations by Sex
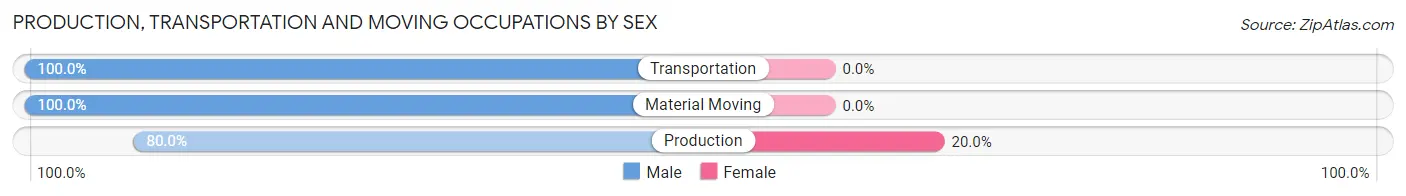
| Occupation | Male | Female |
| Production | 20 (80.0%) | 5 (20.0%) |
| Transportation | 2 (100.0%) | 0 (0.0%) |
| Material Moving | 10 (100.0%) | 0 (0.0%) |
| Total (Category) | 32 (86.5%) | 5 (13.5%) |
| Total (Overall) | 93 (42.1%) | 128 (57.9%) |
Employment Industries by Sex in Clear Spring
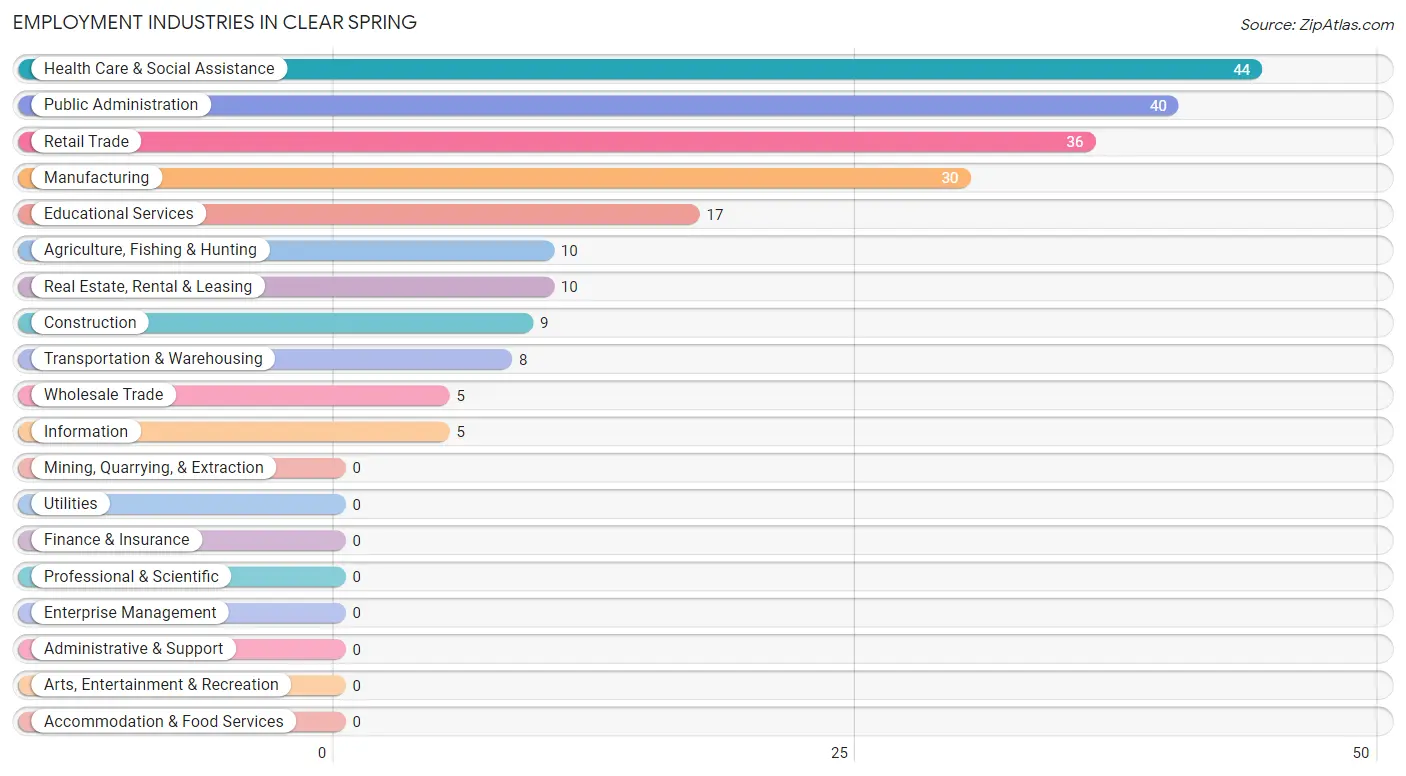
Employment Industries in Clear Spring
The major employment industries in Clear Spring include Health Care & Social Assistance (44 | 19.9%), Public Administration (40 | 18.1%), Retail Trade (36 | 16.3%), Manufacturing (30 | 13.6%), and Educational Services (17 | 7.7%).
Employment Industries by Sex in Clear Spring
The Clear Spring industries that see more men than women are Construction (100.0%), Transportation & Warehousing (100.0%), and Educational Services (100.0%), whereas the industries that tend to have a higher number of women are Wholesale Trade (100.0%), Information (100.0%), and Health Care & Social Assistance (100.0%).
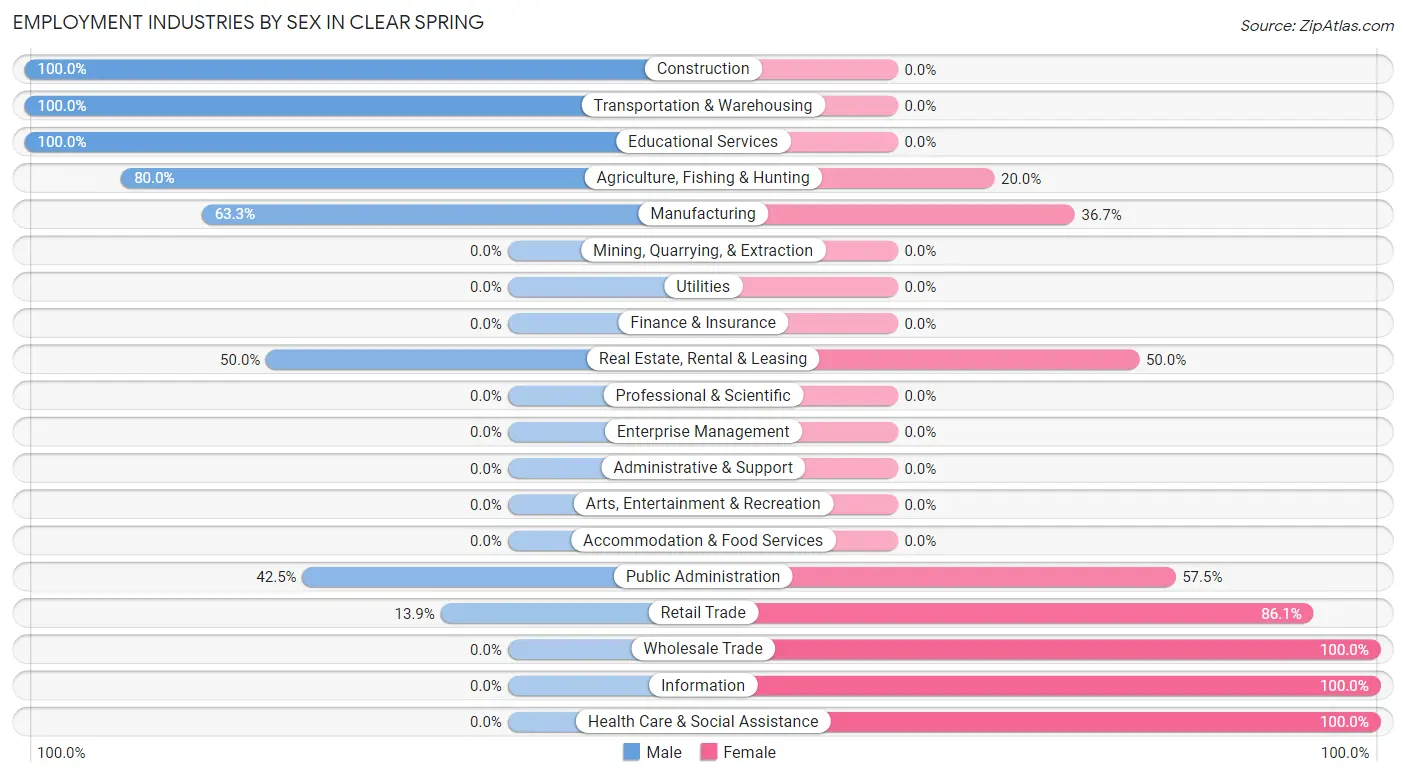
| Industry | Male | Female |
| Agriculture, Fishing & Hunting | 8 (80.0%) | 2 (20.0%) |
| Mining, Quarrying, & Extraction | 0 (0.0%) | 0 (0.0%) |
| Construction | 9 (100.0%) | 0 (0.0%) |
| Manufacturing | 19 (63.3%) | 11 (36.7%) |
| Wholesale Trade | 0 (0.0%) | 5 (100.0%) |
| Retail Trade | 5 (13.9%) | 31 (86.1%) |
| Transportation & Warehousing | 8 (100.0%) | 0 (0.0%) |
| Utilities | 0 (0.0%) | 0 (0.0%) |
| Information | 0 (0.0%) | 5 (100.0%) |
| Finance & Insurance | 0 (0.0%) | 0 (0.0%) |
| Real Estate, Rental & Leasing | 5 (50.0%) | 5 (50.0%) |
| Professional & Scientific | 0 (0.0%) | 0 (0.0%) |
| Enterprise Management | 0 (0.0%) | 0 (0.0%) |
| Administrative & Support | 0 (0.0%) | 0 (0.0%) |
| Educational Services | 17 (100.0%) | 0 (0.0%) |
| Health Care & Social Assistance | 0 (0.0%) | 44 (100.0%) |
| Arts, Entertainment & Recreation | 0 (0.0%) | 0 (0.0%) |
| Accommodation & Food Services | 0 (0.0%) | 0 (0.0%) |
| Public Administration | 17 (42.5%) | 23 (57.5%) |
| Total | 93 (42.1%) | 128 (57.9%) |
Education in Clear Spring
School Enrollment in Clear Spring
The most common levels of schooling among the 128 students in Clear Spring are high school (32 | 25.0%), elementary school (29 | 22.7%), and middle school (23 | 18.0%).
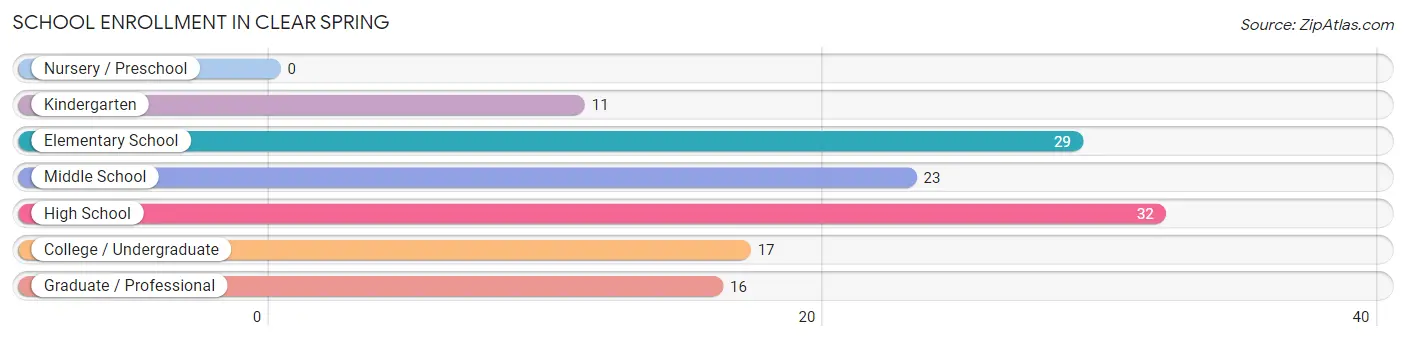
| School Level | # Students | % Students |
| Nursery / Preschool | 0 | 0.0% |
| Kindergarten | 11 | 8.6% |
| Elementary School | 29 | 22.7% |
| Middle School | 23 | 18.0% |
| High School | 32 | 25.0% |
| College / Undergraduate | 17 | 13.3% |
| Graduate / Professional | 16 | 12.5% |
| Total | 128 | 100.0% |
School Enrollment by Age by Funding Source in Clear Spring
Out of a total of 128 students who are enrolled in schools in Clear Spring, 4 (3.1%) attend a private institution, while the remaining 124 (96.9%) are enrolled in public schools. The age group of 20 to 24 year olds has the highest likelihood of being enrolled in private schools, with 4 (44.4% in the age bracket) enrolled. Conversely, the age group of 5 to 9 year old has the lowest likelihood of being enrolled in a private school, with 40 (100.0% in the age bracket) attending a public institution.
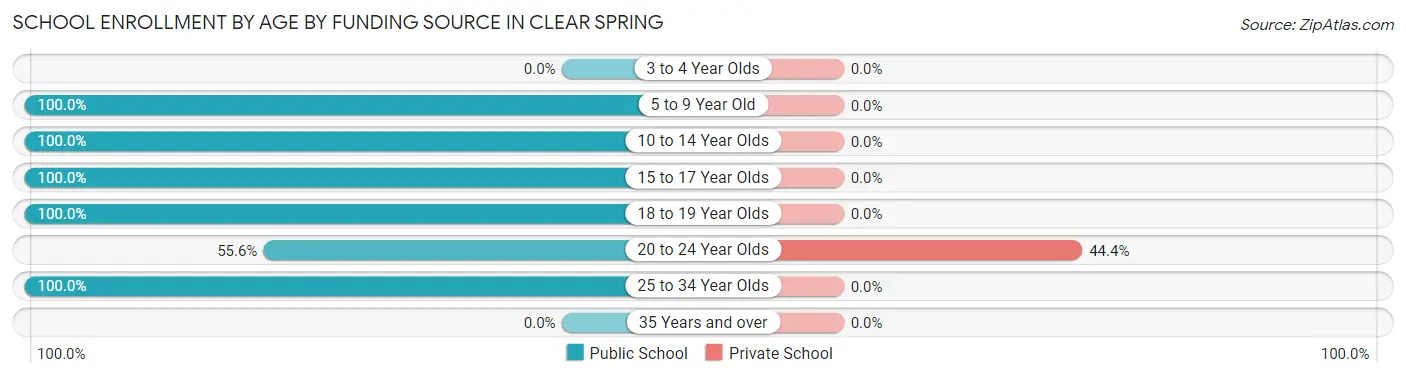
| Age Bracket | Public School | Private School |
| 3 to 4 Year Olds | 0 (0.0%) | 0 (0.0%) |
| 5 to 9 Year Old | 40 (100.0%) | 0 (0.0%) |
| 10 to 14 Year Olds | 23 (100.0%) | 0 (0.0%) |
| 15 to 17 Year Olds | 16 (100.0%) | 0 (0.0%) |
| 18 to 19 Year Olds | 16 (100.0%) | 0 (0.0%) |
| 20 to 24 Year Olds | 5 (55.6%) | 4 (44.4%) |
| 25 to 34 Year Olds | 24 (100.0%) | 0 (0.0%) |
| 35 Years and over | 0 (0.0%) | 0 (0.0%) |
| Total | 124 (96.9%) | 4 (3.1%) |
Educational Attainment by Field of Study in Clear Spring
Education (33 | 68.8%), science & technology (11 | 22.9%), engineering (2 | 4.2%), and literature & languages (2 | 4.2%) are the most common fields of study among 48 individuals in Clear Spring who have obtained a bachelor's degree or higher.
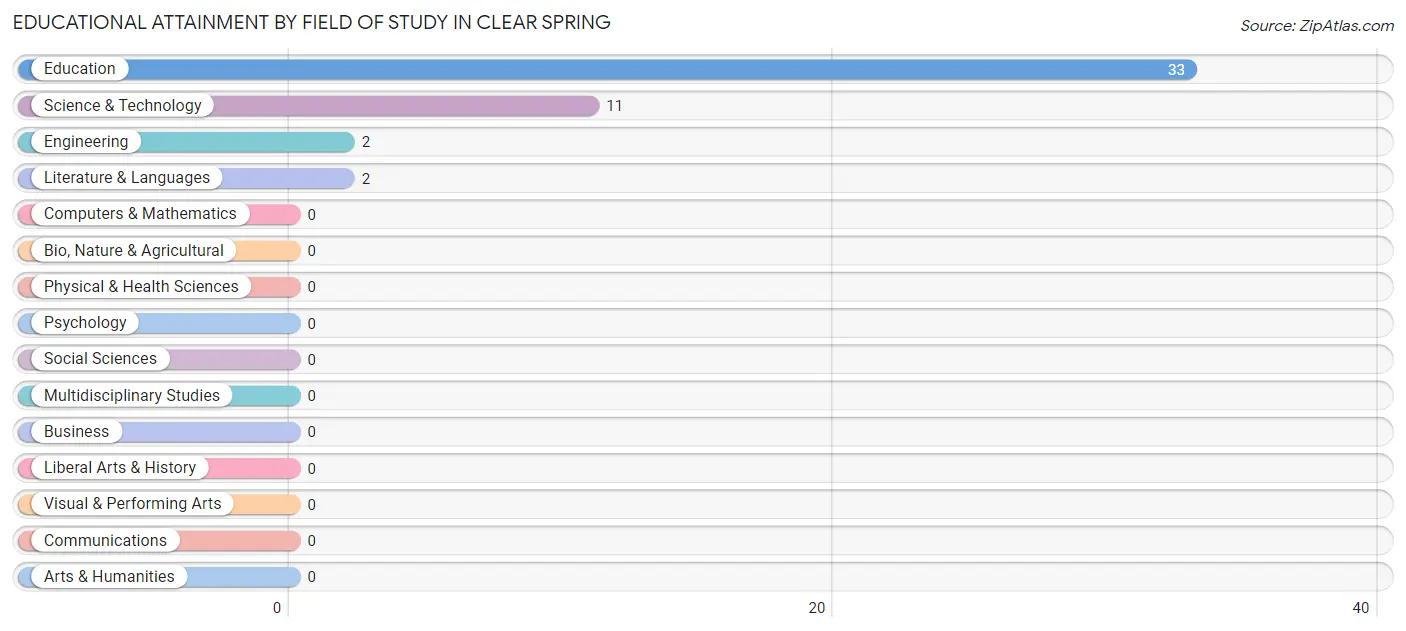
| Field of Study | # Graduates | % Graduates |
| Computers & Mathematics | 0 | 0.0% |
| Bio, Nature & Agricultural | 0 | 0.0% |
| Physical & Health Sciences | 0 | 0.0% |
| Psychology | 0 | 0.0% |
| Social Sciences | 0 | 0.0% |
| Engineering | 2 | 4.2% |
| Multidisciplinary Studies | 0 | 0.0% |
| Science & Technology | 11 | 22.9% |
| Business | 0 | 0.0% |
| Education | 33 | 68.8% |
| Literature & Languages | 2 | 4.2% |
| Liberal Arts & History | 0 | 0.0% |
| Visual & Performing Arts | 0 | 0.0% |
| Communications | 0 | 0.0% |
| Arts & Humanities | 0 | 0.0% |
| Total | 48 | 100.0% |
Transportation & Commute in Clear Spring
Vehicle Availability by Sex in Clear Spring
The most prevalent vehicle ownership categories in Clear Spring are males with 1 vehicle (37, accounting for 39.8%) and females with 1 vehicle (26, making up 28.9%).
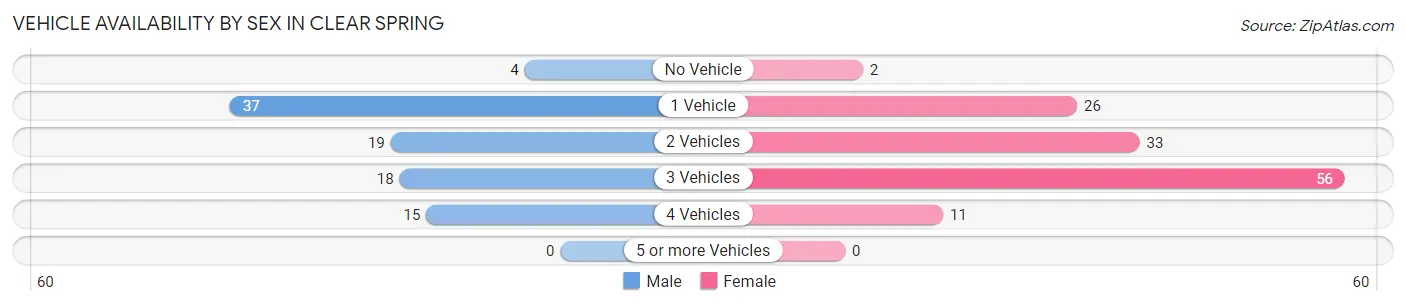
| Vehicles Available | Male | Female |
| No Vehicle | 4 (4.3%) | 2 (1.6%) |
| 1 Vehicle | 37 (39.8%) | 26 (20.3%) |
| 2 Vehicles | 19 (20.4%) | 33 (25.8%) |
| 3 Vehicles | 18 (19.4%) | 56 (43.8%) |
| 4 Vehicles | 15 (16.1%) | 11 (8.6%) |
| 5 or more Vehicles | 0 (0.0%) | 0 (0.0%) |
| Total | 93 (100.0%) | 128 (100.0%) |
Commute Time in Clear Spring
The most frequently occuring commute durations in Clear Spring are 20 to 24 minutes (58 commuters, 27.8%), 15 to 19 minutes (55 commuters, 26.3%), and 25 to 29 minutes (22 commuters, 10.5%).
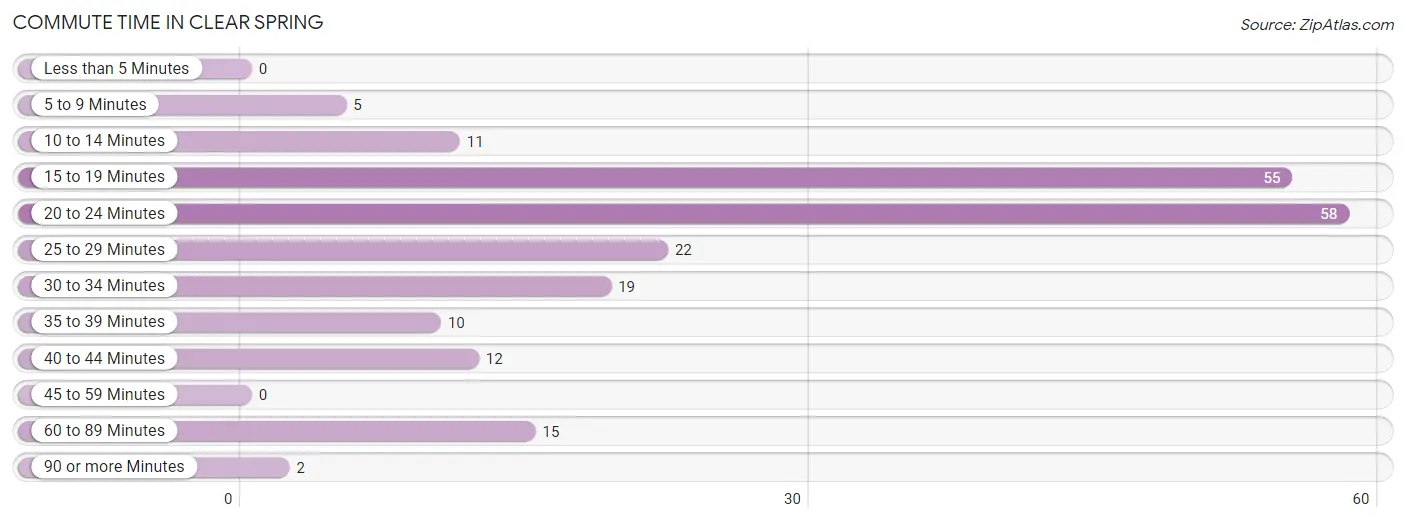
| Commute Time | # Commuters | % Commuters |
| Less than 5 Minutes | 0 | 0.0% |
| 5 to 9 Minutes | 5 | 2.4% |
| 10 to 14 Minutes | 11 | 5.3% |
| 15 to 19 Minutes | 55 | 26.3% |
| 20 to 24 Minutes | 58 | 27.8% |
| 25 to 29 Minutes | 22 | 10.5% |
| 30 to 34 Minutes | 19 | 9.1% |
| 35 to 39 Minutes | 10 | 4.8% |
| 40 to 44 Minutes | 12 | 5.7% |
| 45 to 59 Minutes | 0 | 0.0% |
| 60 to 89 Minutes | 15 | 7.2% |
| 90 or more Minutes | 2 | 1.0% |
Commute Time by Sex in Clear Spring
The most common commute times in Clear Spring are 20 to 24 minutes (21 commuters, 23.1%) for males and 15 to 19 minutes (44 commuters, 37.3%) for females.
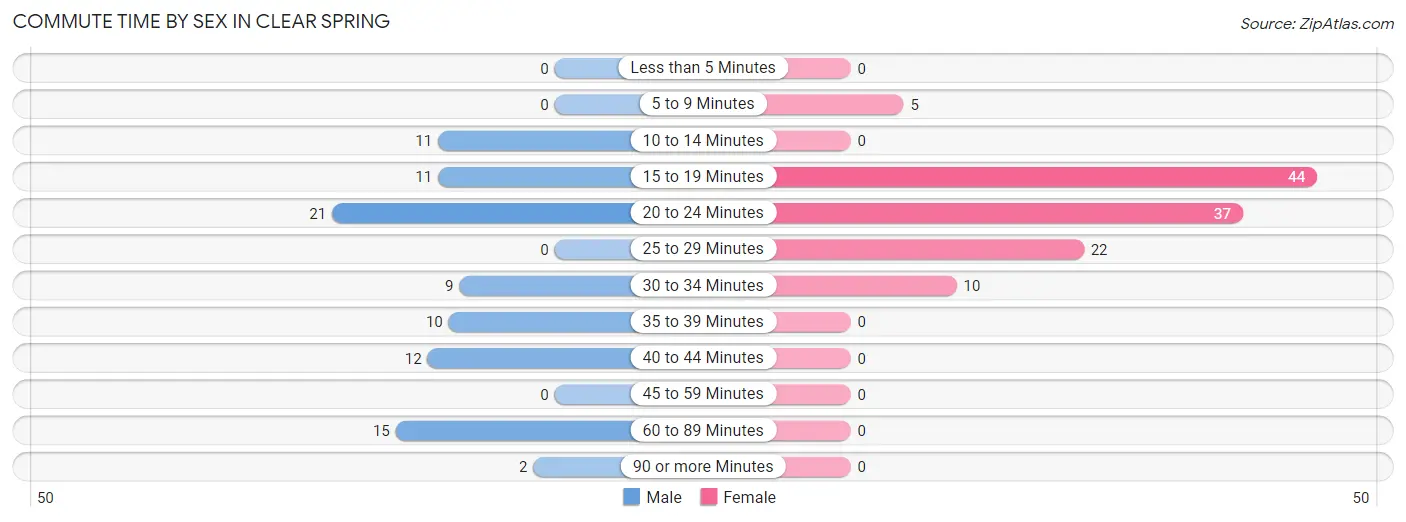
| Commute Time | Male | Female |
| Less than 5 Minutes | 0 (0.0%) | 0 (0.0%) |
| 5 to 9 Minutes | 0 (0.0%) | 5 (4.2%) |
| 10 to 14 Minutes | 11 (12.1%) | 0 (0.0%) |
| 15 to 19 Minutes | 11 (12.1%) | 44 (37.3%) |
| 20 to 24 Minutes | 21 (23.1%) | 37 (31.4%) |
| 25 to 29 Minutes | 0 (0.0%) | 22 (18.6%) |
| 30 to 34 Minutes | 9 (9.9%) | 10 (8.5%) |
| 35 to 39 Minutes | 10 (11.0%) | 0 (0.0%) |
| 40 to 44 Minutes | 12 (13.2%) | 0 (0.0%) |
| 45 to 59 Minutes | 0 (0.0%) | 0 (0.0%) |
| 60 to 89 Minutes | 15 (16.5%) | 0 (0.0%) |
| 90 or more Minutes | 2 (2.2%) | 0 (0.0%) |
Time of Departure to Work by Sex in Clear Spring
The most frequent times of departure to work in Clear Spring are 6:30 AM to 6:59 AM (20, 22.0%) for males and 7:30 AM to 7:59 AM (59, 50.0%) for females.
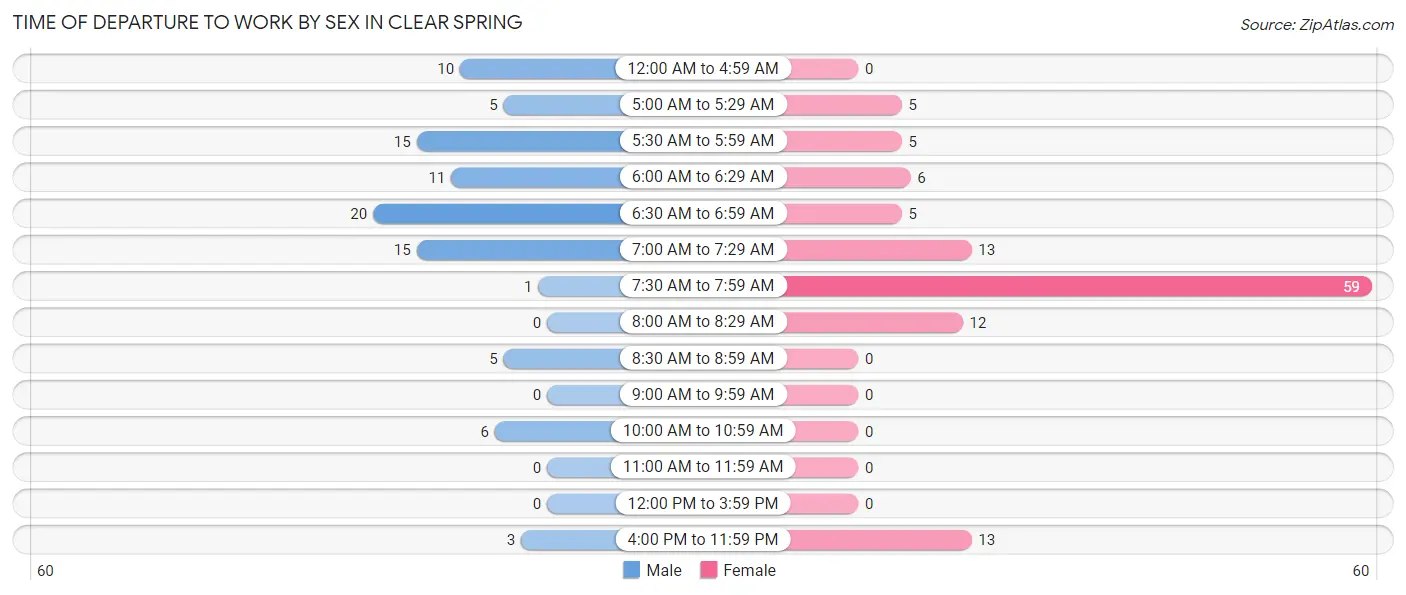
| Time of Departure | Male | Female |
| 12:00 AM to 4:59 AM | 10 (11.0%) | 0 (0.0%) |
| 5:00 AM to 5:29 AM | 5 (5.5%) | 5 (4.2%) |
| 5:30 AM to 5:59 AM | 15 (16.5%) | 5 (4.2%) |
| 6:00 AM to 6:29 AM | 11 (12.1%) | 6 (5.1%) |
| 6:30 AM to 6:59 AM | 20 (22.0%) | 5 (4.2%) |
| 7:00 AM to 7:29 AM | 15 (16.5%) | 13 (11.0%) |
| 7:30 AM to 7:59 AM | 1 (1.1%) | 59 (50.0%) |
| 8:00 AM to 8:29 AM | 0 (0.0%) | 12 (10.2%) |
| 8:30 AM to 8:59 AM | 5 (5.5%) | 0 (0.0%) |
| 9:00 AM to 9:59 AM | 0 (0.0%) | 0 (0.0%) |
| 10:00 AM to 10:59 AM | 6 (6.6%) | 0 (0.0%) |
| 11:00 AM to 11:59 AM | 0 (0.0%) | 0 (0.0%) |
| 12:00 PM to 3:59 PM | 0 (0.0%) | 0 (0.0%) |
| 4:00 PM to 11:59 PM | 3 (3.3%) | 13 (11.0%) |
| Total | 91 (100.0%) | 118 (100.0%) |
Housing Occupancy in Clear Spring
Occupancy by Ownership in Clear Spring
Of the total 164 dwellings in Clear Spring, owner-occupied units account for 81 (49.4%), while renter-occupied units make up 83 (50.6%).
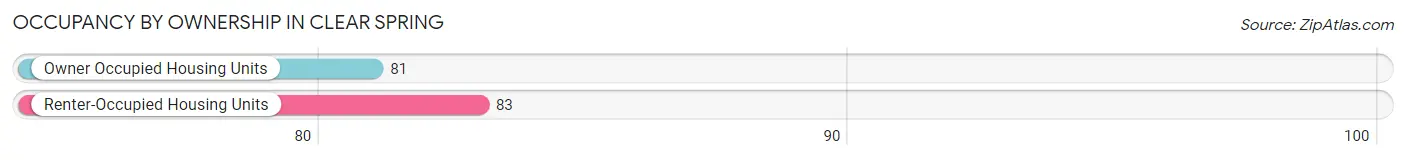
| Occupancy | # Housing Units | % Housing Units |
| Owner Occupied Housing Units | 81 | 49.4% |
| Renter-Occupied Housing Units | 83 | 50.6% |
| Total Occupied Housing Units | 164 | 100.0% |
Occupancy by Household Size in Clear Spring
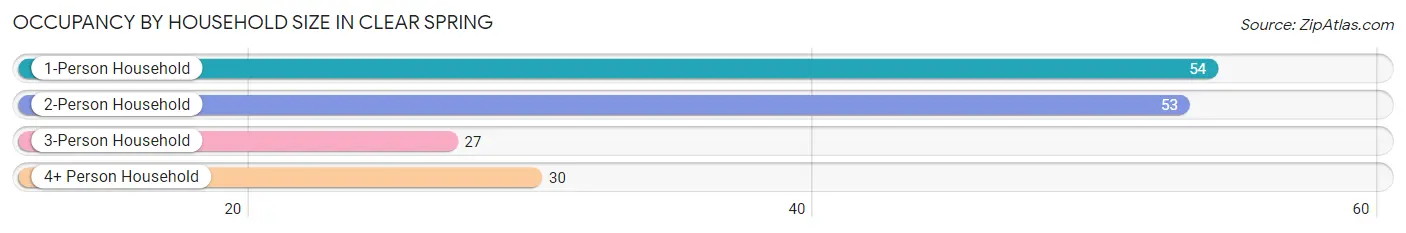
| Household Size | # Housing Units | % Housing Units |
| 1-Person Household | 54 | 32.9% |
| 2-Person Household | 53 | 32.3% |
| 3-Person Household | 27 | 16.5% |
| 4+ Person Household | 30 | 18.3% |
| Total Housing Units | 164 | 100.0% |
Occupancy by Ownership by Household Size in Clear Spring
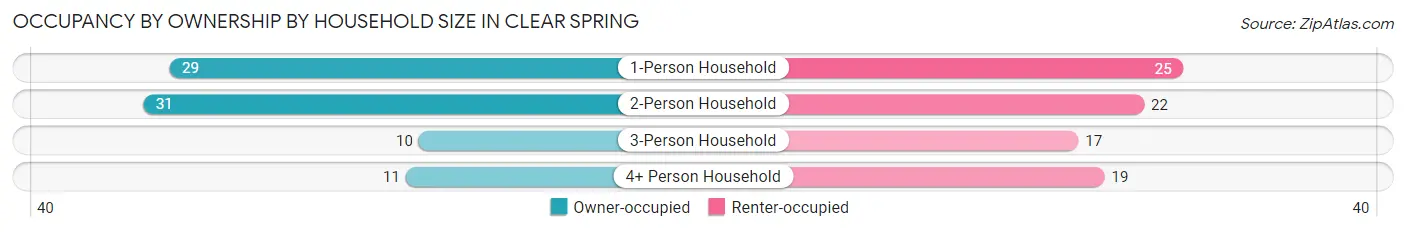
| Household Size | Owner-occupied | Renter-occupied |
| 1-Person Household | 29 (53.7%) | 25 (46.3%) |
| 2-Person Household | 31 (58.5%) | 22 (41.5%) |
| 3-Person Household | 10 (37.0%) | 17 (63.0%) |
| 4+ Person Household | 11 (36.7%) | 19 (63.3%) |
| Total Housing Units | 81 (49.4%) | 83 (50.6%) |
Occupancy by Educational Attainment in Clear Spring
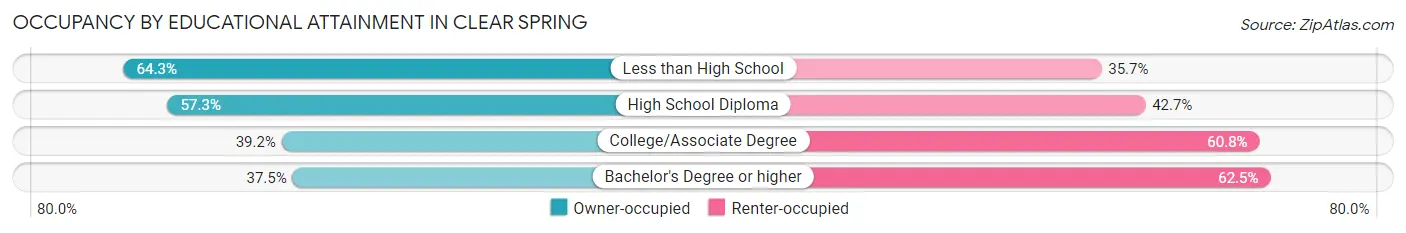
| Household Size | Owner-occupied | Renter-occupied |
| Less than High School | 9 (64.3%) | 5 (35.7%) |
| High School Diploma | 43 (57.3%) | 32 (42.7%) |
| College/Associate Degree | 20 (39.2%) | 31 (60.8%) |
| Bachelor's Degree or higher | 9 (37.5%) | 15 (62.5%) |
Occupancy by Age of Householder in Clear Spring
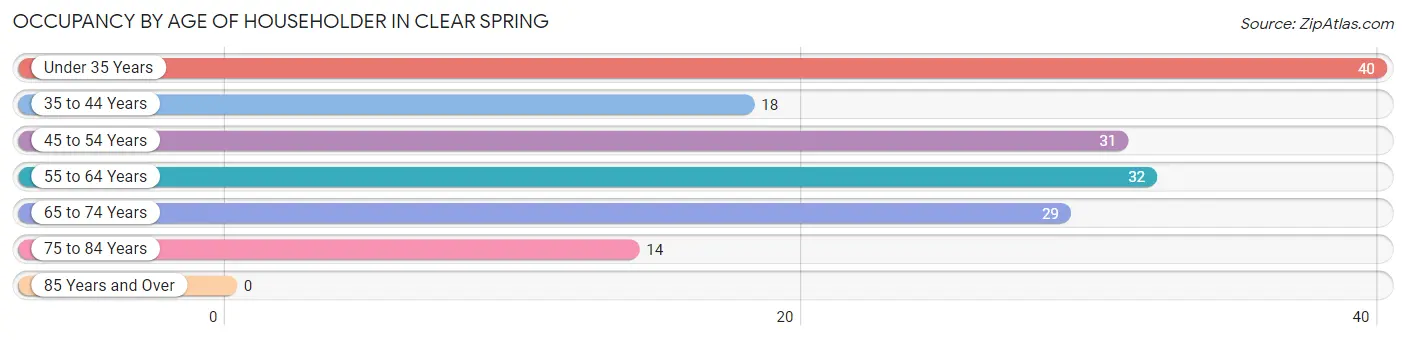
| Age Bracket | # Households | % Households |
| Under 35 Years | 40 | 24.4% |
| 35 to 44 Years | 18 | 11.0% |
| 45 to 54 Years | 31 | 18.9% |
| 55 to 64 Years | 32 | 19.5% |
| 65 to 74 Years | 29 | 17.7% |
| 75 to 84 Years | 14 | 8.5% |
| 85 Years and Over | 0 | 0.0% |
| Total | 164 | 100.0% |
Housing Finances in Clear Spring
Median Income by Occupancy in Clear Spring
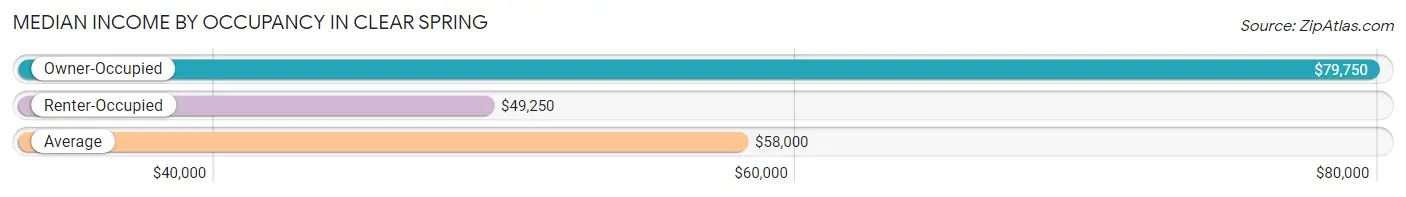
| Occupancy Type | # Households | Median Income |
| Owner-Occupied | 81 (49.4%) | $79,750 |
| Renter-Occupied | 83 (50.6%) | $49,250 |
| Average | 164 (100.0%) | $58,000 |
Occupancy by Householder Income Bracket in Clear Spring
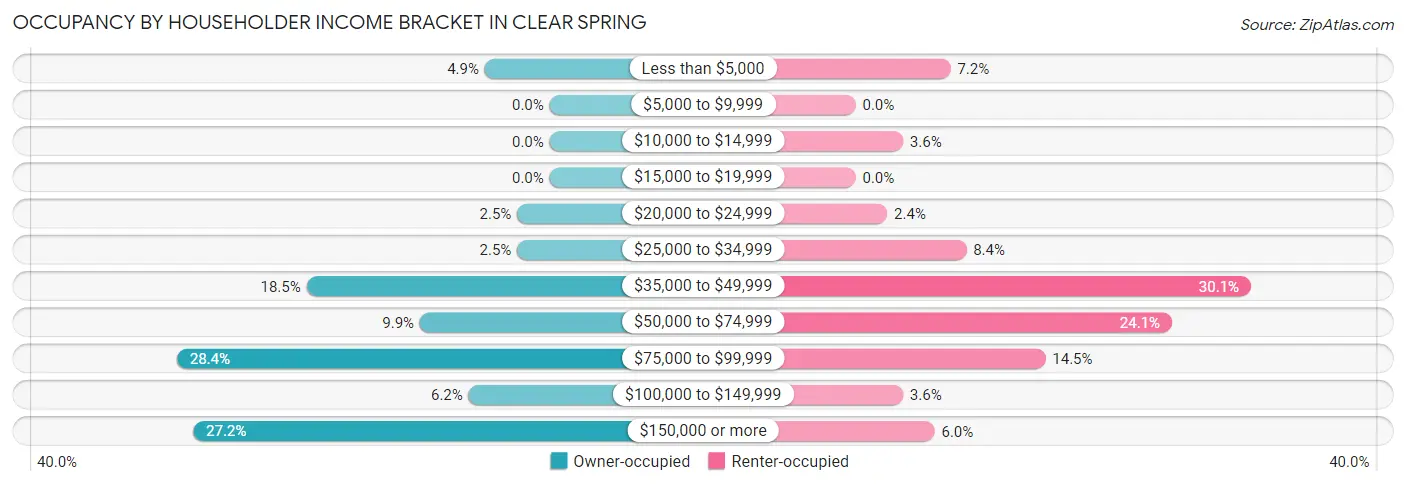
| Income Bracket | Owner-occupied | Renter-occupied |
| Less than $5,000 | 4 (4.9%) | 6 (7.2%) |
| $5,000 to $9,999 | 0 (0.0%) | 0 (0.0%) |
| $10,000 to $14,999 | 0 (0.0%) | 3 (3.6%) |
| $15,000 to $19,999 | 0 (0.0%) | 0 (0.0%) |
| $20,000 to $24,999 | 2 (2.5%) | 2 (2.4%) |
| $25,000 to $34,999 | 2 (2.5%) | 7 (8.4%) |
| $35,000 to $49,999 | 15 (18.5%) | 25 (30.1%) |
| $50,000 to $74,999 | 8 (9.9%) | 20 (24.1%) |
| $75,000 to $99,999 | 23 (28.4%) | 12 (14.5%) |
| $100,000 to $149,999 | 5 (6.2%) | 3 (3.6%) |
| $150,000 or more | 22 (27.2%) | 5 (6.0%) |
| Total | 81 (100.0%) | 83 (100.0%) |
Monthly Housing Cost Tiers in Clear Spring
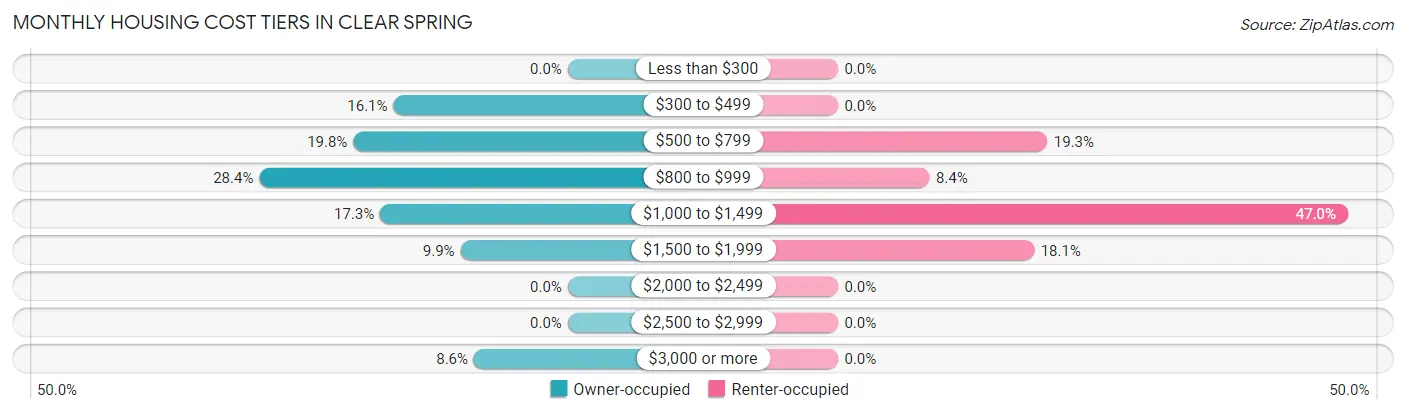
| Monthly Cost | Owner-occupied | Renter-occupied |
| Less than $300 | 0 (0.0%) | 0 (0.0%) |
| $300 to $499 | 13 (16.1%) | 0 (0.0%) |
| $500 to $799 | 16 (19.8%) | 16 (19.3%) |
| $800 to $999 | 23 (28.4%) | 7 (8.4%) |
| $1,000 to $1,499 | 14 (17.3%) | 39 (47.0%) |
| $1,500 to $1,999 | 8 (9.9%) | 15 (18.1%) |
| $2,000 to $2,499 | 0 (0.0%) | 0 (0.0%) |
| $2,500 to $2,999 | 0 (0.0%) | 0 (0.0%) |
| $3,000 or more | 7 (8.6%) | 0 (0.0%) |
| Total | 81 (100.0%) | 83 (100.0%) |
Physical Housing Characteristics in Clear Spring
Housing Structures in Clear Spring
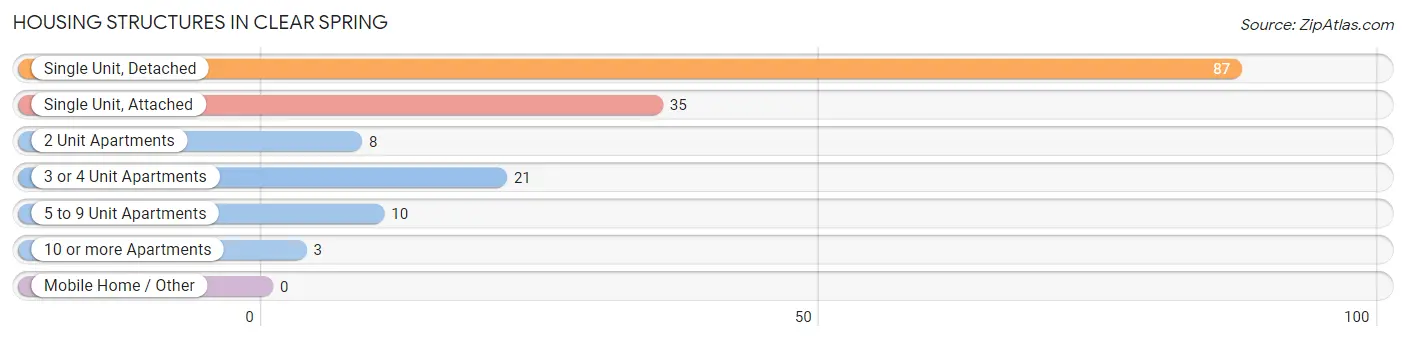
| Structure Type | # Housing Units | % Housing Units |
| Single Unit, Detached | 87 | 53.0% |
| Single Unit, Attached | 35 | 21.3% |
| 2 Unit Apartments | 8 | 4.9% |
| 3 or 4 Unit Apartments | 21 | 12.8% |
| 5 to 9 Unit Apartments | 10 | 6.1% |
| 10 or more Apartments | 3 | 1.8% |
| Mobile Home / Other | 0 | 0.0% |
| Total | 164 | 100.0% |
Housing Structures by Occupancy in Clear Spring
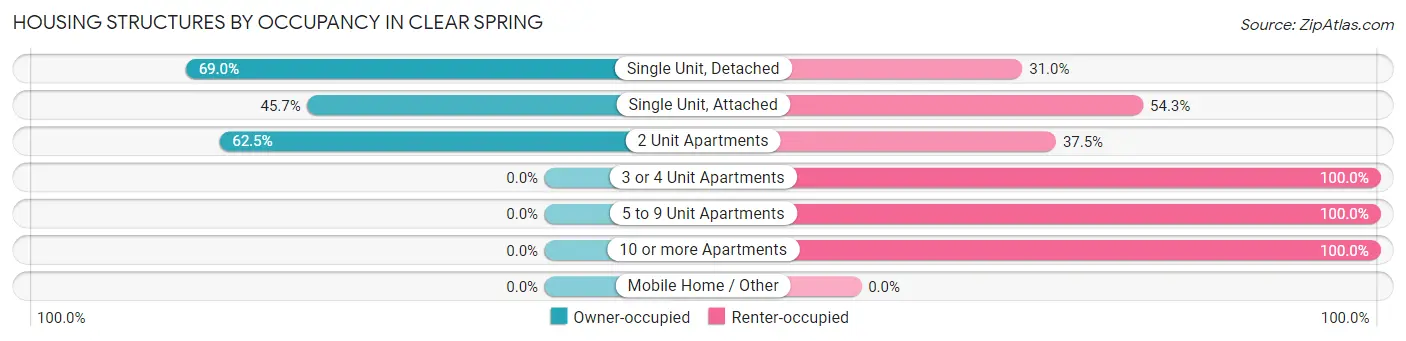
| Structure Type | Owner-occupied | Renter-occupied |
| Single Unit, Detached | 60 (69.0%) | 27 (31.0%) |
| Single Unit, Attached | 16 (45.7%) | 19 (54.3%) |
| 2 Unit Apartments | 5 (62.5%) | 3 (37.5%) |
| 3 or 4 Unit Apartments | 0 (0.0%) | 21 (100.0%) |
| 5 to 9 Unit Apartments | 0 (0.0%) | 10 (100.0%) |
| 10 or more Apartments | 0 (0.0%) | 3 (100.0%) |
| Mobile Home / Other | 0 (0.0%) | 0 (0.0%) |
| Total | 81 (49.4%) | 83 (50.6%) |
Housing Structures by Number of Rooms in Clear Spring
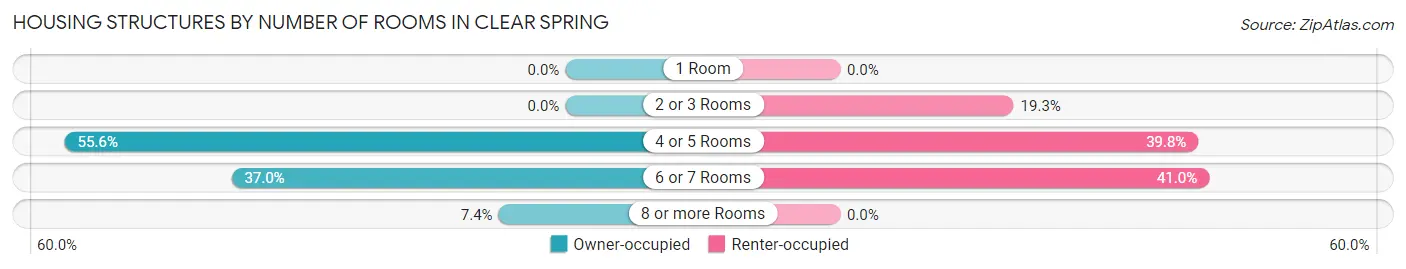
| Number of Rooms | Owner-occupied | Renter-occupied |
| 1 Room | 0 (0.0%) | 0 (0.0%) |
| 2 or 3 Rooms | 0 (0.0%) | 16 (19.3%) |
| 4 or 5 Rooms | 45 (55.6%) | 33 (39.8%) |
| 6 or 7 Rooms | 30 (37.0%) | 34 (41.0%) |
| 8 or more Rooms | 6 (7.4%) | 0 (0.0%) |
| Total | 81 (100.0%) | 83 (100.0%) |
Housing Structure by Heating Type in Clear Spring
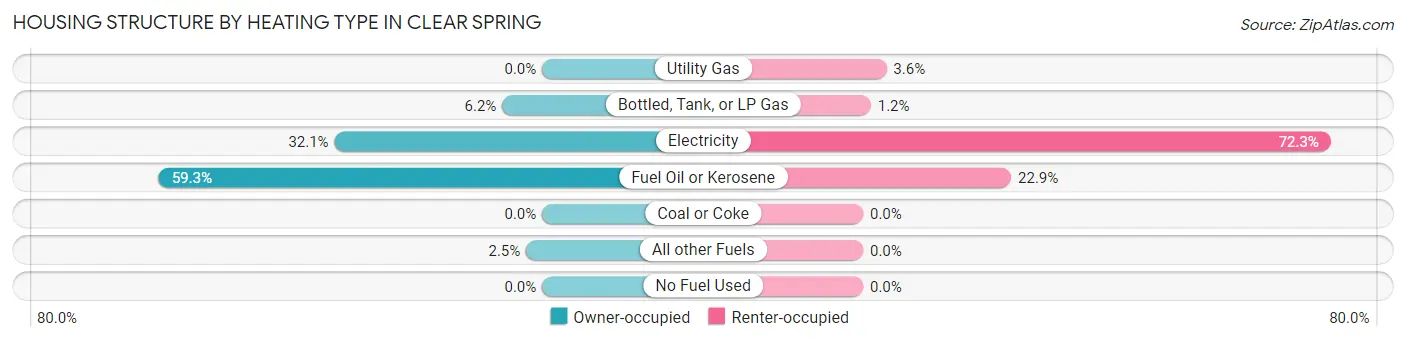
| Heating Type | Owner-occupied | Renter-occupied |
| Utility Gas | 0 (0.0%) | 3 (3.6%) |
| Bottled, Tank, or LP Gas | 5 (6.2%) | 1 (1.2%) |
| Electricity | 26 (32.1%) | 60 (72.3%) |
| Fuel Oil or Kerosene | 48 (59.3%) | 19 (22.9%) |
| Coal or Coke | 0 (0.0%) | 0 (0.0%) |
| All other Fuels | 2 (2.5%) | 0 (0.0%) |
| No Fuel Used | 0 (0.0%) | 0 (0.0%) |
| Total | 81 (100.0%) | 83 (100.0%) |
Household Vehicle Usage in Clear Spring
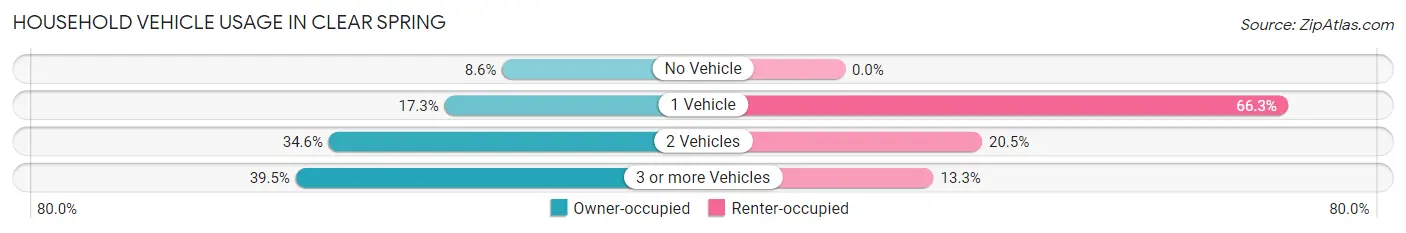
| Vehicles per Household | Owner-occupied | Renter-occupied |
| No Vehicle | 7 (8.6%) | 0 (0.0%) |
| 1 Vehicle | 14 (17.3%) | 55 (66.3%) |
| 2 Vehicles | 28 (34.6%) | 17 (20.5%) |
| 3 or more Vehicles | 32 (39.5%) | 11 (13.3%) |
| Total | 81 (100.0%) | 83 (100.0%) |
Real Estate & Mortgages in Clear Spring
Real Estate and Mortgage Overview in Clear Spring
| Characteristic | Without Mortgage | With Mortgage |
| Housing Units | 31 | 50 |
| Median Property Value | $177,500 | $160,400 |
| Median Household Income | $91,750 | $13 |
| Monthly Housing Costs | $528 | $7 |
| Real Estate Taxes | $1,339 | $0 |
Property Value by Mortgage Status in Clear Spring
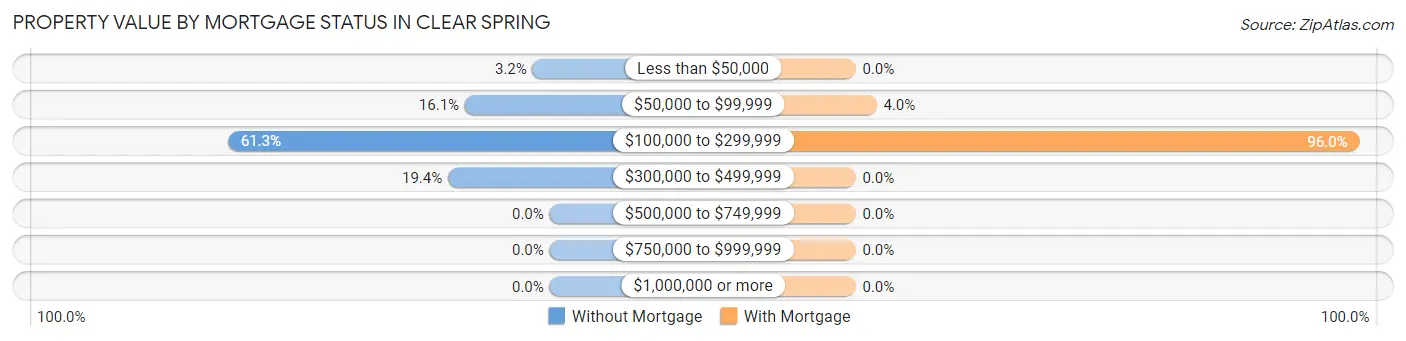
| Property Value | Without Mortgage | With Mortgage |
| Less than $50,000 | 1 (3.2%) | 0 (0.0%) |
| $50,000 to $99,999 | 5 (16.1%) | 2 (4.0%) |
| $100,000 to $299,999 | 19 (61.3%) | 48 (96.0%) |
| $300,000 to $499,999 | 6 (19.4%) | 0 (0.0%) |
| $500,000 to $749,999 | 0 (0.0%) | 0 (0.0%) |
| $750,000 to $999,999 | 0 (0.0%) | 0 (0.0%) |
| $1,000,000 or more | 0 (0.0%) | 0 (0.0%) |
| Total | 31 (100.0%) | 50 (100.0%) |
Household Income by Mortgage Status in Clear Spring
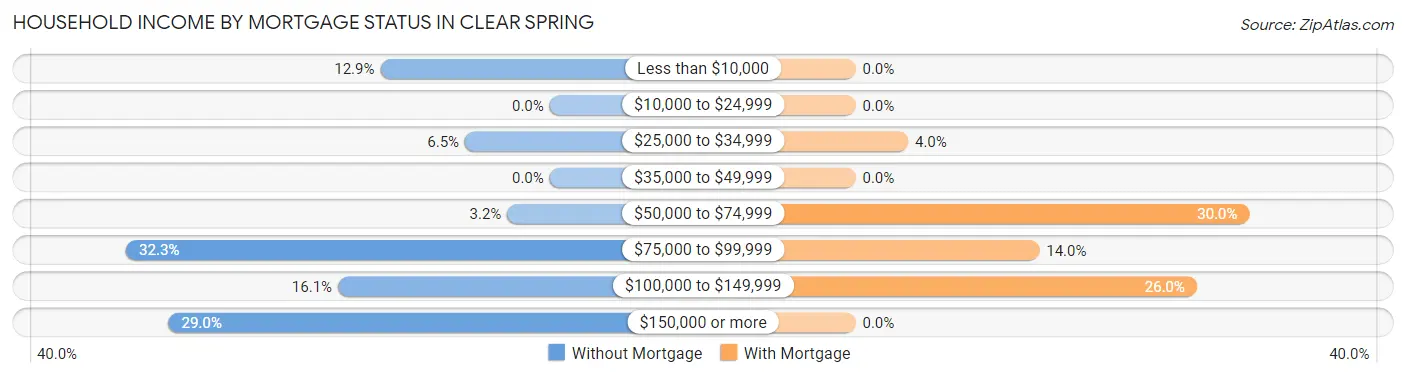
| Household Income | Without Mortgage | With Mortgage |
| Less than $10,000 | 4 (12.9%) | 0 (0.0%) |
| $10,000 to $24,999 | 0 (0.0%) | 0 (0.0%) |
| $25,000 to $34,999 | 2 (6.5%) | 2 (4.0%) |
| $35,000 to $49,999 | 0 (0.0%) | 0 (0.0%) |
| $50,000 to $74,999 | 1 (3.2%) | 15 (30.0%) |
| $75,000 to $99,999 | 10 (32.3%) | 7 (14.0%) |
| $100,000 to $149,999 | 5 (16.1%) | 13 (26.0%) |
| $150,000 or more | 9 (29.0%) | 0 (0.0%) |
| Total | 31 (100.0%) | 50 (100.0%) |
Property Value to Household Income Ratio in Clear Spring
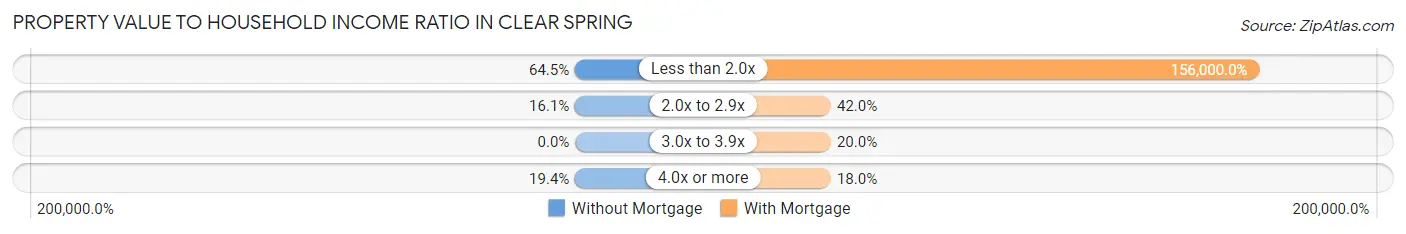
| Value-to-Income Ratio | Without Mortgage | With Mortgage |
| Less than 2.0x | 20 (64.5%) | 78,000 (156,000.0%) |
| 2.0x to 2.9x | 5 (16.1%) | 21 (42.0%) |
| 3.0x to 3.9x | 0 (0.0%) | 10 (20.0%) |
| 4.0x or more | 6 (19.4%) | 9 (18.0%) |
| Total | 31 (100.0%) | 50 (100.0%) |
Real Estate Taxes by Mortgage Status in Clear Spring
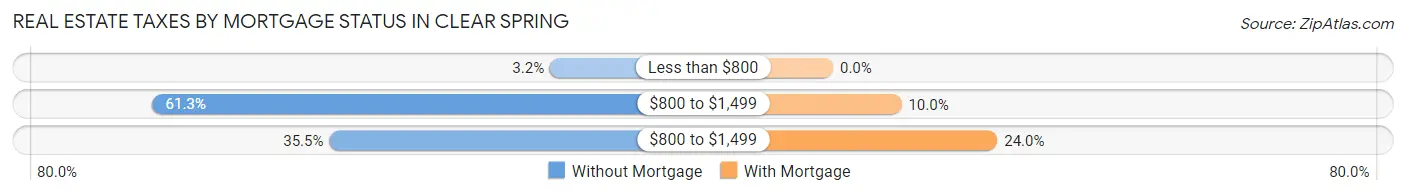
| Property Taxes | Without Mortgage | With Mortgage |
| Less than $800 | 1 (3.2%) | 0 (0.0%) |
| $800 to $1,499 | 19 (61.3%) | 5 (10.0%) |
| $800 to $1,499 | 11 (35.5%) | 12 (24.0%) |
| Total | 31 (100.0%) | 50 (100.0%) |
Health & Disability in Clear Spring
Health Insurance Coverage by Age in Clear Spring
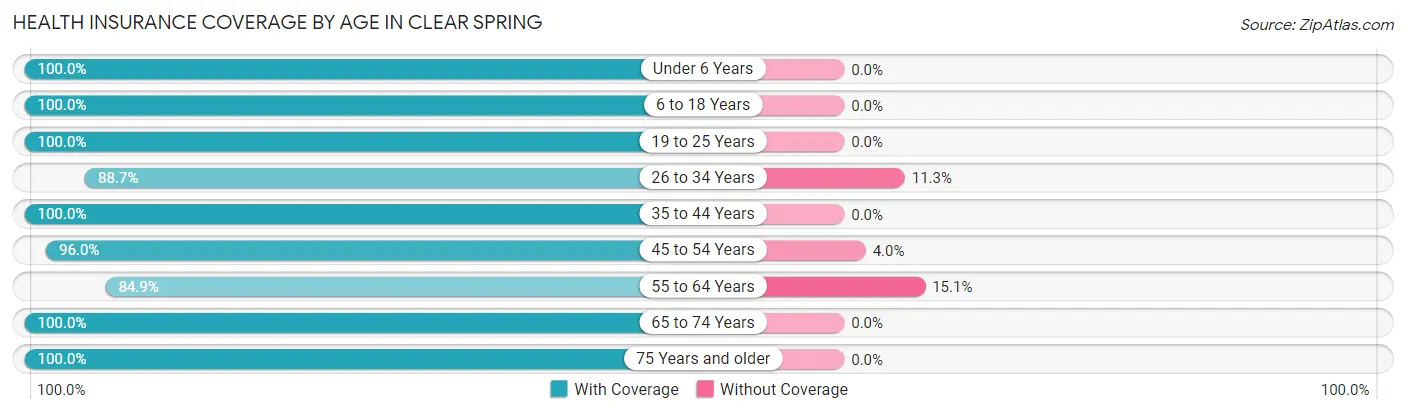
| Age Bracket | With Coverage | Without Coverage |
| Under 6 Years | 26 (100.0%) | 0 (0.0%) |
| 6 to 18 Years | 89 (100.0%) | 0 (0.0%) |
| 19 to 25 Years | 24 (100.0%) | 0 (0.0%) |
| 26 to 34 Years | 55 (88.7%) | 7 (11.3%) |
| 35 to 44 Years | 41 (100.0%) | 0 (0.0%) |
| 45 to 54 Years | 48 (96.0%) | 2 (4.0%) |
| 55 to 64 Years | 45 (84.9%) | 8 (15.1%) |
| 65 to 74 Years | 41 (100.0%) | 0 (0.0%) |
| 75 Years and older | 25 (100.0%) | 0 (0.0%) |
| Total | 394 (95.9%) | 17 (4.1%) |
Health Insurance Coverage by Citizenship Status in Clear Spring
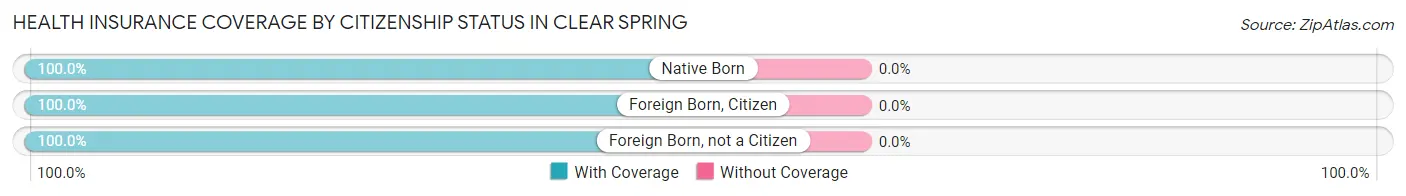
| Citizenship Status | With Coverage | Without Coverage |
| Native Born | 26 (100.0%) | 0 (0.0%) |
| Foreign Born, Citizen | 89 (100.0%) | 0 (0.0%) |
| Foreign Born, not a Citizen | 24 (100.0%) | 0 (0.0%) |
Health Insurance Coverage by Household Income in Clear Spring
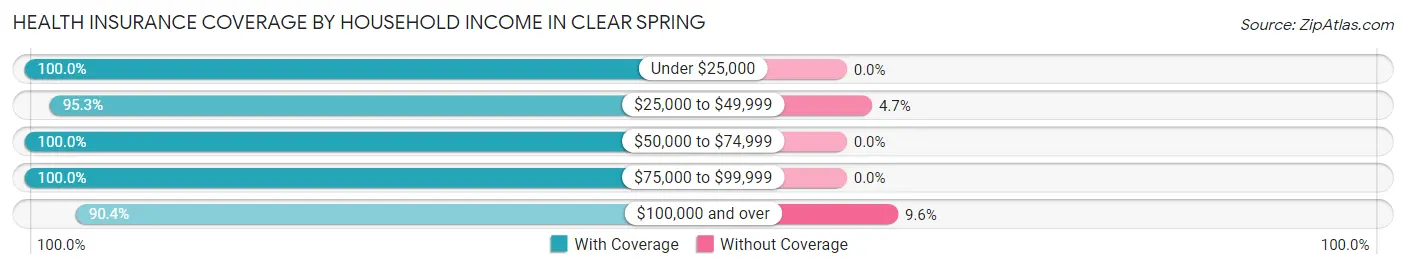
| Household Income | With Coverage | Without Coverage |
| Under $25,000 | 35 (100.0%) | 0 (0.0%) |
| $25,000 to $49,999 | 101 (95.3%) | 5 (4.7%) |
| $50,000 to $74,999 | 57 (100.0%) | 0 (0.0%) |
| $75,000 to $99,999 | 88 (100.0%) | 0 (0.0%) |
| $100,000 and over | 113 (90.4%) | 12 (9.6%) |
Public vs Private Health Insurance Coverage by Age in Clear Spring
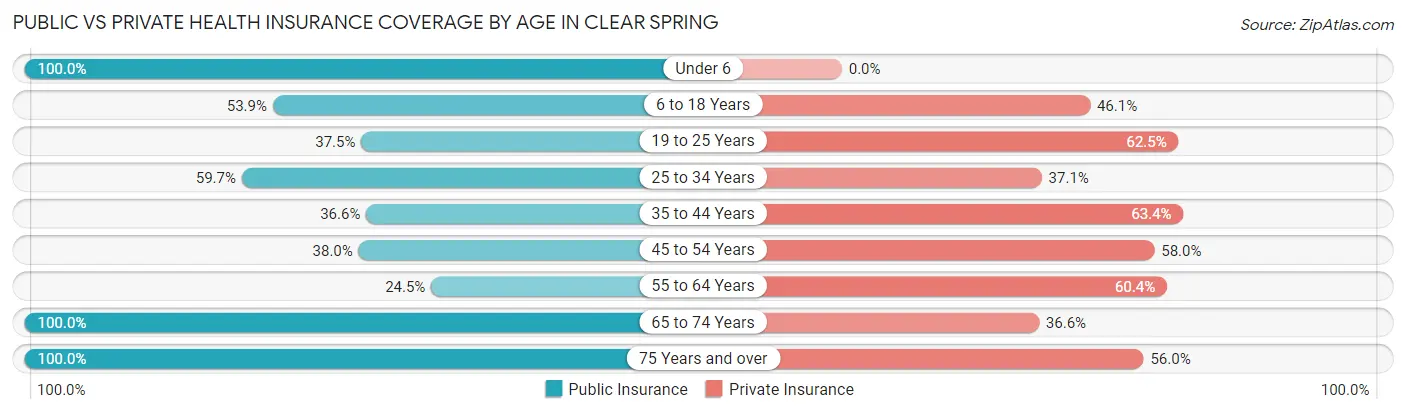
| Age Bracket | Public Insurance | Private Insurance |
| Under 6 | 26 (100.0%) | 0 (0.0%) |
| 6 to 18 Years | 48 (53.9%) | 41 (46.1%) |
| 19 to 25 Years | 9 (37.5%) | 15 (62.5%) |
| 25 to 34 Years | 37 (59.7%) | 23 (37.1%) |
| 35 to 44 Years | 15 (36.6%) | 26 (63.4%) |
| 45 to 54 Years | 19 (38.0%) | 29 (58.0%) |
| 55 to 64 Years | 13 (24.5%) | 32 (60.4%) |
| 65 to 74 Years | 41 (100.0%) | 15 (36.6%) |
| 75 Years and over | 25 (100.0%) | 14 (56.0%) |
| Total | 233 (56.7%) | 195 (47.4%) |
Disability Status by Sex by Age in Clear Spring
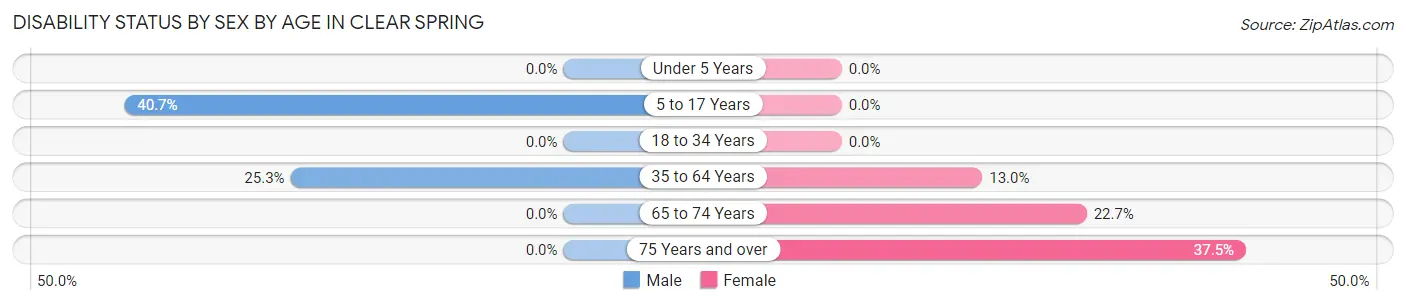
| Age Bracket | Male | Female |
| Under 5 Years | 0 (0.0%) | 0 (0.0%) |
| 5 to 17 Years | 11 (40.7%) | 0 (0.0%) |
| 18 to 34 Years | 0 (0.0%) | 0 (0.0%) |
| 35 to 64 Years | 19 (25.3%) | 9 (13.0%) |
| 65 to 74 Years | 0 (0.0%) | 5 (22.7%) |
| 75 Years and over | 0 (0.0%) | 6 (37.5%) |
Disability Class by Sex by Age in Clear Spring
Disability Class: Hearing Difficulty
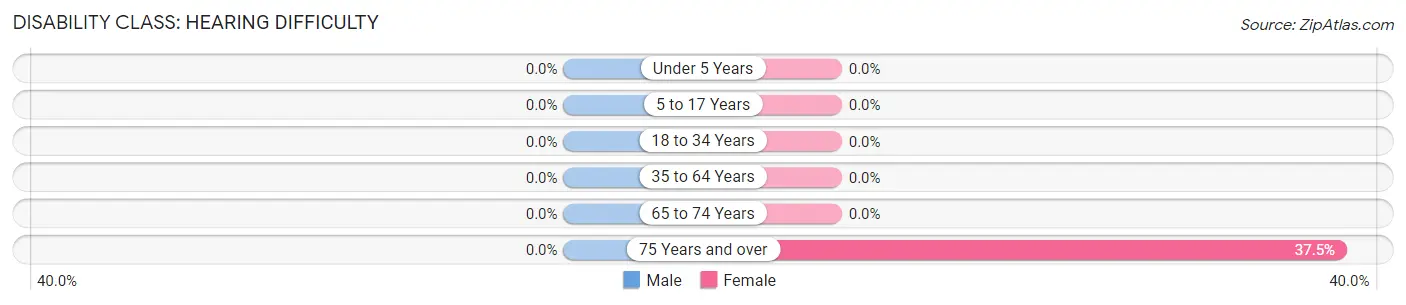
| Age Bracket | Male | Female |
| Under 5 Years | 0 (0.0%) | 0 (0.0%) |
| 5 to 17 Years | 0 (0.0%) | 0 (0.0%) |
| 18 to 34 Years | 0 (0.0%) | 0 (0.0%) |
| 35 to 64 Years | 0 (0.0%) | 0 (0.0%) |
| 65 to 74 Years | 0 (0.0%) | 0 (0.0%) |
| 75 Years and over | 0 (0.0%) | 6 (37.5%) |
Disability Class: Vision Difficulty
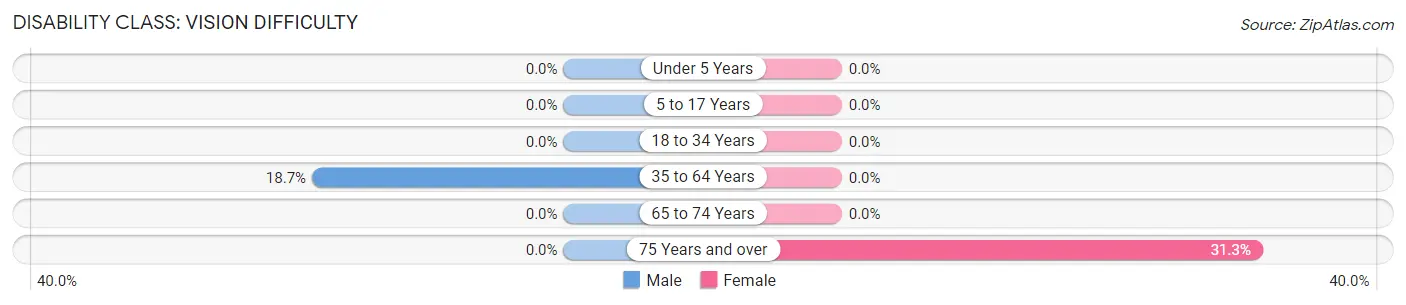
| Age Bracket | Male | Female |
| Under 5 Years | 0 (0.0%) | 0 (0.0%) |
| 5 to 17 Years | 0 (0.0%) | 0 (0.0%) |
| 18 to 34 Years | 0 (0.0%) | 0 (0.0%) |
| 35 to 64 Years | 14 (18.7%) | 0 (0.0%) |
| 65 to 74 Years | 0 (0.0%) | 0 (0.0%) |
| 75 Years and over | 0 (0.0%) | 5 (31.2%) |
Disability Class: Cognitive Difficulty
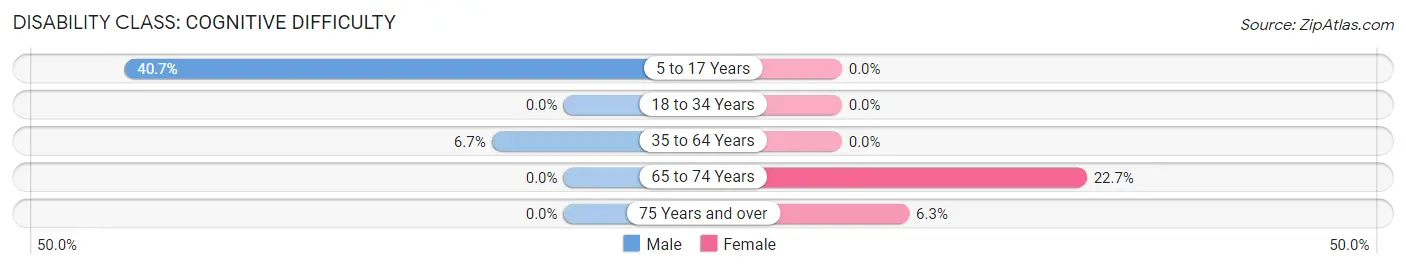
| Age Bracket | Male | Female |
| 5 to 17 Years | 11 (40.7%) | 0 (0.0%) |
| 18 to 34 Years | 0 (0.0%) | 0 (0.0%) |
| 35 to 64 Years | 5 (6.7%) | 0 (0.0%) |
| 65 to 74 Years | 0 (0.0%) | 5 (22.7%) |
| 75 Years and over | 0 (0.0%) | 1 (6.2%) |
Disability Class: Ambulatory Difficulty
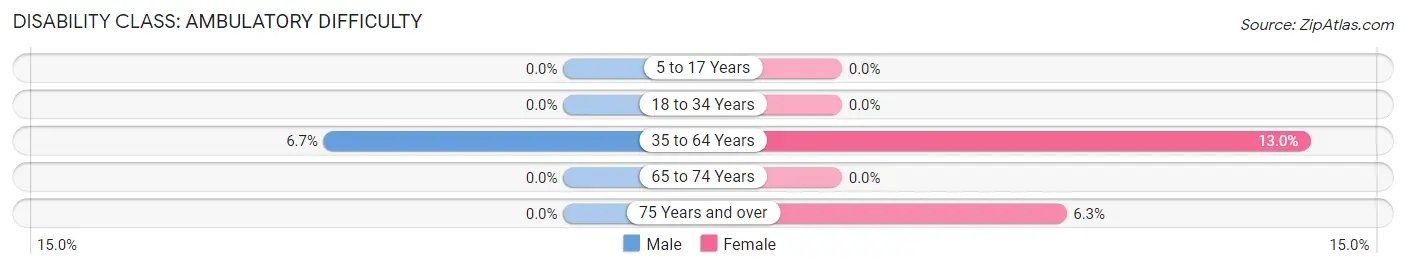
| Age Bracket | Male | Female |
| 5 to 17 Years | 0 (0.0%) | 0 (0.0%) |
| 18 to 34 Years | 0 (0.0%) | 0 (0.0%) |
| 35 to 64 Years | 5 (6.7%) | 9 (13.0%) |
| 65 to 74 Years | 0 (0.0%) | 0 (0.0%) |
| 75 Years and over | 0 (0.0%) | 1 (6.2%) |
Disability Class: Self-Care Difficulty
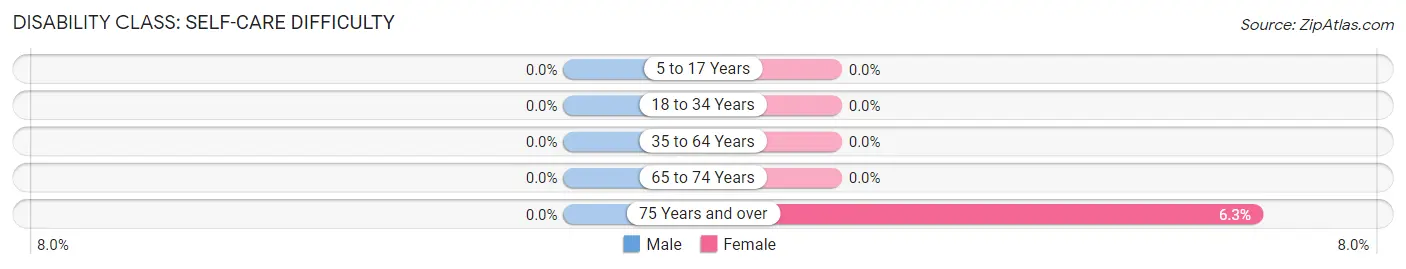
| Age Bracket | Male | Female |
| 5 to 17 Years | 0 (0.0%) | 0 (0.0%) |
| 18 to 34 Years | 0 (0.0%) | 0 (0.0%) |
| 35 to 64 Years | 0 (0.0%) | 0 (0.0%) |
| 65 to 74 Years | 0 (0.0%) | 0 (0.0%) |
| 75 Years and over | 0 (0.0%) | 1 (6.2%) |
Technology Access in Clear Spring
Computing Device Access in Clear Spring
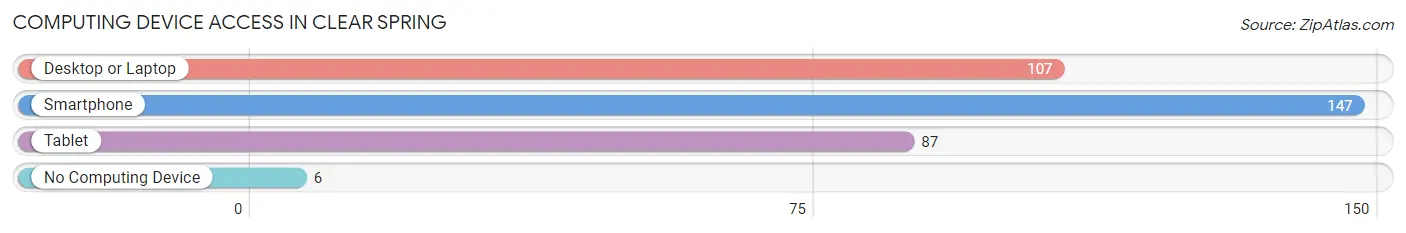
| Device Type | # Households | % Households |
| Desktop or Laptop | 107 | 65.2% |
| Smartphone | 147 | 89.6% |
| Tablet | 87 | 53.0% |
| No Computing Device | 6 | 3.7% |
| Total | 164 | 100.0% |
Internet Access in Clear Spring
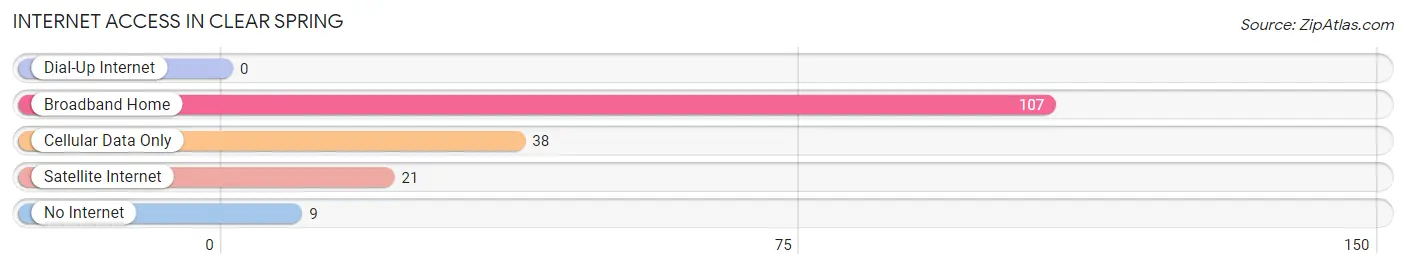
| Internet Type | # Households | % Households |
| Dial-Up Internet | 0 | 0.0% |
| Broadband Home | 107 | 65.2% |
| Cellular Data Only | 38 | 23.2% |
| Satellite Internet | 21 | 12.8% |
| No Internet | 9 | 5.5% |
| Total | 164 | 100.0% |
Clear Spring Summary
Spring, Maryland is a small town located in Washington County, Maryland. It is situated along the Potomac River, just south of Hagerstown. The town was founded in 1786 and is the oldest town in Washington County. The town is known for its historic buildings, scenic views, and its close proximity to the Appalachian Trail.
History
The town of Clear Spring was founded in 1786 by a group of German settlers. The settlers were led by John Jacob Keedy, who had purchased the land from the local Native Americans. The town was originally known as Keedysville, but was later changed to Clear Spring in 1820. The town was named for the clear spring that ran through the area.
The town was an important stop on the National Road, which was the first federally funded highway in the United States. The road was built in the early 1800s and connected Cumberland, Maryland to Vandalia, Illinois. The road was used by settlers and traders traveling westward.
The town was also an important stop on the Baltimore and Ohio Railroad. The railroad was built in the mid-1800s and connected Baltimore to the Ohio River. The railroad was used to transport coal and other goods to the east coast.
Geography
Clear Spring is located in Washington County, Maryland. The town is situated along the Potomac River, just south of Hagerstown. The town is surrounded by rolling hills and farmland. The town is located in the Appalachian Mountains and is close to the Appalachian Trail.
The town has a total area of 1.2 square miles, all of which is land. The town has a humid subtropical climate, with hot summers and cold winters. The average temperature in the summer is around 80 degrees Fahrenheit, and the average temperature in the winter is around 40 degrees Fahrenheit.
Economy
The economy of Clear Spring is largely based on agriculture and tourism. The town is home to several farms, which produce a variety of crops, including corn, soybeans, and hay. The town is also home to several wineries, which produce a variety of wines.
The town is also a popular tourist destination. The town is home to several historic buildings, including the Clear Spring Historic District, which is listed on the National Register of Historic Places. The town is also close to the Appalachian Trail, which attracts hikers and outdoor enthusiasts from all over the world.
Demographics
As of the 2010 census, the town of Clear Spring had a population of 1,717. The population is largely white (94.3%), with a small percentage of African Americans (2.2%) and Hispanics (2.1%). The median household income is $45,000, and the median home value is $150,000. The town has a low unemployment rate of 4.2%.
Conclusion
Clear Spring, Maryland is a small town located in Washington County, Maryland. The town was founded in 1786 and is the oldest town in Washington County. The town is known for its historic buildings, scenic views, and its close proximity to the Appalachian Trail. The economy of Clear Spring is largely based on agriculture and tourism. The town has a population of 1,717, with a median household income of $45,000 and a median home value of $150,000. The town has a low unemployment rate of 4.2%.
Common Questions
What is Per Capita Income in Clear Spring?
Per Capita income in Clear Spring is $40,065.
What is the Median Family Income in Clear Spring?
Median Family Income in Clear Spring is $54,375.
What is the Median Household income in Clear Spring?
Median Household Income in Clear Spring is $58,000.
What is Income or Wage Gap in Clear Spring?
Income or Wage Gap in Clear Spring is 33.3%.
Women in Clear Spring earn 66.7 cents for every dollar earned by a man.
What is Inequality or Gini Index in Clear Spring?
Inequality or Gini Index in Clear Spring is 0.49.
What is the Total Population of Clear Spring?
Total Population of Clear Spring is 411.
What is the Total Male Population of Clear Spring?
Total Male Population of Clear Spring is 170.
What is the Total Female Population of Clear Spring?
Total Female Population of Clear Spring is 241.
What is the Ratio of Males per 100 Females in Clear Spring?
There are 70.54 Males per 100 Females in Clear Spring.
What is the Ratio of Females per 100 Males in Clear Spring?
There are 141.76 Females per 100 Males in Clear Spring.
What is the Median Population Age in Clear Spring?
Median Population Age in Clear Spring is 35.8 Years.
What is the Average Family Size in Clear Spring
Average Family Size in Clear Spring is 3.0 People.
What is the Average Household Size in Clear Spring
Average Household Size in Clear Spring is 2.5 People.
How Large is the Labor Force in Clear Spring?
There are 224 People in the Labor Forcein in Clear Spring.
What is the Percentage of People in the Labor Force in Clear Spring?
71.8% of People are in the Labor Force in Clear Spring.
What is the Unemployment Rate in Clear Spring?
Unemployment Rate in Clear Spring is 1.3%.