Deale, MD Map & Demographics
Deale Map
Deale Overview
$62,979
PER CAPITA INCOME
$148,661
AVG FAMILY INCOME
$117,253
AVG HOUSEHOLD INCOME
34.9%
WAGE / INCOME GAP [ % ]
65.1¢/ $1
WAGE / INCOME GAP [ $ ]
0.40
INEQUALITY / GINI INDEX
4,706
TOTAL POPULATION
2,219
MALE POPULATION
2,487
FEMALE POPULATION
89.22
MALES / 100 FEMALES
112.08
FEMALES / 100 MALES
49.1
MEDIAN AGE
3.1
AVG FAMILY SIZE
2.5
AVG HOUSEHOLD SIZE
2,472
LABOR FORCE [ PEOPLE ]
64.9%
PERCENT IN LABOR FORCE
7.3%
UNEMPLOYMENT RATE
Deale Zip Codes
Deale Area Codes
Income in Deale
Income Overview in Deale
Per Capita Income in Deale is $62,979, while median incomes of families and households are $148,661 and $117,253 respectively.
| Characteristic | Number | Measure |
| Per Capita Income | 4,706 | $62,979 |
| Median Family Income | 1,267 | $148,661 |
| Mean Family Income | 1,267 | $181,404 |
| Median Household Income | 1,889 | $117,253 |
| Mean Household Income | 1,889 | $152,119 |
| Income Deficit | 1,267 | $0 |
| Wage / Income Gap (%) | 4,706 | 34.93% |
| Wage / Income Gap ($) | 4,706 | 65.07¢ per $1 |
| Gini / Inequality Index | 4,706 | 0.40 |
Earnings by Sex in Deale
Average Earnings in Deale are $71,484, $85,833 for men and $55,855 for women, a difference of 34.9%.
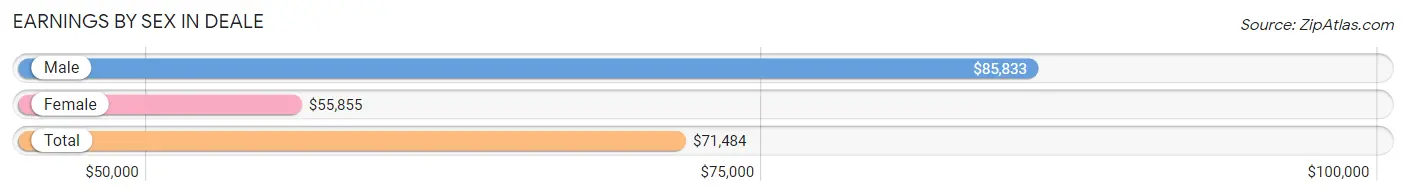
| Sex | Number | Average Earnings |
| Male | 1,290 (47.8%) | $85,833 |
| Female | 1,407 (52.2%) | $55,855 |
| Total | 2,697 (100.0%) | $71,484 |
Earnings by Sex by Income Bracket in Deale
The most common earnings brackets in Deale are $100,000+ for men (575 | 44.6%) and $100,000+ for women (432 | 30.7%).
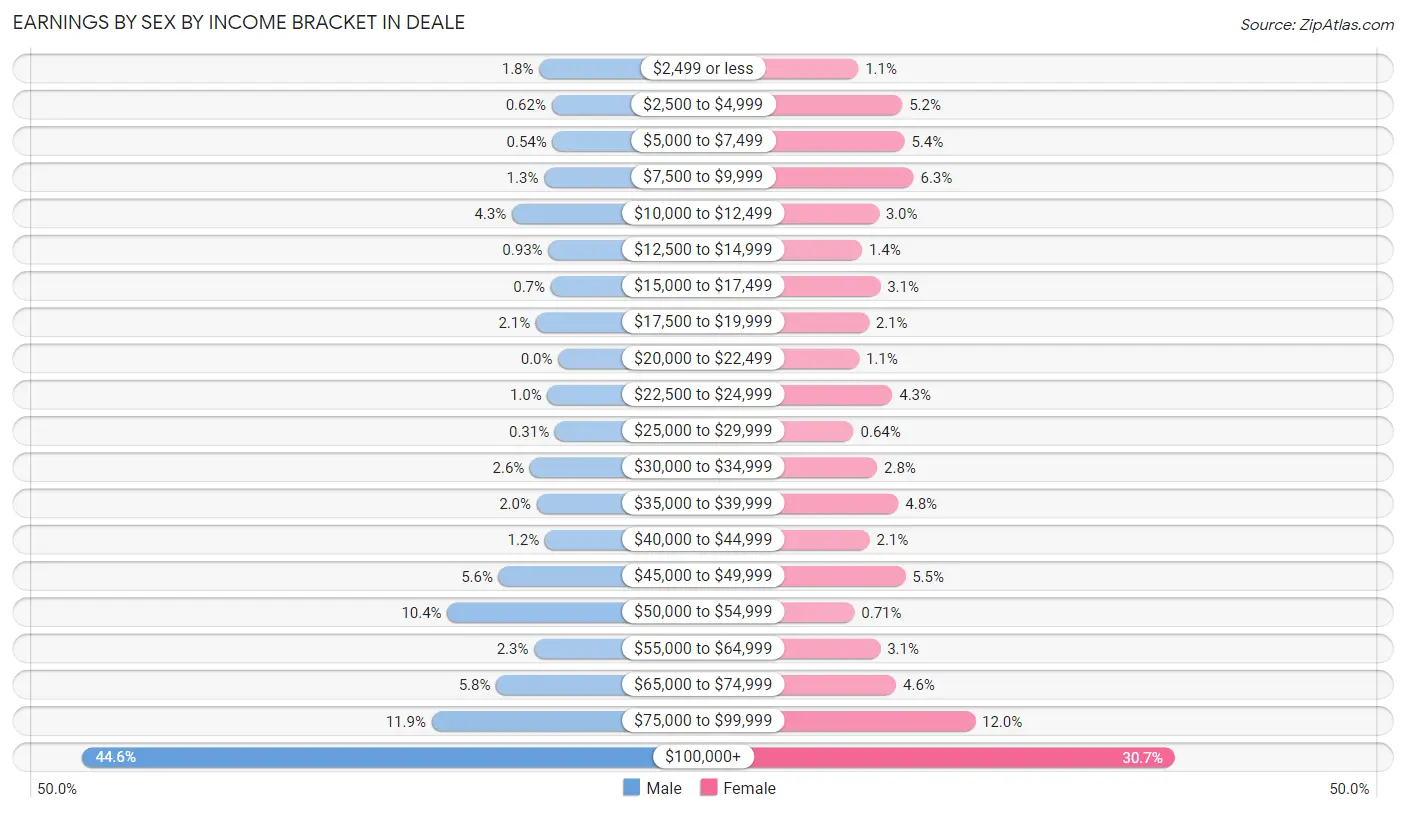
| Income | Male | Female |
| $2,499 or less | 23 (1.8%) | 15 (1.1%) |
| $2,500 to $4,999 | 8 (0.6%) | 73 (5.2%) |
| $5,000 to $7,499 | 7 (0.5%) | 76 (5.4%) |
| $7,500 to $9,999 | 17 (1.3%) | 88 (6.2%) |
| $10,000 to $12,499 | 56 (4.3%) | 42 (3.0%) |
| $12,500 to $14,999 | 12 (0.9%) | 20 (1.4%) |
| $15,000 to $17,499 | 9 (0.7%) | 44 (3.1%) |
| $17,500 to $19,999 | 27 (2.1%) | 29 (2.1%) |
| $20,000 to $22,499 | 0 (0.0%) | 16 (1.1%) |
| $22,500 to $24,999 | 13 (1.0%) | 60 (4.3%) |
| $25,000 to $29,999 | 4 (0.3%) | 9 (0.6%) |
| $30,000 to $34,999 | 34 (2.6%) | 40 (2.8%) |
| $35,000 to $39,999 | 26 (2.0%) | 68 (4.8%) |
| $40,000 to $44,999 | 16 (1.2%) | 30 (2.1%) |
| $45,000 to $49,999 | 72 (5.6%) | 77 (5.5%) |
| $50,000 to $54,999 | 134 (10.4%) | 10 (0.7%) |
| $55,000 to $64,999 | 29 (2.2%) | 44 (3.1%) |
| $65,000 to $74,999 | 75 (5.8%) | 65 (4.6%) |
| $75,000 to $99,999 | 153 (11.9%) | 169 (12.0%) |
| $100,000+ | 575 (44.6%) | 432 (30.7%) |
| Total | 1,290 (100.0%) | 1,407 (100.0%) |
Earnings by Sex by Educational Attainment in Deale
Average earnings in Deale are $91,625 for men and $69,323 for women, a difference of 24.3%. Men with an educational attainment of bachelor's degree enjoy the highest average annual earnings of $109,667, while those with high school diploma education earn the least with $58,906. Women with an educational attainment of high school diploma earn the most with the average annual earnings of $100,574, while those with less than high school education have the smallest earnings of $31,875.
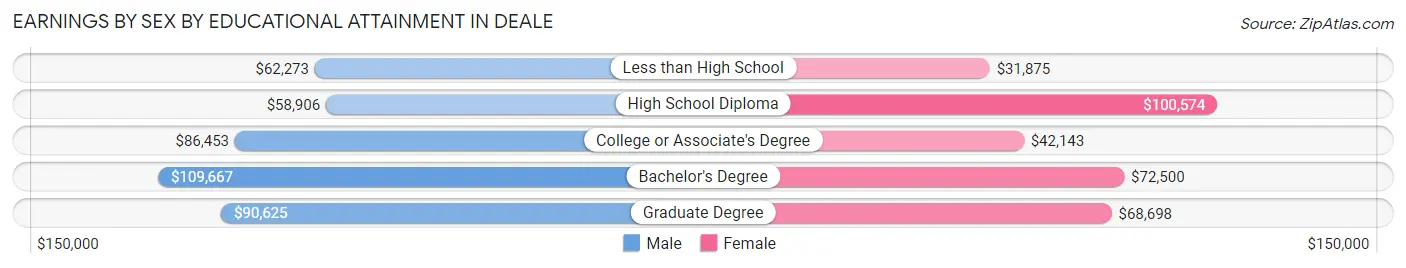
| Educational Attainment | Male Income | Female Income |
| Less than High School | $62,273 | $31,875 |
| High School Diploma | $58,906 | $100,574 |
| College or Associate's Degree | $86,453 | $42,143 |
| Bachelor's Degree | $109,667 | $72,500 |
| Graduate Degree | $90,625 | $68,698 |
| Total | $91,625 | $69,323 |
Family Income in Deale
Family Income Brackets in Deale
According to the Deale family income data, there are 474 families falling into the $200,000+ income range, which is the most common income bracket and makes up 37.4% of all families. Conversely, the less than $10,000 income bracket is the least frequent group with only 8 families (0.6%) belonging to this category.
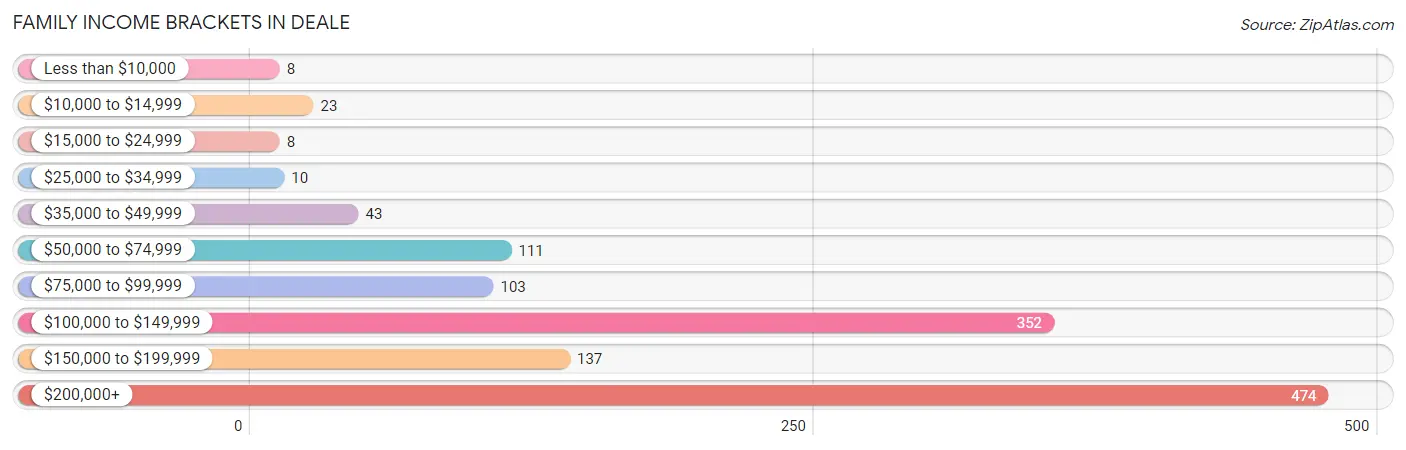
| Income Bracket | # Families | % Families |
| Less than $10,000 | 8 | 0.6% |
| $10,000 to $14,999 | 23 | 1.8% |
| $15,000 to $24,999 | 8 | 0.6% |
| $25,000 to $34,999 | 10 | 0.8% |
| $35,000 to $49,999 | 43 | 3.4% |
| $50,000 to $74,999 | 111 | 8.8% |
| $75,000 to $99,999 | 103 | 8.1% |
| $100,000 to $149,999 | 352 | 27.8% |
| $150,000 to $199,999 | 137 | 10.8% |
| $200,000+ | 474 | 37.4% |
Family Income by Famaliy Size in Deale
5-person families (149 | 11.8%) account for the highest median family income in Deale with $250,001 per family, while 2-person families (539 | 42.5%) have the highest median income of $69,896 per family member.
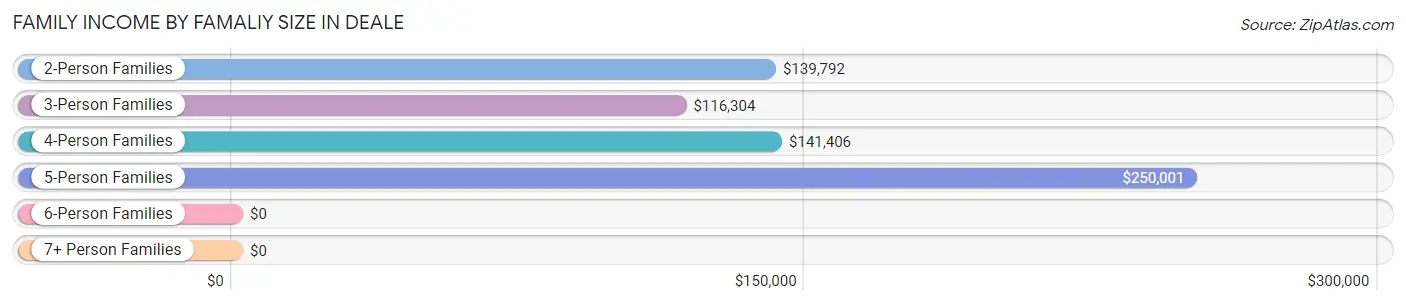
| Income Bracket | # Families | Median Income |
| 2-Person Families | 539 (42.5%) | $139,792 |
| 3-Person Families | 364 (28.7%) | $116,304 |
| 4-Person Families | 198 (15.6%) | $141,406 |
| 5-Person Families | 149 (11.8%) | $250,001 |
| 6-Person Families | 17 (1.3%) | $0 |
| 7+ Person Families | 0 (0.0%) | $0 |
| Total | 1,267 (100.0%) | $148,661 |
Family Income by Number of Earners in Deale
The median family income in Deale is $148,661, with families comprising 3+ earners (235) having the highest median family income of $223,750, while families with no earners (119) have the lowest median family income of $67,969, accounting for 18.5% and 9.4% of families, respectively.
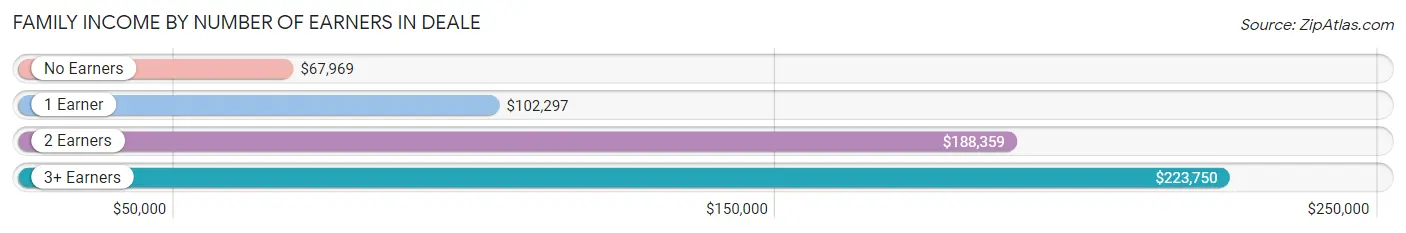
| Number of Earners | # Families | Median Income |
| No Earners | 119 (9.4%) | $67,969 |
| 1 Earner | 336 (26.5%) | $102,297 |
| 2 Earners | 577 (45.5%) | $188,359 |
| 3+ Earners | 235 (18.5%) | $223,750 |
| Total | 1,267 (100.0%) | $148,661 |
Household Income in Deale
Household Income Brackets in Deale
With 502 households falling in the category, the $200,000+ income range is the most frequent in Deale, accounting for 26.6% of all households. In contrast, only 26 households (1.4%) fall into the $25,000 to $34,999 income bracket, making it the least populous group.
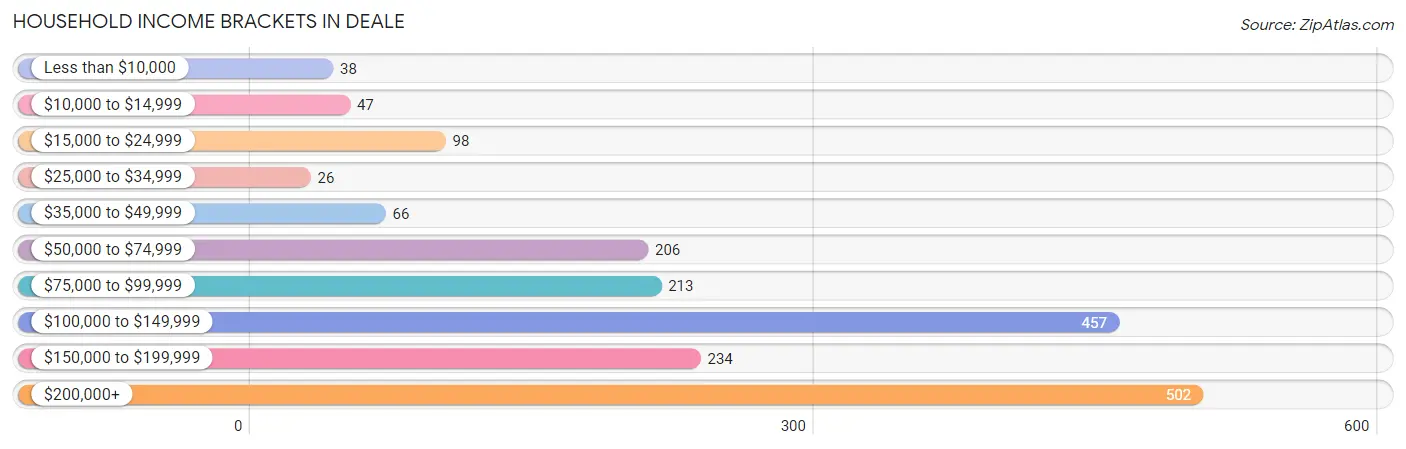
| Income Bracket | # Households | % Households |
| Less than $10,000 | 38 | 2.0% |
| $10,000 to $14,999 | 47 | 2.5% |
| $15,000 to $24,999 | 98 | 5.2% |
| $25,000 to $34,999 | 26 | 1.4% |
| $35,000 to $49,999 | 66 | 3.5% |
| $50,000 to $74,999 | 206 | 10.9% |
| $75,000 to $99,999 | 213 | 11.3% |
| $100,000 to $149,999 | 457 | 24.2% |
| $150,000 to $199,999 | 234 | 12.4% |
| $200,000+ | 502 | 26.6% |
Household Income by Householder Age in Deale
The median household income in Deale is $117,253, with the highest median household income of $165,583 found in the 45 to 64 years age bracket for the primary householder. A total of 845 households (44.7%) fall into this category. Meanwhile, the 15 to 24 years age bracket for the primary householder has the lowest median household income of $0, with 23 households (1.2%) in this group.
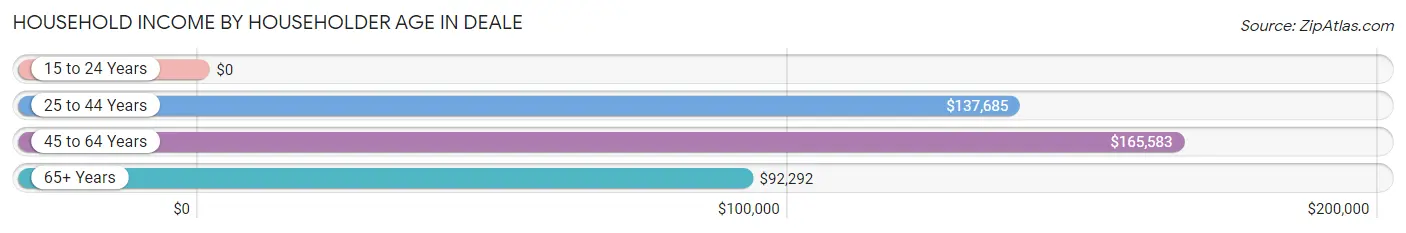
| Income Bracket | # Households | Median Income |
| 15 to 24 Years | 23 (1.2%) | $0 |
| 25 to 44 Years | 370 (19.6%) | $137,685 |
| 45 to 64 Years | 845 (44.7%) | $165,583 |
| 65+ Years | 651 (34.5%) | $92,292 |
| Total | 1,889 (100.0%) | $117,253 |
Poverty in Deale
Income Below Poverty by Sex and Age in Deale
With 1.4% poverty level for males and 5.1% for females among the residents of Deale, 75 year old and over males and under 5 year old females are the most vulnerable to poverty, with 7 males (6.6%) and 46 females (25.1%) in their respective age groups living below the poverty level.
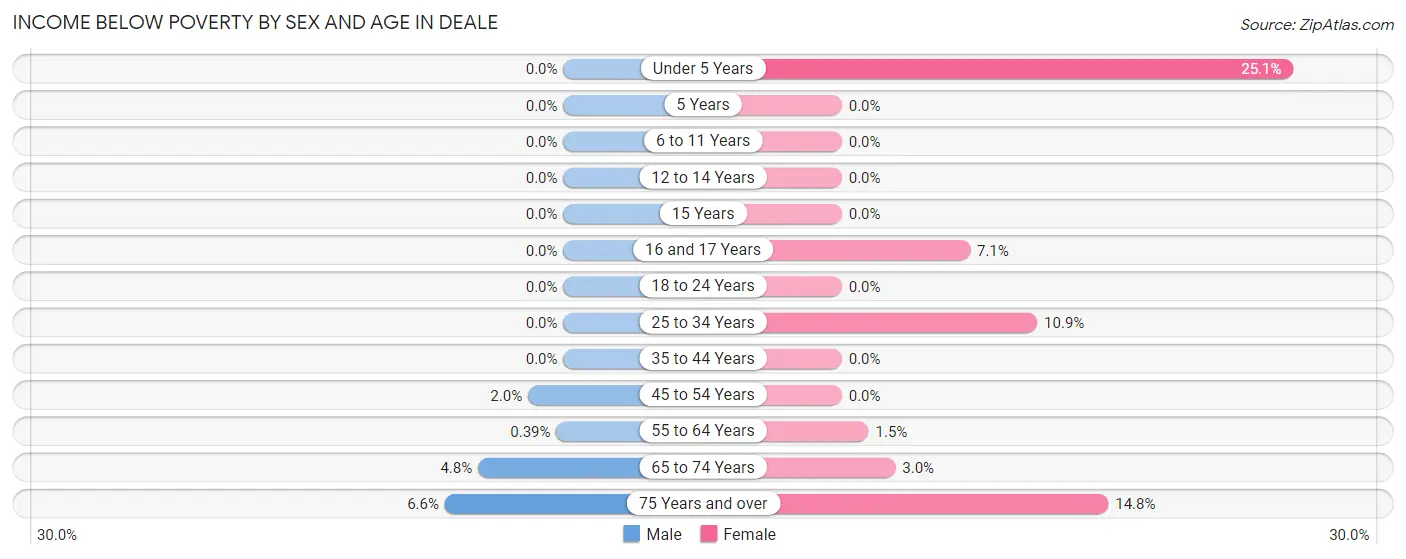
| Age Bracket | Male | Female |
| Under 5 Years | 0 (0.0%) | 46 (25.1%) |
| 5 Years | 0 (0.0%) | 0 (0.0%) |
| 6 to 11 Years | 0 (0.0%) | 0 (0.0%) |
| 12 to 14 Years | 0 (0.0%) | 0 (0.0%) |
| 15 Years | 0 (0.0%) | 0 (0.0%) |
| 16 and 17 Years | 0 (0.0%) | 6 (7.1%) |
| 18 to 24 Years | 0 (0.0%) | 0 (0.0%) |
| 25 to 34 Years | 0 (0.0%) | 36 (10.9%) |
| 35 to 44 Years | 0 (0.0%) | 0 (0.0%) |
| 45 to 54 Years | 5 (2.0%) | 0 (0.0%) |
| 55 to 64 Years | 2 (0.4%) | 9 (1.5%) |
| 65 to 74 Years | 17 (4.8%) | 10 (3.0%) |
| 75 Years and over | 7 (6.6%) | 19 (14.8%) |
| Total | 31 (1.4%) | 126 (5.1%) |
Income Above Poverty by Sex and Age in Deale
According to the poverty statistics in Deale, males aged under 5 years and females aged 5 years are the age groups that are most secure financially, with 100.0% of males and 100.0% of females in these age groups living above the poverty line.
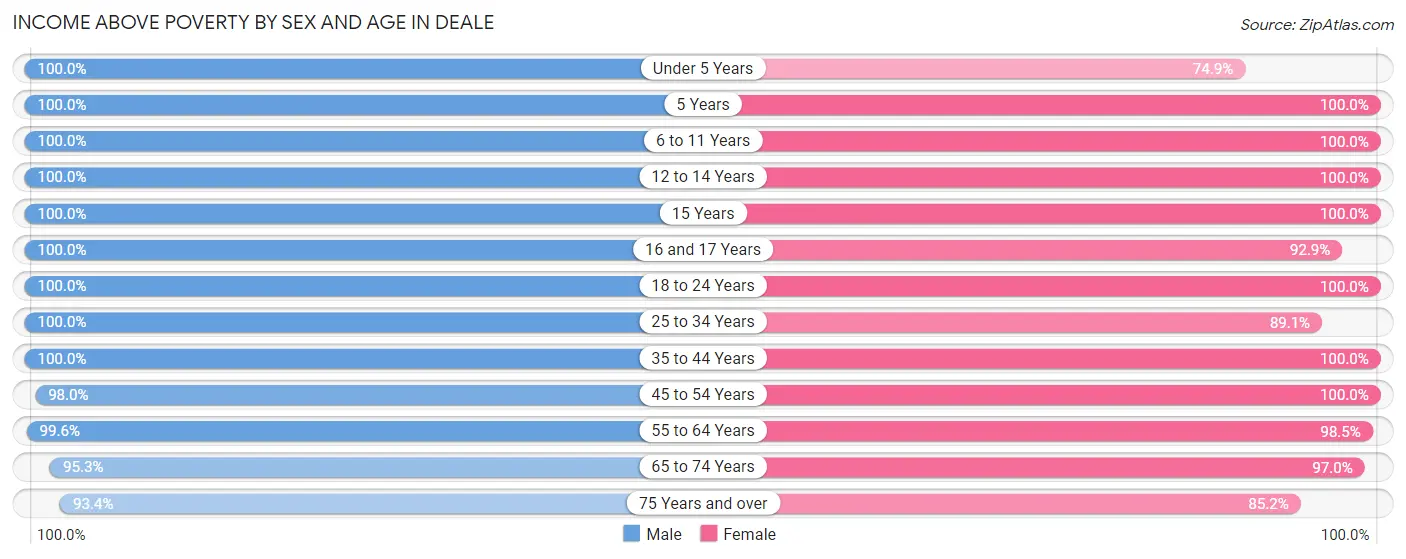
| Age Bracket | Male | Female |
| Under 5 Years | 53 (100.0%) | 137 (74.9%) |
| 5 Years | 29 (100.0%) | 14 (100.0%) |
| 6 to 11 Years | 169 (100.0%) | 224 (100.0%) |
| 12 to 14 Years | 95 (100.0%) | 75 (100.0%) |
| 15 Years | 34 (100.0%) | 21 (100.0%) |
| 16 and 17 Years | 8 (100.0%) | 78 (92.9%) |
| 18 to 24 Years | 122 (100.0%) | 96 (100.0%) |
| 25 to 34 Years | 323 (100.0%) | 295 (89.1%) |
| 35 to 44 Years | 160 (100.0%) | 182 (100.0%) |
| 45 to 54 Years | 249 (98.0%) | 209 (100.0%) |
| 55 to 64 Years | 506 (99.6%) | 595 (98.5%) |
| 65 to 74 Years | 341 (95.3%) | 326 (97.0%) |
| 75 Years and over | 99 (93.4%) | 109 (85.2%) |
| Total | 2,188 (98.6%) | 2,361 (94.9%) |
Income Below Poverty Among Married-Couple Families in Deale
The poverty statistics for married-couple families in Deale show that 0.7% or 7 of the total 1,055 families live below the poverty line. Families with no children have the highest poverty rate of 1.1%, comprising of 7 families. On the other hand, families with 1 or 2 children have the lowest poverty rate of 0.0%, which includes 0 families.
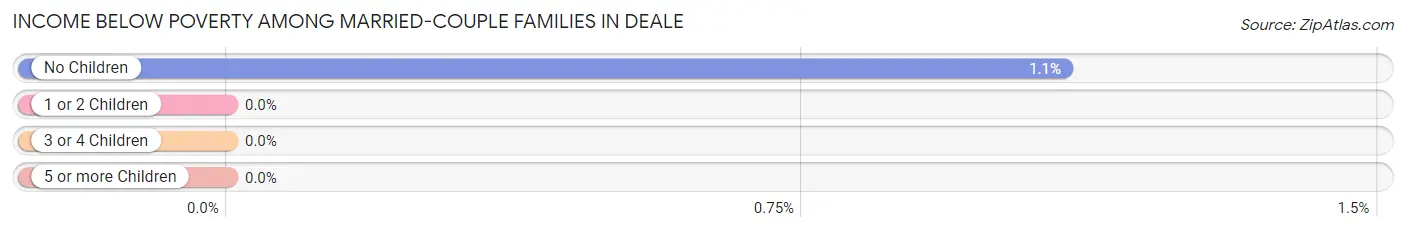
| Children | Above Poverty | Below Poverty |
| No Children | 637 (98.9%) | 7 (1.1%) |
| 1 or 2 Children | 339 (100.0%) | 0 (0.0%) |
| 3 or 4 Children | 72 (100.0%) | 0 (0.0%) |
| 5 or more Children | 0 (0.0%) | 0 (0.0%) |
| Total | 1,048 (99.3%) | 7 (0.7%) |
Income Below Poverty Among Single-Parent Households in Deale
| Children | Single Father | Single Mother |
| No Children | 0 (0.0%) | 0 (0.0%) |
| 1 or 2 Children | 0 (0.0%) | 23 (21.3%) |
| 3 or 4 Children | 0 (0.0%) | 0 (0.0%) |
| 5 or more Children | 0 (0.0%) | 0 (0.0%) |
| Total | 0 (0.0%) | 23 (14.6%) |
Income Below Poverty Among Married-Couple vs Single-Parent Households in Deale
The poverty data for Deale shows that 7 of the married-couple family households (0.7%) and 23 of the single-parent households (10.8%) are living below the poverty level. Within the married-couple family households, those with no children have the highest poverty rate, with 7 households (1.1%) falling below the poverty line. Among the single-parent households, those with 1 or 2 children have the highest poverty rate, with 23 household (21.3%) living below poverty.
| Children | Married-Couple Families | Single-Parent Households |
| No Children | 7 (1.1%) | 0 (0.0%) |
| 1 or 2 Children | 0 (0.0%) | 23 (21.3%) |
| 3 or 4 Children | 0 (0.0%) | 0 (0.0%) |
| 5 or more Children | 0 (0.0%) | 0 (0.0%) |
| Total | 7 (0.7%) | 23 (10.8%) |
Race in Deale
The most populous races in Deale are White / Caucasian (4,048 | 86.0%), Two or more Races (386 | 8.2%), and Black / African American (213 | 4.5%).
| Race | # Population | % Population |
| Asian | 50 | 1.1% |
| Black / African American | 213 | 4.5% |
| Hawaiian / Pacific | 0 | 0.0% |
| Hispanic or Latino | 185 | 3.9% |
| Native / Alaskan | 5 | 0.1% |
| White / Caucasian | 4,048 | 86.0% |
| Two or more Races | 386 | 8.2% |
| Some other Race | 4 | 0.1% |
| Total | 4,706 | 100.0% |
Ancestry in Deale
The most populous ancestries reported in Deale are German (720 | 15.3%), Irish (614 | 13.1%), English (611 | 13.0%), American (603 | 12.8%), and Italian (341 | 7.2%), together accounting for 61.4% of all Deale residents.
| Ancestry | # Population | % Population |
| American | 603 | 12.8% |
| Austrian | 28 | 0.6% |
| Belgian | 9 | 0.2% |
| Bhutanese | 16 | 0.3% |
| Brazilian | 9 | 0.2% |
| British | 27 | 0.6% |
| Burmese | 8 | 0.2% |
| Canadian | 11 | 0.2% |
| Central American | 4 | 0.1% |
| Cherokee | 44 | 0.9% |
| Colombian | 32 | 0.7% |
| Croatian | 12 | 0.3% |
| Cuban | 36 | 0.8% |
| Czechoslovakian | 32 | 0.7% |
| Danish | 49 | 1.0% |
| Dutch | 45 | 1.0% |
| Eastern European | 13 | 0.3% |
| English | 611 | 13.0% |
| European | 40 | 0.9% |
| French | 32 | 0.7% |
| French Canadian | 17 | 0.4% |
| German | 720 | 15.3% |
| Greek | 16 | 0.3% |
| Hungarian | 57 | 1.2% |
| Indian (Asian) | 35 | 0.7% |
| Irish | 614 | 13.1% |
| Italian | 341 | 7.2% |
| Mexican | 53 | 1.1% |
| Norwegian | 15 | 0.3% |
| Panamanian | 4 | 0.1% |
| Polish | 63 | 1.3% |
| Potawatomi | 5 | 0.1% |
| Puerto Rican | 48 | 1.0% |
| Russian | 5 | 0.1% |
| Scandinavian | 8 | 0.2% |
| Scotch-Irish | 56 | 1.2% |
| Scottish | 144 | 3.1% |
| South American | 32 | 0.7% |
| Spanish | 12 | 0.3% |
| Swedish | 35 | 0.7% |
| Swiss | 23 | 0.5% |
| Welsh | 79 | 1.7% | View All 42 Rows |
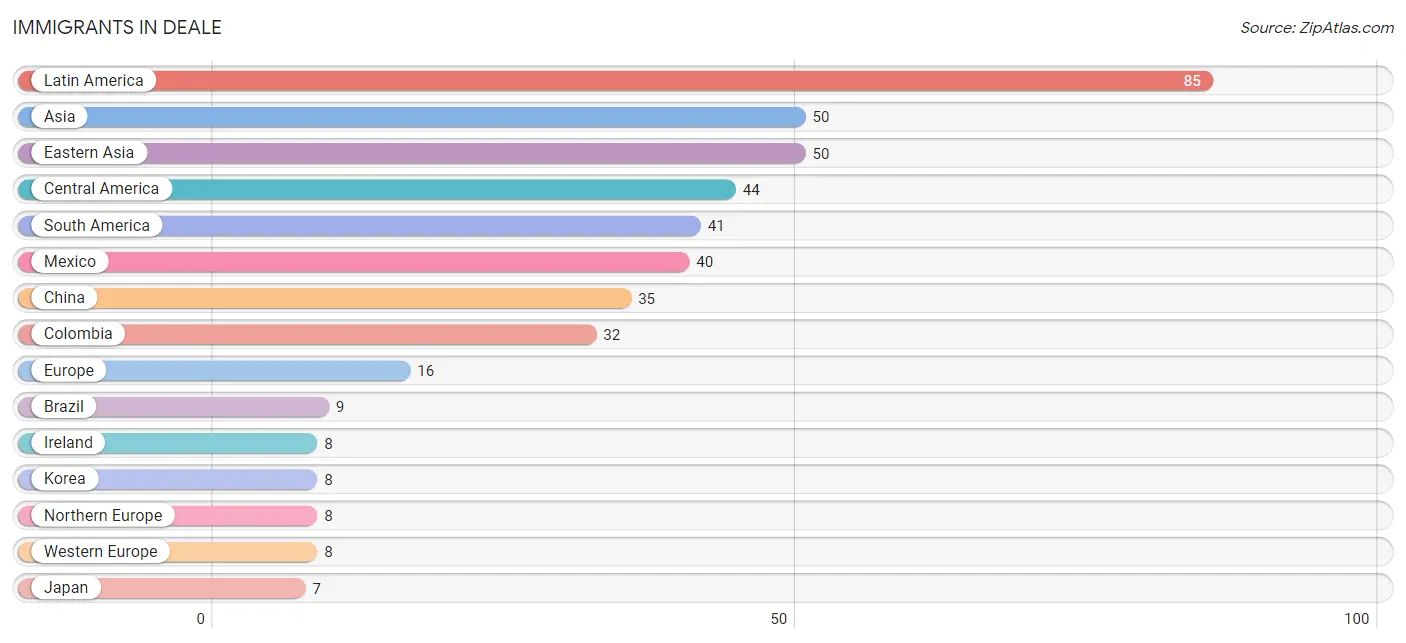
Immigrants in Deale
The most numerous immigrant groups reported in Deale came from Latin America (85 | 1.8%), Asia (50 | 1.1%), Eastern Asia (50 | 1.1%), Central America (44 | 0.9%), and South America (41 | 0.9%), together accounting for 5.7% of all Deale residents.
| Immigration Origin | # Population | % Population |
| Asia | 50 | 1.1% |
| Brazil | 9 | 0.2% |
| Central America | 44 | 0.9% |
| China | 35 | 0.7% |
| Colombia | 32 | 0.7% |
| Eastern Asia | 50 | 1.1% |
| Europe | 16 | 0.3% |
| Germany | 5 | 0.1% |
| Ireland | 8 | 0.2% |
| Japan | 7 | 0.2% |
| Korea | 8 | 0.2% |
| Latin America | 85 | 1.8% |
| Mexico | 40 | 0.9% |
| Northern Europe | 8 | 0.2% |
| Panama | 4 | 0.1% |
| South America | 41 | 0.9% |
| Switzerland | 3 | 0.1% |
| Western Europe | 8 | 0.2% | View All 18 Rows |
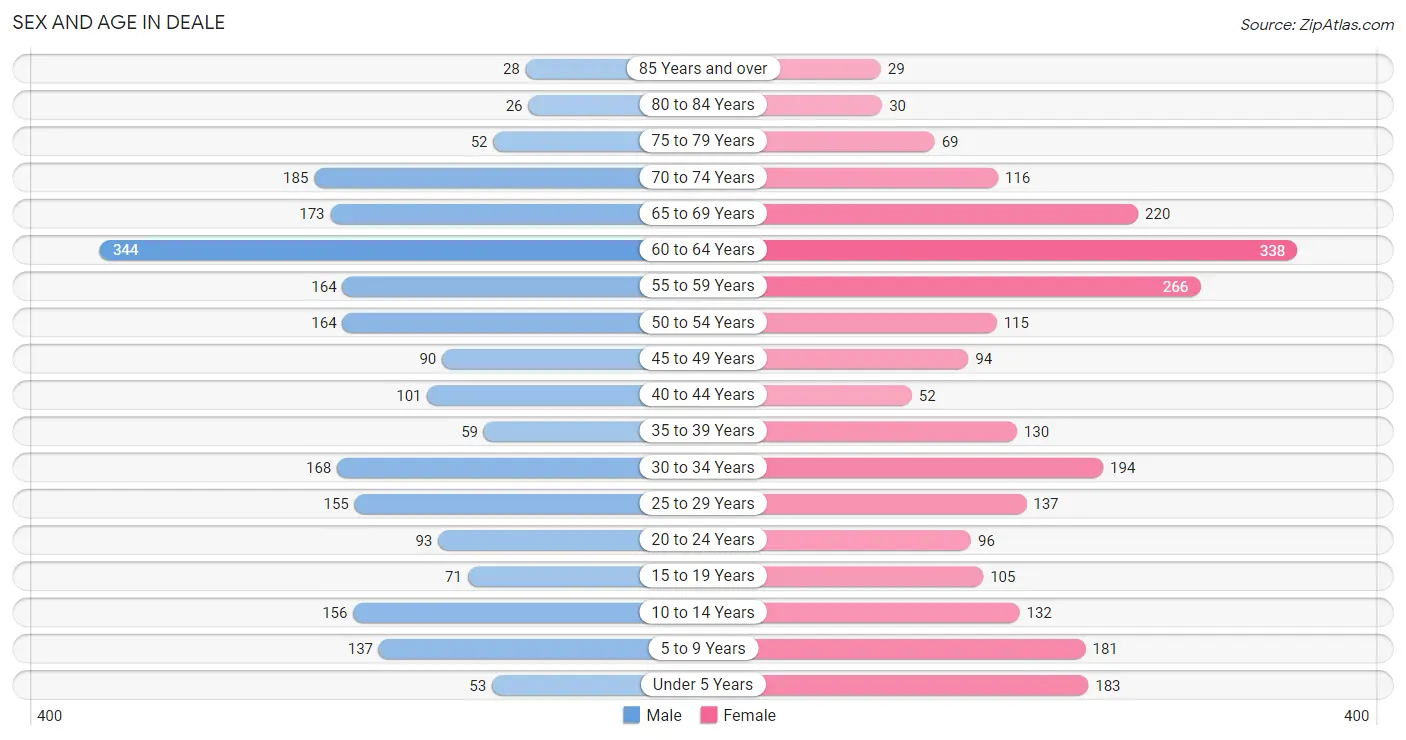
Sex and Age in Deale
Sex and Age in Deale
The most populous age groups in Deale are 60 to 64 Years (344 | 15.5%) for men and 60 to 64 Years (338 | 13.6%) for women.
| Age Bracket | Male | Female |
| Under 5 Years | 53 (2.4%) | 183 (7.4%) |
| 5 to 9 Years | 137 (6.2%) | 181 (7.3%) |
| 10 to 14 Years | 156 (7.0%) | 132 (5.3%) |
| 15 to 19 Years | 71 (3.2%) | 105 (4.2%) |
| 20 to 24 Years | 93 (4.2%) | 96 (3.9%) |
| 25 to 29 Years | 155 (7.0%) | 137 (5.5%) |
| 30 to 34 Years | 168 (7.6%) | 194 (7.8%) |
| 35 to 39 Years | 59 (2.7%) | 130 (5.2%) |
| 40 to 44 Years | 101 (4.5%) | 52 (2.1%) |
| 45 to 49 Years | 90 (4.1%) | 94 (3.8%) |
| 50 to 54 Years | 164 (7.4%) | 115 (4.6%) |
| 55 to 59 Years | 164 (7.4%) | 266 (10.7%) |
| 60 to 64 Years | 344 (15.5%) | 338 (13.6%) |
| 65 to 69 Years | 173 (7.8%) | 220 (8.8%) |
| 70 to 74 Years | 185 (8.3%) | 116 (4.7%) |
| 75 to 79 Years | 52 (2.3%) | 69 (2.8%) |
| 80 to 84 Years | 26 (1.2%) | 30 (1.2%) |
| 85 Years and over | 28 (1.3%) | 29 (1.2%) |
| Total | 2,219 (100.0%) | 2,487 (100.0%) |
Families and Households in Deale
Median Family Size in Deale
The median family size in Deale is 3.12 persons per family, with single female/mother families (158 | 12.5%) accounting for the largest median family size of 3.46 persons per family. On the other hand, single male/father families (54 | 4.3%) represent the smallest median family size with 2.00 persons per family.
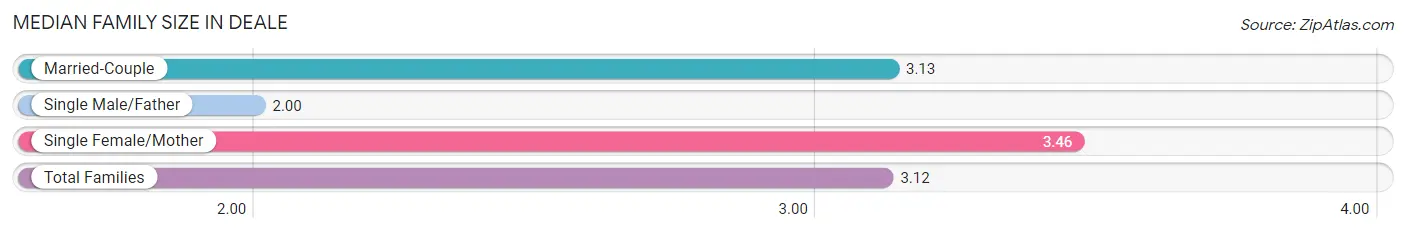
| Family Type | # Families | Family Size |
| Married-Couple | 1,055 (83.3%) | 3.13 |
| Single Male/Father | 54 (4.3%) | 2.00 |
| Single Female/Mother | 158 (12.5%) | 3.46 |
| Total Families | 1,267 (100.0%) | 3.12 |
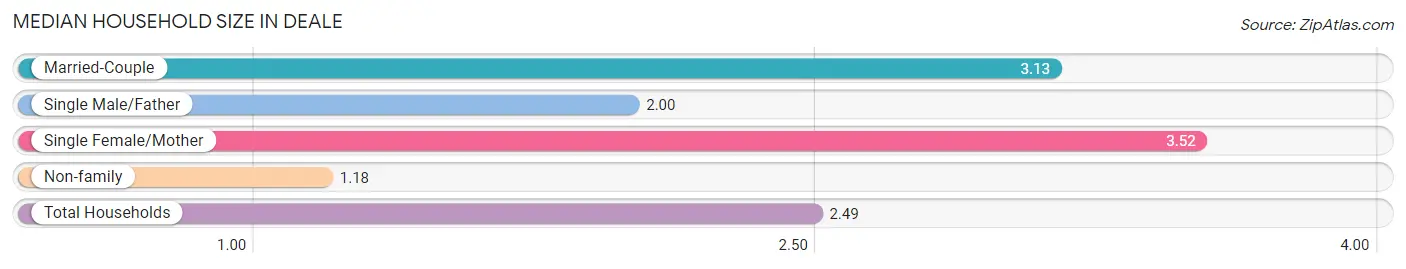
Median Household Size in Deale
The median household size in Deale is 2.49 persons per household, with single female/mother households (158 | 8.4%) accounting for the largest median household size of 3.52 persons per household. non-family households (622 | 32.9%) represent the smallest median household size with 1.18 persons per household.
| Household Type | # Households | Household Size |
| Married-Couple | 1,055 (55.8%) | 3.13 |
| Single Male/Father | 54 (2.9%) | 2.00 |
| Single Female/Mother | 158 (8.4%) | 3.52 |
| Non-family | 622 (32.9%) | 1.18 |
| Total Households | 1,889 (100.0%) | 2.49 |
Household Size by Marriage Status in Deale
Out of a total of 1,889 households in Deale, 1,267 (67.1%) are family households, while 622 (32.9%) are nonfamily households. The most numerous type of family households are 2-person households, comprising 539, and the most common type of nonfamily households are 1-person households, comprising 507.
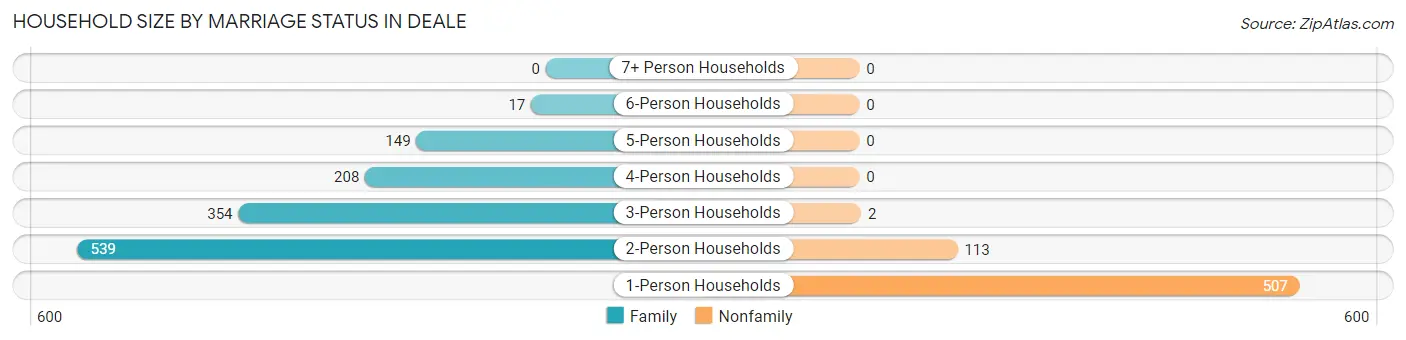
| Household Size | Family Households | Nonfamily Households |
| 1-Person Households | - | 507 (26.8%) |
| 2-Person Households | 539 (28.5%) | 113 (6.0%) |
| 3-Person Households | 354 (18.7%) | 2 (0.1%) |
| 4-Person Households | 208 (11.0%) | 0 (0.0%) |
| 5-Person Households | 149 (7.9%) | 0 (0.0%) |
| 6-Person Households | 17 (0.9%) | 0 (0.0%) |
| 7+ Person Households | 0 (0.0%) | 0 (0.0%) |
| Total | 1,267 (67.1%) | 622 (32.9%) |
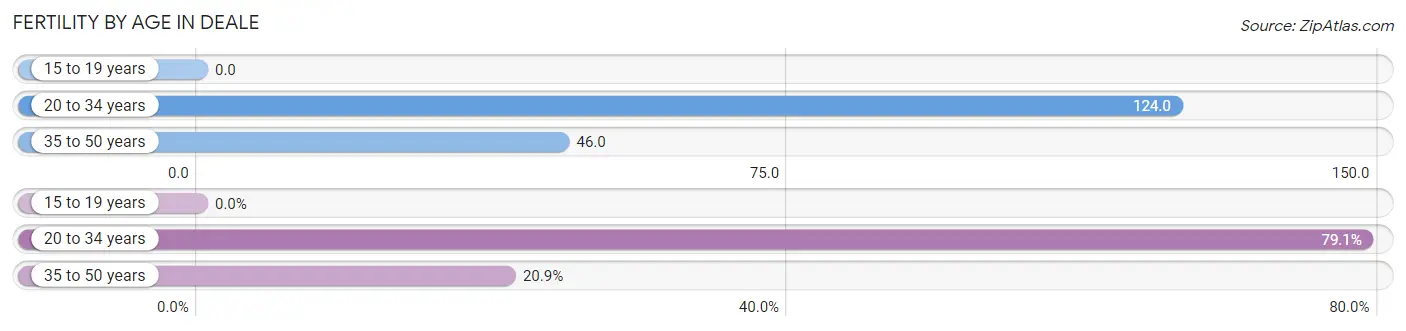
Female Fertility in Deale
Fertility by Age in Deale
Average fertility rate in Deale is 80.0 births per 1,000 women. Women in the age bracket of 20 to 34 years have the highest fertility rate with 124.0 births per 1,000 women. Women in the age bracket of 20 to 34 years acount for 79.1% of all women with births.
| Age Bracket | Women with Births | Births / 1,000 Women |
| 15 to 19 years | 0 (0.0%) | 0.0 |
| 20 to 34 years | 53 (79.1%) | 124.0 |
| 35 to 50 years | 14 (20.9%) | 46.0 |
| Total | 67 (100.0%) | 80.0 |
Fertility by Age by Marriage Status in Deale
68.7% of women with births (67) in Deale are married. The highest percentage of unmarried women with births falls into 20 to 34 years age bracket with 39.6% of them unmarried at the time of birth, while the lowest percentage of unmarried women with births belong to 35 to 50 years age bracket with 0.0% of them unmarried.
| Age Bracket | Married | Unmarried |
| 15 to 19 years | 0 (0.0%) | 0 (0.0%) |
| 20 to 34 years | 32 (60.4%) | 21 (39.6%) |
| 35 to 50 years | 14 (100.0%) | 0 (0.0%) |
| Total | 46 (68.7%) | 21 (31.3%) |
Fertility by Education in Deale
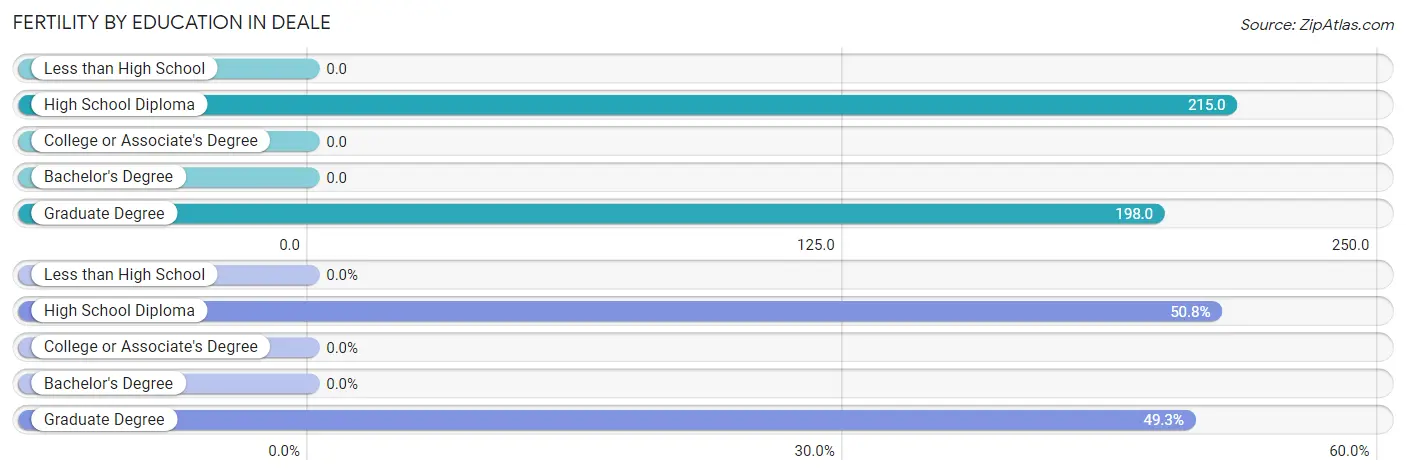
| Educational Attainment | Women with Births | Births / 1,000 Women |
| Less than High School | 0 (0.0%) | 0.0 |
| High School Diploma | 34 (50.7%) | 215.0 |
| College or Associate's Degree | 0 (0.0%) | 0.0 |
| Bachelor's Degree | 0 (0.0%) | 0.0 |
| Graduate Degree | 33 (49.2%) | 198.0 |
| Total | 67 (100.0%) | 80.0 |
Fertility by Education by Marriage Status in Deale
31.3% of women with births in Deale are unmarried. Women with the educational attainment of graduate degree are most likely to be married with 100.0% of them married at childbirth, while women with the educational attainment of high school diploma are least likely to be married with 61.8% of them unmarried at childbirth.
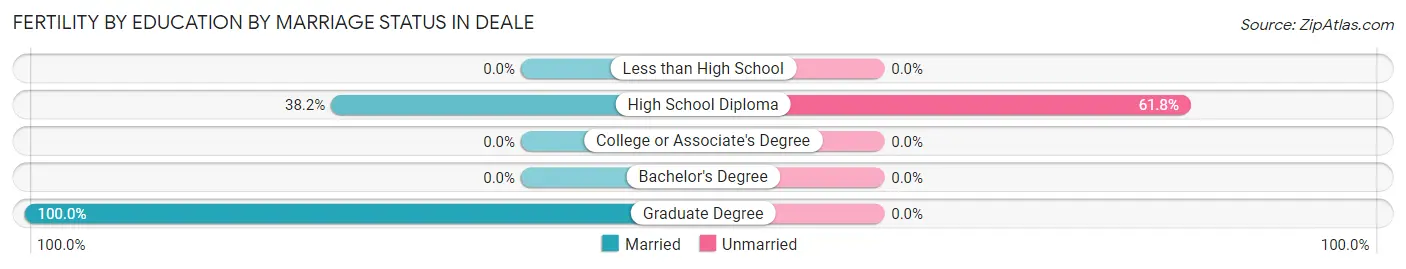
| Educational Attainment | Married | Unmarried |
| Less than High School | 0 (0.0%) | 0 (0.0%) |
| High School Diploma | 13 (38.2%) | 21 (61.8%) |
| College or Associate's Degree | 0 (0.0%) | 0 (0.0%) |
| Bachelor's Degree | 0 (0.0%) | 0 (0.0%) |
| Graduate Degree | 33 (100.0%) | 0 (0.0%) |
| Total | 46 (68.7%) | 21 (31.3%) |
Employment Characteristics in Deale
Employment by Class of Employer in Deale
Among the 2,283 employed individuals in Deale, private company employees (1,084 | 47.5%), not-for-profit organizations (356 | 15.6%), and federal government employees (354 | 15.5%) make up the most common classes of employment.
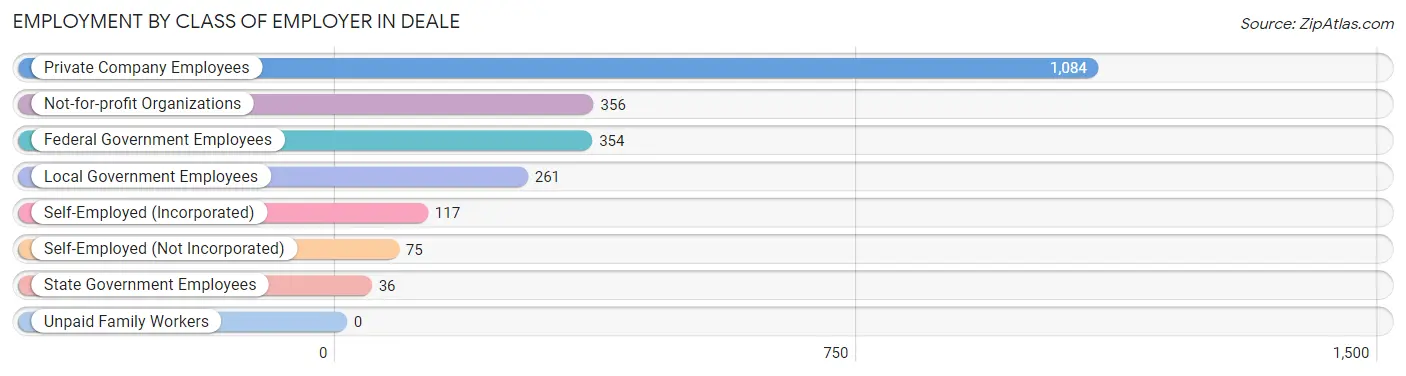
| Employer Class | # Employees | % Employees |
| Private Company Employees | 1,084 | 47.5% |
| Self-Employed (Incorporated) | 117 | 5.1% |
| Self-Employed (Not Incorporated) | 75 | 3.3% |
| Not-for-profit Organizations | 356 | 15.6% |
| Local Government Employees | 261 | 11.4% |
| State Government Employees | 36 | 1.6% |
| Federal Government Employees | 354 | 15.5% |
| Unpaid Family Workers | 0 | 0.0% |
| Total | 2,283 | 100.0% |
Employment Status by Age in Deale
According to the labor force statistics for Deale, out of the total population over 16 years of age (3,809), 64.9% or 2,472 individuals are in the labor force, with 7.3% or 180 of them unemployed. The age group with the highest labor force participation rate is 45 to 54 years, with 92.0% or 426 individuals in the labor force. Within the labor force, the 30 to 34 years age range has the highest percentage of unemployed individuals, with 29.8% or 97 of them being unemployed.
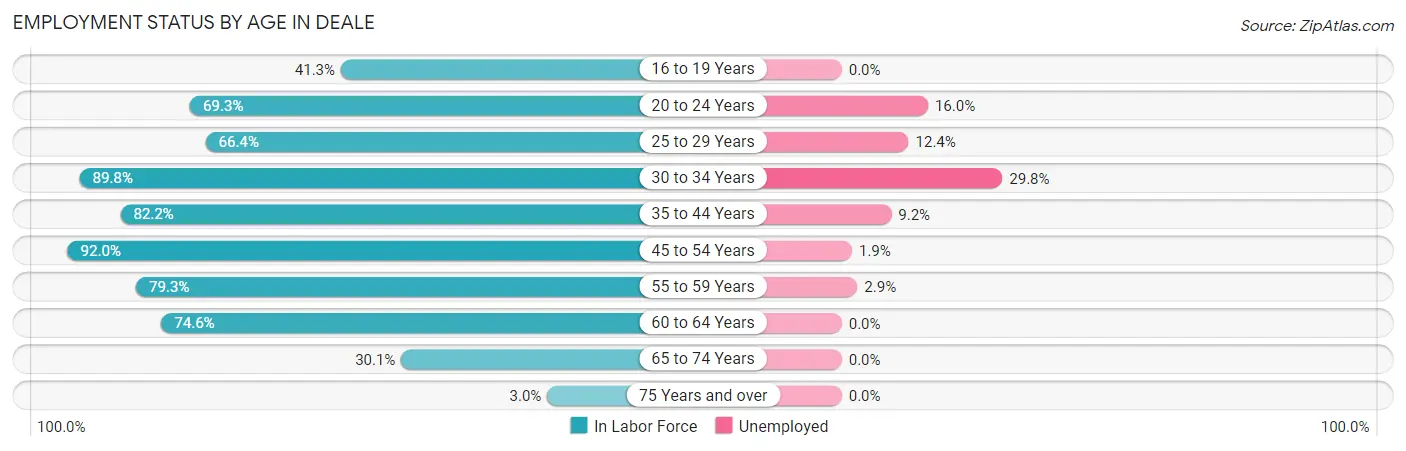
| Age Bracket | In Labor Force | Unemployed |
| 16 to 19 Years | 50 (41.3%) | 0 (0.0%) |
| 20 to 24 Years | 131 (69.3%) | 21 (16.0%) |
| 25 to 29 Years | 194 (66.4%) | 24 (12.4%) |
| 30 to 34 Years | 325 (89.8%) | 97 (29.8%) |
| 35 to 44 Years | 281 (82.2%) | 26 (9.2%) |
| 45 to 54 Years | 426 (92.0%) | 8 (1.9%) |
| 55 to 59 Years | 341 (79.3%) | 10 (2.9%) |
| 60 to 64 Years | 509 (74.6%) | 0 (0.0%) |
| 65 to 74 Years | 209 (30.1%) | 0 (0.0%) |
| 75 Years and over | 7 (3.0%) | 0 (0.0%) |
| Total | 2,472 (64.9%) | 180 (7.3%) |
Employment Status by Educational Attainment in Deale
According to labor force statistics for Deale, 80.7% of individuals (2,075) out of the total population between 25 and 64 years of age (2,571) are in the labor force, with 7.7% or 160 of them being unemployed. The group with the highest labor force participation rate are those with the educational attainment of less than high school, with 100.0% or 68 individuals in the labor force. Within the labor force, individuals with college / associate degree education have the highest percentage of unemployment, with 11.0% or 52 of them being unemployed.
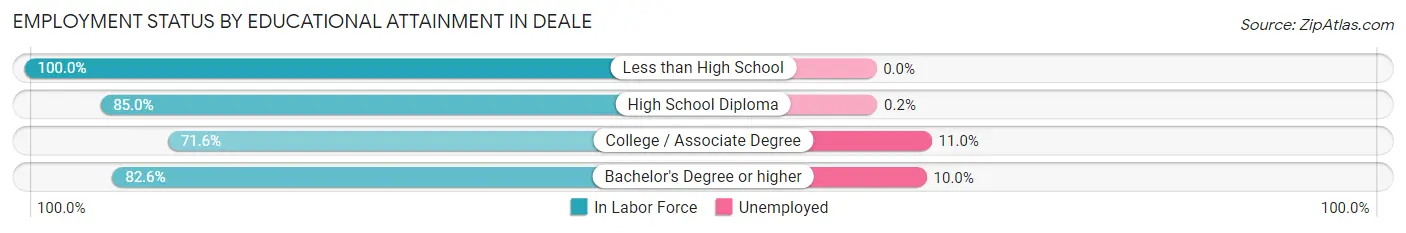
| Educational Attainment | In Labor Force | Unemployed |
| Less than High School | 68 (100.0%) | 0 (0.0%) |
| High School Diploma | 460 (85.0%) | 1 (0.2%) |
| College / Associate Degree | 469 (71.6%) | 72 (11.0%) |
| Bachelor's Degree or higher | 1,080 (82.6%) | 131 (10.0%) |
| Total | 2,075 (80.7%) | 198 (7.7%) |
Employment Occupations by Sex in Deale
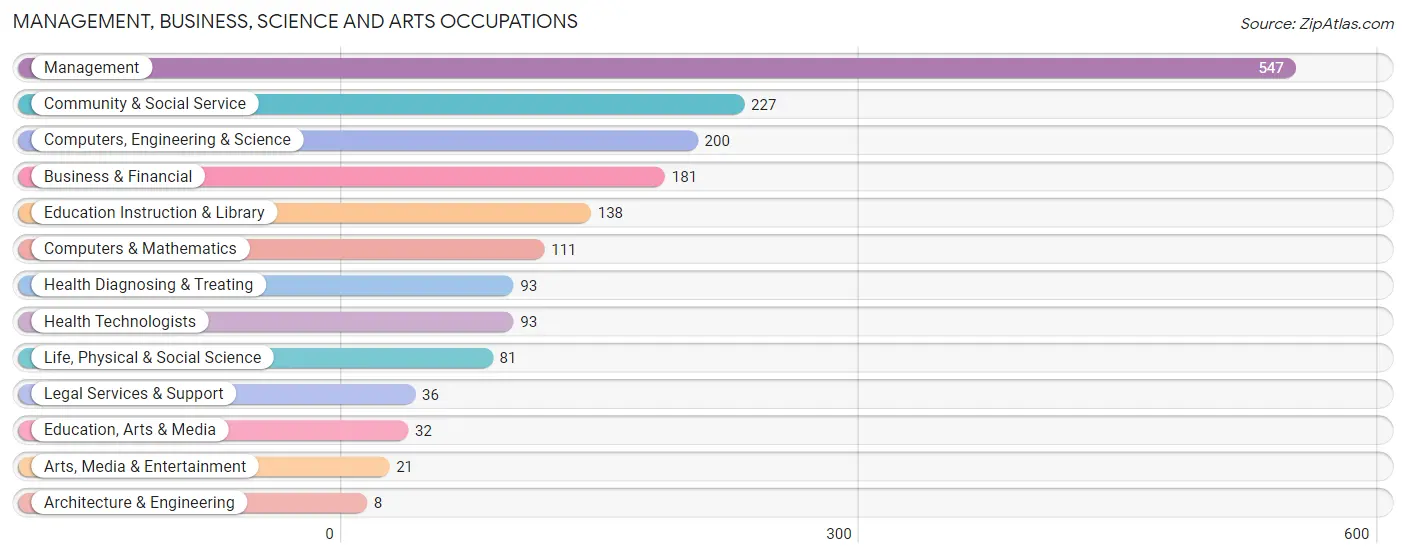
Management, Business, Science and Arts Occupations
The most common Management, Business, Science and Arts occupations in Deale are Management (547 | 24.4%), Community & Social Service (227 | 10.1%), Computers, Engineering & Science (200 | 8.9%), Business & Financial (181 | 8.1%), and Education Instruction & Library (138 | 6.1%).
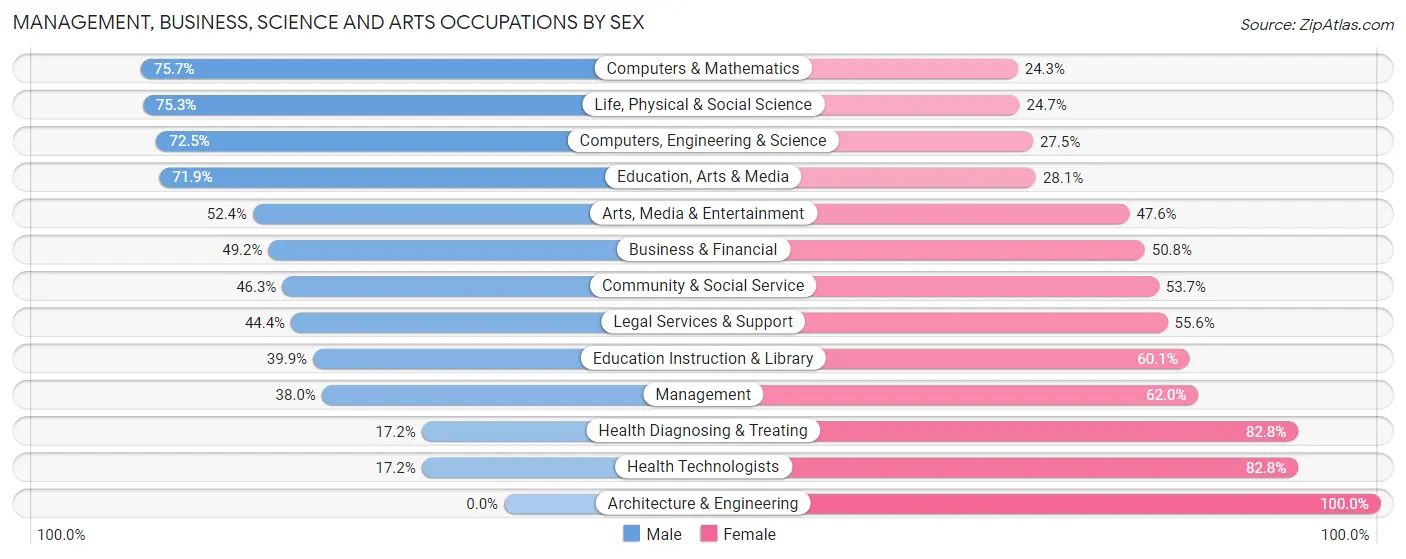
Management, Business, Science and Arts Occupations by Sex
Within the Management, Business, Science and Arts occupations in Deale, the most male-oriented occupations are Computers & Mathematics (75.7%), Life, Physical & Social Science (75.3%), and Computers, Engineering & Science (72.5%), while the most female-oriented occupations are Architecture & Engineering (100.0%), Health Diagnosing & Treating (82.8%), and Health Technologists (82.8%).
| Occupation | Male | Female |
| Management | 208 (38.0%) | 339 (62.0%) |
| Business & Financial | 89 (49.2%) | 92 (50.8%) |
| Computers, Engineering & Science | 145 (72.5%) | 55 (27.5%) |
| Computers & Mathematics | 84 (75.7%) | 27 (24.3%) |
| Architecture & Engineering | 0 (0.0%) | 8 (100.0%) |
| Life, Physical & Social Science | 61 (75.3%) | 20 (24.7%) |
| Community & Social Service | 105 (46.3%) | 122 (53.7%) |
| Education, Arts & Media | 23 (71.9%) | 9 (28.1%) |
| Legal Services & Support | 16 (44.4%) | 20 (55.6%) |
| Education Instruction & Library | 55 (39.9%) | 83 (60.1%) |
| Arts, Media & Entertainment | 11 (52.4%) | 10 (47.6%) |
| Health Diagnosing & Treating | 16 (17.2%) | 77 (82.8%) |
| Health Technologists | 16 (17.2%) | 77 (82.8%) |
| Total (Category) | 563 (45.1%) | 685 (54.9%) |
| Total (Overall) | 1,117 (49.8%) | 1,128 (50.2%) |
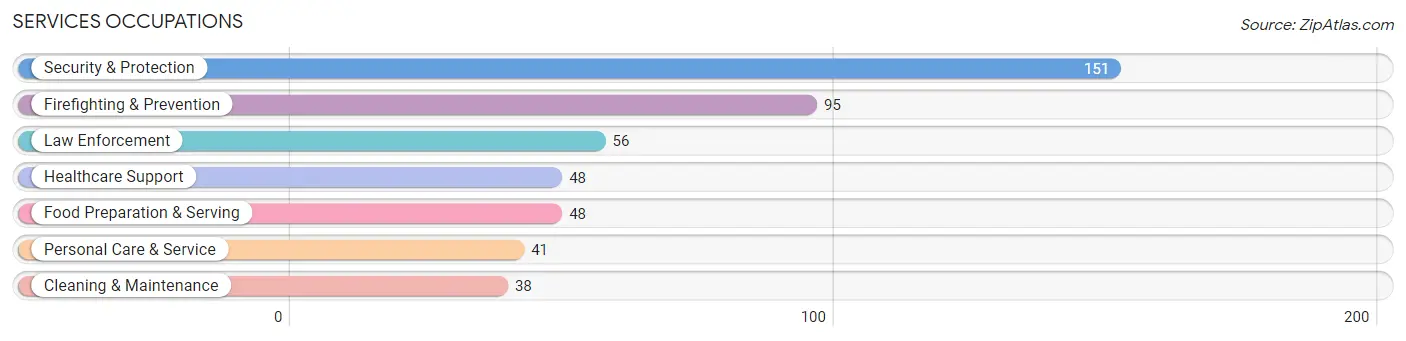
Services Occupations
The most common Services occupations in Deale are Security & Protection (151 | 6.7%), Firefighting & Prevention (95 | 4.2%), Law Enforcement (56 | 2.5%), Healthcare Support (48 | 2.1%), and Food Preparation & Serving (48 | 2.1%).
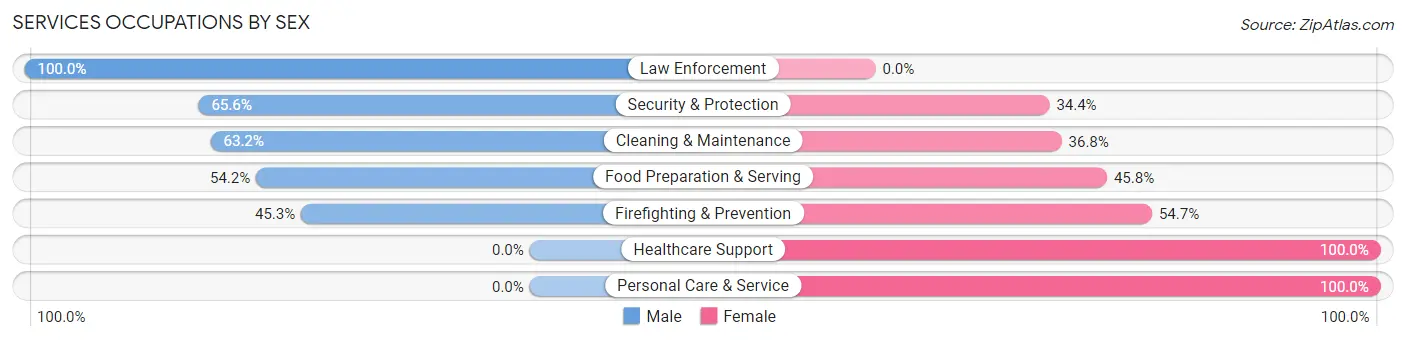
Services Occupations by Sex
Within the Services occupations in Deale, the most male-oriented occupations are Law Enforcement (100.0%), Security & Protection (65.6%), and Cleaning & Maintenance (63.2%), while the most female-oriented occupations are Healthcare Support (100.0%), Personal Care & Service (100.0%), and Firefighting & Prevention (54.7%).
| Occupation | Male | Female |
| Healthcare Support | 0 (0.0%) | 48 (100.0%) |
| Security & Protection | 99 (65.6%) | 52 (34.4%) |
| Firefighting & Prevention | 43 (45.3%) | 52 (54.7%) |
| Law Enforcement | 56 (100.0%) | 0 (0.0%) |
| Food Preparation & Serving | 26 (54.2%) | 22 (45.8%) |
| Cleaning & Maintenance | 24 (63.2%) | 14 (36.8%) |
| Personal Care & Service | 0 (0.0%) | 41 (100.0%) |
| Total (Category) | 149 (45.7%) | 177 (54.3%) |
| Total (Overall) | 1,117 (49.8%) | 1,128 (50.2%) |
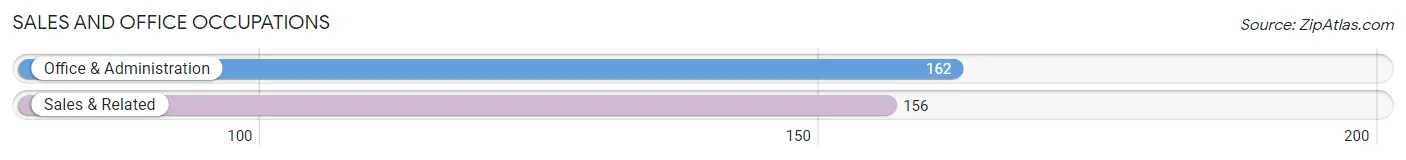
Sales and Office Occupations
The most common Sales and Office occupations in Deale are Office & Administration (162 | 7.2%), and Sales & Related (156 | 7.0%).
Sales and Office Occupations by Sex
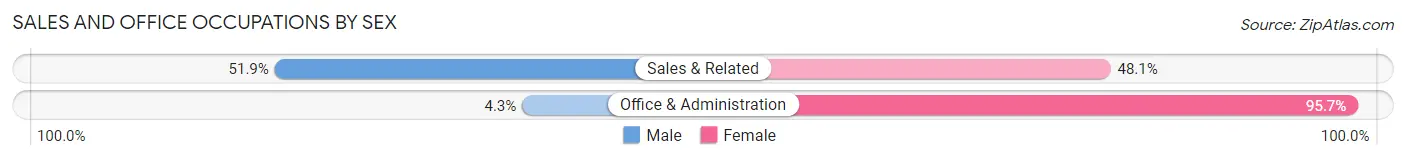
| Occupation | Male | Female |
| Sales & Related | 81 (51.9%) | 75 (48.1%) |
| Office & Administration | 7 (4.3%) | 155 (95.7%) |
| Total (Category) | 88 (27.7%) | 230 (72.3%) |
| Total (Overall) | 1,117 (49.8%) | 1,128 (50.2%) |
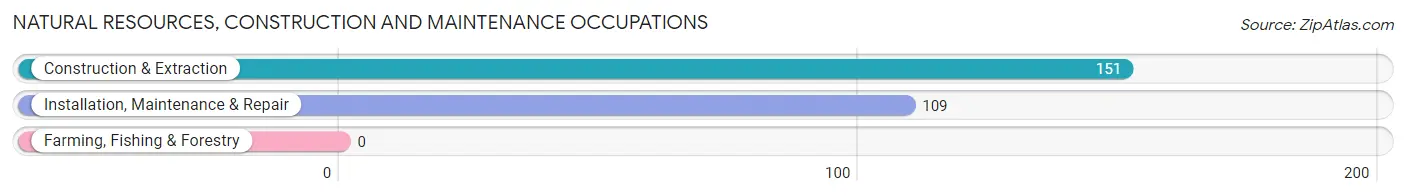
Natural Resources, Construction and Maintenance Occupations
The most common Natural Resources, Construction and Maintenance occupations in Deale are Construction & Extraction (151 | 6.7%), and Installation, Maintenance & Repair (109 | 4.9%).
Natural Resources, Construction and Maintenance Occupations by Sex
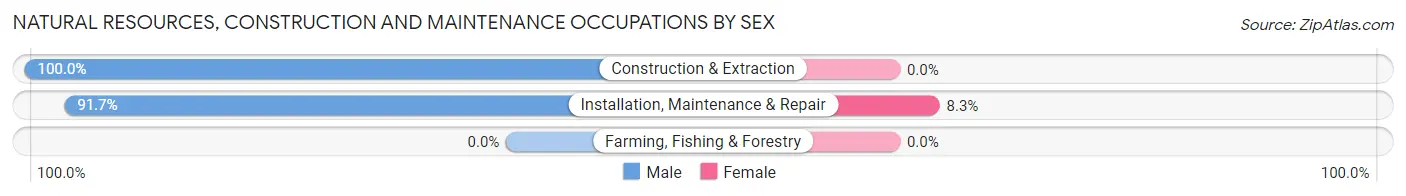
| Occupation | Male | Female |
| Farming, Fishing & Forestry | 0 (0.0%) | 0 (0.0%) |
| Construction & Extraction | 151 (100.0%) | 0 (0.0%) |
| Installation, Maintenance & Repair | 100 (91.7%) | 9 (8.3%) |
| Total (Category) | 251 (96.5%) | 9 (3.5%) |
| Total (Overall) | 1,117 (49.8%) | 1,128 (50.2%) |
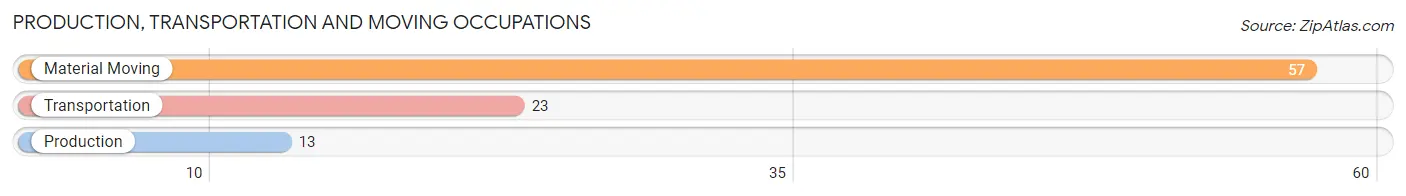
Production, Transportation and Moving Occupations
The most common Production, Transportation and Moving occupations in Deale are Material Moving (57 | 2.5%), Transportation (23 | 1.0%), and Production (13 | 0.6%).
Production, Transportation and Moving Occupations by Sex
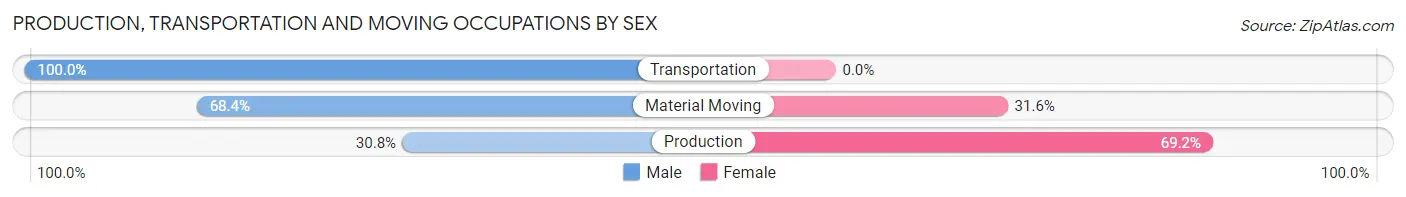
| Occupation | Male | Female |
| Production | 4 (30.8%) | 9 (69.2%) |
| Transportation | 23 (100.0%) | 0 (0.0%) |
| Material Moving | 39 (68.4%) | 18 (31.6%) |
| Total (Category) | 66 (71.0%) | 27 (29.0%) |
| Total (Overall) | 1,117 (49.8%) | 1,128 (50.2%) |
Employment Industries by Sex in Deale
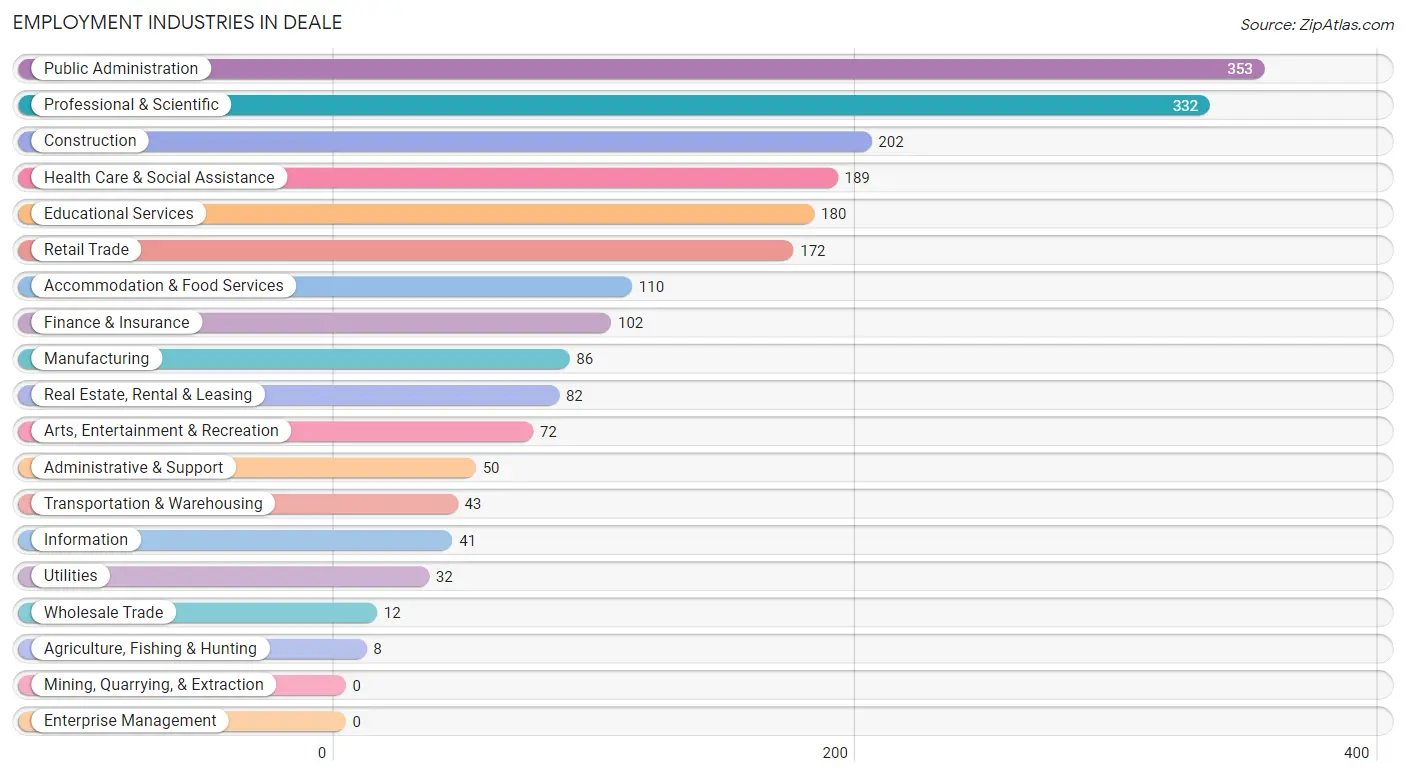
Employment Industries in Deale
The major employment industries in Deale include Public Administration (353 | 15.7%), Professional & Scientific (332 | 14.8%), Construction (202 | 9.0%), Health Care & Social Assistance (189 | 8.4%), and Educational Services (180 | 8.0%).
Employment Industries by Sex in Deale
The Deale industries that see more men than women are Agriculture, Fishing & Hunting (100.0%), Construction (86.6%), and Administrative & Support (82.0%), whereas the industries that tend to have a higher number of women are Wholesale Trade (100.0%), Utilities (100.0%), and Health Care & Social Assistance (91.5%).
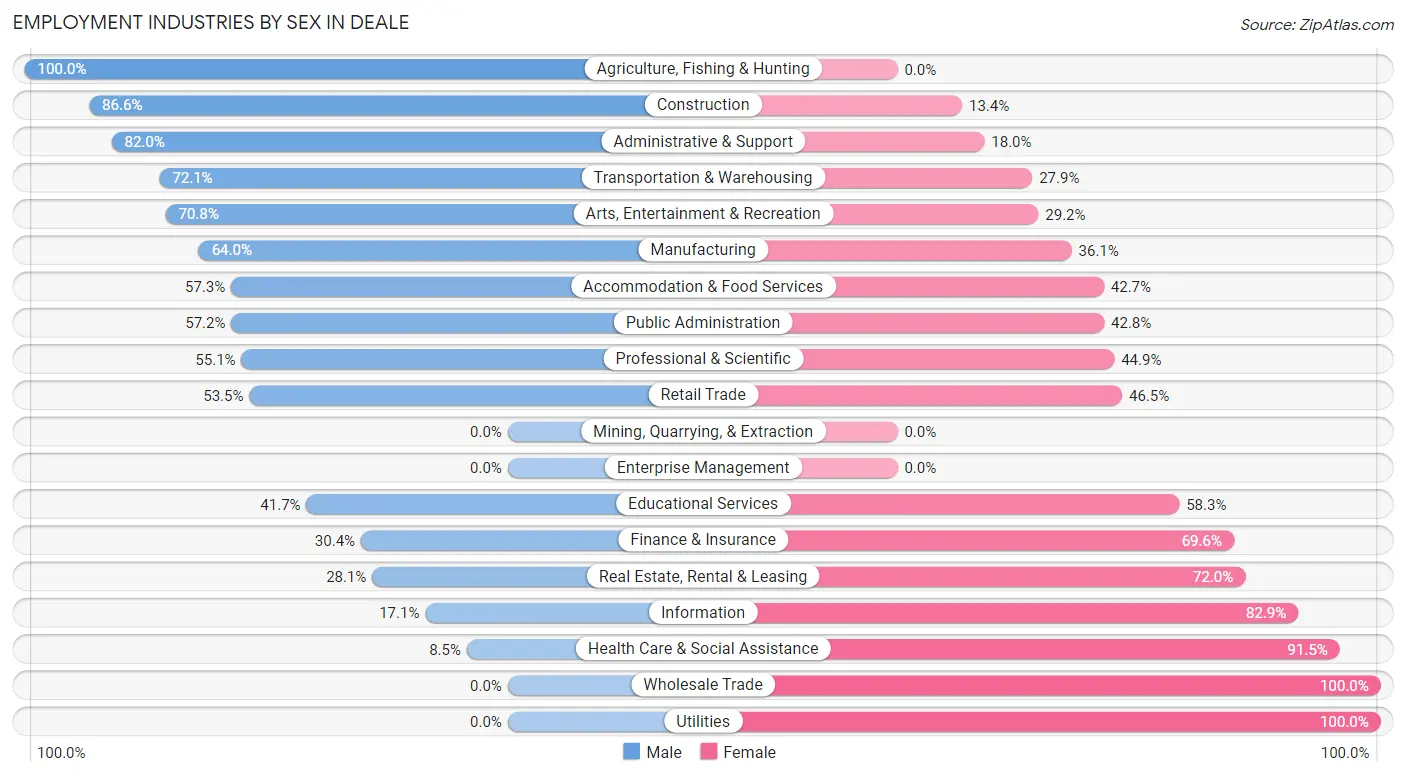
| Industry | Male | Female |
| Agriculture, Fishing & Hunting | 8 (100.0%) | 0 (0.0%) |
| Mining, Quarrying, & Extraction | 0 (0.0%) | 0 (0.0%) |
| Construction | 175 (86.6%) | 27 (13.4%) |
| Manufacturing | 55 (63.9%) | 31 (36.0%) |
| Wholesale Trade | 0 (0.0%) | 12 (100.0%) |
| Retail Trade | 92 (53.5%) | 80 (46.5%) |
| Transportation & Warehousing | 31 (72.1%) | 12 (27.9%) |
| Utilities | 0 (0.0%) | 32 (100.0%) |
| Information | 7 (17.1%) | 34 (82.9%) |
| Finance & Insurance | 31 (30.4%) | 71 (69.6%) |
| Real Estate, Rental & Leasing | 23 (28.1%) | 59 (72.0%) |
| Professional & Scientific | 183 (55.1%) | 149 (44.9%) |
| Enterprise Management | 0 (0.0%) | 0 (0.0%) |
| Administrative & Support | 41 (82.0%) | 9 (18.0%) |
| Educational Services | 75 (41.7%) | 105 (58.3%) |
| Health Care & Social Assistance | 16 (8.5%) | 173 (91.5%) |
| Arts, Entertainment & Recreation | 51 (70.8%) | 21 (29.2%) |
| Accommodation & Food Services | 63 (57.3%) | 47 (42.7%) |
| Public Administration | 202 (57.2%) | 151 (42.8%) |
| Total | 1,117 (49.8%) | 1,128 (50.2%) |
Education in Deale
School Enrollment in Deale
The most common levels of schooling among the 1,092 students in Deale are elementary school (246 | 22.5%), middle school (233 | 21.3%), and high school (173 | 15.8%).
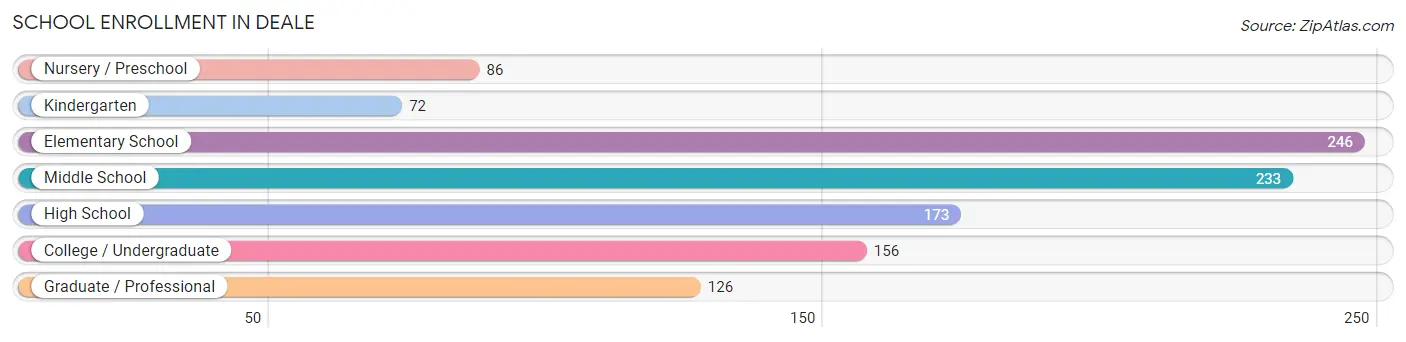
| School Level | # Students | % Students |
| Nursery / Preschool | 86 | 7.9% |
| Kindergarten | 72 | 6.6% |
| Elementary School | 246 | 22.5% |
| Middle School | 233 | 21.3% |
| High School | 173 | 15.8% |
| College / Undergraduate | 156 | 14.3% |
| Graduate / Professional | 126 | 11.5% |
| Total | 1,092 | 100.0% |
School Enrollment by Age by Funding Source in Deale
Out of a total of 1,092 students who are enrolled in schools in Deale, 197 (18.0%) attend a private institution, while the remaining 895 (82.0%) are enrolled in public schools. The age group of 15 to 17 year olds has the highest likelihood of being enrolled in private schools, with 50 (34.0% in the age bracket) enrolled. Conversely, the age group of 3 to 4 year olds has the lowest likelihood of being enrolled in a private school, with 57 (100.0% in the age bracket) attending a public institution.
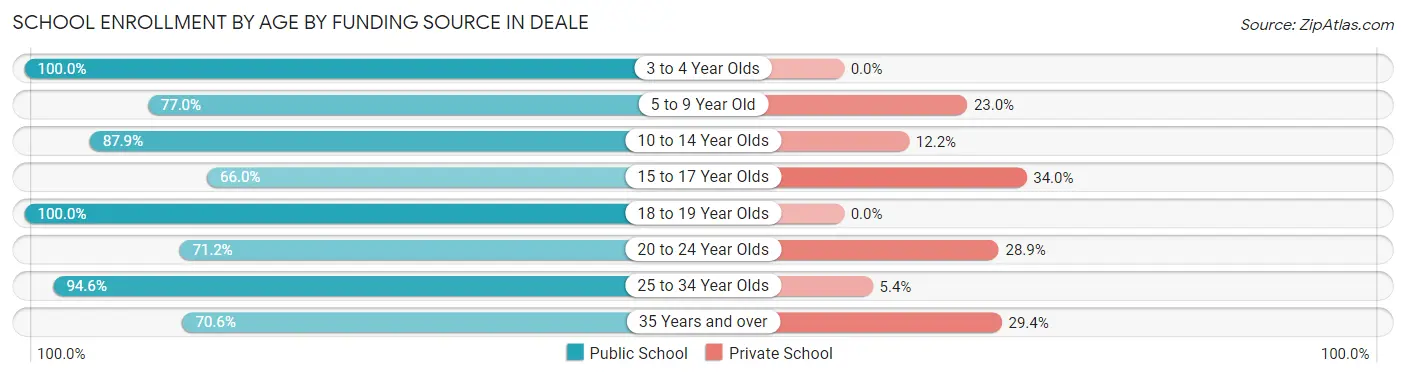
| Age Bracket | Public School | Private School |
| 3 to 4 Year Olds | 57 (100.0%) | 0 (0.0%) |
| 5 to 9 Year Old | 245 (77.0%) | 73 (23.0%) |
| 10 to 14 Year Olds | 253 (87.8%) | 35 (12.1%) |
| 15 to 17 Year Olds | 97 (66.0%) | 50 (34.0%) |
| 18 to 19 Year Olds | 12 (100.0%) | 0 (0.0%) |
| 20 to 24 Year Olds | 37 (71.2%) | 15 (28.8%) |
| 25 to 34 Year Olds | 158 (94.6%) | 9 (5.4%) |
| 35 Years and over | 36 (70.6%) | 15 (29.4%) |
| Total | 895 (82.0%) | 197 (18.0%) |
Educational Attainment by Field of Study in Deale
Business (355 | 19.6%), education (277 | 15.3%), social sciences (262 | 14.5%), science & technology (143 | 7.9%), and bio, nature & agricultural (113 | 6.2%) are the most common fields of study among 1,811 individuals in Deale who have obtained a bachelor's degree or higher.
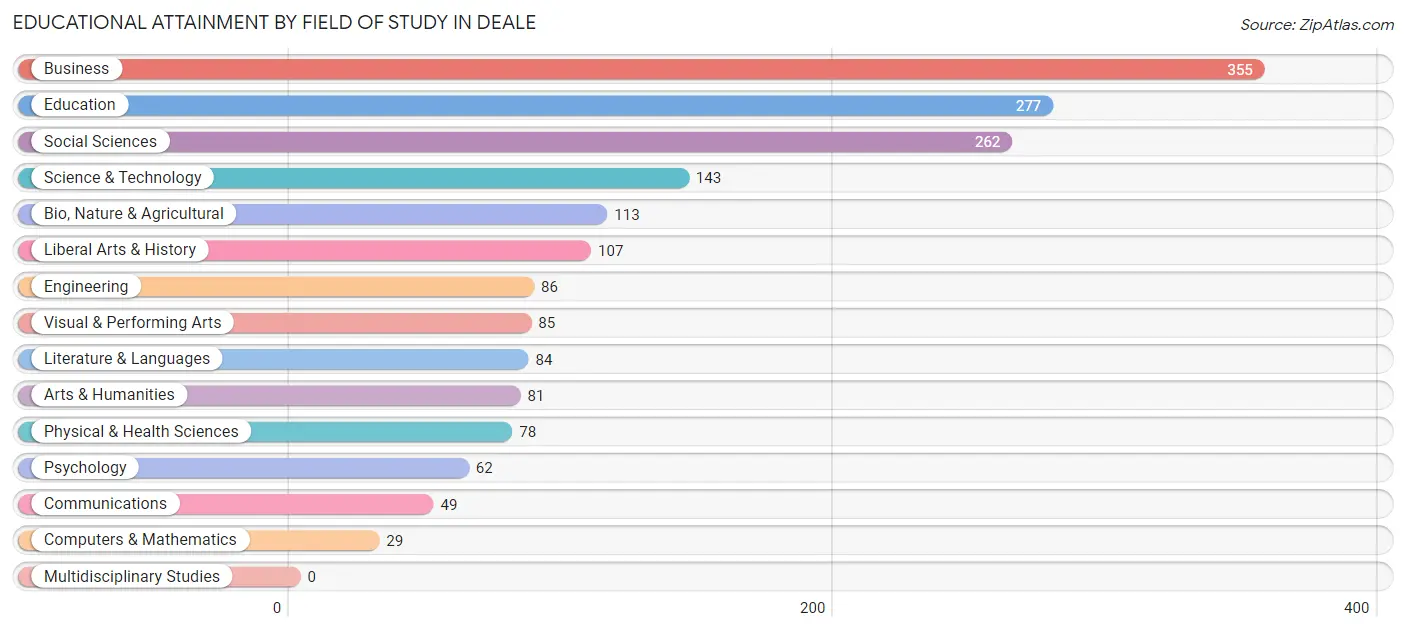
| Field of Study | # Graduates | % Graduates |
| Computers & Mathematics | 29 | 1.6% |
| Bio, Nature & Agricultural | 113 | 6.2% |
| Physical & Health Sciences | 78 | 4.3% |
| Psychology | 62 | 3.4% |
| Social Sciences | 262 | 14.5% |
| Engineering | 86 | 4.8% |
| Multidisciplinary Studies | 0 | 0.0% |
| Science & Technology | 143 | 7.9% |
| Business | 355 | 19.6% |
| Education | 277 | 15.3% |
| Literature & Languages | 84 | 4.6% |
| Liberal Arts & History | 107 | 5.9% |
| Visual & Performing Arts | 85 | 4.7% |
| Communications | 49 | 2.7% |
| Arts & Humanities | 81 | 4.5% |
| Total | 1,811 | 100.0% |
Transportation & Commute in Deale
Vehicle Availability by Sex in Deale
The most prevalent vehicle ownership categories in Deale are males with 3 vehicles (463, accounting for 40.7%) and females with 3 vehicles (398, making up 40.4%).
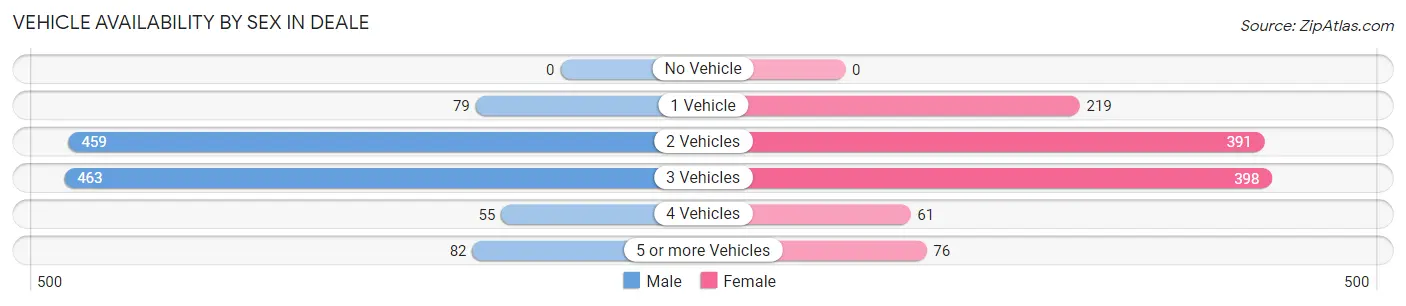
| Vehicles Available | Male | Female |
| No Vehicle | 0 (0.0%) | 0 (0.0%) |
| 1 Vehicle | 79 (6.9%) | 219 (19.1%) |
| 2 Vehicles | 459 (40.3%) | 391 (34.2%) |
| 3 Vehicles | 463 (40.7%) | 398 (34.8%) |
| 4 Vehicles | 55 (4.8%) | 61 (5.3%) |
| 5 or more Vehicles | 82 (7.2%) | 76 (6.6%) |
| Total | 1,138 (100.0%) | 1,145 (100.0%) |
Commute Time in Deale
The most frequently occuring commute durations in Deale are 60 to 89 minutes (380 commuters, 22.0%), 45 to 59 minutes (286 commuters, 16.5%), and 90 or more minutes (161 commuters, 9.3%).
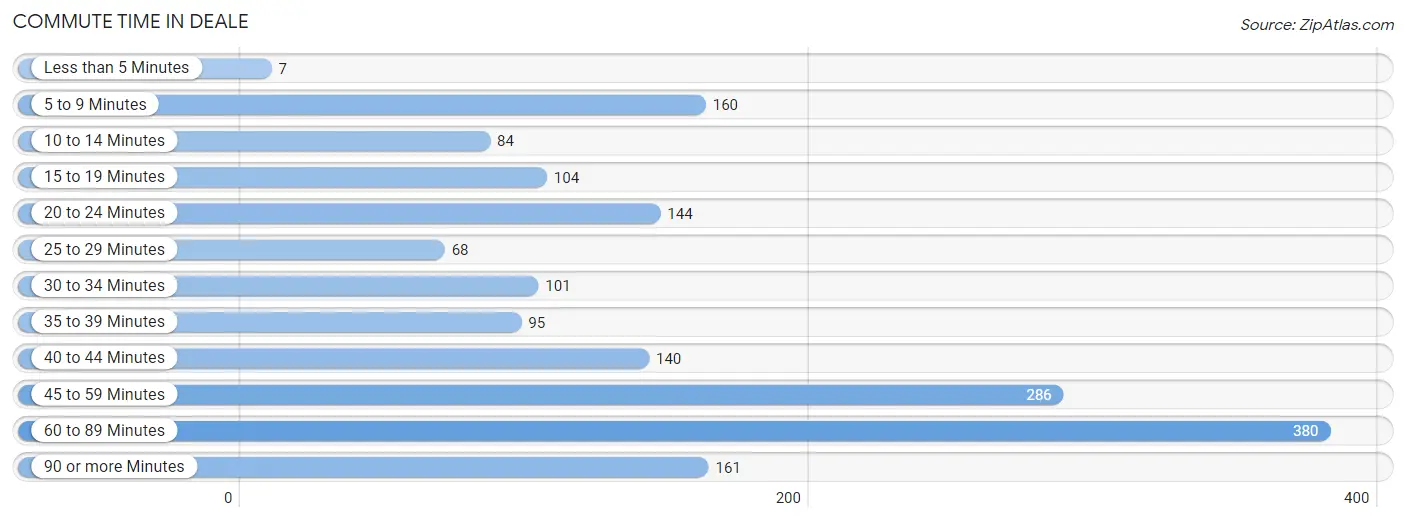
| Commute Time | # Commuters | % Commuters |
| Less than 5 Minutes | 7 | 0.4% |
| 5 to 9 Minutes | 160 | 9.2% |
| 10 to 14 Minutes | 84 | 4.9% |
| 15 to 19 Minutes | 104 | 6.0% |
| 20 to 24 Minutes | 144 | 8.3% |
| 25 to 29 Minutes | 68 | 3.9% |
| 30 to 34 Minutes | 101 | 5.8% |
| 35 to 39 Minutes | 95 | 5.5% |
| 40 to 44 Minutes | 140 | 8.1% |
| 45 to 59 Minutes | 286 | 16.5% |
| 60 to 89 Minutes | 380 | 22.0% |
| 90 or more Minutes | 161 | 9.3% |
Commute Time by Sex in Deale
The most common commute times in Deale are 45 to 59 minutes (206 commuters, 22.8%) for males and 60 to 89 minutes (179 commuters, 21.7%) for females.
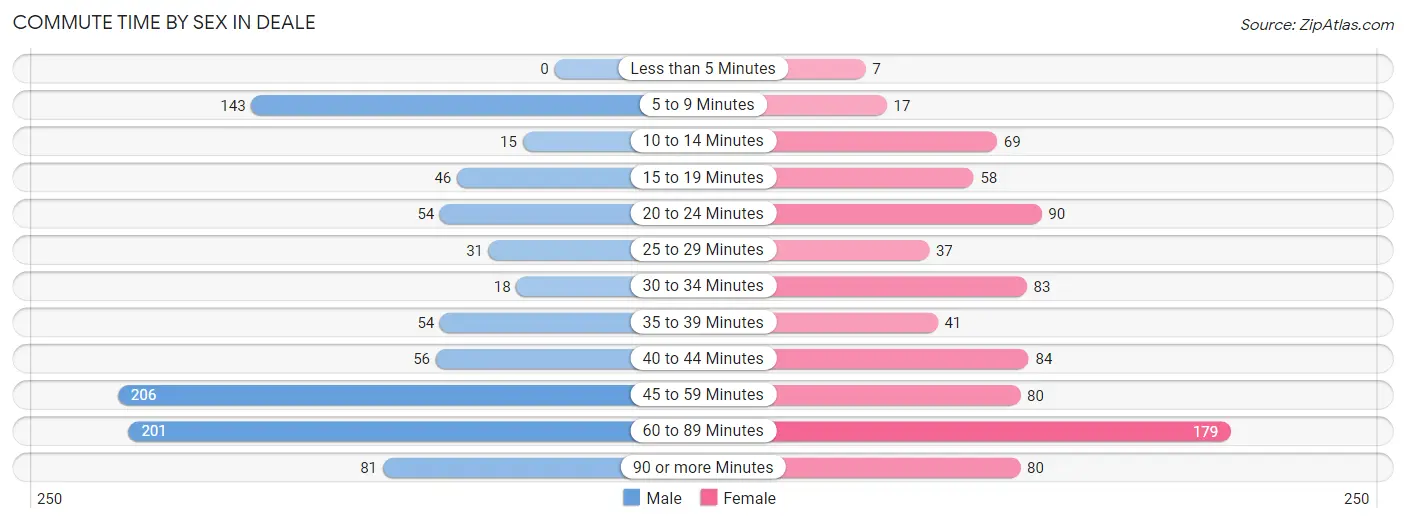
| Commute Time | Male | Female |
| Less than 5 Minutes | 0 (0.0%) | 7 (0.9%) |
| 5 to 9 Minutes | 143 (15.8%) | 17 (2.1%) |
| 10 to 14 Minutes | 15 (1.7%) | 69 (8.4%) |
| 15 to 19 Minutes | 46 (5.1%) | 58 (7.0%) |
| 20 to 24 Minutes | 54 (6.0%) | 90 (10.9%) |
| 25 to 29 Minutes | 31 (3.4%) | 37 (4.5%) |
| 30 to 34 Minutes | 18 (2.0%) | 83 (10.1%) |
| 35 to 39 Minutes | 54 (6.0%) | 41 (5.0%) |
| 40 to 44 Minutes | 56 (6.2%) | 84 (10.2%) |
| 45 to 59 Minutes | 206 (22.8%) | 80 (9.7%) |
| 60 to 89 Minutes | 201 (22.2%) | 179 (21.7%) |
| 90 or more Minutes | 81 (8.9%) | 80 (9.7%) |
Time of Departure to Work by Sex in Deale
The most frequent times of departure to work in Deale are 7:00 AM to 7:29 AM (172, 19.0%) for males and 6:30 AM to 6:59 AM (181, 21.9%) for females.
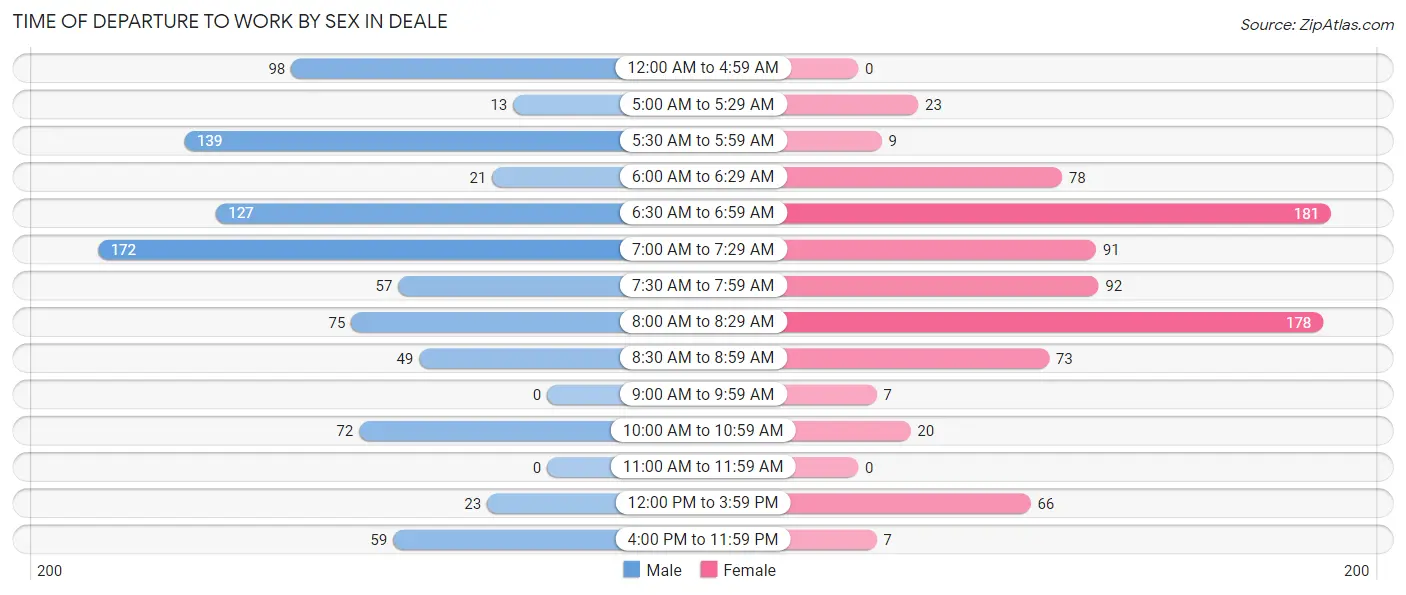
| Time of Departure | Male | Female |
| 12:00 AM to 4:59 AM | 98 (10.8%) | 0 (0.0%) |
| 5:00 AM to 5:29 AM | 13 (1.4%) | 23 (2.8%) |
| 5:30 AM to 5:59 AM | 139 (15.4%) | 9 (1.1%) |
| 6:00 AM to 6:29 AM | 21 (2.3%) | 78 (9.5%) |
| 6:30 AM to 6:59 AM | 127 (14.0%) | 181 (21.9%) |
| 7:00 AM to 7:29 AM | 172 (19.0%) | 91 (11.0%) |
| 7:30 AM to 7:59 AM | 57 (6.3%) | 92 (11.2%) |
| 8:00 AM to 8:29 AM | 75 (8.3%) | 178 (21.6%) |
| 8:30 AM to 8:59 AM | 49 (5.4%) | 73 (8.8%) |
| 9:00 AM to 9:59 AM | 0 (0.0%) | 7 (0.9%) |
| 10:00 AM to 10:59 AM | 72 (8.0%) | 20 (2.4%) |
| 11:00 AM to 11:59 AM | 0 (0.0%) | 0 (0.0%) |
| 12:00 PM to 3:59 PM | 23 (2.5%) | 66 (8.0%) |
| 4:00 PM to 11:59 PM | 59 (6.5%) | 7 (0.9%) |
| Total | 905 (100.0%) | 825 (100.0%) |
Housing Occupancy in Deale
Occupancy by Ownership in Deale
Of the total 1,889 dwellings in Deale, owner-occupied units account for 1,710 (90.5%), while renter-occupied units make up 179 (9.5%).
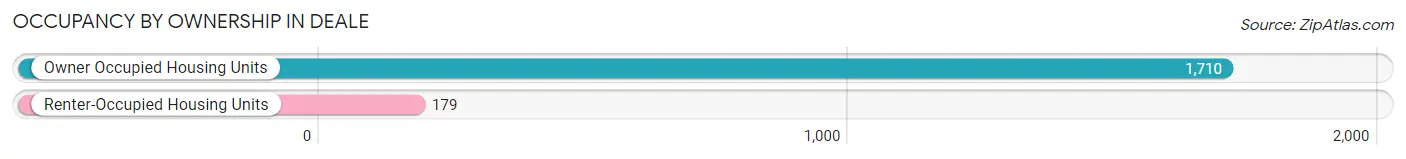
| Occupancy | # Housing Units | % Housing Units |
| Owner Occupied Housing Units | 1,710 | 90.5% |
| Renter-Occupied Housing Units | 179 | 9.5% |
| Total Occupied Housing Units | 1,889 | 100.0% |
Occupancy by Household Size in Deale
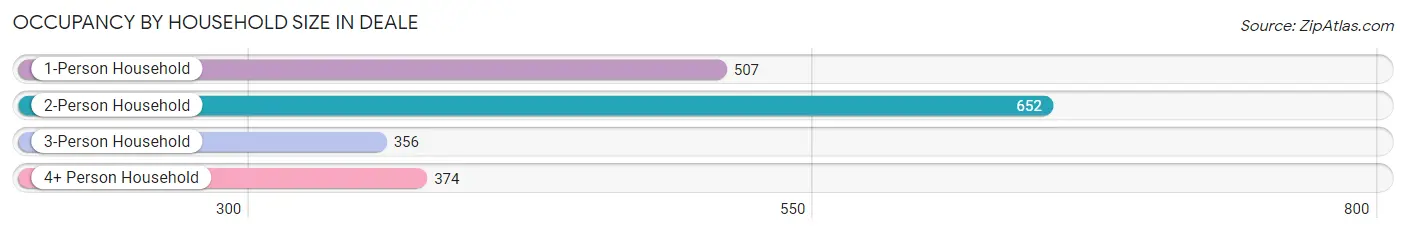
| Household Size | # Housing Units | % Housing Units |
| 1-Person Household | 507 | 26.8% |
| 2-Person Household | 652 | 34.5% |
| 3-Person Household | 356 | 18.9% |
| 4+ Person Household | 374 | 19.8% |
| Total Housing Units | 1,889 | 100.0% |
Occupancy by Ownership by Household Size in Deale
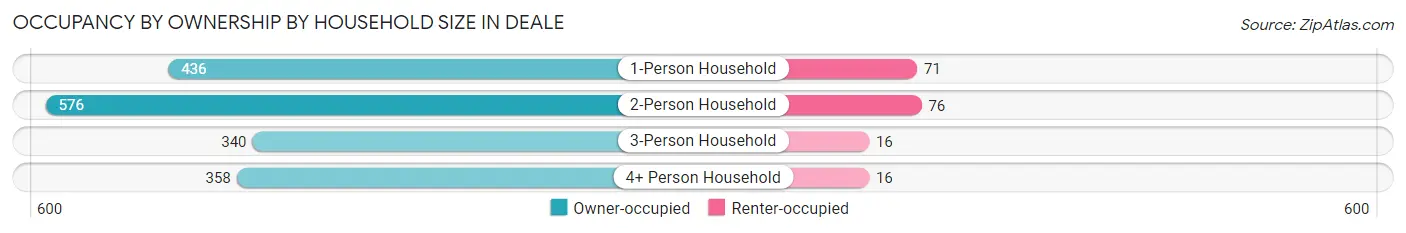
| Household Size | Owner-occupied | Renter-occupied |
| 1-Person Household | 436 (86.0%) | 71 (14.0%) |
| 2-Person Household | 576 (88.3%) | 76 (11.7%) |
| 3-Person Household | 340 (95.5%) | 16 (4.5%) |
| 4+ Person Household | 358 (95.7%) | 16 (4.3%) |
| Total Housing Units | 1,710 (90.5%) | 179 (9.5%) |
Occupancy by Educational Attainment in Deale
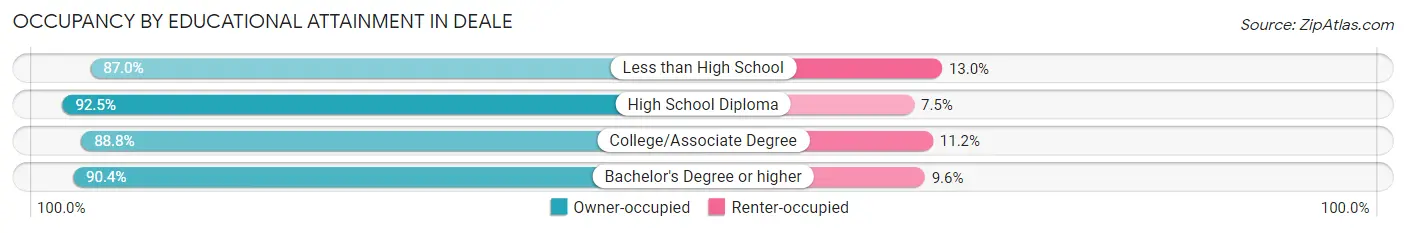
| Household Size | Owner-occupied | Renter-occupied |
| Less than High School | 40 (87.0%) | 6 (13.0%) |
| High School Diploma | 492 (92.5%) | 40 (7.5%) |
| College/Associate Degree | 379 (88.8%) | 48 (11.2%) |
| Bachelor's Degree or higher | 799 (90.4%) | 85 (9.6%) |
Occupancy by Age of Householder in Deale
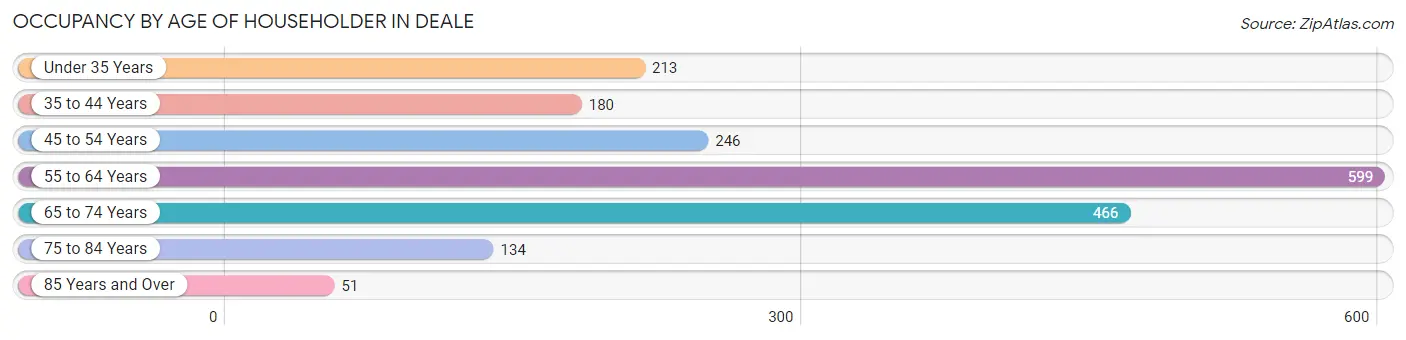
| Age Bracket | # Households | % Households |
| Under 35 Years | 213 | 11.3% |
| 35 to 44 Years | 180 | 9.5% |
| 45 to 54 Years | 246 | 13.0% |
| 55 to 64 Years | 599 | 31.7% |
| 65 to 74 Years | 466 | 24.7% |
| 75 to 84 Years | 134 | 7.1% |
| 85 Years and Over | 51 | 2.7% |
| Total | 1,889 | 100.0% |
Housing Finances in Deale
Median Income by Occupancy in Deale
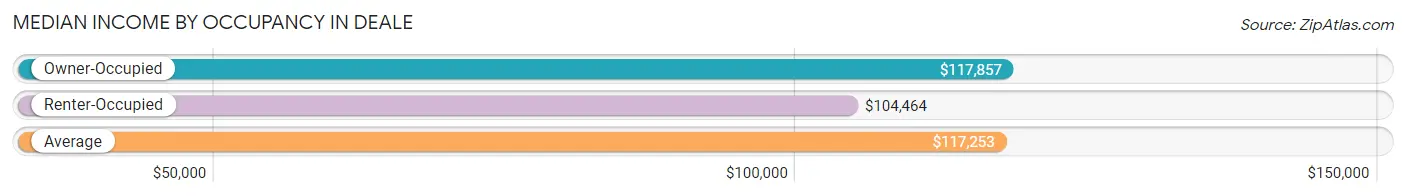
| Occupancy Type | # Households | Median Income |
| Owner-Occupied | 1,710 (90.5%) | $117,857 |
| Renter-Occupied | 179 (9.5%) | $104,464 |
| Average | 1,889 (100.0%) | $117,253 |
Occupancy by Householder Income Bracket in Deale
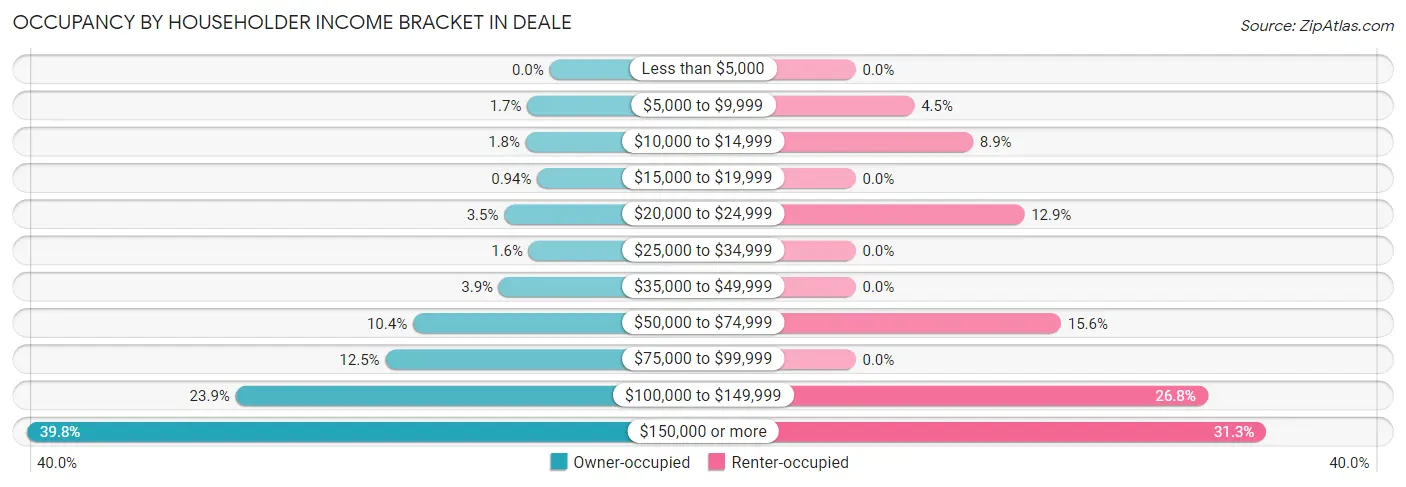
| Income Bracket | Owner-occupied | Renter-occupied |
| Less than $5,000 | 0 (0.0%) | 0 (0.0%) |
| $5,000 to $9,999 | 29 (1.7%) | 8 (4.5%) |
| $10,000 to $14,999 | 31 (1.8%) | 16 (8.9%) |
| $15,000 to $19,999 | 16 (0.9%) | 0 (0.0%) |
| $20,000 to $24,999 | 59 (3.5%) | 23 (12.9%) |
| $25,000 to $34,999 | 27 (1.6%) | 0 (0.0%) |
| $35,000 to $49,999 | 66 (3.9%) | 0 (0.0%) |
| $50,000 to $74,999 | 178 (10.4%) | 28 (15.6%) |
| $75,000 to $99,999 | 214 (12.5%) | 0 (0.0%) |
| $100,000 to $149,999 | 409 (23.9%) | 48 (26.8%) |
| $150,000 or more | 681 (39.8%) | 56 (31.3%) |
| Total | 1,710 (100.0%) | 179 (100.0%) |
Monthly Housing Cost Tiers in Deale
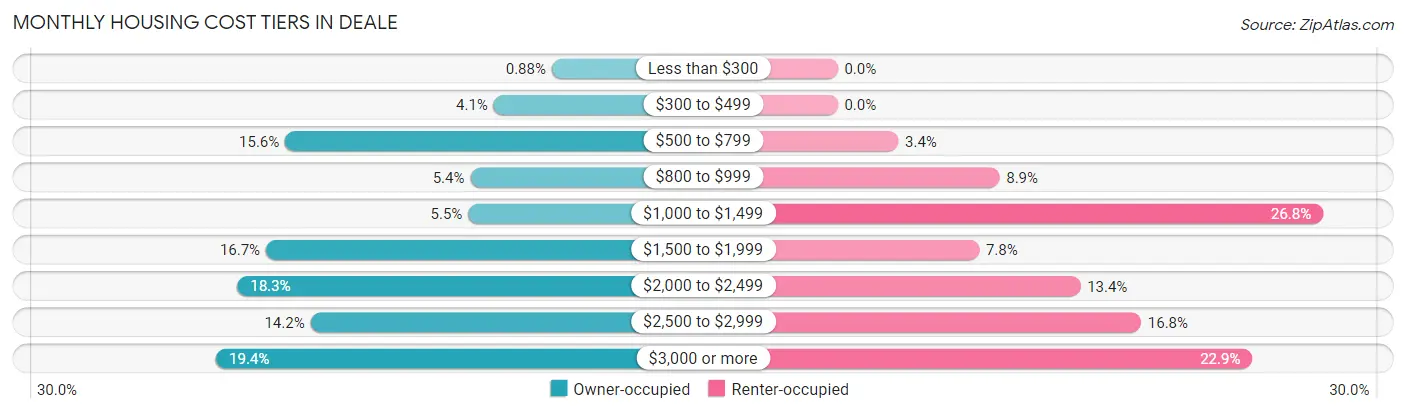
| Monthly Cost | Owner-occupied | Renter-occupied |
| Less than $300 | 15 (0.9%) | 0 (0.0%) |
| $300 to $499 | 70 (4.1%) | 0 (0.0%) |
| $500 to $799 | 267 (15.6%) | 6 (3.4%) |
| $800 to $999 | 92 (5.4%) | 16 (8.9%) |
| $1,000 to $1,499 | 94 (5.5%) | 48 (26.8%) |
| $1,500 to $1,999 | 285 (16.7%) | 14 (7.8%) |
| $2,000 to $2,499 | 312 (18.2%) | 24 (13.4%) |
| $2,500 to $2,999 | 243 (14.2%) | 30 (16.8%) |
| $3,000 or more | 332 (19.4%) | 41 (22.9%) |
| Total | 1,710 (100.0%) | 179 (100.0%) |
Physical Housing Characteristics in Deale
Housing Structures in Deale
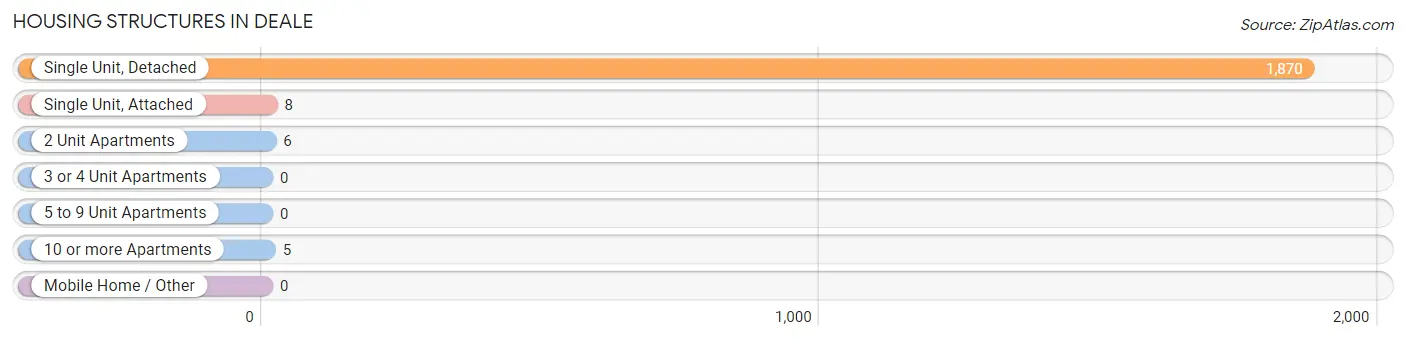
| Structure Type | # Housing Units | % Housing Units |
| Single Unit, Detached | 1,870 | 99.0% |
| Single Unit, Attached | 8 | 0.4% |
| 2 Unit Apartments | 6 | 0.3% |
| 3 or 4 Unit Apartments | 0 | 0.0% |
| 5 to 9 Unit Apartments | 0 | 0.0% |
| 10 or more Apartments | 5 | 0.3% |
| Mobile Home / Other | 0 | 0.0% |
| Total | 1,889 | 100.0% |
Housing Structures by Occupancy in Deale
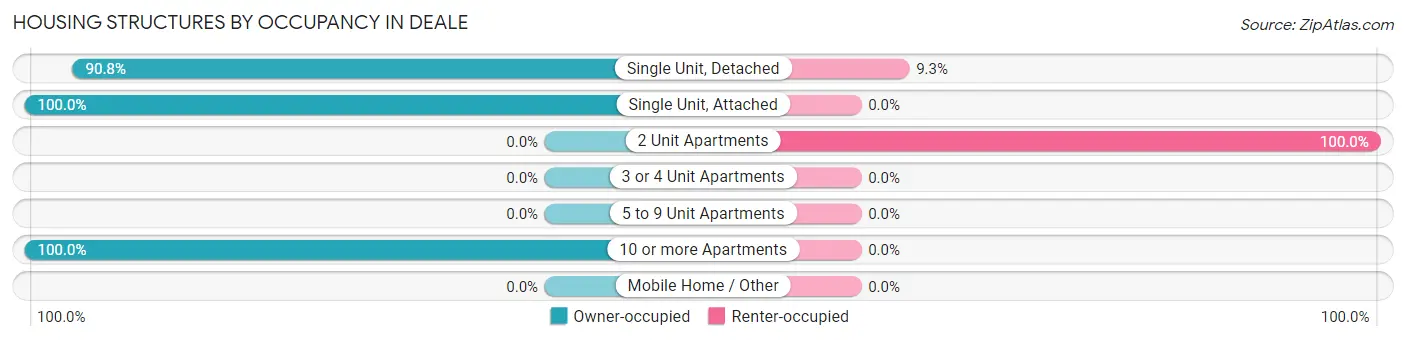
| Structure Type | Owner-occupied | Renter-occupied |
| Single Unit, Detached | 1,697 (90.7%) | 173 (9.2%) |
| Single Unit, Attached | 8 (100.0%) | 0 (0.0%) |
| 2 Unit Apartments | 0 (0.0%) | 6 (100.0%) |
| 3 or 4 Unit Apartments | 0 (0.0%) | 0 (0.0%) |
| 5 to 9 Unit Apartments | 0 (0.0%) | 0 (0.0%) |
| 10 or more Apartments | 5 (100.0%) | 0 (0.0%) |
| Mobile Home / Other | 0 (0.0%) | 0 (0.0%) |
| Total | 1,710 (90.5%) | 179 (9.5%) |
Housing Structures by Number of Rooms in Deale
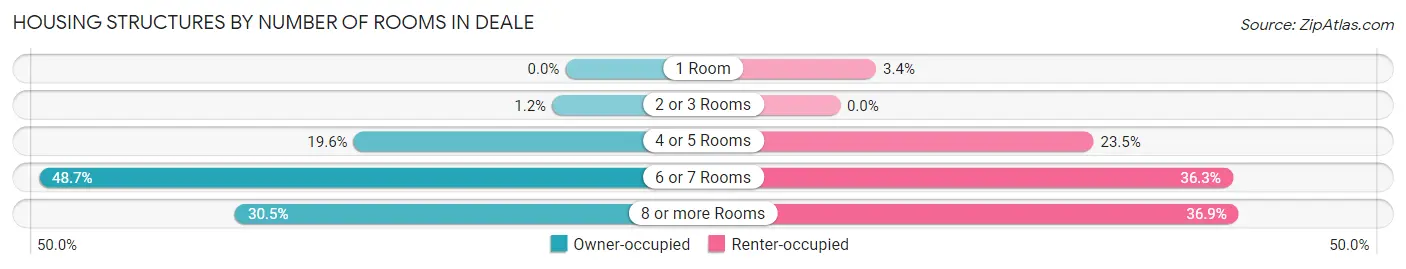
| Number of Rooms | Owner-occupied | Renter-occupied |
| 1 Room | 0 (0.0%) | 6 (3.4%) |
| 2 or 3 Rooms | 21 (1.2%) | 0 (0.0%) |
| 4 or 5 Rooms | 335 (19.6%) | 42 (23.5%) |
| 6 or 7 Rooms | 832 (48.6%) | 65 (36.3%) |
| 8 or more Rooms | 522 (30.5%) | 66 (36.9%) |
| Total | 1,710 (100.0%) | 179 (100.0%) |
Housing Structure by Heating Type in Deale
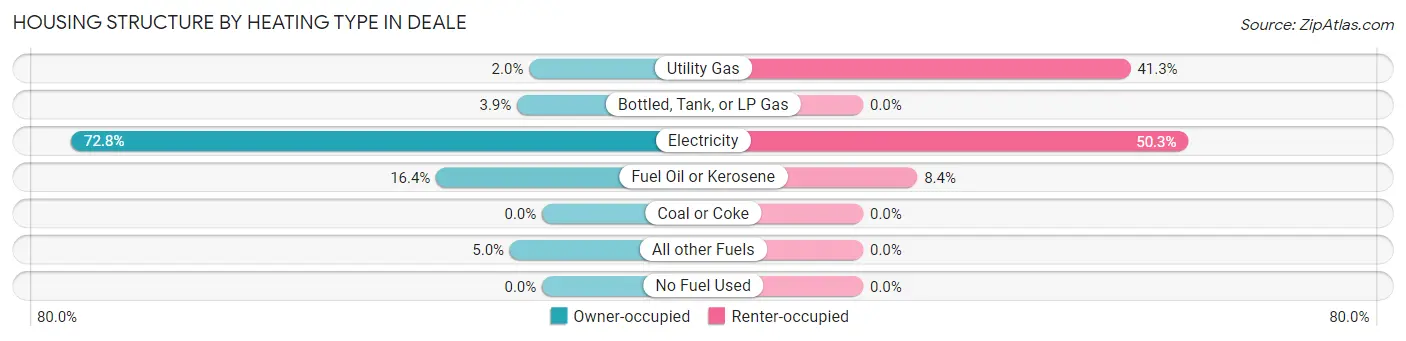
| Heating Type | Owner-occupied | Renter-occupied |
| Utility Gas | 34 (2.0%) | 74 (41.3%) |
| Bottled, Tank, or LP Gas | 66 (3.9%) | 0 (0.0%) |
| Electricity | 1,245 (72.8%) | 90 (50.3%) |
| Fuel Oil or Kerosene | 280 (16.4%) | 15 (8.4%) |
| Coal or Coke | 0 (0.0%) | 0 (0.0%) |
| All other Fuels | 85 (5.0%) | 0 (0.0%) |
| No Fuel Used | 0 (0.0%) | 0 (0.0%) |
| Total | 1,710 (100.0%) | 179 (100.0%) |
Household Vehicle Usage in Deale
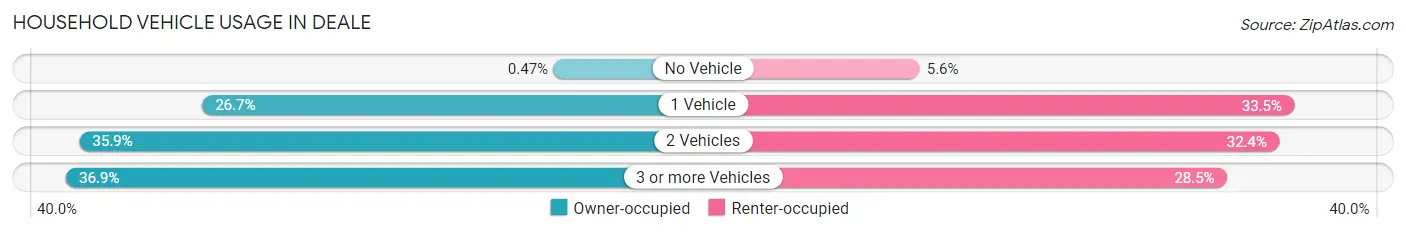
| Vehicles per Household | Owner-occupied | Renter-occupied |
| No Vehicle | 8 (0.5%) | 10 (5.6%) |
| 1 Vehicle | 457 (26.7%) | 60 (33.5%) |
| 2 Vehicles | 614 (35.9%) | 58 (32.4%) |
| 3 or more Vehicles | 631 (36.9%) | 51 (28.5%) |
| Total | 1,710 (100.0%) | 179 (100.0%) |
Real Estate & Mortgages in Deale
Real Estate and Mortgage Overview in Deale
| Characteristic | Without Mortgage | With Mortgage |
| Housing Units | 420 | 1,290 |
| Median Property Value | $358,500 | $421,900 |
| Median Household Income | $110,000 | $537 |
| Monthly Housing Costs | $626 | $332 |
| Real Estate Taxes | $2,849 | $12 |
Property Value by Mortgage Status in Deale
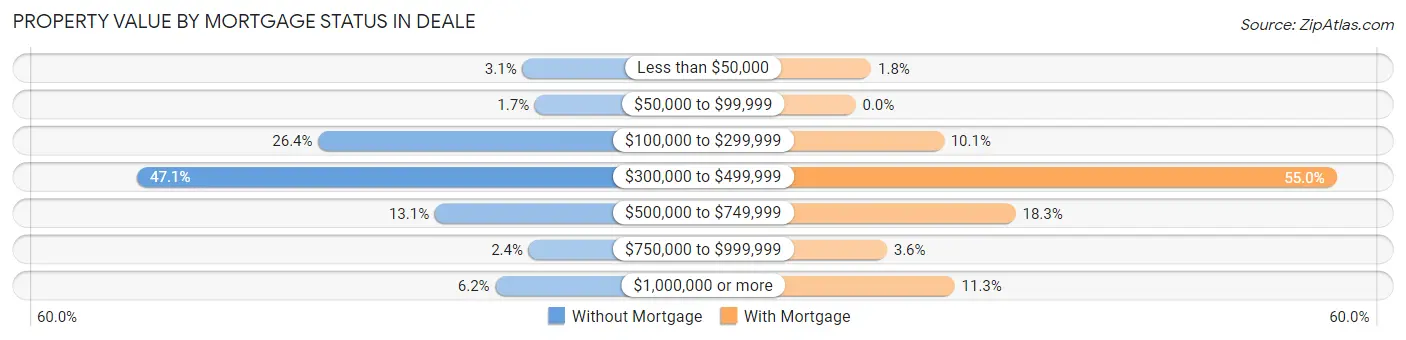
| Property Value | Without Mortgage | With Mortgage |
| Less than $50,000 | 13 (3.1%) | 23 (1.8%) |
| $50,000 to $99,999 | 7 (1.7%) | 0 (0.0%) |
| $100,000 to $299,999 | 111 (26.4%) | 130 (10.1%) |
| $300,000 to $499,999 | 198 (47.1%) | 709 (55.0%) |
| $500,000 to $749,999 | 55 (13.1%) | 236 (18.3%) |
| $750,000 to $999,999 | 10 (2.4%) | 46 (3.6%) |
| $1,000,000 or more | 26 (6.2%) | 146 (11.3%) |
| Total | 420 (100.0%) | 1,290 (100.0%) |
Household Income by Mortgage Status in Deale
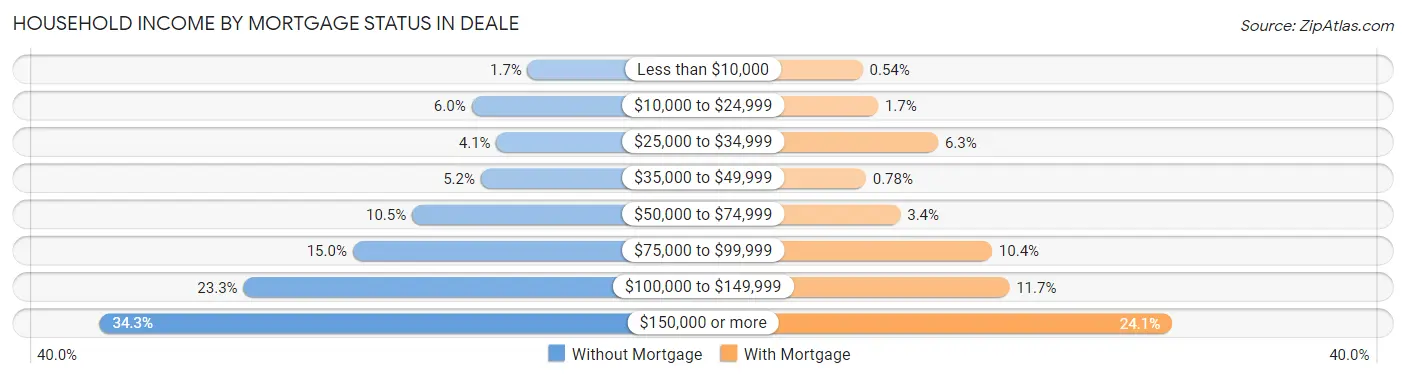
| Household Income | Without Mortgage | With Mortgage |
| Less than $10,000 | 7 (1.7%) | 7 (0.5%) |
| $10,000 to $24,999 | 25 (5.9%) | 22 (1.7%) |
| $25,000 to $34,999 | 17 (4.1%) | 81 (6.3%) |
| $35,000 to $49,999 | 22 (5.2%) | 10 (0.8%) |
| $50,000 to $74,999 | 44 (10.5%) | 44 (3.4%) |
| $75,000 to $99,999 | 63 (15.0%) | 134 (10.4%) |
| $100,000 to $149,999 | 98 (23.3%) | 151 (11.7%) |
| $150,000 or more | 144 (34.3%) | 311 (24.1%) |
| Total | 420 (100.0%) | 1,290 (100.0%) |
Property Value to Household Income Ratio in Deale
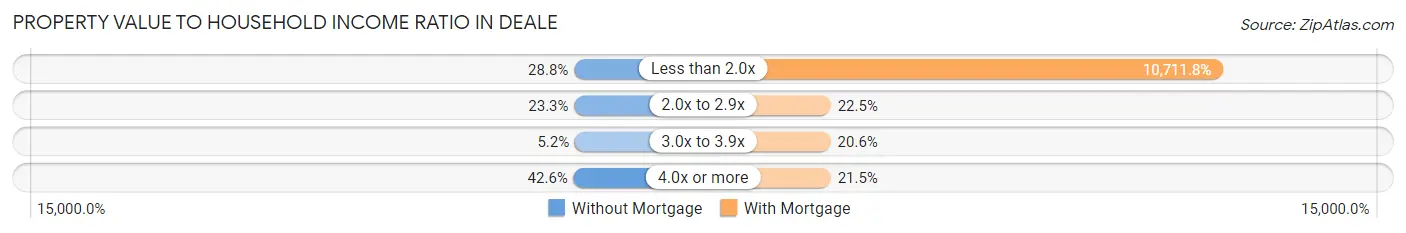
| Value-to-Income Ratio | Without Mortgage | With Mortgage |
| Less than 2.0x | 121 (28.8%) | 138,182 (10,711.8%) |
| 2.0x to 2.9x | 98 (23.3%) | 290 (22.5%) |
| 3.0x to 3.9x | 22 (5.2%) | 266 (20.6%) |
| 4.0x or more | 179 (42.6%) | 277 (21.5%) |
| Total | 420 (100.0%) | 1,290 (100.0%) |
Real Estate Taxes by Mortgage Status in Deale
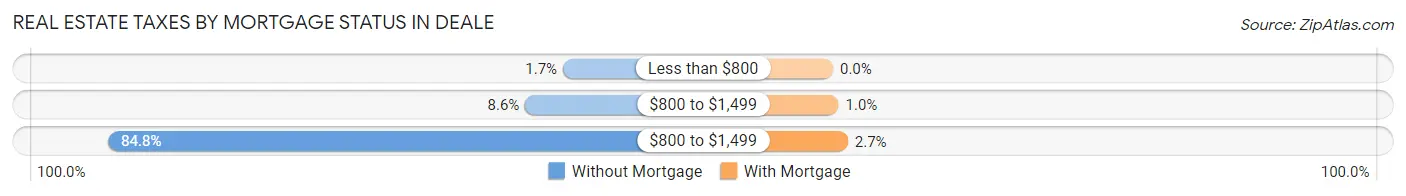
| Property Taxes | Without Mortgage | With Mortgage |
| Less than $800 | 7 (1.7%) | 0 (0.0%) |
| $800 to $1,499 | 36 (8.6%) | 13 (1.0%) |
| $800 to $1,499 | 356 (84.8%) | 35 (2.7%) |
| Total | 420 (100.0%) | 1,290 (100.0%) |
Health & Disability in Deale
Health Insurance Coverage by Age in Deale
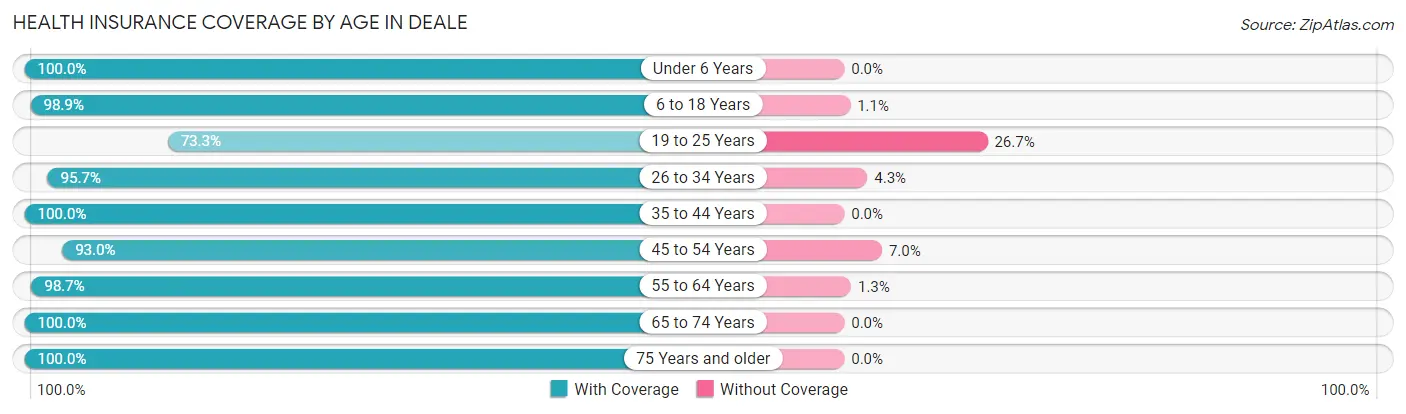
| Age Bracket | With Coverage | Without Coverage |
| Under 6 Years | 279 (100.0%) | 0 (0.0%) |
| 6 to 18 Years | 714 (98.9%) | 8 (1.1%) |
| 19 to 25 Years | 151 (73.3%) | 55 (26.7%) |
| 26 to 34 Years | 601 (95.7%) | 27 (4.3%) |
| 35 to 44 Years | 323 (100.0%) | 0 (0.0%) |
| 45 to 54 Years | 424 (93.0%) | 32 (7.0%) |
| 55 to 64 Years | 1,098 (98.7%) | 14 (1.3%) |
| 65 to 74 Years | 694 (100.0%) | 0 (0.0%) |
| 75 Years and older | 234 (100.0%) | 0 (0.0%) |
| Total | 4,518 (97.1%) | 136 (2.9%) |
Health Insurance Coverage by Citizenship Status in Deale
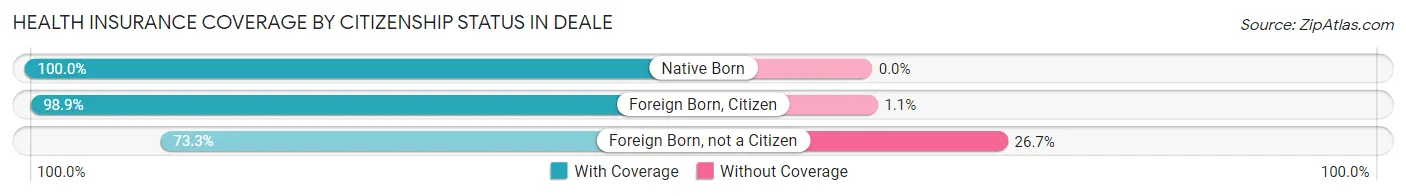
| Citizenship Status | With Coverage | Without Coverage |
| Native Born | 279 (100.0%) | 0 (0.0%) |
| Foreign Born, Citizen | 714 (98.9%) | 8 (1.1%) |
| Foreign Born, not a Citizen | 151 (73.3%) | 55 (26.7%) |
Health Insurance Coverage by Household Income in Deale
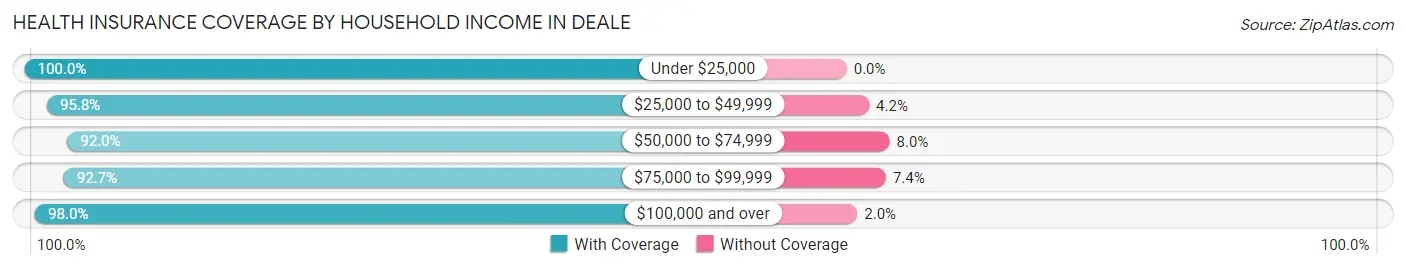
| Household Income | With Coverage | Without Coverage |
| Under $25,000 | 242 (100.0%) | 0 (0.0%) |
| $25,000 to $49,999 | 183 (95.8%) | 8 (4.2%) |
| $50,000 to $74,999 | 344 (92.0%) | 30 (8.0%) |
| $75,000 to $99,999 | 378 (92.6%) | 30 (7.3%) |
| $100,000 and over | 3,368 (98.0%) | 68 (2.0%) |
Public vs Private Health Insurance Coverage by Age in Deale
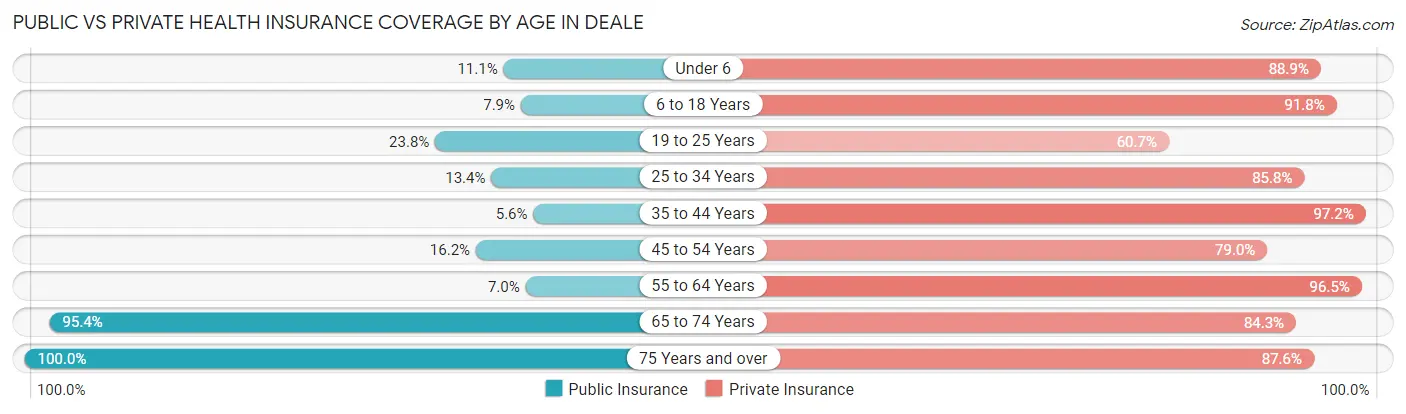
| Age Bracket | Public Insurance | Private Insurance |
| Under 6 | 31 (11.1%) | 248 (88.9%) |
| 6 to 18 Years | 57 (7.9%) | 663 (91.8%) |
| 19 to 25 Years | 49 (23.8%) | 125 (60.7%) |
| 25 to 34 Years | 84 (13.4%) | 539 (85.8%) |
| 35 to 44 Years | 18 (5.6%) | 314 (97.2%) |
| 45 to 54 Years | 74 (16.2%) | 360 (78.9%) |
| 55 to 64 Years | 78 (7.0%) | 1,073 (96.5%) |
| 65 to 74 Years | 662 (95.4%) | 585 (84.3%) |
| 75 Years and over | 234 (100.0%) | 205 (87.6%) |
| Total | 1,287 (27.7%) | 4,112 (88.3%) |
Disability Status by Sex by Age in Deale
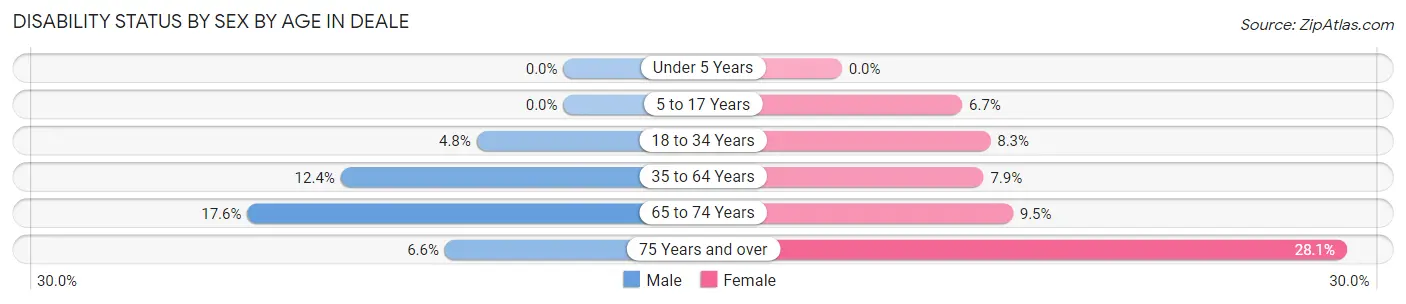
| Age Bracket | Male | Female |
| Under 5 Years | 0 (0.0%) | 0 (0.0%) |
| 5 to 17 Years | 0 (0.0%) | 28 (6.7%) |
| 18 to 34 Years | 21 (4.8%) | 34 (8.3%) |
| 35 to 64 Years | 112 (12.4%) | 78 (7.9%) |
| 65 to 74 Years | 63 (17.6%) | 32 (9.5%) |
| 75 Years and over | 7 (6.6%) | 36 (28.1%) |
Disability Class by Sex by Age in Deale
Disability Class: Hearing Difficulty

| Age Bracket | Male | Female |
| Under 5 Years | 0 (0.0%) | 0 (0.0%) |
| 5 to 17 Years | 0 (0.0%) | 0 (0.0%) |
| 18 to 34 Years | 0 (0.0%) | 12 (2.9%) |
| 35 to 64 Years | 9 (1.0%) | 58 (5.9%) |
| 65 to 74 Years | 33 (9.2%) | 0 (0.0%) |
| 75 Years and over | 7 (6.6%) | 12 (9.4%) |
Disability Class: Vision Difficulty
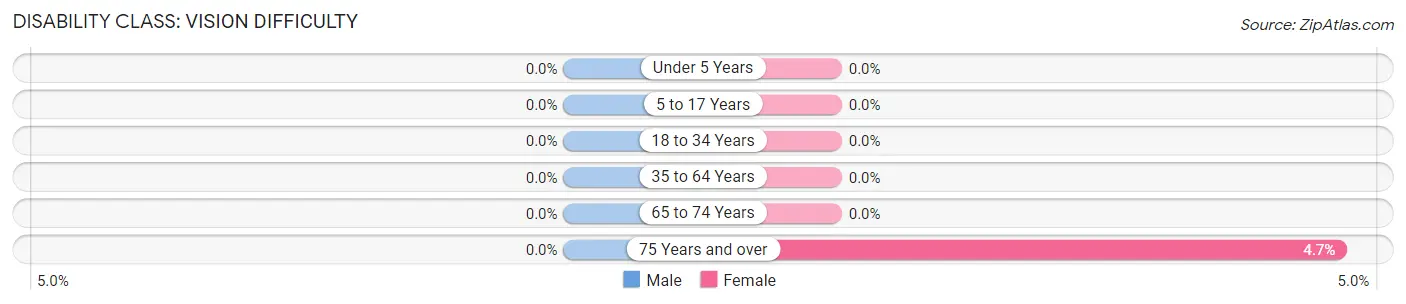
| Age Bracket | Male | Female |
| Under 5 Years | 0 (0.0%) | 0 (0.0%) |
| 5 to 17 Years | 0 (0.0%) | 0 (0.0%) |
| 18 to 34 Years | 0 (0.0%) | 0 (0.0%) |
| 35 to 64 Years | 0 (0.0%) | 0 (0.0%) |
| 65 to 74 Years | 0 (0.0%) | 0 (0.0%) |
| 75 Years and over | 0 (0.0%) | 6 (4.7%) |
Disability Class: Cognitive Difficulty
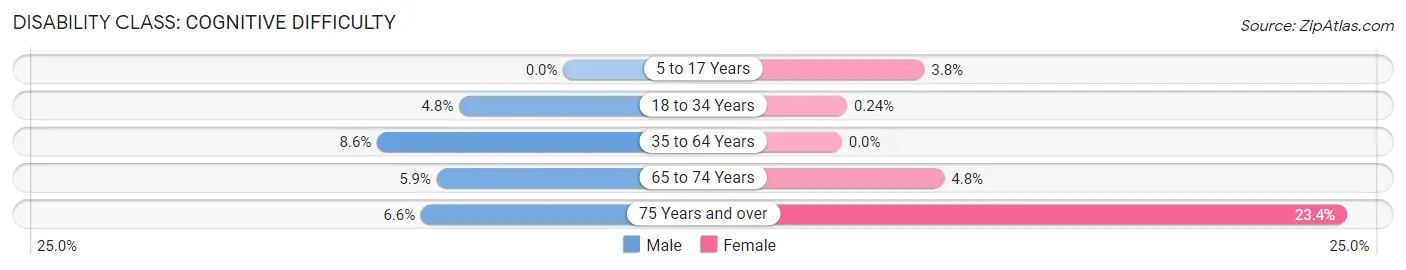
| Age Bracket | Male | Female |
| 5 to 17 Years | 0 (0.0%) | 16 (3.8%) |
| 18 to 34 Years | 21 (4.8%) | 1 (0.2%) |
| 35 to 64 Years | 78 (8.6%) | 0 (0.0%) |
| 65 to 74 Years | 21 (5.9%) | 16 (4.8%) |
| 75 Years and over | 7 (6.6%) | 30 (23.4%) |
Disability Class: Ambulatory Difficulty
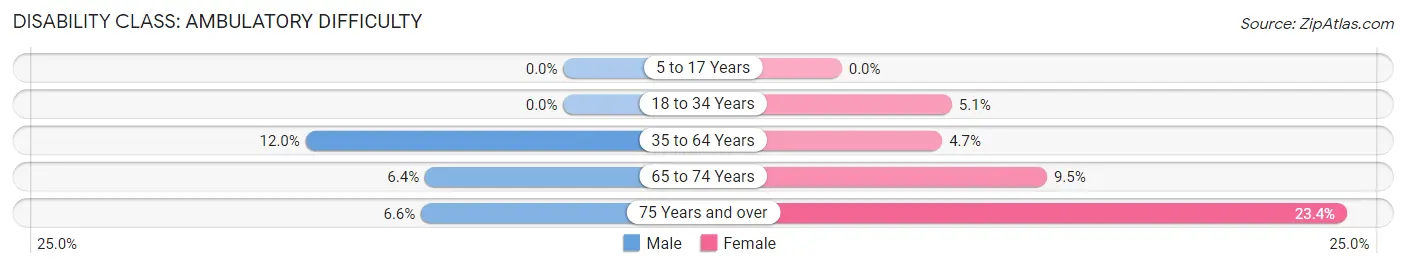
| Age Bracket | Male | Female |
| 5 to 17 Years | 0 (0.0%) | 0 (0.0%) |
| 18 to 34 Years | 0 (0.0%) | 21 (5.1%) |
| 35 to 64 Years | 108 (12.0%) | 46 (4.7%) |
| 65 to 74 Years | 23 (6.4%) | 32 (9.5%) |
| 75 Years and over | 7 (6.6%) | 30 (23.4%) |
Disability Class: Self-Care Difficulty
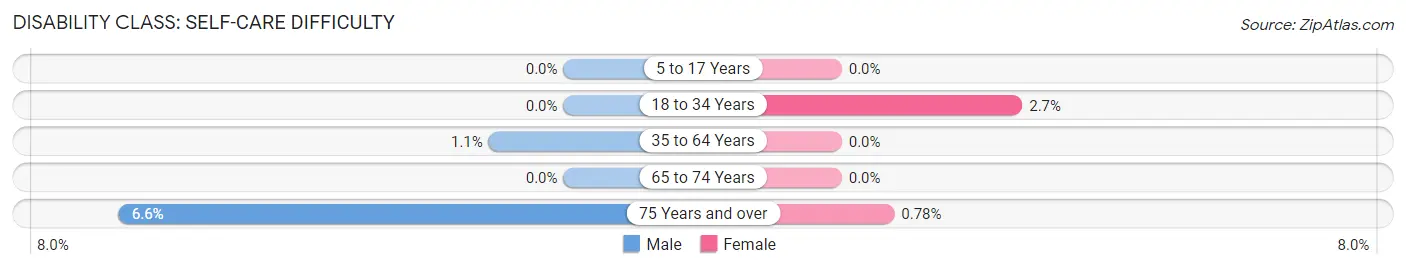
| Age Bracket | Male | Female |
| 5 to 17 Years | 0 (0.0%) | 0 (0.0%) |
| 18 to 34 Years | 0 (0.0%) | 11 (2.7%) |
| 35 to 64 Years | 10 (1.1%) | 0 (0.0%) |
| 65 to 74 Years | 0 (0.0%) | 0 (0.0%) |
| 75 Years and over | 7 (6.6%) | 1 (0.8%) |
Technology Access in Deale
Computing Device Access in Deale
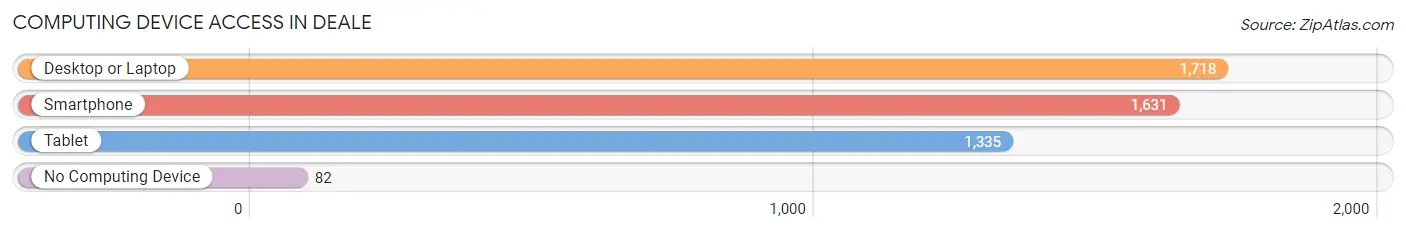
| Device Type | # Households | % Households |
| Desktop or Laptop | 1,718 | 90.9% |
| Smartphone | 1,631 | 86.3% |
| Tablet | 1,335 | 70.7% |
| No Computing Device | 82 | 4.3% |
| Total | 1,889 | 100.0% |
Internet Access in Deale
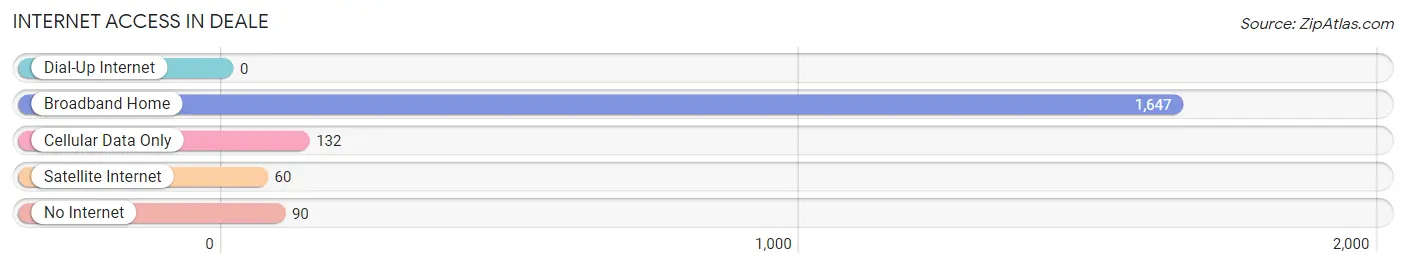
| Internet Type | # Households | % Households |
| Dial-Up Internet | 0 | 0.0% |
| Broadband Home | 1,647 | 87.2% |
| Cellular Data Only | 132 | 7.0% |
| Satellite Internet | 60 | 3.2% |
| No Internet | 90 | 4.8% |
| Total | 1,889 | 100.0% |
Deale Summary
Deale is a small unincorporated community located in Anne Arundel County, Maryland. It is situated on the western shore of the Chesapeake Bay, approximately 25 miles south of Baltimore and 30 miles east of Washington, D.C. The population of Deale was 2,845 as of the 2010 census.
History
Deale was first settled in the early 1700s by English colonists. The town was originally known as “Deale’s Landing” and was a popular port for ships carrying tobacco and other goods. In 1868, the town was officially incorporated as “Deale”.
In the late 19th century, Deale became a popular summer resort for wealthy Washingtonians. The town was home to several large hotels, including the Deale Hotel, which was built in 1891 and was the largest hotel in the area.
In the early 20th century, Deale became a popular fishing destination. The town was home to several seafood processing plants, which provided employment for many of the town’s residents.
Geography
Deale is located at 38°45'25"N 76°30'45"W (38.7569, -76.5125). The town is situated on the western shore of the Chesapeake Bay, approximately 25 miles south of Baltimore and 30 miles east of Washington, D.C.
The town is bordered by the Chesapeake Bay to the east, Herring Bay to the south, and the Patuxent River to the west. The town is located in a rural area, with the nearest major city being Annapolis, which is approximately 15 miles to the north.
Economy
Deale’s economy is largely based on fishing and seafood processing. The town is home to several seafood processing plants, which provide employment for many of the town’s residents.
In addition to fishing and seafood processing, Deale is also home to several small businesses, including restaurants, convenience stores, and marinas.
Demographics
As of the 2010 census, the population of Deale was 2,845. The racial makeup of the town was 87.3% White, 8.2% African American, 0.7% Asian, 0.3% Native American, and 3.5% from other races.
The median household income in Deale was $60,938, and the median family income was $68,750. The per capita income in Deale was $27,945. Approximately 8.2% of the population was below the poverty line.
Common Questions
What is Per Capita Income in Deale?
Per Capita income in Deale is $62,979.
What is the Median Family Income in Deale?
Median Family Income in Deale is $148,661.
What is the Median Household income in Deale?
Median Household Income in Deale is $117,253.
What is Income or Wage Gap in Deale?
Income or Wage Gap in Deale is 34.9%.
Women in Deale earn 65.1 cents for every dollar earned by a man.
What is Inequality or Gini Index in Deale?
Inequality or Gini Index in Deale is 0.40.
What is the Total Population of Deale?
Total Population of Deale is 4,706.
What is the Total Male Population of Deale?
Total Male Population of Deale is 2,219.
What is the Total Female Population of Deale?
Total Female Population of Deale is 2,487.
What is the Ratio of Males per 100 Females in Deale?
There are 89.22 Males per 100 Females in Deale.
What is the Ratio of Females per 100 Males in Deale?
There are 112.08 Females per 100 Males in Deale.
What is the Median Population Age in Deale?
Median Population Age in Deale is 49.1 Years.
What is the Average Family Size in Deale
Average Family Size in Deale is 3.1 People.
What is the Average Household Size in Deale
Average Household Size in Deale is 2.5 People.
How Large is the Labor Force in Deale?
There are 2,472 People in the Labor Forcein in Deale.
What is the Percentage of People in the Labor Force in Deale?
64.9% of People are in the Labor Force in Deale.
What is the Unemployment Rate in Deale?
Unemployment Rate in Deale is 7.3%.