Zip Codes with the Highest Percentage of Population Employed in Security & Protection in Bowie, MD
RELATED REPORTS & OPTIONS
Security & Protection
Bowie
Compare Zip Codes
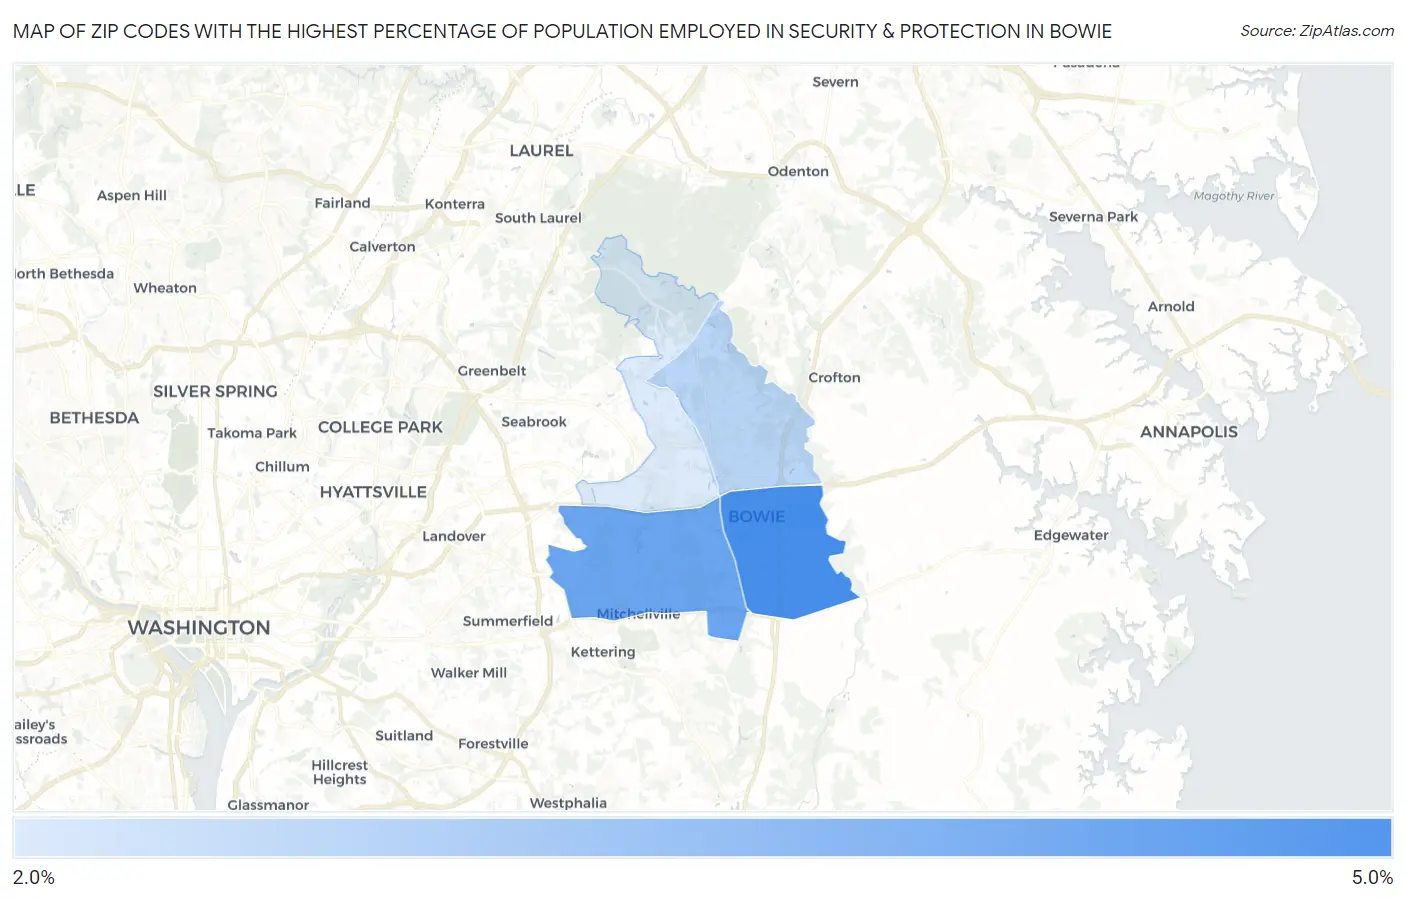
Map of Zip Codes with the Highest Percentage of Population Employed in Security & Protection in Bowie
2.8%
4.6%
Zip Codes with the Highest Percentage of Population Employed in Security & Protection in Bowie, MD
| Zip Code | % Employed | vs State | vs National | |
| 1. | 20716 | 4.6% | 2.8%(+1.81)#79 | 2.1%(+2.46)#3,432 |
| 2. | 20721 | 4.1% | 2.8%(+1.35)#96 | 2.1%(+2.00)#4,211 |
| 3. | 20715 | 3.2% | 2.8%(+0.400)#153 | 2.1%(+1.05)#6,549 |
| 4. | 20720 | 2.8% | 2.8%(-0.017)#186 | 2.1%(+0.632)#8,192 |
1
Common Questions
What are the Top 3 Zip Codes with the Highest Percentage of Population Employed in Security & Protection in Bowie, MD?
Top 3 Zip Codes with the Highest Percentage of Population Employed in Security & Protection in Bowie, MD are:
What zip code has the Highest Percentage of Population Employed in Security & Protection in Bowie, MD?
20716 has the Highest Percentage of Population Employed in Security & Protection in Bowie, MD with 4.6%.
What is the Percentage of Population Employed in Security & Protection in Bowie, MD?
Percentage of Population Employed in Security & Protection in Bowie is 3.1%.
What is the Percentage of Population Employed in Security & Protection in Maryland?
Percentage of Population Employed in Security & Protection in Maryland is 2.8%.
What is the Percentage of Population Employed in Security & Protection in the United States?
Percentage of Population Employed in Security & Protection in the United States is 2.1%.