Fairmount Heights, MD Map & Demographics
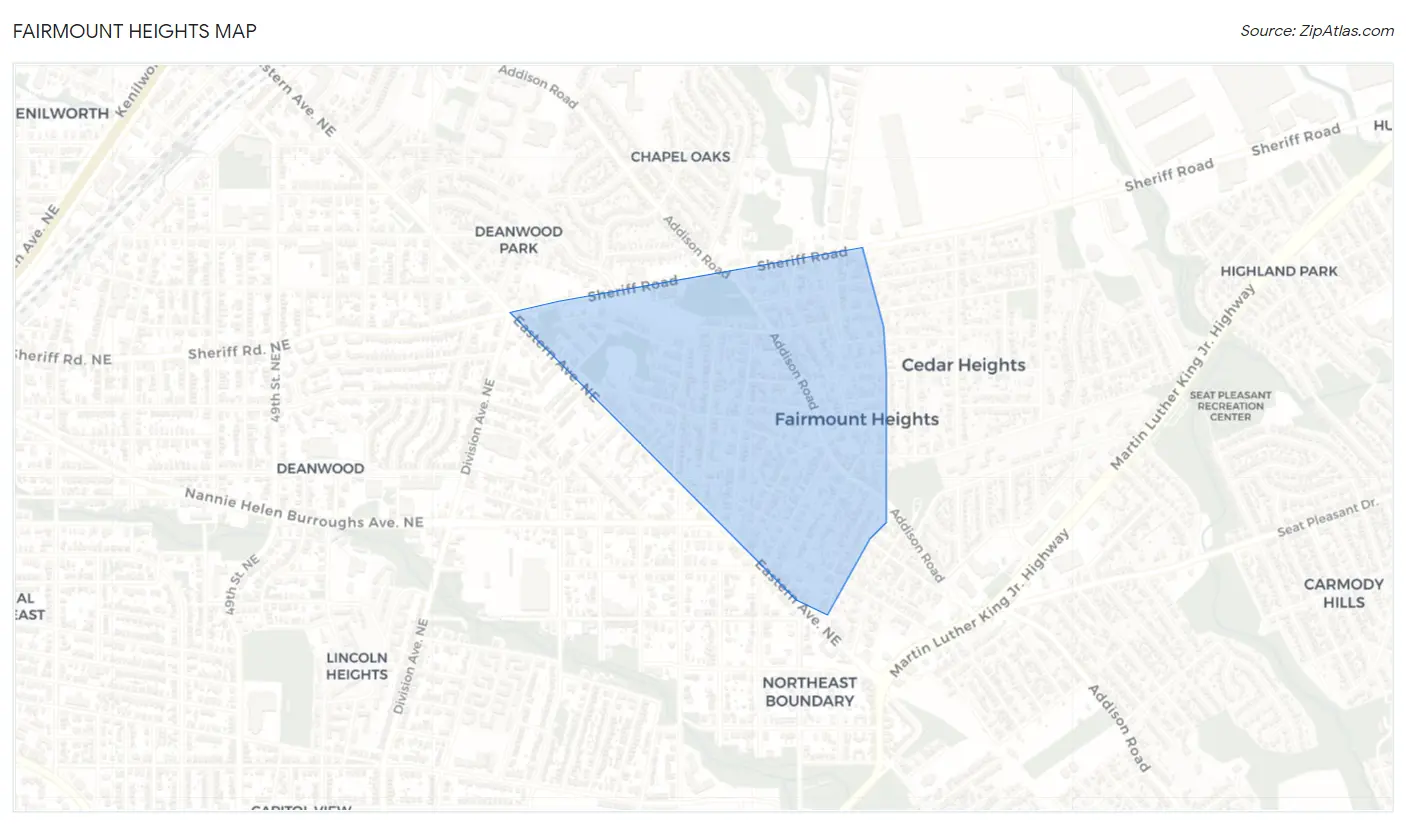
Fairmount Heights Map
Fairmount Heights Overview
$36,768
PER CAPITA INCOME
$84,750
AVG FAMILY INCOME
$74,750
AVG HOUSEHOLD INCOME
4.7%
WAGE / INCOME GAP [ % ]
95.3¢/ $1
WAGE / INCOME GAP [ $ ]
0.38
INEQUALITY / GINI INDEX
1,490
TOTAL POPULATION
751
MALE POPULATION
739
FEMALE POPULATION
101.62
MALES / 100 FEMALES
98.40
FEMALES / 100 MALES
39.2
MEDIAN AGE
3.3
AVG FAMILY SIZE
2.5
AVG HOUSEHOLD SIZE
786
LABOR FORCE [ PEOPLE ]
68.7%
PERCENT IN LABOR FORCE
7.1%
UNEMPLOYMENT RATE
Income in Fairmount Heights
Income Overview in Fairmount Heights
Per Capita Income in Fairmount Heights is $36,768, while median incomes of families and households are $84,750 and $74,750 respectively.
| Characteristic | Number | Measure |
| Per Capita Income | 1,490 | $36,768 |
| Median Family Income | 341 | $84,750 |
| Mean Family Income | 341 | $101,769 |
| Median Household Income | 586 | $74,750 |
| Mean Household Income | 586 | $92,473 |
| Income Deficit | 341 | $0 |
| Wage / Income Gap (%) | 1,490 | 4.67% |
| Wage / Income Gap ($) | 1,490 | 95.33¢ per $1 |
| Gini / Inequality Index | 1,490 | 0.38 |
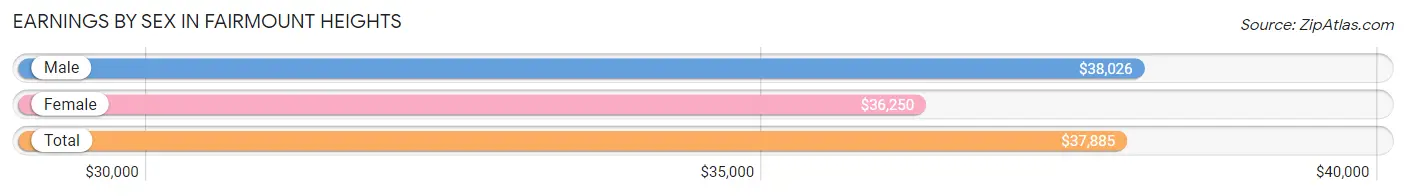
Earnings by Sex in Fairmount Heights
Average Earnings in Fairmount Heights are $37,885, $38,026 for men and $36,250 for women, a difference of 4.7%.
| Sex | Number | Average Earnings |
| Male | 446 (51.0%) | $38,026 |
| Female | 428 (49.0%) | $36,250 |
| Total | 874 (100.0%) | $37,885 |
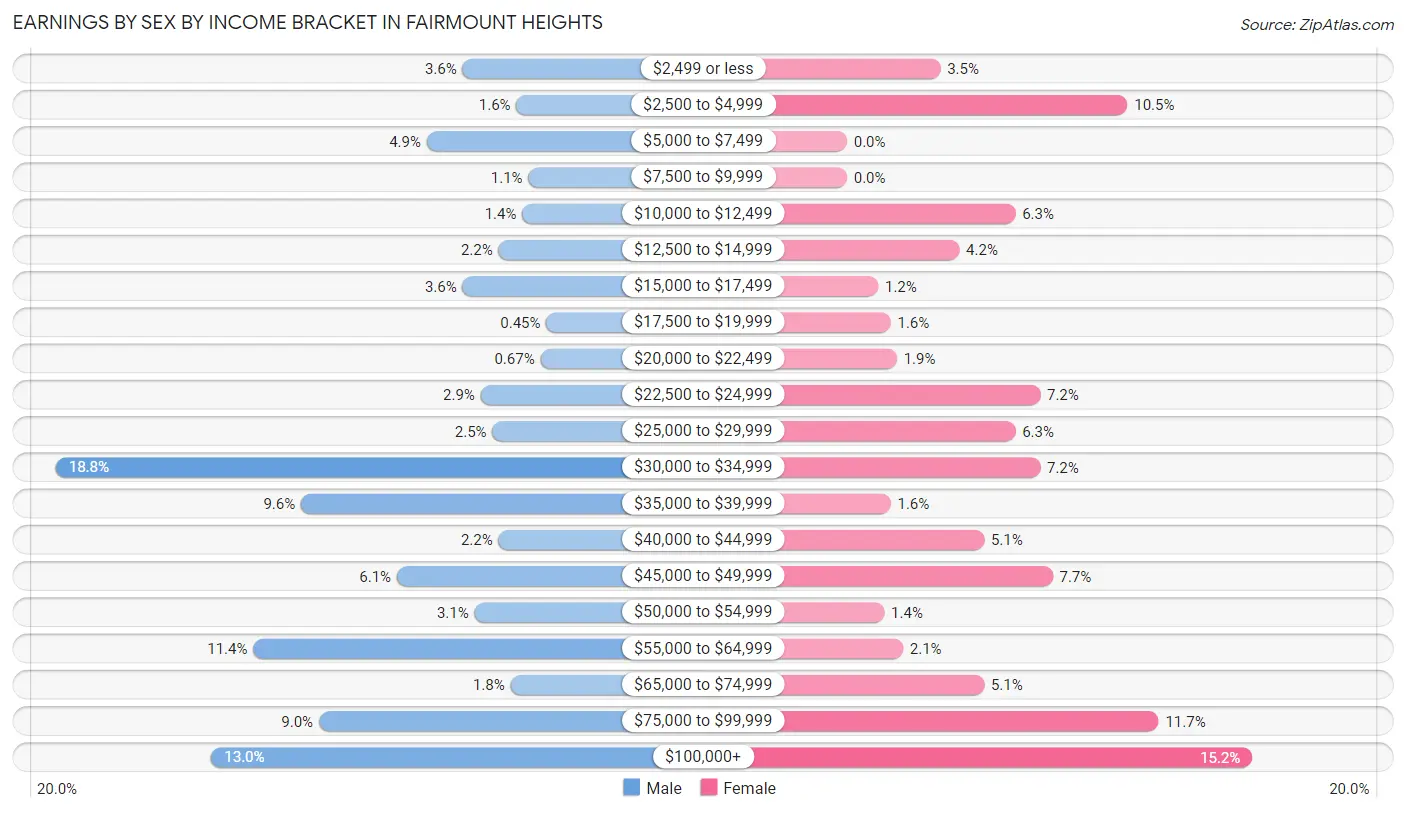
Earnings by Sex by Income Bracket in Fairmount Heights
The most common earnings brackets in Fairmount Heights are $30,000 to $34,999 for men (84 | 18.8%) and $100,000+ for women (65 | 15.2%).
| Income | Male | Female |
| $2,499 or less | 16 (3.6%) | 15 (3.5%) |
| $2,500 to $4,999 | 7 (1.6%) | 45 (10.5%) |
| $5,000 to $7,499 | 22 (4.9%) | 0 (0.0%) |
| $7,500 to $9,999 | 5 (1.1%) | 0 (0.0%) |
| $10,000 to $12,499 | 6 (1.3%) | 27 (6.3%) |
| $12,500 to $14,999 | 10 (2.2%) | 18 (4.2%) |
| $15,000 to $17,499 | 16 (3.6%) | 5 (1.2%) |
| $17,500 to $19,999 | 2 (0.4%) | 7 (1.6%) |
| $20,000 to $22,499 | 3 (0.7%) | 8 (1.9%) |
| $22,500 to $24,999 | 13 (2.9%) | 31 (7.2%) |
| $25,000 to $29,999 | 11 (2.5%) | 27 (6.3%) |
| $30,000 to $34,999 | 84 (18.8%) | 31 (7.2%) |
| $35,000 to $39,999 | 43 (9.6%) | 7 (1.6%) |
| $40,000 to $44,999 | 10 (2.2%) | 22 (5.1%) |
| $45,000 to $49,999 | 27 (6.0%) | 33 (7.7%) |
| $50,000 to $54,999 | 14 (3.1%) | 6 (1.4%) |
| $55,000 to $64,999 | 51 (11.4%) | 9 (2.1%) |
| $65,000 to $74,999 | 8 (1.8%) | 22 (5.1%) |
| $75,000 to $99,999 | 40 (9.0%) | 50 (11.7%) |
| $100,000+ | 58 (13.0%) | 65 (15.2%) |
| Total | 446 (100.0%) | 428 (100.0%) |
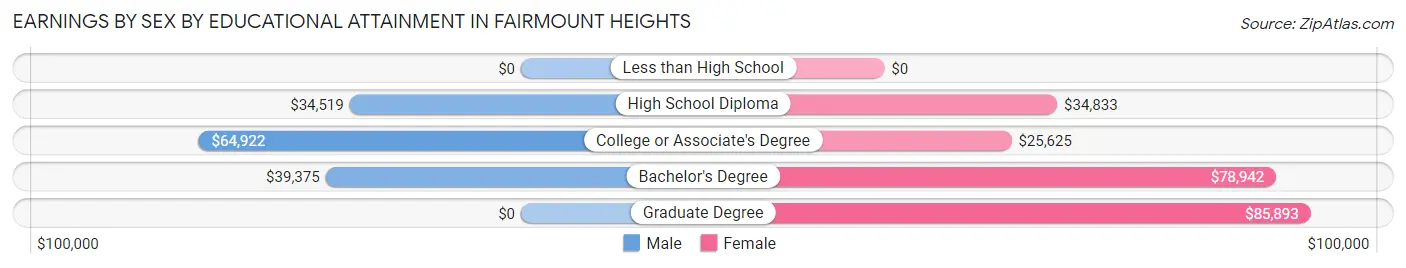
Earnings by Sex by Educational Attainment in Fairmount Heights
Average earnings in Fairmount Heights are $39,803 for men and $43,594 for women, a difference of 8.7%. Men with an educational attainment of college or associate's degree enjoy the highest average annual earnings of $64,922, while those with high school diploma education earn the least with $34,519. Women with an educational attainment of graduate degree earn the most with the average annual earnings of $85,893, while those with college or associate's degree education have the smallest earnings of $25,625.
| Educational Attainment | Male Income | Female Income |
| Less than High School | - | - |
| High School Diploma | $34,519 | $34,833 |
| College or Associate's Degree | $64,922 | $25,625 |
| Bachelor's Degree | $39,375 | $78,942 |
| Graduate Degree | - | - |
| Total | $39,803 | $43,594 |
Family Income in Fairmount Heights
Family Income Brackets in Fairmount Heights
According to the Fairmount Heights family income data, there are 77 families falling into the $50,000 to $74,999 income range, which is the most common income bracket and makes up 22.6% of all families. Conversely, the less than $10,000 income bracket is the least frequent group with only 10 families (2.9%) belonging to this category.
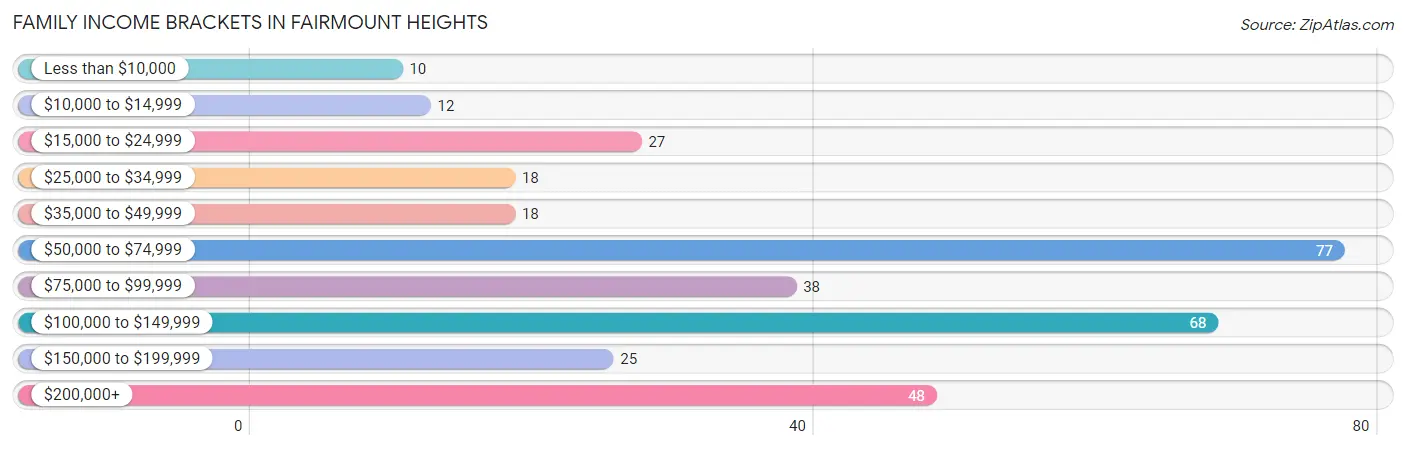
| Income Bracket | # Families | % Families |
| Less than $10,000 | 10 | 2.9% |
| $10,000 to $14,999 | 12 | 3.5% |
| $15,000 to $24,999 | 27 | 7.9% |
| $25,000 to $34,999 | 18 | 5.3% |
| $35,000 to $49,999 | 18 | 5.3% |
| $50,000 to $74,999 | 77 | 22.6% |
| $75,000 to $99,999 | 38 | 11.1% |
| $100,000 to $149,999 | 68 | 19.9% |
| $150,000 to $199,999 | 25 | 7.3% |
| $200,000+ | 48 | 14.1% |
Family Income by Famaliy Size in Fairmount Heights
2-person families (125 | 36.7%) account for the highest median family income in Fairmount Heights with $105,938 per family, while 2-person families (125 | 36.7%) have the highest median income of $52,969 per family member.
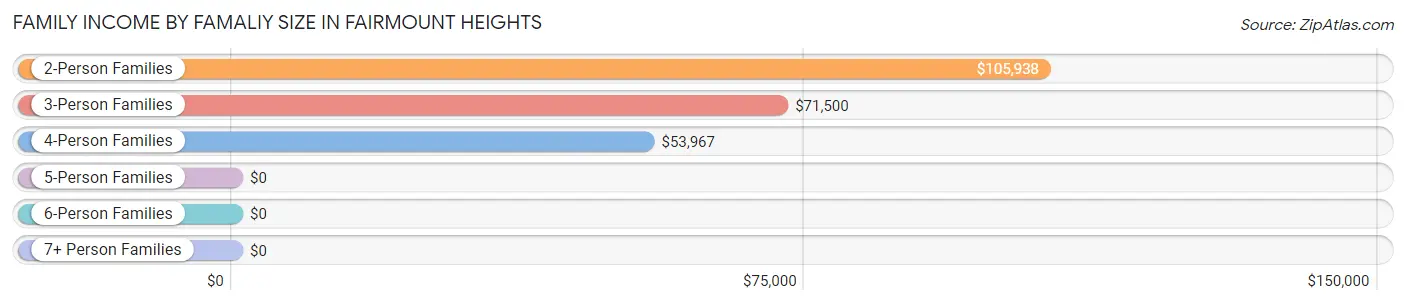
| Income Bracket | # Families | Median Income |
| 2-Person Families | 125 (36.7%) | $105,938 |
| 3-Person Families | 108 (31.7%) | $71,500 |
| 4-Person Families | 69 (20.2%) | $53,967 |
| 5-Person Families | 14 (4.1%) | $0 |
| 6-Person Families | 0 (0.0%) | $0 |
| 7+ Person Families | 25 (7.3%) | $0 |
| Total | 341 (100.0%) | $84,750 |
Family Income by Number of Earners in Fairmount Heights
The median family income in Fairmount Heights is $84,750, with families comprising 3+ earners (82) having the highest median family income of $114,000, while families with no earners (18) have the lowest median family income of $2,499, accounting for 24.0% and 5.3% of families, respectively.
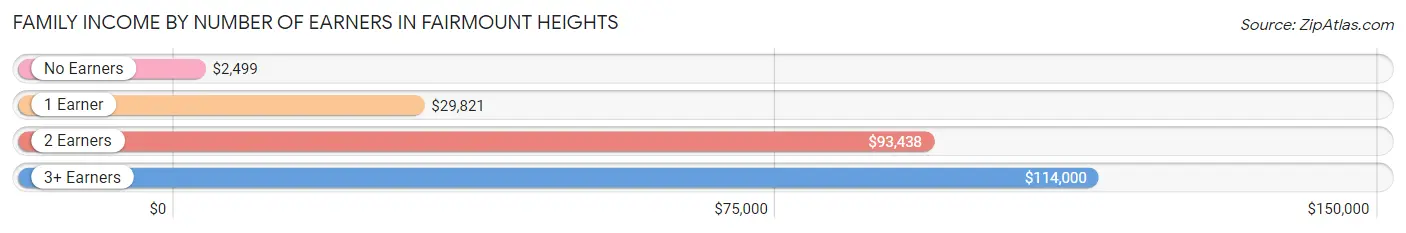
| Number of Earners | # Families | Median Income |
| No Earners | 18 (5.3%) | $2,499 |
| 1 Earner | 96 (28.1%) | $29,821 |
| 2 Earners | 145 (42.5%) | $93,438 |
| 3+ Earners | 82 (24.0%) | $114,000 |
| Total | 341 (100.0%) | $84,750 |
Household Income in Fairmount Heights
Household Income Brackets in Fairmount Heights
With 157 households falling in the category, the $50,000 to $74,999 income range is the most frequent in Fairmount Heights, accounting for 26.8% of all households. In contrast, only 14 households (2.4%) fall into the $25,000 to $34,999 income bracket, making it the least populous group.
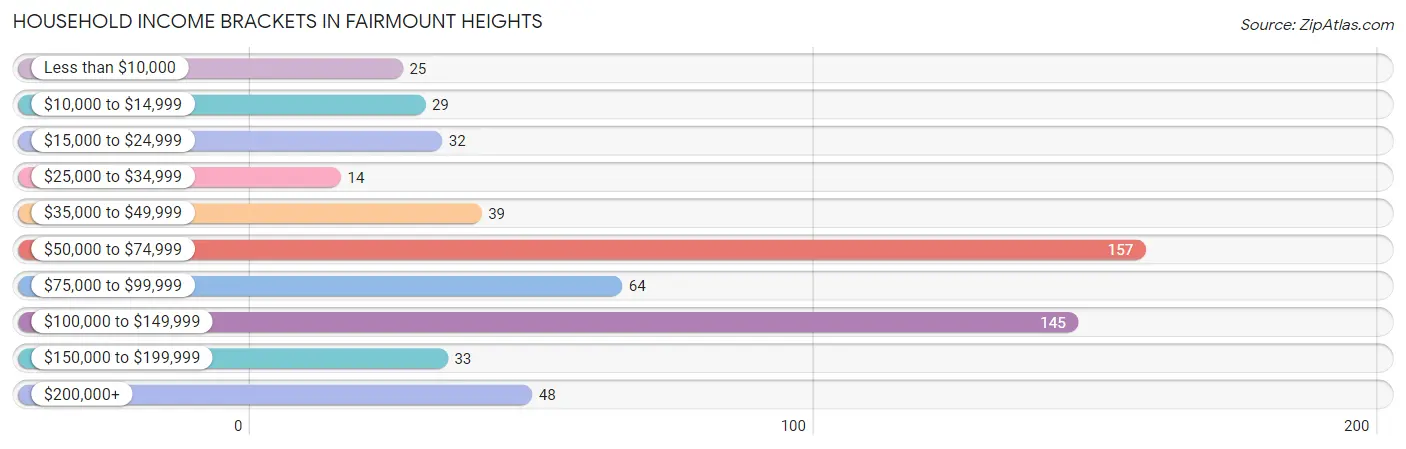
| Income Bracket | # Households | % Households |
| Less than $10,000 | 25 | 4.3% |
| $10,000 to $14,999 | 29 | 4.9% |
| $15,000 to $24,999 | 32 | 5.5% |
| $25,000 to $34,999 | 14 | 2.4% |
| $35,000 to $49,999 | 39 | 6.7% |
| $50,000 to $74,999 | 157 | 26.8% |
| $75,000 to $99,999 | 64 | 10.9% |
| $100,000 to $149,999 | 145 | 24.7% |
| $150,000 to $199,999 | 33 | 5.6% |
| $200,000+ | 48 | 8.2% |
Household Income by Householder Age in Fairmount Heights
The median household income in Fairmount Heights is $74,750, with the highest median household income of $91,667 found in the 25 to 44 years age bracket for the primary householder. A total of 154 households (26.3%) fall into this category.
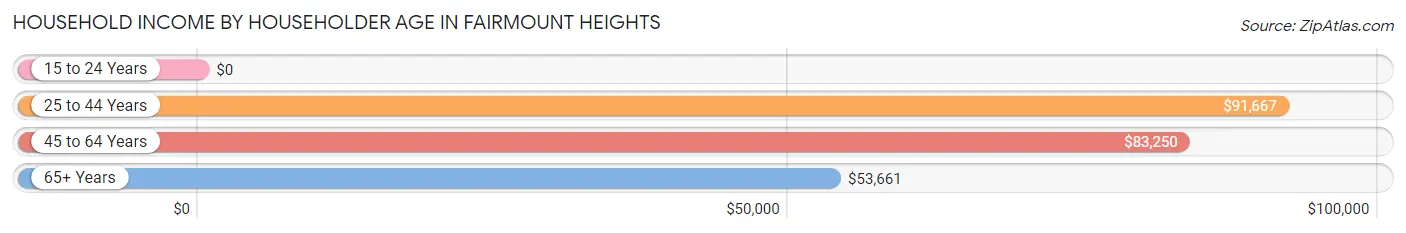
| Income Bracket | # Households | Median Income |
| 15 to 24 Years | 0 (0.0%) | $0 |
| 25 to 44 Years | 154 (26.3%) | $91,667 |
| 45 to 64 Years | 307 (52.4%) | $83,250 |
| 65+ Years | 125 (21.3%) | $53,661 |
| Total | 586 (100.0%) | $74,750 |
Poverty in Fairmount Heights
Income Below Poverty by Sex and Age in Fairmount Heights
With 19.3% poverty level for males and 24.6% for females among the residents of Fairmount Heights, 5 year old males and under 5 year old females are the most vulnerable to poverty, with 17 males (100.0%) and 71 females (100.0%) in their respective age groups living below the poverty level.
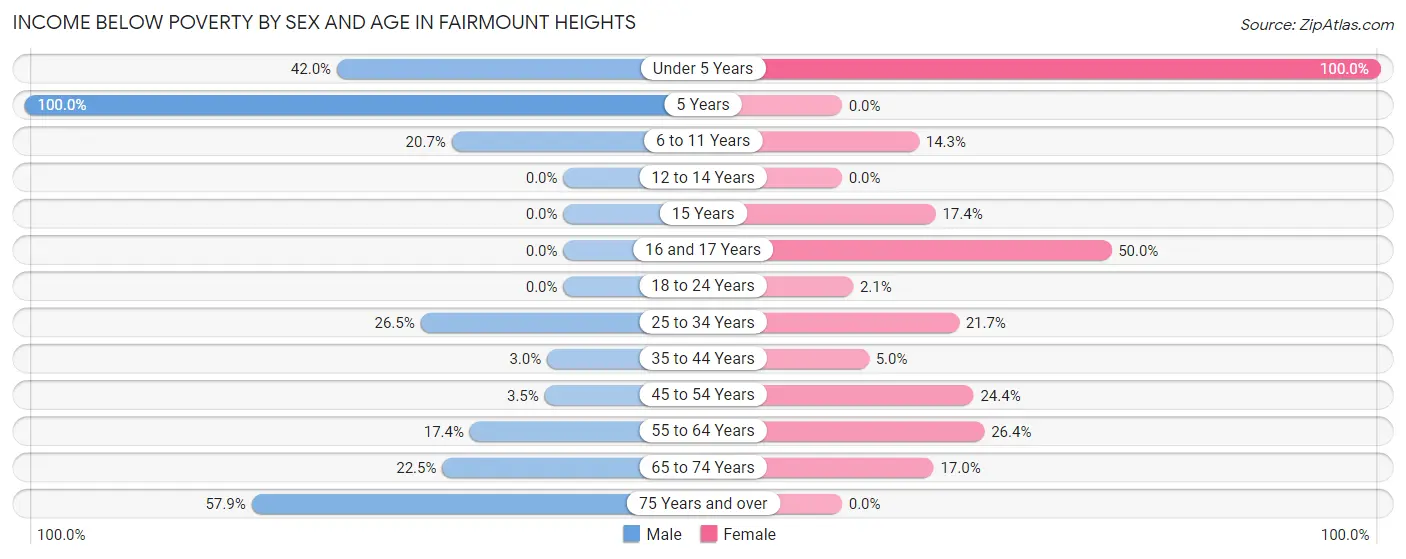
| Age Bracket | Male | Female |
| Under 5 Years | 29 (42.0%) | 71 (100.0%) |
| 5 Years | 17 (100.0%) | 0 (0.0%) |
| 6 to 11 Years | 17 (20.7%) | 8 (14.3%) |
| 12 to 14 Years | 0 (0.0%) | 0 (0.0%) |
| 15 Years | 0 (0.0%) | 4 (17.4%) |
| 16 and 17 Years | 0 (0.0%) | 5 (50.0%) |
| 18 to 24 Years | 0 (0.0%) | 1 (2.1%) |
| 25 to 34 Years | 22 (26.5%) | 23 (21.7%) |
| 35 to 44 Years | 3 (3.0%) | 5 (5.0%) |
| 45 to 54 Years | 4 (3.5%) | 33 (24.4%) |
| 55 to 64 Years | 21 (17.4%) | 23 (26.4%) |
| 65 to 74 Years | 20 (22.5%) | 8 (17.0%) |
| 75 Years and over | 11 (57.9%) | 0 (0.0%) |
| Total | 144 (19.3%) | 181 (24.6%) |
Income Above Poverty by Sex and Age in Fairmount Heights
According to the poverty statistics in Fairmount Heights, males aged 12 to 14 years and females aged 5 years are the age groups that are most secure financially, with 100.0% of males and 100.0% of females in these age groups living above the poverty line.
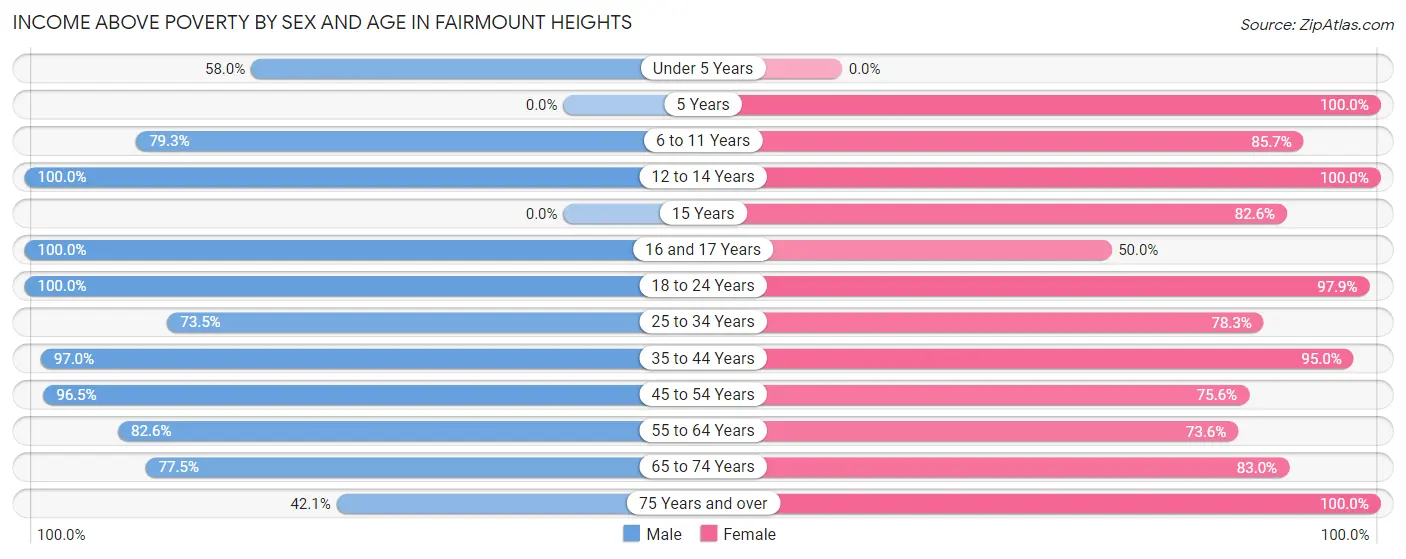
| Age Bracket | Male | Female |
| Under 5 Years | 40 (58.0%) | 0 (0.0%) |
| 5 Years | 0 (0.0%) | 5 (100.0%) |
| 6 to 11 Years | 65 (79.3%) | 48 (85.7%) |
| 12 to 14 Years | 17 (100.0%) | 6 (100.0%) |
| 15 Years | 0 (0.0%) | 19 (82.6%) |
| 16 and 17 Years | 23 (100.0%) | 5 (50.0%) |
| 18 to 24 Years | 13 (100.0%) | 47 (97.9%) |
| 25 to 34 Years | 61 (73.5%) | 83 (78.3%) |
| 35 to 44 Years | 96 (97.0%) | 95 (95.0%) |
| 45 to 54 Years | 111 (96.5%) | 102 (75.6%) |
| 55 to 64 Years | 100 (82.6%) | 64 (73.6%) |
| 65 to 74 Years | 69 (77.5%) | 39 (83.0%) |
| 75 Years and over | 8 (42.1%) | 43 (100.0%) |
| Total | 603 (80.7%) | 556 (75.4%) |
Income Below Poverty Among Married-Couple Families in Fairmount Heights
The poverty statistics for married-couple families in Fairmount Heights show that 11.5% or 26 of the total 226 families live below the poverty line. Families with 1 or 2 children have the highest poverty rate of 36.2%, comprising of 21 families. On the other hand, families with 3 or 4 children have the lowest poverty rate of 0.0%, which includes 0 families.
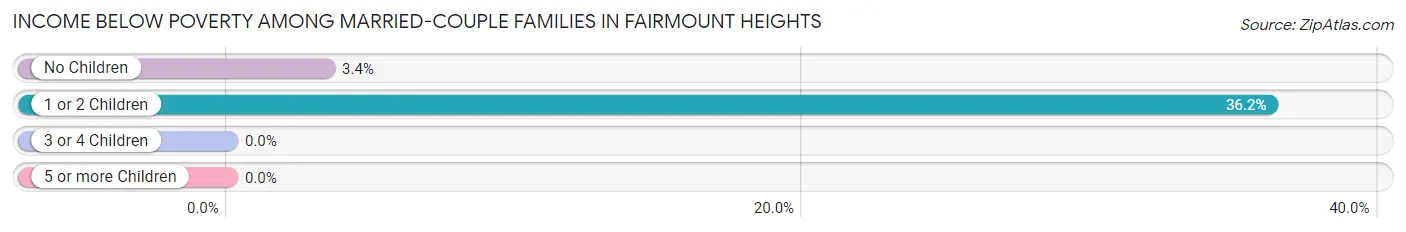
| Children | Above Poverty | Below Poverty |
| No Children | 143 (96.6%) | 5 (3.4%) |
| 1 or 2 Children | 37 (63.8%) | 21 (36.2%) |
| 3 or 4 Children | 20 (100.0%) | 0 (0.0%) |
| 5 or more Children | 0 (0.0%) | 0 (0.0%) |
| Total | 200 (88.5%) | 26 (11.5%) |
Income Below Poverty Among Single-Parent Households in Fairmount Heights
According to the poverty data in Fairmount Heights, 41.9% or 13 single-father households and 22.6% or 19 single-mother households are living below the poverty line. Among single-father households, those with 1 or 2 children have the highest poverty rate, with 13 households (68.4%) experiencing poverty. Likewise, among single-mother households, those with 1 or 2 children have the highest poverty rate, with 12 households (46.2%) falling below the poverty line.
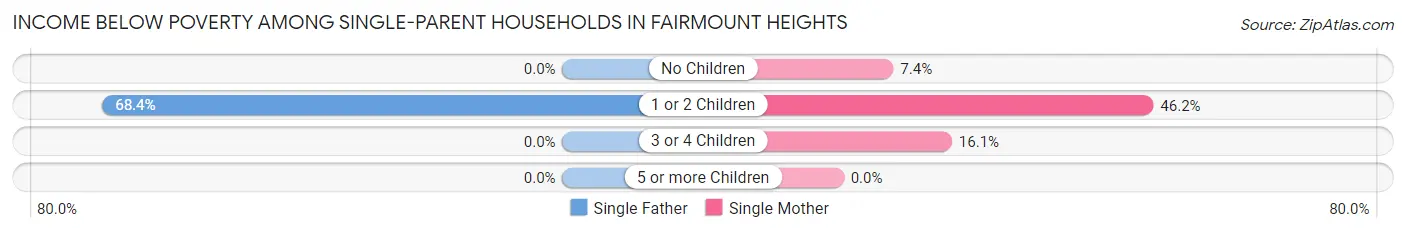
| Children | Single Father | Single Mother |
| No Children | 0 (0.0%) | 2 (7.4%) |
| 1 or 2 Children | 13 (68.4%) | 12 (46.2%) |
| 3 or 4 Children | 0 (0.0%) | 5 (16.1%) |
| 5 or more Children | 0 (0.0%) | 0 (0.0%) |
| Total | 13 (41.9%) | 19 (22.6%) |
Income Below Poverty Among Married-Couple vs Single-Parent Households in Fairmount Heights
The poverty data for Fairmount Heights shows that 26 of the married-couple family households (11.5%) and 32 of the single-parent households (27.8%) are living below the poverty level. Within the married-couple family households, those with 1 or 2 children have the highest poverty rate, with 21 households (36.2%) falling below the poverty line. Among the single-parent households, those with 1 or 2 children have the highest poverty rate, with 25 household (55.6%) living below poverty.
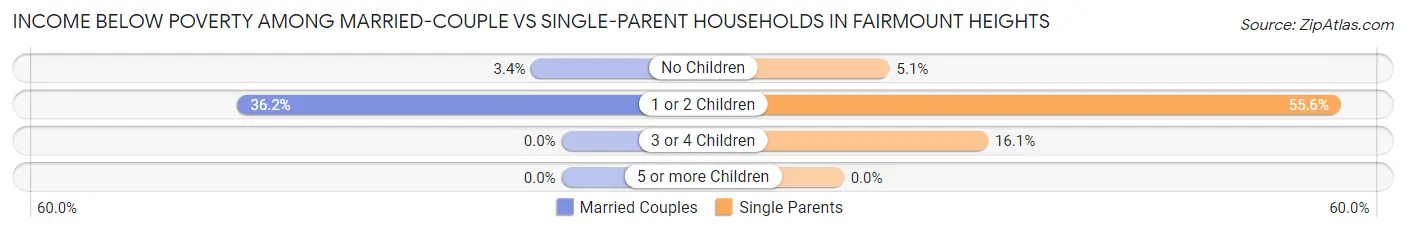
| Children | Married-Couple Families | Single-Parent Households |
| No Children | 5 (3.4%) | 2 (5.1%) |
| 1 or 2 Children | 21 (36.2%) | 25 (55.6%) |
| 3 or 4 Children | 0 (0.0%) | 5 (16.1%) |
| 5 or more Children | 0 (0.0%) | 0 (0.0%) |
| Total | 26 (11.5%) | 32 (27.8%) |
Race in Fairmount Heights
The most populous races in Fairmount Heights are Black / African American (919 | 61.7%), Hispanic or Latino (364 | 24.4%), and Some other Race (324 | 21.7%).
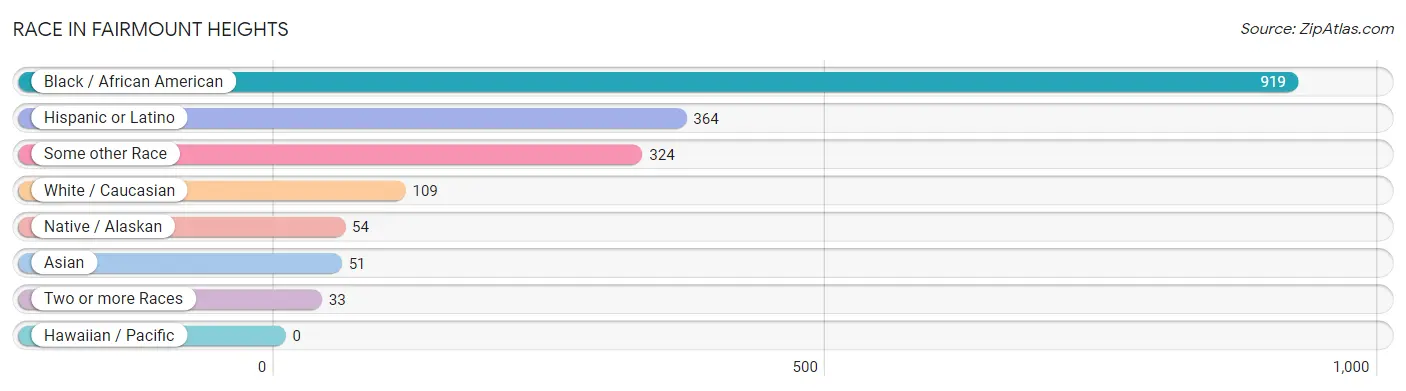
| Race | # Population | % Population |
| Asian | 51 | 3.4% |
| Black / African American | 919 | 61.7% |
| Hawaiian / Pacific | 0 | 0.0% |
| Hispanic or Latino | 364 | 24.4% |
| Native / Alaskan | 54 | 3.6% |
| White / Caucasian | 109 | 7.3% |
| Two or more Races | 33 | 2.2% |
| Some other Race | 324 | 21.7% |
| Total | 1,490 | 100.0% |
Ancestry in Fairmount Heights
The most populous ancestries reported in Fairmount Heights are Mexican (209 | 14.0%), Central American (139 | 9.3%), Salvadoran (89 | 6.0%), Subsaharan African (75 | 5.0%), and American (70 | 4.7%), together accounting for 39.1% of all Fairmount Heights residents.
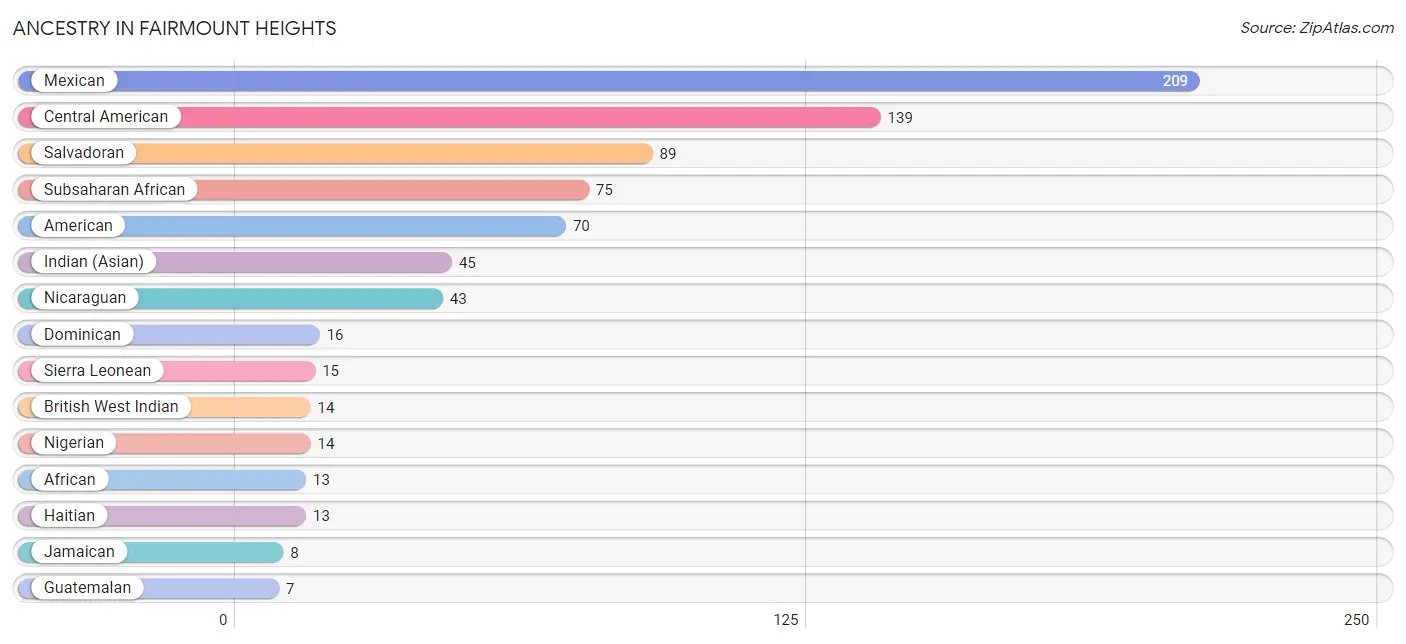
| Ancestry | # Population | % Population |
| African | 13 | 0.9% |
| American | 70 | 4.7% |
| British West Indian | 14 | 0.9% |
| Central American | 139 | 9.3% |
| Dominican | 16 | 1.1% |
| Guatemalan | 7 | 0.5% |
| Haitian | 13 | 0.9% |
| Indian (Asian) | 45 | 3.0% |
| Jamaican | 8 | 0.5% |
| Korean | 6 | 0.4% |
| Mexican | 209 | 14.0% |
| Nicaraguan | 43 | 2.9% |
| Nigerian | 14 | 0.9% |
| Salvadoran | 89 | 6.0% |
| Sierra Leonean | 15 | 1.0% |
| Subsaharan African | 75 | 5.0% |
| Trinidadian and Tobagonian | 7 | 0.5% | View All 17 Rows |
Immigrants in Fairmount Heights
The most numerous immigrant groups reported in Fairmount Heights came from Latin America (216 | 14.5%), Central America (165 | 11.1%), Mexico (88 | 5.9%), Africa (79 | 5.3%), and Asia (51 | 3.4%), together accounting for 40.2% of all Fairmount Heights residents.
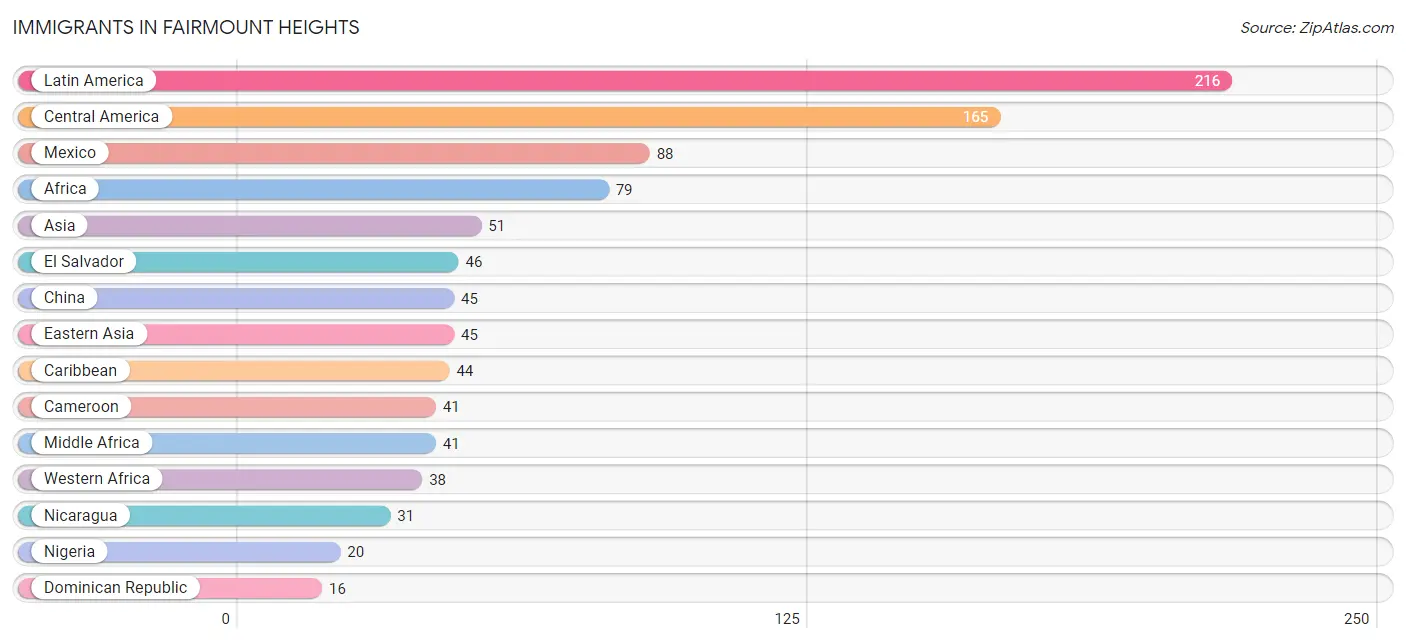
| Immigration Origin | # Population | % Population |
| Africa | 79 | 5.3% |
| Asia | 51 | 3.4% |
| Cameroon | 41 | 2.8% |
| Caribbean | 44 | 2.9% |
| Central America | 165 | 11.1% |
| China | 45 | 3.0% |
| Dominican Republic | 16 | 1.1% |
| Eastern Asia | 45 | 3.0% |
| El Salvador | 46 | 3.1% |
| Ghana | 3 | 0.2% |
| Grenada | 14 | 0.9% |
| Guyana | 7 | 0.5% |
| Haiti | 13 | 0.9% |
| Jamaica | 1 | 0.1% |
| Latin America | 216 | 14.5% |
| Mexico | 88 | 5.9% |
| Middle Africa | 41 | 2.8% |
| Nicaragua | 31 | 2.1% |
| Nigeria | 20 | 1.3% |
| Philippines | 6 | 0.4% |
| Sierra Leone | 15 | 1.0% |
| South America | 7 | 0.5% |
| South Eastern Asia | 6 | 0.4% |
| Western Africa | 38 | 2.5% | View All 24 Rows |
Sex and Age in Fairmount Heights
Sex and Age in Fairmount Heights
The most populous age groups in Fairmount Heights are 35 to 39 Years (89 | 11.8%) for men and 50 to 54 Years (75 | 10.2%) for women.
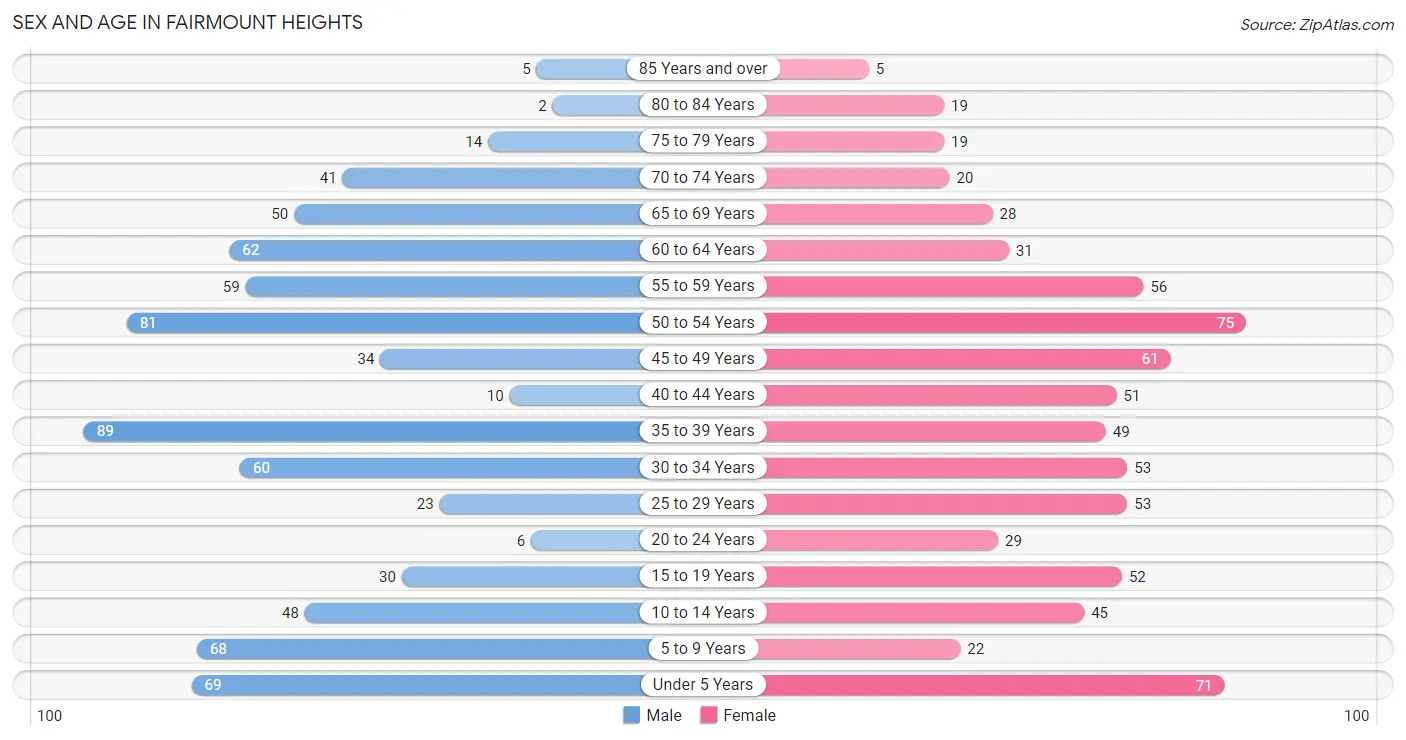
| Age Bracket | Male | Female |
| Under 5 Years | 69 (9.2%) | 71 (9.6%) |
| 5 to 9 Years | 68 (9.0%) | 22 (3.0%) |
| 10 to 14 Years | 48 (6.4%) | 45 (6.1%) |
| 15 to 19 Years | 30 (4.0%) | 52 (7.0%) |
| 20 to 24 Years | 6 (0.8%) | 29 (3.9%) |
| 25 to 29 Years | 23 (3.1%) | 53 (7.2%) |
| 30 to 34 Years | 60 (8.0%) | 53 (7.2%) |
| 35 to 39 Years | 89 (11.8%) | 49 (6.6%) |
| 40 to 44 Years | 10 (1.3%) | 51 (6.9%) |
| 45 to 49 Years | 34 (4.5%) | 61 (8.3%) |
| 50 to 54 Years | 81 (10.8%) | 75 (10.2%) |
| 55 to 59 Years | 59 (7.9%) | 56 (7.6%) |
| 60 to 64 Years | 62 (8.3%) | 31 (4.2%) |
| 65 to 69 Years | 50 (6.7%) | 28 (3.8%) |
| 70 to 74 Years | 41 (5.5%) | 20 (2.7%) |
| 75 to 79 Years | 14 (1.9%) | 19 (2.6%) |
| 80 to 84 Years | 2 (0.3%) | 19 (2.6%) |
| 85 Years and over | 5 (0.7%) | 5 (0.7%) |
| Total | 751 (100.0%) | 739 (100.0%) |
Families and Households in Fairmount Heights
Median Family Size in Fairmount Heights
The median family size in Fairmount Heights is 3.32 persons per family, with single female/mother families (84 | 24.6%) accounting for the largest median family size of 3.58 persons per family. On the other hand, single male/father families (31 | 9.1%) represent the smallest median family size with 2.97 persons per family.
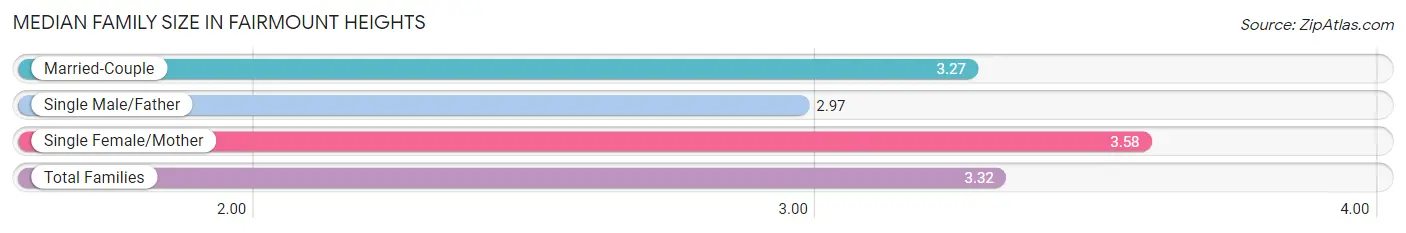
| Family Type | # Families | Family Size |
| Married-Couple | 226 (66.3%) | 3.27 |
| Single Male/Father | 31 (9.1%) | 2.97 |
| Single Female/Mother | 84 (24.6%) | 3.58 |
| Total Families | 341 (100.0%) | 3.32 |
Median Household Size in Fairmount Heights
The median household size in Fairmount Heights is 2.53 persons per household, with single female/mother households (84 | 14.3%) accounting for the largest median household size of 3.74 persons per household. non-family households (245 | 41.8%) represent the smallest median household size with 1.20 persons per household.
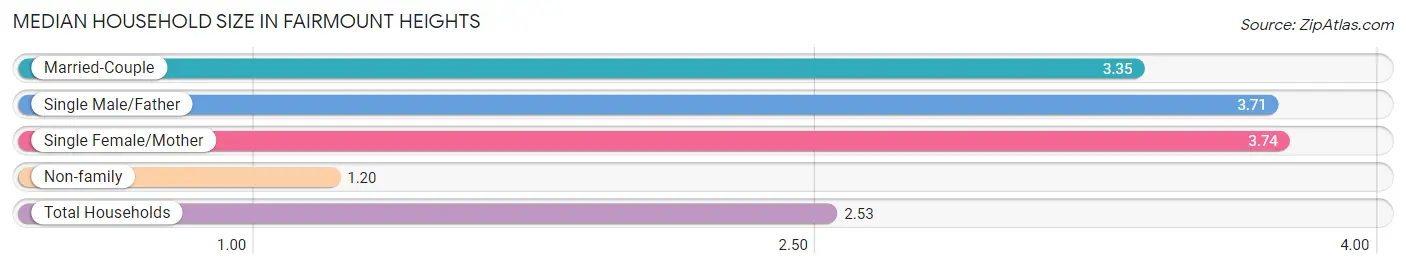
| Household Type | # Households | Household Size |
| Married-Couple | 226 (38.6%) | 3.35 |
| Single Male/Father | 31 (5.3%) | 3.71 |
| Single Female/Mother | 84 (14.3%) | 3.74 |
| Non-family | 245 (41.8%) | 1.20 |
| Total Households | 586 (100.0%) | 2.53 |
Household Size by Marriage Status in Fairmount Heights
Out of a total of 586 households in Fairmount Heights, 341 (58.2%) are family households, while 245 (41.8%) are nonfamily households. The most numerous type of family households are 2-person households, comprising 112, and the most common type of nonfamily households are 1-person households, comprising 208.
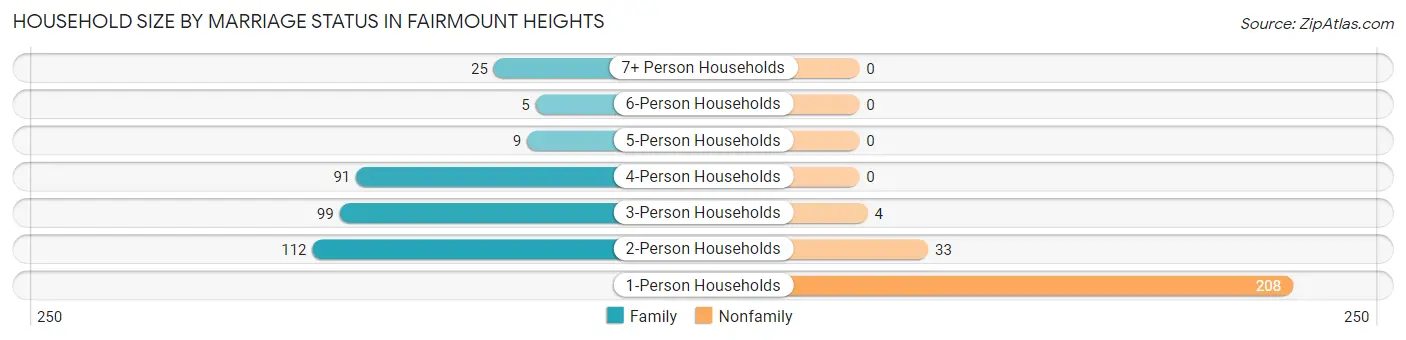
| Household Size | Family Households | Nonfamily Households |
| 1-Person Households | - | 208 (35.5%) |
| 2-Person Households | 112 (19.1%) | 33 (5.6%) |
| 3-Person Households | 99 (16.9%) | 4 (0.7%) |
| 4-Person Households | 91 (15.5%) | 0 (0.0%) |
| 5-Person Households | 9 (1.5%) | 0 (0.0%) |
| 6-Person Households | 5 (0.9%) | 0 (0.0%) |
| 7+ Person Households | 25 (4.3%) | 0 (0.0%) |
| Total | 341 (58.2%) | 245 (41.8%) |
Female Fertility in Fairmount Heights
Fertility by Age in Fairmount Heights
Average fertility rate in Fairmount Heights is 116.0 births per 1,000 women. Women in the age bracket of 20 to 34 years have the highest fertility rate with 215.0 births per 1,000 women. Women in the age bracket of 20 to 34 years acount for 69.1% of all women with births.
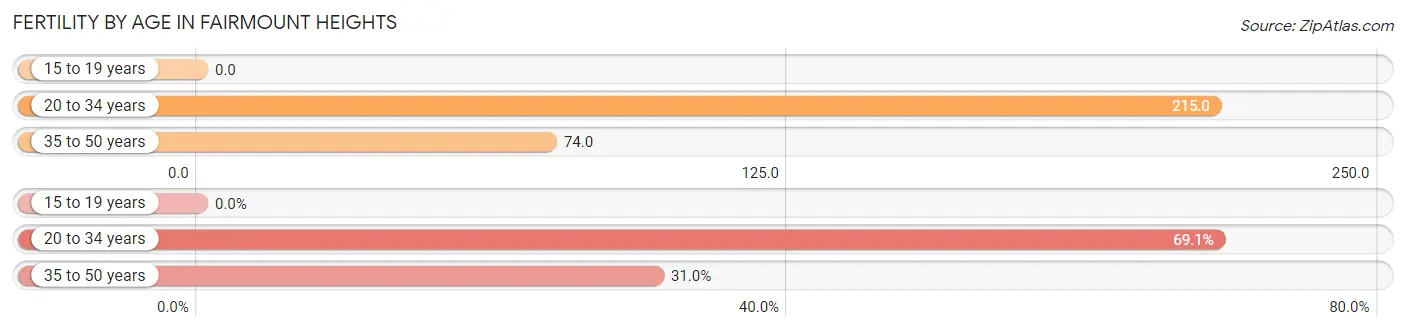
| Age Bracket | Women with Births | Births / 1,000 Women |
| 15 to 19 years | 0 (0.0%) | 0.0 |
| 20 to 34 years | 29 (69.1%) | 215.0 |
| 35 to 50 years | 13 (30.9%) | 74.0 |
| Total | 42 (100.0%) | 116.0 |
Fertility by Age by Marriage Status in Fairmount Heights
66.7% of women with births (42) in Fairmount Heights are married. The highest percentage of unmarried women with births falls into 20 to 34 years age bracket with 48.3% of them unmarried at the time of birth, while the lowest percentage of unmarried women with births belong to 35 to 50 years age bracket with 0.0% of them unmarried.
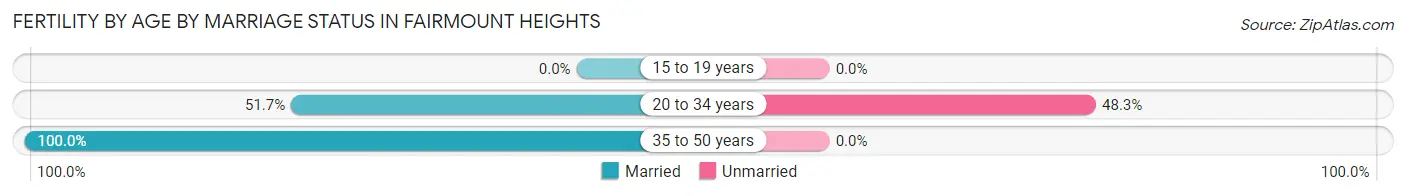
| Age Bracket | Married | Unmarried |
| 15 to 19 years | 0 (0.0%) | 0 (0.0%) |
| 20 to 34 years | 15 (51.7%) | 14 (48.3%) |
| 35 to 50 years | 13 (100.0%) | 0 (0.0%) |
| Total | 28 (66.7%) | 14 (33.3%) |
Fertility by Education in Fairmount Heights
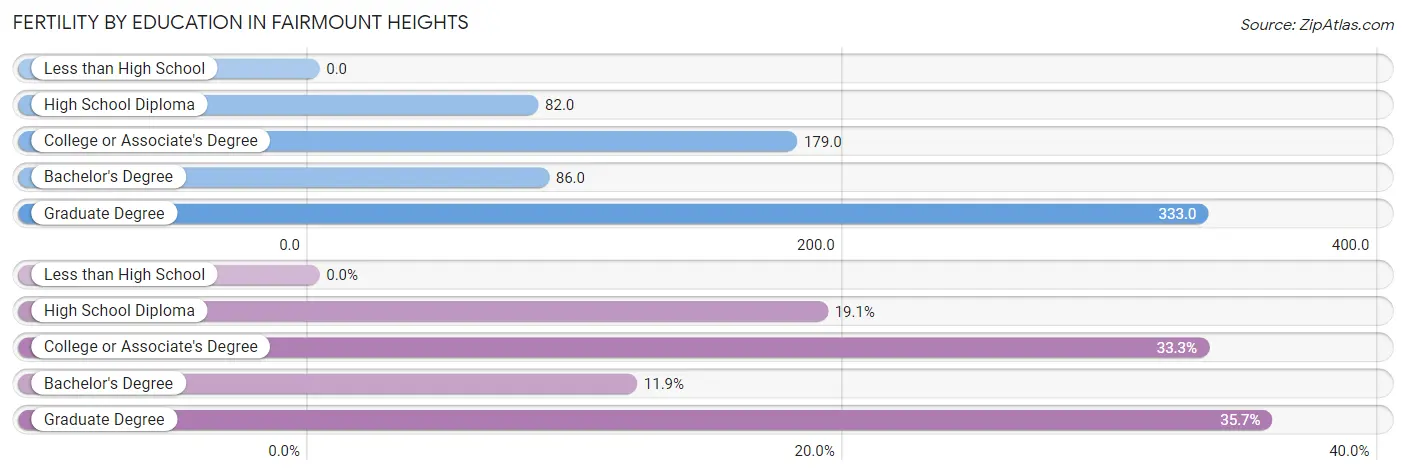
| Educational Attainment | Women with Births | Births / 1,000 Women |
| Less than High School | 0 (0.0%) | 0.0 |
| High School Diploma | 8 (19.1%) | 82.0 |
| College or Associate's Degree | 14 (33.3%) | 179.0 |
| Bachelor's Degree | 5 (11.9%) | 86.0 |
| Graduate Degree | 15 (35.7%) | 333.0 |
| Total | 42 (100.0%) | 116.0 |
Fertility by Education by Marriage Status in Fairmount Heights
33.3% of women with births in Fairmount Heights are unmarried. Women with the educational attainment of high school diploma are most likely to be married with 100.0% of them married at childbirth, while women with the educational attainment of college or associate's degree are least likely to be married with 100.0% of them unmarried at childbirth.
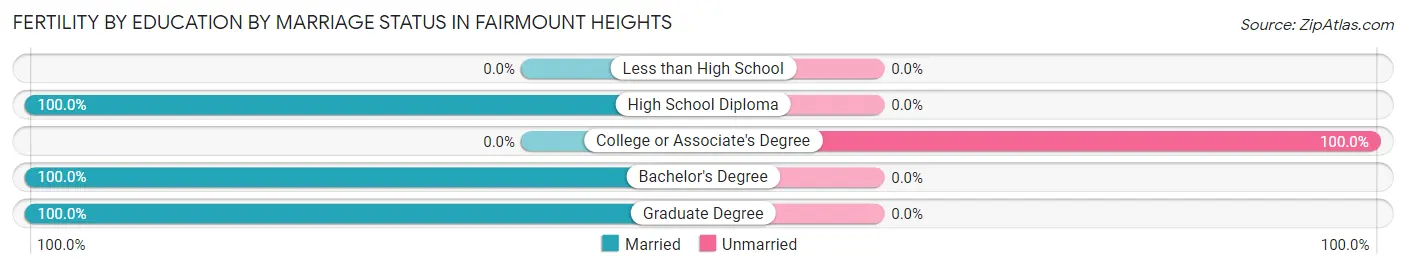
| Educational Attainment | Married | Unmarried |
| Less than High School | 0 (0.0%) | 0 (0.0%) |
| High School Diploma | 8 (100.0%) | 0 (0.0%) |
| College or Associate's Degree | 0 (0.0%) | 14 (100.0%) |
| Bachelor's Degree | 5 (100.0%) | 0 (0.0%) |
| Graduate Degree | 15 (100.0%) | 0 (0.0%) |
| Total | 28 (66.7%) | 14 (33.3%) |
Employment Characteristics in Fairmount Heights
Employment by Class of Employer in Fairmount Heights
Among the 690 employed individuals in Fairmount Heights, private company employees (437 | 63.3%), federal government employees (82 | 11.9%), and not-for-profit organizations (78 | 11.3%) make up the most common classes of employment.
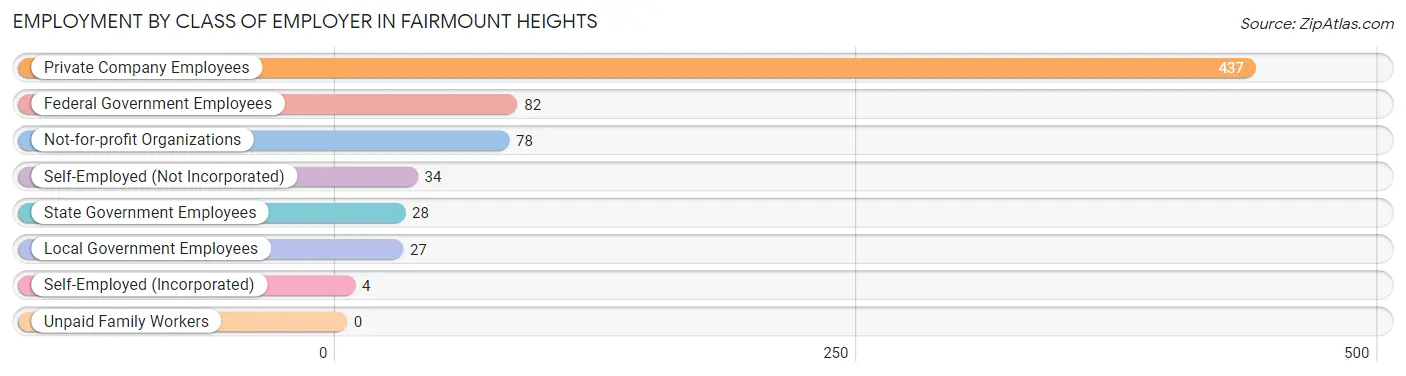
| Employer Class | # Employees | % Employees |
| Private Company Employees | 437 | 63.3% |
| Self-Employed (Incorporated) | 4 | 0.6% |
| Self-Employed (Not Incorporated) | 34 | 4.9% |
| Not-for-profit Organizations | 78 | 11.3% |
| Local Government Employees | 27 | 3.9% |
| State Government Employees | 28 | 4.1% |
| Federal Government Employees | 82 | 11.9% |
| Unpaid Family Workers | 0 | 0.0% |
| Total | 690 | 100.0% |
Employment Status by Age in Fairmount Heights
According to the labor force statistics for Fairmount Heights, out of the total population over 16 years of age (1,144), 68.7% or 786 individuals are in the labor force, with 7.1% or 56 of them unemployed. The age group with the highest labor force participation rate is 30 to 34 years, with 95.6% or 108 individuals in the labor force. Within the labor force, the 16 to 19 years age range has the highest percentage of unemployed individuals, with 100.0% or 21 of them being unemployed.
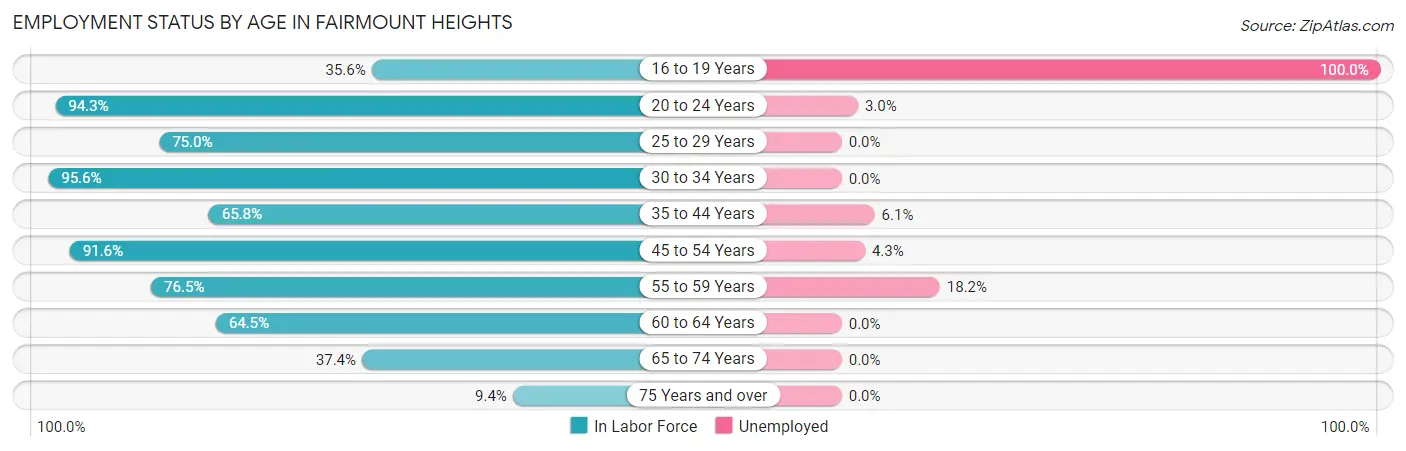
| Age Bracket | In Labor Force | Unemployed |
| 16 to 19 Years | 21 (35.6%) | 21 (100.0%) |
| 20 to 24 Years | 33 (94.3%) | 1 (3.0%) |
| 25 to 29 Years | 57 (75.0%) | 0 (0.0%) |
| 30 to 34 Years | 108 (95.6%) | 0 (0.0%) |
| 35 to 44 Years | 131 (65.8%) | 8 (6.1%) |
| 45 to 54 Years | 230 (91.6%) | 10 (4.3%) |
| 55 to 59 Years | 88 (76.5%) | 16 (18.2%) |
| 60 to 64 Years | 60 (64.5%) | 0 (0.0%) |
| 65 to 74 Years | 52 (37.4%) | 0 (0.0%) |
| 75 Years and over | 6 (9.4%) | 0 (0.0%) |
| Total | 786 (68.7%) | 56 (7.1%) |
Employment Status by Educational Attainment in Fairmount Heights
According to labor force statistics for Fairmount Heights, 79.6% of individuals (674) out of the total population between 25 and 64 years of age (847) are in the labor force, with 5.0% or 34 of them being unemployed. The group with the highest labor force participation rate are those with the educational attainment of college / associate degree, with 88.4% or 206 individuals in the labor force. Within the labor force, individuals with less than high school education have the highest percentage of unemployment, with 17.9% or 15 of them being unemployed.
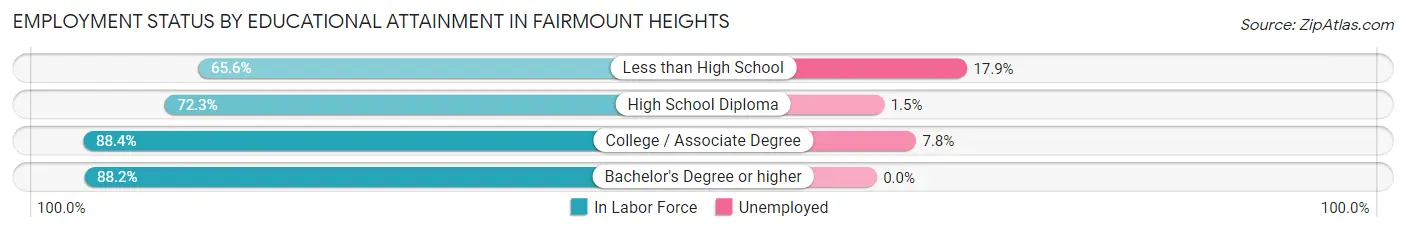
| Educational Attainment | In Labor Force | Unemployed |
| Less than High School | 84 (65.6%) | 23 (17.9%) |
| High School Diploma | 204 (72.3%) | 4 (1.5%) |
| College / Associate Degree | 206 (88.4%) | 18 (7.8%) |
| Bachelor's Degree or higher | 180 (88.2%) | 0 (0.0%) |
| Total | 674 (79.6%) | 42 (5.0%) |
Employment Occupations by Sex in Fairmount Heights
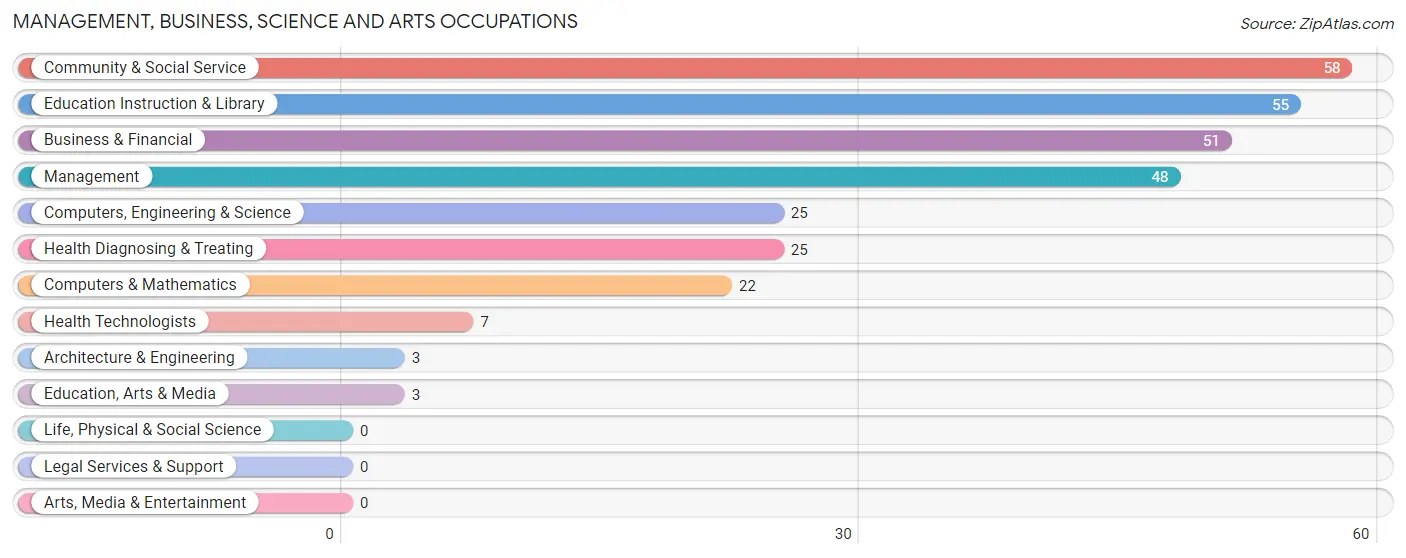
Management, Business, Science and Arts Occupations
The most common Management, Business, Science and Arts occupations in Fairmount Heights are Community & Social Service (58 | 8.0%), Education Instruction & Library (55 | 7.5%), Business & Financial (51 | 7.0%), Management (48 | 6.6%), and Computers, Engineering & Science (25 | 3.4%).
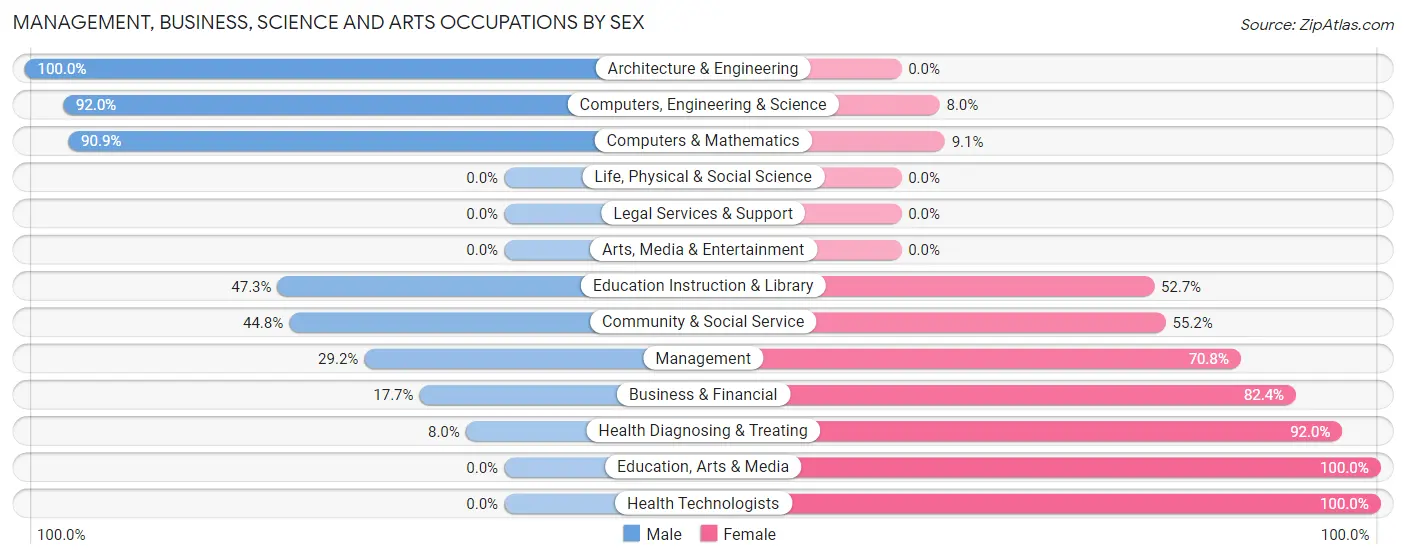
Management, Business, Science and Arts Occupations by Sex
Within the Management, Business, Science and Arts occupations in Fairmount Heights, the most male-oriented occupations are Architecture & Engineering (100.0%), Computers, Engineering & Science (92.0%), and Computers & Mathematics (90.9%), while the most female-oriented occupations are Education, Arts & Media (100.0%), Health Technologists (100.0%), and Health Diagnosing & Treating (92.0%).
| Occupation | Male | Female |
| Management | 14 (29.2%) | 34 (70.8%) |
| Business & Financial | 9 (17.6%) | 42 (82.4%) |
| Computers, Engineering & Science | 23 (92.0%) | 2 (8.0%) |
| Computers & Mathematics | 20 (90.9%) | 2 (9.1%) |
| Architecture & Engineering | 3 (100.0%) | 0 (0.0%) |
| Life, Physical & Social Science | 0 (0.0%) | 0 (0.0%) |
| Community & Social Service | 26 (44.8%) | 32 (55.2%) |
| Education, Arts & Media | 0 (0.0%) | 3 (100.0%) |
| Legal Services & Support | 0 (0.0%) | 0 (0.0%) |
| Education Instruction & Library | 26 (47.3%) | 29 (52.7%) |
| Arts, Media & Entertainment | 0 (0.0%) | 0 (0.0%) |
| Health Diagnosing & Treating | 2 (8.0%) | 23 (92.0%) |
| Health Technologists | 0 (0.0%) | 7 (100.0%) |
| Total (Category) | 74 (35.7%) | 133 (64.2%) |
| Total (Overall) | 337 (46.2%) | 393 (53.8%) |
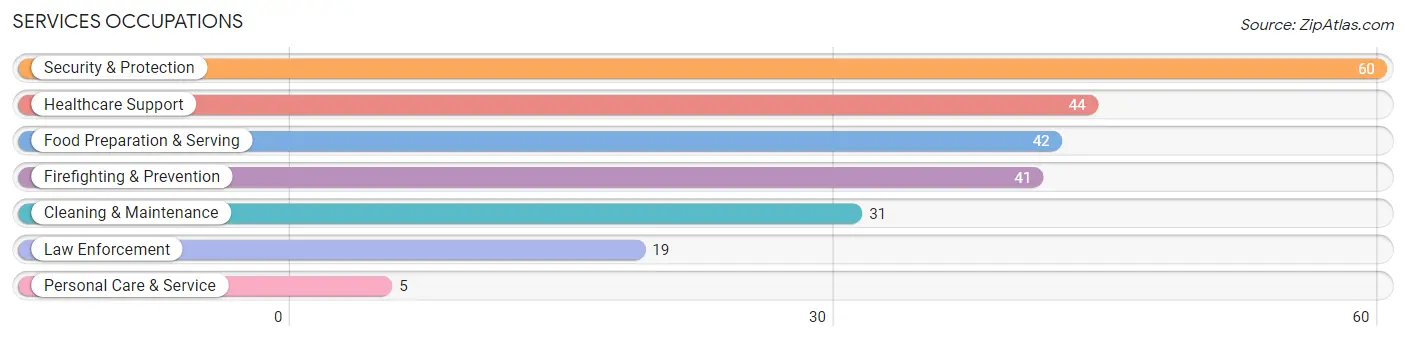
Services Occupations
The most common Services occupations in Fairmount Heights are Security & Protection (60 | 8.2%), Healthcare Support (44 | 6.0%), Food Preparation & Serving (42 | 5.8%), Firefighting & Prevention (41 | 5.6%), and Cleaning & Maintenance (31 | 4.3%).
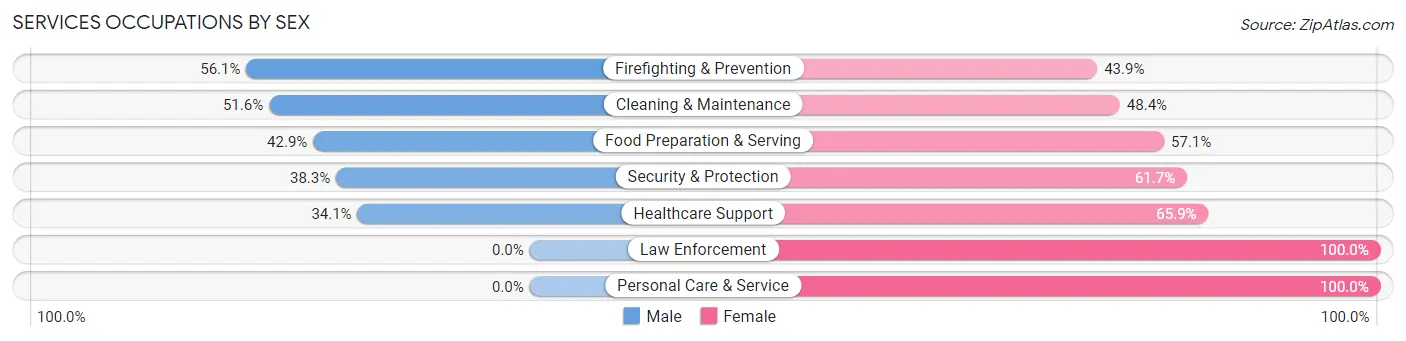
Services Occupations by Sex
Within the Services occupations in Fairmount Heights, the most male-oriented occupations are Firefighting & Prevention (56.1%), Cleaning & Maintenance (51.6%), and Food Preparation & Serving (42.9%), while the most female-oriented occupations are Law Enforcement (100.0%), Personal Care & Service (100.0%), and Healthcare Support (65.9%).
| Occupation | Male | Female |
| Healthcare Support | 15 (34.1%) | 29 (65.9%) |
| Security & Protection | 23 (38.3%) | 37 (61.7%) |
| Firefighting & Prevention | 23 (56.1%) | 18 (43.9%) |
| Law Enforcement | 0 (0.0%) | 19 (100.0%) |
| Food Preparation & Serving | 18 (42.9%) | 24 (57.1%) |
| Cleaning & Maintenance | 16 (51.6%) | 15 (48.4%) |
| Personal Care & Service | 0 (0.0%) | 5 (100.0%) |
| Total (Category) | 72 (39.6%) | 110 (60.4%) |
| Total (Overall) | 337 (46.2%) | 393 (53.8%) |
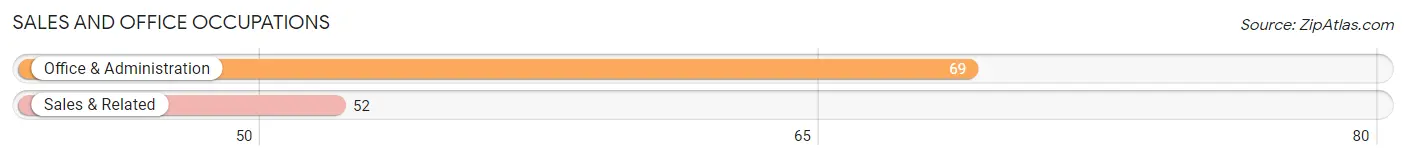
Sales and Office Occupations
The most common Sales and Office occupations in Fairmount Heights are Office & Administration (69 | 9.5%), and Sales & Related (52 | 7.1%).
Sales and Office Occupations by Sex
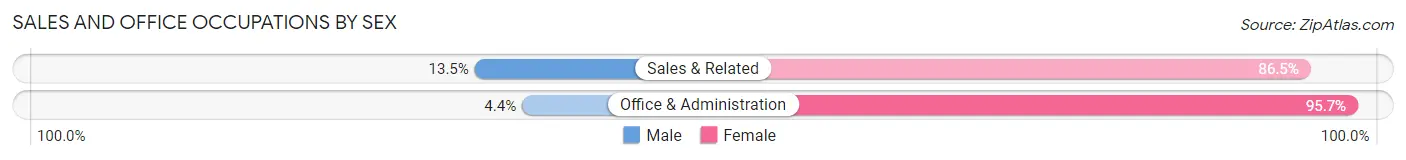
| Occupation | Male | Female |
| Sales & Related | 7 (13.5%) | 45 (86.5%) |
| Office & Administration | 3 (4.3%) | 66 (95.7%) |
| Total (Category) | 10 (8.3%) | 111 (91.7%) |
| Total (Overall) | 337 (46.2%) | 393 (53.8%) |
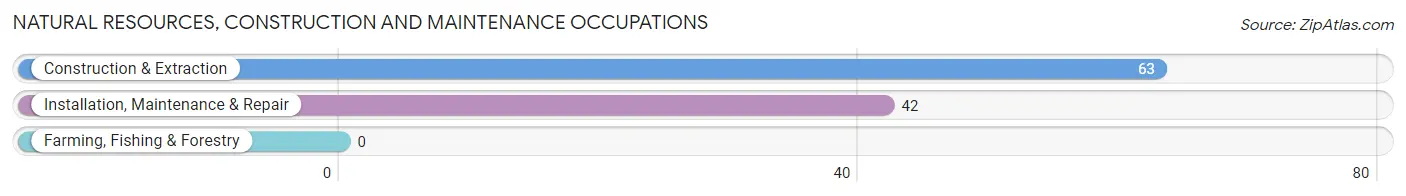
Natural Resources, Construction and Maintenance Occupations
The most common Natural Resources, Construction and Maintenance occupations in Fairmount Heights are Construction & Extraction (63 | 8.6%), and Installation, Maintenance & Repair (42 | 5.8%).
Natural Resources, Construction and Maintenance Occupations by Sex
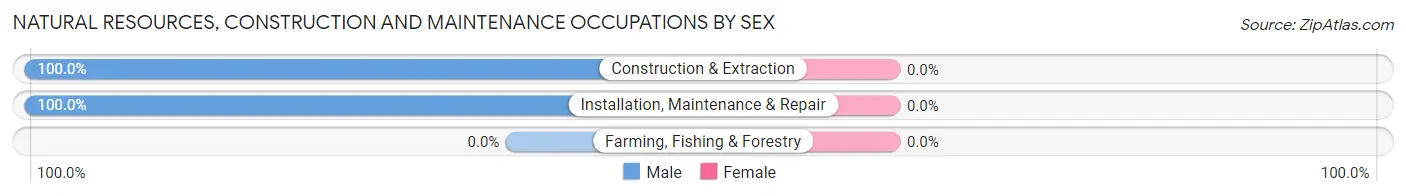
| Occupation | Male | Female |
| Farming, Fishing & Forestry | 0 (0.0%) | 0 (0.0%) |
| Construction & Extraction | 63 (100.0%) | 0 (0.0%) |
| Installation, Maintenance & Repair | 42 (100.0%) | 0 (0.0%) |
| Total (Category) | 105 (100.0%) | 0 (0.0%) |
| Total (Overall) | 337 (46.2%) | 393 (53.8%) |
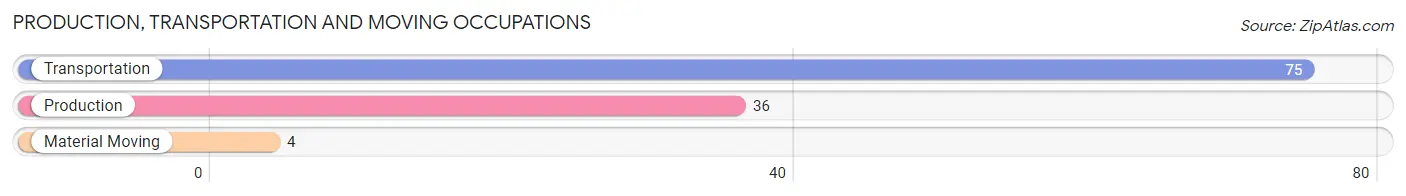
Production, Transportation and Moving Occupations
The most common Production, Transportation and Moving occupations in Fairmount Heights are Transportation (75 | 10.3%), Production (36 | 4.9%), and Material Moving (4 | 0.5%).
Production, Transportation and Moving Occupations by Sex
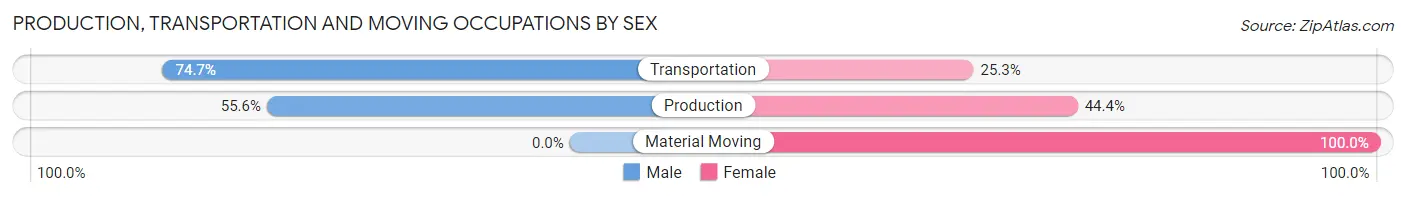
| Occupation | Male | Female |
| Production | 20 (55.6%) | 16 (44.4%) |
| Transportation | 56 (74.7%) | 19 (25.3%) |
| Material Moving | 0 (0.0%) | 4 (100.0%) |
| Total (Category) | 76 (66.1%) | 39 (33.9%) |
| Total (Overall) | 337 (46.2%) | 393 (53.8%) |
Employment Industries by Sex in Fairmount Heights
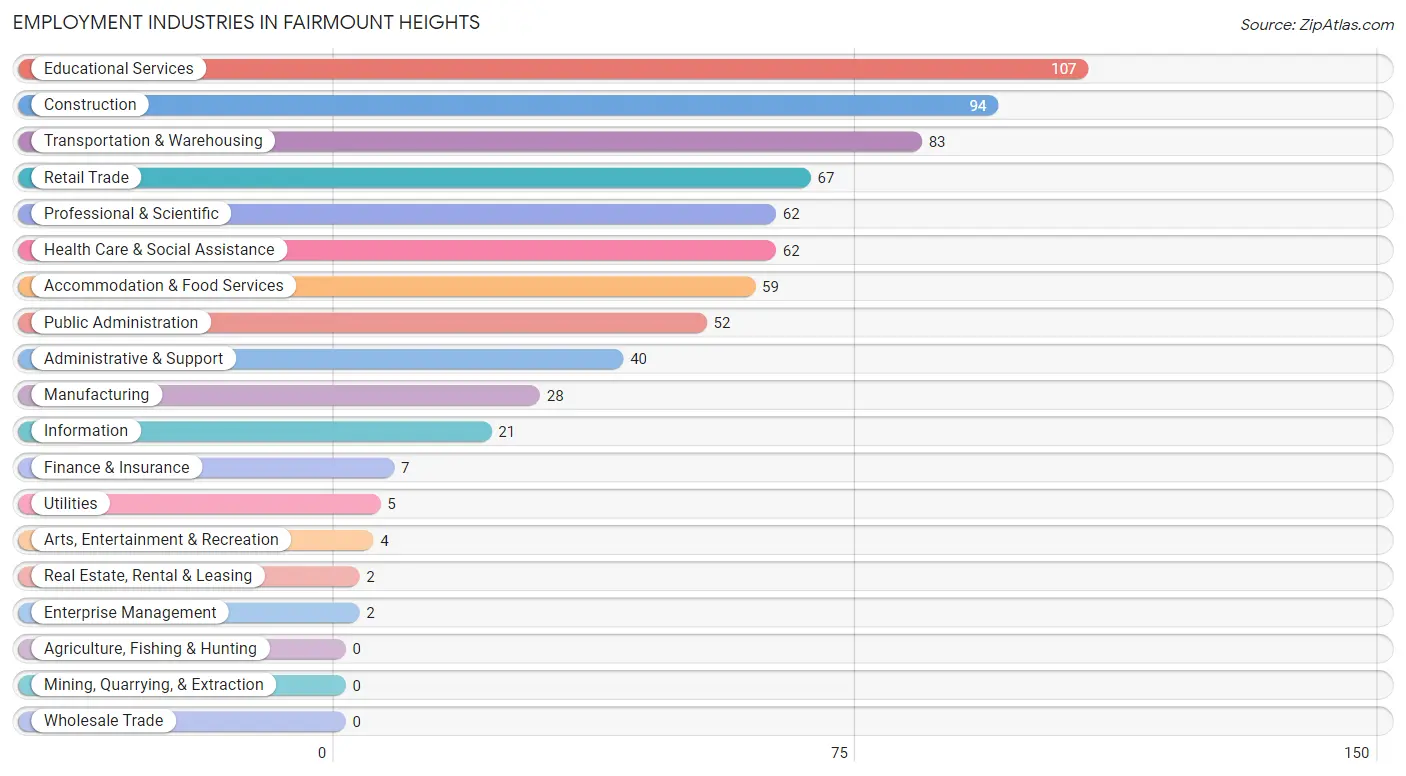
Employment Industries in Fairmount Heights
The major employment industries in Fairmount Heights include Educational Services (107 | 14.7%), Construction (94 | 12.9%), Transportation & Warehousing (83 | 11.4%), Retail Trade (67 | 9.2%), and Professional & Scientific (62 | 8.5%).
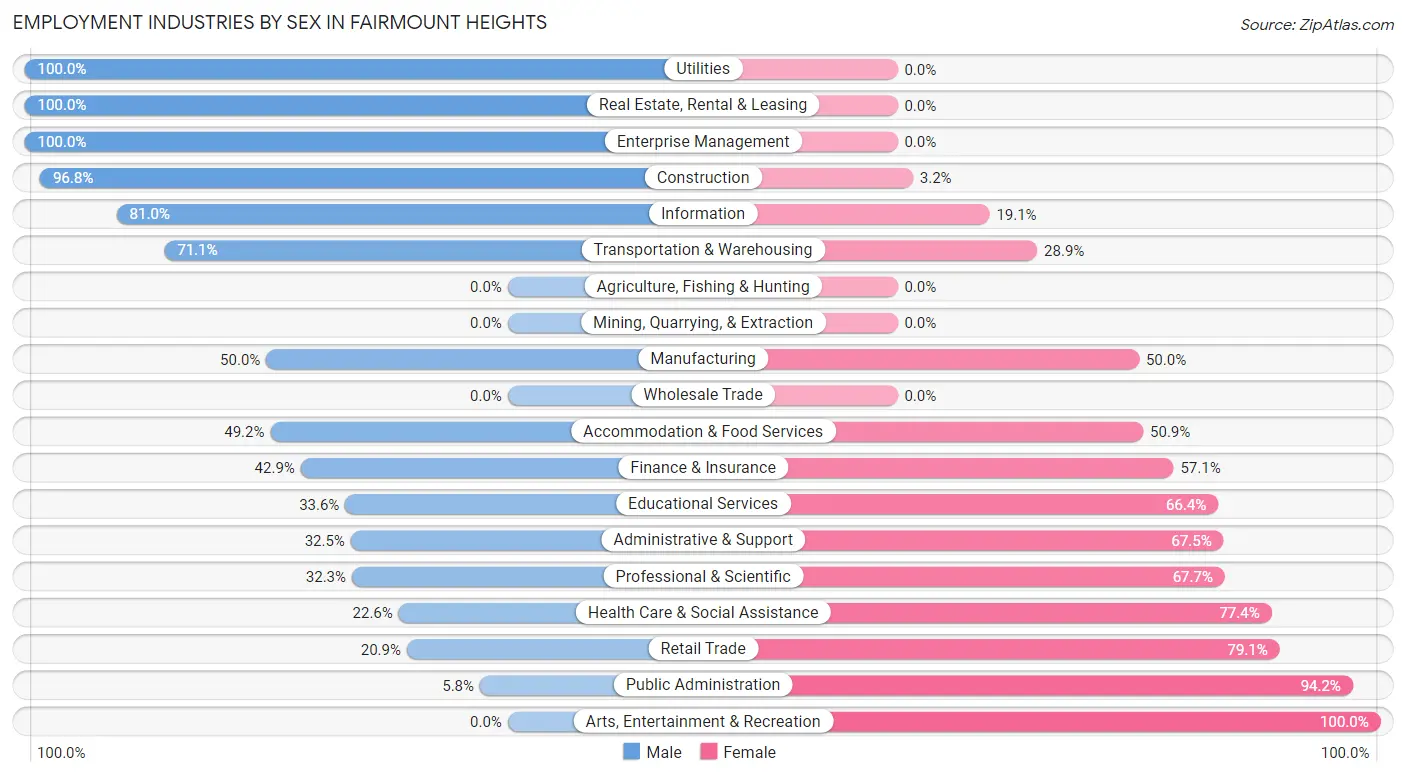
Employment Industries by Sex in Fairmount Heights
The Fairmount Heights industries that see more men than women are Utilities (100.0%), Real Estate, Rental & Leasing (100.0%), and Enterprise Management (100.0%), whereas the industries that tend to have a higher number of women are Arts, Entertainment & Recreation (100.0%), Public Administration (94.2%), and Retail Trade (79.1%).
| Industry | Male | Female |
| Agriculture, Fishing & Hunting | 0 (0.0%) | 0 (0.0%) |
| Mining, Quarrying, & Extraction | 0 (0.0%) | 0 (0.0%) |
| Construction | 91 (96.8%) | 3 (3.2%) |
| Manufacturing | 14 (50.0%) | 14 (50.0%) |
| Wholesale Trade | 0 (0.0%) | 0 (0.0%) |
| Retail Trade | 14 (20.9%) | 53 (79.1%) |
| Transportation & Warehousing | 59 (71.1%) | 24 (28.9%) |
| Utilities | 5 (100.0%) | 0 (0.0%) |
| Information | 17 (80.9%) | 4 (19.1%) |
| Finance & Insurance | 3 (42.9%) | 4 (57.1%) |
| Real Estate, Rental & Leasing | 2 (100.0%) | 0 (0.0%) |
| Professional & Scientific | 20 (32.3%) | 42 (67.7%) |
| Enterprise Management | 2 (100.0%) | 0 (0.0%) |
| Administrative & Support | 13 (32.5%) | 27 (67.5%) |
| Educational Services | 36 (33.6%) | 71 (66.4%) |
| Health Care & Social Assistance | 14 (22.6%) | 48 (77.4%) |
| Arts, Entertainment & Recreation | 0 (0.0%) | 4 (100.0%) |
| Accommodation & Food Services | 29 (49.1%) | 30 (50.8%) |
| Public Administration | 3 (5.8%) | 49 (94.2%) |
| Total | 337 (46.2%) | 393 (53.8%) |
Education in Fairmount Heights
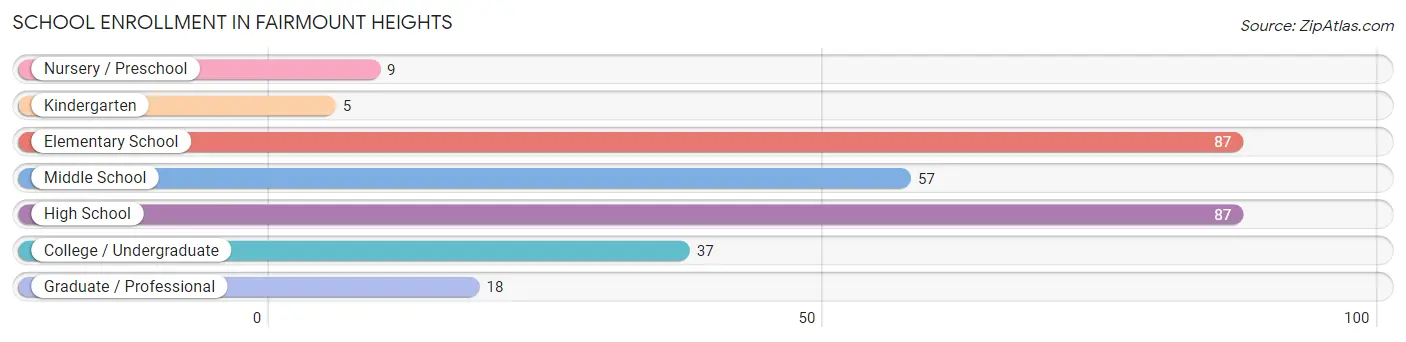
School Enrollment in Fairmount Heights
The most common levels of schooling among the 300 students in Fairmount Heights are elementary school (87 | 29.0%), high school (87 | 29.0%), and middle school (57 | 19.0%).
| School Level | # Students | % Students |
| Nursery / Preschool | 9 | 3.0% |
| Kindergarten | 5 | 1.7% |
| Elementary School | 87 | 29.0% |
| Middle School | 57 | 19.0% |
| High School | 87 | 29.0% |
| College / Undergraduate | 37 | 12.3% |
| Graduate / Professional | 18 | 6.0% |
| Total | 300 | 100.0% |
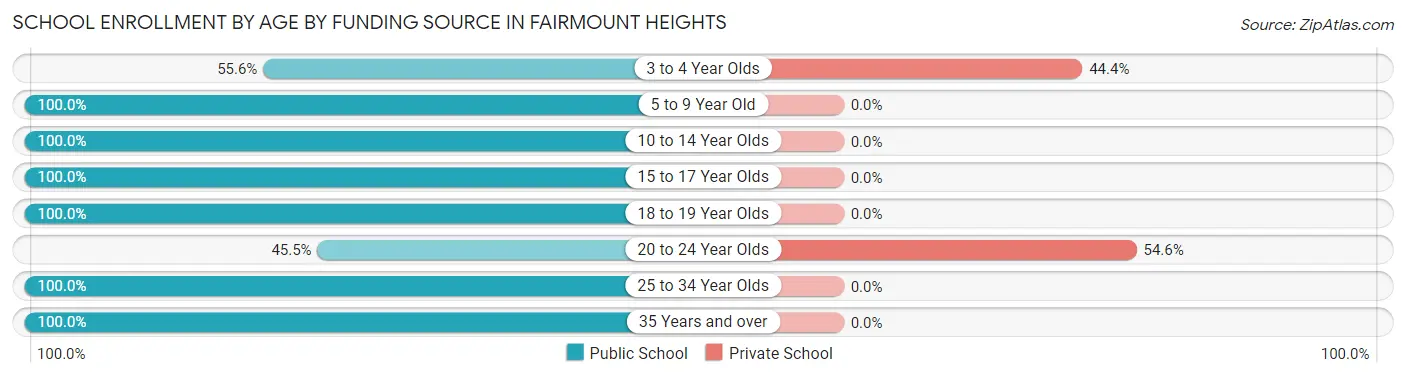
School Enrollment by Age by Funding Source in Fairmount Heights
Out of a total of 300 students who are enrolled in schools in Fairmount Heights, 10 (3.3%) attend a private institution, while the remaining 290 (96.7%) are enrolled in public schools. The age group of 20 to 24 year olds has the highest likelihood of being enrolled in private schools, with 6 (54.5% in the age bracket) enrolled. Conversely, the age group of 5 to 9 year old has the lowest likelihood of being enrolled in a private school, with 73 (100.0% in the age bracket) attending a public institution.
| Age Bracket | Public School | Private School |
| 3 to 4 Year Olds | 5 (55.6%) | 4 (44.4%) |
| 5 to 9 Year Old | 73 (100.0%) | 0 (0.0%) |
| 10 to 14 Year Olds | 93 (100.0%) | 0 (0.0%) |
| 15 to 17 Year Olds | 56 (100.0%) | 0 (0.0%) |
| 18 to 19 Year Olds | 19 (100.0%) | 0 (0.0%) |
| 20 to 24 Year Olds | 5 (45.5%) | 6 (54.5%) |
| 25 to 34 Year Olds | 15 (100.0%) | 0 (0.0%) |
| 35 Years and over | 24 (100.0%) | 0 (0.0%) |
| Total | 290 (96.7%) | 10 (3.3%) |
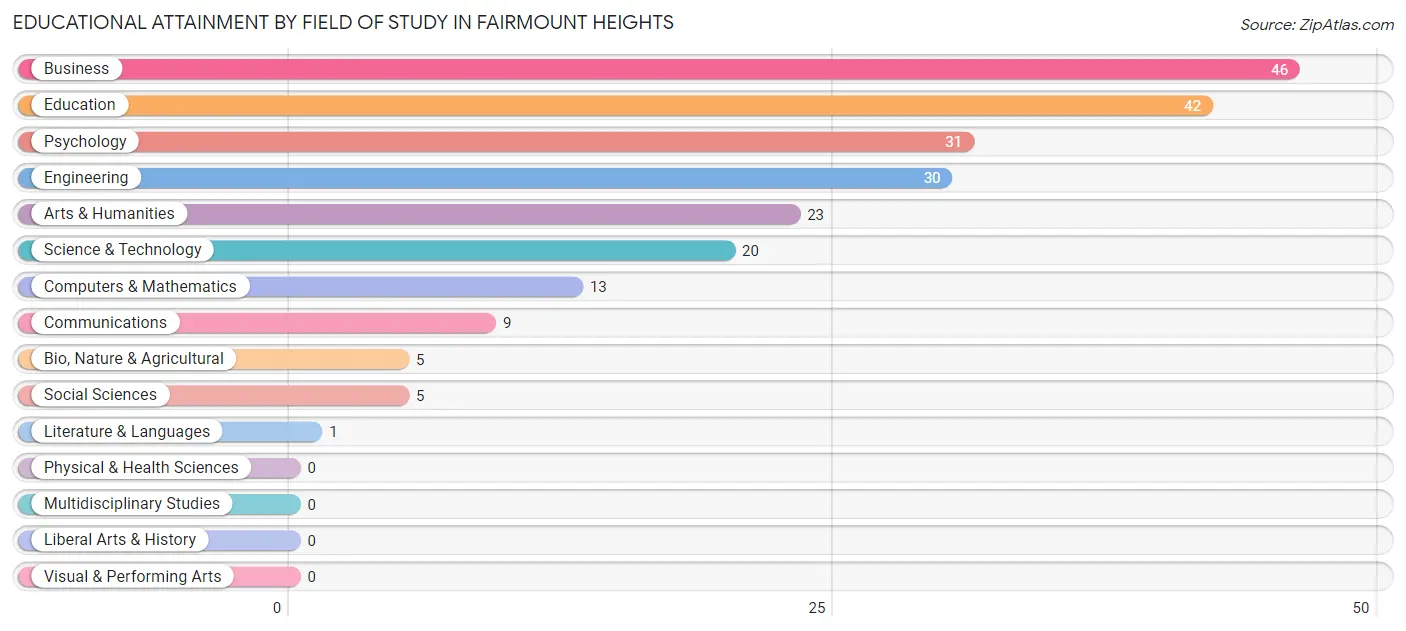
Educational Attainment by Field of Study in Fairmount Heights
Business (46 | 20.4%), education (42 | 18.7%), psychology (31 | 13.8%), engineering (30 | 13.3%), and arts & humanities (23 | 10.2%) are the most common fields of study among 225 individuals in Fairmount Heights who have obtained a bachelor's degree or higher.
| Field of Study | # Graduates | % Graduates |
| Computers & Mathematics | 13 | 5.8% |
| Bio, Nature & Agricultural | 5 | 2.2% |
| Physical & Health Sciences | 0 | 0.0% |
| Psychology | 31 | 13.8% |
| Social Sciences | 5 | 2.2% |
| Engineering | 30 | 13.3% |
| Multidisciplinary Studies | 0 | 0.0% |
| Science & Technology | 20 | 8.9% |
| Business | 46 | 20.4% |
| Education | 42 | 18.7% |
| Literature & Languages | 1 | 0.4% |
| Liberal Arts & History | 0 | 0.0% |
| Visual & Performing Arts | 0 | 0.0% |
| Communications | 9 | 4.0% |
| Arts & Humanities | 23 | 10.2% |
| Total | 225 | 100.0% |
Transportation & Commute in Fairmount Heights
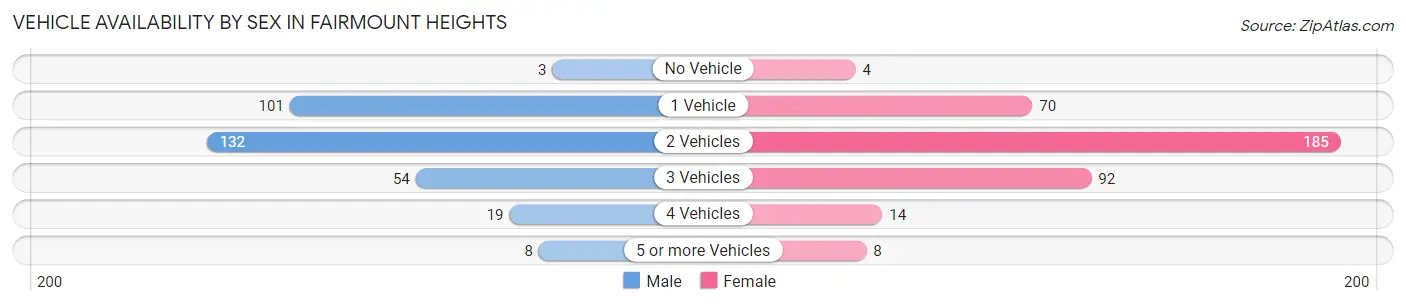
Vehicle Availability by Sex in Fairmount Heights
The most prevalent vehicle ownership categories in Fairmount Heights are males with 2 vehicles (132, accounting for 41.6%) and females with 2 vehicles (185, making up 35.4%).
| Vehicles Available | Male | Female |
| No Vehicle | 3 (0.9%) | 4 (1.1%) |
| 1 Vehicle | 101 (31.9%) | 70 (18.8%) |
| 2 Vehicles | 132 (41.6%) | 185 (49.6%) |
| 3 Vehicles | 54 (17.0%) | 92 (24.7%) |
| 4 Vehicles | 19 (6.0%) | 14 (3.7%) |
| 5 or more Vehicles | 8 (2.5%) | 8 (2.1%) |
| Total | 317 (100.0%) | 373 (100.0%) |
Commute Time in Fairmount Heights
The most frequently occuring commute durations in Fairmount Heights are 30 to 34 minutes (155 commuters, 25.7%), 20 to 24 minutes (86 commuters, 14.2%), and 40 to 44 minutes (84 commuters, 13.9%).
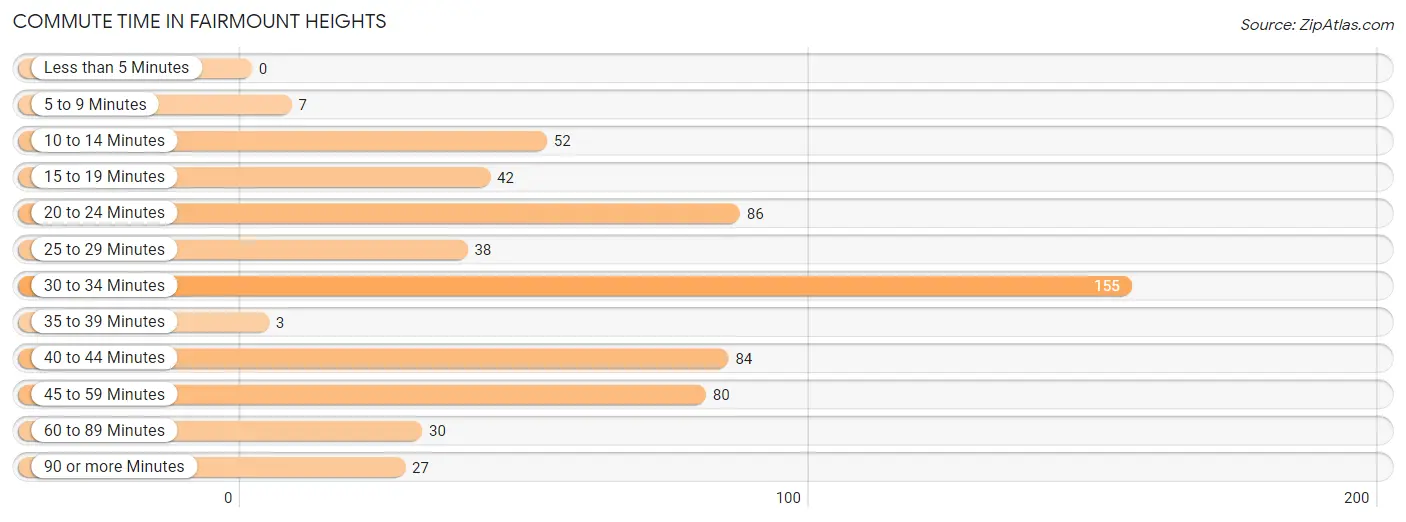
| Commute Time | # Commuters | % Commuters |
| Less than 5 Minutes | 0 | 0.0% |
| 5 to 9 Minutes | 7 | 1.2% |
| 10 to 14 Minutes | 52 | 8.6% |
| 15 to 19 Minutes | 42 | 7.0% |
| 20 to 24 Minutes | 86 | 14.2% |
| 25 to 29 Minutes | 38 | 6.3% |
| 30 to 34 Minutes | 155 | 25.7% |
| 35 to 39 Minutes | 3 | 0.5% |
| 40 to 44 Minutes | 84 | 13.9% |
| 45 to 59 Minutes | 80 | 13.3% |
| 60 to 89 Minutes | 30 | 5.0% |
| 90 or more Minutes | 27 | 4.5% |
Commute Time by Sex in Fairmount Heights
The most common commute times in Fairmount Heights are 30 to 34 minutes (68 commuters, 26.1%) for males and 30 to 34 minutes (87 commuters, 25.4%) for females.
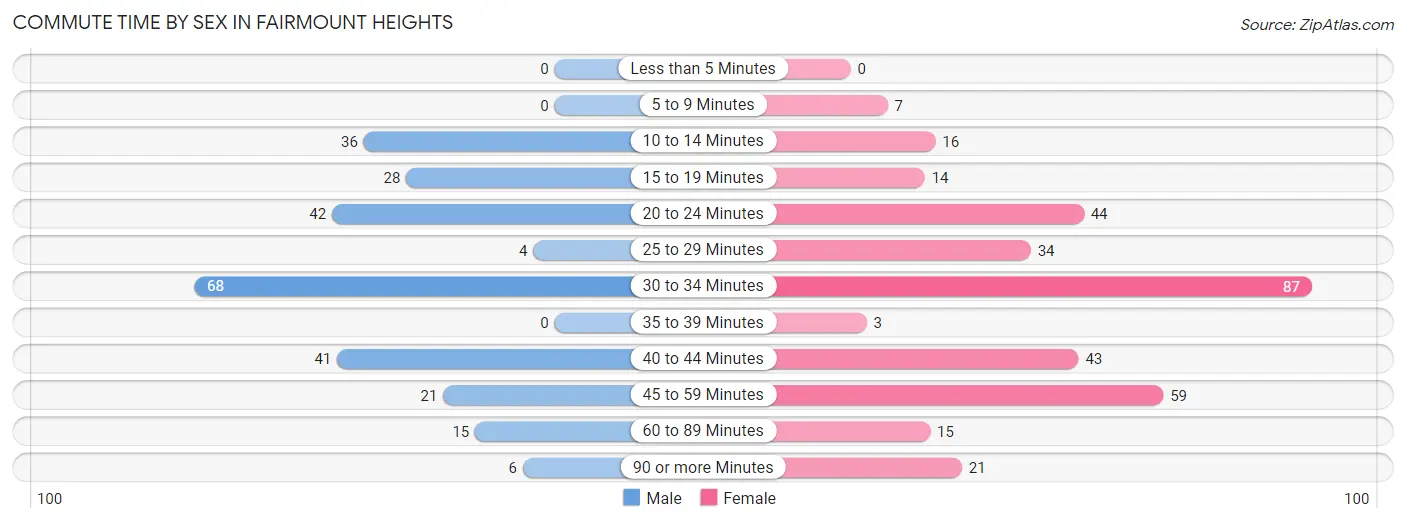
| Commute Time | Male | Female |
| Less than 5 Minutes | 0 (0.0%) | 0 (0.0%) |
| 5 to 9 Minutes | 0 (0.0%) | 7 (2.0%) |
| 10 to 14 Minutes | 36 (13.8%) | 16 (4.7%) |
| 15 to 19 Minutes | 28 (10.7%) | 14 (4.1%) |
| 20 to 24 Minutes | 42 (16.1%) | 44 (12.8%) |
| 25 to 29 Minutes | 4 (1.5%) | 34 (9.9%) |
| 30 to 34 Minutes | 68 (26.1%) | 87 (25.4%) |
| 35 to 39 Minutes | 0 (0.0%) | 3 (0.9%) |
| 40 to 44 Minutes | 41 (15.7%) | 43 (12.5%) |
| 45 to 59 Minutes | 21 (8.1%) | 59 (17.2%) |
| 60 to 89 Minutes | 15 (5.8%) | 15 (4.4%) |
| 90 or more Minutes | 6 (2.3%) | 21 (6.1%) |
Time of Departure to Work by Sex in Fairmount Heights
The most frequent times of departure to work in Fairmount Heights are 7:00 AM to 7:29 AM (53, 20.3%) for males and 6:30 AM to 6:59 AM (60, 17.5%) for females.
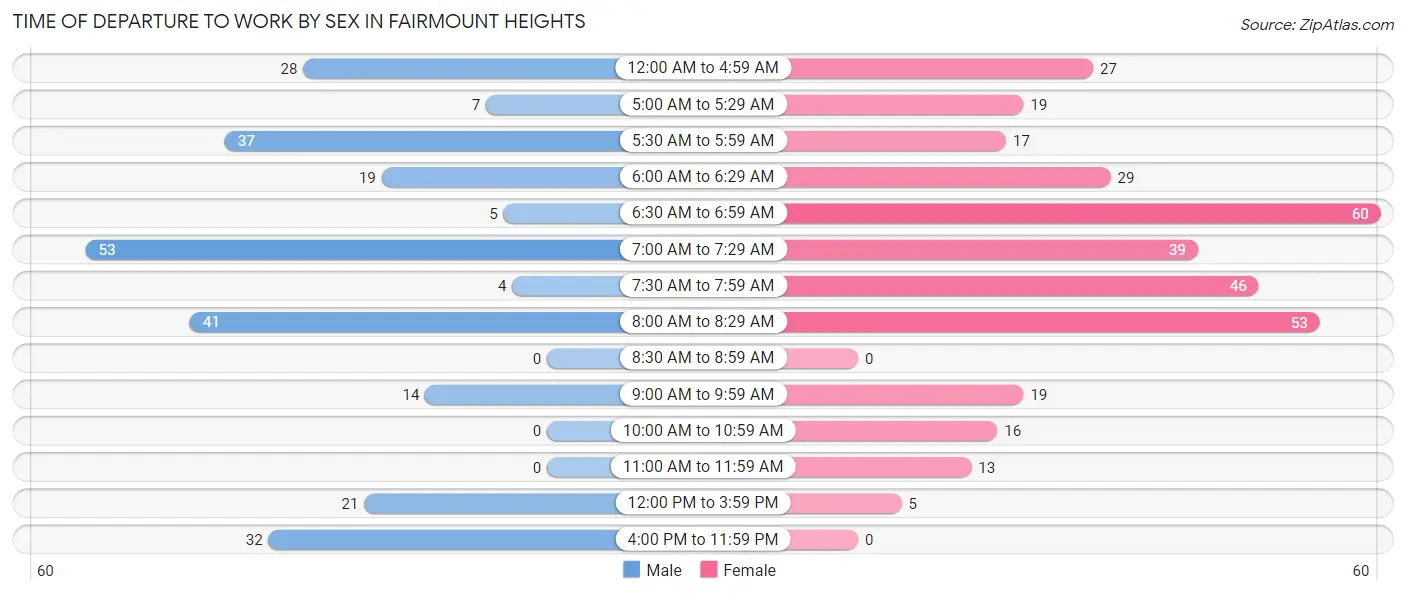
| Time of Departure | Male | Female |
| 12:00 AM to 4:59 AM | 28 (10.7%) | 27 (7.9%) |
| 5:00 AM to 5:29 AM | 7 (2.7%) | 19 (5.5%) |
| 5:30 AM to 5:59 AM | 37 (14.2%) | 17 (5.0%) |
| 6:00 AM to 6:29 AM | 19 (7.3%) | 29 (8.5%) |
| 6:30 AM to 6:59 AM | 5 (1.9%) | 60 (17.5%) |
| 7:00 AM to 7:29 AM | 53 (20.3%) | 39 (11.4%) |
| 7:30 AM to 7:59 AM | 4 (1.5%) | 46 (13.4%) |
| 8:00 AM to 8:29 AM | 41 (15.7%) | 53 (15.4%) |
| 8:30 AM to 8:59 AM | 0 (0.0%) | 0 (0.0%) |
| 9:00 AM to 9:59 AM | 14 (5.4%) | 19 (5.5%) |
| 10:00 AM to 10:59 AM | 0 (0.0%) | 16 (4.7%) |
| 11:00 AM to 11:59 AM | 0 (0.0%) | 13 (3.8%) |
| 12:00 PM to 3:59 PM | 21 (8.1%) | 5 (1.5%) |
| 4:00 PM to 11:59 PM | 32 (12.3%) | 0 (0.0%) |
| Total | 261 (100.0%) | 343 (100.0%) |
Housing Occupancy in Fairmount Heights
Occupancy by Ownership in Fairmount Heights
Of the total 586 dwellings in Fairmount Heights, owner-occupied units account for 519 (88.6%), while renter-occupied units make up 67 (11.4%).
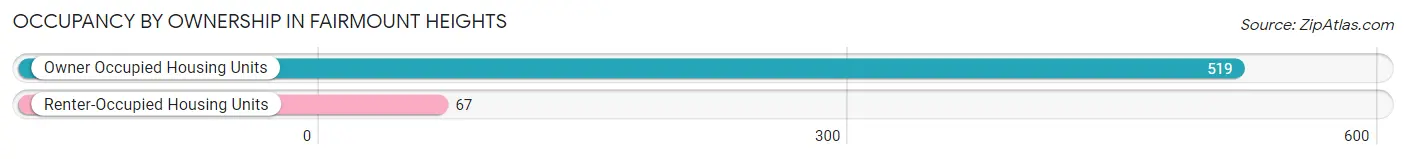
| Occupancy | # Housing Units | % Housing Units |
| Owner Occupied Housing Units | 519 | 88.6% |
| Renter-Occupied Housing Units | 67 | 11.4% |
| Total Occupied Housing Units | 586 | 100.0% |
Occupancy by Household Size in Fairmount Heights
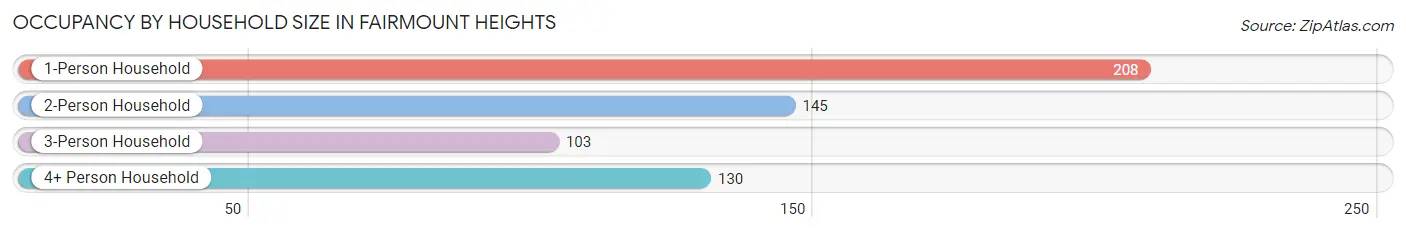
| Household Size | # Housing Units | % Housing Units |
| 1-Person Household | 208 | 35.5% |
| 2-Person Household | 145 | 24.7% |
| 3-Person Household | 103 | 17.6% |
| 4+ Person Household | 130 | 22.2% |
| Total Housing Units | 586 | 100.0% |
Occupancy by Ownership by Household Size in Fairmount Heights
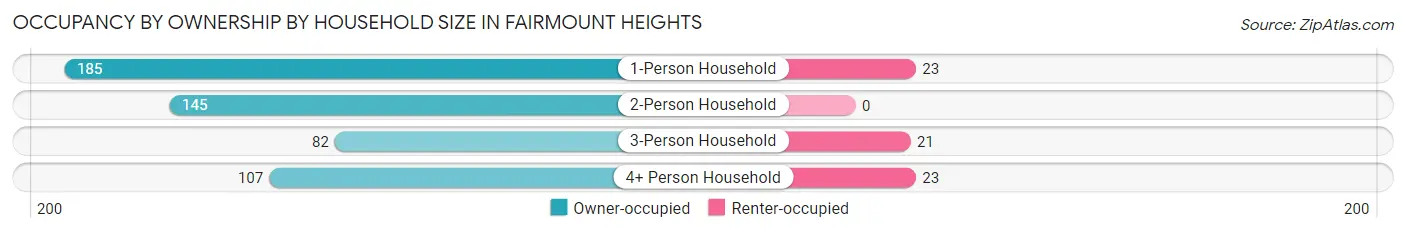
| Household Size | Owner-occupied | Renter-occupied |
| 1-Person Household | 185 (88.9%) | 23 (11.1%) |
| 2-Person Household | 145 (100.0%) | 0 (0.0%) |
| 3-Person Household | 82 (79.6%) | 21 (20.4%) |
| 4+ Person Household | 107 (82.3%) | 23 (17.7%) |
| Total Housing Units | 519 (88.6%) | 67 (11.4%) |
Occupancy by Educational Attainment in Fairmount Heights
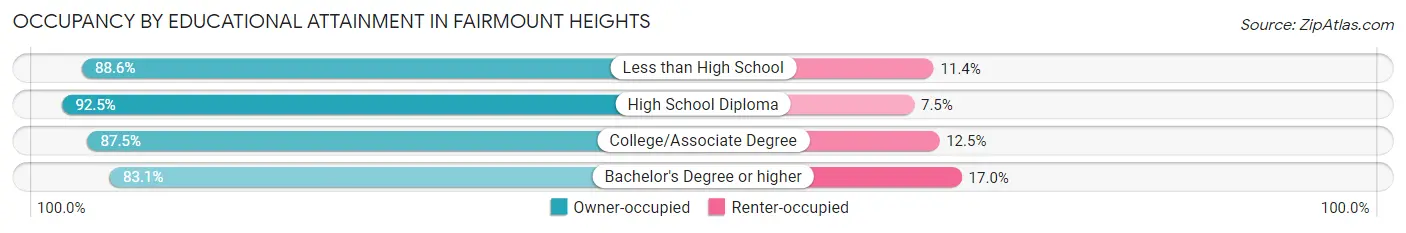
| Household Size | Owner-occupied | Renter-occupied |
| Less than High School | 70 (88.6%) | 9 (11.4%) |
| High School Diploma | 197 (92.5%) | 16 (7.5%) |
| College/Associate Degree | 154 (87.5%) | 22 (12.5%) |
| Bachelor's Degree or higher | 98 (83.1%) | 20 (17.0%) |
Occupancy by Age of Householder in Fairmount Heights
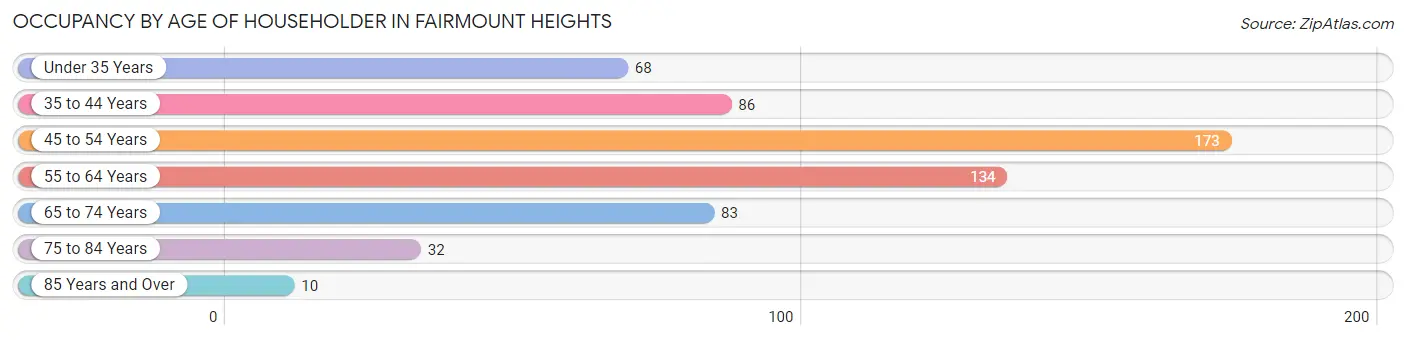
| Age Bracket | # Households | % Households |
| Under 35 Years | 68 | 11.6% |
| 35 to 44 Years | 86 | 14.7% |
| 45 to 54 Years | 173 | 29.5% |
| 55 to 64 Years | 134 | 22.9% |
| 65 to 74 Years | 83 | 14.2% |
| 75 to 84 Years | 32 | 5.5% |
| 85 Years and Over | 10 | 1.7% |
| Total | 586 | 100.0% |
Housing Finances in Fairmount Heights
Median Income by Occupancy in Fairmount Heights
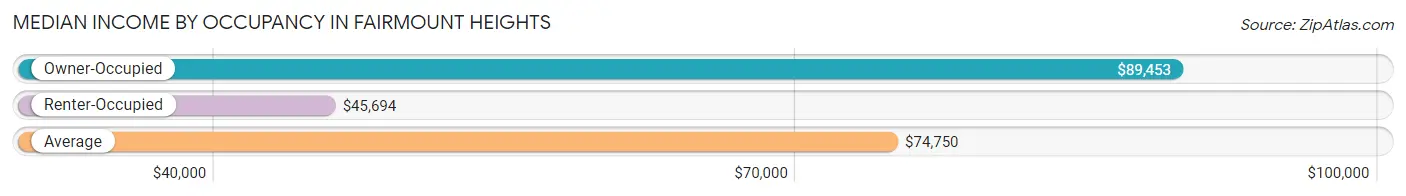
| Occupancy Type | # Households | Median Income |
| Owner-Occupied | 519 (88.6%) | $89,453 |
| Renter-Occupied | 67 (11.4%) | $45,694 |
| Average | 586 (100.0%) | $74,750 |
Occupancy by Householder Income Bracket in Fairmount Heights
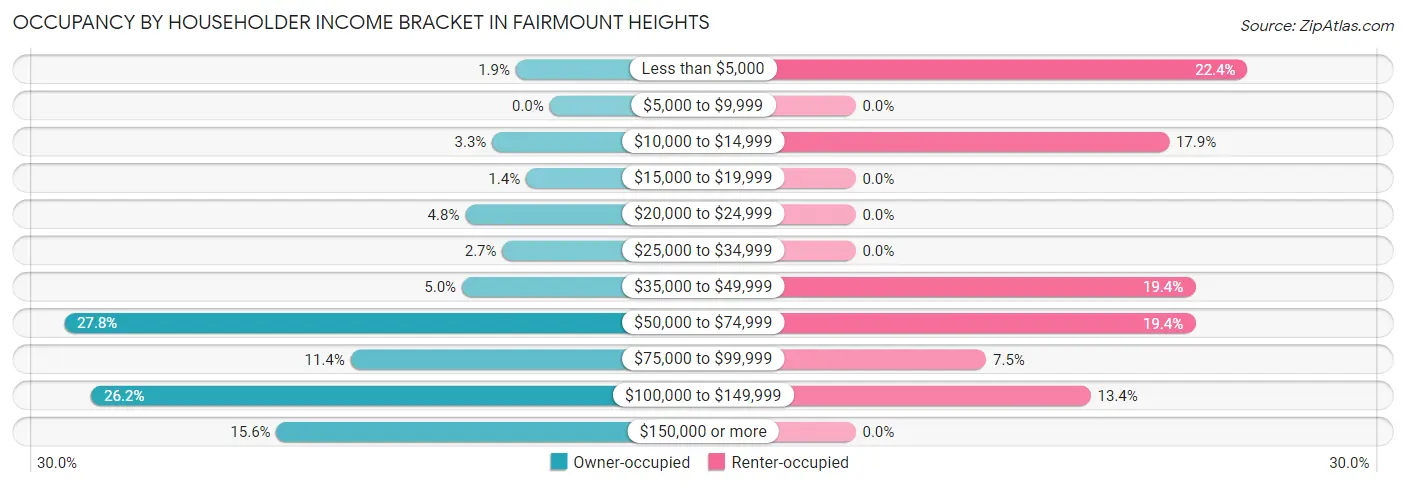
| Income Bracket | Owner-occupied | Renter-occupied |
| Less than $5,000 | 10 (1.9%) | 15 (22.4%) |
| $5,000 to $9,999 | 0 (0.0%) | 0 (0.0%) |
| $10,000 to $14,999 | 17 (3.3%) | 12 (17.9%) |
| $15,000 to $19,999 | 7 (1.3%) | 0 (0.0%) |
| $20,000 to $24,999 | 25 (4.8%) | 0 (0.0%) |
| $25,000 to $34,999 | 14 (2.7%) | 0 (0.0%) |
| $35,000 to $49,999 | 26 (5.0%) | 13 (19.4%) |
| $50,000 to $74,999 | 144 (27.8%) | 13 (19.4%) |
| $75,000 to $99,999 | 59 (11.4%) | 5 (7.5%) |
| $100,000 to $149,999 | 136 (26.2%) | 9 (13.4%) |
| $150,000 or more | 81 (15.6%) | 0 (0.0%) |
| Total | 519 (100.0%) | 67 (100.0%) |
Monthly Housing Cost Tiers in Fairmount Heights
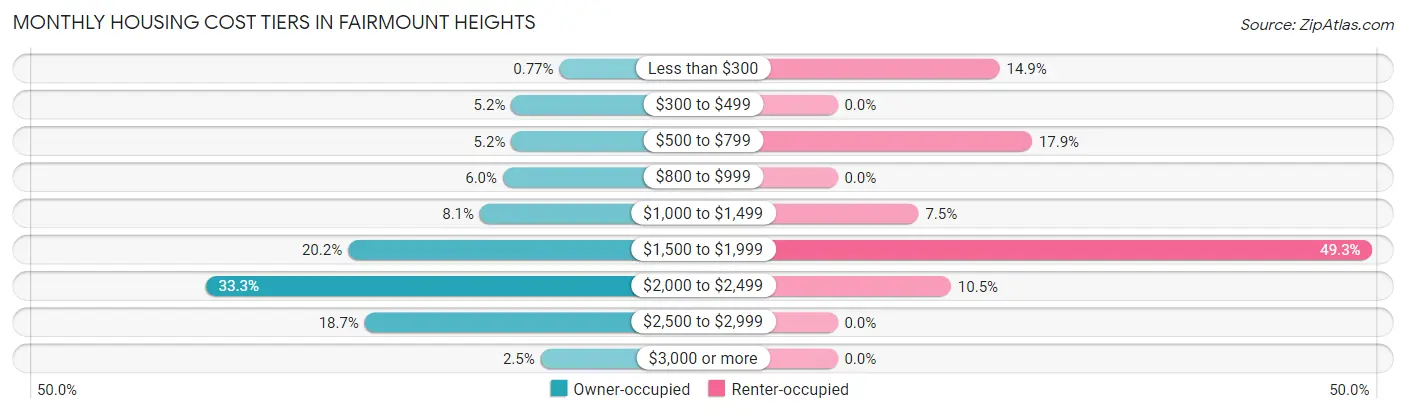
| Monthly Cost | Owner-occupied | Renter-occupied |
| Less than $300 | 4 (0.8%) | 10 (14.9%) |
| $300 to $499 | 27 (5.2%) | 0 (0.0%) |
| $500 to $799 | 27 (5.2%) | 12 (17.9%) |
| $800 to $999 | 31 (6.0%) | 0 (0.0%) |
| $1,000 to $1,499 | 42 (8.1%) | 5 (7.5%) |
| $1,500 to $1,999 | 105 (20.2%) | 33 (49.2%) |
| $2,000 to $2,499 | 173 (33.3%) | 7 (10.4%) |
| $2,500 to $2,999 | 97 (18.7%) | 0 (0.0%) |
| $3,000 or more | 13 (2.5%) | 0 (0.0%) |
| Total | 519 (100.0%) | 67 (100.0%) |
Physical Housing Characteristics in Fairmount Heights
Housing Structures in Fairmount Heights

| Structure Type | # Housing Units | % Housing Units |
| Single Unit, Detached | 556 | 94.9% |
| Single Unit, Attached | 17 | 2.9% |
| 2 Unit Apartments | 0 | 0.0% |
| 3 or 4 Unit Apartments | 13 | 2.2% |
| 5 to 9 Unit Apartments | 0 | 0.0% |
| 10 or more Apartments | 0 | 0.0% |
| Mobile Home / Other | 0 | 0.0% |
| Total | 586 | 100.0% |
Housing Structures by Occupancy in Fairmount Heights
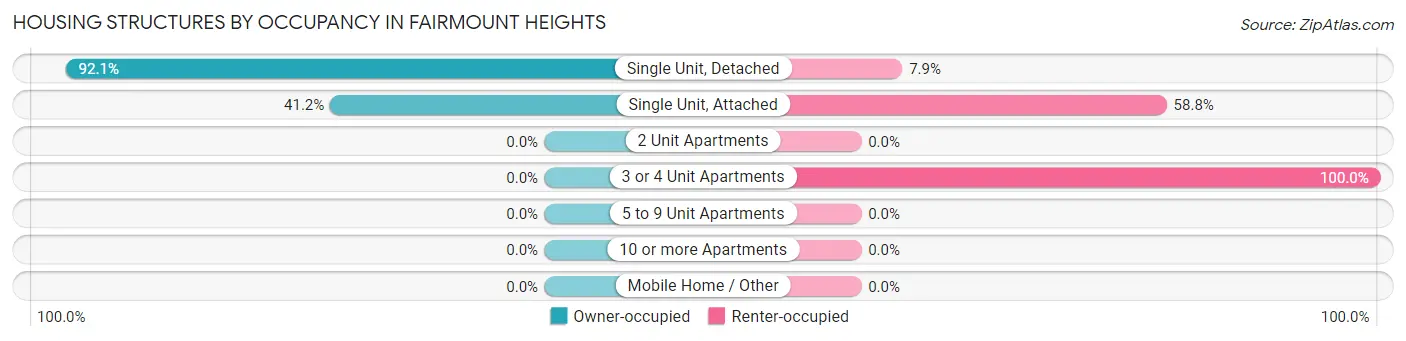
| Structure Type | Owner-occupied | Renter-occupied |
| Single Unit, Detached | 512 (92.1%) | 44 (7.9%) |
| Single Unit, Attached | 7 (41.2%) | 10 (58.8%) |
| 2 Unit Apartments | 0 (0.0%) | 0 (0.0%) |
| 3 or 4 Unit Apartments | 0 (0.0%) | 13 (100.0%) |
| 5 to 9 Unit Apartments | 0 (0.0%) | 0 (0.0%) |
| 10 or more Apartments | 0 (0.0%) | 0 (0.0%) |
| Mobile Home / Other | 0 (0.0%) | 0 (0.0%) |
| Total | 519 (88.6%) | 67 (11.4%) |
Housing Structures by Number of Rooms in Fairmount Heights
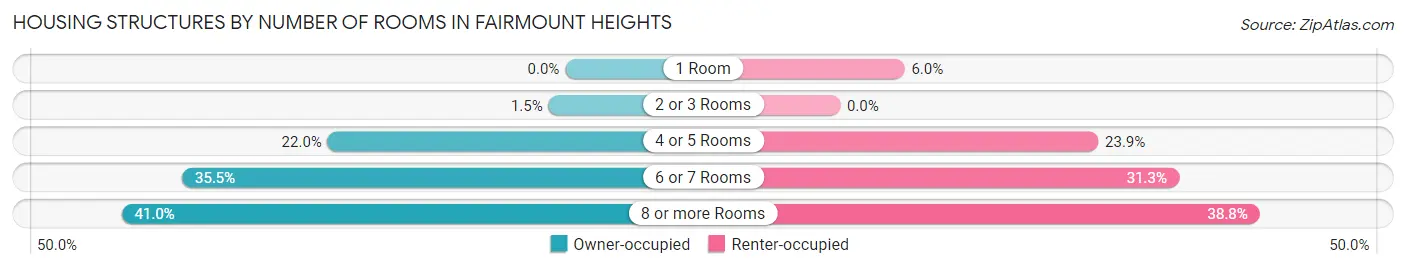
| Number of Rooms | Owner-occupied | Renter-occupied |
| 1 Room | 0 (0.0%) | 4 (6.0%) |
| 2 or 3 Rooms | 8 (1.5%) | 0 (0.0%) |
| 4 or 5 Rooms | 114 (22.0%) | 16 (23.9%) |
| 6 or 7 Rooms | 184 (35.4%) | 21 (31.3%) |
| 8 or more Rooms | 213 (41.0%) | 26 (38.8%) |
| Total | 519 (100.0%) | 67 (100.0%) |
Housing Structure by Heating Type in Fairmount Heights
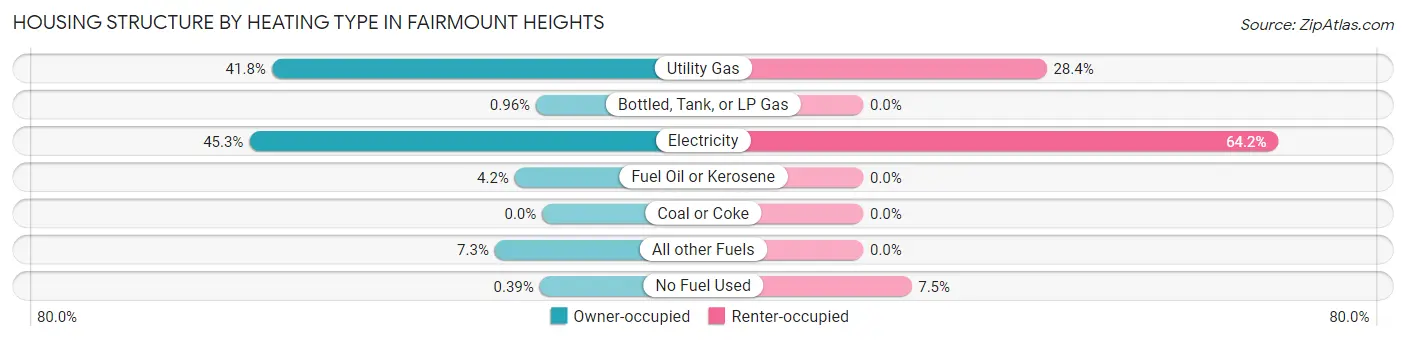
| Heating Type | Owner-occupied | Renter-occupied |
| Utility Gas | 217 (41.8%) | 19 (28.4%) |
| Bottled, Tank, or LP Gas | 5 (1.0%) | 0 (0.0%) |
| Electricity | 235 (45.3%) | 43 (64.2%) |
| Fuel Oil or Kerosene | 22 (4.2%) | 0 (0.0%) |
| Coal or Coke | 0 (0.0%) | 0 (0.0%) |
| All other Fuels | 38 (7.3%) | 0 (0.0%) |
| No Fuel Used | 2 (0.4%) | 5 (7.5%) |
| Total | 519 (100.0%) | 67 (100.0%) |
Household Vehicle Usage in Fairmount Heights
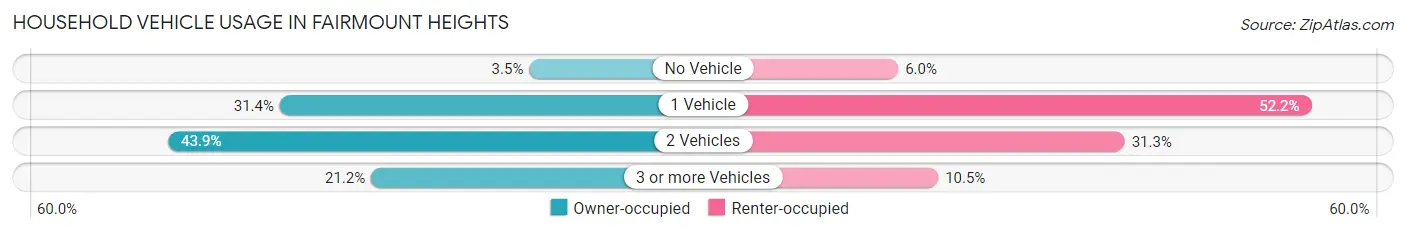
| Vehicles per Household | Owner-occupied | Renter-occupied |
| No Vehicle | 18 (3.5%) | 4 (6.0%) |
| 1 Vehicle | 163 (31.4%) | 35 (52.2%) |
| 2 Vehicles | 228 (43.9%) | 21 (31.3%) |
| 3 or more Vehicles | 110 (21.2%) | 7 (10.4%) |
| Total | 519 (100.0%) | 67 (100.0%) |
Real Estate & Mortgages in Fairmount Heights
Real Estate and Mortgage Overview in Fairmount Heights
| Characteristic | Without Mortgage | With Mortgage |
| Housing Units | 95 | 424 |
| Median Property Value | $275,000 | $319,200 |
| Median Household Income | $50,750 | $81 |
| Monthly Housing Costs | $585 | $7 |
| Real Estate Taxes | $3,148 | $0 |
Property Value by Mortgage Status in Fairmount Heights
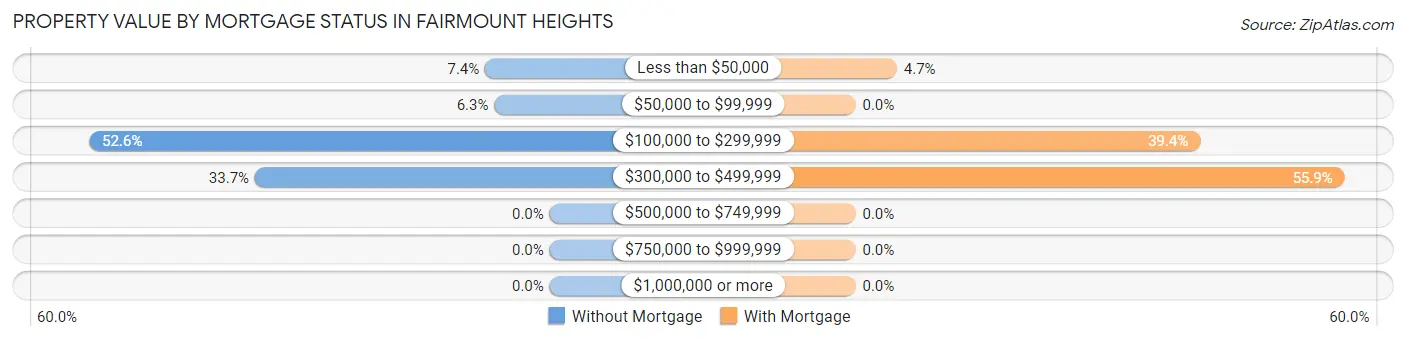
| Property Value | Without Mortgage | With Mortgage |
| Less than $50,000 | 7 (7.4%) | 20 (4.7%) |
| $50,000 to $99,999 | 6 (6.3%) | 0 (0.0%) |
| $100,000 to $299,999 | 50 (52.6%) | 167 (39.4%) |
| $300,000 to $499,999 | 32 (33.7%) | 237 (55.9%) |
| $500,000 to $749,999 | 0 (0.0%) | 0 (0.0%) |
| $750,000 to $999,999 | 0 (0.0%) | 0 (0.0%) |
| $1,000,000 or more | 0 (0.0%) | 0 (0.0%) |
| Total | 95 (100.0%) | 424 (100.0%) |
Household Income by Mortgage Status in Fairmount Heights
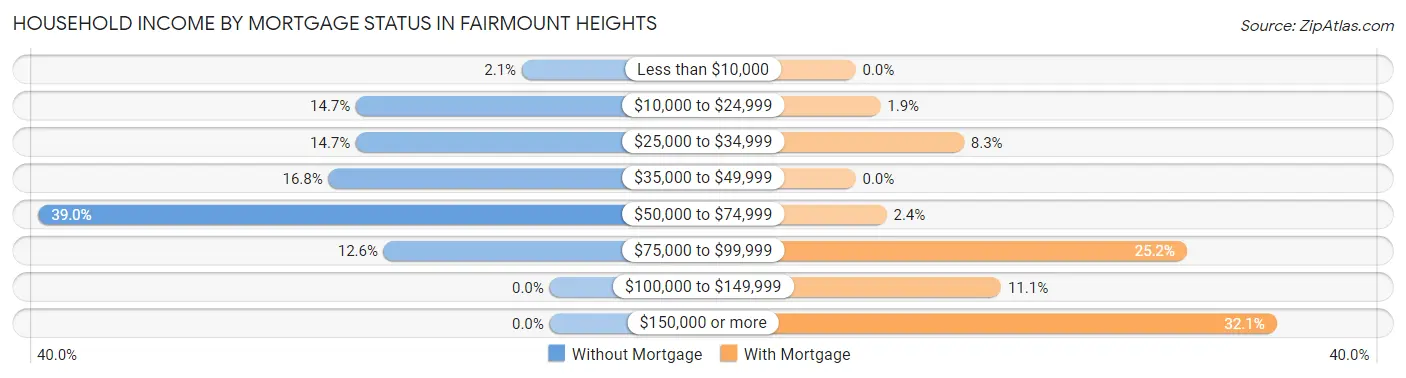
| Household Income | Without Mortgage | With Mortgage |
| Less than $10,000 | 2 (2.1%) | 0 (0.0%) |
| $10,000 to $24,999 | 14 (14.7%) | 8 (1.9%) |
| $25,000 to $34,999 | 14 (14.7%) | 35 (8.3%) |
| $35,000 to $49,999 | 16 (16.8%) | 0 (0.0%) |
| $50,000 to $74,999 | 37 (39.0%) | 10 (2.4%) |
| $75,000 to $99,999 | 12 (12.6%) | 107 (25.2%) |
| $100,000 to $149,999 | 0 (0.0%) | 47 (11.1%) |
| $150,000 or more | 0 (0.0%) | 136 (32.1%) |
| Total | 95 (100.0%) | 424 (100.0%) |
Property Value to Household Income Ratio in Fairmount Heights
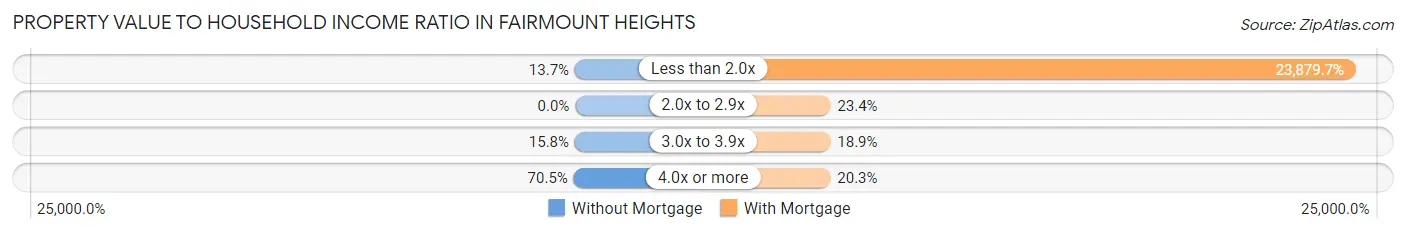
| Value-to-Income Ratio | Without Mortgage | With Mortgage |
| Less than 2.0x | 13 (13.7%) | 101,250 (23,879.7%) |
| 2.0x to 2.9x | 0 (0.0%) | 99 (23.4%) |
| 3.0x to 3.9x | 15 (15.8%) | 80 (18.9%) |
| 4.0x or more | 67 (70.5%) | 86 (20.3%) |
| Total | 95 (100.0%) | 424 (100.0%) |
Real Estate Taxes by Mortgage Status in Fairmount Heights
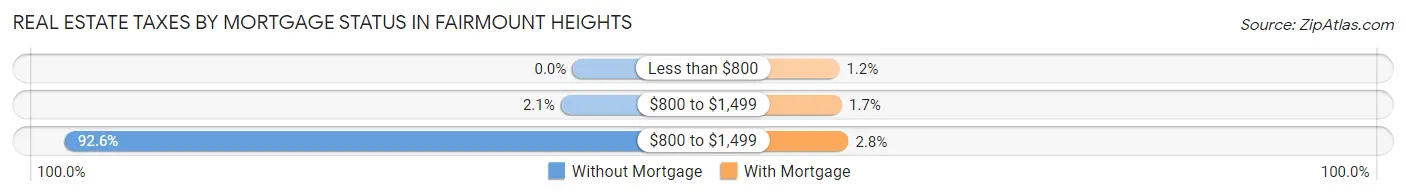
| Property Taxes | Without Mortgage | With Mortgage |
| Less than $800 | 0 (0.0%) | 5 (1.2%) |
| $800 to $1,499 | 2 (2.1%) | 7 (1.7%) |
| $800 to $1,499 | 88 (92.6%) | 12 (2.8%) |
| Total | 95 (100.0%) | 424 (100.0%) |
Health & Disability in Fairmount Heights
Health Insurance Coverage by Age in Fairmount Heights
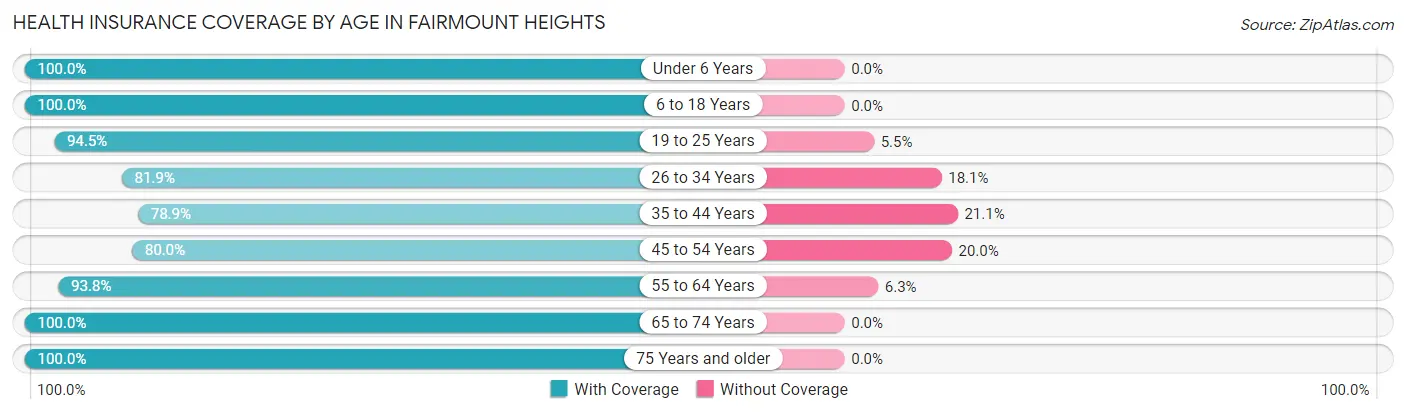
| Age Bracket | With Coverage | Without Coverage |
| Under 6 Years | 162 (100.0%) | 0 (0.0%) |
| 6 to 18 Years | 217 (100.0%) | 0 (0.0%) |
| 19 to 25 Years | 69 (94.5%) | 4 (5.5%) |
| 26 to 34 Years | 145 (81.9%) | 32 (18.1%) |
| 35 to 44 Years | 157 (78.9%) | 42 (21.1%) |
| 45 to 54 Years | 200 (80.0%) | 50 (20.0%) |
| 55 to 64 Years | 195 (93.8%) | 13 (6.2%) |
| 65 to 74 Years | 136 (100.0%) | 0 (0.0%) |
| 75 Years and older | 62 (100.0%) | 0 (0.0%) |
| Total | 1,343 (90.5%) | 141 (9.5%) |
Health Insurance Coverage by Citizenship Status in Fairmount Heights
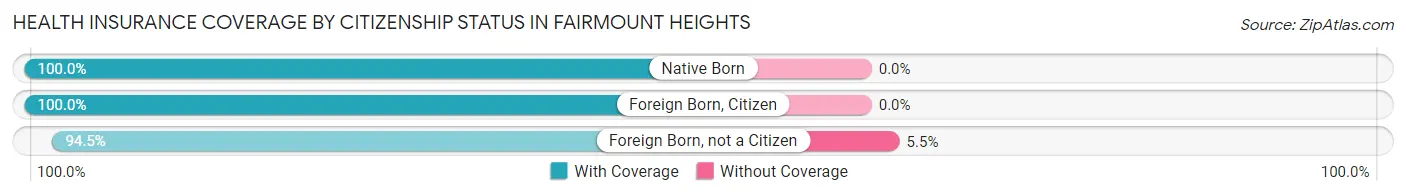
| Citizenship Status | With Coverage | Without Coverage |
| Native Born | 162 (100.0%) | 0 (0.0%) |
| Foreign Born, Citizen | 217 (100.0%) | 0 (0.0%) |
| Foreign Born, not a Citizen | 69 (94.5%) | 4 (5.5%) |
Health Insurance Coverage by Household Income in Fairmount Heights
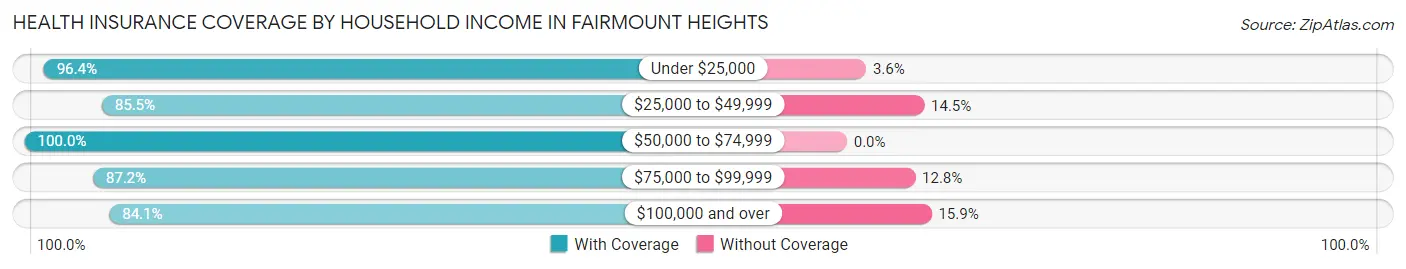
| Household Income | With Coverage | Without Coverage |
| Under $25,000 | 215 (96.4%) | 8 (3.6%) |
| $25,000 to $49,999 | 124 (85.5%) | 21 (14.5%) |
| $50,000 to $74,999 | 382 (100.0%) | 0 (0.0%) |
| $75,000 to $99,999 | 109 (87.2%) | 16 (12.8%) |
| $100,000 and over | 509 (84.1%) | 96 (15.9%) |
Public vs Private Health Insurance Coverage by Age in Fairmount Heights
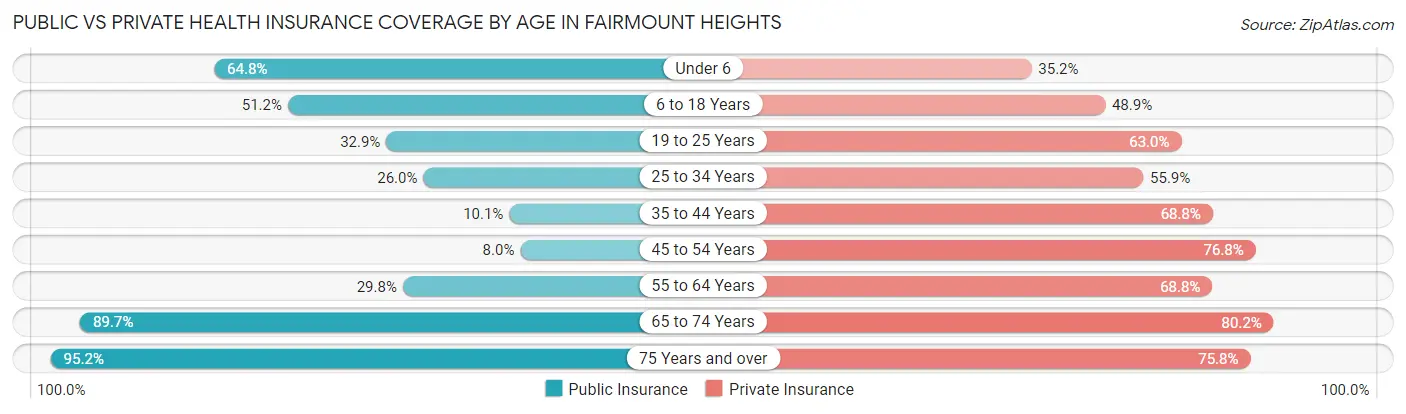
| Age Bracket | Public Insurance | Private Insurance |
| Under 6 | 105 (64.8%) | 57 (35.2%) |
| 6 to 18 Years | 111 (51.1%) | 106 (48.8%) |
| 19 to 25 Years | 24 (32.9%) | 46 (63.0%) |
| 25 to 34 Years | 46 (26.0%) | 99 (55.9%) |
| 35 to 44 Years | 20 (10.1%) | 137 (68.8%) |
| 45 to 54 Years | 20 (8.0%) | 192 (76.8%) |
| 55 to 64 Years | 62 (29.8%) | 143 (68.8%) |
| 65 to 74 Years | 122 (89.7%) | 109 (80.1%) |
| 75 Years and over | 59 (95.2%) | 47 (75.8%) |
| Total | 569 (38.3%) | 936 (63.1%) |
Disability Status by Sex by Age in Fairmount Heights
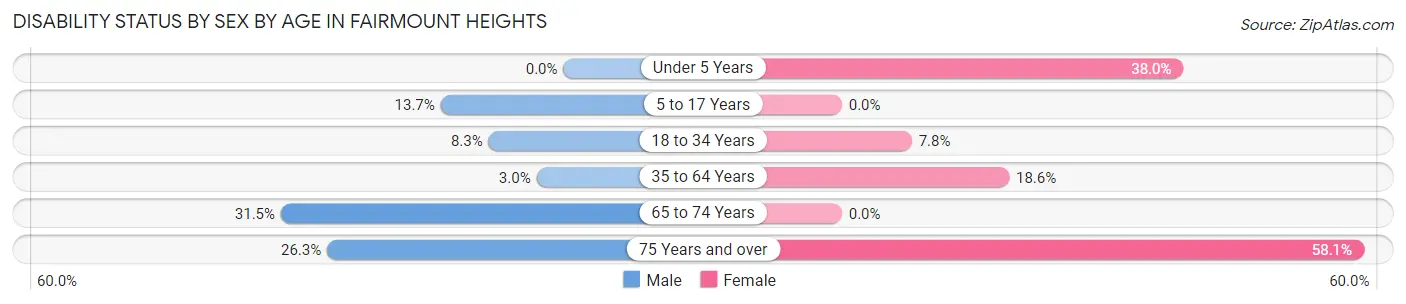
| Age Bracket | Male | Female |
| Under 5 Years | 0 (0.0%) | 27 (38.0%) |
| 5 to 17 Years | 19 (13.7%) | 0 (0.0%) |
| 18 to 34 Years | 8 (8.3%) | 12 (7.8%) |
| 35 to 64 Years | 10 (3.0%) | 60 (18.6%) |
| 65 to 74 Years | 28 (31.5%) | 0 (0.0%) |
| 75 Years and over | 5 (26.3%) | 25 (58.1%) |
Disability Class by Sex by Age in Fairmount Heights
Disability Class: Hearing Difficulty
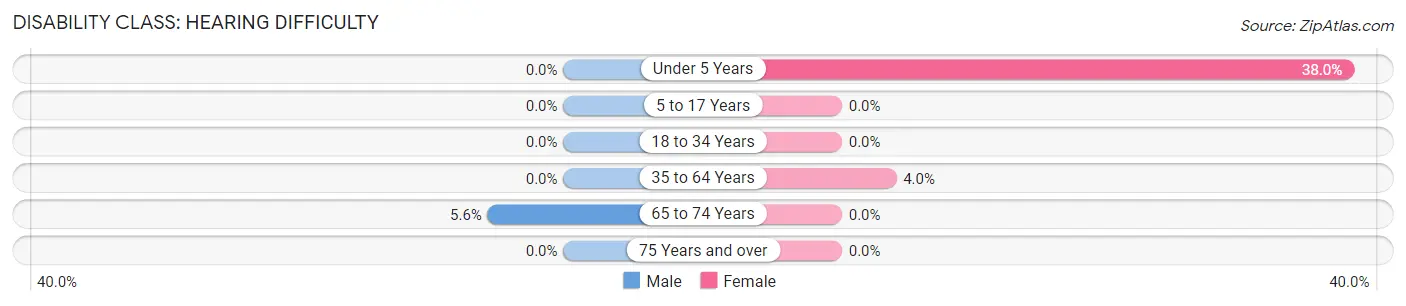
| Age Bracket | Male | Female |
| Under 5 Years | 0 (0.0%) | 27 (38.0%) |
| 5 to 17 Years | 0 (0.0%) | 0 (0.0%) |
| 18 to 34 Years | 0 (0.0%) | 0 (0.0%) |
| 35 to 64 Years | 0 (0.0%) | 13 (4.0%) |
| 65 to 74 Years | 5 (5.6%) | 0 (0.0%) |
| 75 Years and over | 0 (0.0%) | 0 (0.0%) |
Disability Class: Vision Difficulty
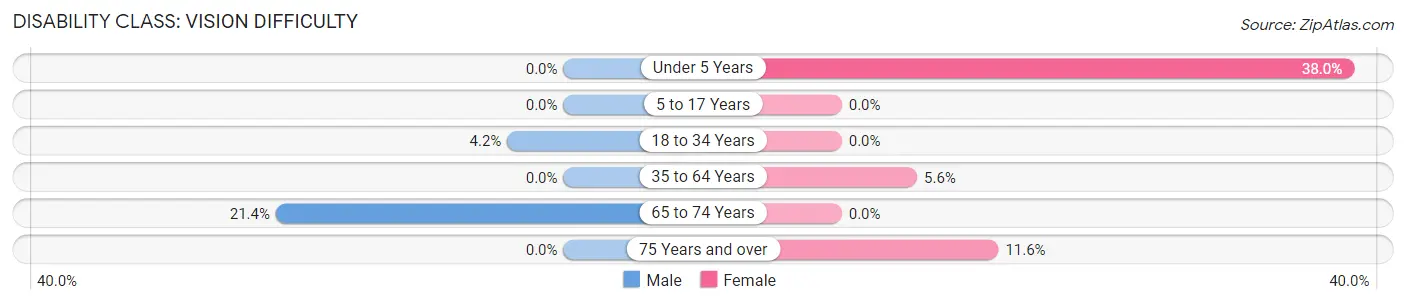
| Age Bracket | Male | Female |
| Under 5 Years | 0 (0.0%) | 27 (38.0%) |
| 5 to 17 Years | 0 (0.0%) | 0 (0.0%) |
| 18 to 34 Years | 4 (4.2%) | 0 (0.0%) |
| 35 to 64 Years | 0 (0.0%) | 18 (5.6%) |
| 65 to 74 Years | 19 (21.3%) | 0 (0.0%) |
| 75 Years and over | 0 (0.0%) | 5 (11.6%) |
Disability Class: Cognitive Difficulty
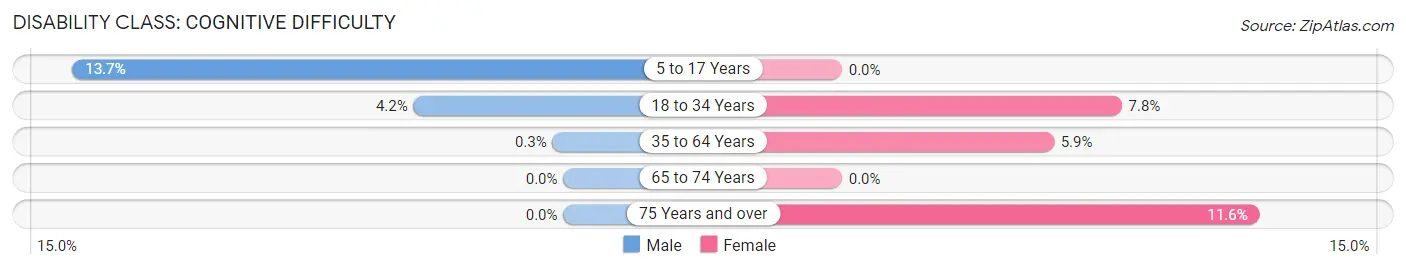
| Age Bracket | Male | Female |
| 5 to 17 Years | 19 (13.7%) | 0 (0.0%) |
| 18 to 34 Years | 4 (4.2%) | 12 (7.8%) |
| 35 to 64 Years | 1 (0.3%) | 19 (5.9%) |
| 65 to 74 Years | 0 (0.0%) | 0 (0.0%) |
| 75 Years and over | 0 (0.0%) | 5 (11.6%) |
Disability Class: Ambulatory Difficulty
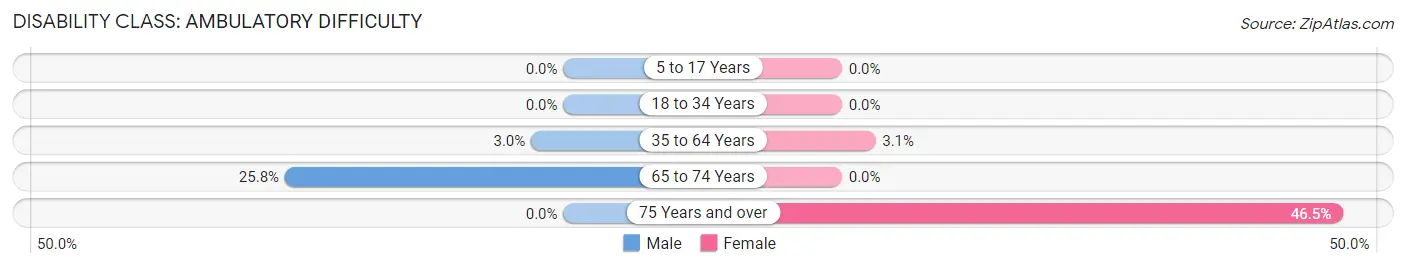
| Age Bracket | Male | Female |
| 5 to 17 Years | 0 (0.0%) | 0 (0.0%) |
| 18 to 34 Years | 0 (0.0%) | 0 (0.0%) |
| 35 to 64 Years | 10 (3.0%) | 10 (3.1%) |
| 65 to 74 Years | 23 (25.8%) | 0 (0.0%) |
| 75 Years and over | 0 (0.0%) | 20 (46.5%) |
Disability Class: Self-Care Difficulty
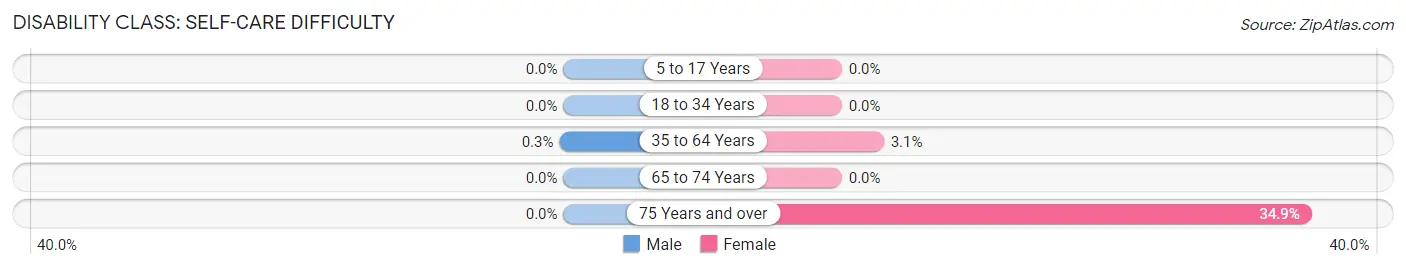
| Age Bracket | Male | Female |
| 5 to 17 Years | 0 (0.0%) | 0 (0.0%) |
| 18 to 34 Years | 0 (0.0%) | 0 (0.0%) |
| 35 to 64 Years | 1 (0.3%) | 10 (3.1%) |
| 65 to 74 Years | 0 (0.0%) | 0 (0.0%) |
| 75 Years and over | 0 (0.0%) | 15 (34.9%) |
Technology Access in Fairmount Heights
Computing Device Access in Fairmount Heights
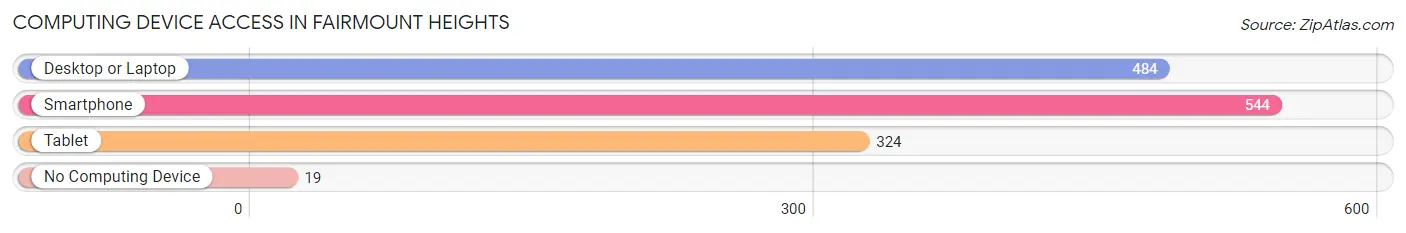
| Device Type | # Households | % Households |
| Desktop or Laptop | 484 | 82.6% |
| Smartphone | 544 | 92.8% |
| Tablet | 324 | 55.3% |
| No Computing Device | 19 | 3.2% |
| Total | 586 | 100.0% |
Internet Access in Fairmount Heights
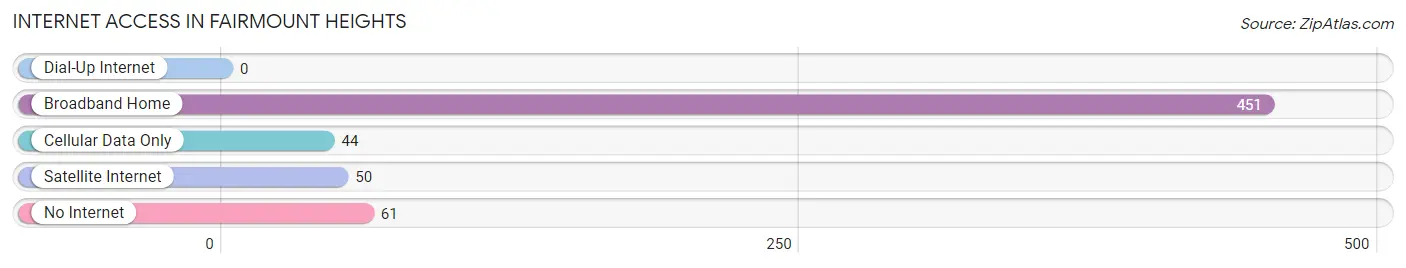
| Internet Type | # Households | % Households |
| Dial-Up Internet | 0 | 0.0% |
| Broadband Home | 451 | 77.0% |
| Cellular Data Only | 44 | 7.5% |
| Satellite Internet | 50 | 8.5% |
| No Internet | 61 | 10.4% |
| Total | 586 | 100.0% |
Fairmount Heights Summary
Introduction
Fairmount Heights is a small town located in Prince George’s County, Maryland. It is situated just east of Washington, D.C. and is part of the Washington Metropolitan Area. The town has a population of approximately 2,000 people and is known for its diverse population and vibrant culture.
History
Fairmount Heights was founded in 1891 by a group of African American farmers who had recently purchased land in the area. The town was originally known as “Fairmount” and was named after the nearby Fairmount Cemetery. The town was incorporated in 1895 and was the first African American-majority town in Prince George’s County.
In the early 20th century, Fairmount Heights was a thriving community with a variety of businesses, churches, and schools. The town was home to a number of prominent African American leaders, including civil rights activist Mary Church Terrell and educator Mary McLeod Bethune.
In the 1950s, the town began to decline as many of its residents moved to nearby Washington, D.C. in search of better job opportunities. The town’s population decreased from a peak of 2,500 in 1950 to just 1,500 in 2000.
Geography
Fairmount Heights is located in Prince George’s County, Maryland. It is situated just east of Washington, D.C. and is part of the Washington Metropolitan Area. The town is bordered by the towns of Bladensburg, Colmar Manor, and Cottage City.
The town is situated on a plateau and is surrounded by rolling hills. The terrain is mostly flat and is covered with a mix of residential and commercial buildings. The town is located near the Anacostia River and is just a few miles from the Potomac River.
Economy
Fairmount Heights is a small town with a limited economy. The town’s main industries are retail, education, and health care. The town is home to a number of small businesses, including restaurants, convenience stores, and auto repair shops.
The town is also home to a number of government agencies, including the U.S. Department of Agriculture and the U.S. Department of Housing and Urban Development. The town is also home to a number of educational institutions, including the University of Maryland and the University of the District of Columbia.
Demographics
As of the 2010 census, the population of Fairmount Heights was 2,000. The town has a diverse population, with African Americans making up the majority of the population (77.3%). Other racial and ethnic groups include Hispanics (14.2%), Whites (4.7%), and Asians (3.8%).
The median household income in Fairmount Heights is $45,000, which is slightly lower than the national average. The town has a poverty rate of 22.3%, which is higher than the national average.
Conclusion
Fairmount Heights is a small town located in Prince George’s County, Maryland. It is situated just east of Washington, D.C. and is part of the Washington Metropolitan Area. The town has a population of approximately 2,000 people and is known for its diverse population and vibrant culture. The town’s main industries are retail, education, and health care. The town has a diverse population, with African Americans making up the majority of the population. The median household income in Fairmount Heights is $45,000, which is slightly lower than the national average.
Common Questions
What is Per Capita Income in Fairmount Heights?
Per Capita income in Fairmount Heights is $36,768.
What is the Median Family Income in Fairmount Heights?
Median Family Income in Fairmount Heights is $84,750.
What is the Median Household income in Fairmount Heights?
Median Household Income in Fairmount Heights is $74,750.
What is Income or Wage Gap in Fairmount Heights?
Income or Wage Gap in Fairmount Heights is 4.7%.
Women in Fairmount Heights earn 95.3 cents for every dollar earned by a man.
What is Inequality or Gini Index in Fairmount Heights?
Inequality or Gini Index in Fairmount Heights is 0.38.
What is the Total Population of Fairmount Heights?
Total Population of Fairmount Heights is 1,490.
What is the Total Male Population of Fairmount Heights?
Total Male Population of Fairmount Heights is 751.
What is the Total Female Population of Fairmount Heights?
Total Female Population of Fairmount Heights is 739.
What is the Ratio of Males per 100 Females in Fairmount Heights?
There are 101.62 Males per 100 Females in Fairmount Heights.
What is the Ratio of Females per 100 Males in Fairmount Heights?
There are 98.40 Females per 100 Males in Fairmount Heights.
What is the Median Population Age in Fairmount Heights?
Median Population Age in Fairmount Heights is 39.2 Years.
What is the Average Family Size in Fairmount Heights
Average Family Size in Fairmount Heights is 3.3 People.
What is the Average Household Size in Fairmount Heights
Average Household Size in Fairmount Heights is 2.5 People.
How Large is the Labor Force in Fairmount Heights?
There are 786 People in the Labor Forcein in Fairmount Heights.
What is the Percentage of People in the Labor Force in Fairmount Heights?
68.7% of People are in the Labor Force in Fairmount Heights.
What is the Unemployment Rate in Fairmount Heights?
Unemployment Rate in Fairmount Heights is 7.1%.