Cities with the Highest Percentage of Population Employed in Mining, Quarrying, & Extraction in Maryland
RELATED REPORTS & OPTIONS
Mining, Quarrying, & Extraction
Maryland
Compare Cities
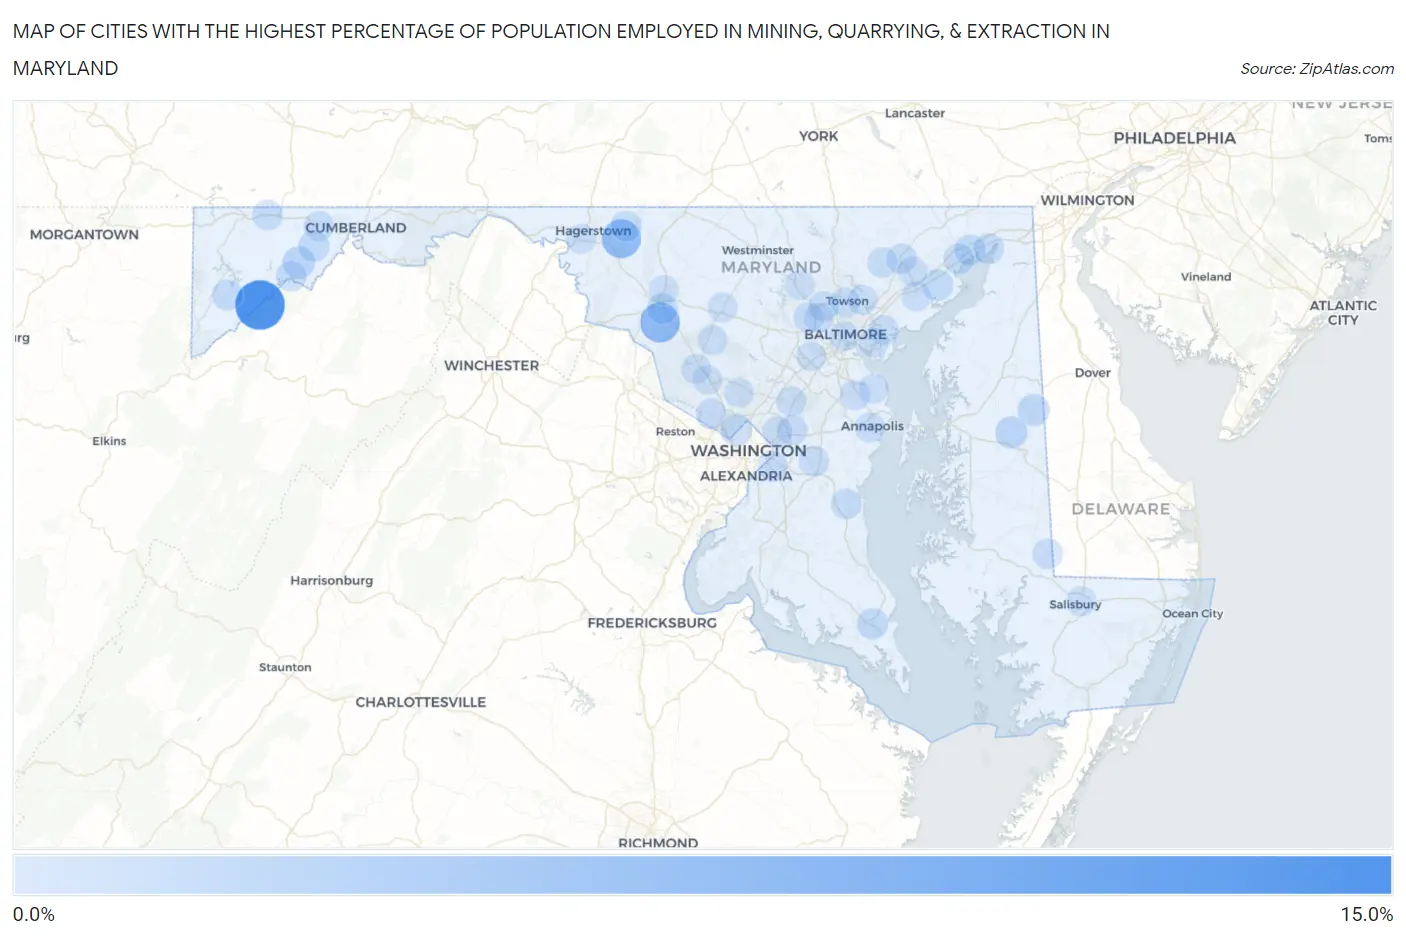
Map of Cities with the Highest Percentage of Population Employed in Mining, Quarrying, & Extraction in Maryland
0.0%
15.0%
Cities with the Highest Percentage of Population Employed in Mining, Quarrying, & Extraction in Maryland
| City | % Employed | vs State | vs National | |
| 1. | Kitzmiller | 14.8% | 0.054%(+14.7)#1 | 0.44%(+14.3)#424 |
| 2. | Buckeystown | 7.3% | 0.054%(+7.20)#2 | 0.44%(+6.81)#1,102 |
| 3. | Jugtown | 6.5% | 0.054%(+6.44)#3 | 0.44%(+6.05)#1,252 |
| 4. | Barton | 1.7% | 0.054%(+1.63)#4 | 0.44%(+1.25)#3,571 |
| 5. | Ridgely | 1.5% | 0.054%(+1.46)#5 | 0.44%(+1.08)#3,804 |
| 6. | Friendship Heights Village | 1.4% | 0.054%(+1.31)#6 | 0.44%(+0.919)#4,007 |
| 7. | Goldsboro | 1.2% | 0.054%(+1.17)#7 | 0.44%(+0.779)#4,214 |
| 8. | Perryman | 1.1% | 0.054%(+1.02)#8 | 0.44%(+0.638)#4,432 |
| 9. | California | 0.96% | 0.054%(+0.904)#9 | 0.44%(+0.518)#4,650 |
| 10. | Abingdon | 0.79% | 0.054%(+0.739)#10 | 0.44%(+0.353)#4,948 |
| 11. | Perryville | 0.69% | 0.054%(+0.638)#11 | 0.44%(+0.252)#5,227 |
| 12. | Midland | 0.69% | 0.054%(+0.635)#12 | 0.44%(+0.249)#5,232 |
| 13. | Deer Park | 0.67% | 0.054%(+0.612)#13 | 0.44%(+0.226)#5,283 |
| 14. | Ballenger Creek | 0.66% | 0.054%(+0.604)#14 | 0.44%(+0.218)#5,302 |
| 15. | Owings | 0.59% | 0.054%(+0.538)#15 | 0.44%(+0.152)#5,511 |
| 16. | Grantsville | 0.53% | 0.054%(+0.478)#16 | 0.44%(+0.092)#5,691 |
| 17. | Westernport | 0.52% | 0.054%(+0.465)#17 | 0.44%(+0.079)#5,720 |
| 18. | Havre De Grace | 0.50% | 0.054%(+0.449)#18 | 0.44%(+0.063)#5,768 |
| 19. | Charlestown | 0.47% | 0.054%(+0.414)#19 | 0.44%(+0.028)#5,873 |
| 20. | Smithsburg | 0.47% | 0.054%(+0.414)#20 | 0.44%(+0.028)#5,875 |
| 21. | Fallston | 0.33% | 0.054%(+0.277)#21 | 0.44%(-0.109)#6,381 |
| 22. | Brock Hall | 0.32% | 0.054%(+0.263)#22 | 0.44%(-0.123)#6,428 |
| 23. | Bel Air North | 0.31% | 0.054%(+0.256)#23 | 0.44%(-0.130)#6,453 |
| 24. | Silver Hill | 0.27% | 0.054%(+0.215)#24 | 0.44%(-0.171)#6,602 |
| 25. | Sharptown | 0.24% | 0.054%(+0.186)#25 | 0.44%(-0.200)#6,698 |
| 26. | Potomac | 0.23% | 0.054%(+0.176)#26 | 0.44%(-0.210)#6,731 |
| 27. | Frostburg | 0.21% | 0.054%(+0.159)#27 | 0.44%(-0.227)#6,808 |
| 28. | Annapolis | 0.19% | 0.054%(+0.134)#28 | 0.44%(-0.252)#6,917 |
| 29. | Pikesville | 0.19% | 0.054%(+0.133)#29 | 0.44%(-0.253)#6,922 |
| 30. | Lanham | 0.16% | 0.054%(+0.107)#30 | 0.44%(-0.279)#7,020 |
| 31. | Severna Park | 0.16% | 0.054%(+0.106)#31 | 0.44%(-0.280)#7,025 |
| 32. | Reisterstown | 0.15% | 0.054%(+0.092)#32 | 0.44%(-0.294)#7,087 |
| 33. | Towson | 0.14% | 0.054%(+0.089)#33 | 0.44%(-0.297)#7,107 |
| 34. | South Laurel | 0.13% | 0.054%(+0.074)#34 | 0.44%(-0.312)#7,184 |
| 35. | Lake Shore | 0.12% | 0.054%(+0.066)#35 | 0.44%(-0.320)#7,230 |
| 36. | Halfway | 0.12% | 0.054%(+0.065)#36 | 0.44%(-0.321)#7,236 |
| 37. | East Riverdale | 0.12% | 0.054%(+0.063)#37 | 0.44%(-0.323)#7,249 |
| 38. | Frederick | 0.10% | 0.054%(+0.046)#38 | 0.44%(-0.340)#7,335 |
| 39. | Carney | 0.10% | 0.054%(+0.046)#39 | 0.44%(-0.340)#7,336 |
| 40. | Mount Airy | 0.095% | 0.054%(+0.040)#40 | 0.44%(-0.346)#7,365 |
| 41. | Milford Mill | 0.088% | 0.054%(+0.034)#41 | 0.44%(-0.353)#7,408 |
| 42. | Lochearn | 0.086% | 0.054%(+0.031)#42 | 0.44%(-0.355)#7,419 |
| 43. | Damascus | 0.073% | 0.054%(+0.019)#43 | 0.44%(-0.367)#7,508 |
| 44. | Baltimore | 0.064% | 0.054%(+0.010)#44 | 0.44%(-0.376)#7,569 |
| 45. | Edgewood | 0.062% | 0.054%(+0.007)#45 | 0.44%(-0.379)#7,586 |
| 46. | Salisbury | 0.045% | 0.054%(-0.009)#46 | 0.44%(-0.395)#7,692 |
| 47. | Essex | 0.044% | 0.054%(-0.010)#47 | 0.44%(-0.397)#7,701 |
| 48. | Ilchester | 0.038% | 0.054%(-0.016)#48 | 0.44%(-0.402)#7,748 |
| 49. | Gaithersburg | 0.034% | 0.054%(-0.020)#49 | 0.44%(-0.406)#7,769 |
| 50. | Germantown | 0.034% | 0.054%(-0.020)#50 | 0.44%(-0.406)#7,772 |
| 51. | Bel Air South | 0.030% | 0.054%(-0.024)#51 | 0.44%(-0.411)#7,808 |
| 52. | Dundalk | 0.027% | 0.054%(-0.027)#52 | 0.44%(-0.413)#7,825 |
| 53. | Aspen Hill | 0.024% | 0.054%(-0.030)#53 | 0.44%(-0.416)#7,845 |
Common Questions
What are the Top 10 Cities with the Highest Percentage of Population Employed in Mining, Quarrying, & Extraction in Maryland?
Top 10 Cities with the Highest Percentage of Population Employed in Mining, Quarrying, & Extraction in Maryland are:
#1
14.8%
#2
7.3%
#3
6.5%
#4
1.7%
#5
1.5%
#6
1.4%
#7
1.2%
#8
1.1%
#9
0.96%
#10
0.69%
What city has the Highest Percentage of Population Employed in Mining, Quarrying, & Extraction in Maryland?
Kitzmiller has the Highest Percentage of Population Employed in Mining, Quarrying, & Extraction in Maryland with 14.8%.
What is the Percentage of Population Employed in Mining, Quarrying, & Extraction in the State of Maryland?
Percentage of Population Employed in Mining, Quarrying, & Extraction in Maryland is 0.054%.
What is the Percentage of Population Employed in Mining, Quarrying, & Extraction in the United States?
Percentage of Population Employed in Mining, Quarrying, & Extraction in the United States is 0.44%.