Landover, MD Map & Demographics
Landover Map

Landover Overview
$34,054
PER CAPITA INCOME
$79,953
AVG FAMILY INCOME
$68,643
AVG HOUSEHOLD INCOME
9.7%
WAGE / INCOME GAP [ % ]
90.3¢/ $1
WAGE / INCOME GAP [ $ ]
$12,208
FAMILY INCOME DEFICIT
0.47
INEQUALITY / GINI INDEX
24,430
TOTAL POPULATION
11,279
MALE POPULATION
13,151
FEMALE POPULATION
85.77
MALES / 100 FEMALES
116.60
FEMALES / 100 MALES
35.1
MEDIAN AGE
3.6
AVG FAMILY SIZE
2.8
AVG HOUSEHOLD SIZE
13,037
LABOR FORCE [ PEOPLE ]
70.6%
PERCENT IN LABOR FORCE
6.0%
UNEMPLOYMENT RATE
Income in Landover
Income Overview in Landover
Per Capita Income in Landover is $34,054, while median incomes of families and households are $79,953 and $68,643 respectively.
| Characteristic | Number | Measure |
| Per Capita Income | 24,430 | $34,054 |
| Median Family Income | 5,407 | $79,953 |
| Mean Family Income | 5,407 | $108,745 |
| Median Household Income | 8,737 | $68,643 |
| Mean Household Income | 8,737 | $91,701 |
| Income Deficit | 5,407 | $12,208 |
| Wage / Income Gap (%) | 24,430 | 9.66% |
| Wage / Income Gap ($) | 24,430 | 90.34¢ per $1 |
| Gini / Inequality Index | 24,430 | 0.47 |
Earnings by Sex in Landover
Average Earnings in Landover are $40,365, $42,248 for men and $38,168 for women, a difference of 9.7%.
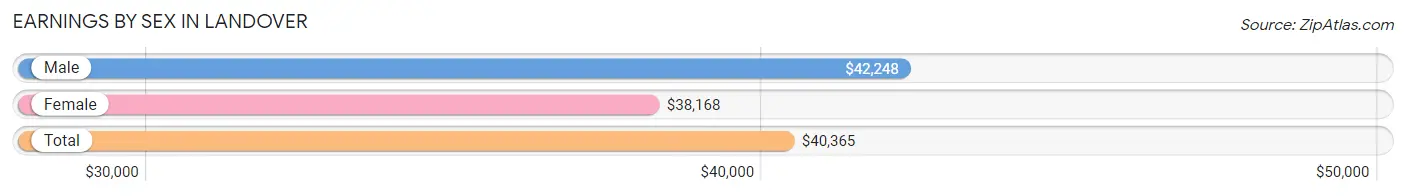
| Sex | Number | Average Earnings |
| Male | 6,410 (48.0%) | $42,248 |
| Female | 6,951 (52.0%) | $38,168 |
| Total | 13,361 (100.0%) | $40,365 |
Earnings by Sex by Income Bracket in Landover
The most common earnings brackets in Landover are $45,000 to $49,999 for men (660 | 10.3%) and $40,000 to $44,999 for women (727 | 10.5%).
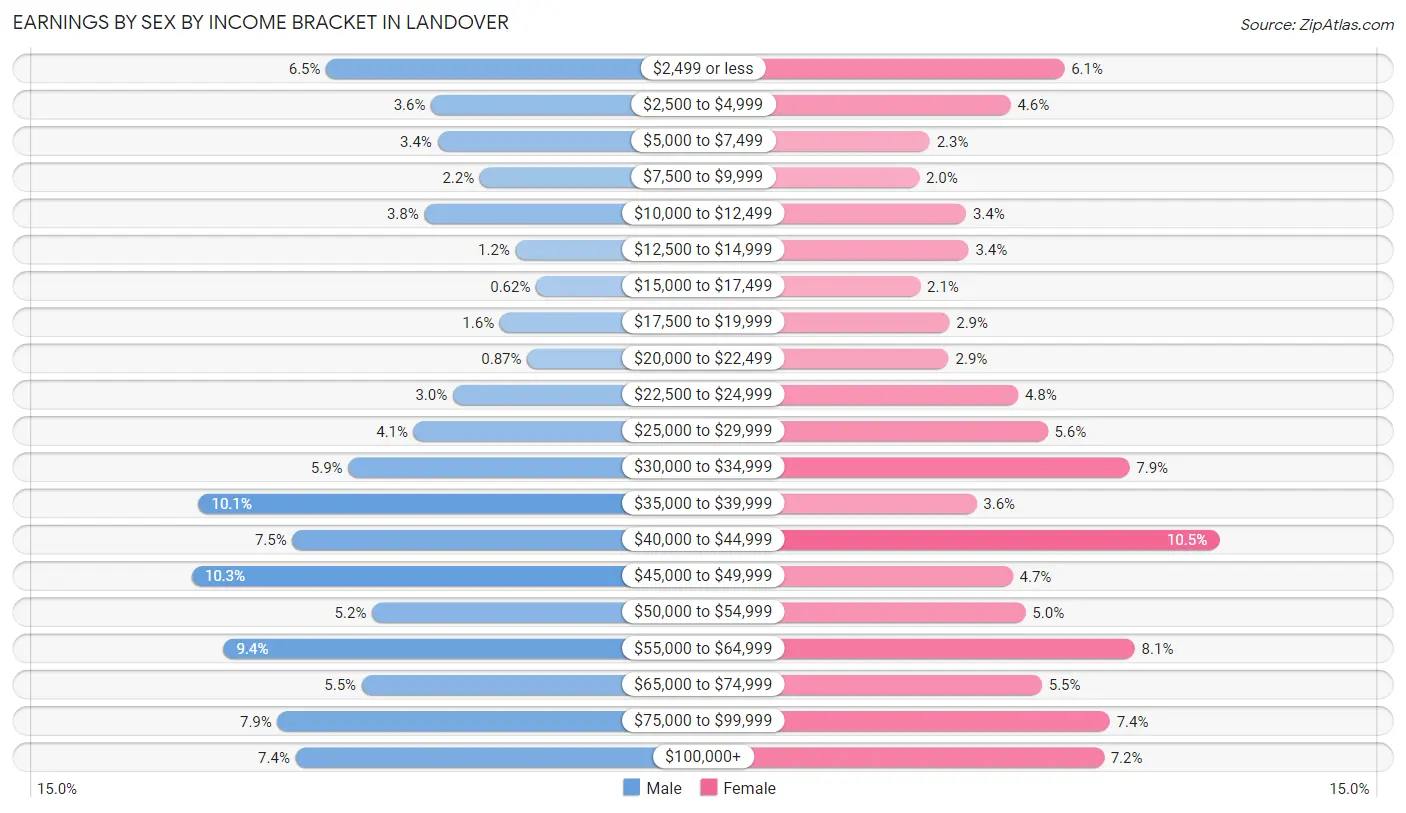
| Income | Male | Female |
| $2,499 or less | 418 (6.5%) | 425 (6.1%) |
| $2,500 to $4,999 | 229 (3.6%) | 320 (4.6%) |
| $5,000 to $7,499 | 217 (3.4%) | 162 (2.3%) |
| $7,500 to $9,999 | 141 (2.2%) | 141 (2.0%) |
| $10,000 to $12,499 | 241 (3.8%) | 233 (3.4%) |
| $12,500 to $14,999 | 77 (1.2%) | 238 (3.4%) |
| $15,000 to $17,499 | 40 (0.6%) | 143 (2.1%) |
| $17,500 to $19,999 | 105 (1.6%) | 200 (2.9%) |
| $20,000 to $22,499 | 56 (0.9%) | 199 (2.9%) |
| $22,500 to $24,999 | 190 (3.0%) | 334 (4.8%) |
| $25,000 to $29,999 | 260 (4.1%) | 392 (5.6%) |
| $30,000 to $34,999 | 378 (5.9%) | 552 (7.9%) |
| $35,000 to $39,999 | 648 (10.1%) | 253 (3.6%) |
| $40,000 to $44,999 | 479 (7.5%) | 727 (10.5%) |
| $45,000 to $49,999 | 660 (10.3%) | 324 (4.7%) |
| $50,000 to $54,999 | 335 (5.2%) | 349 (5.0%) |
| $55,000 to $64,999 | 603 (9.4%) | 562 (8.1%) |
| $65,000 to $74,999 | 354 (5.5%) | 381 (5.5%) |
| $75,000 to $99,999 | 506 (7.9%) | 514 (7.4%) |
| $100,000+ | 473 (7.4%) | 502 (7.2%) |
| Total | 6,410 (100.0%) | 6,951 (100.0%) |
Earnings by Sex by Educational Attainment in Landover
Average earnings in Landover are $45,537 for men and $41,599 for women, a difference of 8.6%. Men with an educational attainment of bachelor's degree enjoy the highest average annual earnings of $58,650, while those with college or associate's degree education earn the least with $39,692. Women with an educational attainment of graduate degree earn the most with the average annual earnings of $53,077, while those with less than high school education have the smallest earnings of $24,504.
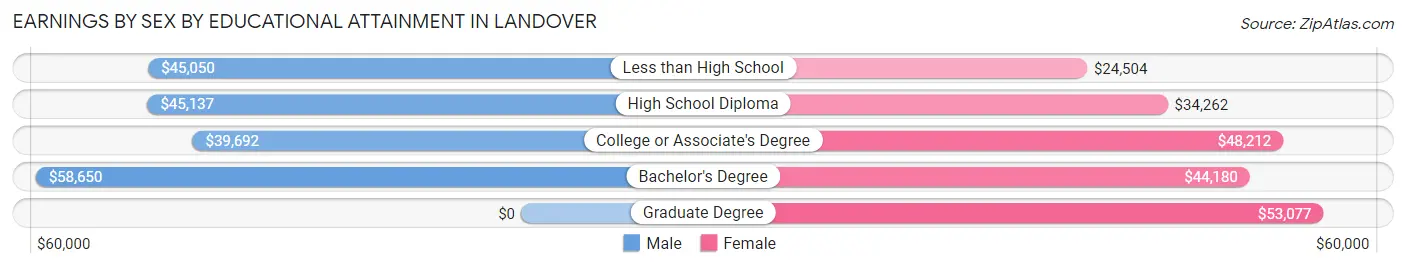
| Educational Attainment | Male Income | Female Income |
| Less than High School | $45,050 | $24,504 |
| High School Diploma | $45,137 | $34,262 |
| College or Associate's Degree | $39,692 | $48,212 |
| Bachelor's Degree | $58,650 | $44,180 |
| Graduate Degree | - | - |
| Total | $45,537 | $41,599 |
Family Income in Landover
Family Income Brackets in Landover
According to the Landover family income data, there are 1,141 families falling into the $75,000 to $99,999 income range, which is the most common income bracket and makes up 21.1% of all families. Conversely, the $10,000 to $14,999 income bracket is the least frequent group with only 124 families (2.3%) belonging to this category.
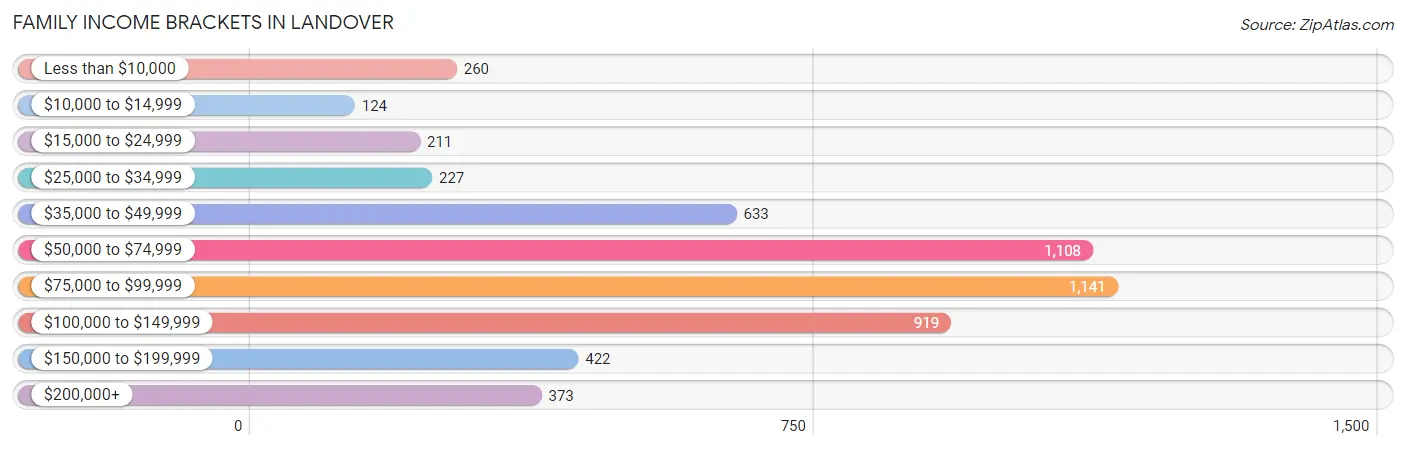
| Income Bracket | # Families | % Families |
| Less than $10,000 | 260 | 4.8% |
| $10,000 to $14,999 | 124 | 2.3% |
| $15,000 to $24,999 | 211 | 3.9% |
| $25,000 to $34,999 | 227 | 4.2% |
| $35,000 to $49,999 | 633 | 11.7% |
| $50,000 to $74,999 | 1,108 | 20.5% |
| $75,000 to $99,999 | 1,141 | 21.1% |
| $100,000 to $149,999 | 919 | 17.0% |
| $150,000 to $199,999 | 422 | 7.8% |
| $200,000+ | 373 | 6.9% |
Family Income by Famaliy Size in Landover
4-person families (960 | 17.7%) account for the highest median family income in Landover with $91,523 per family, while 2-person families (2,104 | 38.9%) have the highest median income of $39,024 per family member.
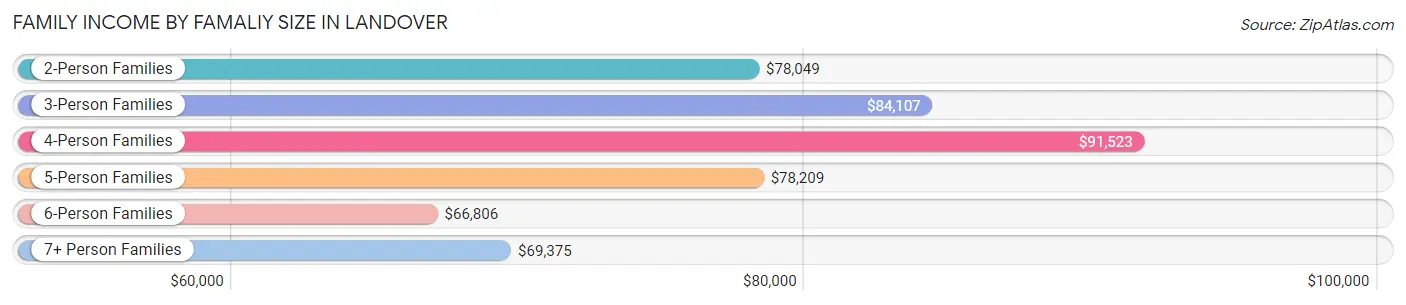
| Income Bracket | # Families | Median Income |
| 2-Person Families | 2,104 (38.9%) | $78,049 |
| 3-Person Families | 1,184 (21.9%) | $84,107 |
| 4-Person Families | 960 (17.7%) | $91,523 |
| 5-Person Families | 507 (9.4%) | $78,209 |
| 6-Person Families | 326 (6.0%) | $66,806 |
| 7+ Person Families | 326 (6.0%) | $69,375 |
| Total | 5,407 (100.0%) | $79,953 |
Family Income by Number of Earners in Landover
The median family income in Landover is $79,953, with families comprising 3+ earners (899) having the highest median family income of $124,081, while families with 1 earner (1,762) have the lowest median family income of $50,324, accounting for 16.6% and 32.6% of families, respectively.
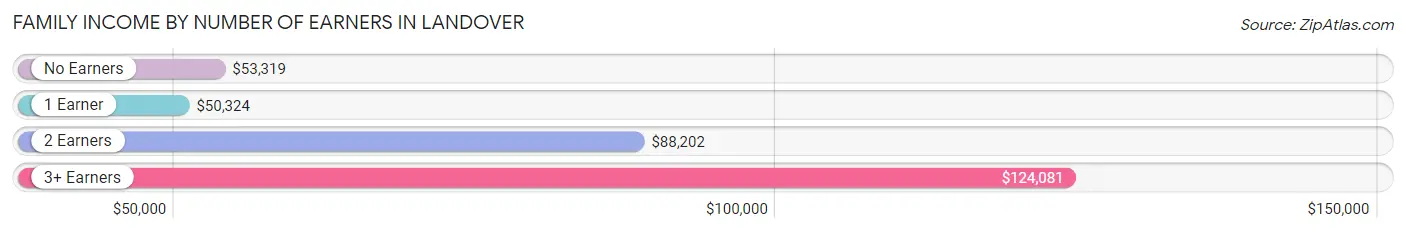
| Number of Earners | # Families | Median Income |
| No Earners | 417 (7.7%) | $53,319 |
| 1 Earner | 1,762 (32.6%) | $50,324 |
| 2 Earners | 2,329 (43.1%) | $88,202 |
| 3+ Earners | 899 (16.6%) | $124,081 |
| Total | 5,407 (100.0%) | $79,953 |
Household Income in Landover
Household Income Brackets in Landover
With 1,686 households falling in the category, the $50,000 to $74,999 income range is the most frequent in Landover, accounting for 19.3% of all households. In contrast, only 288 households (3.3%) fall into the $10,000 to $14,999 income bracket, making it the least populous group.
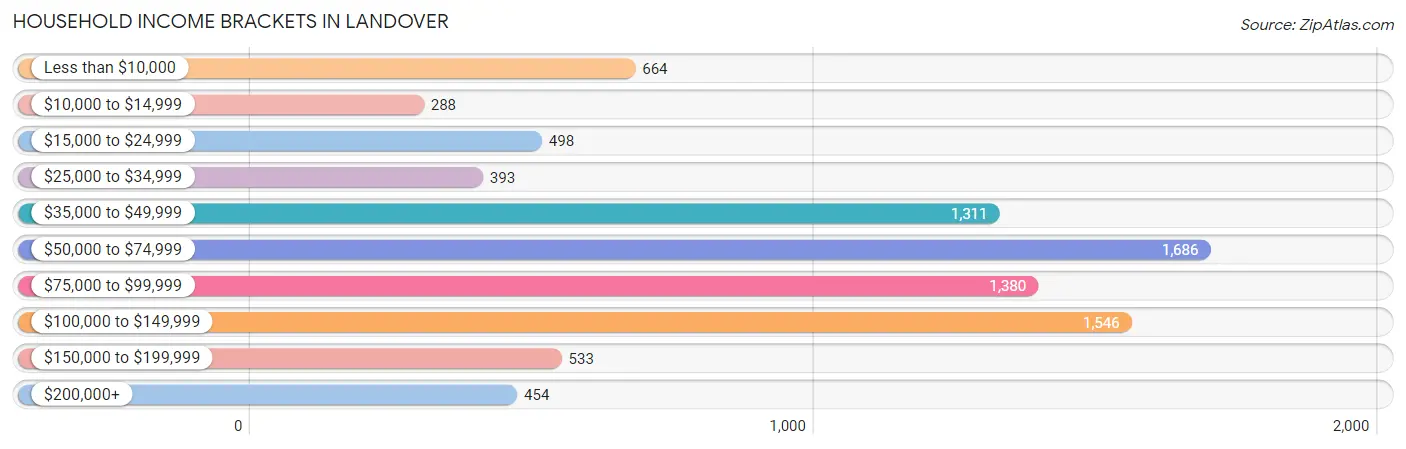
| Income Bracket | # Households | % Households |
| Less than $10,000 | 664 | 7.6% |
| $10,000 to $14,999 | 288 | 3.3% |
| $15,000 to $24,999 | 498 | 5.7% |
| $25,000 to $34,999 | 393 | 4.5% |
| $35,000 to $49,999 | 1,311 | 15.0% |
| $50,000 to $74,999 | 1,686 | 19.3% |
| $75,000 to $99,999 | 1,380 | 15.8% |
| $100,000 to $149,999 | 1,546 | 17.7% |
| $150,000 to $199,999 | 533 | 6.1% |
| $200,000+ | 454 | 5.2% |
Household Income by Householder Age in Landover
The median household income in Landover is $68,643, with the highest median household income of $81,000 found in the 45 to 64 years age bracket for the primary householder. A total of 3,374 households (38.6%) fall into this category. Meanwhile, the 15 to 24 years age bracket for the primary householder has the lowest median household income of $50,950, with 185 households (2.1%) in this group.
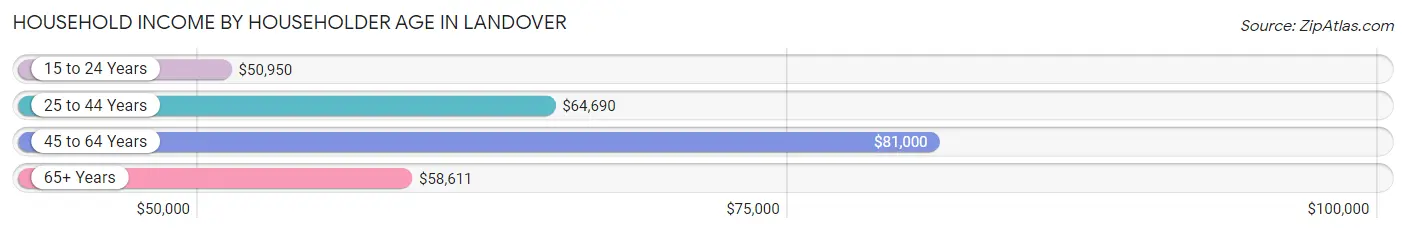
| Income Bracket | # Households | Median Income |
| 15 to 24 Years | 185 (2.1%) | $50,950 |
| 25 to 44 Years | 3,362 (38.5%) | $64,690 |
| 45 to 64 Years | 3,374 (38.6%) | $81,000 |
| 65+ Years | 1,816 (20.8%) | $58,611 |
| Total | 8,737 (100.0%) | $68,643 |
Poverty in Landover
Income Below Poverty by Sex and Age in Landover
With 17.5% poverty level for males and 18.4% for females among the residents of Landover, 15 year old males and 16 and 17 year old females are the most vulnerable to poverty, with 48 males (48.5%) and 148 females (39.8%) in their respective age groups living below the poverty level.
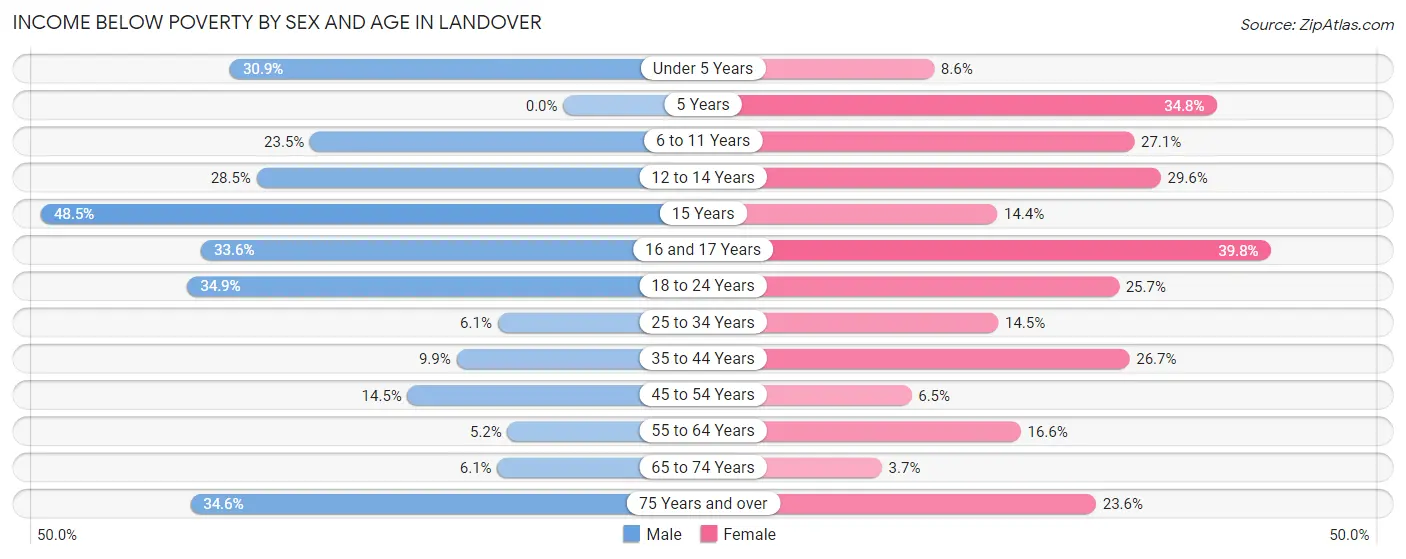
| Age Bracket | Male | Female |
| Under 5 Years | 276 (30.9%) | 85 (8.6%) |
| 5 Years | 0 (0.0%) | 81 (34.8%) |
| 6 to 11 Years | 259 (23.5%) | 285 (27.1%) |
| 12 to 14 Years | 181 (28.5%) | 129 (29.6%) |
| 15 Years | 48 (48.5%) | 34 (14.4%) |
| 16 and 17 Years | 121 (33.6%) | 148 (39.8%) |
| 18 to 24 Years | 321 (34.9%) | 239 (25.7%) |
| 25 to 34 Years | 88 (6.1%) | 317 (14.5%) |
| 35 to 44 Years | 186 (9.9%) | 523 (26.7%) |
| 45 to 54 Years | 246 (14.4%) | 87 (6.5%) |
| 55 to 64 Years | 54 (5.2%) | 270 (16.6%) |
| 65 to 74 Years | 35 (6.1%) | 36 (3.7%) |
| 75 Years and over | 126 (34.6%) | 181 (23.6%) |
| Total | 1,941 (17.5%) | 2,415 (18.4%) |
Income Above Poverty by Sex and Age in Landover
According to the poverty statistics in Landover, males aged 5 years and females aged 65 to 74 years are the age groups that are most secure financially, with 100.0% of males and 96.3% of females in these age groups living above the poverty line.
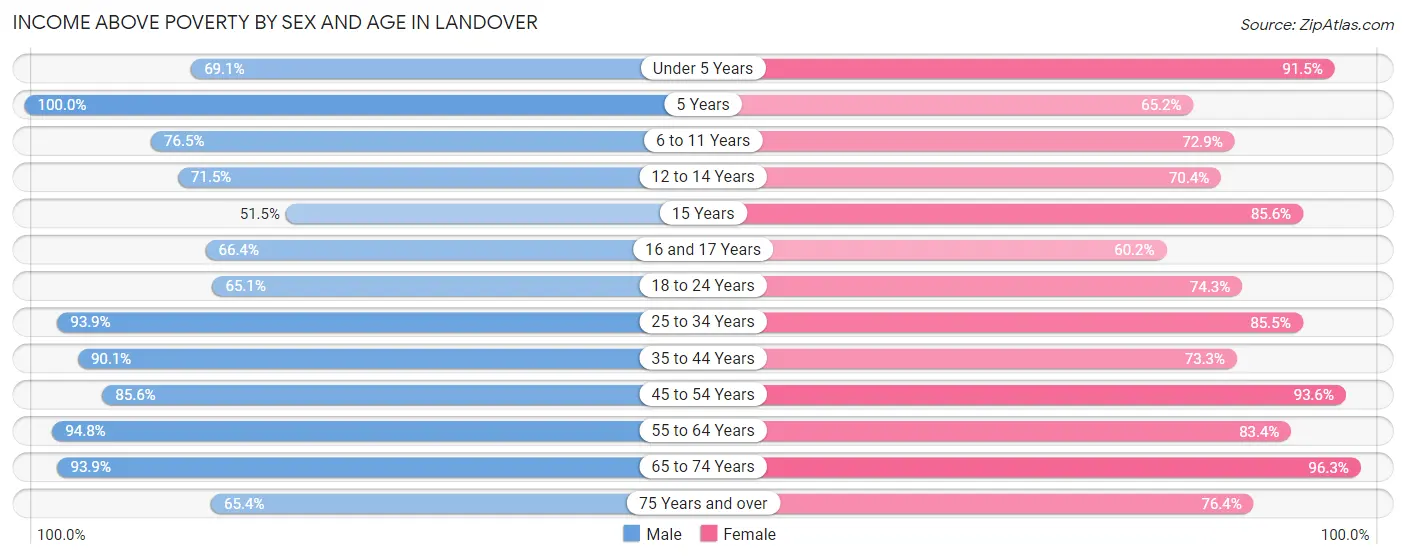
| Age Bracket | Male | Female |
| Under 5 Years | 616 (69.1%) | 909 (91.4%) |
| 5 Years | 94 (100.0%) | 152 (65.2%) |
| 6 to 11 Years | 843 (76.5%) | 766 (72.9%) |
| 12 to 14 Years | 455 (71.5%) | 307 (70.4%) |
| 15 Years | 51 (51.5%) | 202 (85.6%) |
| 16 and 17 Years | 239 (66.4%) | 224 (60.2%) |
| 18 to 24 Years | 599 (65.1%) | 691 (74.3%) |
| 25 to 34 Years | 1,358 (93.9%) | 1,869 (85.5%) |
| 35 to 44 Years | 1,691 (90.1%) | 1,437 (73.3%) |
| 45 to 54 Years | 1,457 (85.6%) | 1,261 (93.5%) |
| 55 to 64 Years | 990 (94.8%) | 1,357 (83.4%) |
| 65 to 74 Years | 537 (93.9%) | 936 (96.3%) |
| 75 Years and over | 238 (65.4%) | 587 (76.4%) |
| Total | 9,168 (82.5%) | 10,698 (81.6%) |
Income Below Poverty Among Married-Couple Families in Landover
The poverty statistics for married-couple families in Landover show that 10.1% or 294 of the total 2,915 families live below the poverty line. Families with 5 or more children have the highest poverty rate of 68.5%, comprising of 74 families. On the other hand, families with no children have the lowest poverty rate of 4.9%, which includes 67 families.
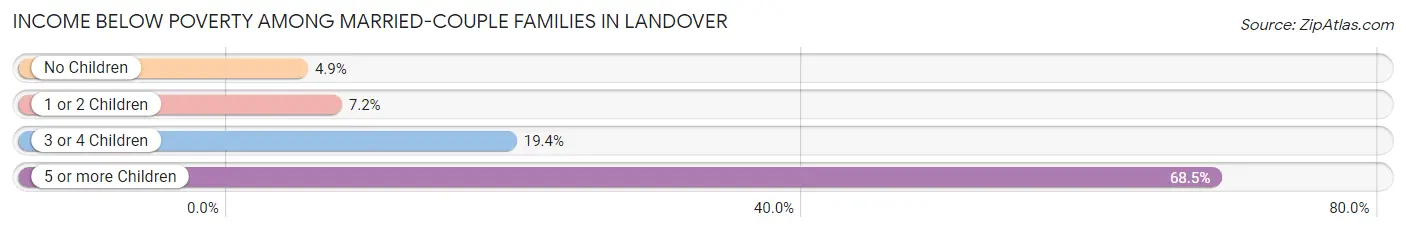
| Children | Above Poverty | Below Poverty |
| No Children | 1,310 (95.1%) | 67 (4.9%) |
| 1 or 2 Children | 949 (92.8%) | 74 (7.2%) |
| 3 or 4 Children | 328 (80.6%) | 79 (19.4%) |
| 5 or more Children | 34 (31.5%) | 74 (68.5%) |
| Total | 2,621 (89.9%) | 294 (10.1%) |
Income Below Poverty Among Single-Parent Households in Landover
According to the poverty data in Landover, 19.0% or 110 single-father households and 16.4% or 314 single-mother households are living below the poverty line. Among single-father households, those with 1 or 2 children have the highest poverty rate, with 85 households (37.3%) experiencing poverty. Likewise, among single-mother households, those with 5 or more children have the highest poverty rate, with 13 households (100.0%) falling below the poverty line.
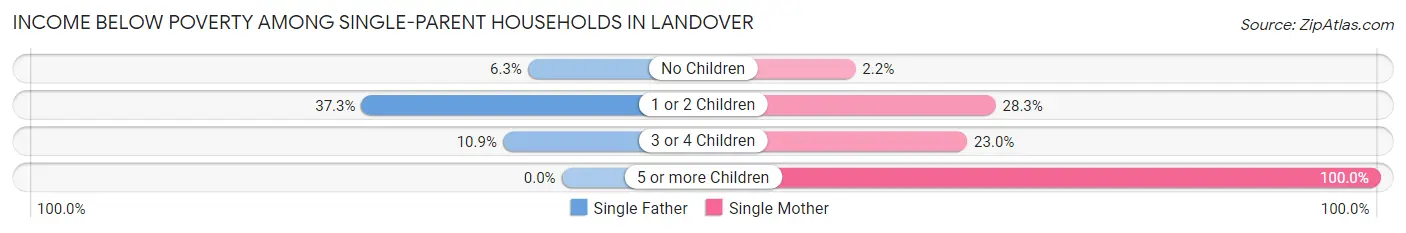
| Children | Single Father | Single Mother |
| No Children | 18 (6.3%) | 19 (2.2%) |
| 1 or 2 Children | 85 (37.3%) | 236 (28.3%) |
| 3 or 4 Children | 7 (10.9%) | 46 (23.0%) |
| 5 or more Children | 0 (0.0%) | 13 (100.0%) |
| Total | 110 (19.0%) | 314 (16.4%) |
Income Below Poverty Among Married-Couple vs Single-Parent Households in Landover
The poverty data for Landover shows that 294 of the married-couple family households (10.1%) and 424 of the single-parent households (17.0%) are living below the poverty level. Within the married-couple family households, those with 5 or more children have the highest poverty rate, with 74 households (68.5%) falling below the poverty line. Among the single-parent households, those with 5 or more children have the highest poverty rate, with 13 household (100.0%) living below poverty.
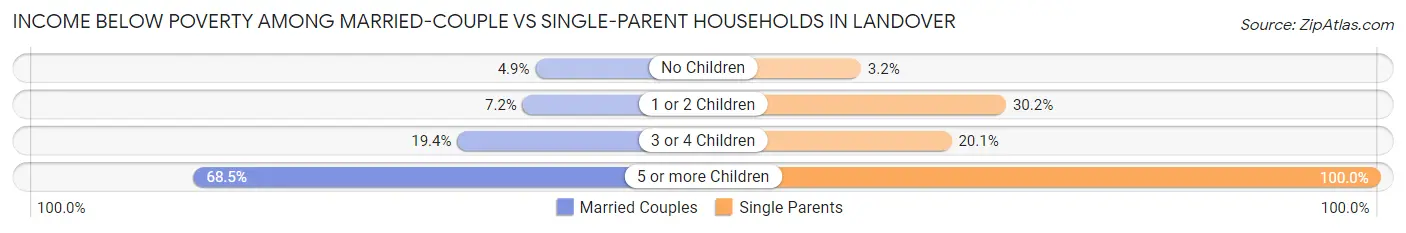
| Children | Married-Couple Families | Single-Parent Households |
| No Children | 67 (4.9%) | 37 (3.2%) |
| 1 or 2 Children | 74 (7.2%) | 321 (30.2%) |
| 3 or 4 Children | 79 (19.4%) | 53 (20.1%) |
| 5 or more Children | 74 (68.5%) | 13 (100.0%) |
| Total | 294 (10.1%) | 424 (17.0%) |
Race in Landover
The most populous races in Landover are Black / African American (16,753 | 68.6%), Hispanic or Latino (5,785 | 23.7%), and Some other Race (4,714 | 19.3%).
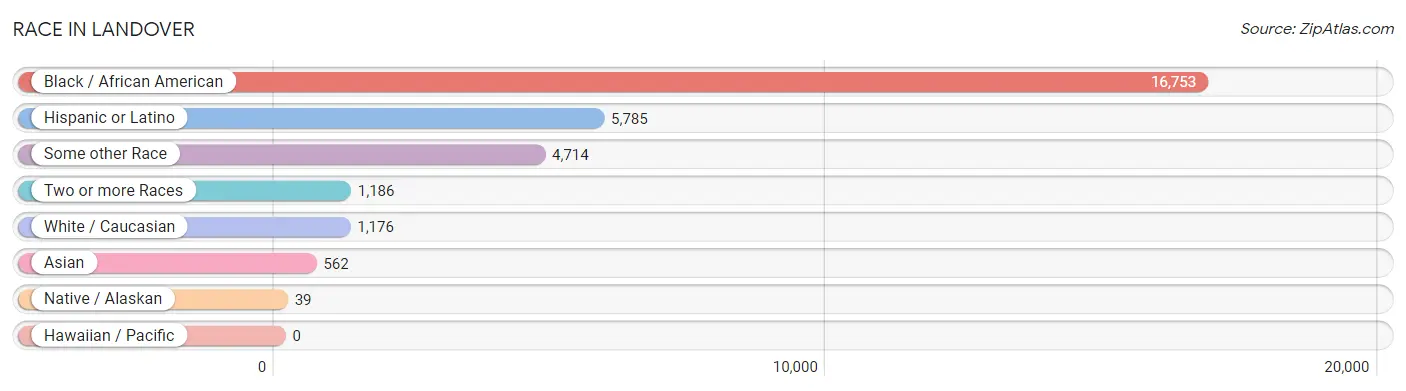
| Race | # Population | % Population |
| Asian | 562 | 2.3% |
| Black / African American | 16,753 | 68.6% |
| Hawaiian / Pacific | 0 | 0.0% |
| Hispanic or Latino | 5,785 | 23.7% |
| Native / Alaskan | 39 | 0.2% |
| White / Caucasian | 1,176 | 4.8% |
| Two or more Races | 1,186 | 4.9% |
| Some other Race | 4,714 | 19.3% |
| Total | 24,430 | 100.0% |
Ancestry in Landover
The most populous ancestries reported in Landover are Subsaharan African (3,551 | 14.5%), Central American (3,373 | 13.8%), Salvadoran (2,641 | 10.8%), African (1,581 | 6.5%), and Mexican (1,460 | 6.0%), together accounting for 51.6% of all Landover residents.
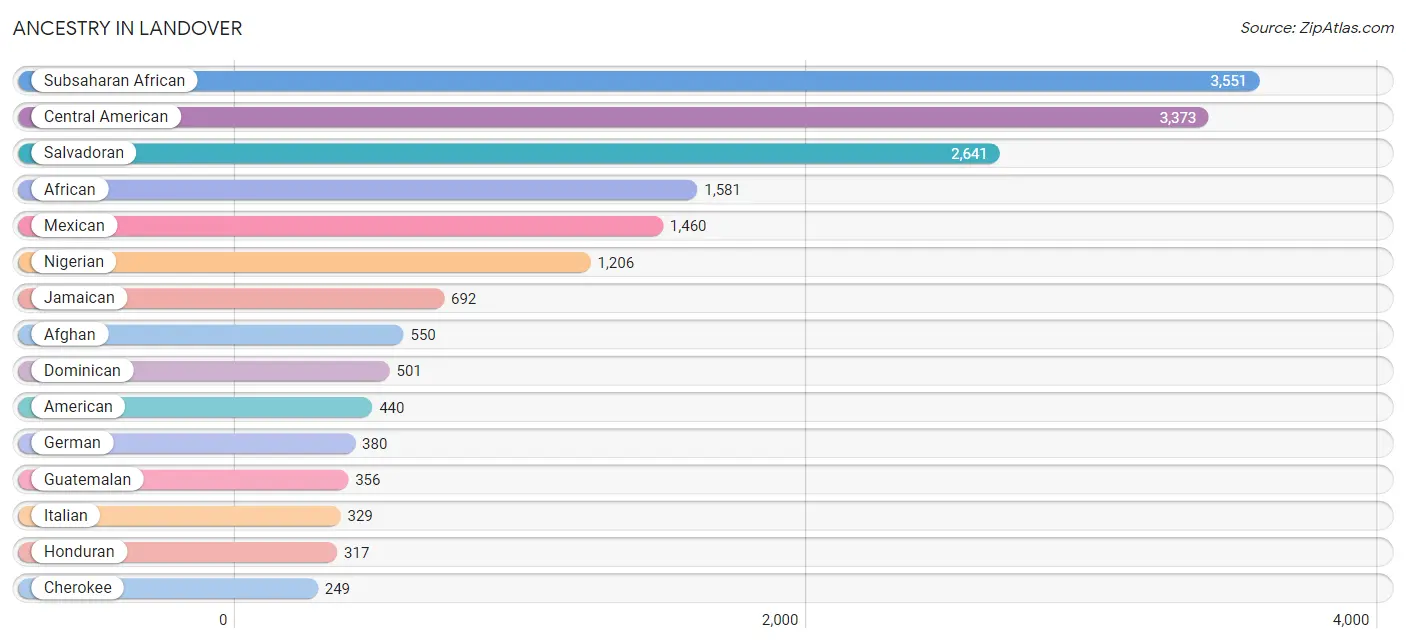
| Ancestry | # Population | % Population |
| Afghan | 550 | 2.2% |
| African | 1,581 | 6.5% |
| American | 440 | 1.8% |
| Arab | 96 | 0.4% |
| Barbadian | 44 | 0.2% |
| Bermudan | 19 | 0.1% |
| Blackfeet | 87 | 0.4% |
| British West Indian | 28 | 0.1% |
| Burmese | 29 | 0.1% |
| Central American | 3,373 | 13.8% |
| Cherokee | 249 | 1.0% |
| Cuban | 104 | 0.4% |
| Danish | 9 | 0.0% |
| Dominican | 501 | 2.1% |
| Dutch | 9 | 0.0% |
| Eastern European | 11 | 0.1% |
| English | 58 | 0.2% |
| European | 27 | 0.1% |
| French | 38 | 0.2% |
| German | 380 | 1.6% |
| Ghanaian | 167 | 0.7% |
| Greek | 10 | 0.0% |
| Guatemalan | 356 | 1.5% |
| Guyanese | 121 | 0.5% |
| Haitian | 56 | 0.2% |
| Honduran | 317 | 1.3% |
| Indian (Asian) | 118 | 0.5% |
| Iraqi | 67 | 0.3% |
| Irish | 189 | 0.8% |
| Israeli | 30 | 0.1% |
| Italian | 329 | 1.3% |
| Jamaican | 692 | 2.8% |
| Korean | 42 | 0.2% |
| Liberian | 213 | 0.9% |
| Mexican | 1,460 | 6.0% |
| Mexican American Indian | 39 | 0.2% |
| Nicaraguan | 59 | 0.2% |
| Nigerian | 1,206 | 4.9% |
| Norwegian | 21 | 0.1% |
| Polish | 20 | 0.1% |
| Portuguese | 8 | 0.0% |
| Puerto Rican | 41 | 0.2% |
| Salvadoran | 2,641 | 10.8% |
| Scotch-Irish | 19 | 0.1% |
| Senegalese | 15 | 0.1% |
| Sierra Leonean | 105 | 0.4% |
| Slavic | 15 | 0.1% |
| Slovak | 10 | 0.0% |
| South American | 5 | 0.0% |
| Spanish | 73 | 0.3% |
| Sri Lankan | 21 | 0.1% |
| Subsaharan African | 3,551 | 14.5% |
| Swedish | 26 | 0.1% |
| Syrian | 29 | 0.1% |
| Thai | 197 | 0.8% |
| Trinidadian and Tobagonian | 88 | 0.4% |
| Venezuelan | 5 | 0.0% |
| West Indian | 40 | 0.2% | View All 58 Rows |
Immigrants in Landover
The most numerous immigrant groups reported in Landover came from Latin America (3,867 | 15.8%), Africa (2,752 | 11.3%), Central America (2,680 | 11.0%), Western Africa (2,216 | 9.1%), and El Salvador (1,596 | 6.5%), together accounting for 53.7% of all Landover residents.
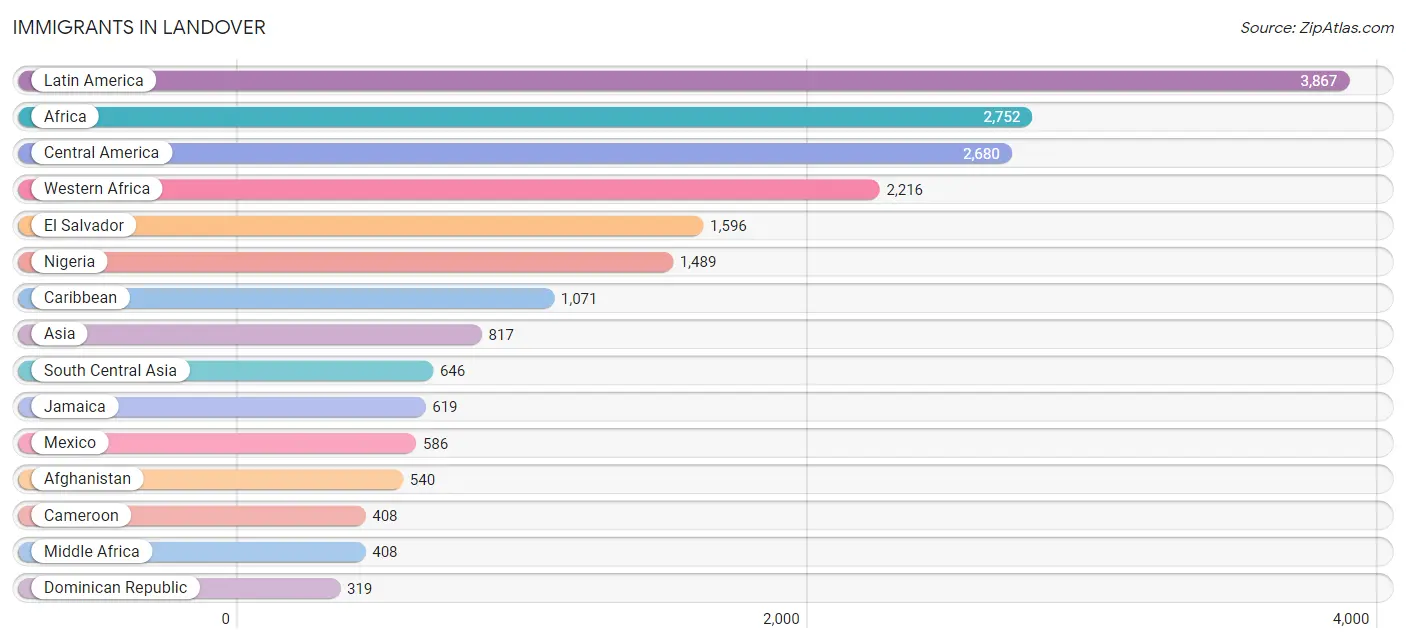
| Immigration Origin | # Population | % Population |
| Afghanistan | 540 | 2.2% |
| Africa | 2,752 | 11.3% |
| Asia | 817 | 3.3% |
| Cameroon | 408 | 1.7% |
| Caribbean | 1,071 | 4.4% |
| Central America | 2,680 | 11.0% |
| China | 35 | 0.1% |
| Dominican Republic | 319 | 1.3% |
| Eastern Africa | 72 | 0.3% |
| Eastern Asia | 35 | 0.1% |
| El Salvador | 1,596 | 6.5% |
| Eritrea | 55 | 0.2% |
| Ethiopia | 17 | 0.1% |
| Europe | 20 | 0.1% |
| Germany | 6 | 0.0% |
| Ghana | 188 | 0.8% |
| Guatemala | 215 | 0.9% |
| Guyana | 116 | 0.5% |
| Haiti | 69 | 0.3% |
| Honduras | 219 | 0.9% |
| Iraq | 73 | 0.3% |
| Jamaica | 619 | 2.5% |
| Latin America | 3,867 | 15.8% |
| Liberia | 44 | 0.2% |
| Mexico | 586 | 2.4% |
| Middle Africa | 408 | 1.7% |
| Nepal | 5 | 0.0% |
| Nicaragua | 64 | 0.3% |
| Nigeria | 1,489 | 6.1% |
| Northern Europe | 14 | 0.1% |
| Pakistan | 25 | 0.1% |
| Philippines | 38 | 0.2% |
| Sierra Leone | 313 | 1.3% |
| South America | 116 | 0.5% |
| South Central Asia | 646 | 2.6% |
| South Eastern Asia | 63 | 0.3% |
| Sri Lanka | 76 | 0.3% |
| St. Vincent and the Grenadines | 34 | 0.1% |
| Trinidad and Tobago | 19 | 0.1% |
| Vietnam | 25 | 0.1% |
| Western Africa | 2,216 | 9.1% |
| Western Asia | 73 | 0.3% |
| Western Europe | 6 | 0.0% | View All 43 Rows |
Sex and Age in Landover
Sex and Age in Landover
The most populous age groups in Landover are 50 to 54 Years (1,037 | 9.2%) for men and 30 to 34 Years (1,188 | 9.0%) for women.
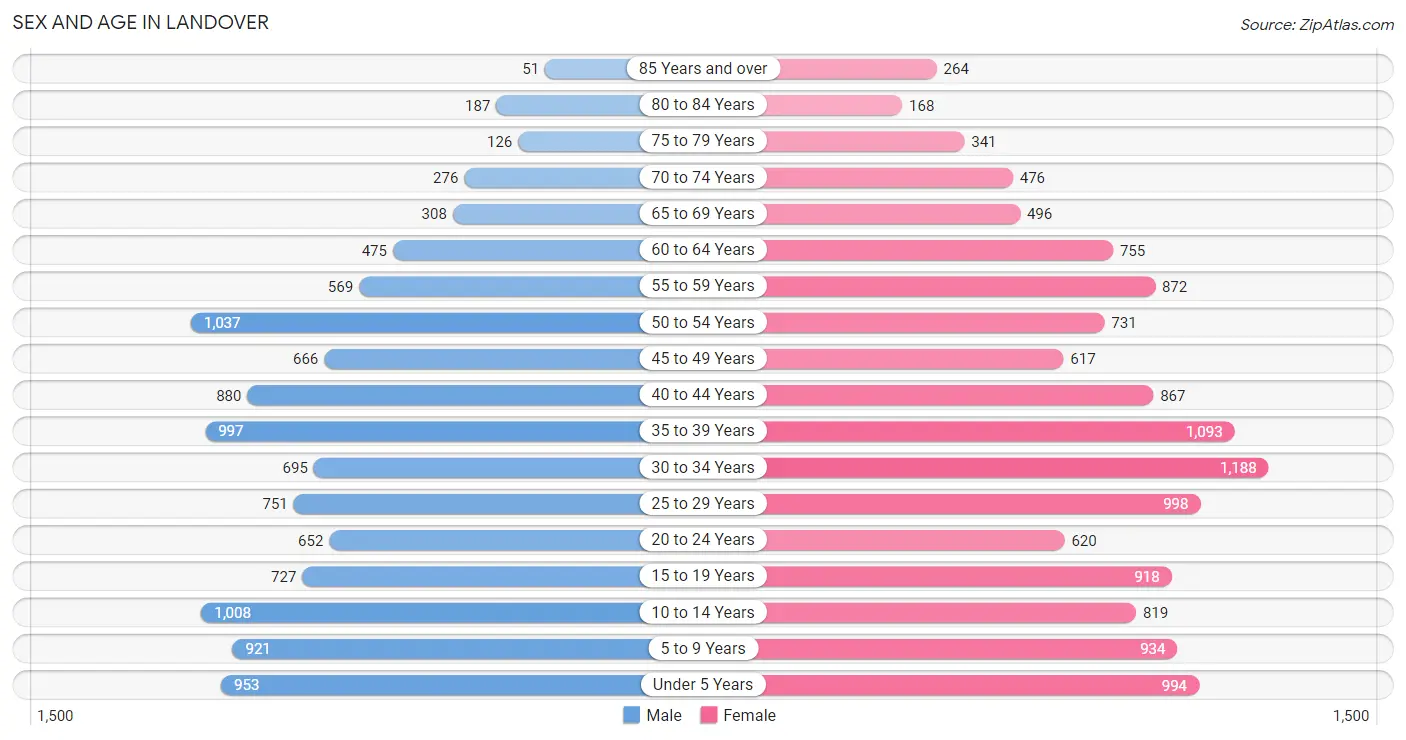
| Age Bracket | Male | Female |
| Under 5 Years | 953 (8.5%) | 994 (7.6%) |
| 5 to 9 Years | 921 (8.2%) | 934 (7.1%) |
| 10 to 14 Years | 1,008 (8.9%) | 819 (6.2%) |
| 15 to 19 Years | 727 (6.5%) | 918 (7.0%) |
| 20 to 24 Years | 652 (5.8%) | 620 (4.7%) |
| 25 to 29 Years | 751 (6.7%) | 998 (7.6%) |
| 30 to 34 Years | 695 (6.2%) | 1,188 (9.0%) |
| 35 to 39 Years | 997 (8.8%) | 1,093 (8.3%) |
| 40 to 44 Years | 880 (7.8%) | 867 (6.6%) |
| 45 to 49 Years | 666 (5.9%) | 617 (4.7%) |
| 50 to 54 Years | 1,037 (9.2%) | 731 (5.6%) |
| 55 to 59 Years | 569 (5.0%) | 872 (6.6%) |
| 60 to 64 Years | 475 (4.2%) | 755 (5.7%) |
| 65 to 69 Years | 308 (2.7%) | 496 (3.8%) |
| 70 to 74 Years | 276 (2.5%) | 476 (3.6%) |
| 75 to 79 Years | 126 (1.1%) | 341 (2.6%) |
| 80 to 84 Years | 187 (1.7%) | 168 (1.3%) |
| 85 Years and over | 51 (0.4%) | 264 (2.0%) |
| Total | 11,279 (100.0%) | 13,151 (100.0%) |
Families and Households in Landover
Median Family Size in Landover
The median family size in Landover is 3.58 persons per family, with married-couple families (2,915 | 53.9%) accounting for the largest median family size of 3.82 persons per family. On the other hand, single male/father families (578 | 10.7%) represent the smallest median family size with 3.28 persons per family.
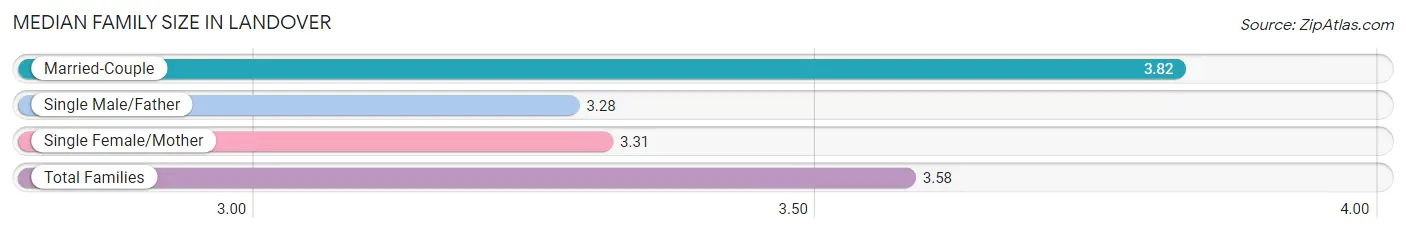
| Family Type | # Families | Family Size |
| Married-Couple | 2,915 (53.9%) | 3.82 |
| Single Male/Father | 578 (10.7%) | 3.28 |
| Single Female/Mother | 1,914 (35.4%) | 3.31 |
| Total Families | 5,407 (100.0%) | 3.58 |
Median Household Size in Landover
The median household size in Landover is 2.79 persons per household, with married-couple households (2,915 | 33.4%) accounting for the largest median household size of 3.91 persons per household. non-family households (3,330 | 38.1%) represent the smallest median household size with 1.25 persons per household.
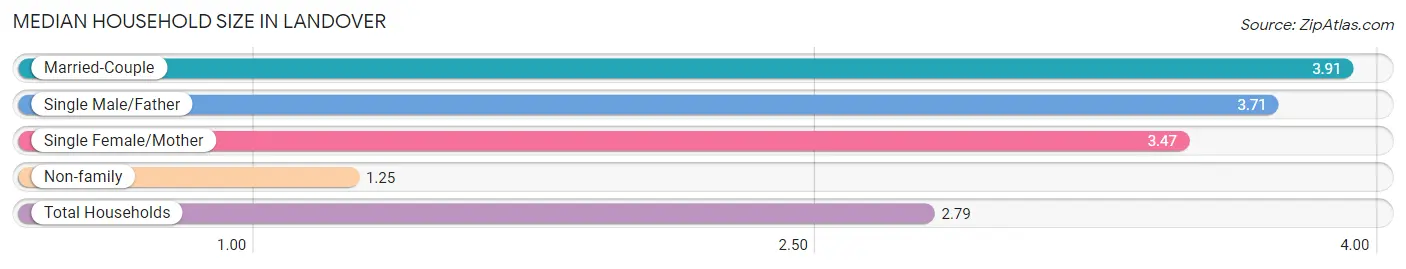
| Household Type | # Households | Household Size |
| Married-Couple | 2,915 (33.4%) | 3.91 |
| Single Male/Father | 578 (6.6%) | 3.71 |
| Single Female/Mother | 1,914 (21.9%) | 3.47 |
| Non-family | 3,330 (38.1%) | 1.25 |
| Total Households | 8,737 (100.0%) | 2.79 |
Household Size by Marriage Status in Landover
Out of a total of 8,737 households in Landover, 5,407 (61.9%) are family households, while 3,330 (38.1%) are nonfamily households. The most numerous type of family households are 2-person households, comprising 1,918, and the most common type of nonfamily households are 1-person households, comprising 2,764.
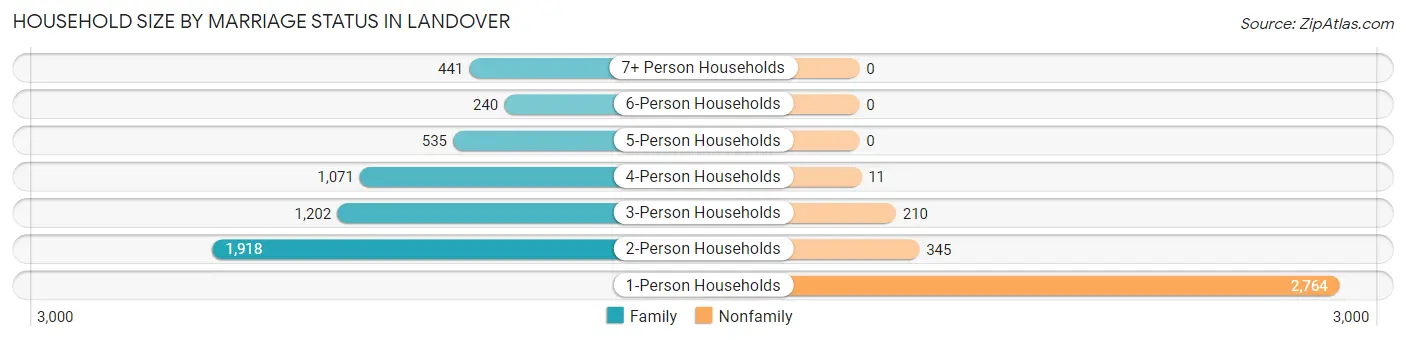
| Household Size | Family Households | Nonfamily Households |
| 1-Person Households | - | 2,764 (31.6%) |
| 2-Person Households | 1,918 (22.0%) | 345 (4.0%) |
| 3-Person Households | 1,202 (13.8%) | 210 (2.4%) |
| 4-Person Households | 1,071 (12.3%) | 11 (0.1%) |
| 5-Person Households | 535 (6.1%) | 0 (0.0%) |
| 6-Person Households | 240 (2.8%) | 0 (0.0%) |
| 7+ Person Households | 441 (5.1%) | 0 (0.0%) |
| Total | 5,407 (61.9%) | 3,330 (38.1%) |
Female Fertility in Landover
Fertility by Age in Landover
Average fertility rate in Landover is 92.0 births per 1,000 women. Women in the age bracket of 15 to 19 years have the highest fertility rate with 113.0 births per 1,000 women. Women in the age bracket of 20 to 34 years acount for 46.6% of all women with births.
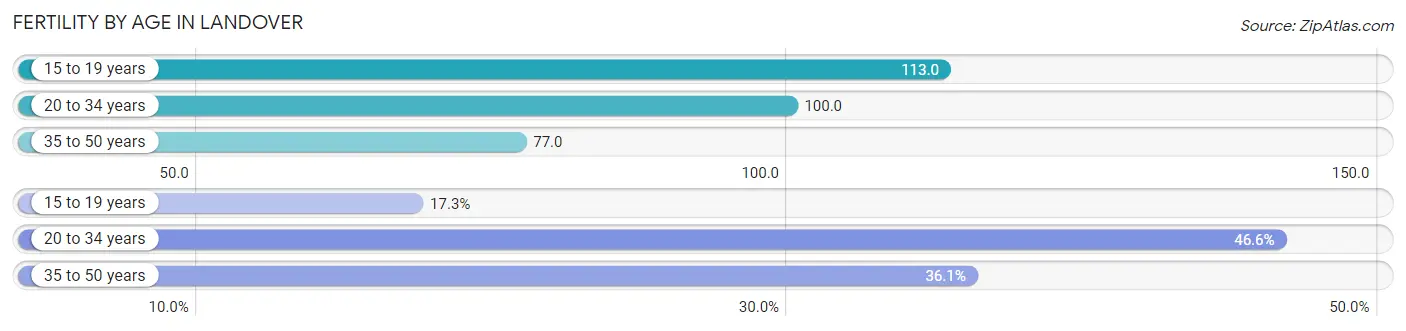
| Age Bracket | Women with Births | Births / 1,000 Women |
| 15 to 19 years | 104 (17.3%) | 113.0 |
| 20 to 34 years | 280 (46.6%) | 100.0 |
| 35 to 50 years | 217 (36.1%) | 77.0 |
| Total | 601 (100.0%) | 92.0 |
Fertility by Age by Marriage Status in Landover
45.8% of women with births (601) in Landover are married. The highest percentage of unmarried women with births falls into 15 to 19 years age bracket with 100.0% of them unmarried at the time of birth, while the lowest percentage of unmarried women with births belong to 35 to 50 years age bracket with 17.5% of them unmarried.
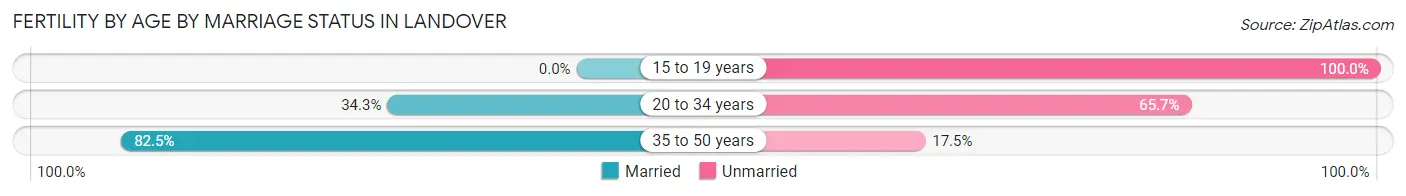
| Age Bracket | Married | Unmarried |
| 15 to 19 years | 0 (0.0%) | 104 (100.0%) |
| 20 to 34 years | 96 (34.3%) | 184 (65.7%) |
| 35 to 50 years | 179 (82.5%) | 38 (17.5%) |
| Total | 275 (45.8%) | 326 (54.2%) |
Fertility by Education in Landover
Average fertility rate in Landover is 92.0 births per 1,000 women. Women with the education attainment of bachelor's degree have the highest fertility rate of 129.0 births per 1,000 women, while women with the education attainment of less than high school have the lowest fertility at 54.0 births per 1,000 women. Women with the education attainment of high school diploma represent 35.4% of all women with births.
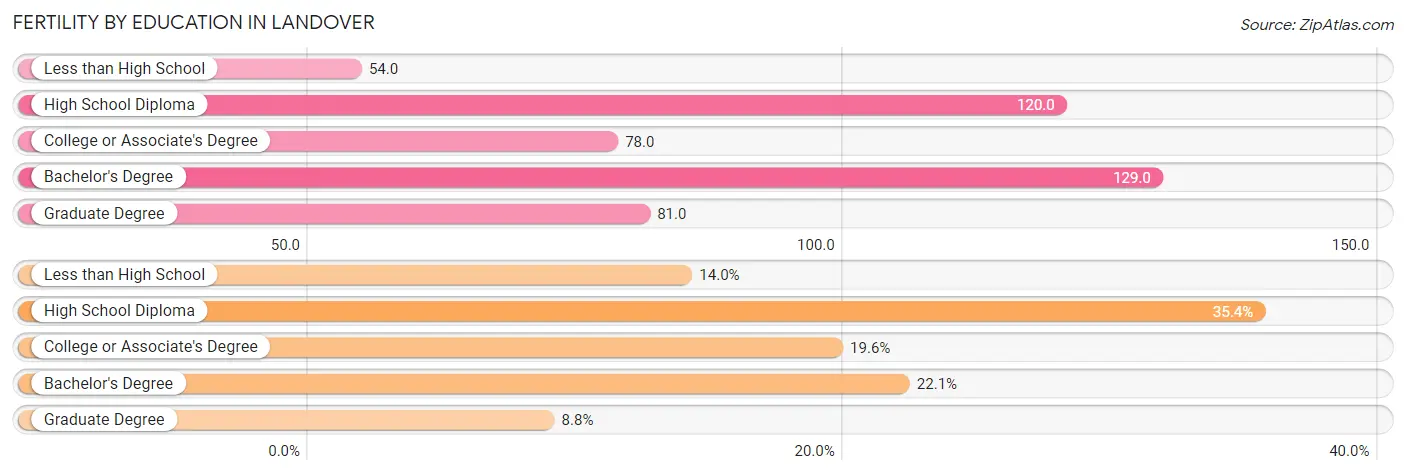
| Educational Attainment | Women with Births | Births / 1,000 Women |
| Less than High School | 84 (14.0%) | 54.0 |
| High School Diploma | 213 (35.4%) | 120.0 |
| College or Associate's Degree | 118 (19.6%) | 78.0 |
| Bachelor's Degree | 133 (22.1%) | 129.0 |
| Graduate Degree | 53 (8.8%) | 81.0 |
| Total | 601 (100.0%) | 92.0 |
Fertility by Education by Marriage Status in Landover
54.2% of women with births in Landover are unmarried. Women with the educational attainment of graduate degree are most likely to be married with 83.0% of them married at childbirth, while women with the educational attainment of college or associate's degree are least likely to be married with 78.8% of them unmarried at childbirth.
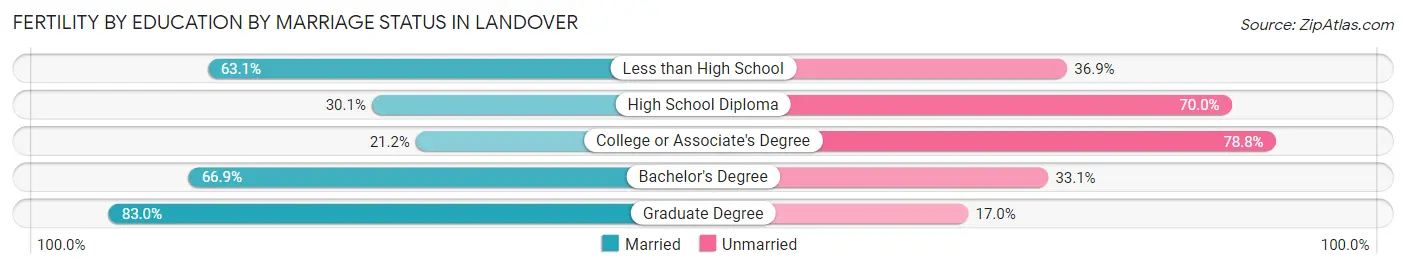
| Educational Attainment | Married | Unmarried |
| Less than High School | 53 (63.1%) | 31 (36.9%) |
| High School Diploma | 64 (30.0%) | 149 (70.0%) |
| College or Associate's Degree | 25 (21.2%) | 93 (78.8%) |
| Bachelor's Degree | 89 (66.9%) | 44 (33.1%) |
| Graduate Degree | 44 (83.0%) | 9 (17.0%) |
| Total | 275 (45.8%) | 326 (54.2%) |
Employment Characteristics in Landover
Employment by Class of Employer in Landover
Among the 11,968 employed individuals in Landover, private company employees (7,315 | 61.1%), federal government employees (1,240 | 10.4%), and not-for-profit organizations (1,192 | 10.0%) make up the most common classes of employment.
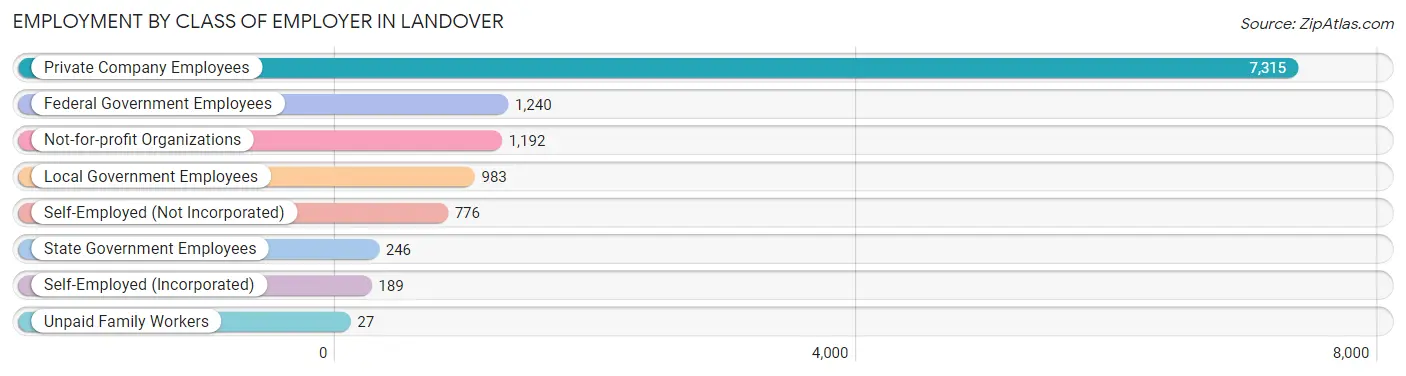
| Employer Class | # Employees | % Employees |
| Private Company Employees | 7,315 | 61.1% |
| Self-Employed (Incorporated) | 189 | 1.6% |
| Self-Employed (Not Incorporated) | 776 | 6.5% |
| Not-for-profit Organizations | 1,192 | 10.0% |
| Local Government Employees | 983 | 8.2% |
| State Government Employees | 246 | 2.1% |
| Federal Government Employees | 1,240 | 10.4% |
| Unpaid Family Workers | 27 | 0.2% |
| Total | 11,968 | 100.0% |
Employment Status by Age in Landover
According to the labor force statistics for Landover, out of the total population over 16 years of age (18,466), 70.6% or 13,037 individuals are in the labor force, with 6.0% or 782 of them unemployed. The age group with the highest labor force participation rate is 25 to 29 years, with 91.4% or 1,599 individuals in the labor force. Within the labor force, the 20 to 24 years age range has the highest percentage of unemployed individuals, with 18.8% or 196 of them being unemployed.
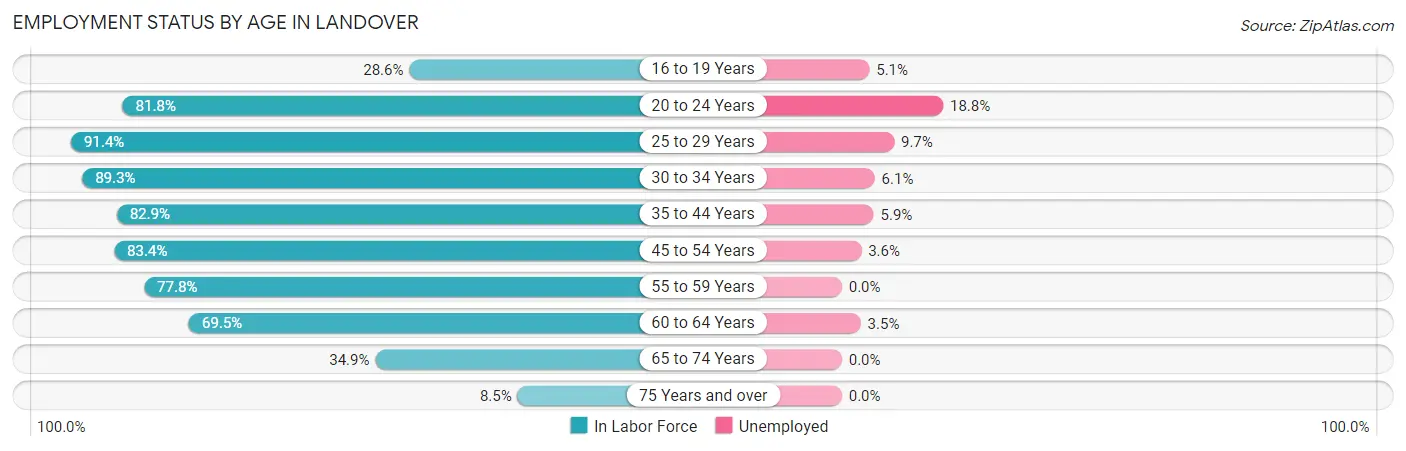
| Age Bracket | In Labor Force | Unemployed |
| 16 to 19 Years | 375 (28.6%) | 19 (5.1%) |
| 20 to 24 Years | 1,040 (81.8%) | 196 (18.8%) |
| 25 to 29 Years | 1,599 (91.4%) | 155 (9.7%) |
| 30 to 34 Years | 1,682 (89.3%) | 103 (6.1%) |
| 35 to 44 Years | 3,181 (82.9%) | 188 (5.9%) |
| 45 to 54 Years | 2,545 (83.4%) | 92 (3.6%) |
| 55 to 59 Years | 1,121 (77.8%) | 0 (0.0%) |
| 60 to 64 Years | 855 (69.5%) | 30 (3.5%) |
| 65 to 74 Years | 543 (34.9%) | 0 (0.0%) |
| 75 Years and over | 97 (8.5%) | 0 (0.0%) |
| Total | 13,037 (70.6%) | 782 (6.0%) |
Employment Status by Educational Attainment in Landover
According to labor force statistics for Landover, 83.2% of individuals (10,975) out of the total population between 25 and 64 years of age (13,191) are in the labor force, with 5.1% or 560 of them being unemployed. The group with the highest labor force participation rate are those with the educational attainment of bachelor's degree or higher, with 96.7% or 3,286 individuals in the labor force. Within the labor force, individuals with less than high school education have the highest percentage of unemployment, with 7.8% or 127 of them being unemployed.
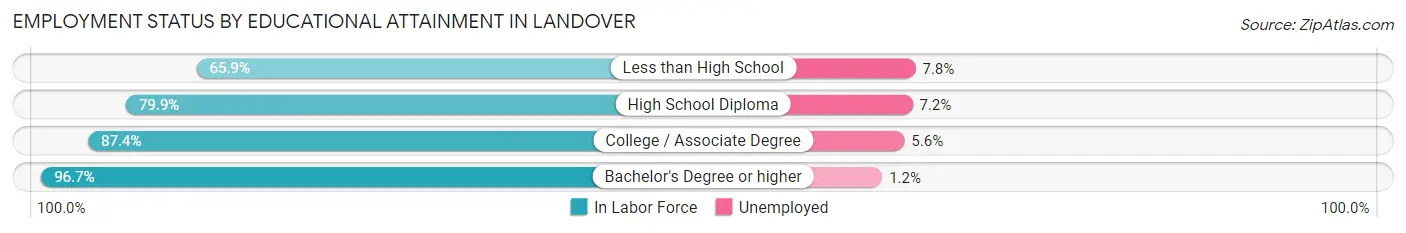
| Educational Attainment | In Labor Force | Unemployed |
| Less than High School | 1,625 (65.9%) | 192 (7.8%) |
| High School Diploma | 3,578 (79.9%) | 322 (7.2%) |
| College / Associate Degree | 2,490 (87.4%) | 160 (5.6%) |
| Bachelor's Degree or higher | 3,286 (96.7%) | 41 (1.2%) |
| Total | 10,975 (83.2%) | 673 (5.1%) |
Employment Occupations by Sex in Landover
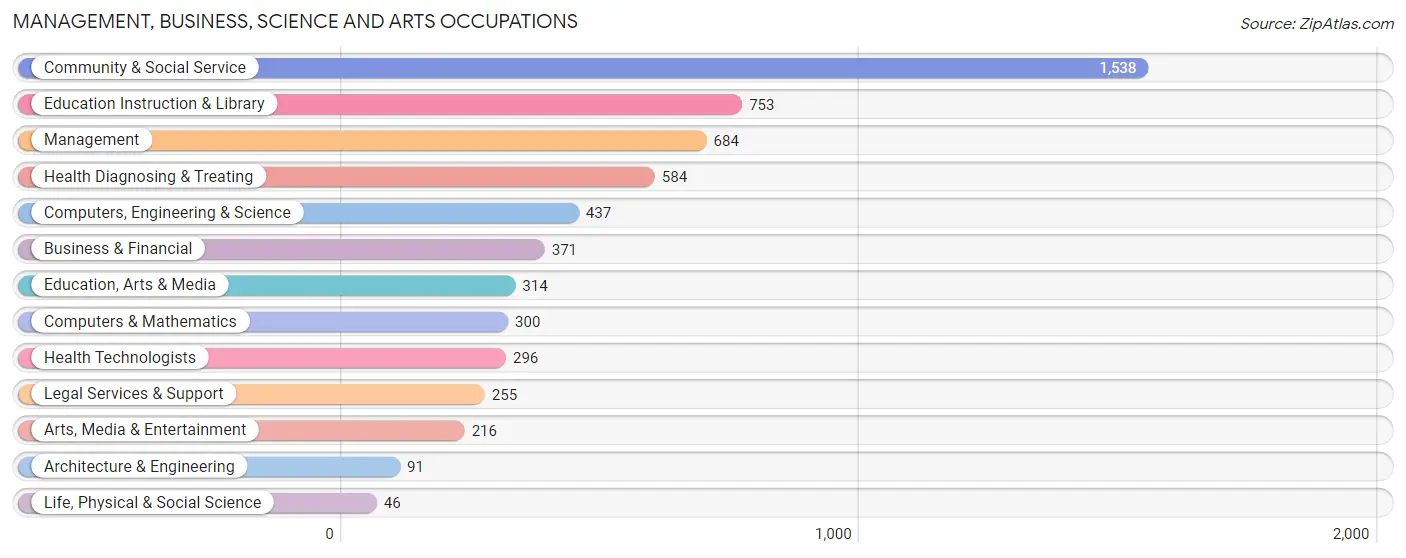
Management, Business, Science and Arts Occupations
The most common Management, Business, Science and Arts occupations in Landover are Community & Social Service (1,538 | 12.6%), Education Instruction & Library (753 | 6.2%), Management (684 | 5.6%), Health Diagnosing & Treating (584 | 4.8%), and Computers, Engineering & Science (437 | 3.6%).
Management, Business, Science and Arts Occupations by Sex
Within the Management, Business, Science and Arts occupations in Landover, the most male-oriented occupations are Architecture & Engineering (89.0%), Life, Physical & Social Science (73.9%), and Computers, Engineering & Science (64.8%), while the most female-oriented occupations are Legal Services & Support (100.0%), Health Diagnosing & Treating (87.2%), and Health Technologists (85.1%).
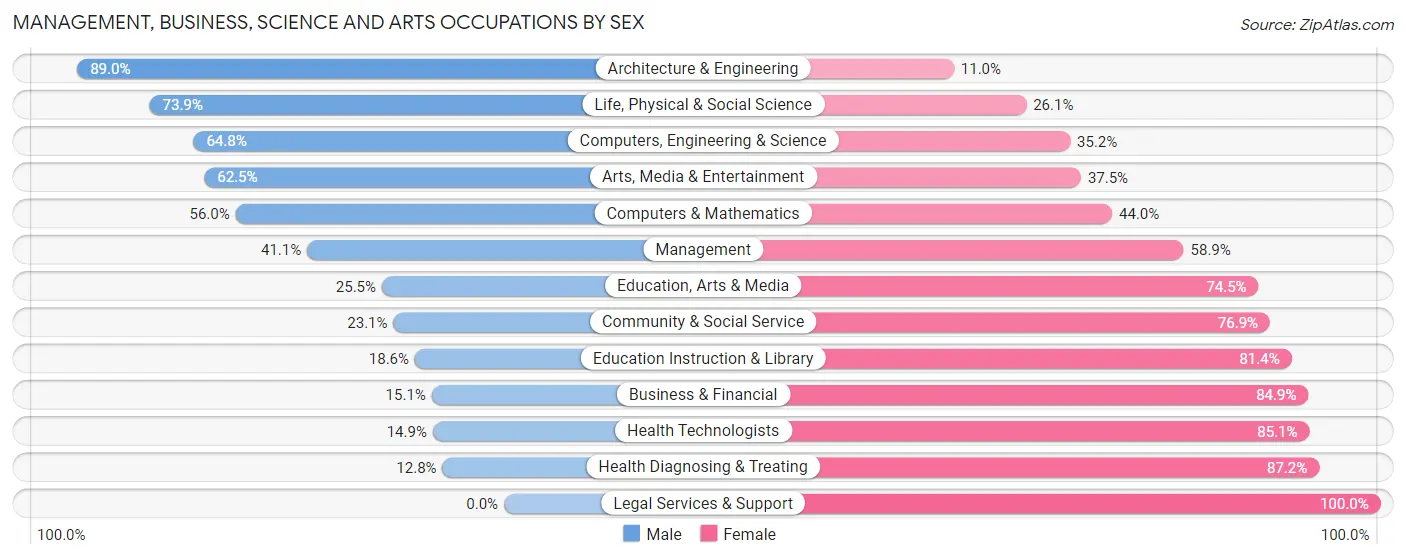
| Occupation | Male | Female |
| Management | 281 (41.1%) | 403 (58.9%) |
| Business & Financial | 56 (15.1%) | 315 (84.9%) |
| Computers, Engineering & Science | 283 (64.8%) | 154 (35.2%) |
| Computers & Mathematics | 168 (56.0%) | 132 (44.0%) |
| Architecture & Engineering | 81 (89.0%) | 10 (11.0%) |
| Life, Physical & Social Science | 34 (73.9%) | 12 (26.1%) |
| Community & Social Service | 355 (23.1%) | 1,183 (76.9%) |
| Education, Arts & Media | 80 (25.5%) | 234 (74.5%) |
| Legal Services & Support | 0 (0.0%) | 255 (100.0%) |
| Education Instruction & Library | 140 (18.6%) | 613 (81.4%) |
| Arts, Media & Entertainment | 135 (62.5%) | 81 (37.5%) |
| Health Diagnosing & Treating | 75 (12.8%) | 509 (87.2%) |
| Health Technologists | 44 (14.9%) | 252 (85.1%) |
| Total (Category) | 1,050 (29.0%) | 2,564 (71.0%) |
| Total (Overall) | 5,779 (47.3%) | 6,439 (52.7%) |
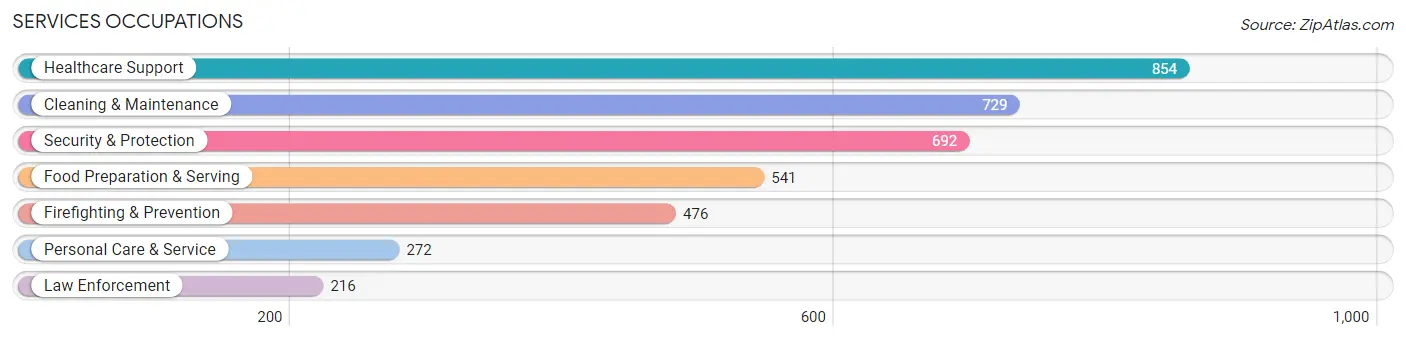
Services Occupations
The most common Services occupations in Landover are Healthcare Support (854 | 7.0%), Cleaning & Maintenance (729 | 6.0%), Security & Protection (692 | 5.7%), Food Preparation & Serving (541 | 4.4%), and Firefighting & Prevention (476 | 3.9%).
Services Occupations by Sex
Within the Services occupations in Landover, the most male-oriented occupations are Law Enforcement (95.8%), Security & Protection (63.0%), and Firefighting & Prevention (48.1%), while the most female-oriented occupations are Healthcare Support (84.2%), Personal Care & Service (60.3%), and Cleaning & Maintenance (54.6%).
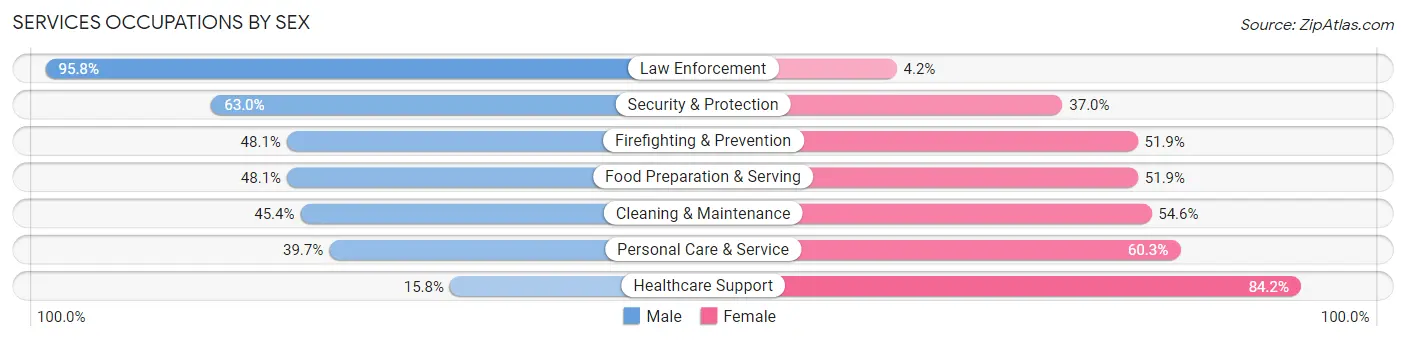
| Occupation | Male | Female |
| Healthcare Support | 135 (15.8%) | 719 (84.2%) |
| Security & Protection | 436 (63.0%) | 256 (37.0%) |
| Firefighting & Prevention | 229 (48.1%) | 247 (51.9%) |
| Law Enforcement | 207 (95.8%) | 9 (4.2%) |
| Food Preparation & Serving | 260 (48.1%) | 281 (51.9%) |
| Cleaning & Maintenance | 331 (45.4%) | 398 (54.6%) |
| Personal Care & Service | 108 (39.7%) | 164 (60.3%) |
| Total (Category) | 1,270 (41.1%) | 1,818 (58.9%) |
| Total (Overall) | 5,779 (47.3%) | 6,439 (52.7%) |
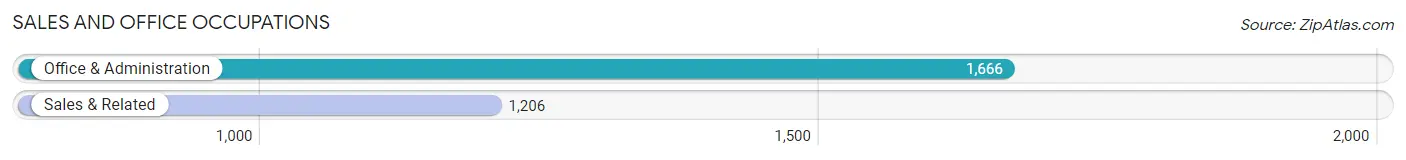
Sales and Office Occupations
The most common Sales and Office occupations in Landover are Office & Administration (1,666 | 13.6%), and Sales & Related (1,206 | 9.9%).
Sales and Office Occupations by Sex
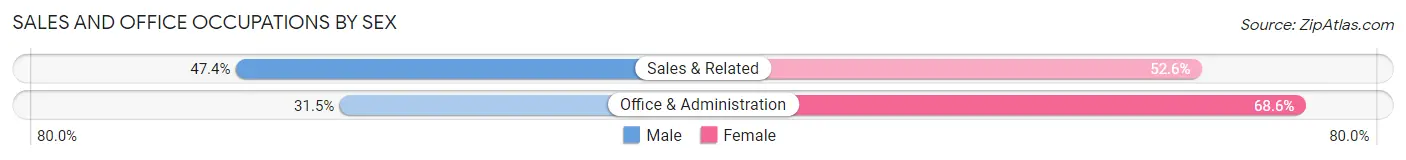
| Occupation | Male | Female |
| Sales & Related | 572 (47.4%) | 634 (52.6%) |
| Office & Administration | 524 (31.5%) | 1,142 (68.5%) |
| Total (Category) | 1,096 (38.2%) | 1,776 (61.8%) |
| Total (Overall) | 5,779 (47.3%) | 6,439 (52.7%) |
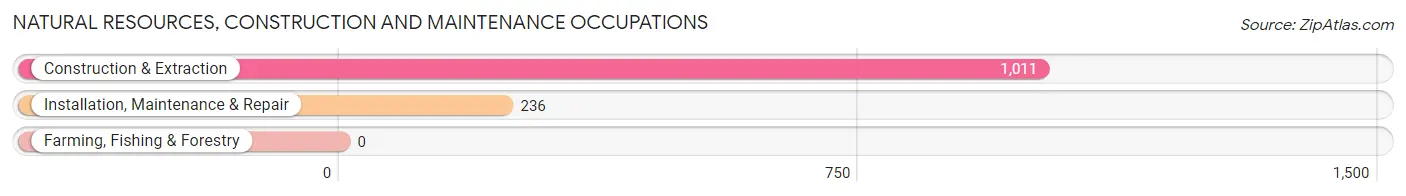
Natural Resources, Construction and Maintenance Occupations
The most common Natural Resources, Construction and Maintenance occupations in Landover are Construction & Extraction (1,011 | 8.3%), and Installation, Maintenance & Repair (236 | 1.9%).
Natural Resources, Construction and Maintenance Occupations by Sex
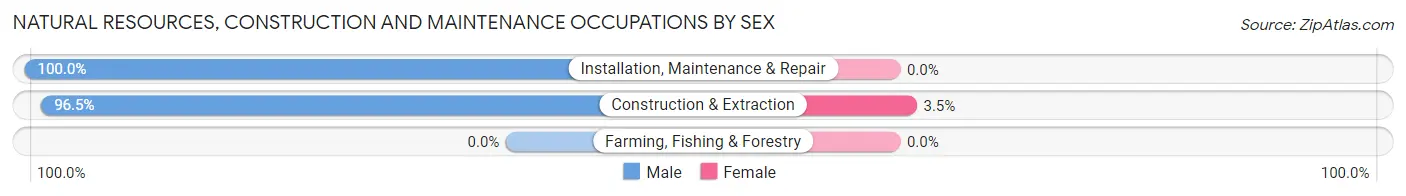
| Occupation | Male | Female |
| Farming, Fishing & Forestry | 0 (0.0%) | 0 (0.0%) |
| Construction & Extraction | 976 (96.5%) | 35 (3.5%) |
| Installation, Maintenance & Repair | 236 (100.0%) | 0 (0.0%) |
| Total (Category) | 1,212 (97.2%) | 35 (2.8%) |
| Total (Overall) | 5,779 (47.3%) | 6,439 (52.7%) |
Production, Transportation and Moving Occupations
The most common Production, Transportation and Moving occupations in Landover are Transportation (568 | 4.6%), Material Moving (566 | 4.6%), and Production (263 | 2.1%).
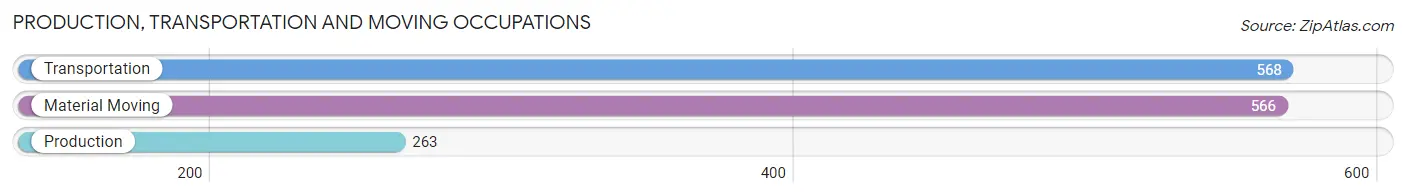
Production, Transportation and Moving Occupations by Sex
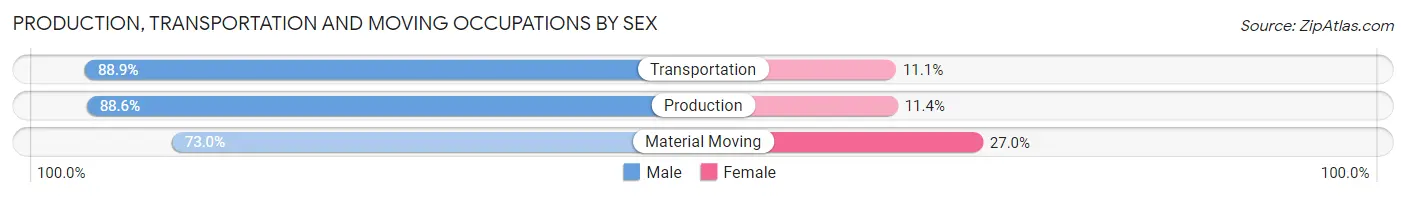
| Occupation | Male | Female |
| Production | 233 (88.6%) | 30 (11.4%) |
| Transportation | 505 (88.9%) | 63 (11.1%) |
| Material Moving | 413 (73.0%) | 153 (27.0%) |
| Total (Category) | 1,151 (82.4%) | 246 (17.6%) |
| Total (Overall) | 5,779 (47.3%) | 6,439 (52.7%) |
Employment Industries by Sex in Landover
Employment Industries in Landover
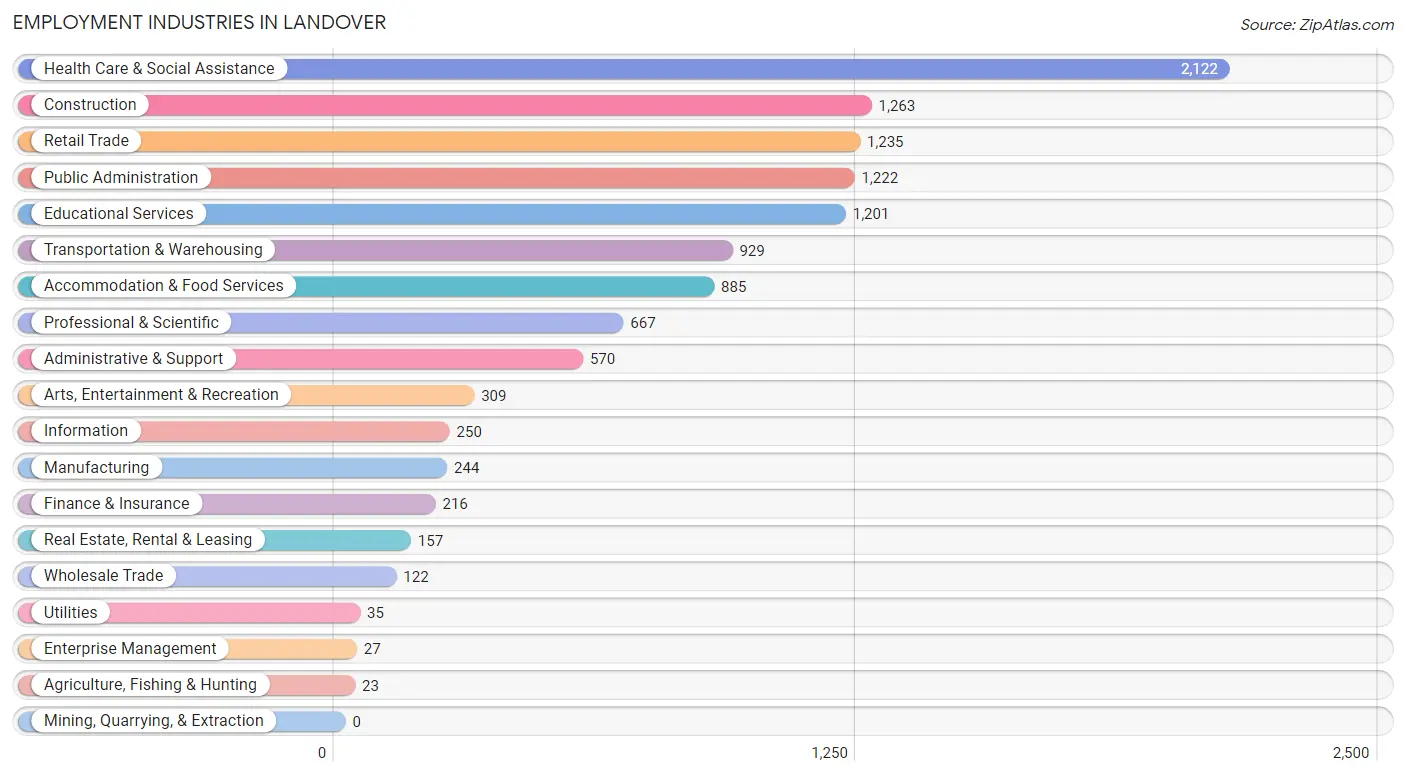
The major employment industries in Landover include Health Care & Social Assistance (2,122 | 17.4%), Construction (1,263 | 10.3%), Retail Trade (1,235 | 10.1%), Public Administration (1,222 | 10.0%), and Educational Services (1,201 | 9.8%).
Employment Industries by Sex in Landover
The Landover industries that see more men than women are Wholesale Trade (100.0%), Utilities (100.0%), and Construction (92.6%), whereas the industries that tend to have a higher number of women are Agriculture, Fishing & Hunting (100.0%), Enterprise Management (100.0%), and Health Care & Social Assistance (76.8%).
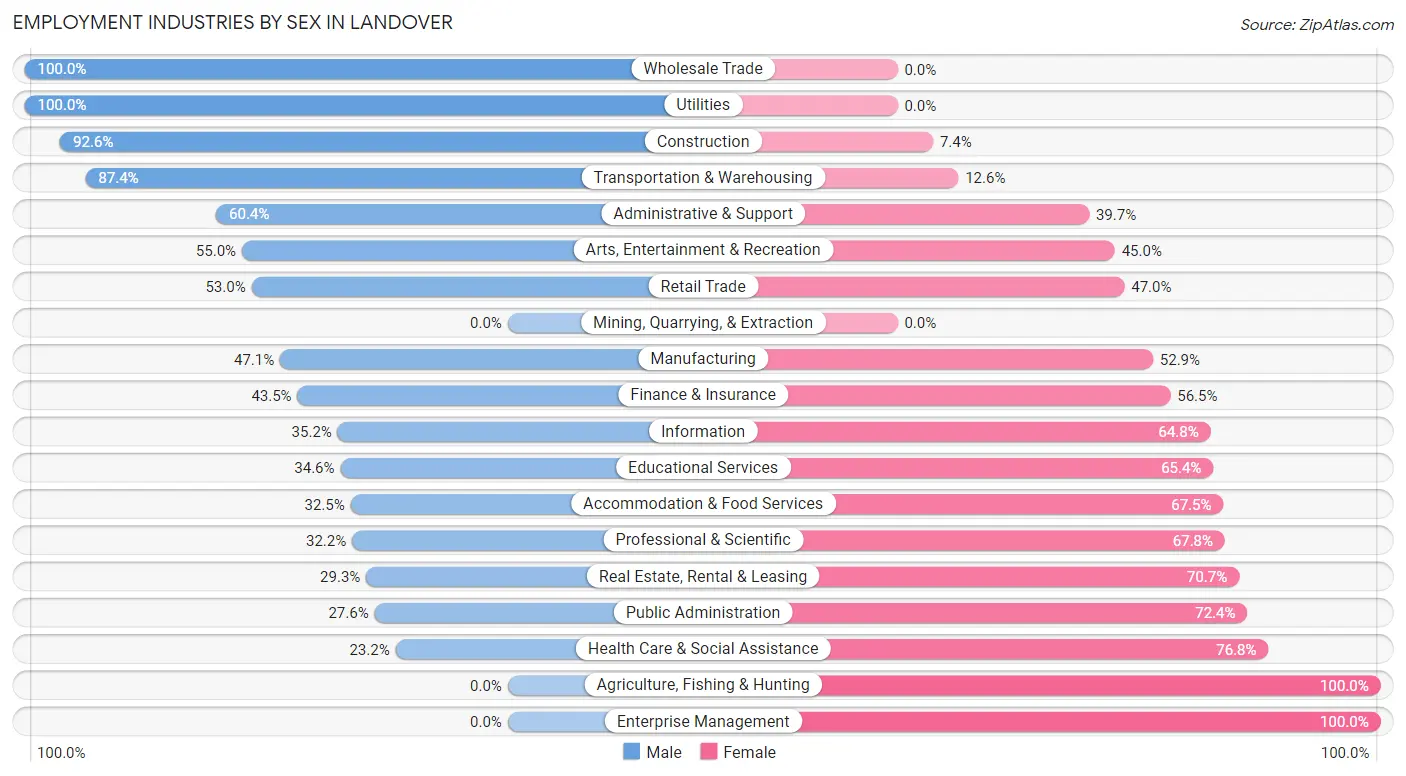
| Industry | Male | Female |
| Agriculture, Fishing & Hunting | 0 (0.0%) | 23 (100.0%) |
| Mining, Quarrying, & Extraction | 0 (0.0%) | 0 (0.0%) |
| Construction | 1,170 (92.6%) | 93 (7.4%) |
| Manufacturing | 115 (47.1%) | 129 (52.9%) |
| Wholesale Trade | 122 (100.0%) | 0 (0.0%) |
| Retail Trade | 655 (53.0%) | 580 (47.0%) |
| Transportation & Warehousing | 812 (87.4%) | 117 (12.6%) |
| Utilities | 35 (100.0%) | 0 (0.0%) |
| Information | 88 (35.2%) | 162 (64.8%) |
| Finance & Insurance | 94 (43.5%) | 122 (56.5%) |
| Real Estate, Rental & Leasing | 46 (29.3%) | 111 (70.7%) |
| Professional & Scientific | 215 (32.2%) | 452 (67.8%) |
| Enterprise Management | 0 (0.0%) | 27 (100.0%) |
| Administrative & Support | 344 (60.4%) | 226 (39.7%) |
| Educational Services | 416 (34.6%) | 785 (65.4%) |
| Health Care & Social Assistance | 493 (23.2%) | 1,629 (76.8%) |
| Arts, Entertainment & Recreation | 170 (55.0%) | 139 (45.0%) |
| Accommodation & Food Services | 288 (32.5%) | 597 (67.5%) |
| Public Administration | 337 (27.6%) | 885 (72.4%) |
| Total | 5,779 (47.3%) | 6,439 (52.7%) |
Education in Landover
School Enrollment in Landover
The most common levels of schooling among the 6,468 students in Landover are middle school (1,583 | 24.5%), high school (1,476 | 22.8%), and elementary school (1,450 | 22.4%).
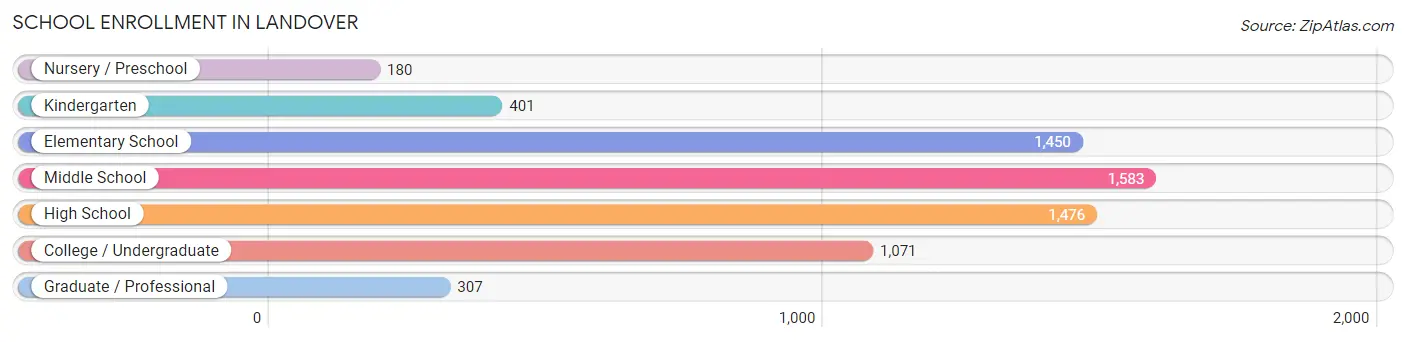
| School Level | # Students | % Students |
| Nursery / Preschool | 180 | 2.8% |
| Kindergarten | 401 | 6.2% |
| Elementary School | 1,450 | 22.4% |
| Middle School | 1,583 | 24.5% |
| High School | 1,476 | 22.8% |
| College / Undergraduate | 1,071 | 16.6% |
| Graduate / Professional | 307 | 4.8% |
| Total | 6,468 | 100.0% |
School Enrollment by Age by Funding Source in Landover
Out of a total of 6,468 students who are enrolled in schools in Landover, 653 (10.1%) attend a private institution, while the remaining 5,815 (89.9%) are enrolled in public schools. The age group of 35 years and over has the highest likelihood of being enrolled in private schools, with 266 (42.9% in the age bracket) enrolled. Conversely, the age group of 18 to 19 year olds has the lowest likelihood of being enrolled in a private school, with 375 (100.0% in the age bracket) attending a public institution.
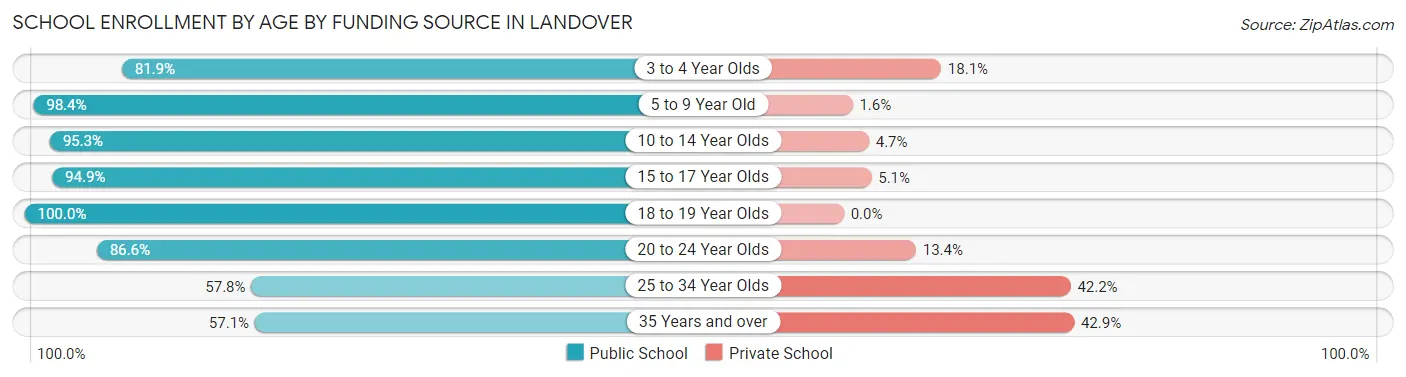
| Age Bracket | Public School | Private School |
| 3 to 4 Year Olds | 104 (81.9%) | 23 (18.1%) |
| 5 to 9 Year Old | 1,755 (98.4%) | 29 (1.6%) |
| 10 to 14 Year Olds | 1,712 (95.3%) | 84 (4.7%) |
| 15 to 17 Year Olds | 978 (94.9%) | 53 (5.1%) |
| 18 to 19 Year Olds | 375 (100.0%) | 0 (0.0%) |
| 20 to 24 Year Olds | 335 (86.6%) | 52 (13.4%) |
| 25 to 34 Year Olds | 201 (57.8%) | 147 (42.2%) |
| 35 Years and over | 354 (57.1%) | 266 (42.9%) |
| Total | 5,815 (89.9%) | 653 (10.1%) |
Educational Attainment by Field of Study in Landover
Business (667 | 16.3%), social sciences (450 | 11.0%), bio, nature & agricultural (428 | 10.5%), computers & mathematics (386 | 9.4%), and arts & humanities (381 | 9.3%) are the most common fields of study among 4,090 individuals in Landover who have obtained a bachelor's degree or higher.
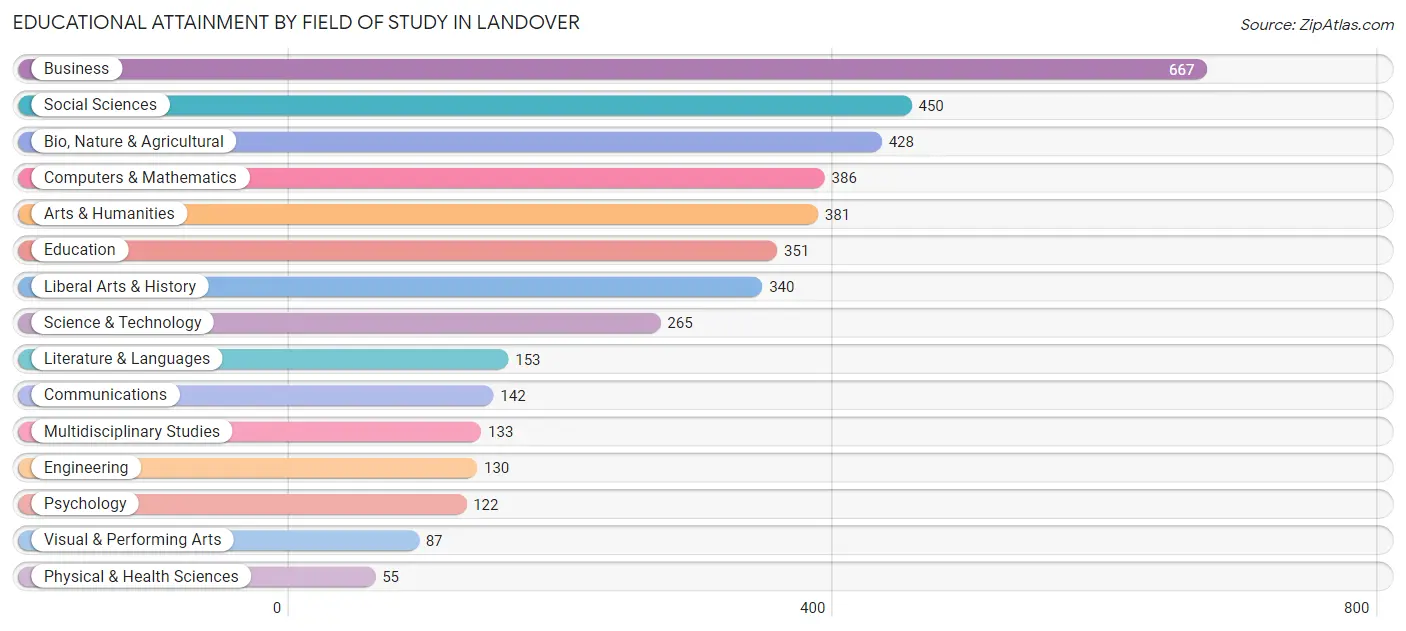
| Field of Study | # Graduates | % Graduates |
| Computers & Mathematics | 386 | 9.4% |
| Bio, Nature & Agricultural | 428 | 10.5% |
| Physical & Health Sciences | 55 | 1.3% |
| Psychology | 122 | 3.0% |
| Social Sciences | 450 | 11.0% |
| Engineering | 130 | 3.2% |
| Multidisciplinary Studies | 133 | 3.3% |
| Science & Technology | 265 | 6.5% |
| Business | 667 | 16.3% |
| Education | 351 | 8.6% |
| Literature & Languages | 153 | 3.7% |
| Liberal Arts & History | 340 | 8.3% |
| Visual & Performing Arts | 87 | 2.1% |
| Communications | 142 | 3.5% |
| Arts & Humanities | 381 | 9.3% |
| Total | 4,090 | 100.0% |
Transportation & Commute in Landover
Vehicle Availability by Sex in Landover
The most prevalent vehicle ownership categories in Landover are males with 1 vehicle (2,101, accounting for 36.7%) and females with 1 vehicle (2,457, making up 33.7%).
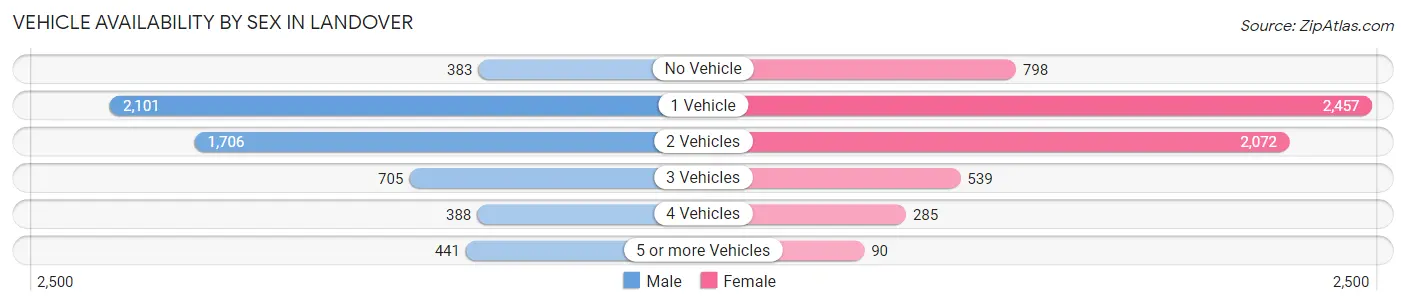
| Vehicles Available | Male | Female |
| No Vehicle | 383 (6.7%) | 798 (12.8%) |
| 1 Vehicle | 2,101 (36.7%) | 2,457 (39.4%) |
| 2 Vehicles | 1,706 (29.8%) | 2,072 (33.2%) |
| 3 Vehicles | 705 (12.3%) | 539 (8.6%) |
| 4 Vehicles | 388 (6.8%) | 285 (4.6%) |
| 5 or more Vehicles | 441 (7.7%) | 90 (1.4%) |
| Total | 5,724 (100.0%) | 6,241 (100.0%) |
Commute Time in Landover
The most frequently occuring commute durations in Landover are 30 to 34 minutes (2,345 commuters, 20.9%), 20 to 24 minutes (1,538 commuters, 13.7%), and 60 to 89 minutes (1,415 commuters, 12.6%).
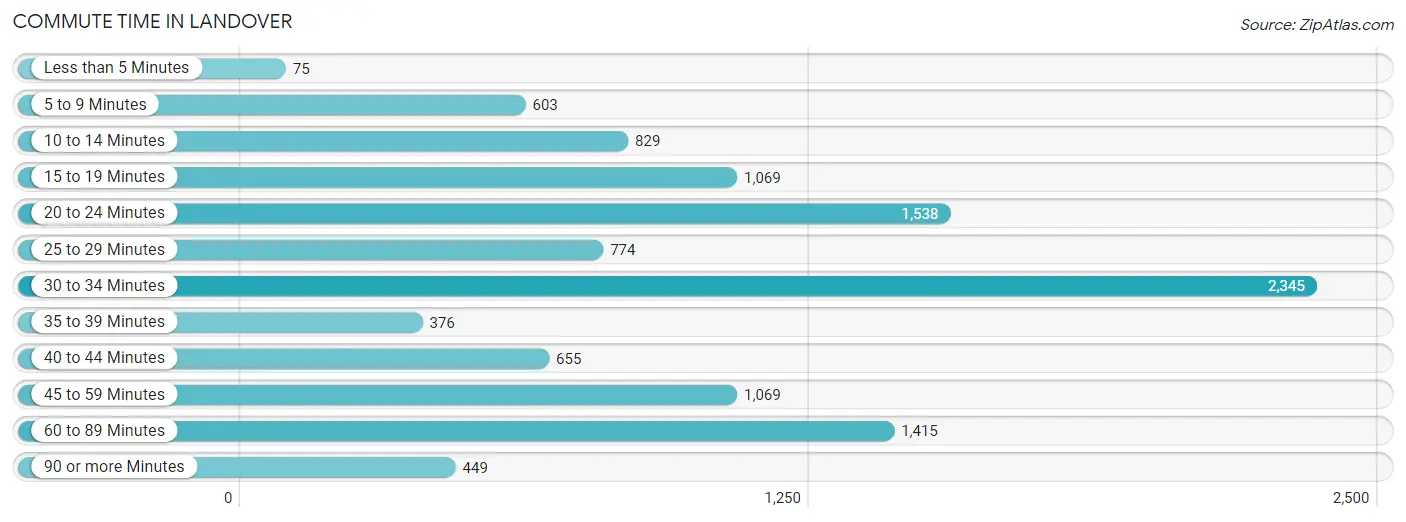
| Commute Time | # Commuters | % Commuters |
| Less than 5 Minutes | 75 | 0.7% |
| 5 to 9 Minutes | 603 | 5.4% |
| 10 to 14 Minutes | 829 | 7.4% |
| 15 to 19 Minutes | 1,069 | 9.6% |
| 20 to 24 Minutes | 1,538 | 13.7% |
| 25 to 29 Minutes | 774 | 6.9% |
| 30 to 34 Minutes | 2,345 | 20.9% |
| 35 to 39 Minutes | 376 | 3.4% |
| 40 to 44 Minutes | 655 | 5.9% |
| 45 to 59 Minutes | 1,069 | 9.6% |
| 60 to 89 Minutes | 1,415 | 12.6% |
| 90 or more Minutes | 449 | 4.0% |
Commute Time by Sex in Landover
The most common commute times in Landover are 30 to 34 minutes (1,378 commuters, 25.4%) for males and 30 to 34 minutes (967 commuters, 16.8%) for females.
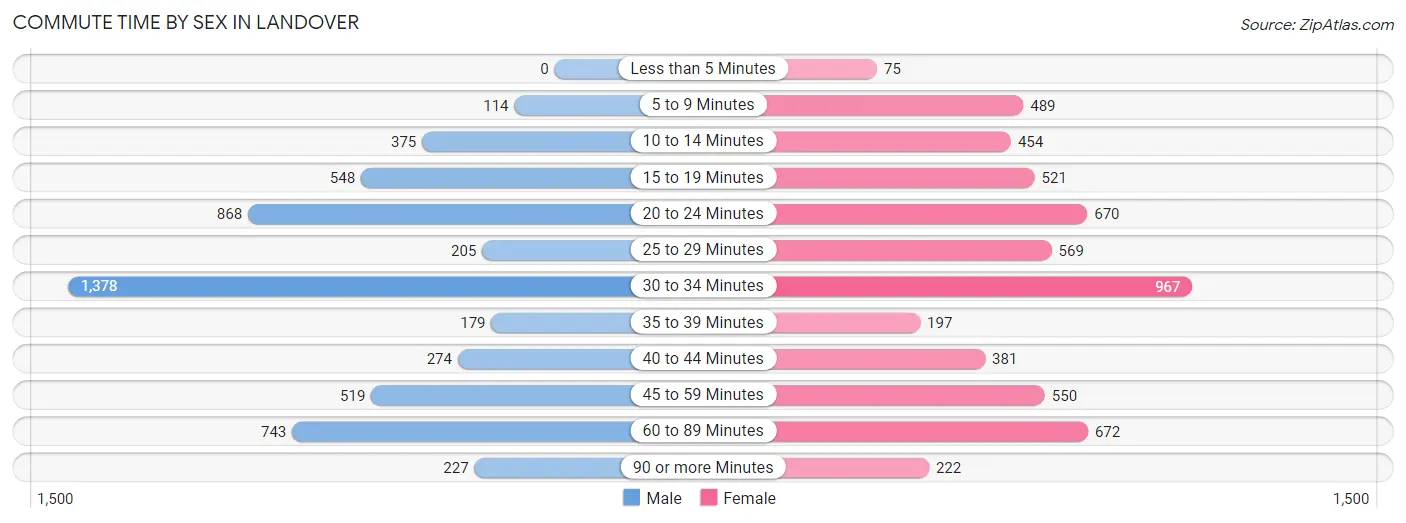
| Commute Time | Male | Female |
| Less than 5 Minutes | 0 (0.0%) | 75 (1.3%) |
| 5 to 9 Minutes | 114 (2.1%) | 489 (8.5%) |
| 10 to 14 Minutes | 375 (6.9%) | 454 (7.9%) |
| 15 to 19 Minutes | 548 (10.1%) | 521 (9.0%) |
| 20 to 24 Minutes | 868 (16.0%) | 670 (11.6%) |
| 25 to 29 Minutes | 205 (3.8%) | 569 (9.9%) |
| 30 to 34 Minutes | 1,378 (25.4%) | 967 (16.8%) |
| 35 to 39 Minutes | 179 (3.3%) | 197 (3.4%) |
| 40 to 44 Minutes | 274 (5.1%) | 381 (6.6%) |
| 45 to 59 Minutes | 519 (9.6%) | 550 (9.5%) |
| 60 to 89 Minutes | 743 (13.7%) | 672 (11.7%) |
| 90 or more Minutes | 227 (4.2%) | 222 (3.8%) |
Time of Departure to Work by Sex in Landover
The most frequent times of departure to work in Landover are 12:00 AM to 4:59 AM (750, 13.8%) for males and 7:00 AM to 7:29 AM (1,080, 18.7%) for females.
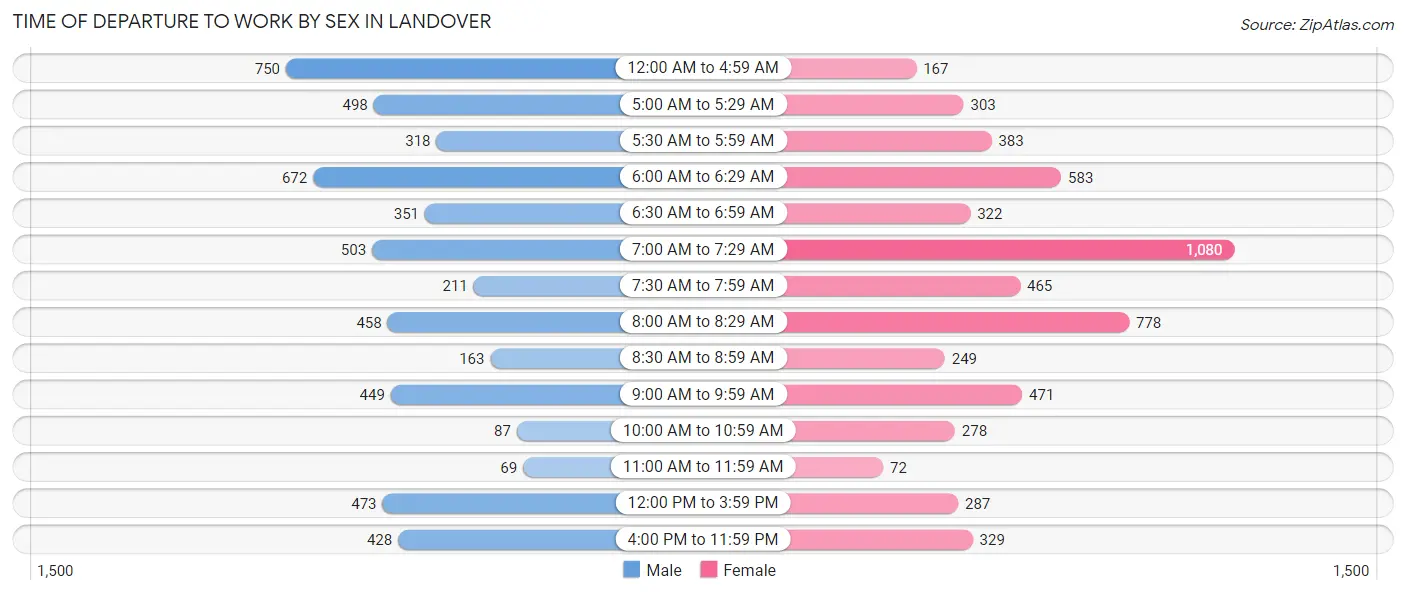
| Time of Departure | Male | Female |
| 12:00 AM to 4:59 AM | 750 (13.8%) | 167 (2.9%) |
| 5:00 AM to 5:29 AM | 498 (9.2%) | 303 (5.2%) |
| 5:30 AM to 5:59 AM | 318 (5.9%) | 383 (6.6%) |
| 6:00 AM to 6:29 AM | 672 (12.4%) | 583 (10.1%) |
| 6:30 AM to 6:59 AM | 351 (6.5%) | 322 (5.6%) |
| 7:00 AM to 7:29 AM | 503 (9.3%) | 1,080 (18.7%) |
| 7:30 AM to 7:59 AM | 211 (3.9%) | 465 (8.1%) |
| 8:00 AM to 8:29 AM | 458 (8.4%) | 778 (13.5%) |
| 8:30 AM to 8:59 AM | 163 (3.0%) | 249 (4.3%) |
| 9:00 AM to 9:59 AM | 449 (8.3%) | 471 (8.2%) |
| 10:00 AM to 10:59 AM | 87 (1.6%) | 278 (4.8%) |
| 11:00 AM to 11:59 AM | 69 (1.3%) | 72 (1.3%) |
| 12:00 PM to 3:59 PM | 473 (8.7%) | 287 (5.0%) |
| 4:00 PM to 11:59 PM | 428 (7.9%) | 329 (5.7%) |
| Total | 5,430 (100.0%) | 5,767 (100.0%) |
Housing Occupancy in Landover
Occupancy by Ownership in Landover
Of the total 8,737 dwellings in Landover, owner-occupied units account for 4,006 (45.9%), while renter-occupied units make up 4,731 (54.1%).
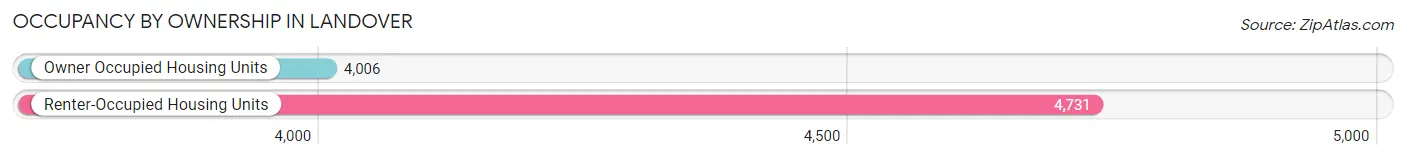
| Occupancy | # Housing Units | % Housing Units |
| Owner Occupied Housing Units | 4,006 | 45.9% |
| Renter-Occupied Housing Units | 4,731 | 54.1% |
| Total Occupied Housing Units | 8,737 | 100.0% |
Occupancy by Household Size in Landover
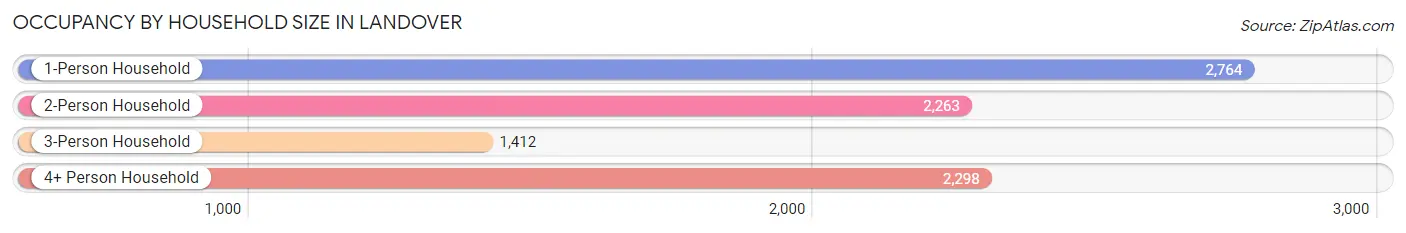
| Household Size | # Housing Units | % Housing Units |
| 1-Person Household | 2,764 | 31.6% |
| 2-Person Household | 2,263 | 25.9% |
| 3-Person Household | 1,412 | 16.2% |
| 4+ Person Household | 2,298 | 26.3% |
| Total Housing Units | 8,737 | 100.0% |
Occupancy by Ownership by Household Size in Landover
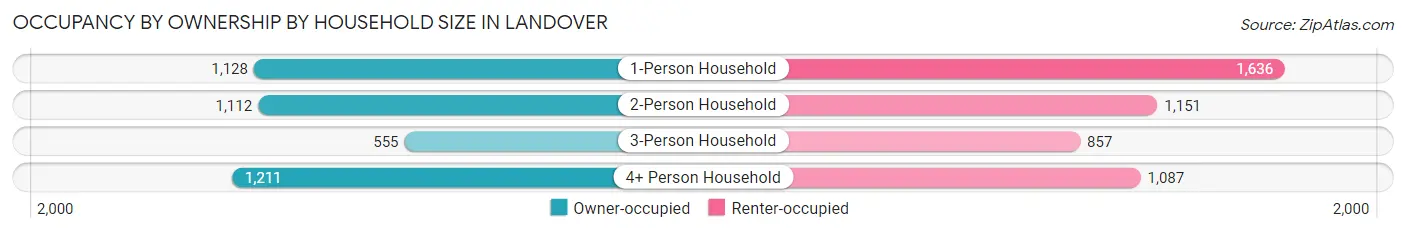
| Household Size | Owner-occupied | Renter-occupied |
| 1-Person Household | 1,128 (40.8%) | 1,636 (59.2%) |
| 2-Person Household | 1,112 (49.1%) | 1,151 (50.9%) |
| 3-Person Household | 555 (39.3%) | 857 (60.7%) |
| 4+ Person Household | 1,211 (52.7%) | 1,087 (47.3%) |
| Total Housing Units | 4,006 (45.9%) | 4,731 (54.1%) |
Occupancy by Educational Attainment in Landover
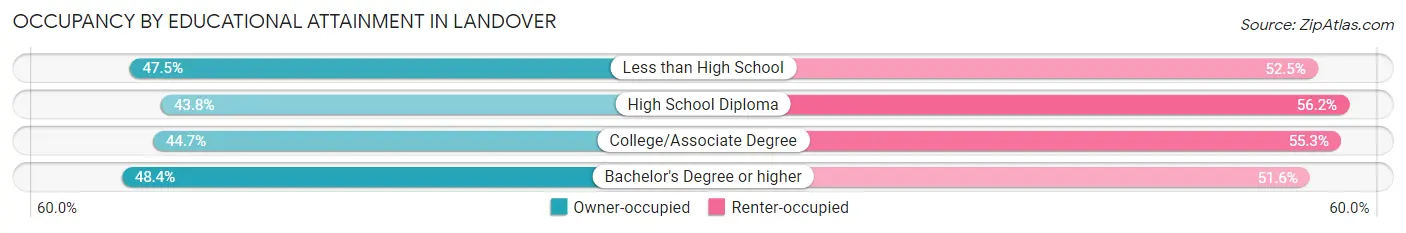
| Household Size | Owner-occupied | Renter-occupied |
| Less than High School | 761 (47.5%) | 841 (52.5%) |
| High School Diploma | 1,204 (43.8%) | 1,547 (56.2%) |
| College/Associate Degree | 995 (44.7%) | 1,229 (55.3%) |
| Bachelor's Degree or higher | 1,046 (48.4%) | 1,114 (51.6%) |
Occupancy by Age of Householder in Landover
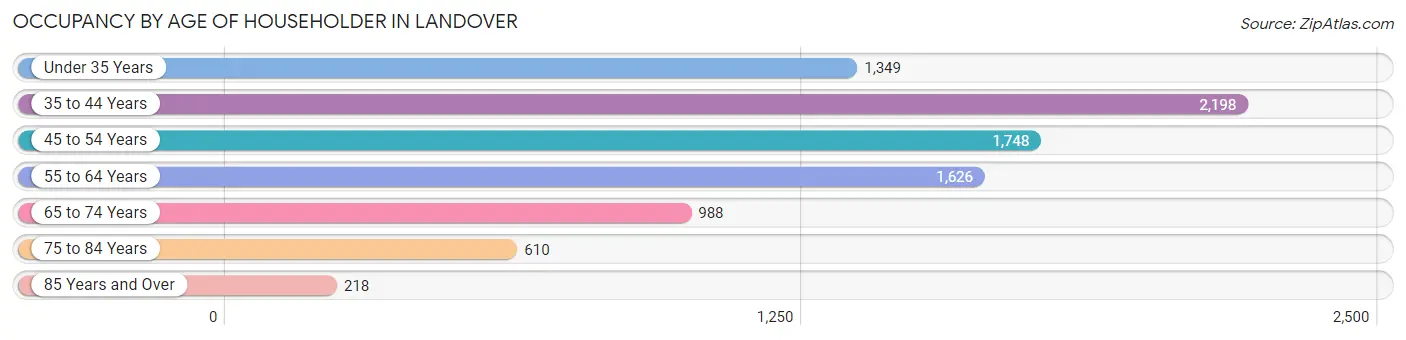
| Age Bracket | # Households | % Households |
| Under 35 Years | 1,349 | 15.4% |
| 35 to 44 Years | 2,198 | 25.2% |
| 45 to 54 Years | 1,748 | 20.0% |
| 55 to 64 Years | 1,626 | 18.6% |
| 65 to 74 Years | 988 | 11.3% |
| 75 to 84 Years | 610 | 7.0% |
| 85 Years and Over | 218 | 2.5% |
| Total | 8,737 | 100.0% |
Housing Finances in Landover
Median Income by Occupancy in Landover
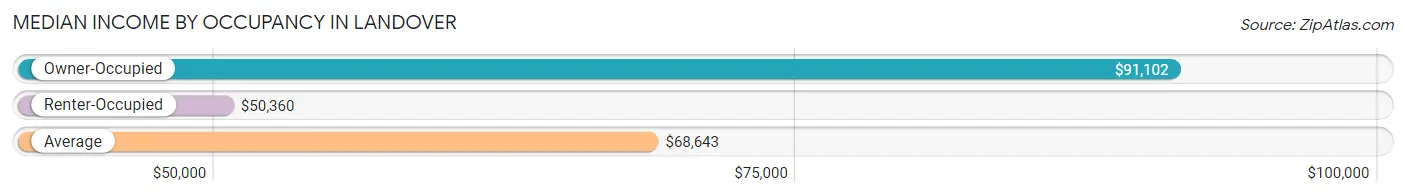
| Occupancy Type | # Households | Median Income |
| Owner-Occupied | 4,006 (45.9%) | $91,102 |
| Renter-Occupied | 4,731 (54.1%) | $50,360 |
| Average | 8,737 (100.0%) | $68,643 |
Occupancy by Householder Income Bracket in Landover
| Income Bracket | Owner-occupied | Renter-occupied |
| Less than $5,000 | 94 (2.4%) | 366 (7.7%) |
| $5,000 to $9,999 | 0 (0.0%) | 202 (4.3%) |
| $10,000 to $14,999 | 42 (1.1%) | 244 (5.2%) |
| $15,000 to $19,999 | 87 (2.2%) | 166 (3.5%) |
| $20,000 to $24,999 | 30 (0.7%) | 216 (4.6%) |
| $25,000 to $34,999 | 152 (3.8%) | 238 (5.0%) |
| $35,000 to $49,999 | 407 (10.2%) | 901 (19.0%) |
| $50,000 to $74,999 | 757 (18.9%) | 925 (19.6%) |
| $75,000 to $99,999 | 823 (20.5%) | 557 (11.8%) |
| $100,000 to $149,999 | 915 (22.8%) | 633 (13.4%) |
| $150,000 or more | 699 (17.4%) | 283 (6.0%) |
| Total | 4,006 (100.0%) | 4,731 (100.0%) |
Monthly Housing Cost Tiers in Landover
| Monthly Cost | Owner-occupied | Renter-occupied |
| Less than $300 | 29 (0.7%) | 56 (1.2%) |
| $300 to $499 | 118 (2.9%) | 238 (5.0%) |
| $500 to $799 | 552 (13.8%) | 57 (1.2%) |
| $800 to $999 | 311 (7.8%) | 32 (0.7%) |
| $1,000 to $1,499 | 755 (18.9%) | 1,367 (28.9%) |
| $1,500 to $1,999 | 1,071 (26.7%) | 2,053 (43.4%) |
| $2,000 to $2,499 | 704 (17.6%) | 621 (13.1%) |
| $2,500 to $2,999 | 293 (7.3%) | 191 (4.0%) |
| $3,000 or more | 173 (4.3%) | 12 (0.3%) |
| Total | 4,006 (100.0%) | 4,731 (100.0%) |
Physical Housing Characteristics in Landover
Housing Structures in Landover
| Structure Type | # Housing Units | % Housing Units |
| Single Unit, Detached | 2,368 | 27.1% |
| Single Unit, Attached | 2,788 | 31.9% |
| 2 Unit Apartments | 77 | 0.9% |
| 3 or 4 Unit Apartments | 176 | 2.0% |
| 5 to 9 Unit Apartments | 1,130 | 12.9% |
| 10 or more Apartments | 2,148 | 24.6% |
| Mobile Home / Other | 50 | 0.6% |
| Total | 8,737 | 100.0% |
Housing Structures by Occupancy in Landover
| Structure Type | Owner-occupied | Renter-occupied |
| Single Unit, Detached | 2,075 (87.6%) | 293 (12.4%) |
| Single Unit, Attached | 1,913 (68.6%) | 875 (31.4%) |
| 2 Unit Apartments | 0 (0.0%) | 77 (100.0%) |
| 3 or 4 Unit Apartments | 0 (0.0%) | 176 (100.0%) |
| 5 to 9 Unit Apartments | 12 (1.1%) | 1,118 (98.9%) |
| 10 or more Apartments | 6 (0.3%) | 2,142 (99.7%) |
| Mobile Home / Other | 0 (0.0%) | 50 (100.0%) |
| Total | 4,006 (45.9%) | 4,731 (54.1%) |
Housing Structures by Number of Rooms in Landover
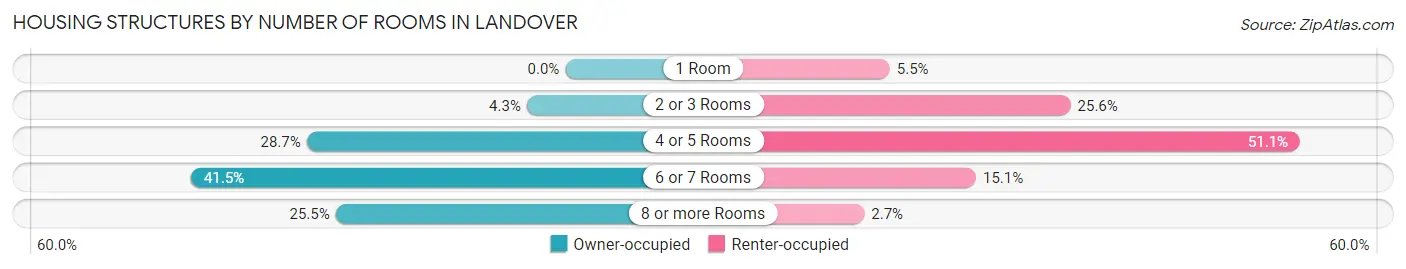
| Number of Rooms | Owner-occupied | Renter-occupied |
| 1 Room | 0 (0.0%) | 262 (5.5%) |
| 2 or 3 Rooms | 171 (4.3%) | 1,211 (25.6%) |
| 4 or 5 Rooms | 1,150 (28.7%) | 2,415 (51.0%) |
| 6 or 7 Rooms | 1,664 (41.5%) | 715 (15.1%) |
| 8 or more Rooms | 1,021 (25.5%) | 128 (2.7%) |
| Total | 4,006 (100.0%) | 4,731 (100.0%) |
Housing Structure by Heating Type in Landover
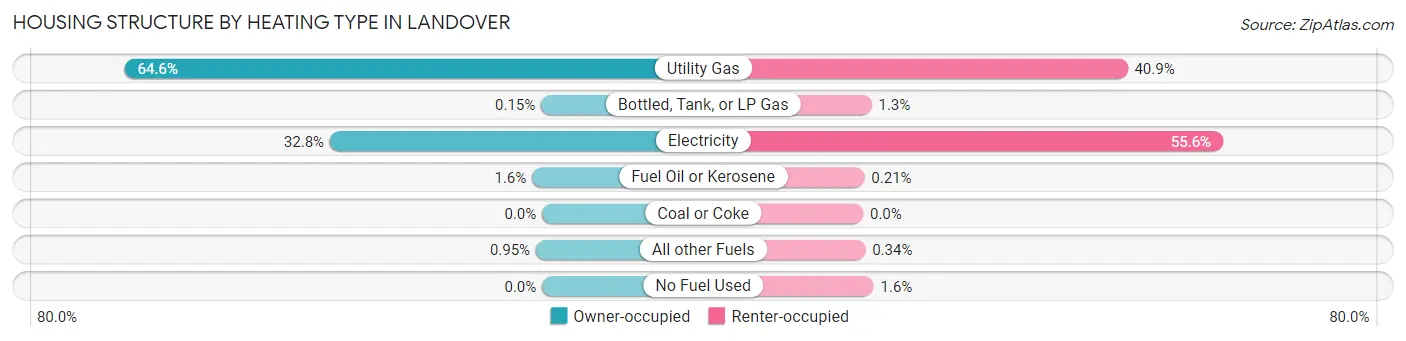
| Heating Type | Owner-occupied | Renter-occupied |
| Utility Gas | 2,586 (64.5%) | 1,934 (40.9%) |
| Bottled, Tank, or LP Gas | 6 (0.2%) | 62 (1.3%) |
| Electricity | 1,314 (32.8%) | 2,632 (55.6%) |
| Fuel Oil or Kerosene | 62 (1.5%) | 10 (0.2%) |
| Coal or Coke | 0 (0.0%) | 0 (0.0%) |
| All other Fuels | 38 (0.9%) | 16 (0.3%) |
| No Fuel Used | 0 (0.0%) | 77 (1.6%) |
| Total | 4,006 (100.0%) | 4,731 (100.0%) |
Household Vehicle Usage in Landover
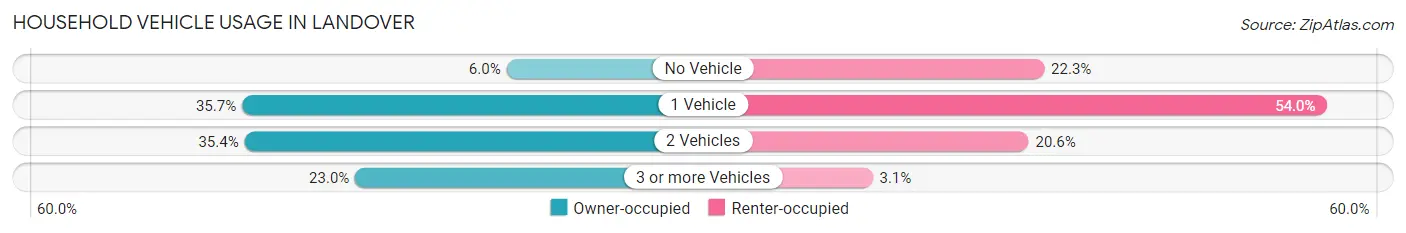
| Vehicles per Household | Owner-occupied | Renter-occupied |
| No Vehicle | 241 (6.0%) | 1,056 (22.3%) |
| 1 Vehicle | 1,428 (35.6%) | 2,556 (54.0%) |
| 2 Vehicles | 1,417 (35.4%) | 973 (20.6%) |
| 3 or more Vehicles | 920 (23.0%) | 146 (3.1%) |
| Total | 4,006 (100.0%) | 4,731 (100.0%) |
Real Estate & Mortgages in Landover
Real Estate and Mortgage Overview in Landover
| Characteristic | Without Mortgage | With Mortgage |
| Housing Units | 941 | 3,065 |
| Median Property Value | $308,500 | $274,000 |
| Median Household Income | $85,475 | $592 |
| Monthly Housing Costs | $641 | $173 |
| Real Estate Taxes | $3,308 | $19 |
Property Value by Mortgage Status in Landover
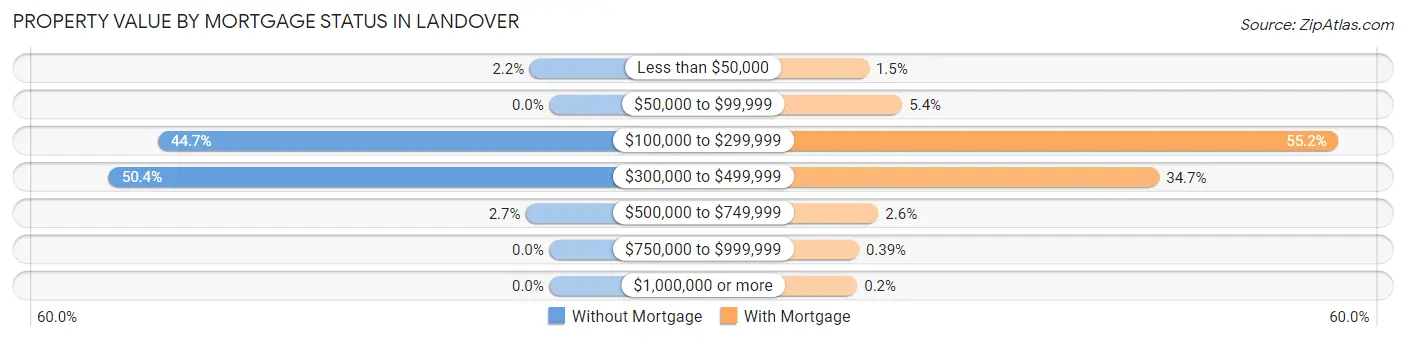
| Property Value | Without Mortgage | With Mortgage |
| Less than $50,000 | 21 (2.2%) | 47 (1.5%) |
| $50,000 to $99,999 | 0 (0.0%) | 164 (5.3%) |
| $100,000 to $299,999 | 421 (44.7%) | 1,692 (55.2%) |
| $300,000 to $499,999 | 474 (50.4%) | 1,064 (34.7%) |
| $500,000 to $749,999 | 25 (2.7%) | 80 (2.6%) |
| $750,000 to $999,999 | 0 (0.0%) | 12 (0.4%) |
| $1,000,000 or more | 0 (0.0%) | 6 (0.2%) |
| Total | 941 (100.0%) | 3,065 (100.0%) |
Household Income by Mortgage Status in Landover
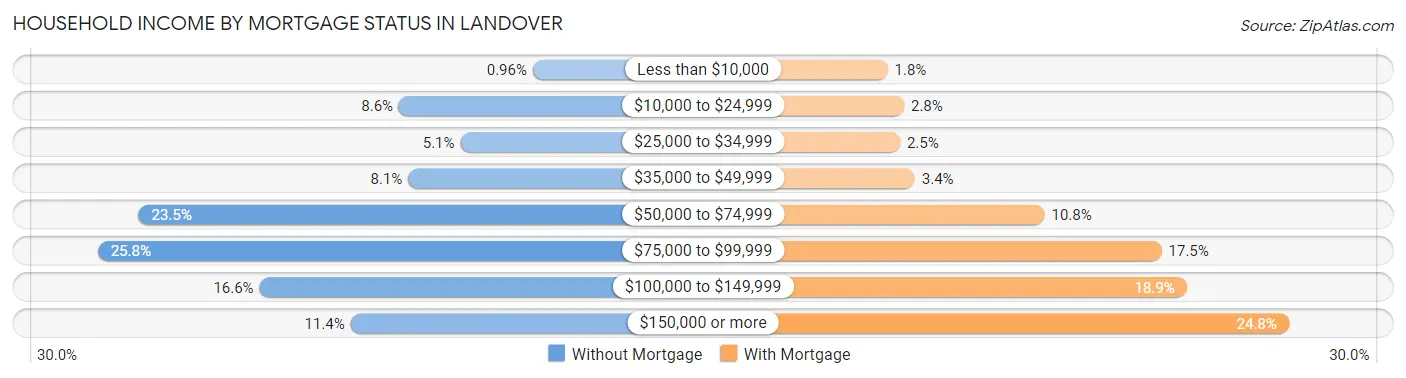
| Household Income | Without Mortgage | With Mortgage |
| Less than $10,000 | 9 (1.0%) | 56 (1.8%) |
| $10,000 to $24,999 | 81 (8.6%) | 85 (2.8%) |
| $25,000 to $34,999 | 48 (5.1%) | 78 (2.5%) |
| $35,000 to $49,999 | 76 (8.1%) | 104 (3.4%) |
| $50,000 to $74,999 | 221 (23.5%) | 331 (10.8%) |
| $75,000 to $99,999 | 243 (25.8%) | 536 (17.5%) |
| $100,000 to $149,999 | 156 (16.6%) | 580 (18.9%) |
| $150,000 or more | 107 (11.4%) | 759 (24.8%) |
| Total | 941 (100.0%) | 3,065 (100.0%) |
Property Value to Household Income Ratio in Landover
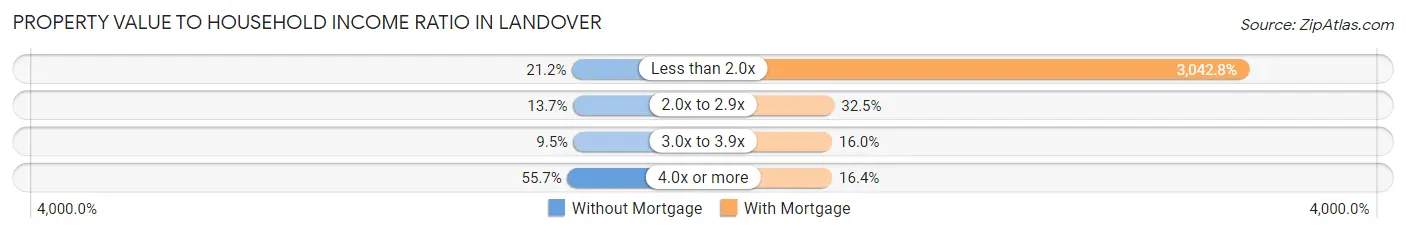
| Value-to-Income Ratio | Without Mortgage | With Mortgage |
| Less than 2.0x | 199 (21.1%) | 93,261 (3,042.8%) |
| 2.0x to 2.9x | 129 (13.7%) | 995 (32.5%) |
| 3.0x to 3.9x | 89 (9.5%) | 489 (16.0%) |
| 4.0x or more | 524 (55.7%) | 503 (16.4%) |
| Total | 941 (100.0%) | 3,065 (100.0%) |
Real Estate Taxes by Mortgage Status in Landover
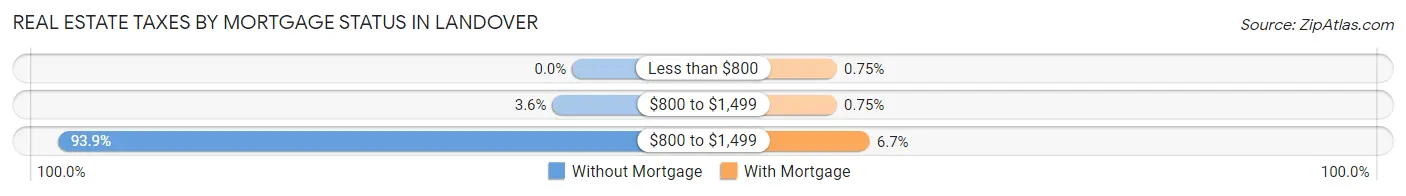
| Property Taxes | Without Mortgage | With Mortgage |
| Less than $800 | 0 (0.0%) | 23 (0.7%) |
| $800 to $1,499 | 34 (3.6%) | 23 (0.7%) |
| $800 to $1,499 | 884 (93.9%) | 206 (6.7%) |
| Total | 941 (100.0%) | 3,065 (100.0%) |
Health & Disability in Landover
Health Insurance Coverage by Age in Landover
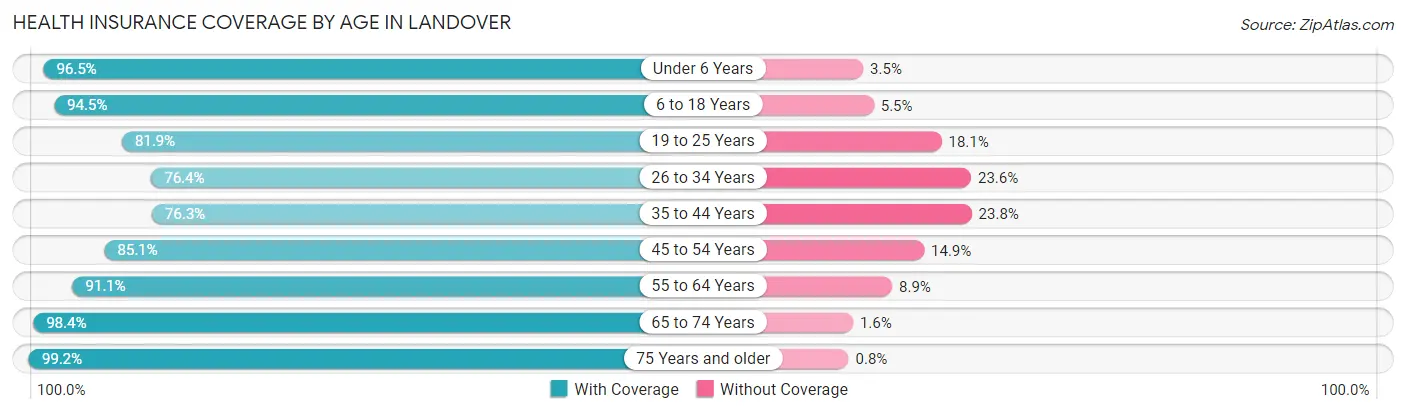
| Age Bracket | With Coverage | Without Coverage |
| Under 6 Years | 2,217 (96.5%) | 81 (3.5%) |
| 6 to 18 Years | 4,487 (94.5%) | 261 (5.5%) |
| 19 to 25 Years | 1,552 (81.9%) | 344 (18.1%) |
| 26 to 34 Years | 2,448 (76.4%) | 758 (23.6%) |
| 35 to 44 Years | 2,918 (76.2%) | 909 (23.7%) |
| 45 to 54 Years | 2,597 (85.1%) | 454 (14.9%) |
| 55 to 64 Years | 2,433 (91.1%) | 238 (8.9%) |
| 65 to 74 Years | 1,519 (98.4%) | 25 (1.6%) |
| 75 Years and older | 1,123 (99.2%) | 9 (0.8%) |
| Total | 21,294 (87.4%) | 3,079 (12.6%) |
Health Insurance Coverage by Citizenship Status in Landover
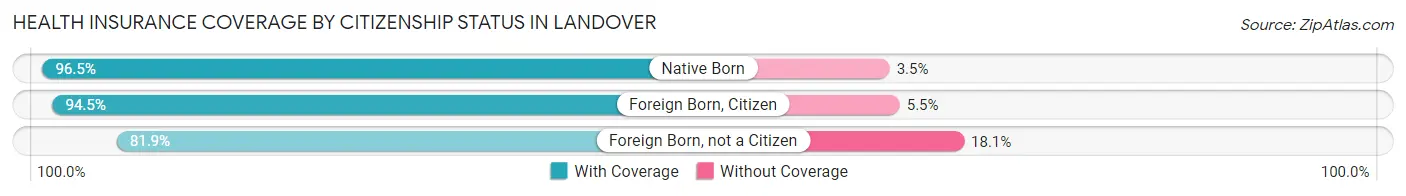
| Citizenship Status | With Coverage | Without Coverage |
| Native Born | 2,217 (96.5%) | 81 (3.5%) |
| Foreign Born, Citizen | 4,487 (94.5%) | 261 (5.5%) |
| Foreign Born, not a Citizen | 1,552 (81.9%) | 344 (18.1%) |
Health Insurance Coverage by Household Income in Landover
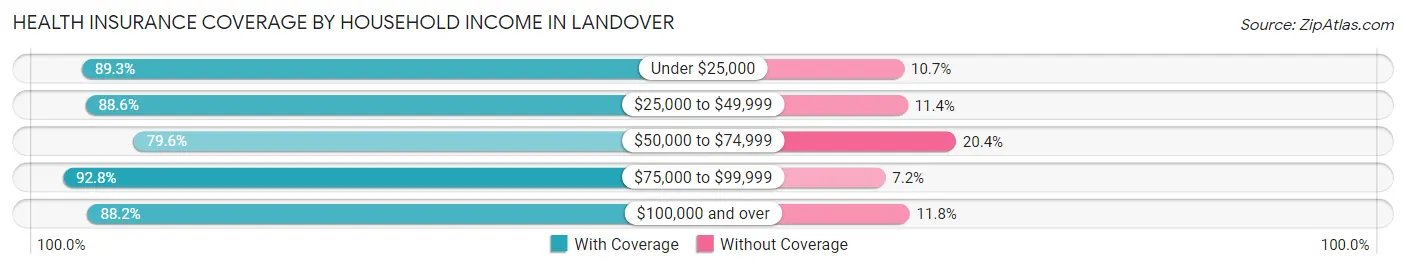
| Household Income | With Coverage | Without Coverage |
| Under $25,000 | 2,299 (89.3%) | 276 (10.7%) |
| $25,000 to $49,999 | 3,772 (88.6%) | 486 (11.4%) |
| $50,000 to $74,999 | 3,951 (79.6%) | 1,015 (20.4%) |
| $75,000 to $99,999 | 3,541 (92.8%) | 276 (7.2%) |
| $100,000 and over | 7,676 (88.2%) | 1,025 (11.8%) |
Public vs Private Health Insurance Coverage by Age in Landover
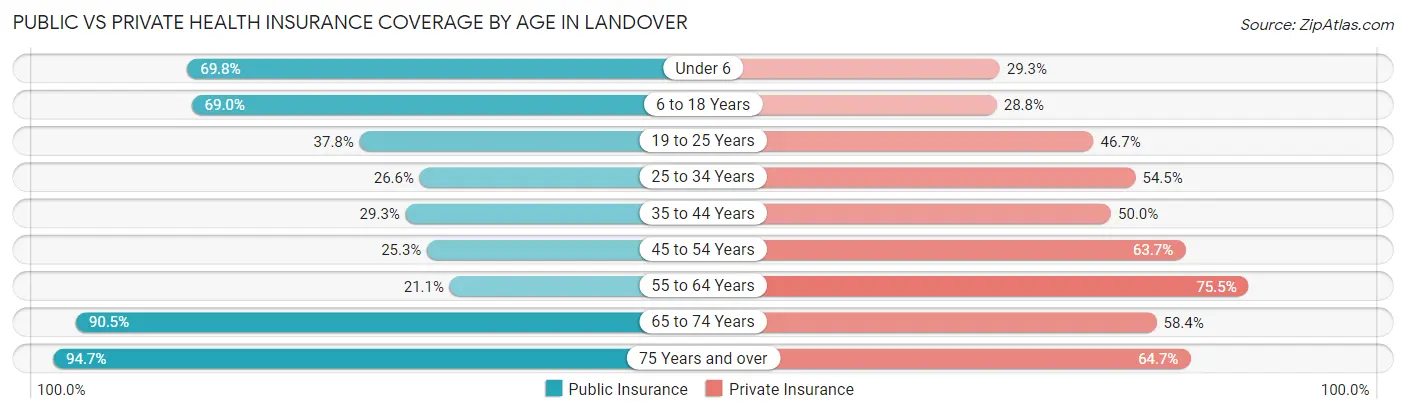
| Age Bracket | Public Insurance | Private Insurance |
| Under 6 | 1,604 (69.8%) | 674 (29.3%) |
| 6 to 18 Years | 3,276 (69.0%) | 1,366 (28.8%) |
| 19 to 25 Years | 717 (37.8%) | 886 (46.7%) |
| 25 to 34 Years | 854 (26.6%) | 1,748 (54.5%) |
| 35 to 44 Years | 1,120 (29.3%) | 1,913 (50.0%) |
| 45 to 54 Years | 771 (25.3%) | 1,944 (63.7%) |
| 55 to 64 Years | 563 (21.1%) | 2,016 (75.5%) |
| 65 to 74 Years | 1,397 (90.5%) | 902 (58.4%) |
| 75 Years and over | 1,072 (94.7%) | 732 (64.7%) |
| Total | 11,374 (46.7%) | 12,181 (50.0%) |
Disability Status by Sex by Age in Landover
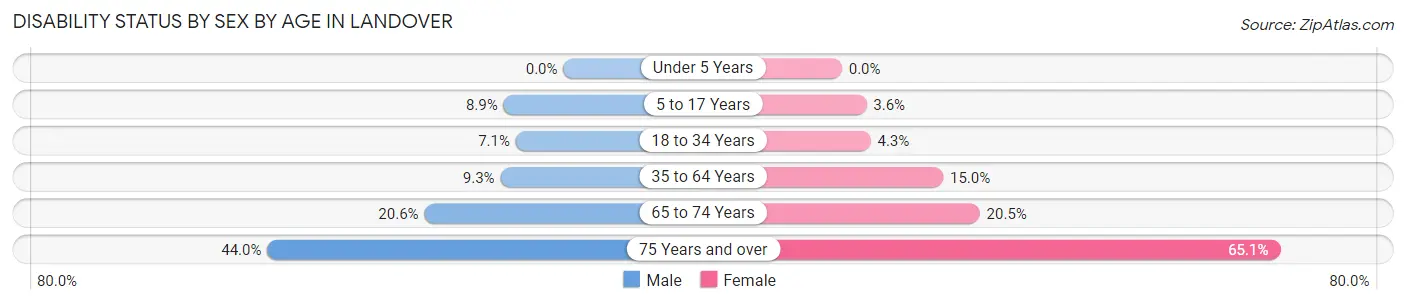
| Age Bracket | Male | Female |
| Under 5 Years | 0 (0.0%) | 0 (0.0%) |
| 5 to 17 Years | 212 (8.9%) | 86 (3.6%) |
| 18 to 34 Years | 165 (7.1%) | 133 (4.3%) |
| 35 to 64 Years | 431 (9.3%) | 742 (15.0%) |
| 65 to 74 Years | 118 (20.6%) | 199 (20.5%) |
| 75 Years and over | 160 (44.0%) | 500 (65.1%) |
Disability Class by Sex by Age in Landover
Disability Class: Hearing Difficulty
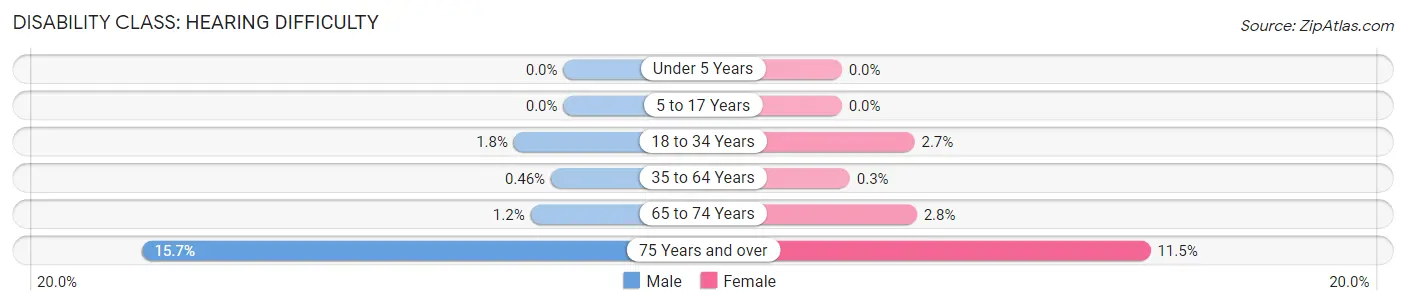
| Age Bracket | Male | Female |
| Under 5 Years | 0 (0.0%) | 0 (0.0%) |
| 5 to 17 Years | 0 (0.0%) | 0 (0.0%) |
| 18 to 34 Years | 43 (1.8%) | 84 (2.7%) |
| 35 to 64 Years | 21 (0.5%) | 15 (0.3%) |
| 65 to 74 Years | 7 (1.2%) | 27 (2.8%) |
| 75 Years and over | 57 (15.7%) | 88 (11.5%) |
Disability Class: Vision Difficulty
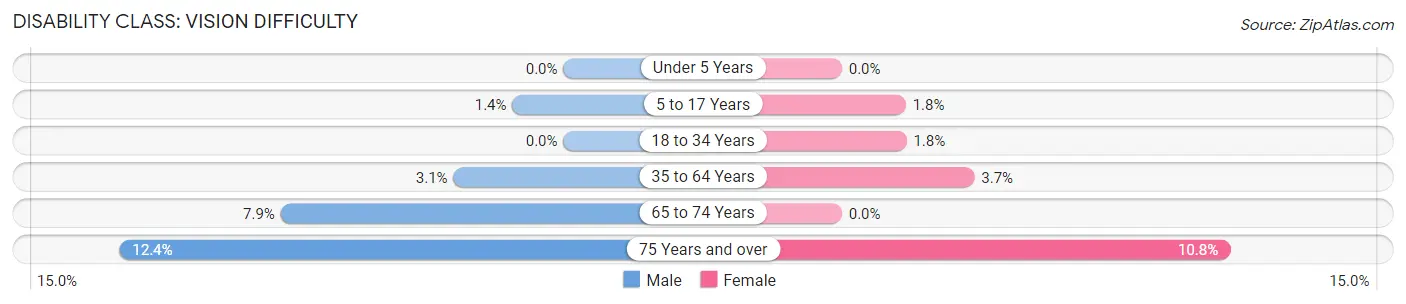
| Age Bracket | Male | Female |
| Under 5 Years | 0 (0.0%) | 0 (0.0%) |
| 5 to 17 Years | 34 (1.4%) | 42 (1.8%) |
| 18 to 34 Years | 0 (0.0%) | 56 (1.8%) |
| 35 to 64 Years | 141 (3.1%) | 182 (3.7%) |
| 65 to 74 Years | 45 (7.9%) | 0 (0.0%) |
| 75 Years and over | 45 (12.4%) | 83 (10.8%) |
Disability Class: Cognitive Difficulty
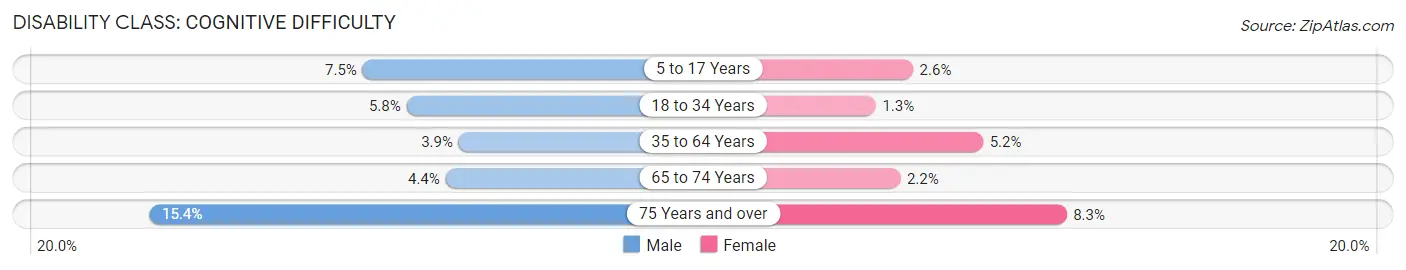
| Age Bracket | Male | Female |
| 5 to 17 Years | 178 (7.4%) | 62 (2.6%) |
| 18 to 34 Years | 136 (5.8%) | 39 (1.3%) |
| 35 to 64 Years | 179 (3.9%) | 258 (5.2%) |
| 65 to 74 Years | 25 (4.4%) | 21 (2.2%) |
| 75 Years and over | 56 (15.4%) | 64 (8.3%) |
Disability Class: Ambulatory Difficulty
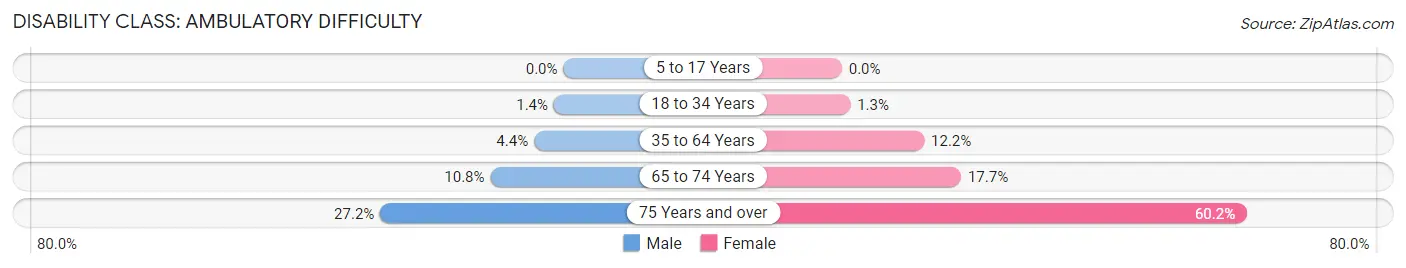
| Age Bracket | Male | Female |
| 5 to 17 Years | 0 (0.0%) | 0 (0.0%) |
| 18 to 34 Years | 33 (1.4%) | 39 (1.3%) |
| 35 to 64 Years | 201 (4.4%) | 603 (12.2%) |
| 65 to 74 Years | 62 (10.8%) | 172 (17.7%) |
| 75 Years and over | 99 (27.2%) | 462 (60.2%) |
Disability Class: Self-Care Difficulty
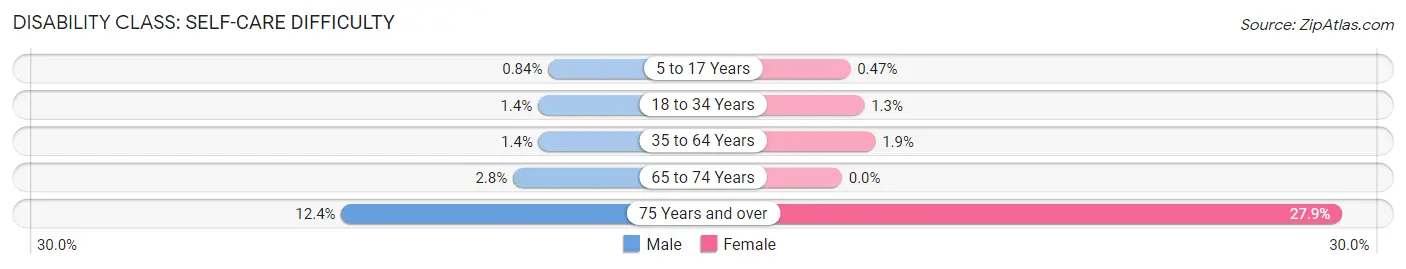
| Age Bracket | Male | Female |
| 5 to 17 Years | 20 (0.8%) | 11 (0.5%) |
| 18 to 34 Years | 33 (1.4%) | 39 (1.3%) |
| 35 to 64 Years | 63 (1.4%) | 92 (1.9%) |
| 65 to 74 Years | 16 (2.8%) | 0 (0.0%) |
| 75 Years and over | 45 (12.4%) | 214 (27.9%) |
Technology Access in Landover
Computing Device Access in Landover
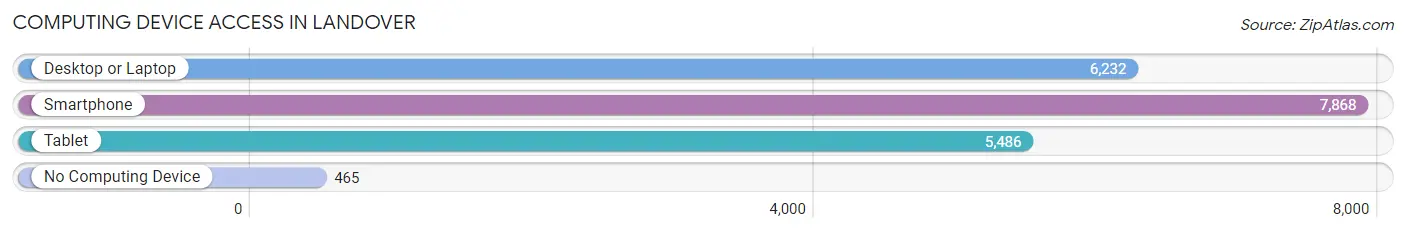
| Device Type | # Households | % Households |
| Desktop or Laptop | 6,232 | 71.3% |
| Smartphone | 7,868 | 90.0% |
| Tablet | 5,486 | 62.8% |
| No Computing Device | 465 | 5.3% |
| Total | 8,737 | 100.0% |
Internet Access in Landover
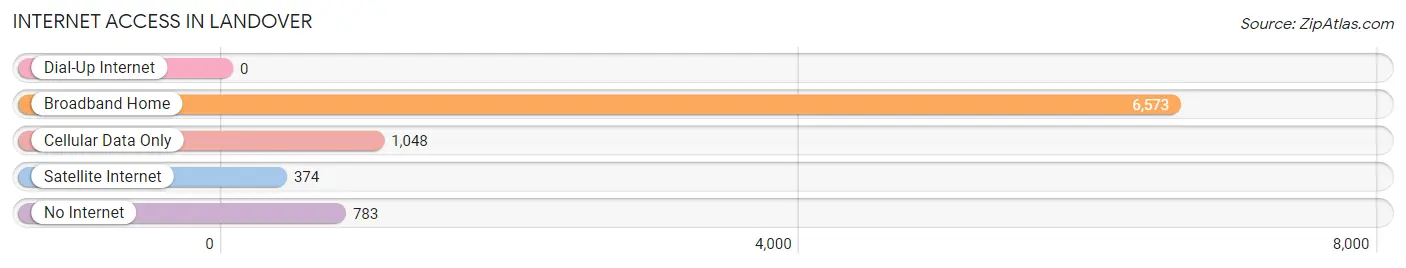
| Internet Type | # Households | % Households |
| Dial-Up Internet | 0 | 0.0% |
| Broadband Home | 6,573 | 75.2% |
| Cellular Data Only | 1,048 | 12.0% |
| Satellite Internet | 374 | 4.3% |
| No Internet | 783 | 9.0% |
| Total | 8,737 | 100.0% |
Landover Summary
Landover, Maryland is a small town located in Prince George’s County, Maryland, just east of Washington, D.C. It is a part of the Washington Metropolitan Area and is home to a population of approximately 23,000 people. The town is known for its diverse population, its proximity to the nation’s capital, and its vibrant economy.
History
Landover was first settled in the late 1700s by a group of farmers from Pennsylvania. The town was originally known as “William’s Crossroads” after the first settler, William Deakins. In 1873, the town was renamed “Landover” after the nearby Landover Hills. The town was officially incorporated in 1924.
In the early 1900s, Landover was a rural farming community. The town was home to several small farms and a few small businesses. In the 1950s, the town began to experience rapid growth as the Washington, D.C. metropolitan area expanded. The town was annexed by Prince George’s County in 1957.
Geography
Landover is located in Prince George’s County, Maryland, just east of Washington, D.C. The town is situated on the banks of the Anacostia River and is bordered by the towns of Cheverly, New Carrollton, and Bladensburg. The town covers an area of approximately 4.5 square miles and has a population density of 5,000 people per square mile.
The town is located in a humid subtropical climate zone and experiences hot, humid summers and mild winters. The average annual temperature is around 60 degrees Fahrenheit. The town receives an average of 40 inches of precipitation per year.
Economy
Landover’s economy is largely based on the service industry. The town is home to several large retail stores, including Walmart, Target, and Best Buy. The town is also home to several restaurants, banks, and other businesses.
The town is also home to several government agencies, including the Federal Aviation Administration, the National Transportation Safety Board, and the U.S. Department of Agriculture. The town is also home to several corporate headquarters, including the headquarters of Giant Food, Inc.
Demographics
As of the 2010 census, the population of Landover was 23,078. The town has a diverse population, with African Americans making up the majority of the population (63.3%). The town also has a large Hispanic population (17.2%) and a small Asian population (3.2%). The median household income in the town is $50,845.
Landover is a vibrant and diverse town with a rich history and a bright future. The town is home to a diverse population and a thriving economy. The town is conveniently located near Washington, D.C. and is a great place to live, work, and play.
Common Questions
What is Per Capita Income in Landover?
Per Capita income in Landover is $34,054.
What is the Median Family Income in Landover?
Median Family Income in Landover is $79,953.
What is the Median Household income in Landover?
Median Household Income in Landover is $68,643.
What is Income or Wage Gap in Landover?
Income or Wage Gap in Landover is 9.7%.
Women in Landover earn 90.3 cents for every dollar earned by a man.
What is Family Income Deficit in Landover?
Family Income Deficit in Landover is $12,208.
Families that are below poverty line in Landover earn $12,208 less on average than the poverty threshold level.
What is Inequality or Gini Index in Landover?
Inequality or Gini Index in Landover is 0.47.
What is the Total Population of Landover?
Total Population of Landover is 24,430.
What is the Total Male Population of Landover?
Total Male Population of Landover is 11,279.
What is the Total Female Population of Landover?
Total Female Population of Landover is 13,151.
What is the Ratio of Males per 100 Females in Landover?
There are 85.77 Males per 100 Females in Landover.
What is the Ratio of Females per 100 Males in Landover?
There are 116.60 Females per 100 Males in Landover.
What is the Median Population Age in Landover?
Median Population Age in Landover is 35.1 Years.
What is the Average Family Size in Landover
Average Family Size in Landover is 3.6 People.
What is the Average Household Size in Landover
Average Household Size in Landover is 2.8 People.
How Large is the Labor Force in Landover?
There are 13,037 People in the Labor Forcein in Landover.
What is the Percentage of People in the Labor Force in Landover?
70.6% of People are in the Labor Force in Landover.
What is the Unemployment Rate in Landover?
Unemployment Rate in Landover is 6.0%.