New Carrollton, MD Map & Demographics
New Carrollton Map
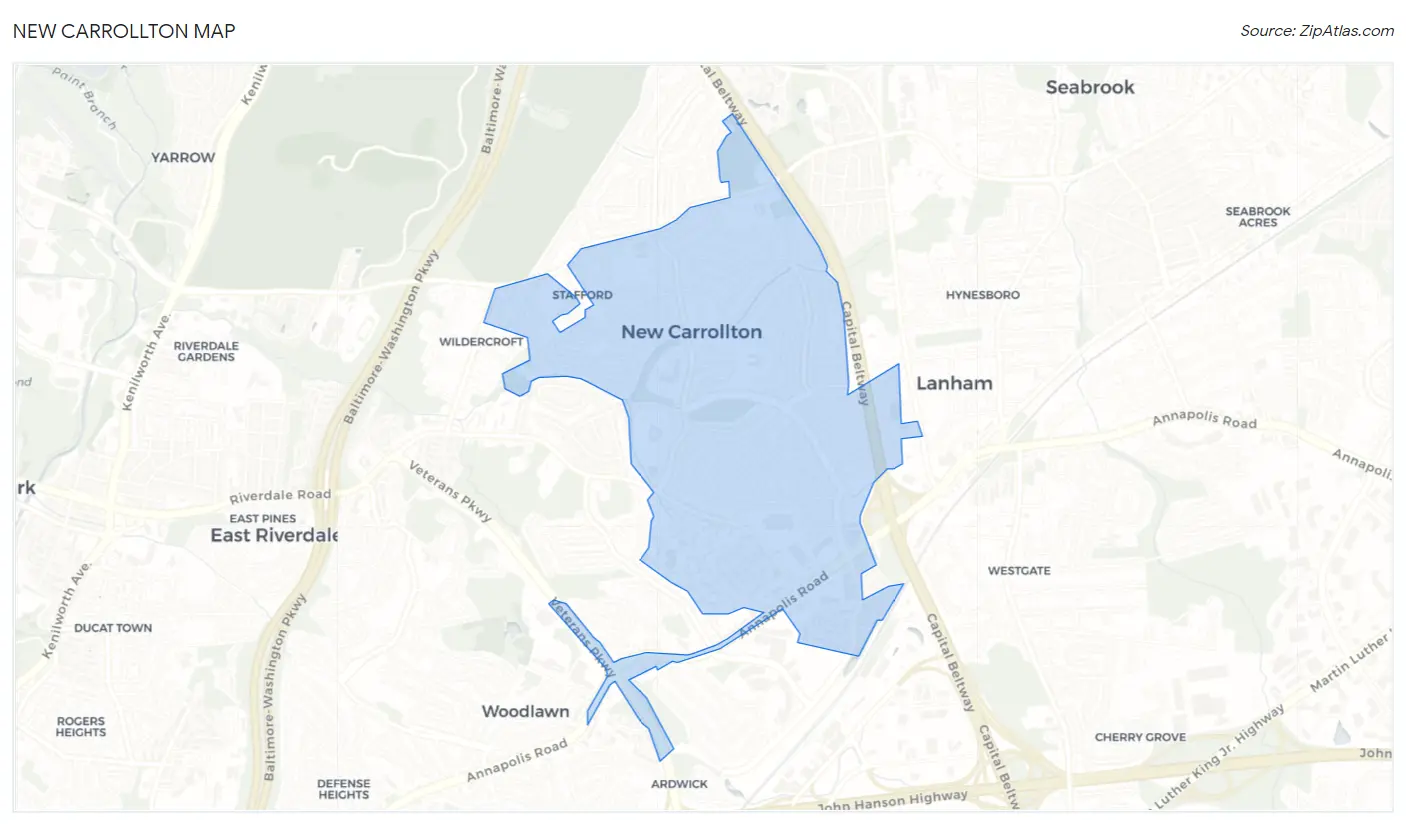
New Carrollton Overview
$33,170
PER CAPITA INCOME
$99,375
AVG FAMILY INCOME
$76,386
AVG HOUSEHOLD INCOME
8.7%
WAGE / INCOME GAP [ % ]
91.3¢/ $1
WAGE / INCOME GAP [ $ ]
0.39
INEQUALITY / GINI INDEX
13,580
TOTAL POPULATION
6,633
MALE POPULATION
6,947
FEMALE POPULATION
95.48
MALES / 100 FEMALES
104.73
FEMALES / 100 MALES
34.8
MEDIAN AGE
3.7
AVG FAMILY SIZE
2.9
AVG HOUSEHOLD SIZE
7,714
LABOR FORCE [ PEOPLE ]
73.0%
PERCENT IN LABOR FORCE
10.9%
UNEMPLOYMENT RATE
New Carrollton Area Codes
Income in New Carrollton
Income Overview in New Carrollton
Per Capita Income in New Carrollton is $33,170, while median incomes of families and households are $99,375 and $76,386 respectively.
| Characteristic | Number | Measure |
| Per Capita Income | 13,580 | $33,170 |
| Median Family Income | 2,863 | $99,375 |
| Mean Family Income | 2,863 | $109,966 |
| Median Household Income | 4,748 | $76,386 |
| Mean Household Income | 4,748 | $91,742 |
| Income Deficit | 2,863 | $0 |
| Wage / Income Gap (%) | 13,580 | 8.71% |
| Wage / Income Gap ($) | 13,580 | 91.29¢ per $1 |
| Gini / Inequality Index | 13,580 | 0.39 |
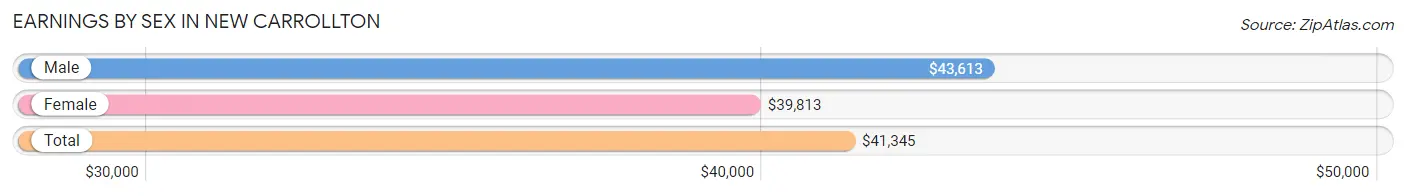
Earnings by Sex in New Carrollton
Average Earnings in New Carrollton are $41,345, $43,613 for men and $39,813 for women, a difference of 8.7%.
| Sex | Number | Average Earnings |
| Male | 3,949 (53.3%) | $43,613 |
| Female | 3,464 (46.7%) | $39,813 |
| Total | 7,413 (100.0%) | $41,345 |
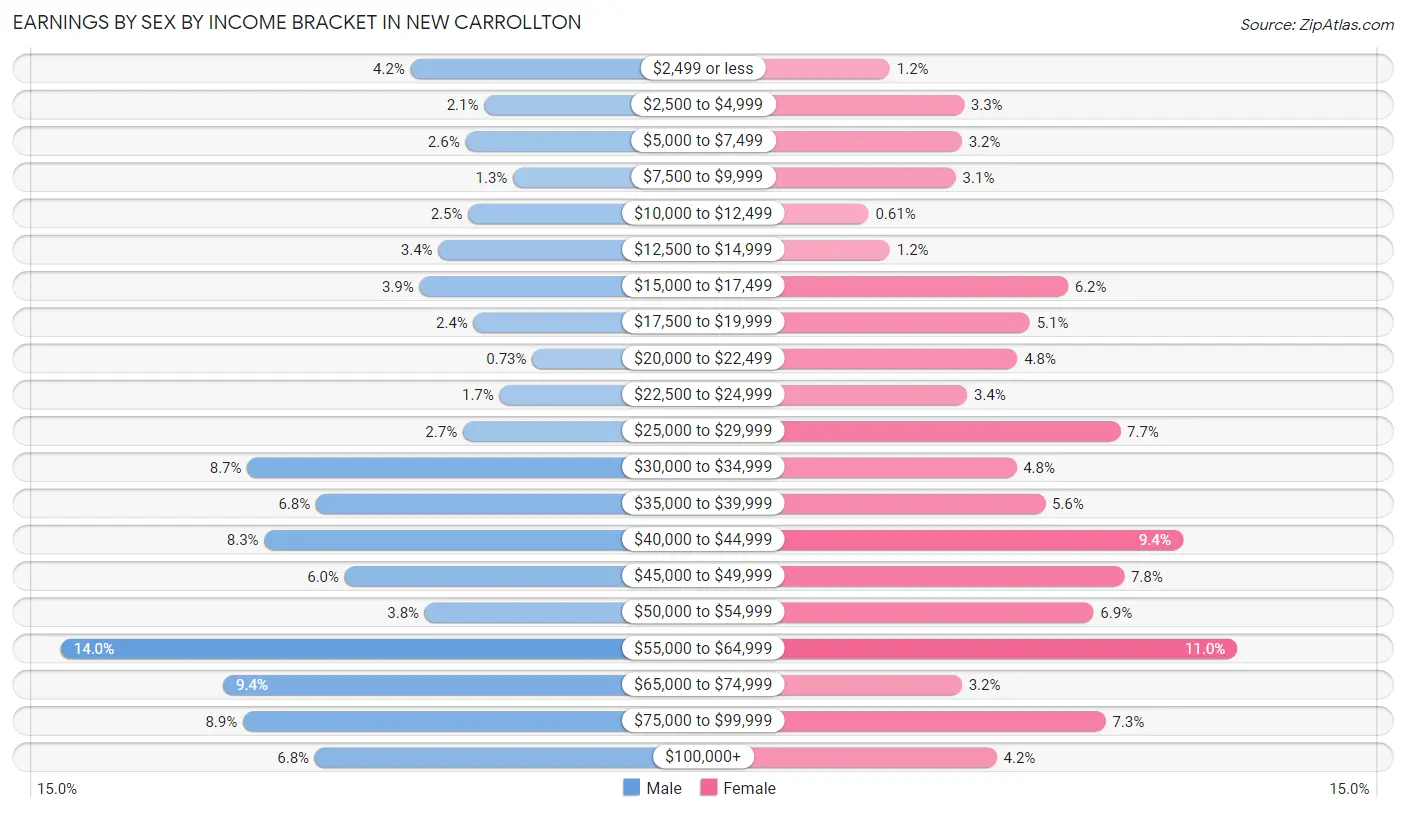
Earnings by Sex by Income Bracket in New Carrollton
The most common earnings brackets in New Carrollton are $55,000 to $64,999 for men (552 | 14.0%) and $55,000 to $64,999 for women (380 | 11.0%).
| Income | Male | Female |
| $2,499 or less | 164 (4.2%) | 42 (1.2%) |
| $2,500 to $4,999 | 82 (2.1%) | 114 (3.3%) |
| $5,000 to $7,499 | 103 (2.6%) | 112 (3.2%) |
| $7,500 to $9,999 | 50 (1.3%) | 106 (3.1%) |
| $10,000 to $12,499 | 100 (2.5%) | 21 (0.6%) |
| $12,500 to $14,999 | 133 (3.4%) | 42 (1.2%) |
| $15,000 to $17,499 | 154 (3.9%) | 215 (6.2%) |
| $17,500 to $19,999 | 94 (2.4%) | 178 (5.1%) |
| $20,000 to $22,499 | 29 (0.7%) | 166 (4.8%) |
| $22,500 to $24,999 | 65 (1.7%) | 117 (3.4%) |
| $25,000 to $29,999 | 106 (2.7%) | 266 (7.7%) |
| $30,000 to $34,999 | 345 (8.7%) | 165 (4.8%) |
| $35,000 to $39,999 | 269 (6.8%) | 193 (5.6%) |
| $40,000 to $44,999 | 326 (8.3%) | 327 (9.4%) |
| $45,000 to $49,999 | 237 (6.0%) | 270 (7.8%) |
| $50,000 to $54,999 | 148 (3.7%) | 240 (6.9%) |
| $55,000 to $64,999 | 552 (14.0%) | 380 (11.0%) |
| $65,000 to $74,999 | 372 (9.4%) | 112 (3.2%) |
| $75,000 to $99,999 | 350 (8.9%) | 252 (7.3%) |
| $100,000+ | 270 (6.8%) | 146 (4.2%) |
| Total | 3,949 (100.0%) | 3,464 (100.0%) |
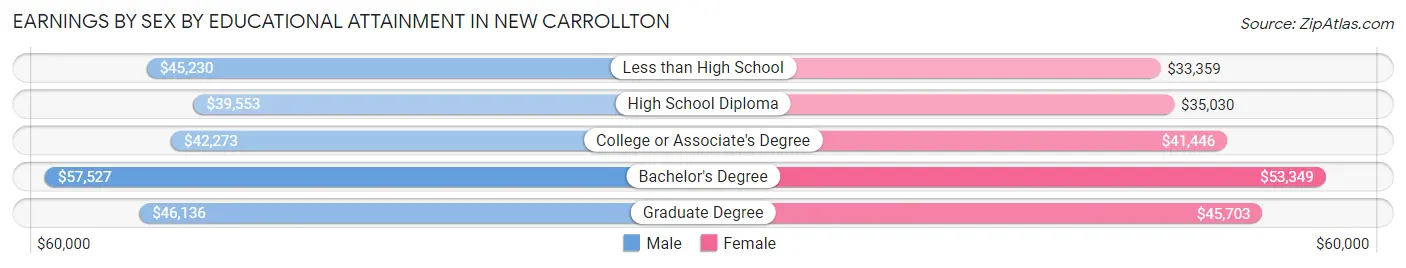
Earnings by Sex by Educational Attainment in New Carrollton
Average earnings in New Carrollton are $46,116 for men and $41,091 for women, a difference of 10.9%. Men with an educational attainment of bachelor's degree enjoy the highest average annual earnings of $57,527, while those with high school diploma education earn the least with $39,553. Women with an educational attainment of bachelor's degree earn the most with the average annual earnings of $53,349, while those with less than high school education have the smallest earnings of $33,359.
| Educational Attainment | Male Income | Female Income |
| Less than High School | $45,230 | $33,359 |
| High School Diploma | $39,553 | $35,030 |
| College or Associate's Degree | $42,273 | $41,446 |
| Bachelor's Degree | $57,527 | $53,349 |
| Graduate Degree | $46,136 | $45,703 |
| Total | $46,116 | $41,091 |
Family Income in New Carrollton
Family Income Brackets in New Carrollton
According to the New Carrollton family income data, there are 790 families falling into the $100,000 to $149,999 income range, which is the most common income bracket and makes up 27.6% of all families. Conversely, the less than $10,000 income bracket is the least frequent group with only 9 families (0.3%) belonging to this category.
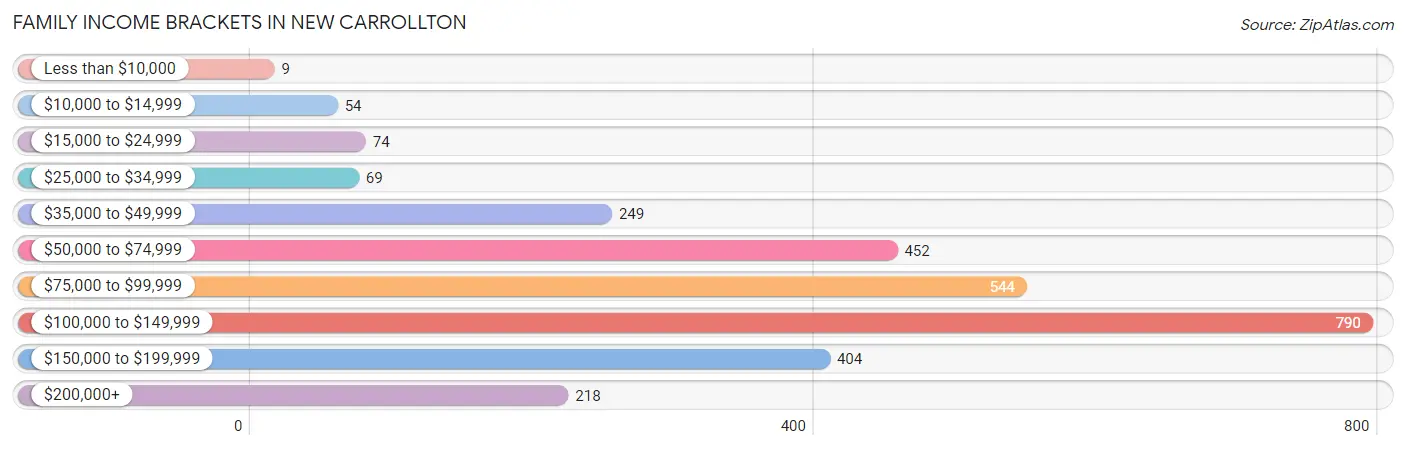
| Income Bracket | # Families | % Families |
| Less than $10,000 | 9 | 0.3% |
| $10,000 to $14,999 | 54 | 1.9% |
| $15,000 to $24,999 | 74 | 2.6% |
| $25,000 to $34,999 | 69 | 2.4% |
| $35,000 to $49,999 | 249 | 8.7% |
| $50,000 to $74,999 | 452 | 15.8% |
| $75,000 to $99,999 | 544 | 19.0% |
| $100,000 to $149,999 | 790 | 27.6% |
| $150,000 to $199,999 | 404 | 14.1% |
| $200,000+ | 218 | 7.6% |
Family Income by Famaliy Size in New Carrollton
4-person families (620 | 21.7%) account for the highest median family income in New Carrollton with $115,185 per family, while 2-person families (977 | 34.1%) have the highest median income of $36,458 per family member.
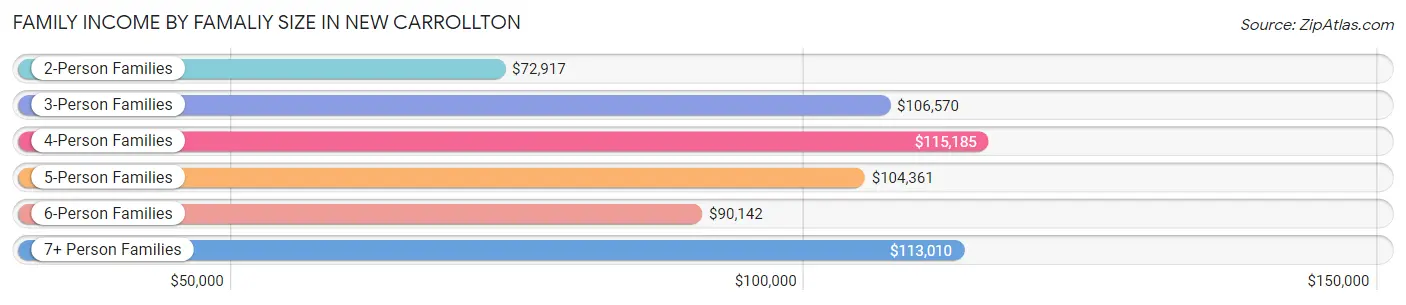
| Income Bracket | # Families | Median Income |
| 2-Person Families | 977 (34.1%) | $72,917 |
| 3-Person Families | 558 (19.5%) | $106,570 |
| 4-Person Families | 620 (21.7%) | $115,185 |
| 5-Person Families | 335 (11.7%) | $104,361 |
| 6-Person Families | 189 (6.6%) | $90,142 |
| 7+ Person Families | 184 (6.4%) | $113,010 |
| Total | 2,863 (100.0%) | $99,375 |
Family Income by Number of Earners in New Carrollton
The median family income in New Carrollton is $99,375, with families comprising 3+ earners (550) having the highest median family income of $145,313, while families with 1 earner (1,033) have the lowest median family income of $63,153, accounting for 19.2% and 36.1% of families, respectively.
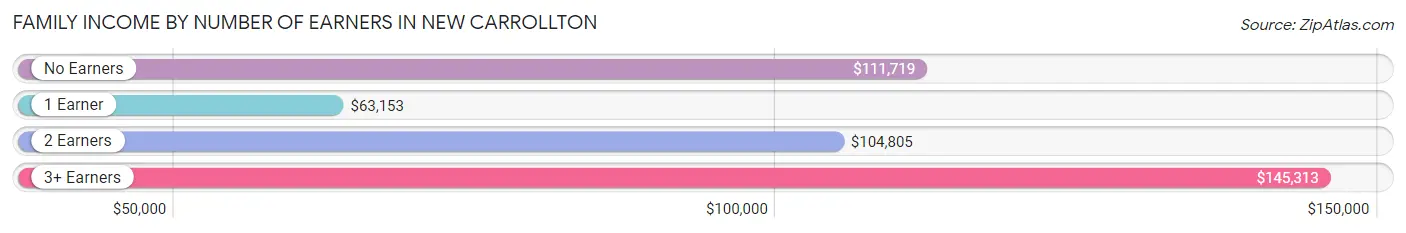
| Number of Earners | # Families | Median Income |
| No Earners | 141 (4.9%) | $111,719 |
| 1 Earner | 1,033 (36.1%) | $63,153 |
| 2 Earners | 1,139 (39.8%) | $104,805 |
| 3+ Earners | 550 (19.2%) | $145,313 |
| Total | 2,863 (100.0%) | $99,375 |
Household Income in New Carrollton
Household Income Brackets in New Carrollton
With 897 households falling in the category, the $50,000 to $74,999 income range is the most frequent in New Carrollton, accounting for 18.9% of all households. In contrast, only 142 households (3.0%) fall into the $25,000 to $34,999 income bracket, making it the least populous group.
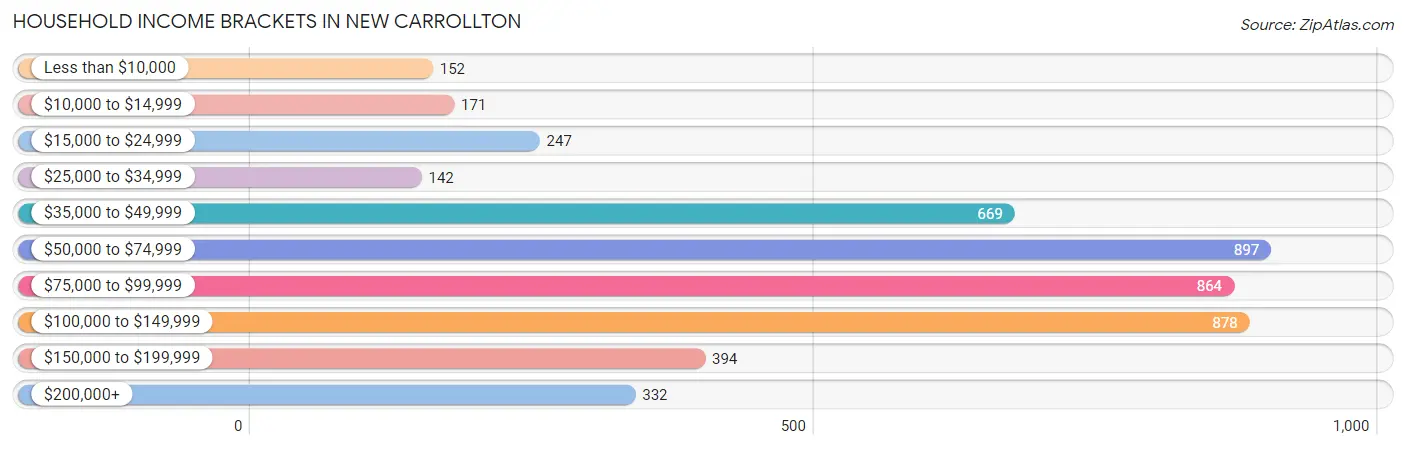
| Income Bracket | # Households | % Households |
| Less than $10,000 | 152 | 3.2% |
| $10,000 to $14,999 | 171 | 3.6% |
| $15,000 to $24,999 | 247 | 5.2% |
| $25,000 to $34,999 | 142 | 3.0% |
| $35,000 to $49,999 | 669 | 14.1% |
| $50,000 to $74,999 | 897 | 18.9% |
| $75,000 to $99,999 | 864 | 18.2% |
| $100,000 to $149,999 | 878 | 18.5% |
| $150,000 to $199,999 | 394 | 8.3% |
| $200,000+ | 332 | 7.0% |
Household Income by Householder Age in New Carrollton
The median household income in New Carrollton is $76,386, with the highest median household income of $82,895 found in the 65+ years age bracket for the primary householder. A total of 1,086 households (22.9%) fall into this category. Meanwhile, the 15 to 24 years age bracket for the primary householder has the lowest median household income of $0, with 34 households (0.7%) in this group.
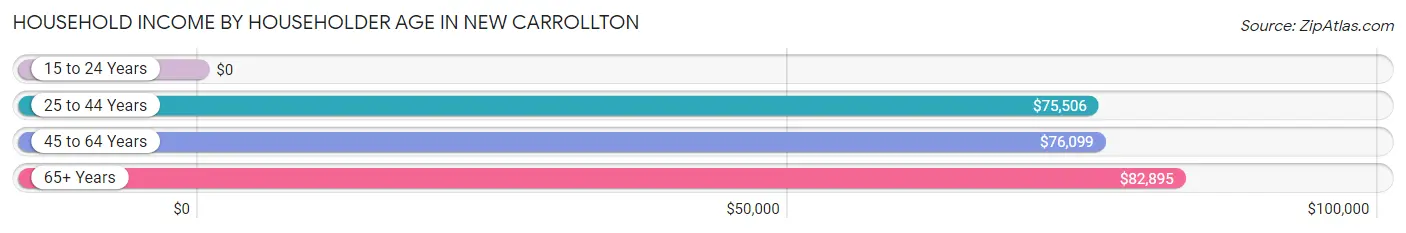
| Income Bracket | # Households | Median Income |
| 15 to 24 Years | 34 (0.7%) | $0 |
| 25 to 44 Years | 1,791 (37.7%) | $75,506 |
| 45 to 64 Years | 1,837 (38.7%) | $76,099 |
| 65+ Years | 1,086 (22.9%) | $82,895 |
| Total | 4,748 (100.0%) | $76,386 |
Poverty in New Carrollton
Income Below Poverty by Sex and Age in New Carrollton
With 5.7% poverty level for males and 6.9% for females among the residents of New Carrollton, 12 to 14 year old males and 15 year old females are the most vulnerable to poverty, with 51 males (18.5%) and 44 females (34.9%) in their respective age groups living below the poverty level.
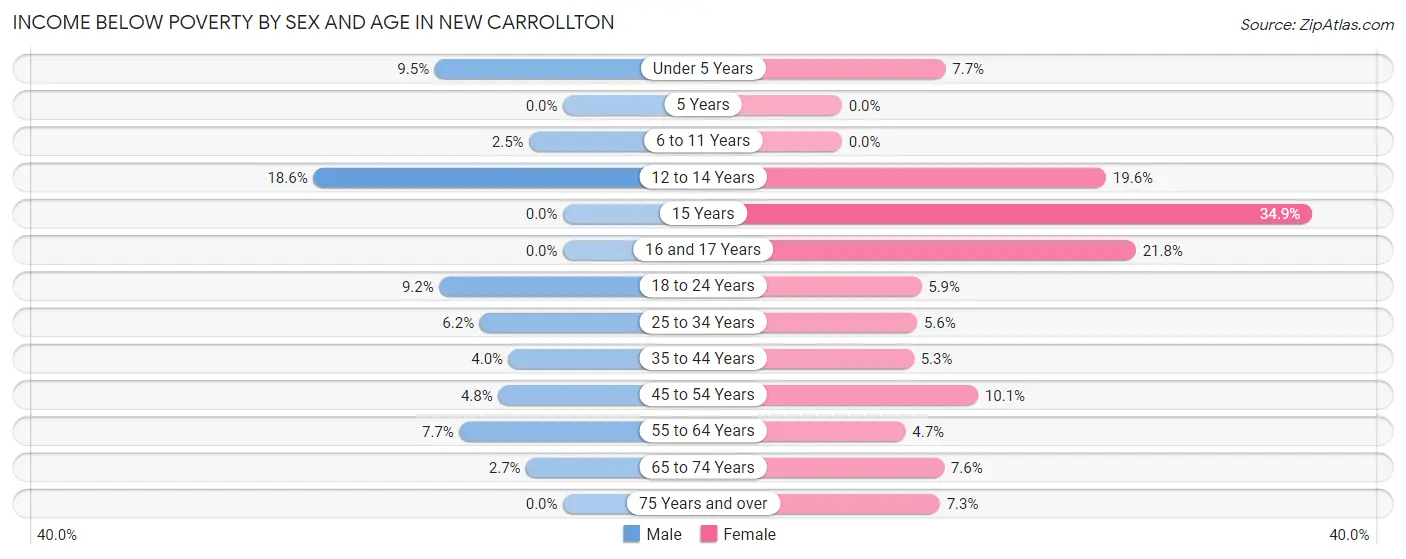
| Age Bracket | Male | Female |
| Under 5 Years | 49 (9.5%) | 37 (7.7%) |
| 5 Years | 0 (0.0%) | 0 (0.0%) |
| 6 to 11 Years | 14 (2.5%) | 0 (0.0%) |
| 12 to 14 Years | 51 (18.5%) | 20 (19.6%) |
| 15 Years | 0 (0.0%) | 44 (34.9%) |
| 16 and 17 Years | 0 (0.0%) | 36 (21.8%) |
| 18 to 24 Years | 41 (9.2%) | 26 (5.9%) |
| 25 to 34 Years | 74 (6.2%) | 86 (5.6%) |
| 35 to 44 Years | 44 (4.0%) | 44 (5.3%) |
| 45 to 54 Years | 35 (4.8%) | 74 (10.1%) |
| 55 to 64 Years | 52 (7.7%) | 46 (4.7%) |
| 65 to 74 Years | 15 (2.7%) | 45 (7.6%) |
| 75 Years and over | 0 (0.0%) | 21 (7.3%) |
| Total | 375 (5.7%) | 479 (6.9%) |
Income Above Poverty by Sex and Age in New Carrollton
According to the poverty statistics in New Carrollton, males aged 5 years and females aged 5 years are the age groups that are most secure financially, with 100.0% of males and 100.0% of females in these age groups living above the poverty line.
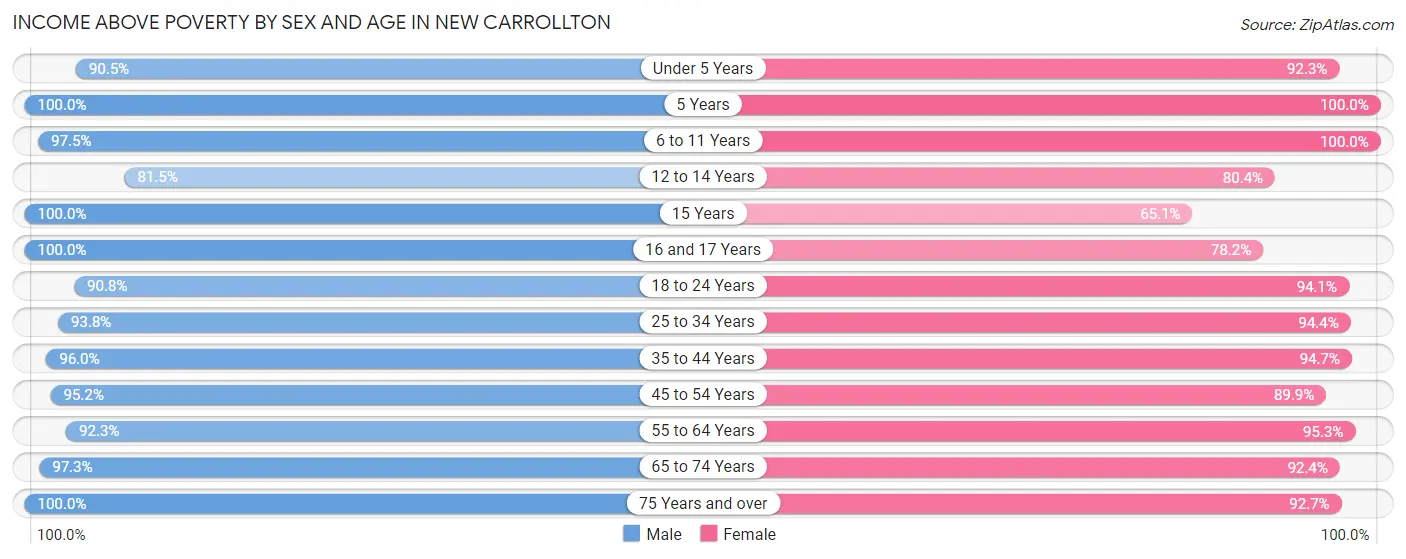
| Age Bracket | Male | Female |
| Under 5 Years | 465 (90.5%) | 444 (92.3%) |
| 5 Years | 130 (100.0%) | 99 (100.0%) |
| 6 to 11 Years | 542 (97.5%) | 543 (100.0%) |
| 12 to 14 Years | 224 (81.5%) | 82 (80.4%) |
| 15 Years | 71 (100.0%) | 82 (65.1%) |
| 16 and 17 Years | 47 (100.0%) | 129 (78.2%) |
| 18 to 24 Years | 405 (90.8%) | 415 (94.1%) |
| 25 to 34 Years | 1,122 (93.8%) | 1,455 (94.4%) |
| 35 to 44 Years | 1,045 (96.0%) | 780 (94.7%) |
| 45 to 54 Years | 693 (95.2%) | 658 (89.9%) |
| 55 to 64 Years | 623 (92.3%) | 928 (95.3%) |
| 65 to 74 Years | 533 (97.3%) | 549 (92.4%) |
| 75 Years and over | 270 (100.0%) | 268 (92.7%) |
| Total | 6,170 (94.3%) | 6,432 (93.1%) |
Income Below Poverty Among Married-Couple Families in New Carrollton
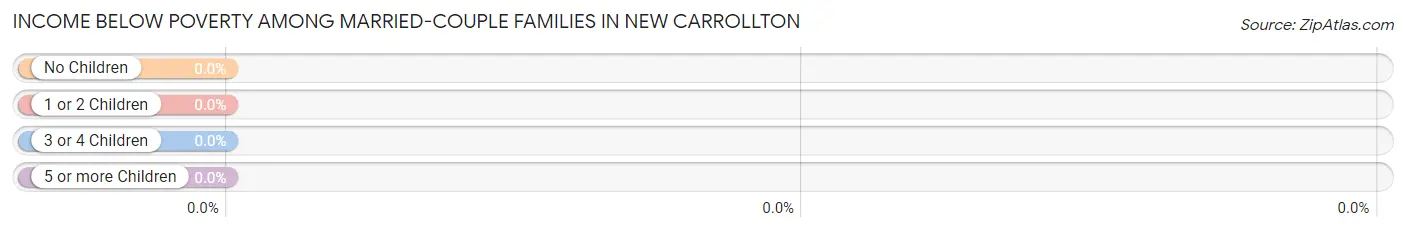
| Children | Above Poverty | Below Poverty |
| No Children | 977 (100.0%) | 0 (0.0%) |
| 1 or 2 Children | 534 (100.0%) | 0 (0.0%) |
| 3 or 4 Children | 294 (100.0%) | 0 (0.0%) |
| 5 or more Children | 0 (0.0%) | 0 (0.0%) |
| Total | 1,805 (100.0%) | 0 (0.0%) |
Income Below Poverty Among Single-Parent Households in New Carrollton
According to the poverty data in New Carrollton, 17.9% or 49 single-father households and 8.4% or 66 single-mother households are living below the poverty line. Among single-father households, those with 1 or 2 children have the highest poverty rate, with 34 households (31.5%) experiencing poverty. Likewise, among single-mother households, those with 3 or 4 children have the highest poverty rate, with 21 households (30.0%) falling below the poverty line.
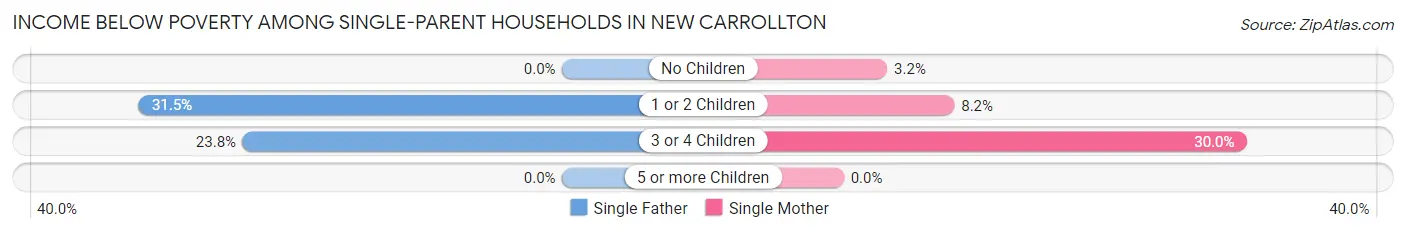
| Children | Single Father | Single Mother |
| No Children | 0 (0.0%) | 9 (3.2%) |
| 1 or 2 Children | 34 (31.5%) | 36 (8.2%) |
| 3 or 4 Children | 15 (23.8%) | 21 (30.0%) |
| 5 or more Children | 0 (0.0%) | 0 (0.0%) |
| Total | 49 (17.9%) | 66 (8.4%) |
Income Below Poverty Among Married-Couple vs Single-Parent Households in New Carrollton
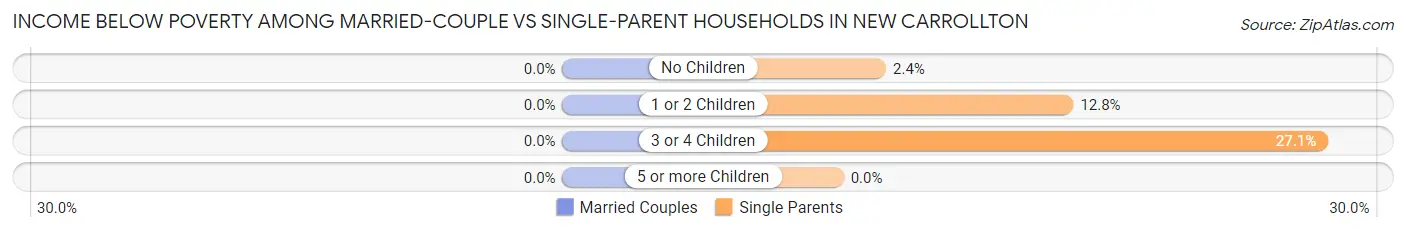
| Children | Married-Couple Families | Single-Parent Households |
| No Children | 0 (0.0%) | 9 (2.4%) |
| 1 or 2 Children | 0 (0.0%) | 70 (12.8%) |
| 3 or 4 Children | 0 (0.0%) | 36 (27.1%) |
| 5 or more Children | 0 (0.0%) | 0 (0.0%) |
| Total | 0 (0.0%) | 115 (10.9%) |
Race in New Carrollton
The most populous races in New Carrollton are Black / African American (8,851 | 65.2%), Hispanic or Latino (3,175 | 23.4%), and Some other Race (2,460 | 18.1%).
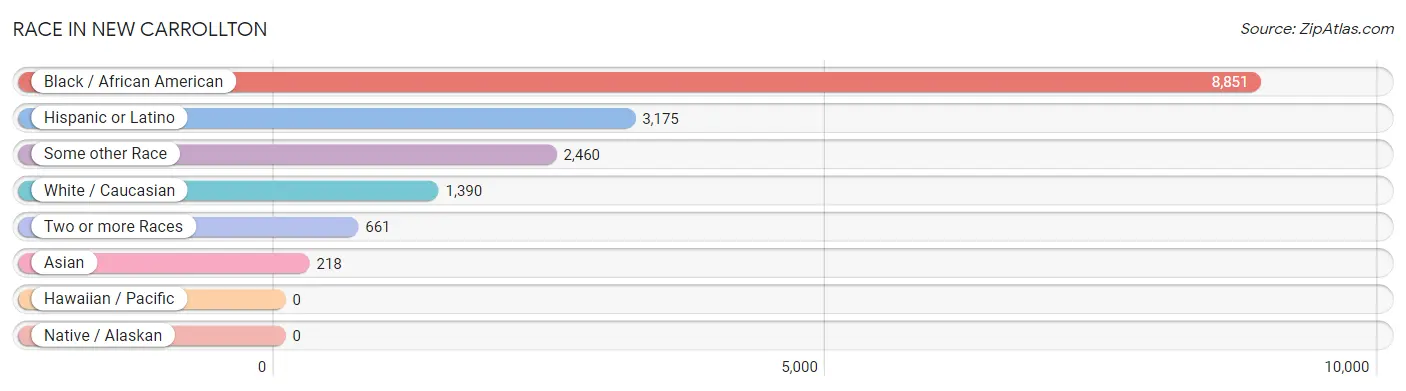
| Race | # Population | % Population |
| Asian | 218 | 1.6% |
| Black / African American | 8,851 | 65.2% |
| Hawaiian / Pacific | 0 | 0.0% |
| Hispanic or Latino | 3,175 | 23.4% |
| Native / Alaskan | 0 | 0.0% |
| White / Caucasian | 1,390 | 10.2% |
| Two or more Races | 661 | 4.9% |
| Some other Race | 2,460 | 18.1% |
| Total | 13,580 | 100.0% |
Ancestry in New Carrollton
The most populous ancestries reported in New Carrollton are Subsaharan African (3,098 | 22.8%), Central American (2,202 | 16.2%), Salvadoran (2,119 | 15.6%), African (1,168 | 8.6%), and Nigerian (741 | 5.5%), together accounting for 68.7% of all New Carrollton residents.
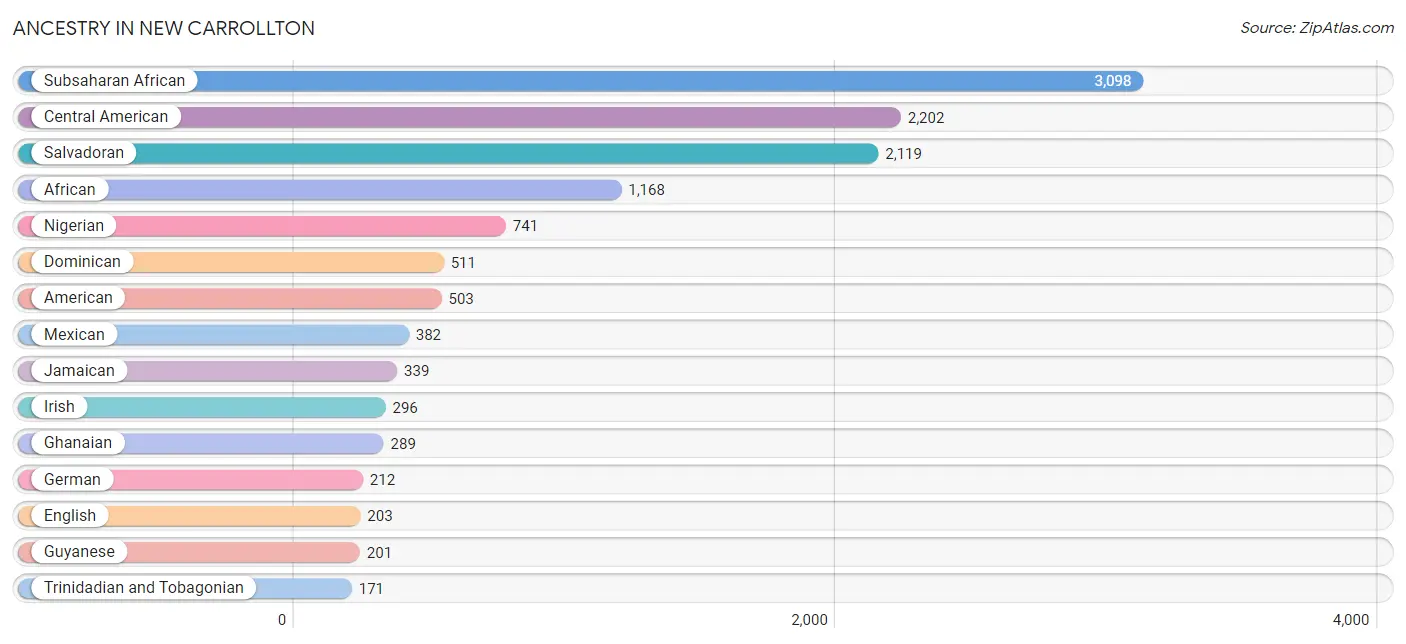
| Ancestry | # Population | % Population |
| African | 1,168 | 8.6% |
| American | 503 | 3.7% |
| Arab | 17 | 0.1% |
| Barbadian | 31 | 0.2% |
| Belizean | 30 | 0.2% |
| Bhutanese | 4 | 0.0% |
| British | 100 | 0.7% |
| Burmese | 6 | 0.0% |
| Cape Verdean | 11 | 0.1% |
| Central American | 2,202 | 16.2% |
| Cherokee | 47 | 0.4% |
| Czech | 19 | 0.1% |
| Danish | 8 | 0.1% |
| Dominican | 511 | 3.8% |
| Eastern European | 11 | 0.1% |
| English | 203 | 1.5% |
| Ethiopian | 152 | 1.1% |
| European | 5 | 0.0% |
| French | 5 | 0.0% |
| German | 212 | 1.6% |
| Ghanaian | 289 | 2.1% |
| Guyanese | 201 | 1.5% |
| Honduran | 32 | 0.2% |
| Hungarian | 10 | 0.1% |
| Indian (Asian) | 7 | 0.1% |
| Irish | 296 | 2.2% |
| Italian | 164 | 1.2% |
| Jamaican | 339 | 2.5% |
| Japanese | 30 | 0.2% |
| Liberian | 31 | 0.2% |
| Maltese | 12 | 0.1% |
| Mexican | 382 | 2.8% |
| Nicaraguan | 42 | 0.3% |
| Nigerian | 741 | 5.5% |
| Peruvian | 26 | 0.2% |
| Polish | 67 | 0.5% |
| Puerto Rican | 11 | 0.1% |
| Russian | 20 | 0.2% |
| Salvadoran | 2,119 | 15.6% |
| Scandinavian | 19 | 0.1% |
| Scotch-Irish | 38 | 0.3% |
| Scottish | 32 | 0.2% |
| Sierra Leonean | 49 | 0.4% |
| South African | 57 | 0.4% |
| South American | 26 | 0.2% |
| Sri Lankan | 79 | 0.6% |
| Subsaharan African | 3,098 | 22.8% |
| Swedish | 12 | 0.1% |
| Swiss | 44 | 0.3% |
| Thai | 112 | 0.8% |
| Trinidadian and Tobagonian | 171 | 1.3% |
| Ukrainian | 12 | 0.1% |
| Welsh | 1 | 0.0% |
| West Indian | 37 | 0.3% | View All 54 Rows |
Immigrants in New Carrollton
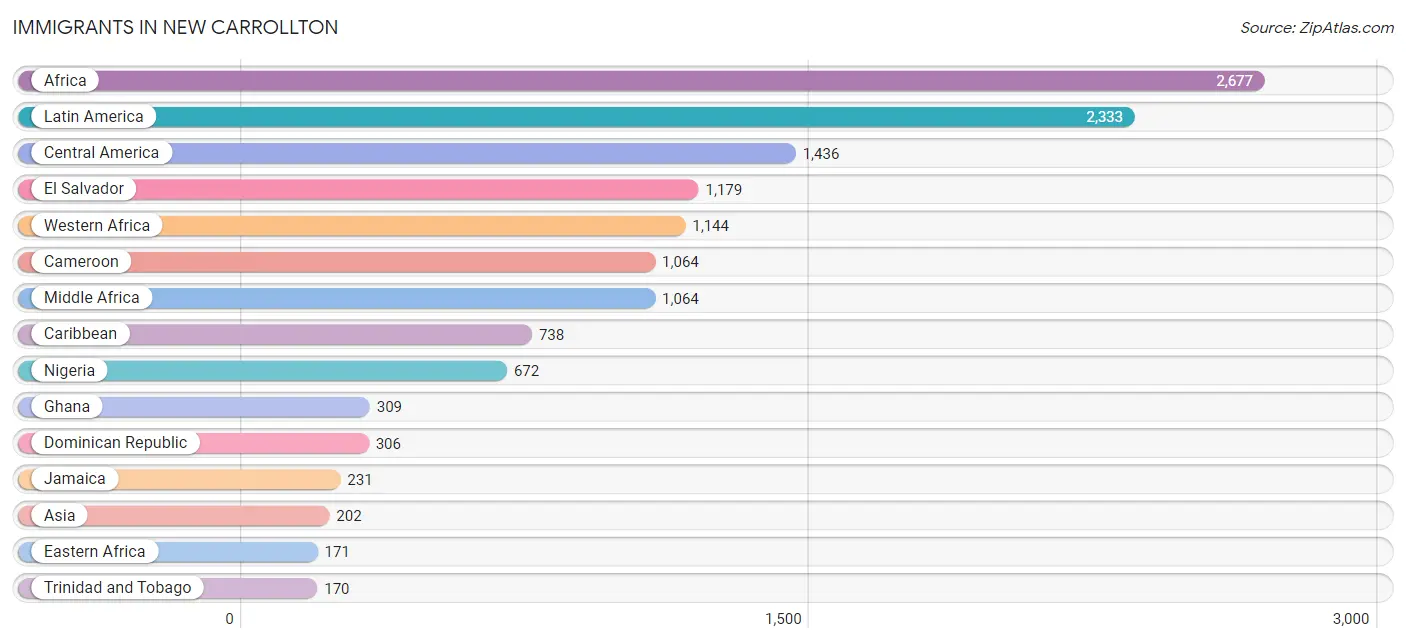
The most numerous immigrant groups reported in New Carrollton came from Africa (2,677 | 19.7%), Latin America (2,333 | 17.2%), Central America (1,436 | 10.6%), El Salvador (1,179 | 8.7%), and Western Africa (1,144 | 8.4%), together accounting for 64.6% of all New Carrollton residents.
| Immigration Origin | # Population | % Population |
| Africa | 2,677 | 19.7% |
| Asia | 202 | 1.5% |
| Barbados | 31 | 0.2% |
| Belize | 30 | 0.2% |
| Cambodia | 14 | 0.1% |
| Cameroon | 1,064 | 7.8% |
| Caribbean | 738 | 5.4% |
| Central America | 1,436 | 10.6% |
| Dominican Republic | 306 | 2.2% |
| Eastern Africa | 171 | 1.3% |
| Eastern Asia | 6 | 0.0% |
| El Salvador | 1,179 | 8.7% |
| England | 11 | 0.1% |
| Eritrea | 22 | 0.2% |
| Ethiopia | 149 | 1.1% |
| Europe | 84 | 0.6% |
| Germany | 26 | 0.2% |
| Ghana | 309 | 2.3% |
| Guyana | 133 | 1.0% |
| Honduras | 32 | 0.2% |
| India | 115 | 0.9% |
| Italy | 26 | 0.2% |
| Jamaica | 231 | 1.7% |
| Korea | 6 | 0.0% |
| Latin America | 2,333 | 17.2% |
| Liberia | 36 | 0.3% |
| Mexico | 144 | 1.1% |
| Middle Africa | 1,064 | 7.8% |
| Nicaragua | 42 | 0.3% |
| Nigeria | 672 | 5.0% |
| Northern Africa | 17 | 0.1% |
| Northern Europe | 32 | 0.2% |
| Peru | 26 | 0.2% |
| Scotland | 12 | 0.1% |
| Sierra Leone | 127 | 0.9% |
| South Africa | 57 | 0.4% |
| South America | 159 | 1.2% |
| South Central Asia | 115 | 0.9% |
| South Eastern Asia | 68 | 0.5% |
| Southern Europe | 26 | 0.2% |
| Thailand | 5 | 0.0% |
| Trinidad and Tobago | 170 | 1.3% |
| Vietnam | 49 | 0.4% |
| Western Africa | 1,144 | 8.4% |
| Western Asia | 13 | 0.1% |
| Western Europe | 26 | 0.2% | View All 46 Rows |
Sex and Age in New Carrollton
Sex and Age in New Carrollton
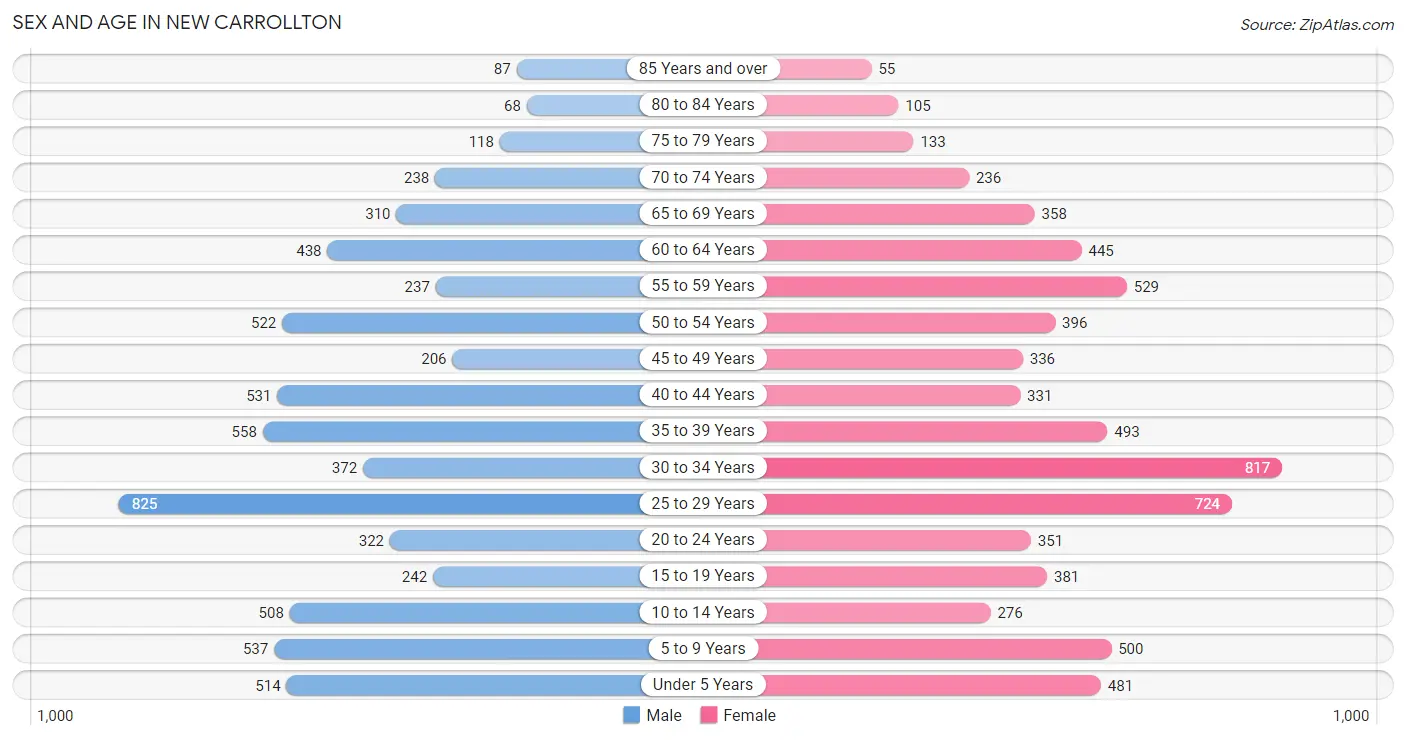
The most populous age groups in New Carrollton are 25 to 29 Years (825 | 12.4%) for men and 30 to 34 Years (817 | 11.8%) for women.
| Age Bracket | Male | Female |
| Under 5 Years | 514 (7.7%) | 481 (6.9%) |
| 5 to 9 Years | 537 (8.1%) | 500 (7.2%) |
| 10 to 14 Years | 508 (7.7%) | 276 (4.0%) |
| 15 to 19 Years | 242 (3.6%) | 381 (5.5%) |
| 20 to 24 Years | 322 (4.9%) | 351 (5.1%) |
| 25 to 29 Years | 825 (12.4%) | 724 (10.4%) |
| 30 to 34 Years | 372 (5.6%) | 817 (11.8%) |
| 35 to 39 Years | 558 (8.4%) | 493 (7.1%) |
| 40 to 44 Years | 531 (8.0%) | 331 (4.8%) |
| 45 to 49 Years | 206 (3.1%) | 336 (4.8%) |
| 50 to 54 Years | 522 (7.9%) | 396 (5.7%) |
| 55 to 59 Years | 237 (3.6%) | 529 (7.6%) |
| 60 to 64 Years | 438 (6.6%) | 445 (6.4%) |
| 65 to 69 Years | 310 (4.7%) | 358 (5.1%) |
| 70 to 74 Years | 238 (3.6%) | 236 (3.4%) |
| 75 to 79 Years | 118 (1.8%) | 133 (1.9%) |
| 80 to 84 Years | 68 (1.0%) | 105 (1.5%) |
| 85 Years and over | 87 (1.3%) | 55 (0.8%) |
| Total | 6,633 (100.0%) | 6,947 (100.0%) |
Families and Households in New Carrollton
Median Family Size in New Carrollton
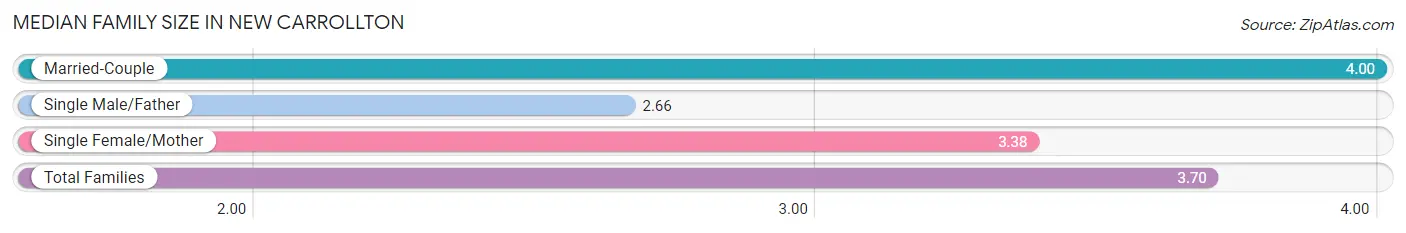
The median family size in New Carrollton is 3.70 persons per family, with married-couple families (1,805 | 63.0%) accounting for the largest median family size of 4 persons per family. On the other hand, single male/father families (273 | 9.5%) represent the smallest median family size with 2.66 persons per family.
| Family Type | # Families | Family Size |
| Married-Couple | 1,805 (63.0%) | 4.00 |
| Single Male/Father | 273 (9.5%) | 2.66 |
| Single Female/Mother | 785 (27.4%) | 3.38 |
| Total Families | 2,863 (100.0%) | 3.70 |
Median Household Size in New Carrollton
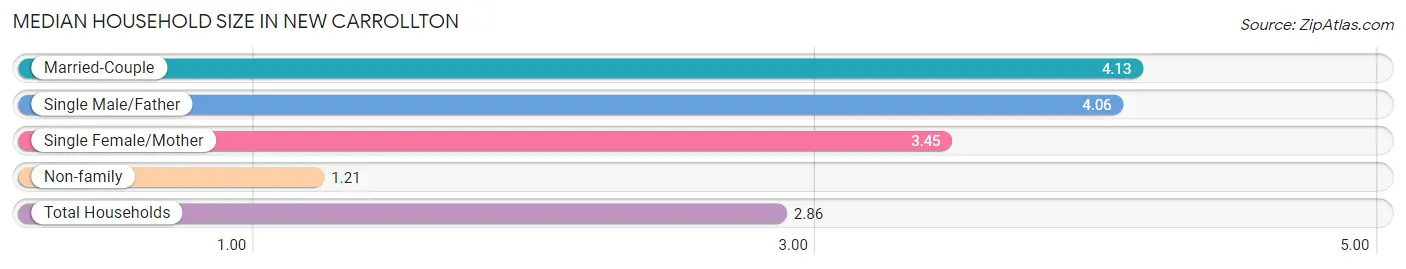
The median household size in New Carrollton is 2.86 persons per household, with married-couple households (1,805 | 38.0%) accounting for the largest median household size of 4.13 persons per household. non-family households (1,885 | 39.7%) represent the smallest median household size with 1.21 persons per household.
| Household Type | # Households | Household Size |
| Married-Couple | 1,805 (38.0%) | 4.13 |
| Single Male/Father | 273 (5.8%) | 4.06 |
| Single Female/Mother | 785 (16.5%) | 3.45 |
| Non-family | 1,885 (39.7%) | 1.21 |
| Total Households | 4,748 (100.0%) | 2.86 |
Household Size by Marriage Status in New Carrollton
Out of a total of 4,748 households in New Carrollton, 2,863 (60.3%) are family households, while 1,885 (39.7%) are nonfamily households. The most numerous type of family households are 2-person households, comprising 853, and the most common type of nonfamily households are 1-person households, comprising 1,515.
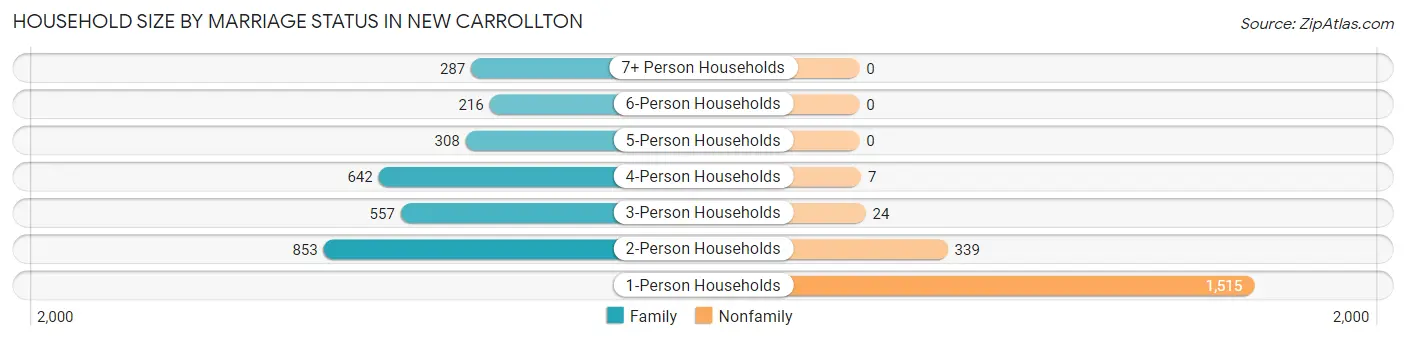
| Household Size | Family Households | Nonfamily Households |
| 1-Person Households | - | 1,515 (31.9%) |
| 2-Person Households | 853 (18.0%) | 339 (7.1%) |
| 3-Person Households | 557 (11.7%) | 24 (0.5%) |
| 4-Person Households | 642 (13.5%) | 7 (0.2%) |
| 5-Person Households | 308 (6.5%) | 0 (0.0%) |
| 6-Person Households | 216 (4.5%) | 0 (0.0%) |
| 7+ Person Households | 287 (6.0%) | 0 (0.0%) |
| Total | 2,863 (60.3%) | 1,885 (39.7%) |
Female Fertility in New Carrollton
Fertility by Age in New Carrollton
Average fertility rate in New Carrollton is 80.0 births per 1,000 women. Women in the age bracket of 35 to 50 years have the highest fertility rate with 109.0 births per 1,000 women. Women in the age bracket of 20 to 34 years acount for 52.9% of all women with births.
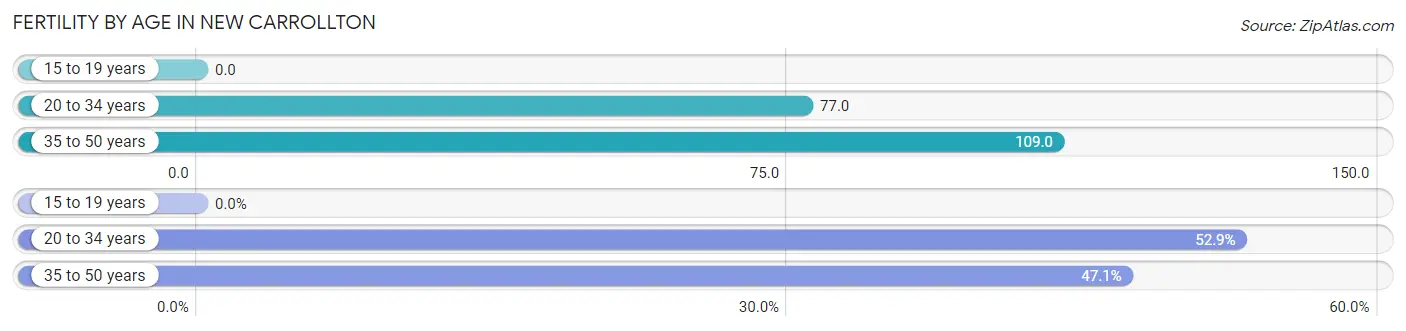
| Age Bracket | Women with Births | Births / 1,000 Women |
| 15 to 19 years | 0 (0.0%) | 0.0 |
| 20 to 34 years | 146 (52.9%) | 77.0 |
| 35 to 50 years | 130 (47.1%) | 109.0 |
| Total | 276 (100.0%) | 80.0 |
Fertility by Age by Marriage Status in New Carrollton
60.5% of women with births (276) in New Carrollton are married. The highest percentage of unmarried women with births falls into 20 to 34 years age bracket with 74.7% of them unmarried at the time of birth, while the lowest percentage of unmarried women with births belong to 35 to 50 years age bracket with 0.0% of them unmarried.

| Age Bracket | Married | Unmarried |
| 15 to 19 years | 0 (0.0%) | 0 (0.0%) |
| 20 to 34 years | 37 (25.3%) | 109 (74.7%) |
| 35 to 50 years | 130 (100.0%) | 0 (0.0%) |
| Total | 167 (60.5%) | 109 (39.5%) |
Fertility by Education in New Carrollton
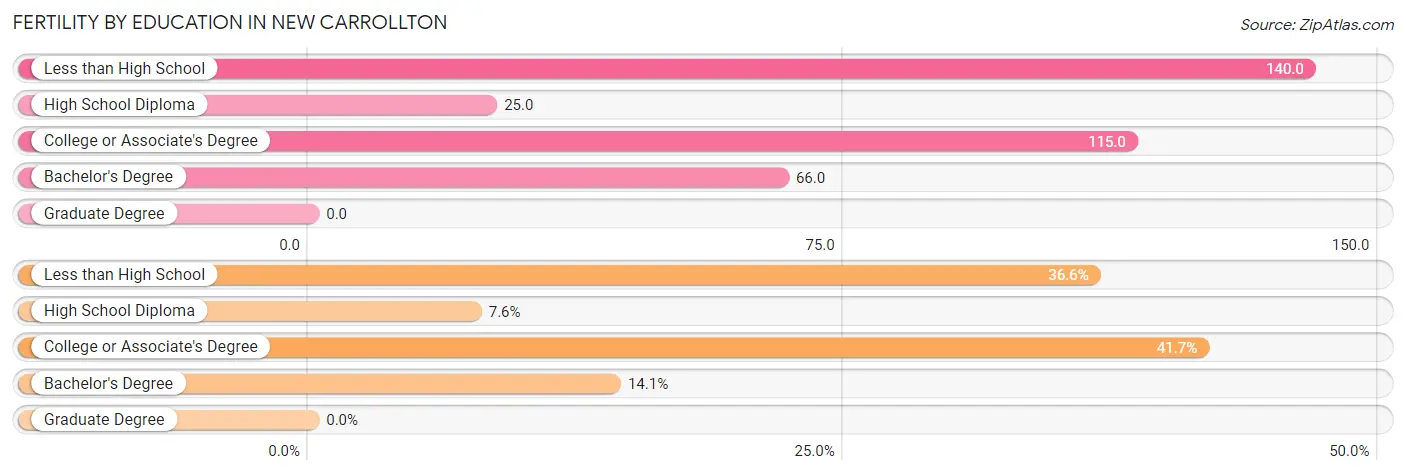
| Educational Attainment | Women with Births | Births / 1,000 Women |
| Less than High School | 101 (36.6%) | 140.0 |
| High School Diploma | 21 (7.6%) | 25.0 |
| College or Associate's Degree | 115 (41.7%) | 115.0 |
| Bachelor's Degree | 39 (14.1%) | 66.0 |
| Graduate Degree | 0 (0.0%) | 0.0 |
| Total | 276 (100.0%) | 80.0 |
Fertility by Education by Marriage Status in New Carrollton
39.5% of women with births in New Carrollton are unmarried. Women with the educational attainment of bachelor's degree are most likely to be married with 100.0% of them married at childbirth, while women with the educational attainment of high school diploma are least likely to be married with 100.0% of them unmarried at childbirth.
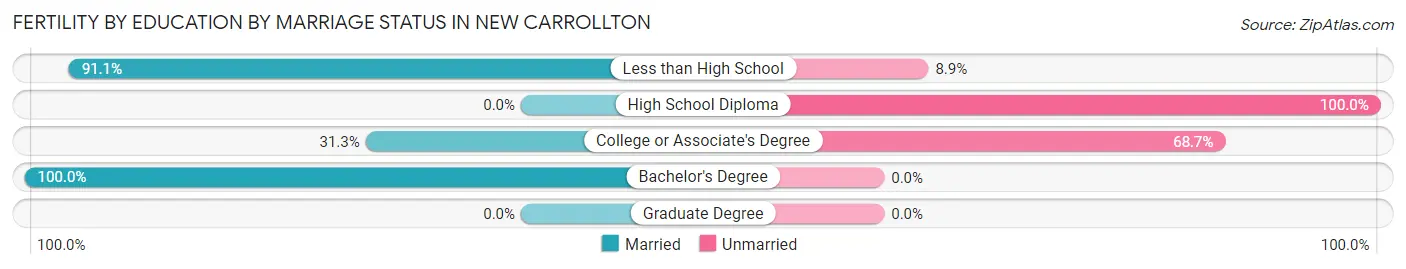
| Educational Attainment | Married | Unmarried |
| Less than High School | 92 (91.1%) | 9 (8.9%) |
| High School Diploma | 0 (0.0%) | 21 (100.0%) |
| College or Associate's Degree | 36 (31.3%) | 79 (68.7%) |
| Bachelor's Degree | 39 (100.0%) | 0 (0.0%) |
| Graduate Degree | 0 (0.0%) | 0 (0.0%) |
| Total | 167 (60.5%) | 109 (39.5%) |
Employment Characteristics in New Carrollton
Employment by Class of Employer in New Carrollton
Among the 6,497 employed individuals in New Carrollton, private company employees (4,773 | 73.5%), federal government employees (531 | 8.2%), and not-for-profit organizations (369 | 5.7%) make up the most common classes of employment.
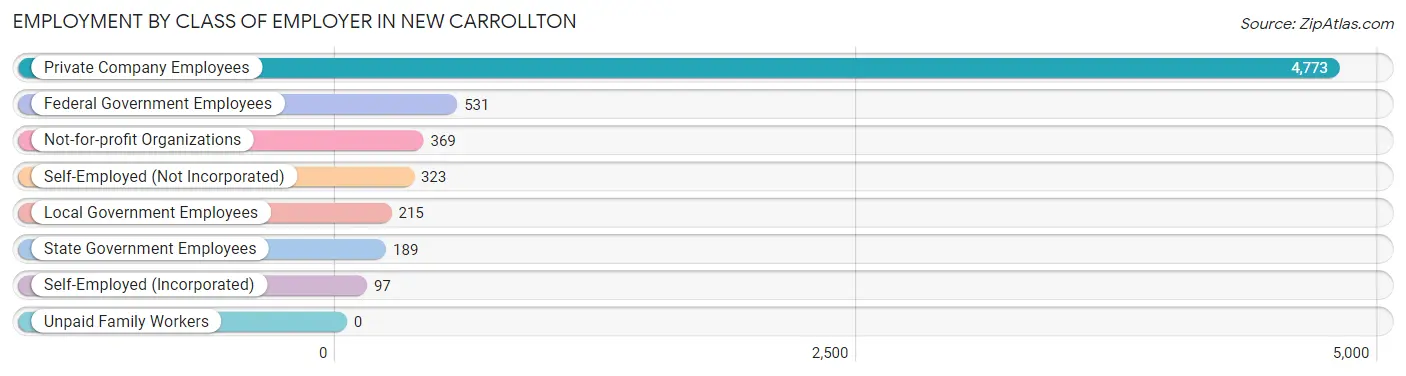
| Employer Class | # Employees | % Employees |
| Private Company Employees | 4,773 | 73.5% |
| Self-Employed (Incorporated) | 97 | 1.5% |
| Self-Employed (Not Incorporated) | 323 | 5.0% |
| Not-for-profit Organizations | 369 | 5.7% |
| Local Government Employees | 215 | 3.3% |
| State Government Employees | 189 | 2.9% |
| Federal Government Employees | 531 | 8.2% |
| Unpaid Family Workers | 0 | 0.0% |
| Total | 6,497 | 100.0% |
Employment Status by Age in New Carrollton
According to the labor force statistics for New Carrollton, out of the total population over 16 years of age (10,567), 73.0% or 7,714 individuals are in the labor force, with 10.9% or 841 of them unemployed. The age group with the highest labor force participation rate is 45 to 54 years, with 89.6% or 1,308 individuals in the labor force. Within the labor force, the 16 to 19 years age range has the highest percentage of unemployed individuals, with 42.3% or 66 of them being unemployed.
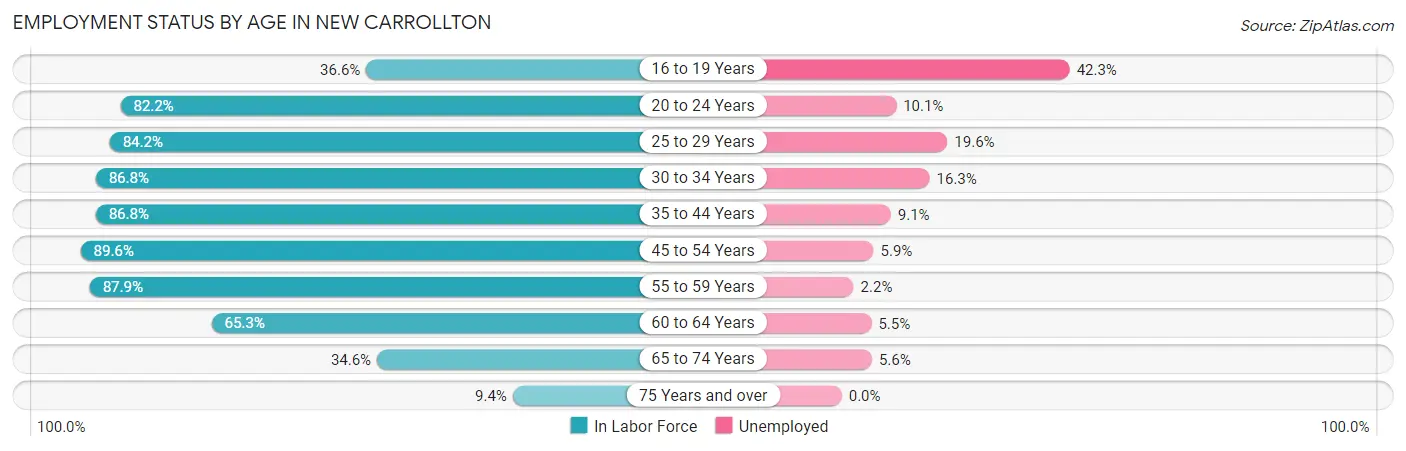
| Age Bracket | In Labor Force | Unemployed |
| 16 to 19 Years | 156 (36.6%) | 66 (42.3%) |
| 20 to 24 Years | 553 (82.2%) | 56 (10.1%) |
| 25 to 29 Years | 1,304 (84.2%) | 256 (19.6%) |
| 30 to 34 Years | 1,032 (86.8%) | 168 (16.3%) |
| 35 to 44 Years | 1,660 (86.8%) | 151 (9.1%) |
| 45 to 54 Years | 1,308 (89.6%) | 77 (5.9%) |
| 55 to 59 Years | 673 (87.9%) | 15 (2.2%) |
| 60 to 64 Years | 577 (65.3%) | 32 (5.5%) |
| 65 to 74 Years | 395 (34.6%) | 22 (5.6%) |
| 75 Years and over | 53 (9.4%) | 0 (0.0%) |
| Total | 7,714 (73.0%) | 841 (10.9%) |
Employment Status by Educational Attainment in New Carrollton
According to labor force statistics for New Carrollton, 84.5% of individuals (6,557) out of the total population between 25 and 64 years of age (7,760) are in the labor force, with 10.6% or 695 of them being unemployed. The group with the highest labor force participation rate are those with the educational attainment of bachelor's degree or higher, with 91.0% or 1,965 individuals in the labor force. Within the labor force, individuals with bachelor's degree or higher education have the highest percentage of unemployment, with 14.3% or 281 of them being unemployed.
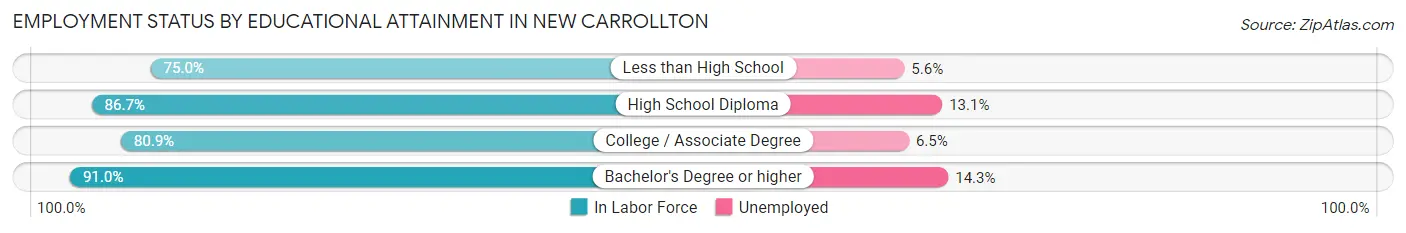
| Educational Attainment | In Labor Force | Unemployed |
| Less than High School | 873 (75.0%) | 65 (5.6%) |
| High School Diploma | 1,932 (86.7%) | 292 (13.1%) |
| College / Associate Degree | 1,787 (80.9%) | 144 (6.5%) |
| Bachelor's Degree or higher | 1,965 (91.0%) | 309 (14.3%) |
| Total | 6,557 (84.5%) | 823 (10.6%) |
Employment Occupations by Sex in New Carrollton
Management, Business, Science and Arts Occupations
The most common Management, Business, Science and Arts occupations in New Carrollton are Community & Social Service (459 | 6.7%), Management (381 | 5.6%), Health Diagnosing & Treating (311 | 4.5%), Computers, Engineering & Science (281 | 4.1%), and Arts, Media & Entertainment (229 | 3.3%).
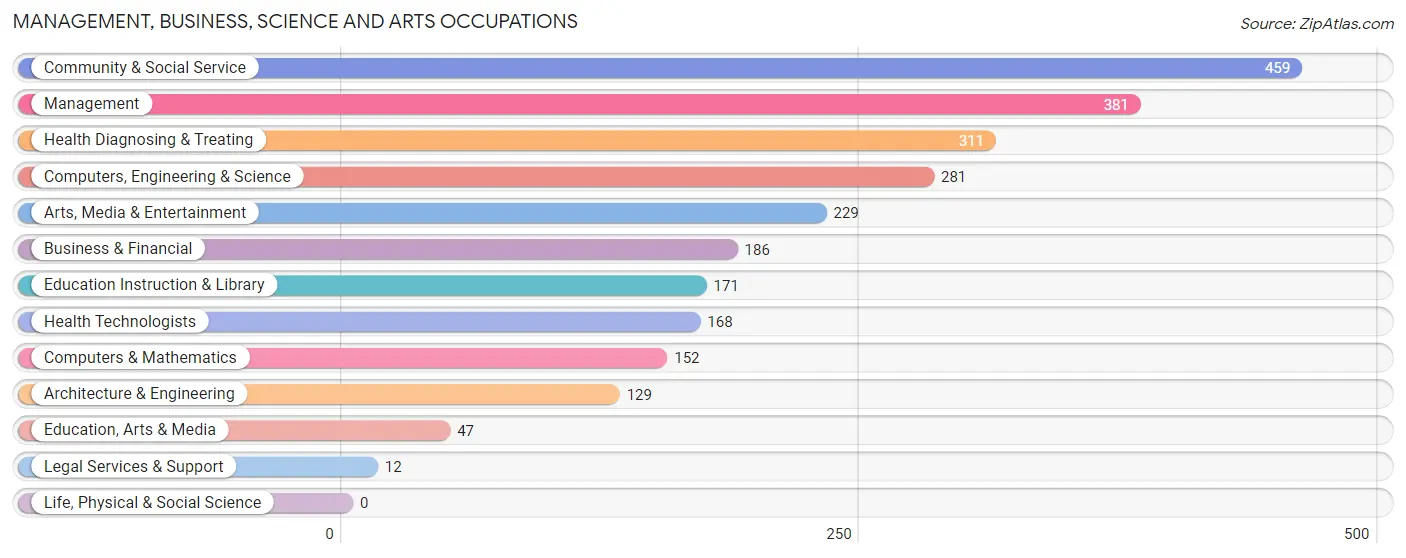
Management, Business, Science and Arts Occupations by Sex
Within the Management, Business, Science and Arts occupations in New Carrollton, the most male-oriented occupations are Architecture & Engineering (93.8%), Arts, Media & Entertainment (72.9%), and Computers, Engineering & Science (72.2%), while the most female-oriented occupations are Education, Arts & Media (97.9%), Education Instruction & Library (87.1%), and Business & Financial (80.6%).
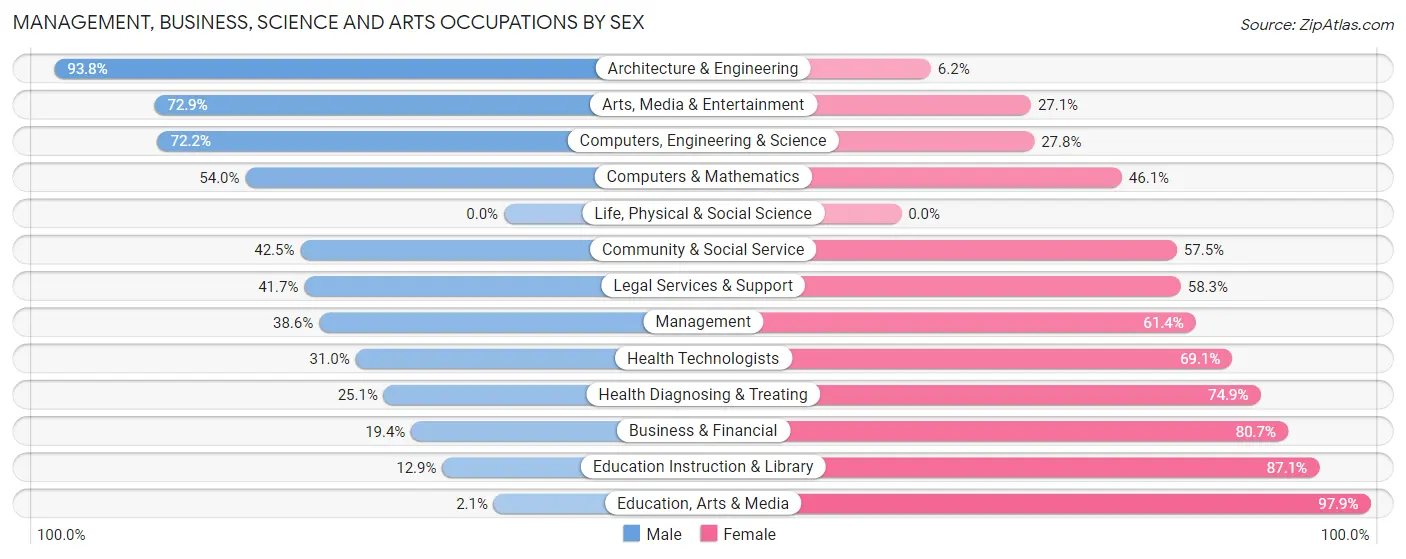
| Occupation | Male | Female |
| Management | 147 (38.6%) | 234 (61.4%) |
| Business & Financial | 36 (19.4%) | 150 (80.6%) |
| Computers, Engineering & Science | 203 (72.2%) | 78 (27.8%) |
| Computers & Mathematics | 82 (53.9%) | 70 (46.1%) |
| Architecture & Engineering | 121 (93.8%) | 8 (6.2%) |
| Life, Physical & Social Science | 0 (0.0%) | 0 (0.0%) |
| Community & Social Service | 195 (42.5%) | 264 (57.5%) |
| Education, Arts & Media | 1 (2.1%) | 46 (97.9%) |
| Legal Services & Support | 5 (41.7%) | 7 (58.3%) |
| Education Instruction & Library | 22 (12.9%) | 149 (87.1%) |
| Arts, Media & Entertainment | 167 (72.9%) | 62 (27.1%) |
| Health Diagnosing & Treating | 78 (25.1%) | 233 (74.9%) |
| Health Technologists | 52 (30.9%) | 116 (69.1%) |
| Total (Category) | 659 (40.7%) | 959 (59.3%) |
| Total (Overall) | 3,599 (52.5%) | 3,262 (47.5%) |
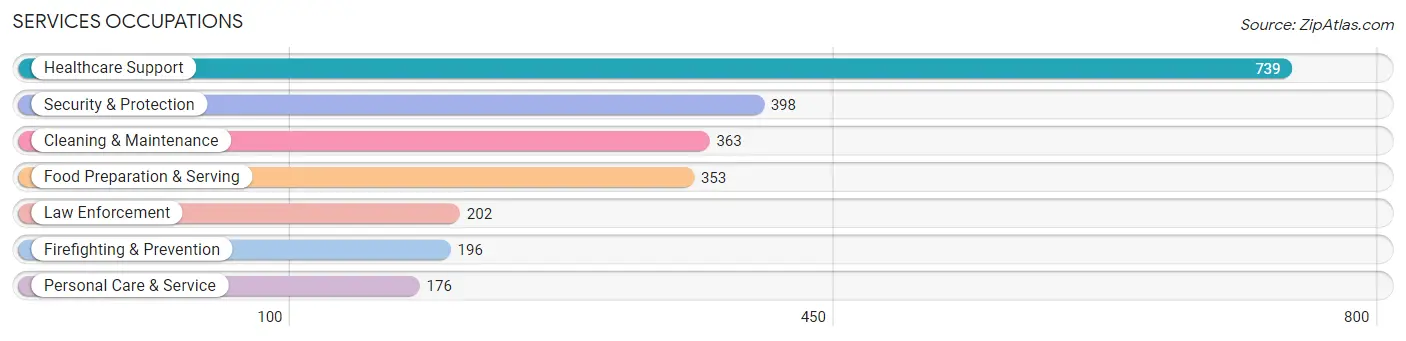
Services Occupations
The most common Services occupations in New Carrollton are Healthcare Support (739 | 10.8%), Security & Protection (398 | 5.8%), Cleaning & Maintenance (363 | 5.3%), Food Preparation & Serving (353 | 5.1%), and Law Enforcement (202 | 2.9%).
Services Occupations by Sex
Within the Services occupations in New Carrollton, the most male-oriented occupations are Law Enforcement (76.2%), Security & Protection (60.3%), and Food Preparation & Serving (54.7%), while the most female-oriented occupations are Personal Care & Service (77.3%), Healthcare Support (70.2%), and Firefighting & Prevention (56.1%).
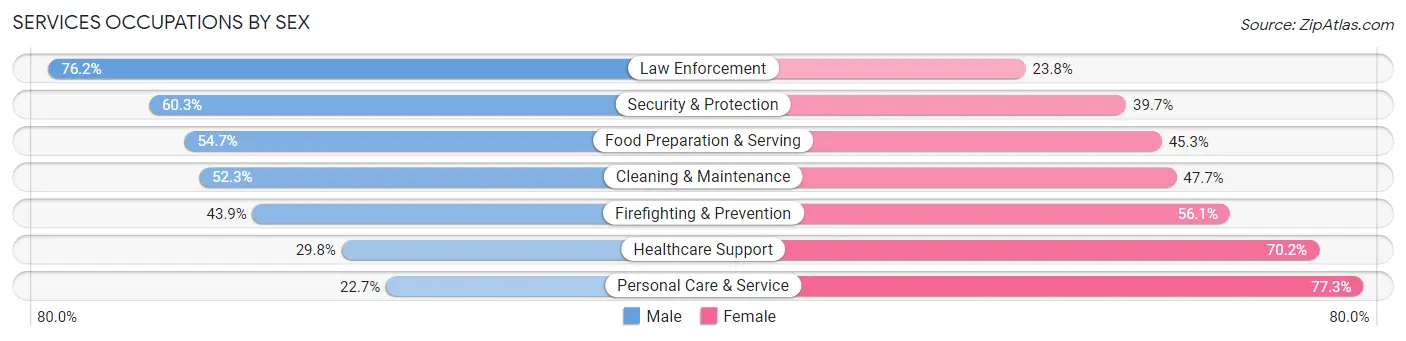
| Occupation | Male | Female |
| Healthcare Support | 220 (29.8%) | 519 (70.2%) |
| Security & Protection | 240 (60.3%) | 158 (39.7%) |
| Firefighting & Prevention | 86 (43.9%) | 110 (56.1%) |
| Law Enforcement | 154 (76.2%) | 48 (23.8%) |
| Food Preparation & Serving | 193 (54.7%) | 160 (45.3%) |
| Cleaning & Maintenance | 190 (52.3%) | 173 (47.7%) |
| Personal Care & Service | 40 (22.7%) | 136 (77.3%) |
| Total (Category) | 883 (43.5%) | 1,146 (56.5%) |
| Total (Overall) | 3,599 (52.5%) | 3,262 (47.5%) |
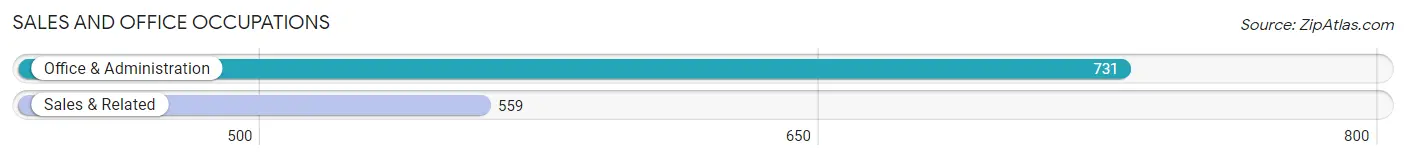
Sales and Office Occupations
The most common Sales and Office occupations in New Carrollton are Office & Administration (731 | 10.6%), and Sales & Related (559 | 8.2%).
Sales and Office Occupations by Sex
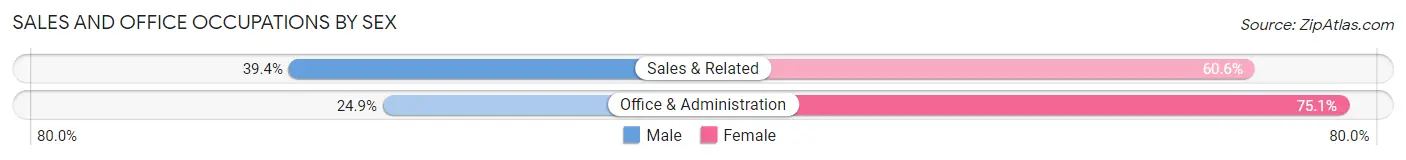
| Occupation | Male | Female |
| Sales & Related | 220 (39.4%) | 339 (60.6%) |
| Office & Administration | 182 (24.9%) | 549 (75.1%) |
| Total (Category) | 402 (31.2%) | 888 (68.8%) |
| Total (Overall) | 3,599 (52.5%) | 3,262 (47.5%) |
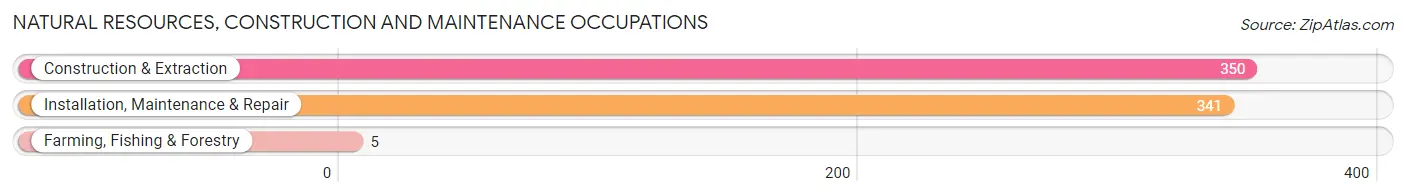
Natural Resources, Construction and Maintenance Occupations
The most common Natural Resources, Construction and Maintenance occupations in New Carrollton are Construction & Extraction (350 | 5.1%), Installation, Maintenance & Repair (341 | 5.0%), and Farming, Fishing & Forestry (5 | 0.1%).
Natural Resources, Construction and Maintenance Occupations by Sex
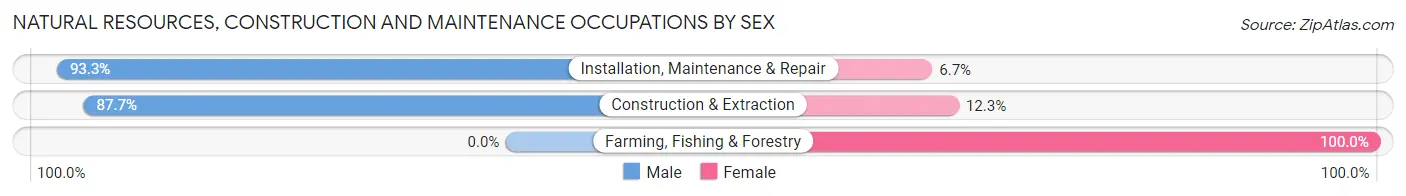
| Occupation | Male | Female |
| Farming, Fishing & Forestry | 0 (0.0%) | 5 (100.0%) |
| Construction & Extraction | 307 (87.7%) | 43 (12.3%) |
| Installation, Maintenance & Repair | 318 (93.3%) | 23 (6.7%) |
| Total (Category) | 625 (89.8%) | 71 (10.2%) |
| Total (Overall) | 3,599 (52.5%) | 3,262 (47.5%) |
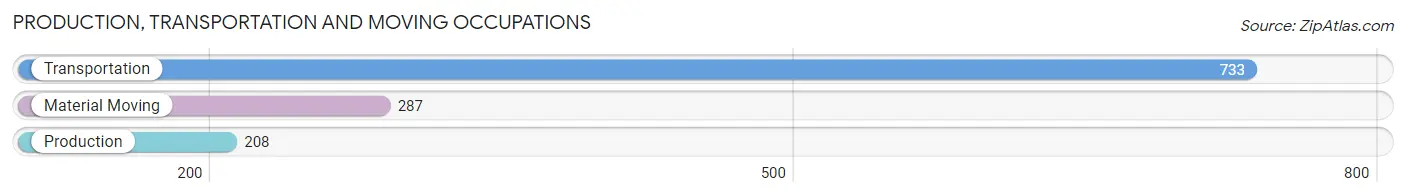
Production, Transportation and Moving Occupations
The most common Production, Transportation and Moving occupations in New Carrollton are Transportation (733 | 10.7%), Material Moving (287 | 4.2%), and Production (208 | 3.0%).
Production, Transportation and Moving Occupations by Sex
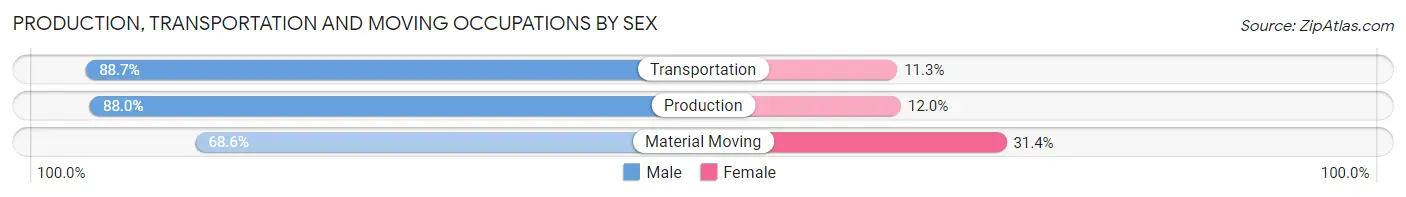
| Occupation | Male | Female |
| Production | 183 (88.0%) | 25 (12.0%) |
| Transportation | 650 (88.7%) | 83 (11.3%) |
| Material Moving | 197 (68.6%) | 90 (31.4%) |
| Total (Category) | 1,030 (83.9%) | 198 (16.1%) |
| Total (Overall) | 3,599 (52.5%) | 3,262 (47.5%) |
Employment Industries by Sex in New Carrollton
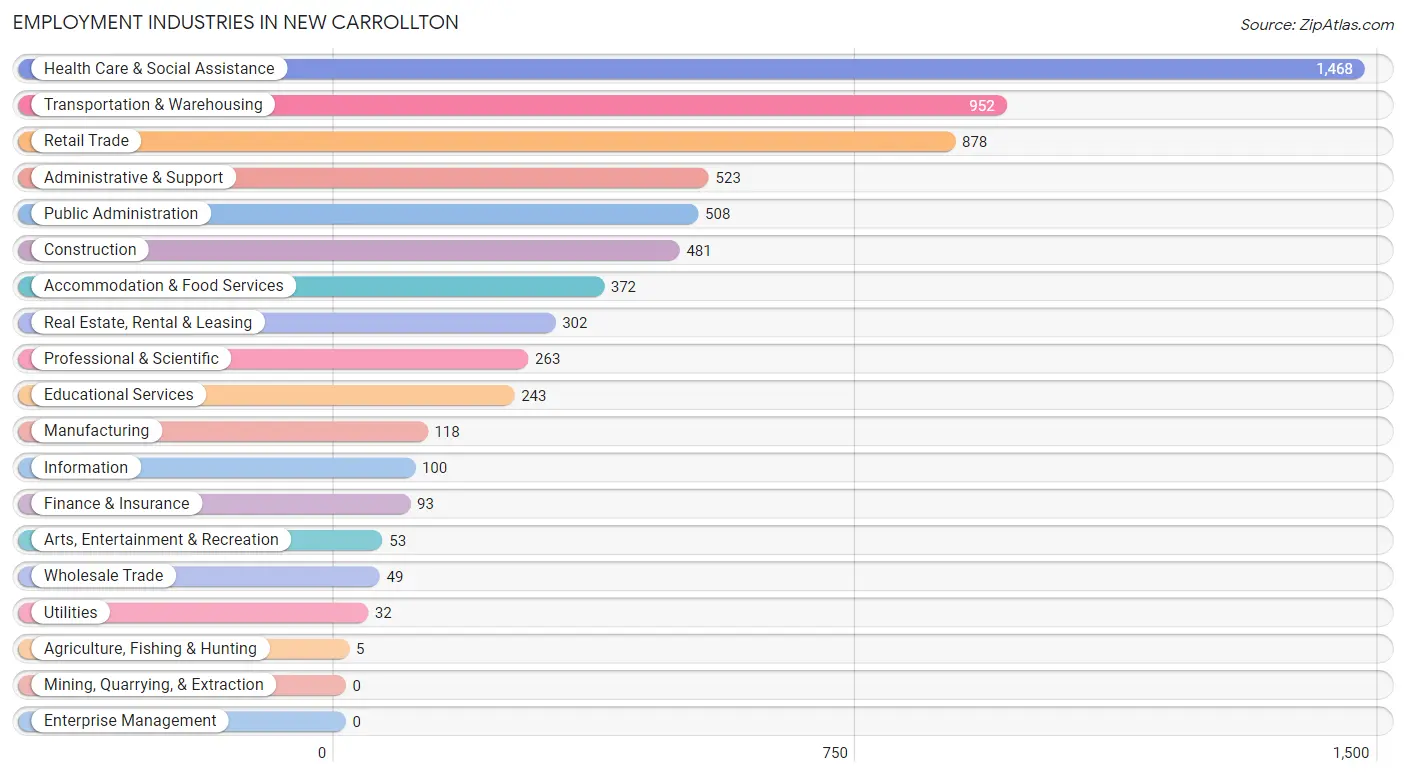
Employment Industries in New Carrollton
The major employment industries in New Carrollton include Health Care & Social Assistance (1,468 | 21.4%), Transportation & Warehousing (952 | 13.9%), Retail Trade (878 | 12.8%), Administrative & Support (523 | 7.6%), and Public Administration (508 | 7.4%).
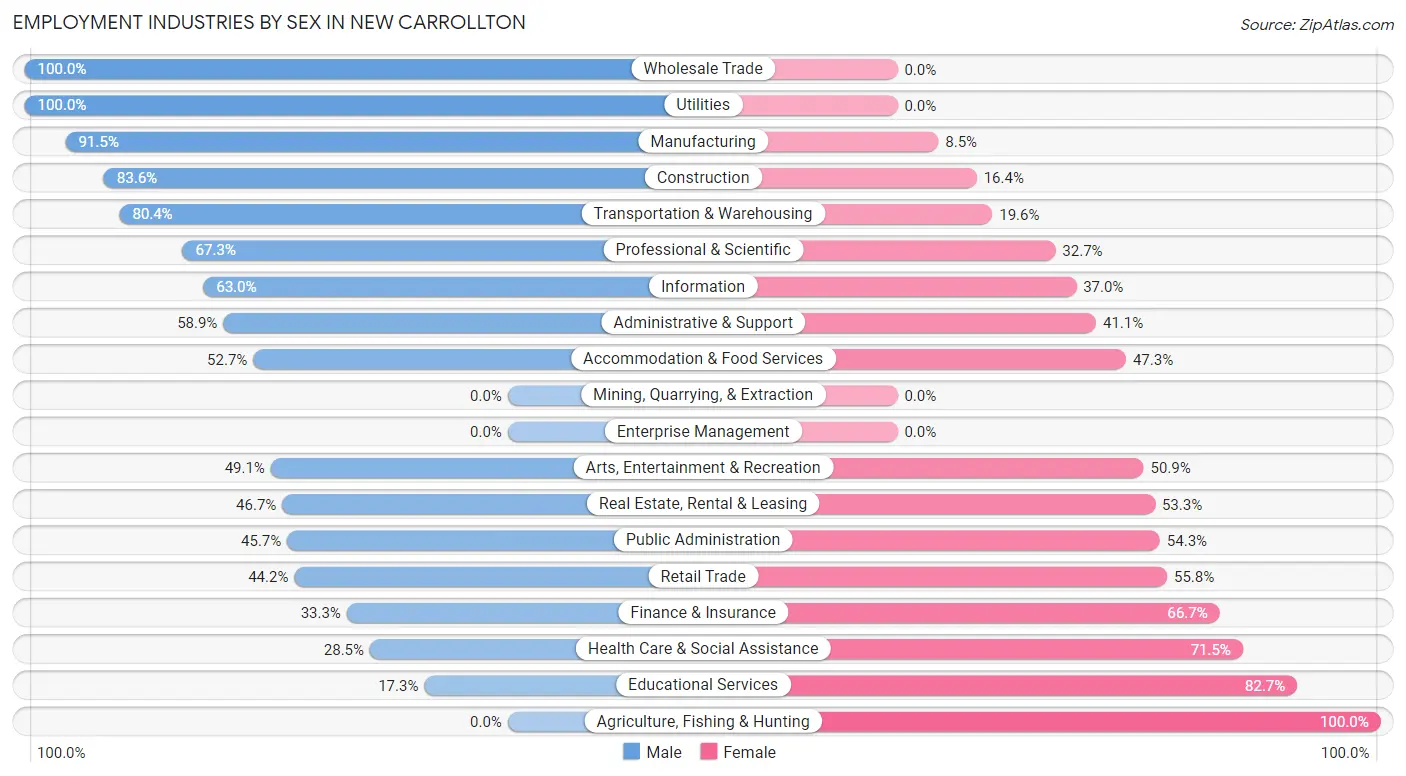
Employment Industries by Sex in New Carrollton
The New Carrollton industries that see more men than women are Wholesale Trade (100.0%), Utilities (100.0%), and Manufacturing (91.5%), whereas the industries that tend to have a higher number of women are Agriculture, Fishing & Hunting (100.0%), Educational Services (82.7%), and Health Care & Social Assistance (71.5%).
| Industry | Male | Female |
| Agriculture, Fishing & Hunting | 0 (0.0%) | 5 (100.0%) |
| Mining, Quarrying, & Extraction | 0 (0.0%) | 0 (0.0%) |
| Construction | 402 (83.6%) | 79 (16.4%) |
| Manufacturing | 108 (91.5%) | 10 (8.5%) |
| Wholesale Trade | 49 (100.0%) | 0 (0.0%) |
| Retail Trade | 388 (44.2%) | 490 (55.8%) |
| Transportation & Warehousing | 765 (80.4%) | 187 (19.6%) |
| Utilities | 32 (100.0%) | 0 (0.0%) |
| Information | 63 (63.0%) | 37 (37.0%) |
| Finance & Insurance | 31 (33.3%) | 62 (66.7%) |
| Real Estate, Rental & Leasing | 141 (46.7%) | 161 (53.3%) |
| Professional & Scientific | 177 (67.3%) | 86 (32.7%) |
| Enterprise Management | 0 (0.0%) | 0 (0.0%) |
| Administrative & Support | 308 (58.9%) | 215 (41.1%) |
| Educational Services | 42 (17.3%) | 201 (82.7%) |
| Health Care & Social Assistance | 419 (28.5%) | 1,049 (71.5%) |
| Arts, Entertainment & Recreation | 26 (49.1%) | 27 (50.9%) |
| Accommodation & Food Services | 196 (52.7%) | 176 (47.3%) |
| Public Administration | 232 (45.7%) | 276 (54.3%) |
| Total | 3,599 (52.5%) | 3,262 (47.5%) |
Education in New Carrollton
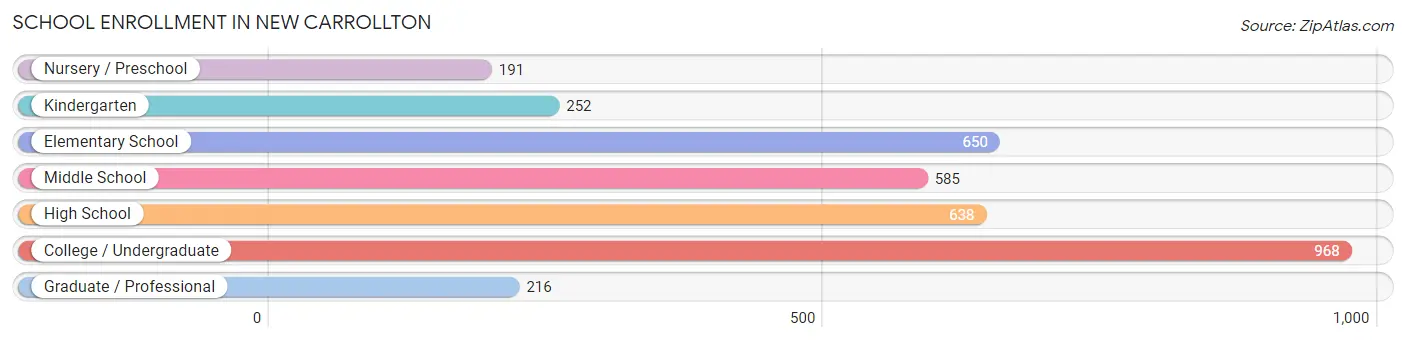
School Enrollment in New Carrollton
The most common levels of schooling among the 3,500 students in New Carrollton are college / undergraduate (968 | 27.7%), elementary school (650 | 18.6%), and high school (638 | 18.2%).
| School Level | # Students | % Students |
| Nursery / Preschool | 191 | 5.5% |
| Kindergarten | 252 | 7.2% |
| Elementary School | 650 | 18.6% |
| Middle School | 585 | 16.7% |
| High School | 638 | 18.2% |
| College / Undergraduate | 968 | 27.7% |
| Graduate / Professional | 216 | 6.2% |
| Total | 3,500 | 100.0% |
School Enrollment by Age by Funding Source in New Carrollton
Out of a total of 3,500 students who are enrolled in schools in New Carrollton, 416 (11.9%) attend a private institution, while the remaining 3,084 (88.1%) are enrolled in public schools. The age group of 3 to 4 year olds has the highest likelihood of being enrolled in private schools, with 40 (70.2% in the age bracket) enrolled. Conversely, the age group of 10 to 14 year olds has the lowest likelihood of being enrolled in a private school, with 767 (97.8% in the age bracket) attending a public institution.
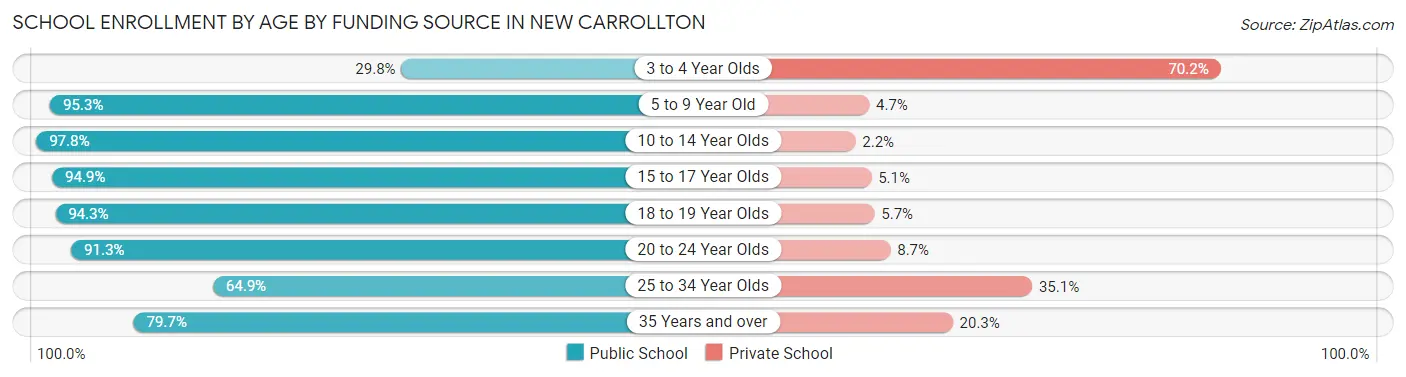
| Age Bracket | Public School | Private School |
| 3 to 4 Year Olds | 17 (29.8%) | 40 (70.2%) |
| 5 to 9 Year Old | 885 (95.3%) | 44 (4.7%) |
| 10 to 14 Year Olds | 767 (97.8%) | 17 (2.2%) |
| 15 to 17 Year Olds | 388 (94.9%) | 21 (5.1%) |
| 18 to 19 Year Olds | 132 (94.3%) | 8 (5.7%) |
| 20 to 24 Year Olds | 263 (91.3%) | 25 (8.7%) |
| 25 to 34 Year Olds | 359 (64.9%) | 194 (35.1%) |
| 35 Years and over | 271 (79.7%) | 69 (20.3%) |
| Total | 3,084 (88.1%) | 416 (11.9%) |
Educational Attainment by Field of Study in New Carrollton
Business (661 | 23.6%), science & technology (272 | 9.7%), social sciences (268 | 9.6%), engineering (266 | 9.5%), and education (245 | 8.7%) are the most common fields of study among 2,803 individuals in New Carrollton who have obtained a bachelor's degree or higher.
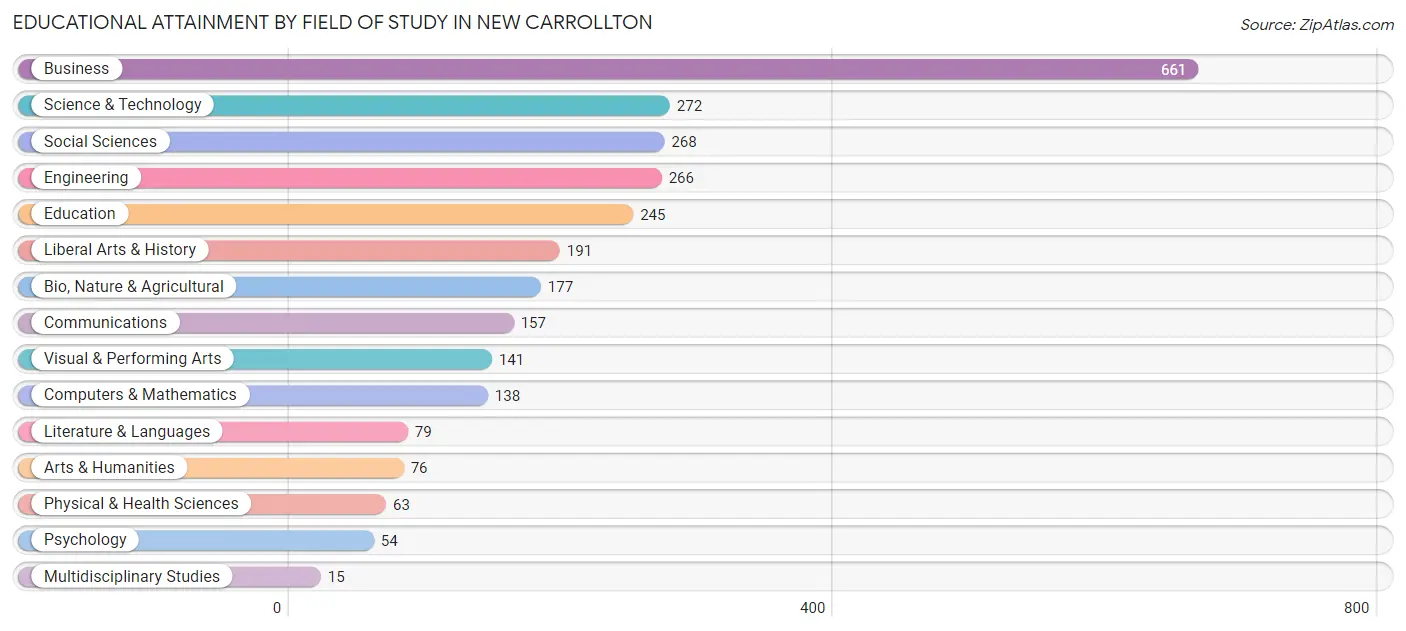
| Field of Study | # Graduates | % Graduates |
| Computers & Mathematics | 138 | 4.9% |
| Bio, Nature & Agricultural | 177 | 6.3% |
| Physical & Health Sciences | 63 | 2.2% |
| Psychology | 54 | 1.9% |
| Social Sciences | 268 | 9.6% |
| Engineering | 266 | 9.5% |
| Multidisciplinary Studies | 15 | 0.5% |
| Science & Technology | 272 | 9.7% |
| Business | 661 | 23.6% |
| Education | 245 | 8.7% |
| Literature & Languages | 79 | 2.8% |
| Liberal Arts & History | 191 | 6.8% |
| Visual & Performing Arts | 141 | 5.0% |
| Communications | 157 | 5.6% |
| Arts & Humanities | 76 | 2.7% |
| Total | 2,803 | 100.0% |
Transportation & Commute in New Carrollton
Vehicle Availability by Sex in New Carrollton
The most prevalent vehicle ownership categories in New Carrollton are males with 2 vehicles (1,137, accounting for 34.2%) and females with 2 vehicles (1,314, making up 35.9%).
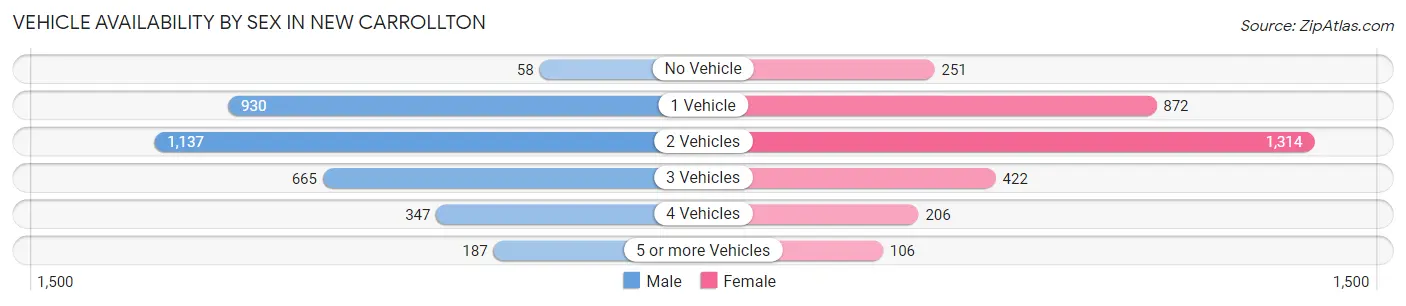
| Vehicles Available | Male | Female |
| No Vehicle | 58 (1.7%) | 251 (7.9%) |
| 1 Vehicle | 930 (28.0%) | 872 (27.5%) |
| 2 Vehicles | 1,137 (34.2%) | 1,314 (41.4%) |
| 3 Vehicles | 665 (20.0%) | 422 (13.3%) |
| 4 Vehicles | 347 (10.4%) | 206 (6.5%) |
| 5 or more Vehicles | 187 (5.6%) | 106 (3.3%) |
| Total | 3,324 (100.0%) | 3,171 (100.0%) |
Commute Time in New Carrollton
The most frequently occuring commute durations in New Carrollton are 30 to 34 minutes (1,124 commuters, 19.0%), 45 to 59 minutes (1,065 commuters, 18.0%), and 15 to 19 minutes (936 commuters, 15.8%).
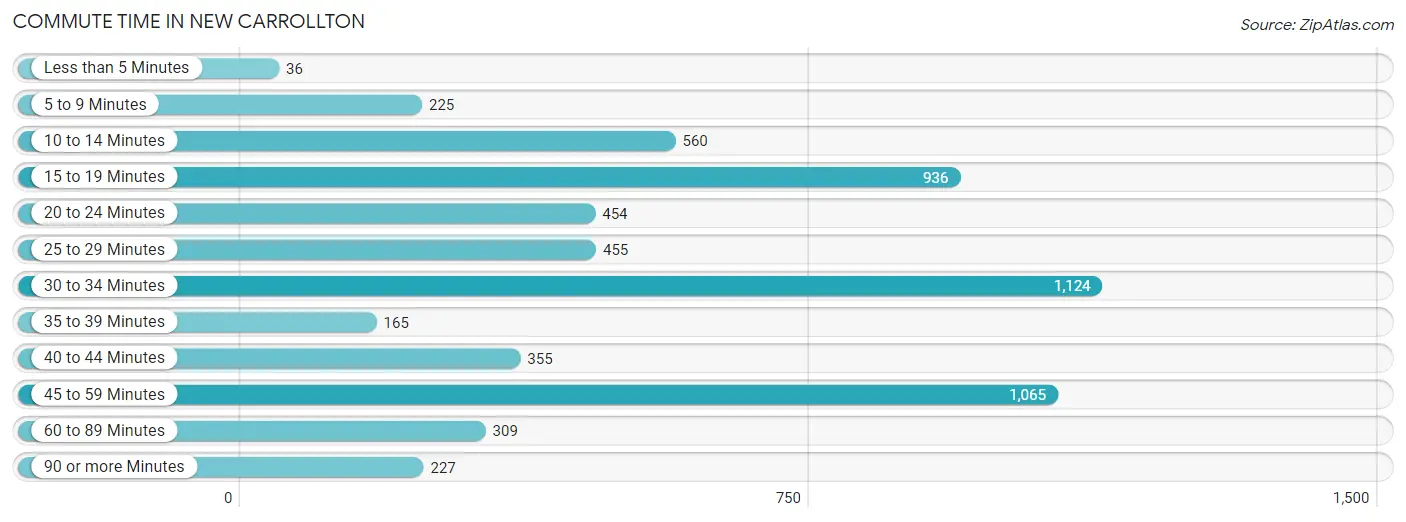
| Commute Time | # Commuters | % Commuters |
| Less than 5 Minutes | 36 | 0.6% |
| 5 to 9 Minutes | 225 | 3.8% |
| 10 to 14 Minutes | 560 | 9.5% |
| 15 to 19 Minutes | 936 | 15.8% |
| 20 to 24 Minutes | 454 | 7.7% |
| 25 to 29 Minutes | 455 | 7.7% |
| 30 to 34 Minutes | 1,124 | 19.0% |
| 35 to 39 Minutes | 165 | 2.8% |
| 40 to 44 Minutes | 355 | 6.0% |
| 45 to 59 Minutes | 1,065 | 18.0% |
| 60 to 89 Minutes | 309 | 5.2% |
| 90 or more Minutes | 227 | 3.8% |
Commute Time by Sex in New Carrollton
The most common commute times in New Carrollton are 30 to 34 minutes (637 commuters, 20.4%) for males and 45 to 59 minutes (623 commuters, 22.4%) for females.
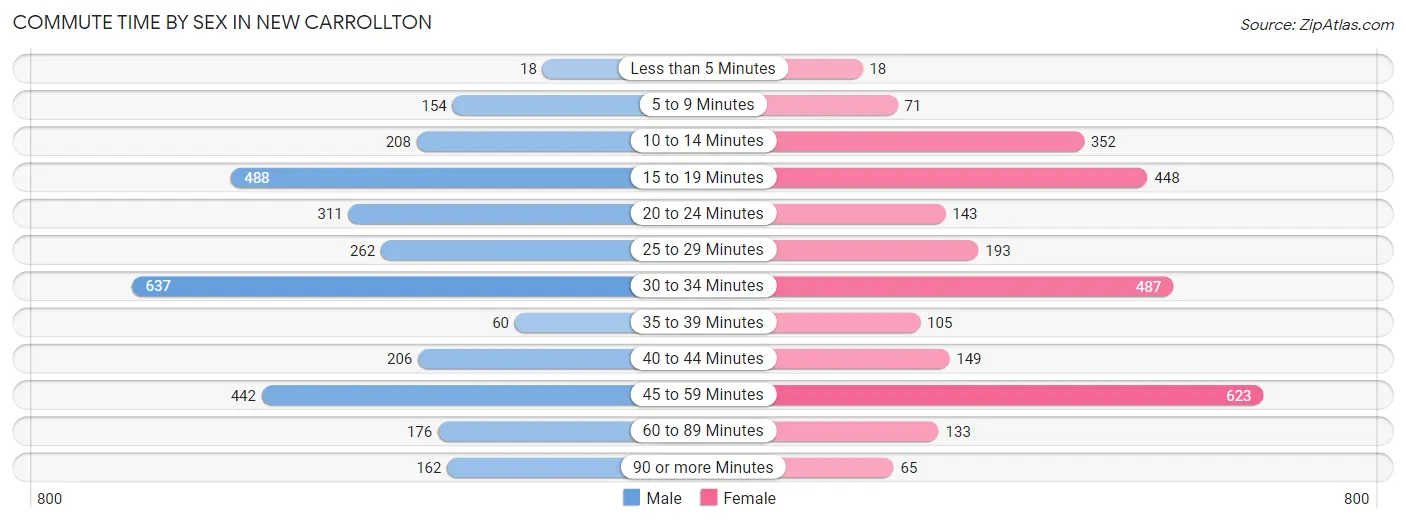
| Commute Time | Male | Female |
| Less than 5 Minutes | 18 (0.6%) | 18 (0.6%) |
| 5 to 9 Minutes | 154 (4.9%) | 71 (2.5%) |
| 10 to 14 Minutes | 208 (6.7%) | 352 (12.6%) |
| 15 to 19 Minutes | 488 (15.6%) | 448 (16.1%) |
| 20 to 24 Minutes | 311 (10.0%) | 143 (5.1%) |
| 25 to 29 Minutes | 262 (8.4%) | 193 (6.9%) |
| 30 to 34 Minutes | 637 (20.4%) | 487 (17.5%) |
| 35 to 39 Minutes | 60 (1.9%) | 105 (3.8%) |
| 40 to 44 Minutes | 206 (6.6%) | 149 (5.3%) |
| 45 to 59 Minutes | 442 (14.1%) | 623 (22.4%) |
| 60 to 89 Minutes | 176 (5.6%) | 133 (4.8%) |
| 90 or more Minutes | 162 (5.2%) | 65 (2.3%) |
Time of Departure to Work by Sex in New Carrollton
The most frequent times of departure to work in New Carrollton are 7:00 AM to 7:29 AM (466, 14.9%) for males and 8:00 AM to 8:29 AM (431, 15.5%) for females.
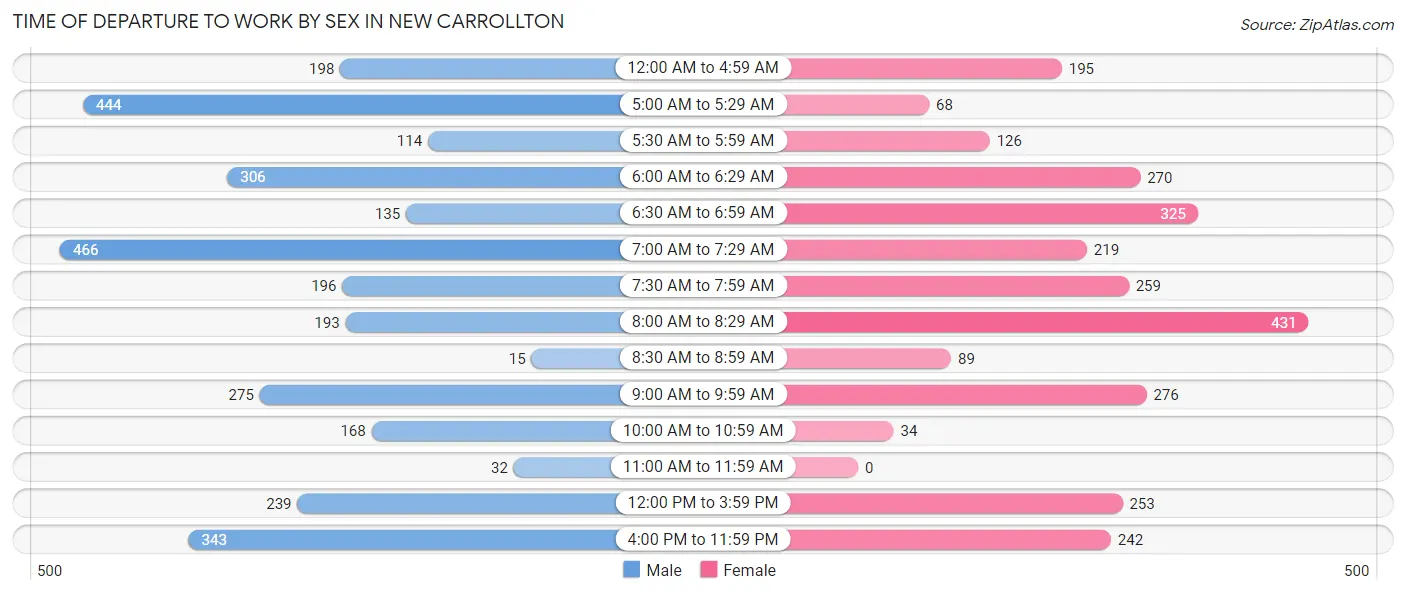
| Time of Departure | Male | Female |
| 12:00 AM to 4:59 AM | 198 (6.3%) | 195 (7.0%) |
| 5:00 AM to 5:29 AM | 444 (14.2%) | 68 (2.4%) |
| 5:30 AM to 5:59 AM | 114 (3.6%) | 126 (4.5%) |
| 6:00 AM to 6:29 AM | 306 (9.8%) | 270 (9.7%) |
| 6:30 AM to 6:59 AM | 135 (4.3%) | 325 (11.7%) |
| 7:00 AM to 7:29 AM | 466 (14.9%) | 219 (7.9%) |
| 7:30 AM to 7:59 AM | 196 (6.3%) | 259 (9.3%) |
| 8:00 AM to 8:29 AM | 193 (6.2%) | 431 (15.5%) |
| 8:30 AM to 8:59 AM | 15 (0.5%) | 89 (3.2%) |
| 9:00 AM to 9:59 AM | 275 (8.8%) | 276 (9.9%) |
| 10:00 AM to 10:59 AM | 168 (5.4%) | 34 (1.2%) |
| 11:00 AM to 11:59 AM | 32 (1.0%) | 0 (0.0%) |
| 12:00 PM to 3:59 PM | 239 (7.6%) | 253 (9.1%) |
| 4:00 PM to 11:59 PM | 343 (11.0%) | 242 (8.7%) |
| Total | 3,124 (100.0%) | 2,787 (100.0%) |
Housing Occupancy in New Carrollton
Occupancy by Ownership in New Carrollton
Of the total 4,748 dwellings in New Carrollton, owner-occupied units account for 2,290 (48.2%), while renter-occupied units make up 2,458 (51.8%).
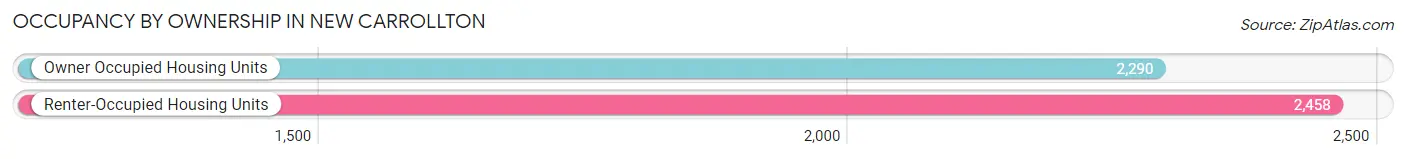
| Occupancy | # Housing Units | % Housing Units |
| Owner Occupied Housing Units | 2,290 | 48.2% |
| Renter-Occupied Housing Units | 2,458 | 51.8% |
| Total Occupied Housing Units | 4,748 | 100.0% |
Occupancy by Household Size in New Carrollton
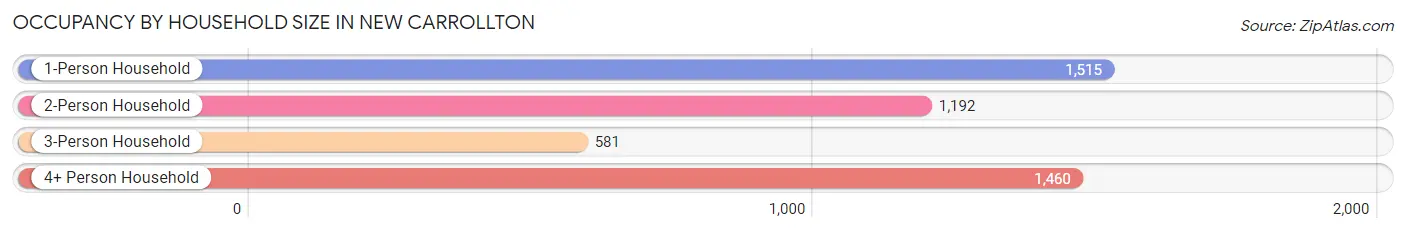
| Household Size | # Housing Units | % Housing Units |
| 1-Person Household | 1,515 | 31.9% |
| 2-Person Household | 1,192 | 25.1% |
| 3-Person Household | 581 | 12.2% |
| 4+ Person Household | 1,460 | 30.7% |
| Total Housing Units | 4,748 | 100.0% |
Occupancy by Ownership by Household Size in New Carrollton
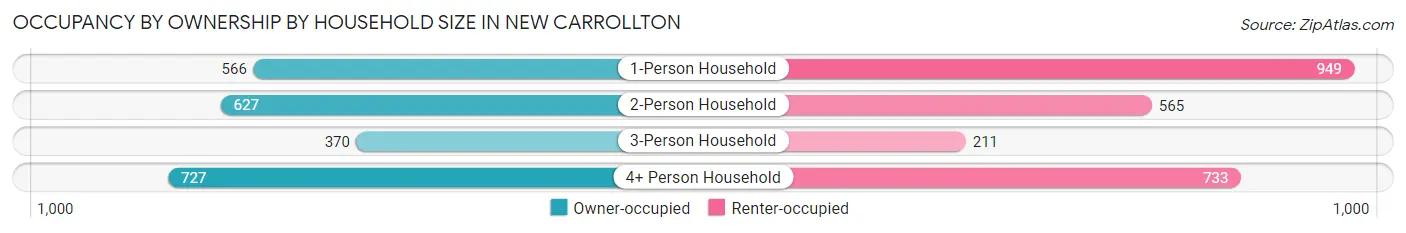
| Household Size | Owner-occupied | Renter-occupied |
| 1-Person Household | 566 (37.4%) | 949 (62.6%) |
| 2-Person Household | 627 (52.6%) | 565 (47.4%) |
| 3-Person Household | 370 (63.7%) | 211 (36.3%) |
| 4+ Person Household | 727 (49.8%) | 733 (50.2%) |
| Total Housing Units | 2,290 (48.2%) | 2,458 (51.8%) |
Occupancy by Educational Attainment in New Carrollton
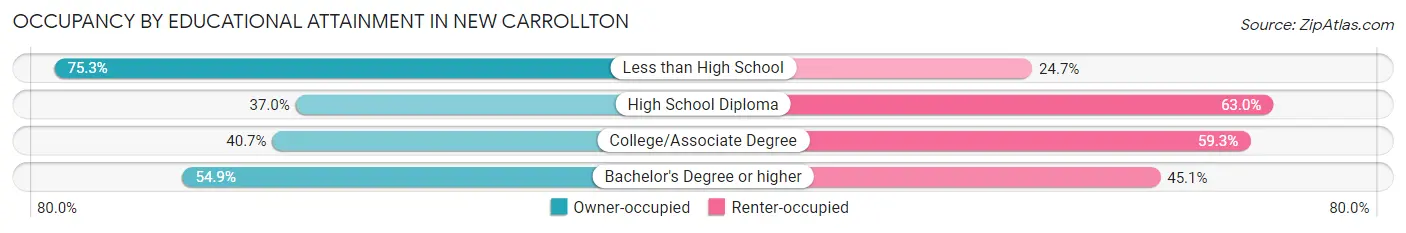
| Household Size | Owner-occupied | Renter-occupied |
| Less than High School | 429 (75.3%) | 141 (24.7%) |
| High School Diploma | 458 (37.0%) | 779 (63.0%) |
| College/Associate Degree | 608 (40.7%) | 886 (59.3%) |
| Bachelor's Degree or higher | 795 (54.9%) | 652 (45.1%) |
Occupancy by Age of Householder in New Carrollton
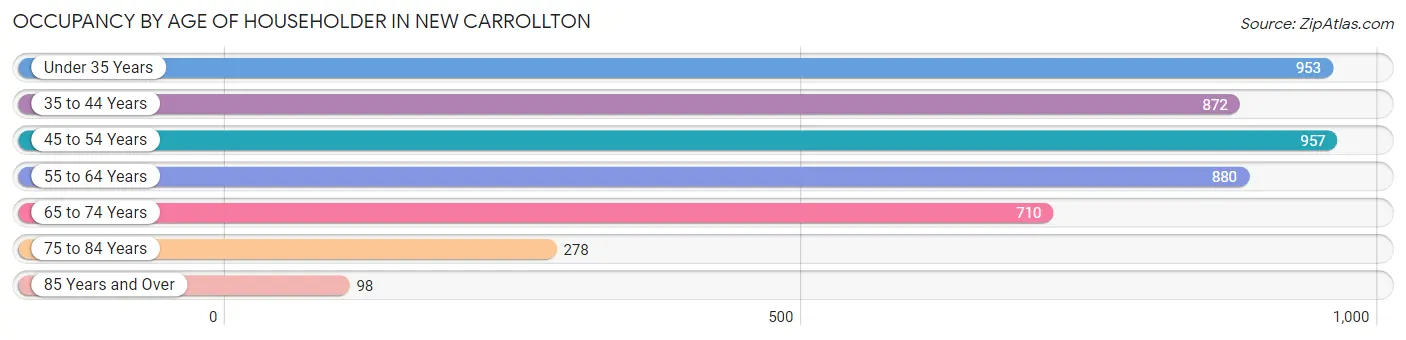
| Age Bracket | # Households | % Households |
| Under 35 Years | 953 | 20.1% |
| 35 to 44 Years | 872 | 18.4% |
| 45 to 54 Years | 957 | 20.2% |
| 55 to 64 Years | 880 | 18.5% |
| 65 to 74 Years | 710 | 14.9% |
| 75 to 84 Years | 278 | 5.9% |
| 85 Years and Over | 98 | 2.1% |
| Total | 4,748 | 100.0% |
Housing Finances in New Carrollton
Median Income by Occupancy in New Carrollton
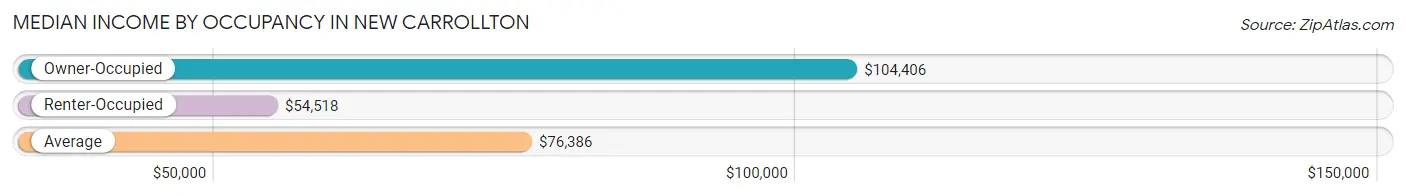
| Occupancy Type | # Households | Median Income |
| Owner-Occupied | 2,290 (48.2%) | $104,406 |
| Renter-Occupied | 2,458 (51.8%) | $54,518 |
| Average | 4,748 (100.0%) | $76,386 |
Occupancy by Householder Income Bracket in New Carrollton
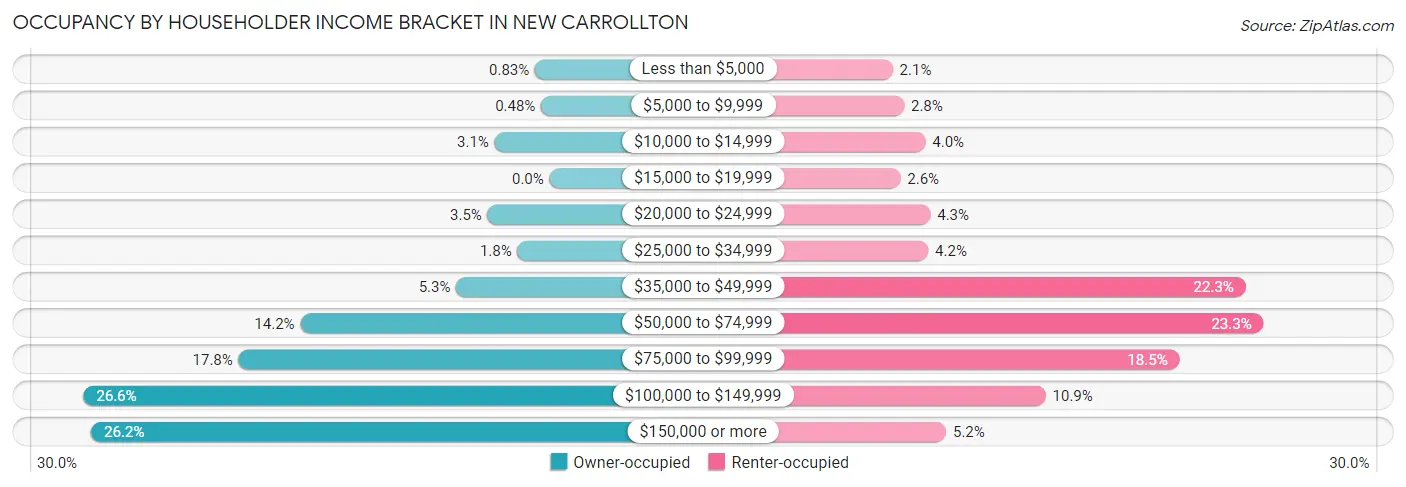
| Income Bracket | Owner-occupied | Renter-occupied |
| Less than $5,000 | 19 (0.8%) | 52 (2.1%) |
| $5,000 to $9,999 | 11 (0.5%) | 68 (2.8%) |
| $10,000 to $14,999 | 72 (3.1%) | 98 (4.0%) |
| $15,000 to $19,999 | 0 (0.0%) | 63 (2.6%) |
| $20,000 to $24,999 | 81 (3.5%) | 105 (4.3%) |
| $25,000 to $34,999 | 42 (1.8%) | 102 (4.2%) |
| $35,000 to $49,999 | 122 (5.3%) | 548 (22.3%) |
| $50,000 to $74,999 | 326 (14.2%) | 573 (23.3%) |
| $75,000 to $99,999 | 407 (17.8%) | 455 (18.5%) |
| $100,000 to $149,999 | 610 (26.6%) | 267 (10.9%) |
| $150,000 or more | 600 (26.2%) | 127 (5.2%) |
| Total | 2,290 (100.0%) | 2,458 (100.0%) |
Monthly Housing Cost Tiers in New Carrollton
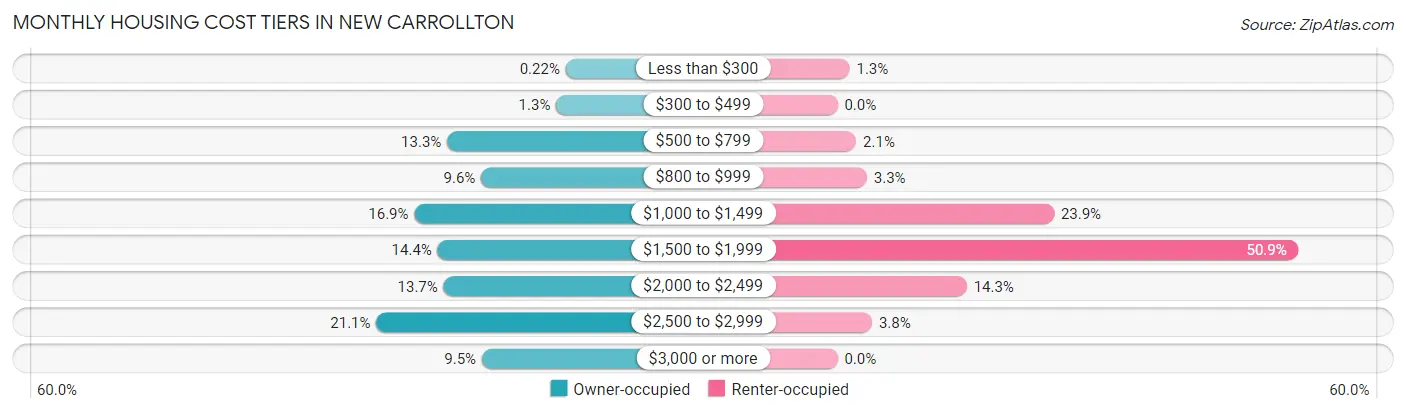
| Monthly Cost | Owner-occupied | Renter-occupied |
| Less than $300 | 5 (0.2%) | 33 (1.3%) |
| $300 to $499 | 29 (1.3%) | 0 (0.0%) |
| $500 to $799 | 305 (13.3%) | 51 (2.1%) |
| $800 to $999 | 219 (9.6%) | 80 (3.3%) |
| $1,000 to $1,499 | 388 (16.9%) | 588 (23.9%) |
| $1,500 to $1,999 | 329 (14.4%) | 1,252 (50.9%) |
| $2,000 to $2,499 | 314 (13.7%) | 351 (14.3%) |
| $2,500 to $2,999 | 484 (21.1%) | 94 (3.8%) |
| $3,000 or more | 217 (9.5%) | 0 (0.0%) |
| Total | 2,290 (100.0%) | 2,458 (100.0%) |
Physical Housing Characteristics in New Carrollton
Housing Structures in New Carrollton
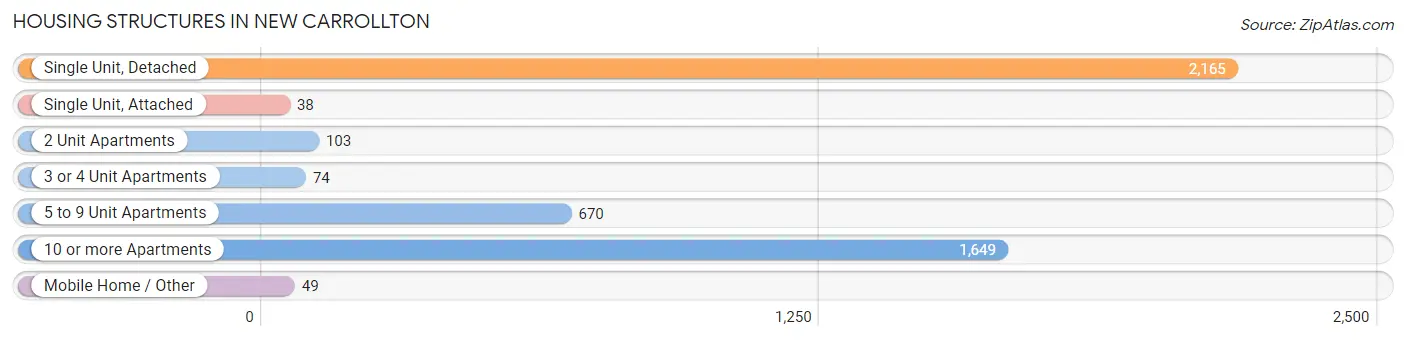
| Structure Type | # Housing Units | % Housing Units |
| Single Unit, Detached | 2,165 | 45.6% |
| Single Unit, Attached | 38 | 0.8% |
| 2 Unit Apartments | 103 | 2.2% |
| 3 or 4 Unit Apartments | 74 | 1.6% |
| 5 to 9 Unit Apartments | 670 | 14.1% |
| 10 or more Apartments | 1,649 | 34.7% |
| Mobile Home / Other | 49 | 1.0% |
| Total | 4,748 | 100.0% |
Housing Structures by Occupancy in New Carrollton
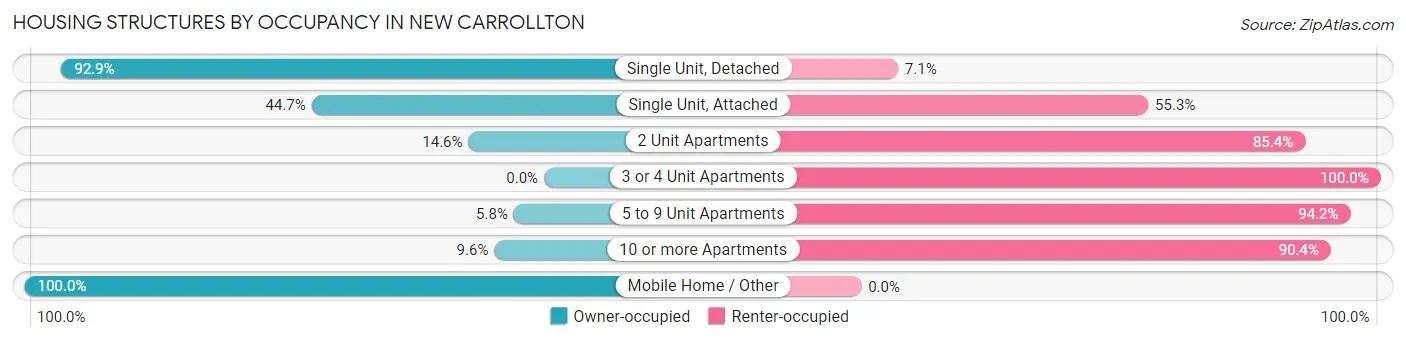
| Structure Type | Owner-occupied | Renter-occupied |
| Single Unit, Detached | 2,012 (92.9%) | 153 (7.1%) |
| Single Unit, Attached | 17 (44.7%) | 21 (55.3%) |
| 2 Unit Apartments | 15 (14.6%) | 88 (85.4%) |
| 3 or 4 Unit Apartments | 0 (0.0%) | 74 (100.0%) |
| 5 to 9 Unit Apartments | 39 (5.8%) | 631 (94.2%) |
| 10 or more Apartments | 158 (9.6%) | 1,491 (90.4%) |
| Mobile Home / Other | 49 (100.0%) | 0 (0.0%) |
| Total | 2,290 (48.2%) | 2,458 (51.8%) |
Housing Structures by Number of Rooms in New Carrollton
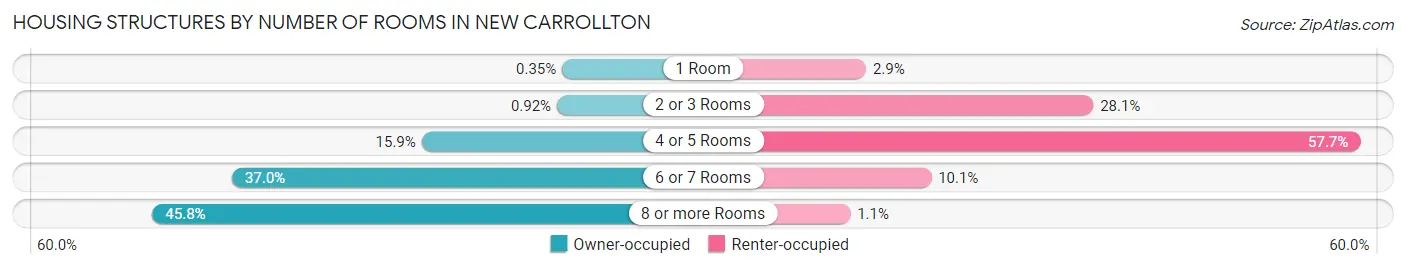
| Number of Rooms | Owner-occupied | Renter-occupied |
| 1 Room | 8 (0.4%) | 71 (2.9%) |
| 2 or 3 Rooms | 21 (0.9%) | 691 (28.1%) |
| 4 or 5 Rooms | 365 (15.9%) | 1,419 (57.7%) |
| 6 or 7 Rooms | 847 (37.0%) | 249 (10.1%) |
| 8 or more Rooms | 1,049 (45.8%) | 28 (1.1%) |
| Total | 2,290 (100.0%) | 2,458 (100.0%) |
Housing Structure by Heating Type in New Carrollton
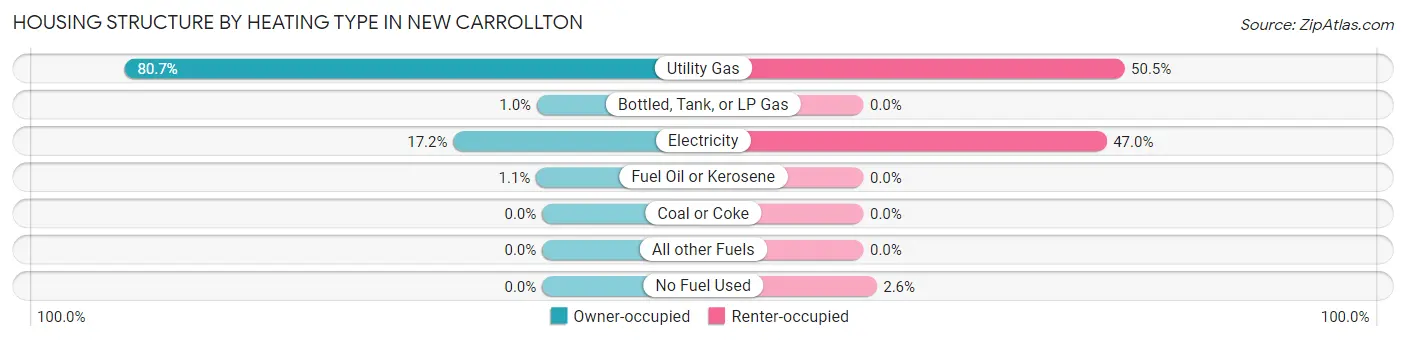
| Heating Type | Owner-occupied | Renter-occupied |
| Utility Gas | 1,848 (80.7%) | 1,240 (50.4%) |
| Bottled, Tank, or LP Gas | 23 (1.0%) | 0 (0.0%) |
| Electricity | 393 (17.2%) | 1,155 (47.0%) |
| Fuel Oil or Kerosene | 26 (1.1%) | 0 (0.0%) |
| Coal or Coke | 0 (0.0%) | 0 (0.0%) |
| All other Fuels | 0 (0.0%) | 0 (0.0%) |
| No Fuel Used | 0 (0.0%) | 63 (2.6%) |
| Total | 2,290 (100.0%) | 2,458 (100.0%) |
Household Vehicle Usage in New Carrollton
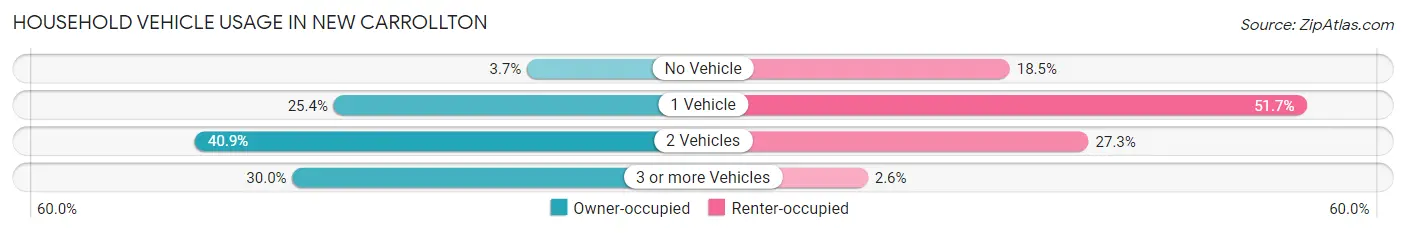
| Vehicles per Household | Owner-occupied | Renter-occupied |
| No Vehicle | 85 (3.7%) | 454 (18.5%) |
| 1 Vehicle | 581 (25.4%) | 1,270 (51.7%) |
| 2 Vehicles | 937 (40.9%) | 671 (27.3%) |
| 3 or more Vehicles | 687 (30.0%) | 63 (2.6%) |
| Total | 2,290 (100.0%) | 2,458 (100.0%) |
Real Estate & Mortgages in New Carrollton
Real Estate and Mortgage Overview in New Carrollton
| Characteristic | Without Mortgage | With Mortgage |
| Housing Units | 603 | 1,687 |
| Median Property Value | $324,900 | $363,200 |
| Median Household Income | $83,542 | $409 |
| Monthly Housing Costs | $791 | $217 |
| Real Estate Taxes | $5,676 | $115 |
Property Value by Mortgage Status in New Carrollton
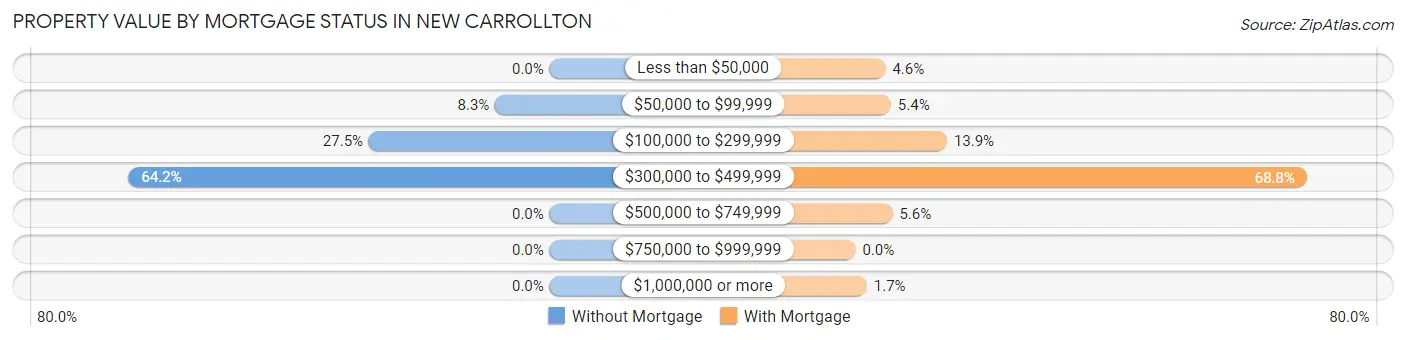
| Property Value | Without Mortgage | With Mortgage |
| Less than $50,000 | 0 (0.0%) | 77 (4.6%) |
| $50,000 to $99,999 | 50 (8.3%) | 91 (5.4%) |
| $100,000 to $299,999 | 166 (27.5%) | 235 (13.9%) |
| $300,000 to $499,999 | 387 (64.2%) | 1,160 (68.8%) |
| $500,000 to $749,999 | 0 (0.0%) | 95 (5.6%) |
| $750,000 to $999,999 | 0 (0.0%) | 0 (0.0%) |
| $1,000,000 or more | 0 (0.0%) | 29 (1.7%) |
| Total | 603 (100.0%) | 1,687 (100.0%) |
Household Income by Mortgage Status in New Carrollton
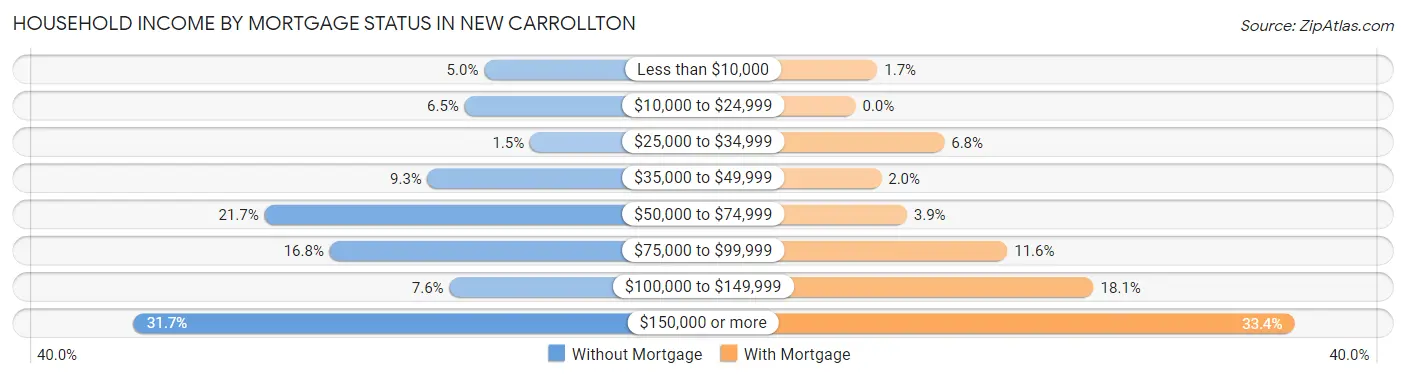
| Household Income | Without Mortgage | With Mortgage |
| Less than $10,000 | 30 (5.0%) | 28 (1.7%) |
| $10,000 to $24,999 | 39 (6.5%) | 0 (0.0%) |
| $25,000 to $34,999 | 9 (1.5%) | 114 (6.8%) |
| $35,000 to $49,999 | 56 (9.3%) | 33 (2.0%) |
| $50,000 to $74,999 | 131 (21.7%) | 66 (3.9%) |
| $75,000 to $99,999 | 101 (16.8%) | 195 (11.6%) |
| $100,000 to $149,999 | 46 (7.6%) | 306 (18.1%) |
| $150,000 or more | 191 (31.7%) | 564 (33.4%) |
| Total | 603 (100.0%) | 1,687 (100.0%) |
Property Value to Household Income Ratio in New Carrollton
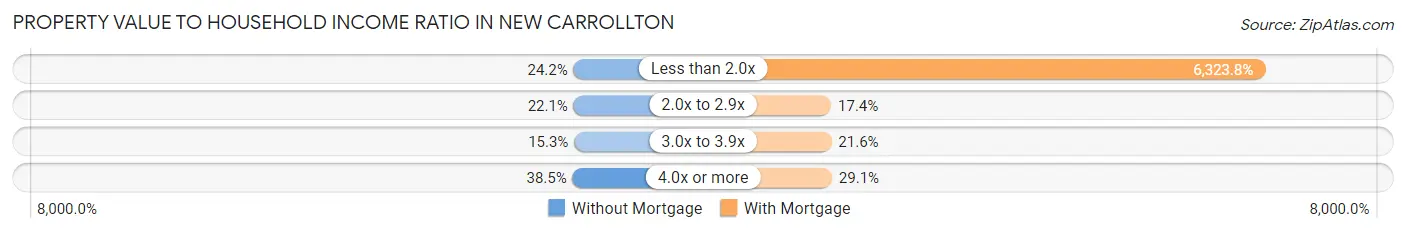
| Value-to-Income Ratio | Without Mortgage | With Mortgage |
| Less than 2.0x | 146 (24.2%) | 106,683 (6,323.8%) |
| 2.0x to 2.9x | 133 (22.1%) | 294 (17.4%) |
| 3.0x to 3.9x | 92 (15.3%) | 364 (21.6%) |
| 4.0x or more | 232 (38.5%) | 491 (29.1%) |
| Total | 603 (100.0%) | 1,687 (100.0%) |
Real Estate Taxes by Mortgage Status in New Carrollton
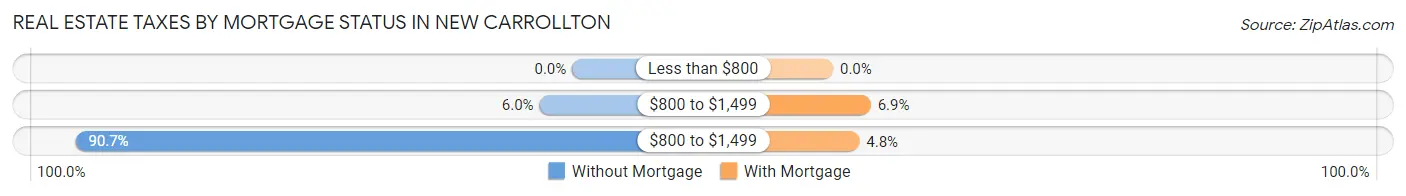
| Property Taxes | Without Mortgage | With Mortgage |
| Less than $800 | 0 (0.0%) | 0 (0.0%) |
| $800 to $1,499 | 36 (6.0%) | 116 (6.9%) |
| $800 to $1,499 | 547 (90.7%) | 81 (4.8%) |
| Total | 603 (100.0%) | 1,687 (100.0%) |
Health & Disability in New Carrollton
Health Insurance Coverage by Age in New Carrollton
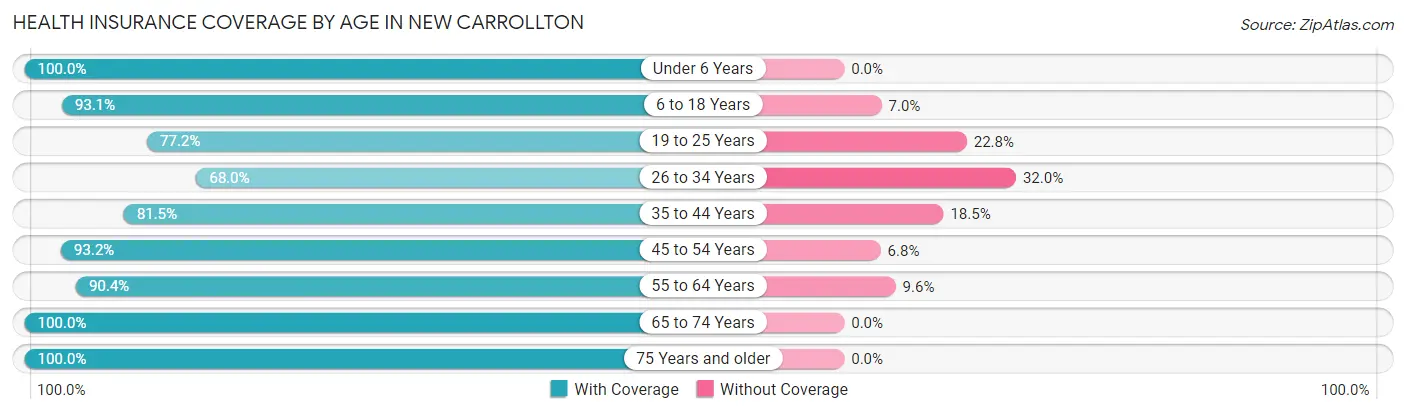
| Age Bracket | With Coverage | Without Coverage |
| Under 6 Years | 1,256 (100.0%) | 0 (0.0%) |
| 6 to 18 Years | 1,982 (93.0%) | 148 (7.0%) |
| 19 to 25 Years | 804 (77.2%) | 238 (22.8%) |
| 26 to 34 Years | 1,639 (68.0%) | 772 (32.0%) |
| 35 to 44 Years | 1,559 (81.5%) | 354 (18.5%) |
| 45 to 54 Years | 1,361 (93.2%) | 99 (6.8%) |
| 55 to 64 Years | 1,491 (90.4%) | 158 (9.6%) |
| 65 to 74 Years | 1,142 (100.0%) | 0 (0.0%) |
| 75 Years and older | 559 (100.0%) | 0 (0.0%) |
| Total | 11,793 (87.0%) | 1,769 (13.0%) |
Health Insurance Coverage by Citizenship Status in New Carrollton
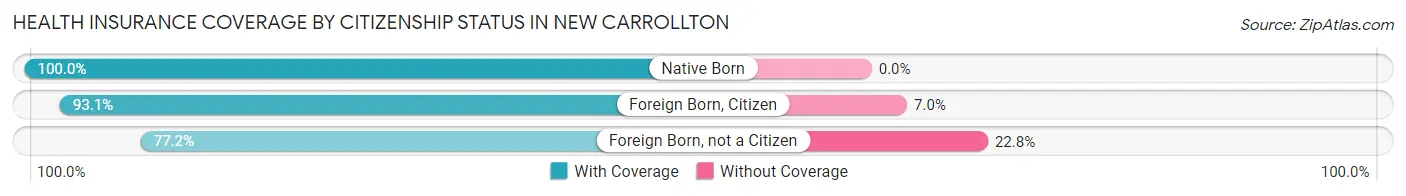
| Citizenship Status | With Coverage | Without Coverage |
| Native Born | 1,256 (100.0%) | 0 (0.0%) |
| Foreign Born, Citizen | 1,982 (93.0%) | 148 (7.0%) |
| Foreign Born, not a Citizen | 804 (77.2%) | 238 (22.8%) |
Health Insurance Coverage by Household Income in New Carrollton
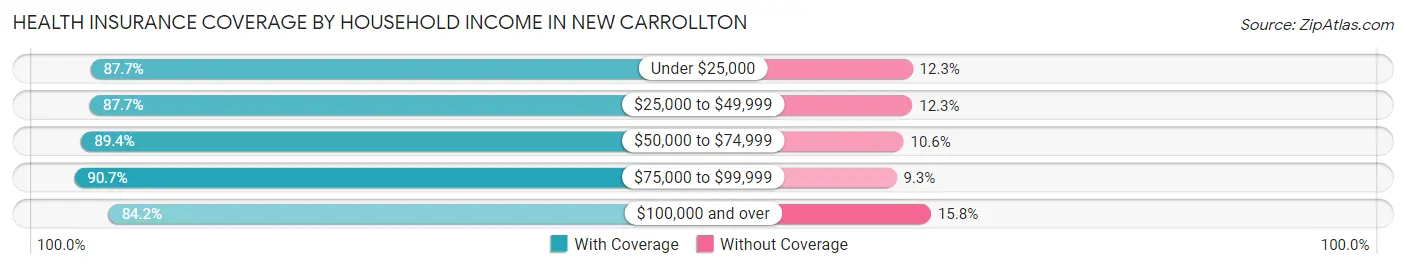
| Household Income | With Coverage | Without Coverage |
| Under $25,000 | 682 (87.7%) | 96 (12.3%) |
| $25,000 to $49,999 | 1,536 (87.7%) | 215 (12.3%) |
| $50,000 to $74,999 | 1,764 (89.4%) | 210 (10.6%) |
| $75,000 to $99,999 | 2,504 (90.7%) | 257 (9.3%) |
| $100,000 and over | 5,295 (84.2%) | 991 (15.8%) |
Public vs Private Health Insurance Coverage by Age in New Carrollton
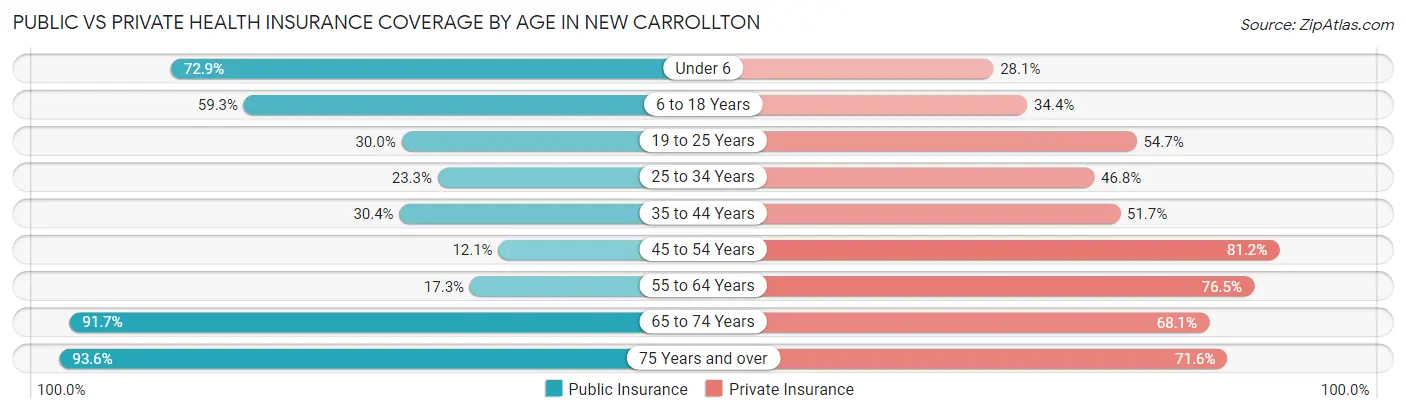
| Age Bracket | Public Insurance | Private Insurance |
| Under 6 | 915 (72.9%) | 353 (28.1%) |
| 6 to 18 Years | 1,263 (59.3%) | 733 (34.4%) |
| 19 to 25 Years | 313 (30.0%) | 570 (54.7%) |
| 25 to 34 Years | 562 (23.3%) | 1,129 (46.8%) |
| 35 to 44 Years | 582 (30.4%) | 988 (51.6%) |
| 45 to 54 Years | 176 (12.0%) | 1,185 (81.2%) |
| 55 to 64 Years | 286 (17.3%) | 1,261 (76.5%) |
| 65 to 74 Years | 1,047 (91.7%) | 778 (68.1%) |
| 75 Years and over | 523 (93.6%) | 400 (71.6%) |
| Total | 5,667 (41.8%) | 7,397 (54.5%) |
Disability Status by Sex by Age in New Carrollton
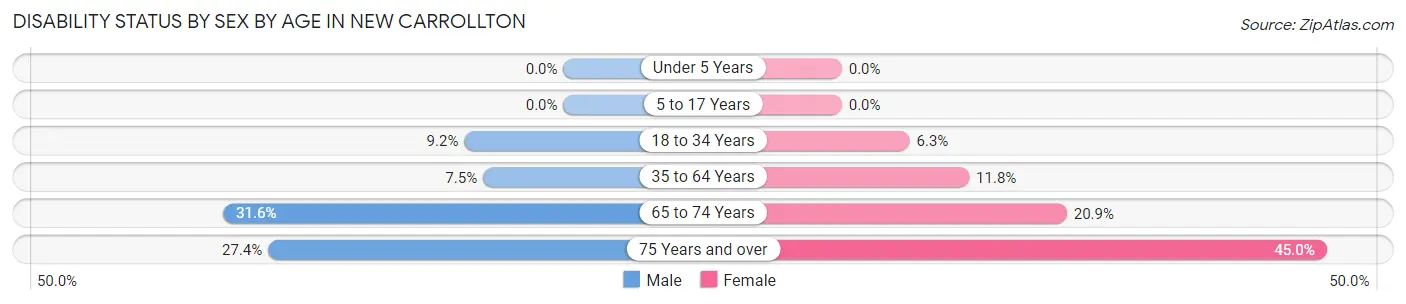
| Age Bracket | Male | Female |
| Under 5 Years | 0 (0.0%) | 0 (0.0%) |
| 5 to 17 Years | 0 (0.0%) | 0 (0.0%) |
| 18 to 34 Years | 151 (9.2%) | 124 (6.3%) |
| 35 to 64 Years | 186 (7.5%) | 299 (11.8%) |
| 65 to 74 Years | 173 (31.6%) | 124 (20.9%) |
| 75 Years and over | 74 (27.4%) | 130 (45.0%) |
Disability Class by Sex by Age in New Carrollton
Disability Class: Hearing Difficulty
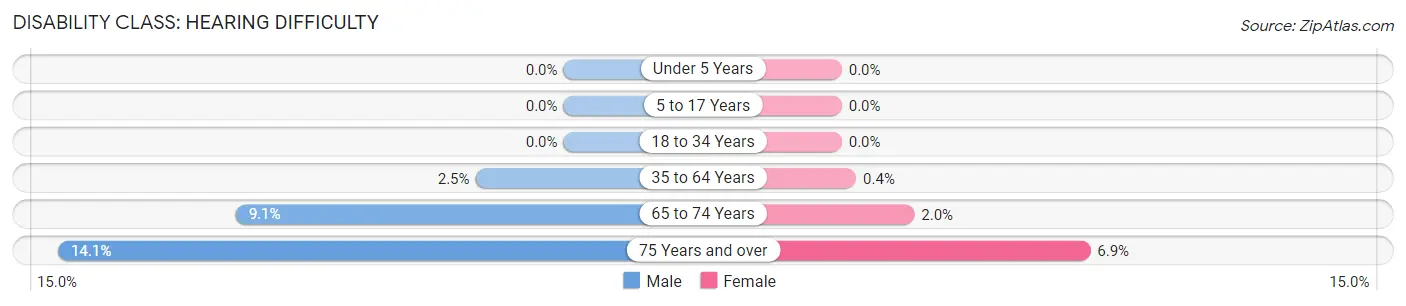
| Age Bracket | Male | Female |
| Under 5 Years | 0 (0.0%) | 0 (0.0%) |
| 5 to 17 Years | 0 (0.0%) | 0 (0.0%) |
| 18 to 34 Years | 0 (0.0%) | 0 (0.0%) |
| 35 to 64 Years | 61 (2.5%) | 10 (0.4%) |
| 65 to 74 Years | 50 (9.1%) | 12 (2.0%) |
| 75 Years and over | 38 (14.1%) | 20 (6.9%) |
Disability Class: Vision Difficulty
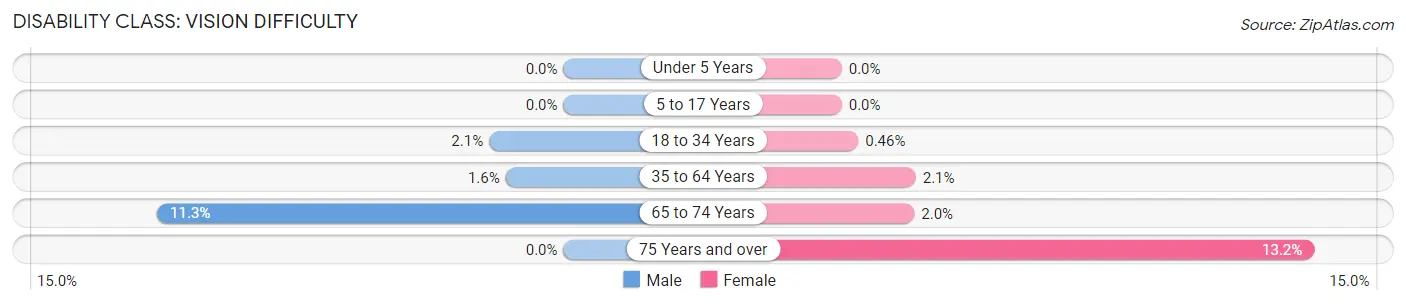
| Age Bracket | Male | Female |
| Under 5 Years | 0 (0.0%) | 0 (0.0%) |
| 5 to 17 Years | 0 (0.0%) | 0 (0.0%) |
| 18 to 34 Years | 34 (2.1%) | 9 (0.5%) |
| 35 to 64 Years | 40 (1.6%) | 52 (2.1%) |
| 65 to 74 Years | 62 (11.3%) | 12 (2.0%) |
| 75 Years and over | 0 (0.0%) | 38 (13.2%) |
Disability Class: Cognitive Difficulty
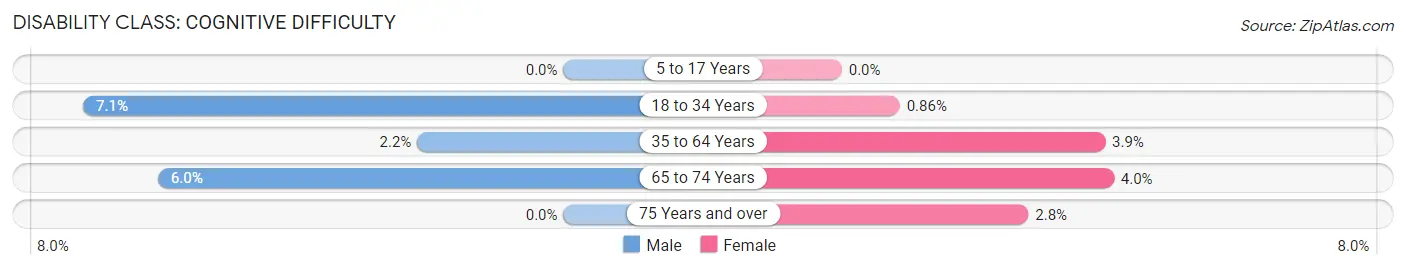
| Age Bracket | Male | Female |
| 5 to 17 Years | 0 (0.0%) | 0 (0.0%) |
| 18 to 34 Years | 117 (7.1%) | 17 (0.9%) |
| 35 to 64 Years | 54 (2.2%) | 99 (3.9%) |
| 65 to 74 Years | 33 (6.0%) | 24 (4.0%) |
| 75 Years and over | 0 (0.0%) | 8 (2.8%) |
Disability Class: Ambulatory Difficulty
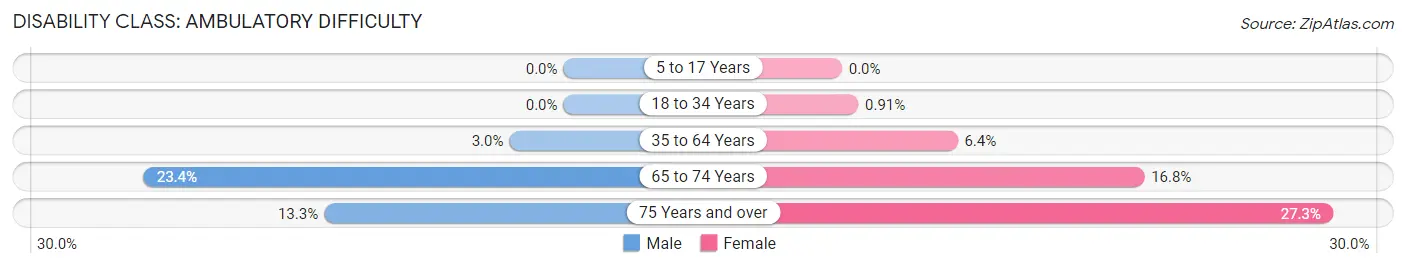
| Age Bracket | Male | Female |
| 5 to 17 Years | 0 (0.0%) | 0 (0.0%) |
| 18 to 34 Years | 0 (0.0%) | 18 (0.9%) |
| 35 to 64 Years | 75 (3.0%) | 163 (6.4%) |
| 65 to 74 Years | 128 (23.4%) | 100 (16.8%) |
| 75 Years and over | 36 (13.3%) | 79 (27.3%) |
Disability Class: Self-Care Difficulty
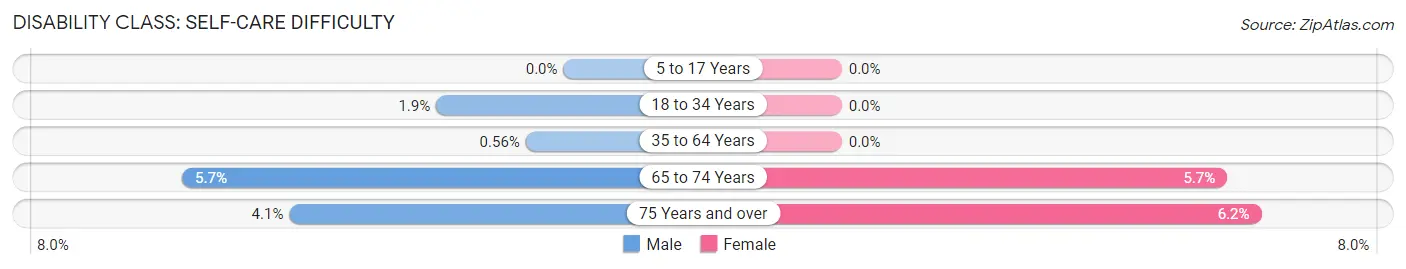
| Age Bracket | Male | Female |
| 5 to 17 Years | 0 (0.0%) | 0 (0.0%) |
| 18 to 34 Years | 31 (1.9%) | 0 (0.0%) |
| 35 to 64 Years | 14 (0.6%) | 0 (0.0%) |
| 65 to 74 Years | 31 (5.7%) | 34 (5.7%) |
| 75 Years and over | 11 (4.1%) | 18 (6.2%) |
Technology Access in New Carrollton
Computing Device Access in New Carrollton
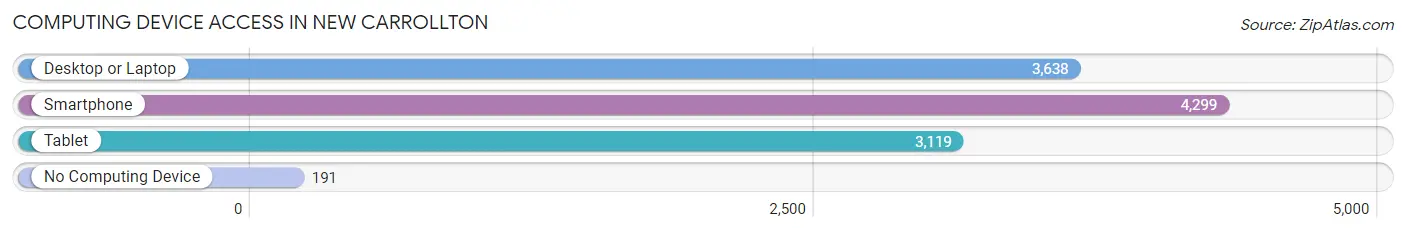
| Device Type | # Households | % Households |
| Desktop or Laptop | 3,638 | 76.6% |
| Smartphone | 4,299 | 90.5% |
| Tablet | 3,119 | 65.7% |
| No Computing Device | 191 | 4.0% |
| Total | 4,748 | 100.0% |
Internet Access in New Carrollton
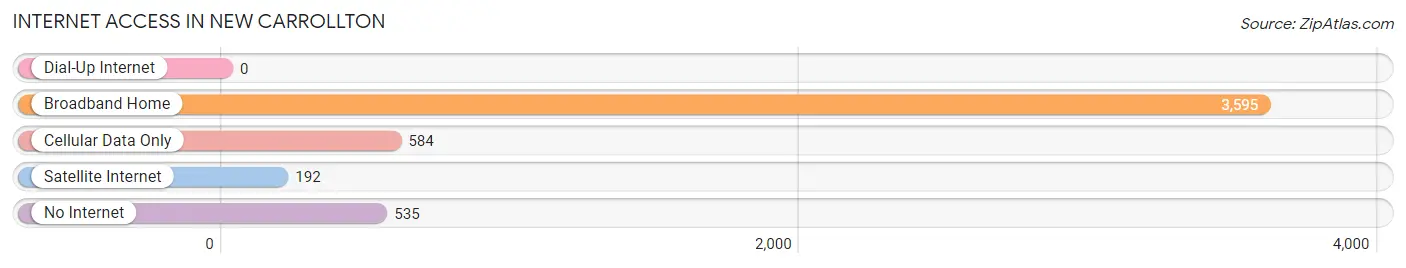
| Internet Type | # Households | % Households |
| Dial-Up Internet | 0 | 0.0% |
| Broadband Home | 3,595 | 75.7% |
| Cellular Data Only | 584 | 12.3% |
| Satellite Internet | 192 | 4.0% |
| No Internet | 535 | 11.3% |
| Total | 4,748 | 100.0% |
New Carrollton Summary
Carrollton, Maryland is a small town located in Prince George’s County, Maryland, United States. It is situated approximately 15 miles east of Washington, D.C. and is part of the Washington metropolitan area. The town was founded in 1873 and is named after Charles Carroll of Carrollton, a signer of the Declaration of Independence.
History
Carrollton was founded in 1873 by the Baltimore and Potomac Railroad. The town was named after Charles Carroll of Carrollton, a signer of the Declaration of Independence. The town was originally a small farming community, but it grew rapidly after the railroad was built. The town was incorporated in 1878 and was the first incorporated town in Prince George’s County.
In the early 20th century, Carrollton was a popular summer resort for Washingtonians. The town was home to several large hotels, including the Carrollton Hotel, which was built in 1891. The hotel was a popular destination for politicians and other prominent figures.
In the 1950s, the town began to experience a decline in population as people moved to the suburbs of Washington, D.C. The town was eventually annexed by the City of New Carrollton in 1967.
Geography
Carrollton is located in Prince George’s County, Maryland, approximately 15 miles east of Washington, D.C. The town is situated on the banks of the Anacostia River and is bordered by the cities of Bladensburg, Hyattsville, and New Carrollton.
The town has a total area of 1.2 square miles, all of which is land. The town is located at an elevation of approximately 100 feet above sea level.
Economy
Carrollton’s economy is largely based on government and service-related industries. The town is home to several government agencies, including the National Security Agency, the Department of Homeland Security, and the Federal Bureau of Investigation.
The town is also home to several large employers, including the University of Maryland Medical Center, the University of Maryland College Park, and the National Institutes of Health.
Demographics
As of the 2010 census, Carrollton had a population of 8,945. The racial makeup of the town was 57.3% African American, 33.2% White, 4.2% Asian, 0.7% Native American, and 4.6% from other races.
The median household income in Carrollton was $50,945, and the median family income was $60,945. The per capita income in the town was $25,945.
Conclusion
Carrollton, Maryland is a small town located in Prince George’s County, Maryland, United States. It is situated approximately 15 miles east of Washington, D.C. and is part of the Washington metropolitan area. The town was founded in 1873 and is named after Charles Carroll of Carrollton, a signer of the Declaration of Independence. The town’s economy is largely based on government and service-related industries, and the population is largely African American. The town has a median household income of $50,945 and a median family income of $60,945.
Common Questions
What is Per Capita Income in New Carrollton?
Per Capita income in New Carrollton is $33,170.
What is the Median Family Income in New Carrollton?
Median Family Income in New Carrollton is $99,375.
What is the Median Household income in New Carrollton?
Median Household Income in New Carrollton is $76,386.
What is Income or Wage Gap in New Carrollton?
Income or Wage Gap in New Carrollton is 8.7%.
Women in New Carrollton earn 91.3 cents for every dollar earned by a man.
What is Inequality or Gini Index in New Carrollton?
Inequality or Gini Index in New Carrollton is 0.39.
What is the Total Population of New Carrollton?
Total Population of New Carrollton is 13,580.
What is the Total Male Population of New Carrollton?
Total Male Population of New Carrollton is 6,633.
What is the Total Female Population of New Carrollton?
Total Female Population of New Carrollton is 6,947.
What is the Ratio of Males per 100 Females in New Carrollton?
There are 95.48 Males per 100 Females in New Carrollton.
What is the Ratio of Females per 100 Males in New Carrollton?
There are 104.73 Females per 100 Males in New Carrollton.
What is the Median Population Age in New Carrollton?
Median Population Age in New Carrollton is 34.8 Years.
What is the Average Family Size in New Carrollton
Average Family Size in New Carrollton is 3.7 People.
What is the Average Household Size in New Carrollton
Average Household Size in New Carrollton is 2.9 People.
How Large is the Labor Force in New Carrollton?
There are 7,714 People in the Labor Forcein in New Carrollton.
What is the Percentage of People in the Labor Force in New Carrollton?
73.0% of People are in the Labor Force in New Carrollton.
What is the Unemployment Rate in New Carrollton?
Unemployment Rate in New Carrollton is 10.9%.