Cities with the Highest Percentage of Kenyan Population in Maryland
RELATED REPORTS & OPTIONS
Kenyan
Maryland
Compare Cities
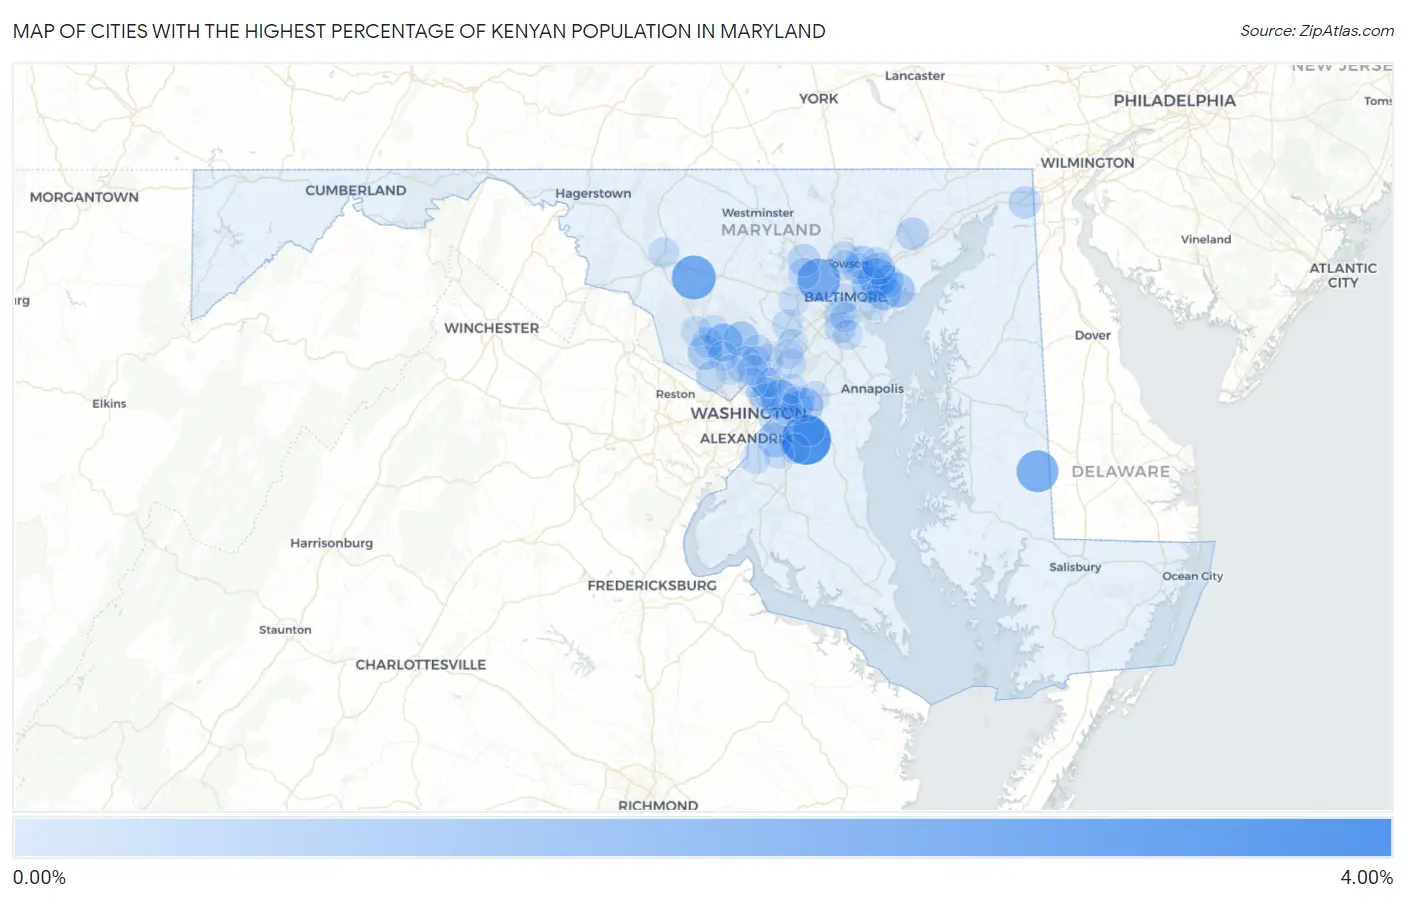
Map of Cities with the Highest Percentage of Kenyan Population in Maryland
0.00%
4.00%
Cities with the Highest Percentage of Kenyan Population in Maryland
| City | Kenyan | vs State | vs National | |
| 1. | Queensland | 3.29% | 0.096%(+3.20)#1 | 0.031%(+3.26)#14 |
| 2. | Monrovia | 2.32% | 0.096%(+2.22)#2 | 0.031%(+2.28)#24 |
| 3. | Lochearn | 2.13% | 0.096%(+2.03)#3 | 0.031%(+2.10)#31 |
| 4. | Federalsburg | 1.95% | 0.096%(+1.86)#4 | 0.031%(+1.92)#35 |
| 5. | Abingdon | 1.55% | 0.096%(+1.45)#5 | 0.031%(+1.51)#44 |
| 6. | Rossville | 1.37% | 0.096%(+1.28)#6 | 0.031%(+1.34)#49 |
| 7. | Landover Hills | 1.27% | 0.096%(+1.18)#7 | 0.031%(+1.24)#53 |
| 8. | Redland | 1.25% | 0.096%(+1.16)#8 | 0.031%(+1.22)#54 |
| 9. | Rosedale | 1.04% | 0.096%(+0.946)#9 | 0.031%(+1.01)#73 |
| 10. | Essex | 0.84% | 0.096%(+0.741)#10 | 0.031%(+0.806)#91 |
| 11. | Bowleys Quarters | 0.82% | 0.096%(+0.719)#11 | 0.031%(+0.784)#94 |
| 12. | Olney | 0.80% | 0.096%(+0.706)#12 | 0.031%(+0.771)#97 |
| 13. | North Potomac | 0.78% | 0.096%(+0.681)#13 | 0.031%(+0.746)#101 |
| 14. | Camp Springs | 0.75% | 0.096%(+0.656)#14 | 0.031%(+0.721)#105 |
| 15. | Woodmore | 0.69% | 0.096%(+0.589)#15 | 0.031%(+0.654)#119 |
| 16. | Carney | 0.55% | 0.096%(+0.452)#16 | 0.031%(+0.517)#137 |
| 17. | Middle River | 0.49% | 0.096%(+0.392)#17 | 0.031%(+0.457)#150 |
| 18. | Lake Arbor | 0.46% | 0.096%(+0.367)#18 | 0.031%(+0.432)#157 |
| 19. | Bel Air South | 0.46% | 0.096%(+0.364)#19 | 0.031%(+0.429)#161 |
| 20. | Mitchellville | 0.45% | 0.096%(+0.350)#20 | 0.031%(+0.415)#167 |
| 21. | Elkton | 0.41% | 0.096%(+0.314)#21 | 0.031%(+0.379)#186 |
| 22. | Owings Mills | 0.40% | 0.096%(+0.307)#22 | 0.031%(+0.372)#191 |
| 23. | Marlboro Village | 0.39% | 0.096%(+0.298)#23 | 0.031%(+0.363)#193 |
| 24. | White Marsh | 0.37% | 0.096%(+0.271)#24 | 0.031%(+0.336)#206 |
| 25. | Coral Hills | 0.36% | 0.096%(+0.265)#25 | 0.031%(+0.330)#209 |
| 26. | Summerfield | 0.35% | 0.096%(+0.249)#26 | 0.031%(+0.314)#216 |
| 27. | Fairland | 0.33% | 0.096%(+0.238)#27 | 0.031%(+0.303)#224 |
| 28. | Chillum | 0.33% | 0.096%(+0.232)#28 | 0.031%(+0.297)#231 |
| 29. | Lutherville | 0.30% | 0.096%(+0.207)#29 | 0.031%(+0.272)#257 |
| 30. | Ferndale | 0.29% | 0.096%(+0.198)#30 | 0.031%(+0.263)#265 |
| 31. | Randallstown | 0.26% | 0.096%(+0.163)#31 | 0.031%(+0.228)#295 |
| 32. | Wheaton | 0.24% | 0.096%(+0.146)#32 | 0.031%(+0.211)#307 |
| 33. | Baltimore Highlands | 0.23% | 0.096%(+0.138)#33 | 0.031%(+0.203)#315 |
| 34. | Parkville | 0.23% | 0.096%(+0.130)#34 | 0.031%(+0.195)#323 |
| 35. | Perry Hall | 0.20% | 0.096%(+0.102)#35 | 0.031%(+0.167)#350 |
| 36. | Flower Hill | 0.20% | 0.096%(+0.102)#36 | 0.031%(+0.167)#351 |
| 37. | Mount Rainier | 0.19% | 0.096%(+0.097)#37 | 0.031%(+0.162)#355 |
| 38. | Cloverly | 0.17% | 0.096%(+0.074)#38 | 0.031%(+0.139)#382 |
| 39. | Columbia | 0.16% | 0.096%(+0.067)#39 | 0.031%(+0.132)#390 |
| 40. | Gaithersburg | 0.16% | 0.096%(+0.060)#40 | 0.031%(+0.125)#399 |
| 41. | Woodlawn Cdp Baltimore County | 0.16% | 0.096%(+0.060)#41 | 0.031%(+0.125)#400 |
| 42. | Frederick | 0.15% | 0.096%(+0.052)#42 | 0.031%(+0.117)#422 |
| 43. | Adelphi | 0.15% | 0.096%(+0.051)#43 | 0.031%(+0.116)#424 |
| 44. | Potomac | 0.14% | 0.096%(+0.041)#44 | 0.031%(+0.106)#448 |
| 45. | Glenmont | 0.12% | 0.096%(+0.024)#45 | 0.031%(+0.089)#483 |
| 46. | Dundalk | 0.11% | 0.096%(+0.017)#46 | 0.031%(+0.082)#496 |
| 47. | Fort Washington | 0.11% | 0.096%(+0.012)#47 | 0.031%(+0.077)#509 |
| 48. | Germantown | 0.094% | 0.096%(-0.002)#48 | 0.031%(+0.063)#537 |
| 49. | Montgomery Village | 0.092% | 0.096%(-0.004)#49 | 0.031%(+0.061)#545 |
| 50. | Hyattsville | 0.091% | 0.096%(-0.005)#50 | 0.031%(+0.060)#549 |
| 51. | Colesville | 0.088% | 0.096%(-0.009)#51 | 0.031%(+0.056)#557 |
| 52. | Kemp Mill | 0.071% | 0.096%(-0.025)#52 | 0.031%(+0.040)#602 |
| 53. | Baltimore | 0.068% | 0.096%(-0.028)#53 | 0.031%(+0.037)#609 |
| 54. | Ellicott City | 0.067% | 0.096%(-0.030)#54 | 0.031%(+0.035)#616 |
| 55. | Rosaryville | 0.067% | 0.096%(-0.030)#55 | 0.031%(+0.035)#617 |
| 56. | North Laurel | 0.066% | 0.096%(-0.031)#56 | 0.031%(+0.034)#618 |
| 57. | Towson | 0.062% | 0.096%(-0.034)#57 | 0.031%(+0.031)#628 |
| 58. | College Park | 0.038% | 0.096%(-0.059)#58 | 0.031%(+0.006)#755 |
| 59. | Seabrook | 0.036% | 0.096%(-0.060)#59 | 0.031%(+0.005)#770 |
| 60. | Glen Burnie | 0.035% | 0.096%(-0.061)#60 | 0.031%(+0.004)#777 |
| 61. | Brooklyn Park | 0.031% | 0.096%(-0.065)#61 | 0.031%(+0.000)#794 |
| 62. | Bowie | 0.031% | 0.096%(-0.065)#62 | 0.031%(-0.000)#795 |
| 63. | Clinton | 0.025% | 0.096%(-0.071)#63 | 0.031%(-0.006)#844 |
| 64. | South Laurel | 0.025% | 0.096%(-0.072)#64 | 0.031%(-0.007)#848 |
| 65. | Silver Spring | 0.017% | 0.096%(-0.079)#65 | 0.031%(-0.014)#904 |
| 66. | Rockville | 0.016% | 0.096%(-0.080)#66 | 0.031%(-0.015)#911 |
| 67. | North Bethesda | 0.016% | 0.096%(-0.080)#67 | 0.031%(-0.015)#912 |
| 68. | Green Valley | 0.0077% | 0.096%(-0.089)#68 | 0.031%(-0.024)#997 |
| 69. | Laurel | 0.0068% | 0.096%(-0.090)#69 | 0.031%(-0.025)#1,003 |
Common Questions
What are the Top 10 Cities with the Highest Percentage of Kenyan Population in Maryland?
Top 10 Cities with the Highest Percentage of Kenyan Population in Maryland are:
#1
3.29%
#2
2.32%
#3
2.13%
#4
1.95%
#5
1.37%
#6
1.27%
#7
1.25%
#8
1.04%
#9
0.84%
#10
0.82%
What city has the Highest Percentage of Kenyan Population in Maryland?
Queensland has the Highest Percentage of Kenyan Population in Maryland with 3.29%.
What is the Percentage of Kenyan Population in the State of Maryland?
Percentage of Kenyan Population in Maryland is 0.096%.
What is the Percentage of Kenyan Population in the United States?
Percentage of Kenyan Population in the United States is 0.031%.