Zip Codes with the Highest Percentage of Population Employed in Security & Protection in Glen Burnie, MD
RELATED REPORTS & OPTIONS
Security & Protection
Glen Burnie
Compare Zip Codes
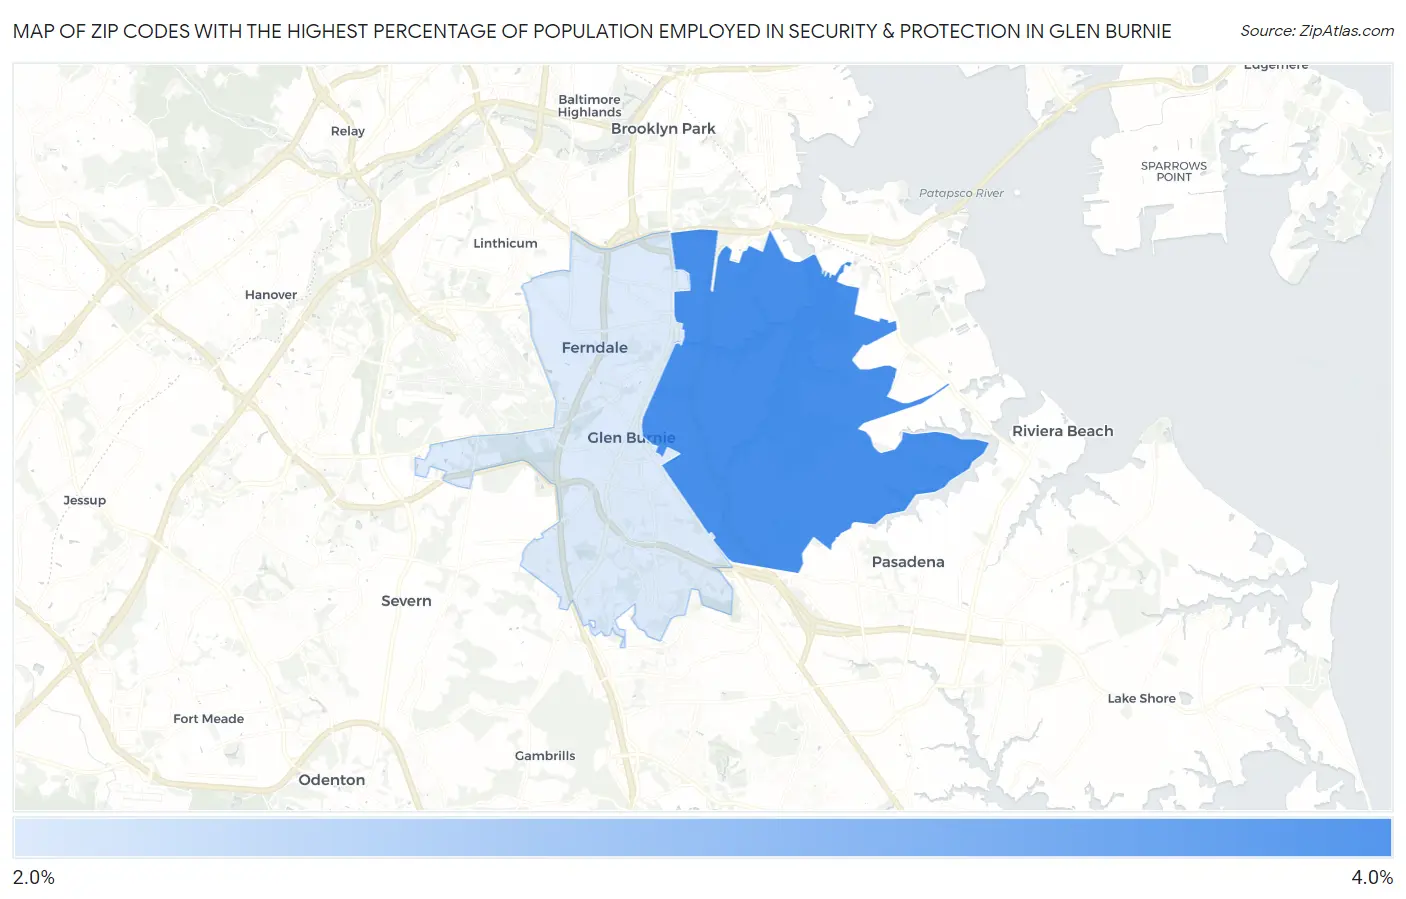
Map of Zip Codes with the Highest Percentage of Population Employed in Security & Protection in Glen Burnie
2.4%
3.5%
Zip Codes with the Highest Percentage of Population Employed in Security & Protection in Glen Burnie, MD
| Zip Code | % Employed | vs State | vs National | |
| 1. | 21060 | 3.5% | 2.8%(+0.752)#127 | 2.1%(+1.40)#5,539 |
| 2. | 21061 | 2.4% | 2.8%(-0.417)#214 | 2.1%(+0.233)#10,148 |
1
Common Questions
What are the Top Zip Codes with the Highest Percentage of Population Employed in Security & Protection in Glen Burnie, MD?
Top Zip Codes with the Highest Percentage of Population Employed in Security & Protection in Glen Burnie, MD are:
What zip code has the Highest Percentage of Population Employed in Security & Protection in Glen Burnie, MD?
21060 has the Highest Percentage of Population Employed in Security & Protection in Glen Burnie, MD with 3.5%.
What is the Percentage of Population Employed in Security & Protection in Glen Burnie, MD?
Percentage of Population Employed in Security & Protection in Glen Burnie is 3.5%.
What is the Percentage of Population Employed in Security & Protection in Maryland?
Percentage of Population Employed in Security & Protection in Maryland is 2.8%.
What is the Percentage of Population Employed in Security & Protection in the United States?
Percentage of Population Employed in Security & Protection in the United States is 2.1%.