Laytonsville, MD Map & Demographics
Laytonsville Map
Laytonsville Overview
$76,757
PER CAPITA INCOME
$227,500
AVG FAMILY INCOME
$200,625
AVG HOUSEHOLD INCOME
28.6%
WAGE / INCOME GAP [ % ]
71.4¢/ $1
WAGE / INCOME GAP [ $ ]
0.41
INEQUALITY / GINI INDEX
736
TOTAL POPULATION
393
MALE POPULATION
343
FEMALE POPULATION
114.58
MALES / 100 FEMALES
87.28
FEMALES / 100 MALES
43.4
MEDIAN AGE
3.5
AVG FAMILY SIZE
3.0
AVG HOUSEHOLD SIZE
385
LABOR FORCE [ PEOPLE ]
69.1%
PERCENT IN LABOR FORCE
3.7%
UNEMPLOYMENT RATE
Laytonsville Area Codes
Income in Laytonsville
Income Overview in Laytonsville
Per Capita Income in Laytonsville is $76,757, while median incomes of families and households are $227,500 and $200,625 respectively.
| Characteristic | Number | Measure |
| Per Capita Income | 736 | $76,757 |
| Median Family Income | 198 | $227,500 |
| Mean Family Income | 198 | $259,599 |
| Median Household Income | 242 | $200,625 |
| Mean Household Income | 242 | $236,845 |
| Income Deficit | 198 | $0 |
| Wage / Income Gap (%) | 736 | 28.62% |
| Wage / Income Gap ($) | 736 | 71.38¢ per $1 |
| Gini / Inequality Index | 736 | 0.41 |
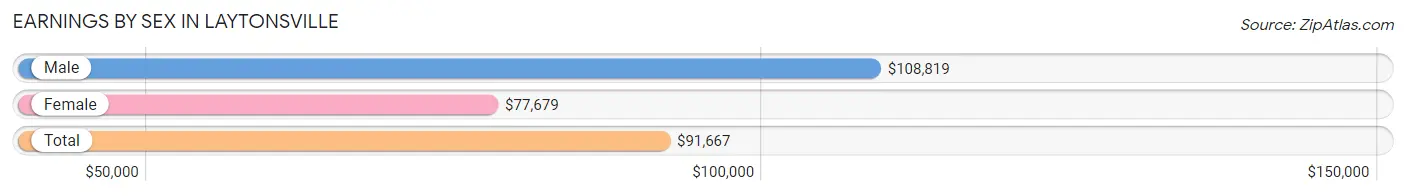
Earnings by Sex in Laytonsville
Average Earnings in Laytonsville are $91,667, $108,819 for men and $77,679 for women, a difference of 28.6%.
| Sex | Number | Average Earnings |
| Male | 233 (58.3%) | $108,819 |
| Female | 167 (41.7%) | $77,679 |
| Total | 400 (100.0%) | $91,667 |
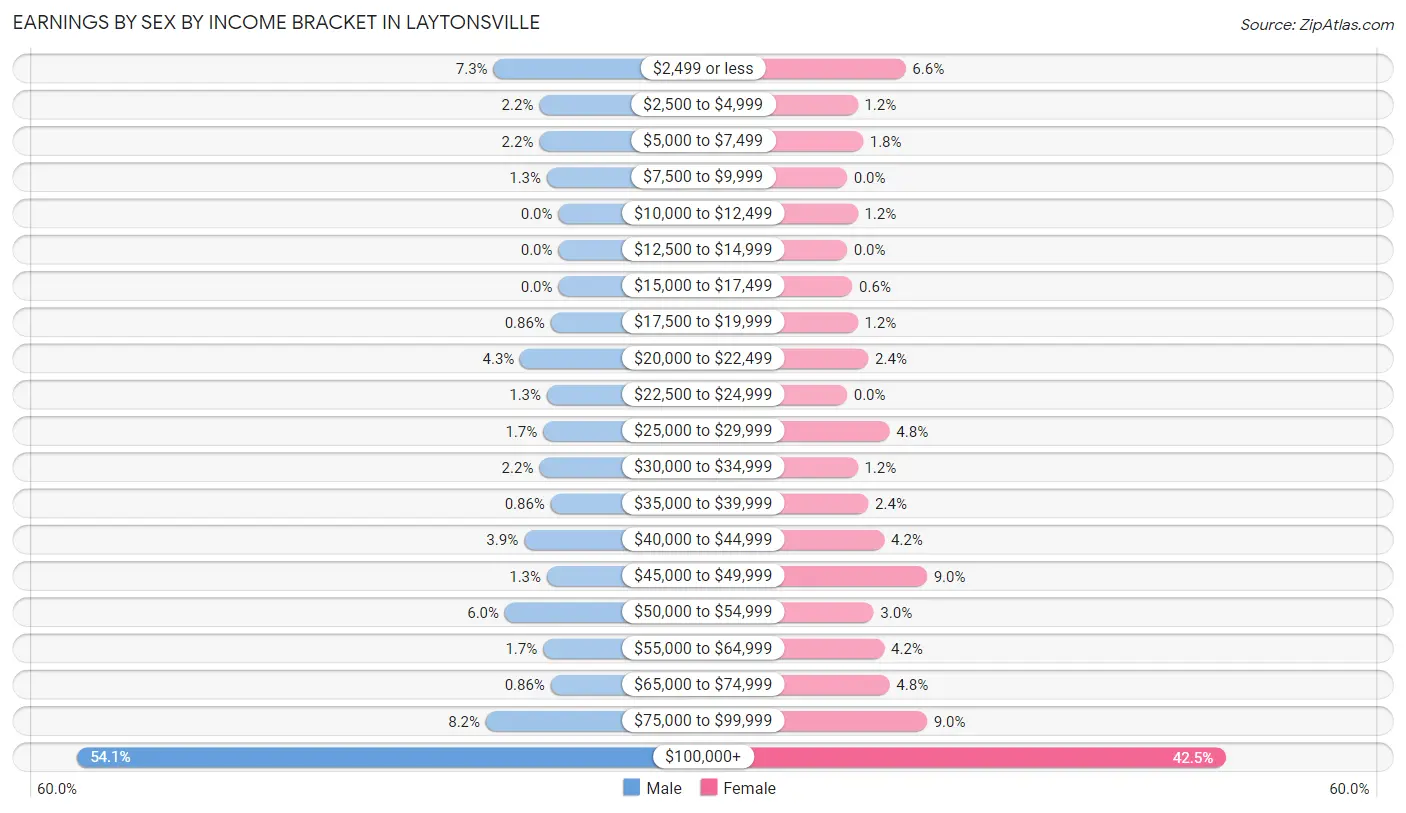
Earnings by Sex by Income Bracket in Laytonsville
The most common earnings brackets in Laytonsville are $100,000+ for men (126 | 54.1%) and $100,000+ for women (71 | 42.5%).
| Income | Male | Female |
| $2,499 or less | 17 (7.3%) | 11 (6.6%) |
| $2,500 to $4,999 | 5 (2.1%) | 2 (1.2%) |
| $5,000 to $7,499 | 5 (2.1%) | 3 (1.8%) |
| $7,500 to $9,999 | 3 (1.3%) | 0 (0.0%) |
| $10,000 to $12,499 | 0 (0.0%) | 2 (1.2%) |
| $12,500 to $14,999 | 0 (0.0%) | 0 (0.0%) |
| $15,000 to $17,499 | 0 (0.0%) | 1 (0.6%) |
| $17,500 to $19,999 | 2 (0.9%) | 2 (1.2%) |
| $20,000 to $22,499 | 10 (4.3%) | 4 (2.4%) |
| $22,500 to $24,999 | 3 (1.3%) | 0 (0.0%) |
| $25,000 to $29,999 | 4 (1.7%) | 8 (4.8%) |
| $30,000 to $34,999 | 5 (2.1%) | 2 (1.2%) |
| $35,000 to $39,999 | 2 (0.9%) | 4 (2.4%) |
| $40,000 to $44,999 | 9 (3.9%) | 7 (4.2%) |
| $45,000 to $49,999 | 3 (1.3%) | 15 (9.0%) |
| $50,000 to $54,999 | 14 (6.0%) | 5 (3.0%) |
| $55,000 to $64,999 | 4 (1.7%) | 7 (4.2%) |
| $65,000 to $74,999 | 2 (0.9%) | 8 (4.8%) |
| $75,000 to $99,999 | 19 (8.2%) | 15 (9.0%) |
| $100,000+ | 126 (54.1%) | 71 (42.5%) |
| Total | 233 (100.0%) | 167 (100.0%) |
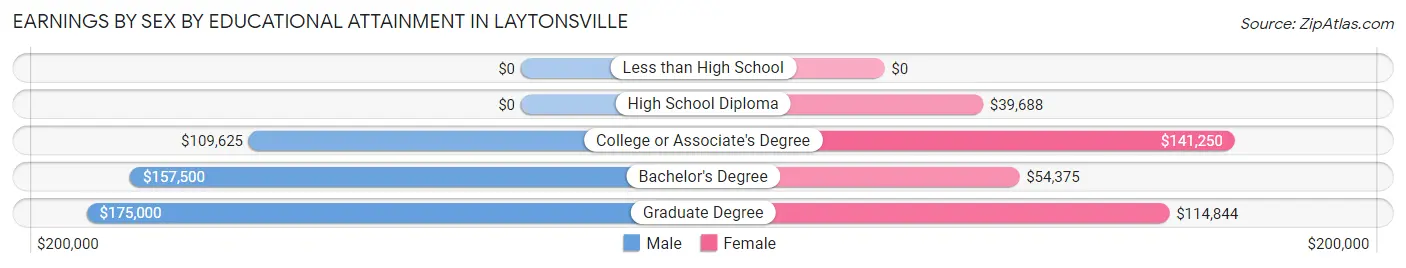
Earnings by Sex by Educational Attainment in Laytonsville
Average earnings in Laytonsville are $118,750 for men and $79,286 for women, a difference of 33.2%. Men with an educational attainment of graduate degree enjoy the highest average annual earnings of $175,000, while those with college or associate's degree education earn the least with $109,625. Women with an educational attainment of college or associate's degree earn the most with the average annual earnings of $141,250, while those with high school diploma education have the smallest earnings of $39,688.
| Educational Attainment | Male Income | Female Income |
| Less than High School | - | - |
| High School Diploma | - | - |
| College or Associate's Degree | $109,625 | $141,250 |
| Bachelor's Degree | $157,500 | $54,375 |
| Graduate Degree | $175,000 | $114,844 |
| Total | $118,750 | $79,286 |
Family Income in Laytonsville
Family Income Brackets in Laytonsville
According to the Laytonsville family income data, there are 115 families falling into the $200,000+ income range, which is the most common income bracket and makes up 58.1% of all families.
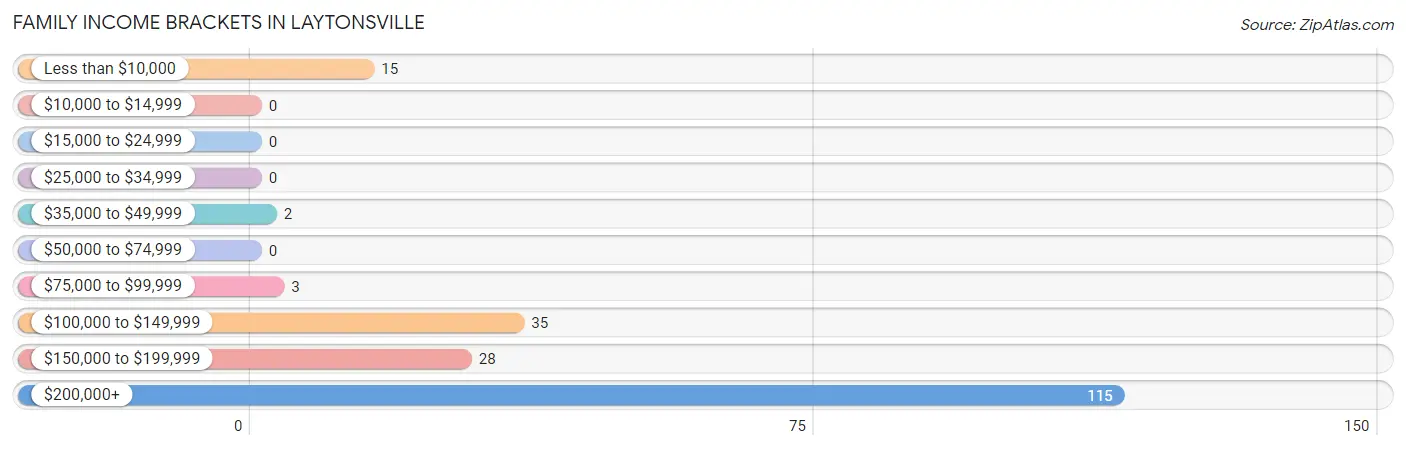
| Income Bracket | # Families | % Families |
| Less than $10,000 | 15 | 7.6% |
| $10,000 to $14,999 | 0 | 0.0% |
| $15,000 to $24,999 | 0 | 0.0% |
| $25,000 to $34,999 | 0 | 0.0% |
| $35,000 to $49,999 | 2 | 1.0% |
| $50,000 to $74,999 | 0 | 0.0% |
| $75,000 to $99,999 | 3 | 1.5% |
| $100,000 to $149,999 | 35 | 17.7% |
| $150,000 to $199,999 | 28 | 14.1% |
| $200,000+ | 115 | 58.1% |
Family Income by Famaliy Size in Laytonsville
3-person families (52 | 26.3%) account for the highest median family income in Laytonsville with $250,001 per family, while 3-person families (52 | 26.3%) have the highest median income of $83,334 per family member.
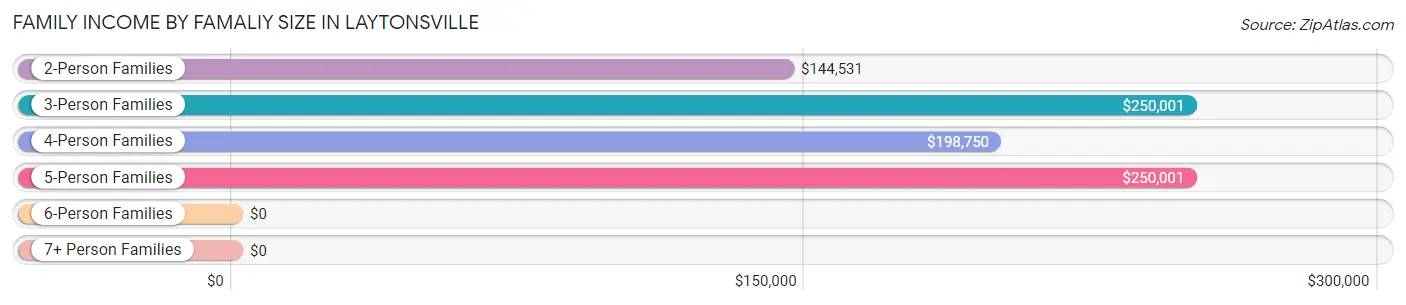
| Income Bracket | # Families | Median Income |
| 2-Person Families | 65 (32.8%) | $144,531 |
| 3-Person Families | 52 (26.3%) | $250,001 |
| 4-Person Families | 37 (18.7%) | $198,750 |
| 5-Person Families | 19 (9.6%) | $250,001 |
| 6-Person Families | 25 (12.6%) | $0 |
| 7+ Person Families | 0 (0.0%) | $0 |
| Total | 198 (100.0%) | $227,500 |
Family Income by Number of Earners in Laytonsville
The median family income in Laytonsville is $227,500, with families comprising 2 earners (122) having the highest median family income of $244,167, while families with no earners (19) have the lowest median family income of $143,958, accounting for 61.6% and 9.6% of families, respectively.
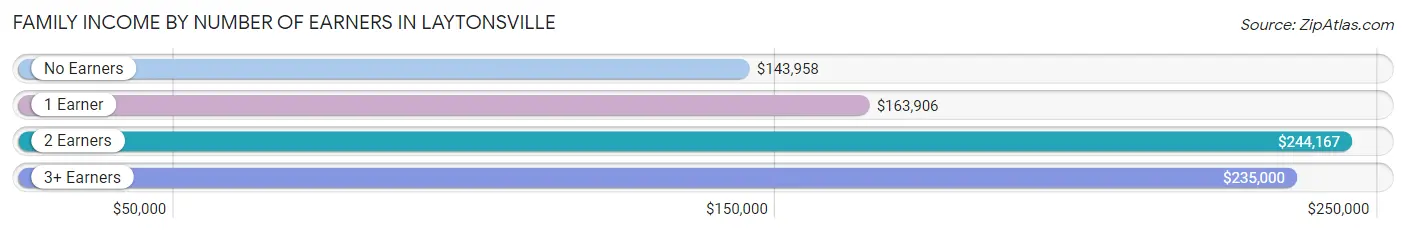
| Number of Earners | # Families | Median Income |
| No Earners | 19 (9.6%) | $143,958 |
| 1 Earner | 27 (13.6%) | $163,906 |
| 2 Earners | 122 (61.6%) | $244,167 |
| 3+ Earners | 30 (15.1%) | $235,000 |
| Total | 198 (100.0%) | $227,500 |
Household Income in Laytonsville
Household Income Brackets in Laytonsville
With 122 households falling in the category, the $200,000+ income range is the most frequent in Laytonsville, accounting for 50.4% of all households.
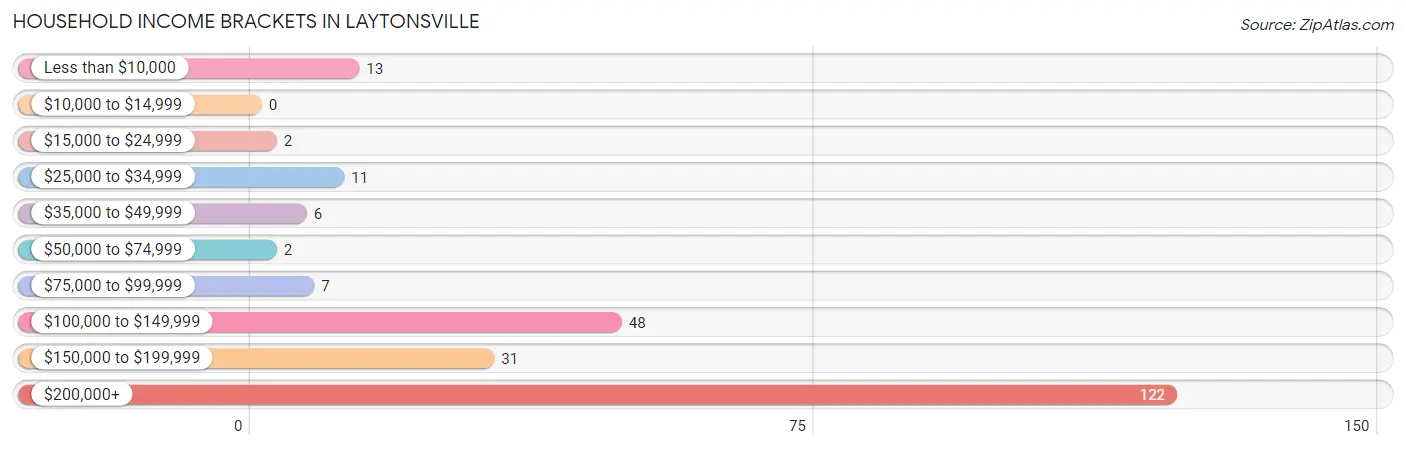
| Income Bracket | # Households | % Households |
| Less than $10,000 | 13 | 5.4% |
| $10,000 to $14,999 | 0 | 0.0% |
| $15,000 to $24,999 | 2 | 0.8% |
| $25,000 to $34,999 | 11 | 4.5% |
| $35,000 to $49,999 | 6 | 2.5% |
| $50,000 to $74,999 | 2 | 0.8% |
| $75,000 to $99,999 | 7 | 2.9% |
| $100,000 to $149,999 | 48 | 19.8% |
| $150,000 to $199,999 | 31 | 12.8% |
| $200,000+ | 122 | 50.4% |
Household Income by Householder Age in Laytonsville
The median household income in Laytonsville is $200,625, with the highest median household income of $250,001 found in the 45 to 64 years age bracket for the primary householder. A total of 122 households (50.4%) fall into this category.
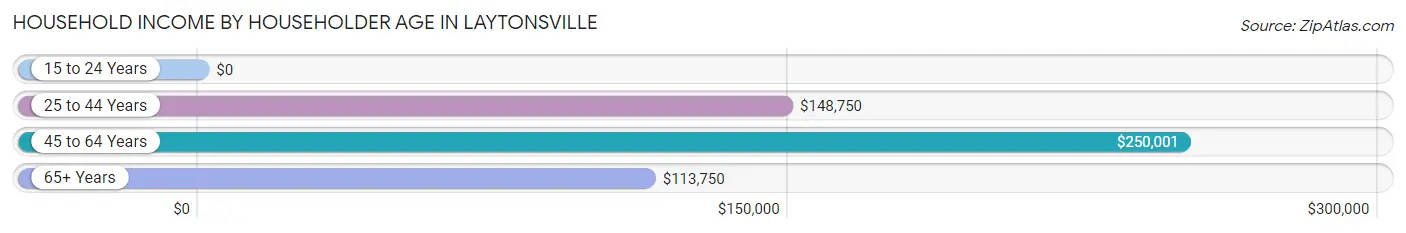
| Income Bracket | # Households | Median Income |
| 15 to 24 Years | 0 (0.0%) | $0 |
| 25 to 44 Years | 58 (24.0%) | $148,750 |
| 45 to 64 Years | 122 (50.4%) | $250,001 |
| 65+ Years | 62 (25.6%) | $113,750 |
| Total | 242 (100.0%) | $200,625 |
Poverty in Laytonsville
Income Below Poverty by Sex and Age in Laytonsville
With 12.0% poverty level for males and 7.3% for females among the residents of Laytonsville, 12 to 14 year old males and 35 to 44 year old females are the most vulnerable to poverty, with 10 males (40.0%) and 11 females (26.8%) in their respective age groups living below the poverty level.
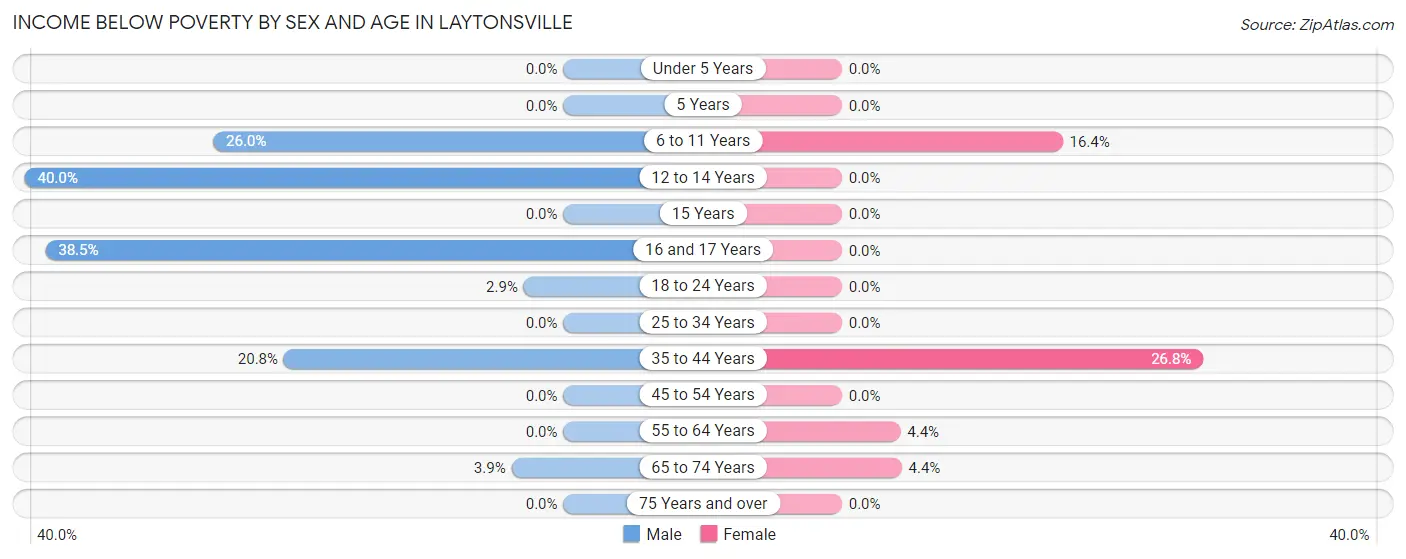
| Age Bracket | Male | Female |
| Under 5 Years | 0 (0.0%) | 0 (0.0%) |
| 5 Years | 0 (0.0%) | 0 (0.0%) |
| 6 to 11 Years | 13 (26.0%) | 10 (16.4%) |
| 12 to 14 Years | 10 (40.0%) | 0 (0.0%) |
| 15 Years | 0 (0.0%) | 0 (0.0%) |
| 16 and 17 Years | 10 (38.5%) | 0 (0.0%) |
| 18 to 24 Years | 1 (2.9%) | 0 (0.0%) |
| 25 to 34 Years | 0 (0.0%) | 0 (0.0%) |
| 35 to 44 Years | 11 (20.7%) | 11 (26.8%) |
| 45 to 54 Years | 0 (0.0%) | 0 (0.0%) |
| 55 to 64 Years | 0 (0.0%) | 2 (4.3%) |
| 65 to 74 Years | 2 (3.8%) | 2 (4.4%) |
| 75 Years and over | 0 (0.0%) | 0 (0.0%) |
| Total | 47 (12.0%) | 25 (7.3%) |
Income Above Poverty by Sex and Age in Laytonsville
According to the poverty statistics in Laytonsville, males aged under 5 years and females aged under 5 years are the age groups that are most secure financially, with 100.0% of males and 100.0% of females in these age groups living above the poverty line.
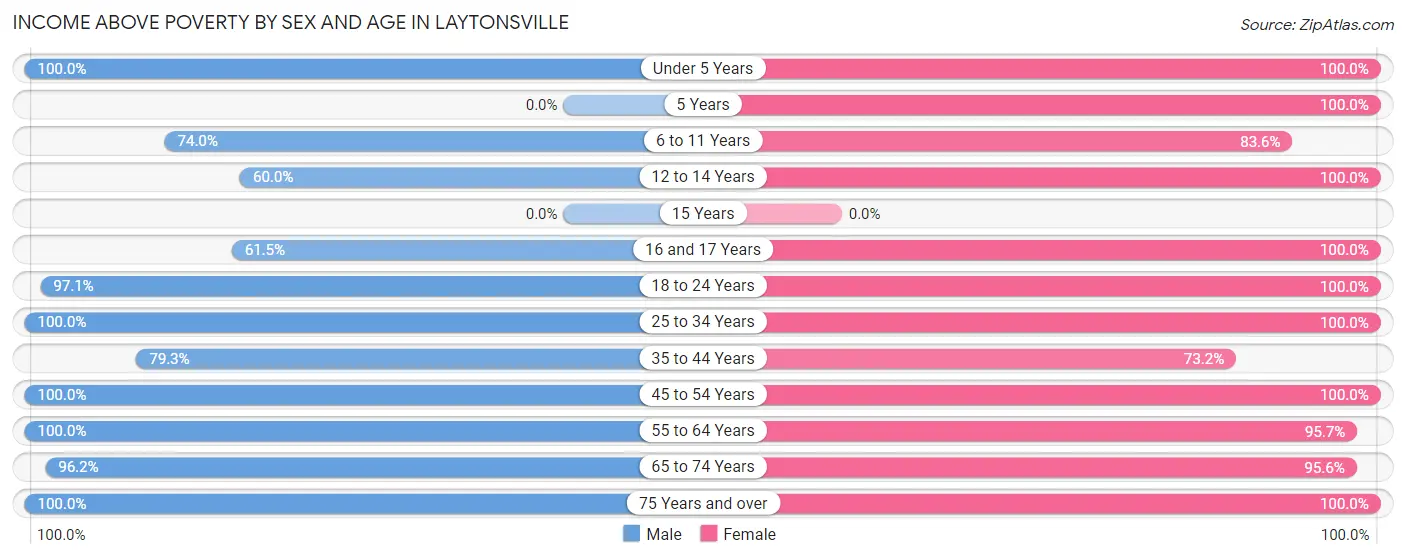
| Age Bracket | Male | Female |
| Under 5 Years | 5 (100.0%) | 20 (100.0%) |
| 5 Years | 0 (0.0%) | 2 (100.0%) |
| 6 to 11 Years | 37 (74.0%) | 51 (83.6%) |
| 12 to 14 Years | 15 (60.0%) | 16 (100.0%) |
| 15 Years | 0 (0.0%) | 0 (0.0%) |
| 16 and 17 Years | 16 (61.5%) | 15 (100.0%) |
| 18 to 24 Years | 33 (97.1%) | 9 (100.0%) |
| 25 to 34 Years | 11 (100.0%) | 16 (100.0%) |
| 35 to 44 Years | 42 (79.2%) | 30 (73.2%) |
| 45 to 54 Years | 75 (100.0%) | 66 (100.0%) |
| 55 to 64 Years | 54 (100.0%) | 44 (95.7%) |
| 65 to 74 Years | 50 (96.2%) | 43 (95.6%) |
| 75 Years and over | 8 (100.0%) | 6 (100.0%) |
| Total | 346 (88.0%) | 318 (92.7%) |
Income Below Poverty Among Married-Couple Families in Laytonsville
The poverty statistics for married-couple families in Laytonsville show that 7.2% or 13 of the total 181 families live below the poverty line. Families with 3 or 4 children have the highest poverty rate of 44.0%, comprising of 11 families. On the other hand, families with 1 or 2 children have the lowest poverty rate of 0.0%, which includes 0 families.
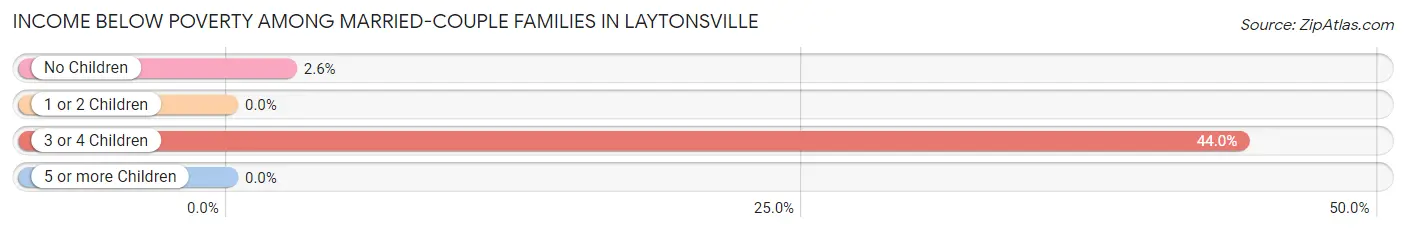
| Children | Above Poverty | Below Poverty |
| No Children | 76 (97.4%) | 2 (2.6%) |
| 1 or 2 Children | 78 (100.0%) | 0 (0.0%) |
| 3 or 4 Children | 14 (56.0%) | 11 (44.0%) |
| 5 or more Children | 0 (0.0%) | 0 (0.0%) |
| Total | 168 (92.8%) | 13 (7.2%) |
Income Below Poverty Among Single-Parent Households in Laytonsville
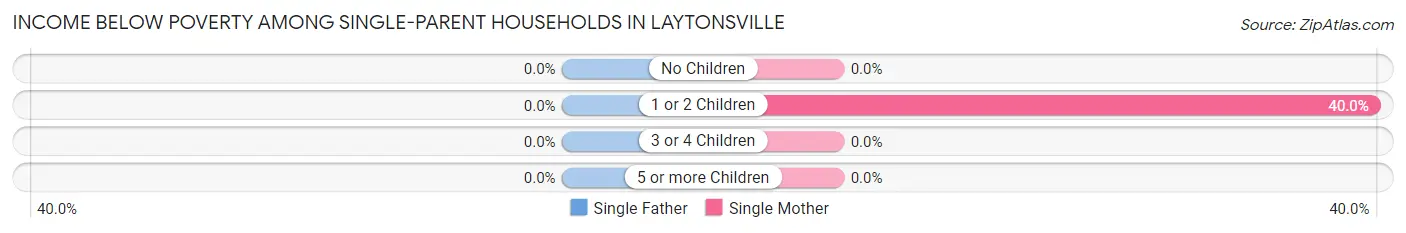
| Children | Single Father | Single Mother |
| No Children | 0 (0.0%) | 0 (0.0%) |
| 1 or 2 Children | 0 (0.0%) | 2 (40.0%) |
| 3 or 4 Children | 0 (0.0%) | 0 (0.0%) |
| 5 or more Children | 0 (0.0%) | 0 (0.0%) |
| Total | 0 (0.0%) | 2 (40.0%) |
Income Below Poverty Among Married-Couple vs Single-Parent Households in Laytonsville
The poverty data for Laytonsville shows that 13 of the married-couple family households (7.2%) and 2 of the single-parent households (11.8%) are living below the poverty level. Within the married-couple family households, those with 3 or 4 children have the highest poverty rate, with 11 households (44.0%) falling below the poverty line. Among the single-parent households, those with 1 or 2 children have the highest poverty rate, with 2 household (40.0%) living below poverty.
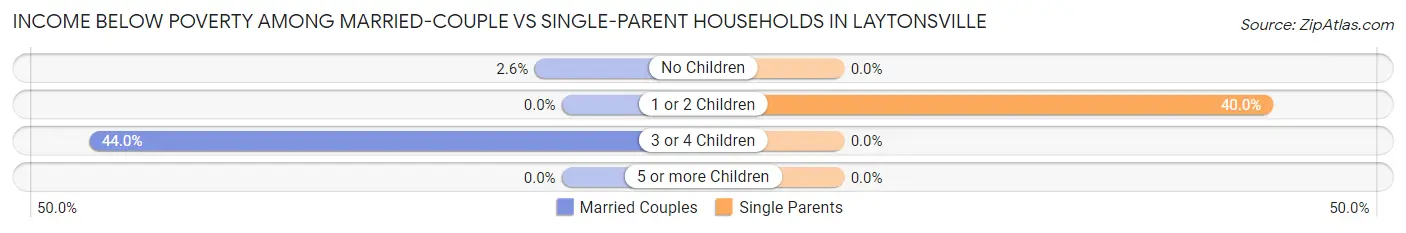
| Children | Married-Couple Families | Single-Parent Households |
| No Children | 2 (2.6%) | 0 (0.0%) |
| 1 or 2 Children | 0 (0.0%) | 2 (40.0%) |
| 3 or 4 Children | 11 (44.0%) | 0 (0.0%) |
| 5 or more Children | 0 (0.0%) | 0 (0.0%) |
| Total | 13 (7.2%) | 2 (11.8%) |
Race in Laytonsville
The most populous races in Laytonsville are White / Caucasian (409 | 55.6%), Asian (127 | 17.3%), and Black / African American (119 | 16.2%).
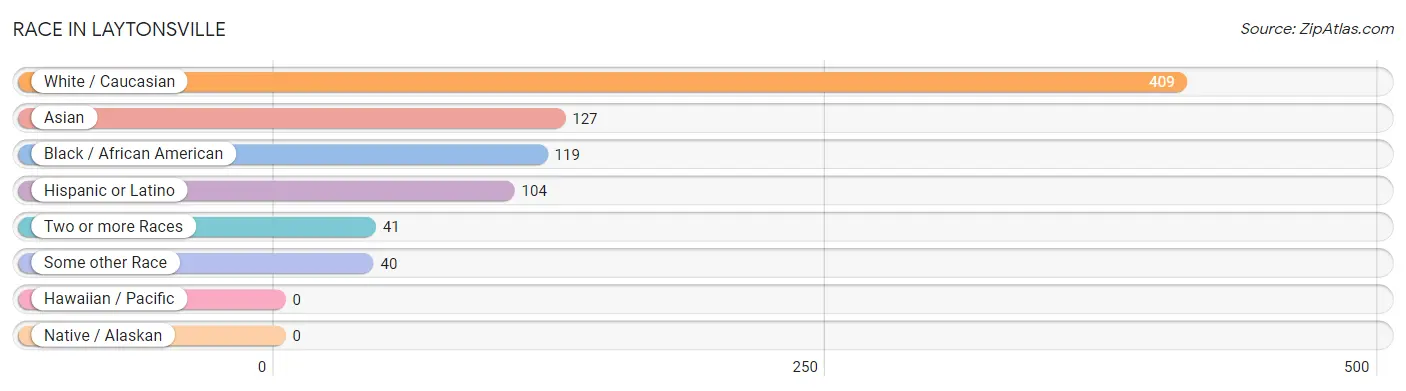
| Race | # Population | % Population |
| Asian | 127 | 17.3% |
| Black / African American | 119 | 16.2% |
| Hawaiian / Pacific | 0 | 0.0% |
| Hispanic or Latino | 104 | 14.1% |
| Native / Alaskan | 0 | 0.0% |
| White / Caucasian | 409 | 55.6% |
| Two or more Races | 41 | 5.6% |
| Some other Race | 40 | 5.4% |
| Total | 736 | 100.0% |
Ancestry in Laytonsville
The most populous ancestries reported in Laytonsville are German (92 | 12.5%), Italian (66 | 9.0%), Sri Lankan (63 | 8.6%), Irish (59 | 8.0%), and South American (55 | 7.5%), together accounting for 45.5% of all Laytonsville residents.
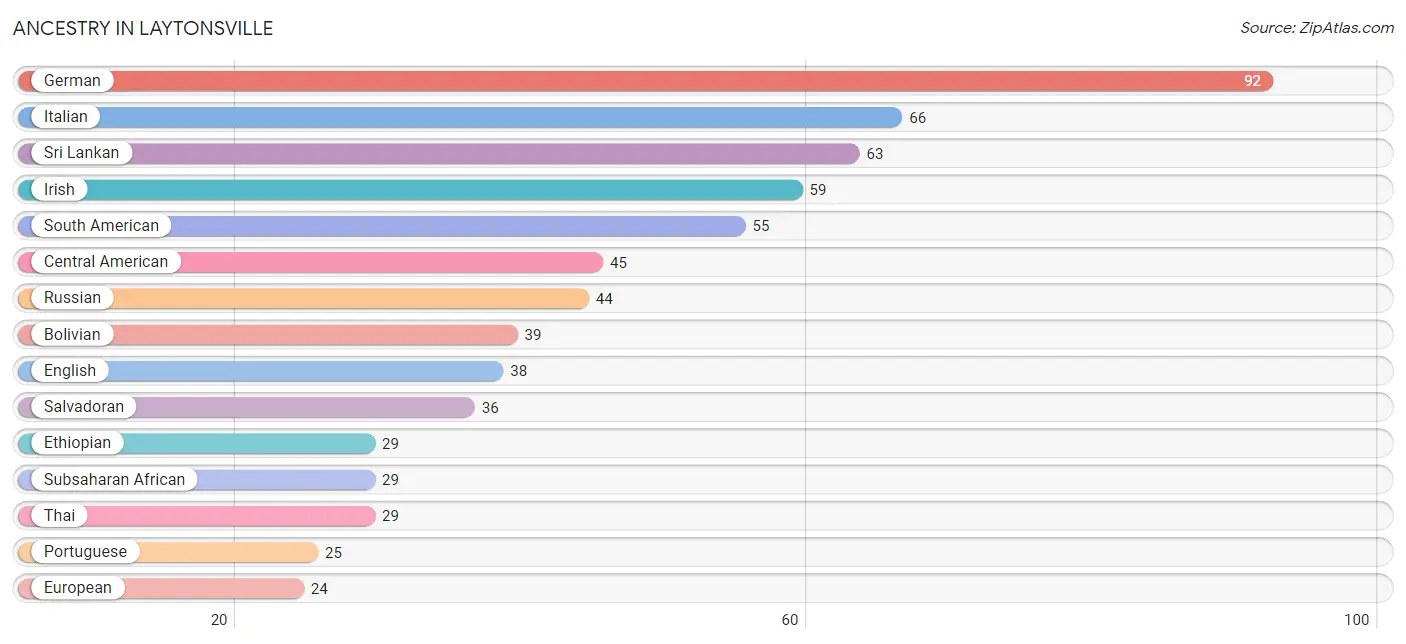
| Ancestry | # Population | % Population |
| American | 19 | 2.6% |
| Austrian | 6 | 0.8% |
| Bhutanese | 1 | 0.1% |
| Bolivian | 39 | 5.3% |
| British | 2 | 0.3% |
| Burmese | 12 | 1.6% |
| Central American | 45 | 6.1% |
| Central American Indian | 2 | 0.3% |
| Dutch | 3 | 0.4% |
| Ecuadorian | 1 | 0.1% |
| English | 38 | 5.2% |
| Ethiopian | 29 | 3.9% |
| European | 24 | 3.3% |
| Finnish | 11 | 1.5% |
| French | 5 | 0.7% |
| German | 92 | 12.5% |
| Greek | 4 | 0.5% |
| Honduran | 2 | 0.3% |
| Indian (Asian) | 13 | 1.8% |
| Iranian | 12 | 1.6% |
| Irish | 59 | 8.0% |
| Italian | 66 | 9.0% |
| Jamaican | 2 | 0.3% |
| Japanese | 3 | 0.4% |
| Korean | 3 | 0.4% |
| Norwegian | 8 | 1.1% |
| Panamanian | 7 | 0.9% |
| Peruvian | 15 | 2.0% |
| Polish | 17 | 2.3% |
| Portuguese | 25 | 3.4% |
| Puerto Rican | 2 | 0.3% |
| Russian | 44 | 6.0% |
| Salvadoran | 36 | 4.9% |
| Scotch-Irish | 4 | 0.5% |
| Scottish | 5 | 0.7% |
| Slovak | 7 | 0.9% |
| Slovene | 2 | 0.3% |
| South American | 55 | 7.5% |
| Sri Lankan | 63 | 8.6% |
| Subsaharan African | 29 | 3.9% |
| Swedish | 2 | 0.3% |
| Swiss | 5 | 0.7% |
| Thai | 29 | 3.9% |
| Welsh | 2 | 0.3% |
| West Indian | 21 | 2.9% | View All 45 Rows |
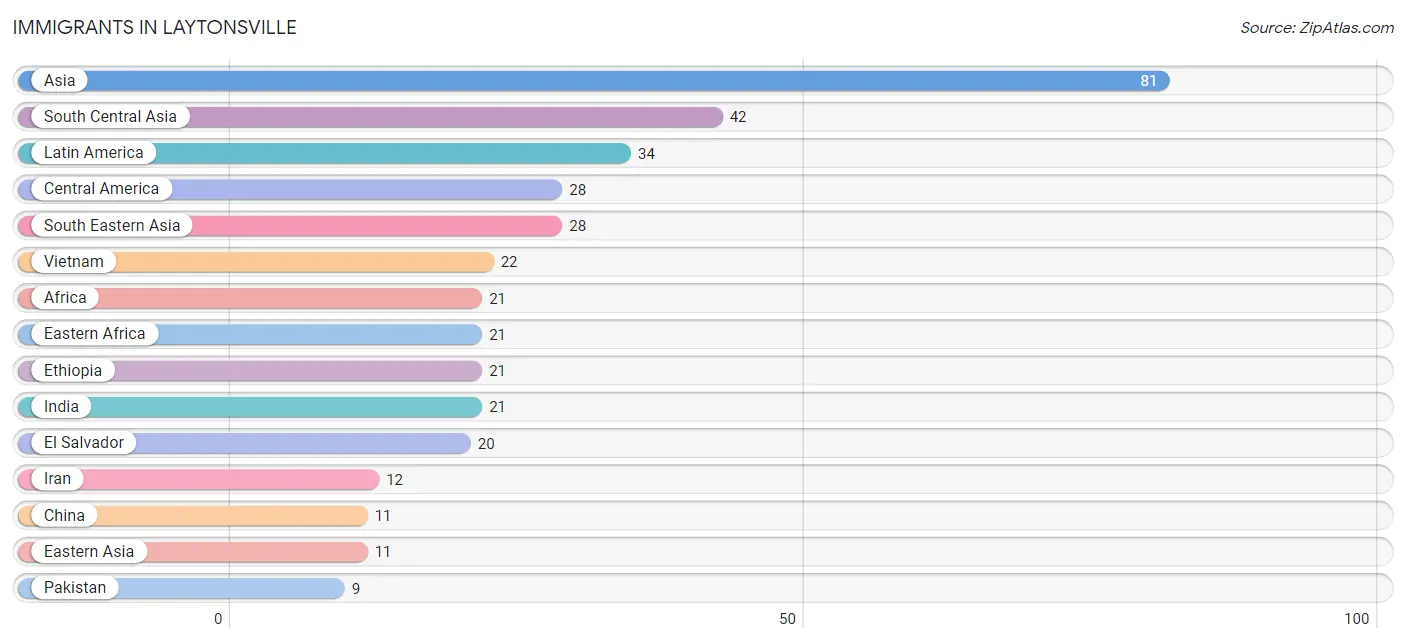
Immigrants in Laytonsville
The most numerous immigrant groups reported in Laytonsville came from Asia (81 | 11.0%), South Central Asia (42 | 5.7%), Latin America (34 | 4.6%), Central America (28 | 3.8%), and South Eastern Asia (28 | 3.8%), together accounting for 28.9% of all Laytonsville residents.
| Immigration Origin | # Population | % Population |
| Africa | 21 | 2.9% |
| Asia | 81 | 11.0% |
| Austria | 1 | 0.1% |
| Cambodia | 2 | 0.3% |
| Canada | 2 | 0.3% |
| Caribbean | 5 | 0.7% |
| Central America | 28 | 3.8% |
| China | 11 | 1.5% |
| Eastern Africa | 21 | 2.9% |
| Eastern Asia | 11 | 1.5% |
| Ecuador | 1 | 0.1% |
| El Salvador | 20 | 2.7% |
| Ethiopia | 21 | 2.9% |
| Europe | 4 | 0.5% |
| Germany | 2 | 0.3% |
| Honduras | 1 | 0.1% |
| India | 21 | 2.9% |
| Iran | 12 | 1.6% |
| Latin America | 34 | 4.6% |
| Northern Europe | 1 | 0.1% |
| Pakistan | 9 | 1.2% |
| Panama | 7 | 0.9% |
| Philippines | 4 | 0.5% |
| South America | 1 | 0.1% |
| South Central Asia | 42 | 5.7% |
| South Eastern Asia | 28 | 3.8% |
| Trinidad and Tobago | 5 | 0.7% |
| Vietnam | 22 | 3.0% |
| Western Europe | 3 | 0.4% | View All 29 Rows |
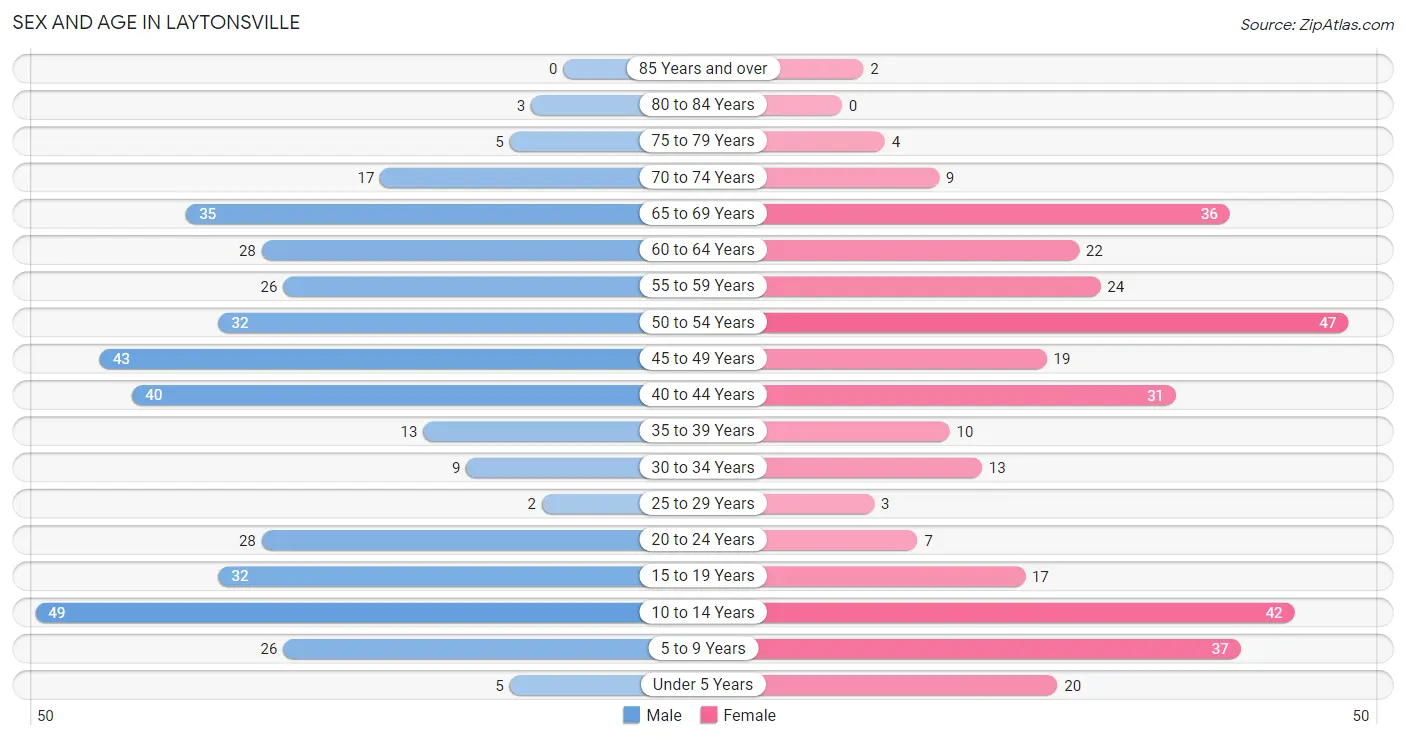
Sex and Age in Laytonsville
Sex and Age in Laytonsville
The most populous age groups in Laytonsville are 10 to 14 Years (49 | 12.5%) for men and 50 to 54 Years (47 | 13.7%) for women.
| Age Bracket | Male | Female |
| Under 5 Years | 5 (1.3%) | 20 (5.8%) |
| 5 to 9 Years | 26 (6.6%) | 37 (10.8%) |
| 10 to 14 Years | 49 (12.5%) | 42 (12.2%) |
| 15 to 19 Years | 32 (8.1%) | 17 (5.0%) |
| 20 to 24 Years | 28 (7.1%) | 7 (2.0%) |
| 25 to 29 Years | 2 (0.5%) | 3 (0.9%) |
| 30 to 34 Years | 9 (2.3%) | 13 (3.8%) |
| 35 to 39 Years | 13 (3.3%) | 10 (2.9%) |
| 40 to 44 Years | 40 (10.2%) | 31 (9.0%) |
| 45 to 49 Years | 43 (10.9%) | 19 (5.5%) |
| 50 to 54 Years | 32 (8.1%) | 47 (13.7%) |
| 55 to 59 Years | 26 (6.6%) | 24 (7.0%) |
| 60 to 64 Years | 28 (7.1%) | 22 (6.4%) |
| 65 to 69 Years | 35 (8.9%) | 36 (10.5%) |
| 70 to 74 Years | 17 (4.3%) | 9 (2.6%) |
| 75 to 79 Years | 5 (1.3%) | 4 (1.2%) |
| 80 to 84 Years | 3 (0.8%) | 0 (0.0%) |
| 85 Years and over | 0 (0.0%) | 2 (0.6%) |
| Total | 393 (100.0%) | 343 (100.0%) |
Families and Households in Laytonsville
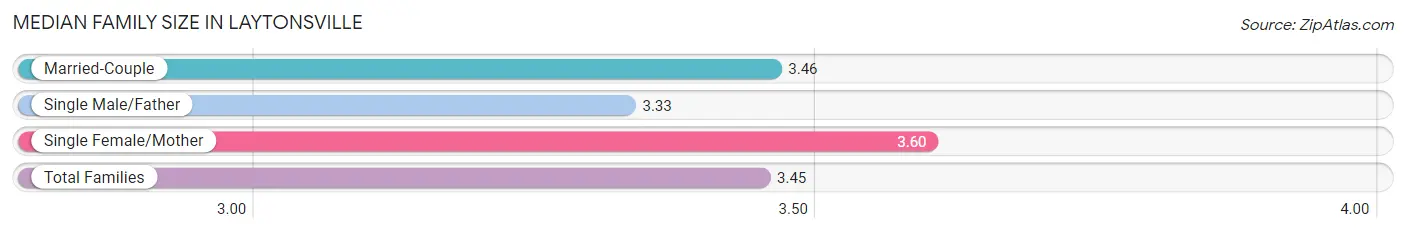
Median Family Size in Laytonsville
The median family size in Laytonsville is 3.45 persons per family, with single female/mother families (5 | 2.5%) accounting for the largest median family size of 3.6 persons per family. On the other hand, single male/father families (12 | 6.1%) represent the smallest median family size with 3.33 persons per family.
| Family Type | # Families | Family Size |
| Married-Couple | 181 (91.4%) | 3.46 |
| Single Male/Father | 12 (6.1%) | 3.33 |
| Single Female/Mother | 5 (2.5%) | 3.60 |
| Total Families | 198 (100.0%) | 3.45 |
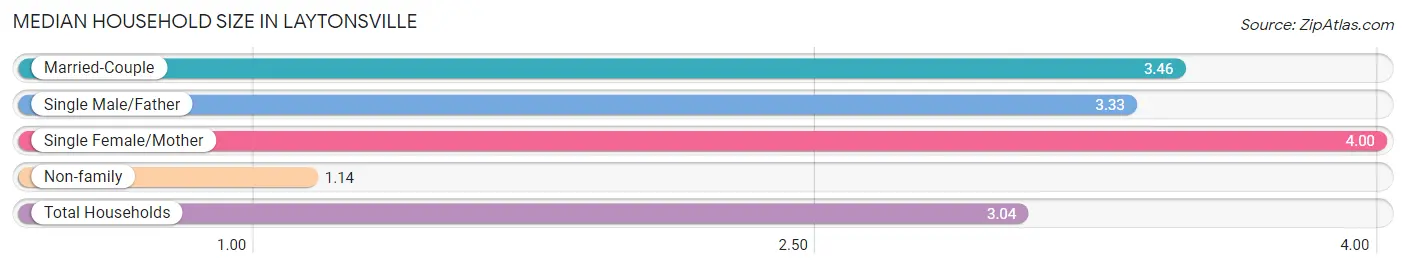
Median Household Size in Laytonsville
The median household size in Laytonsville is 3.04 persons per household, with single female/mother households (5 | 2.1%) accounting for the largest median household size of 4 persons per household. non-family households (44 | 18.2%) represent the smallest median household size with 1.14 persons per household.
| Household Type | # Households | Household Size |
| Married-Couple | 181 (74.8%) | 3.46 |
| Single Male/Father | 12 (5.0%) | 3.33 |
| Single Female/Mother | 5 (2.1%) | 4.00 |
| Non-family | 44 (18.2%) | 1.14 |
| Total Households | 242 (100.0%) | 3.04 |
Household Size by Marriage Status in Laytonsville
Out of a total of 242 households in Laytonsville, 198 (81.8%) are family households, while 44 (18.2%) are nonfamily households. The most numerous type of family households are 2-person households, comprising 63, and the most common type of nonfamily households are 1-person households, comprising 39.
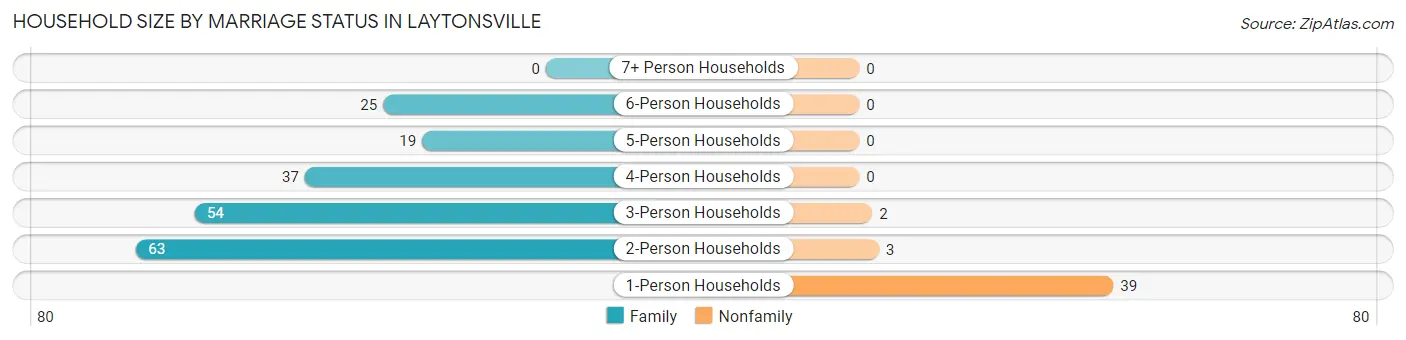
| Household Size | Family Households | Nonfamily Households |
| 1-Person Households | - | 39 (16.1%) |
| 2-Person Households | 63 (26.0%) | 3 (1.2%) |
| 3-Person Households | 54 (22.3%) | 2 (0.8%) |
| 4-Person Households | 37 (15.3%) | 0 (0.0%) |
| 5-Person Households | 19 (7.9%) | 0 (0.0%) |
| 6-Person Households | 25 (10.3%) | 0 (0.0%) |
| 7+ Person Households | 0 (0.0%) | 0 (0.0%) |
| Total | 198 (81.8%) | 44 (18.2%) |
Female Fertility in Laytonsville
Fertility by Age in Laytonsville
Average fertility rate in Laytonsville is 87.0 births per 1,000 women. Women in the age bracket of 20 to 34 years have the highest fertility rate with 391.0 births per 1,000 women. Women in the age bracket of 20 to 34 years acount for 100.0% of all women with births.
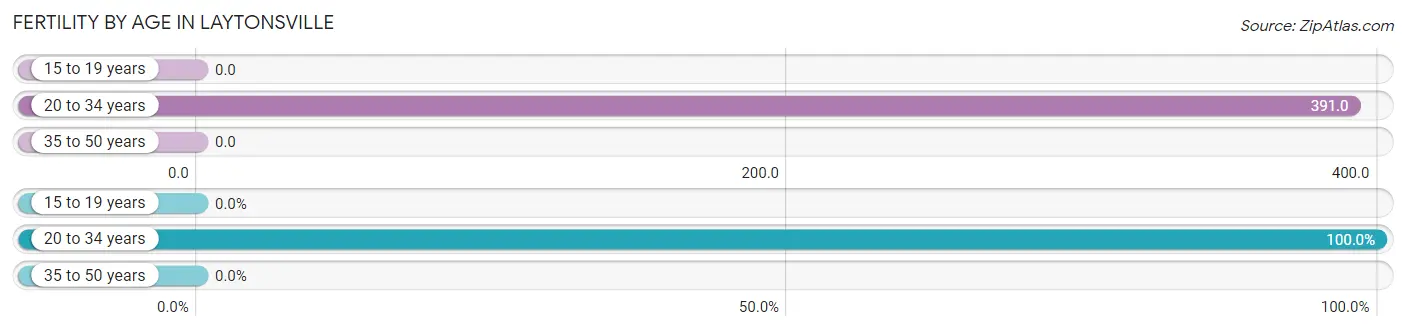
| Age Bracket | Women with Births | Births / 1,000 Women |
| 15 to 19 years | 0 (0.0%) | 0.0 |
| 20 to 34 years | 9 (100.0%) | 391.0 |
| 35 to 50 years | 0 (0.0%) | 0.0 |
| Total | 9 (100.0%) | 87.0 |
Fertility by Age by Marriage Status in Laytonsville
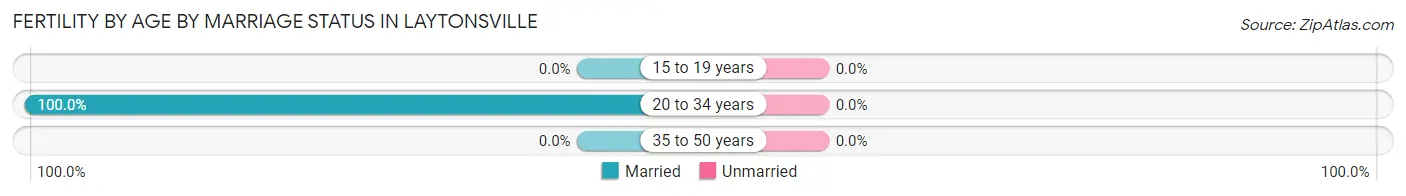
| Age Bracket | Married | Unmarried |
| 15 to 19 years | 0 (0.0%) | 0 (0.0%) |
| 20 to 34 years | 9 (100.0%) | 0 (0.0%) |
| 35 to 50 years | 0 (0.0%) | 0 (0.0%) |
| Total | 9 (100.0%) | 0 (0.0%) |
Fertility by Education in Laytonsville
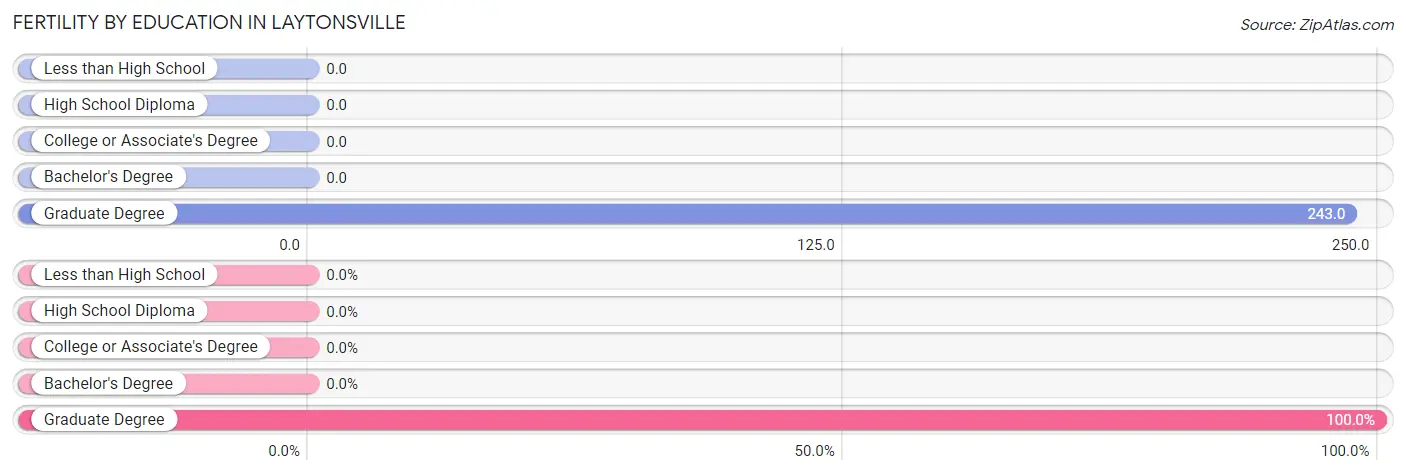
| Educational Attainment | Women with Births | Births / 1,000 Women |
| Less than High School | 0 (0.0%) | 0.0 |
| High School Diploma | 0 (0.0%) | 0.0 |
| College or Associate's Degree | 0 (0.0%) | 0.0 |
| Bachelor's Degree | 0 (0.0%) | 0.0 |
| Graduate Degree | 9 (100.0%) | 243.0 |
| Total | 9 (100.0%) | 87.0 |
Fertility by Education by Marriage Status in Laytonsville
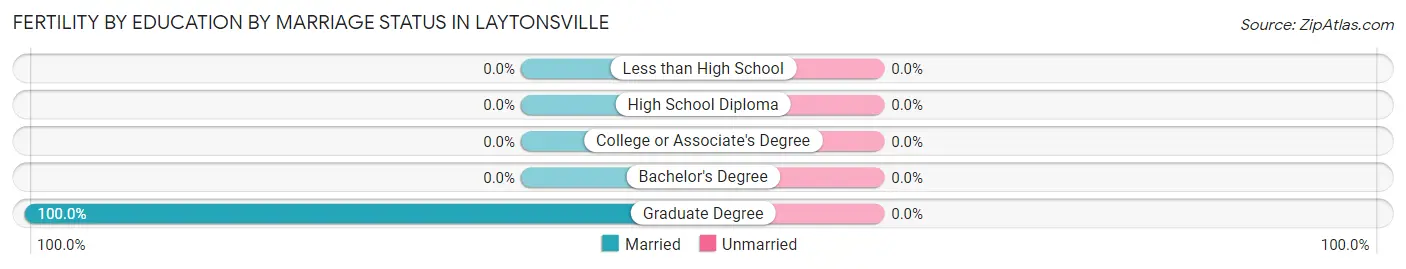
| Educational Attainment | Married | Unmarried |
| Less than High School | 0 (0.0%) | 0 (0.0%) |
| High School Diploma | 0 (0.0%) | 0 (0.0%) |
| College or Associate's Degree | 0 (0.0%) | 0 (0.0%) |
| Bachelor's Degree | 0 (0.0%) | 0 (0.0%) |
| Graduate Degree | 9 (100.0%) | 0 (0.0%) |
| Total | 9 (100.0%) | 0 (0.0%) |
Employment Characteristics in Laytonsville
Employment by Class of Employer in Laytonsville
Among the 371 employed individuals in Laytonsville, private company employees (159 | 42.9%), federal government employees (53 | 14.3%), and local government employees (50 | 13.5%) make up the most common classes of employment.
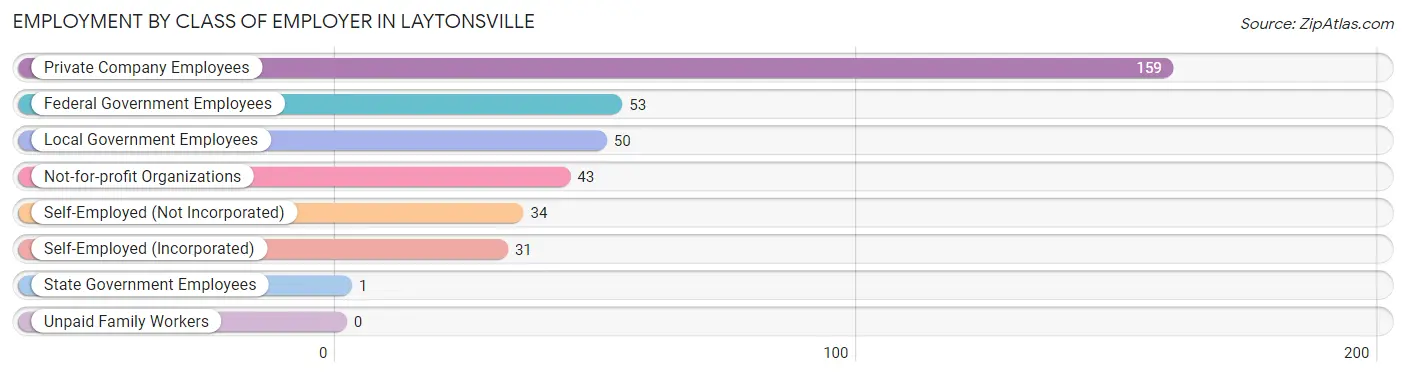
| Employer Class | # Employees | % Employees |
| Private Company Employees | 159 | 42.9% |
| Self-Employed (Incorporated) | 31 | 8.4% |
| Self-Employed (Not Incorporated) | 34 | 9.2% |
| Not-for-profit Organizations | 43 | 11.6% |
| Local Government Employees | 50 | 13.5% |
| State Government Employees | 1 | 0.3% |
| Federal Government Employees | 53 | 14.3% |
| Unpaid Family Workers | 0 | 0.0% |
| Total | 371 | 100.0% |
Employment Status by Age in Laytonsville
According to the labor force statistics for Laytonsville, out of the total population over 16 years of age (557), 69.1% or 385 individuals are in the labor force, with 3.7% or 14 of them unemployed. The age group with the highest labor force participation rate is 25 to 29 years, with 100.0% or 5 individuals in the labor force. Within the labor force, the 20 to 24 years age range has the highest percentage of unemployed individuals, with 29.2% or 7 of them being unemployed.
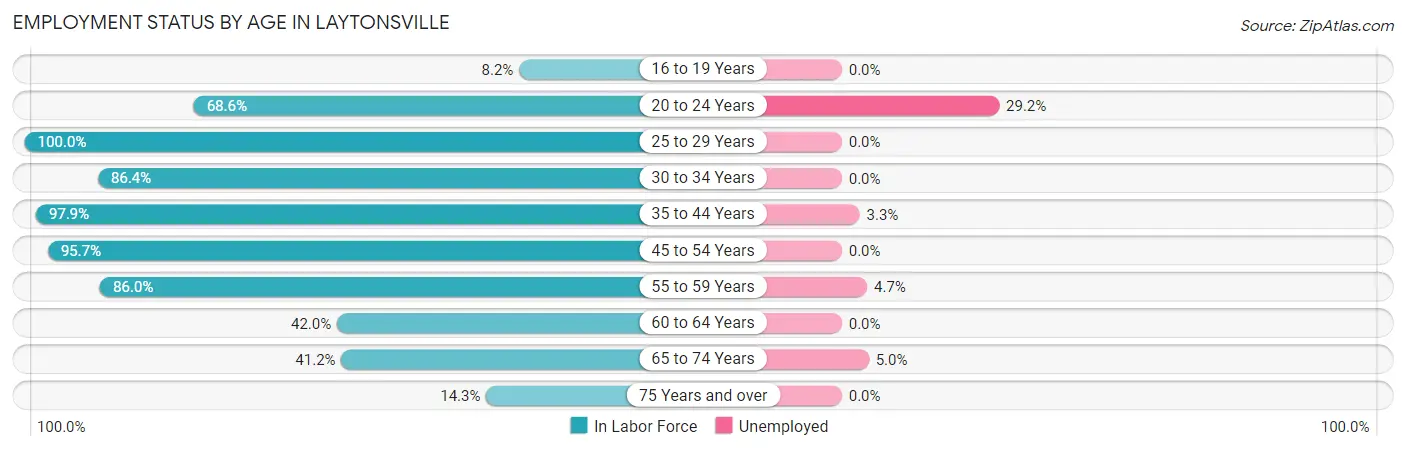
| Age Bracket | In Labor Force | Unemployed |
| 16 to 19 Years | 4 (8.2%) | 0 (0.0%) |
| 20 to 24 Years | 24 (68.6%) | 7 (29.2%) |
| 25 to 29 Years | 5 (100.0%) | 0 (0.0%) |
| 30 to 34 Years | 19 (86.4%) | 0 (0.0%) |
| 35 to 44 Years | 92 (97.9%) | 3 (3.3%) |
| 45 to 54 Years | 135 (95.7%) | 0 (0.0%) |
| 55 to 59 Years | 43 (86.0%) | 2 (4.7%) |
| 60 to 64 Years | 21 (42.0%) | 0 (0.0%) |
| 65 to 74 Years | 40 (41.2%) | 2 (5.0%) |
| 75 Years and over | 2 (14.3%) | 0 (0.0%) |
| Total | 385 (69.1%) | 14 (3.7%) |
Employment Status by Educational Attainment in Laytonsville
According to labor force statistics for Laytonsville, 87.0% of individuals (315) out of the total population between 25 and 64 years of age (362) are in the labor force, with 1.6% or 5 of them being unemployed. The group with the highest labor force participation rate are those with the educational attainment of bachelor's degree or higher, with 98.2% or 219 individuals in the labor force. Within the labor force, individuals with college / associate degree education have the highest percentage of unemployment, with 4.7% or 2 of them being unemployed.
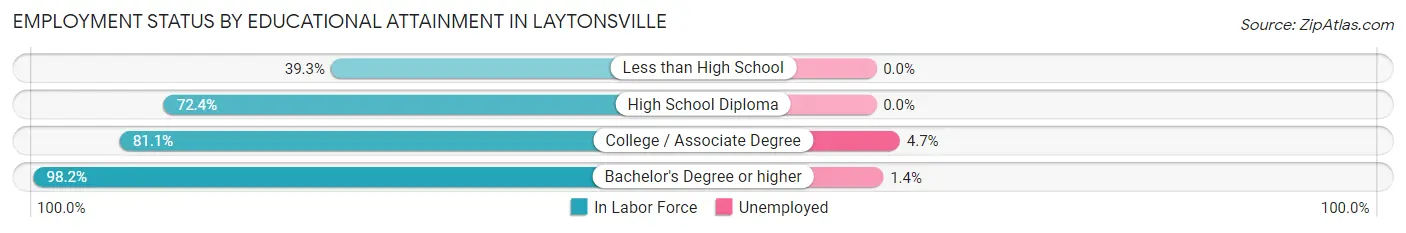
| Educational Attainment | In Labor Force | Unemployed |
| Less than High School | 11 (39.3%) | 0 (0.0%) |
| High School Diploma | 42 (72.4%) | 0 (0.0%) |
| College / Associate Degree | 43 (81.1%) | 2 (4.7%) |
| Bachelor's Degree or higher | 219 (98.2%) | 3 (1.4%) |
| Total | 315 (87.0%) | 6 (1.6%) |
Employment Occupations by Sex in Laytonsville
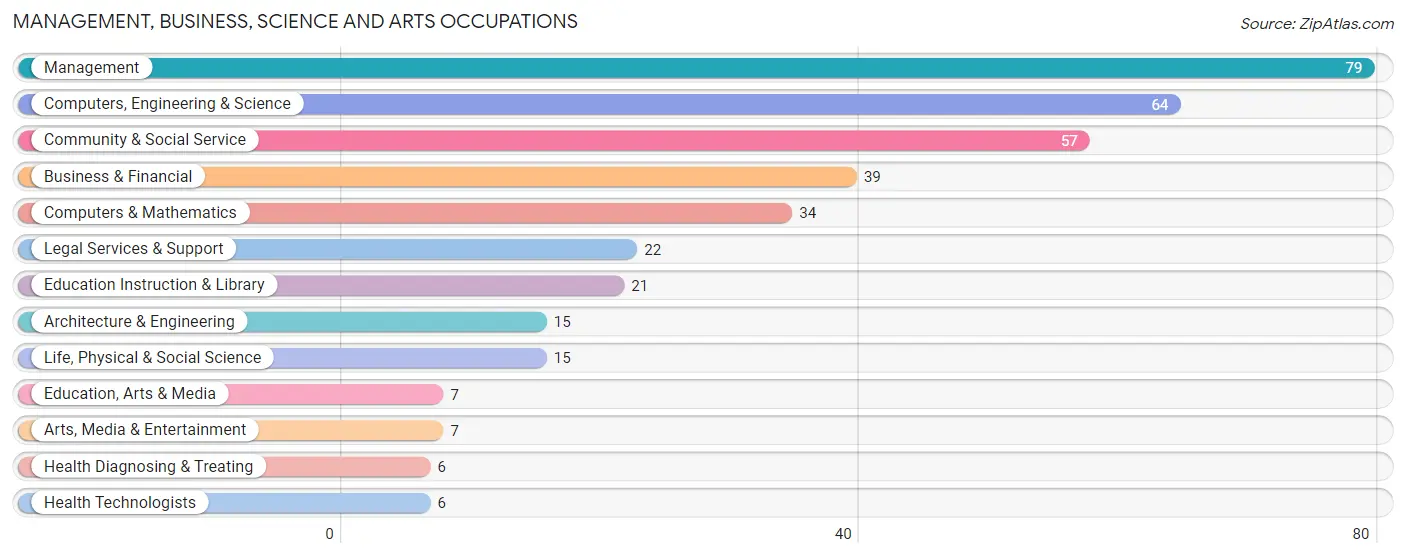
Management, Business, Science and Arts Occupations
The most common Management, Business, Science and Arts occupations in Laytonsville are Management (79 | 21.8%), Computers, Engineering & Science (64 | 17.6%), Community & Social Service (57 | 15.7%), Business & Financial (39 | 10.7%), and Computers & Mathematics (34 | 9.4%).
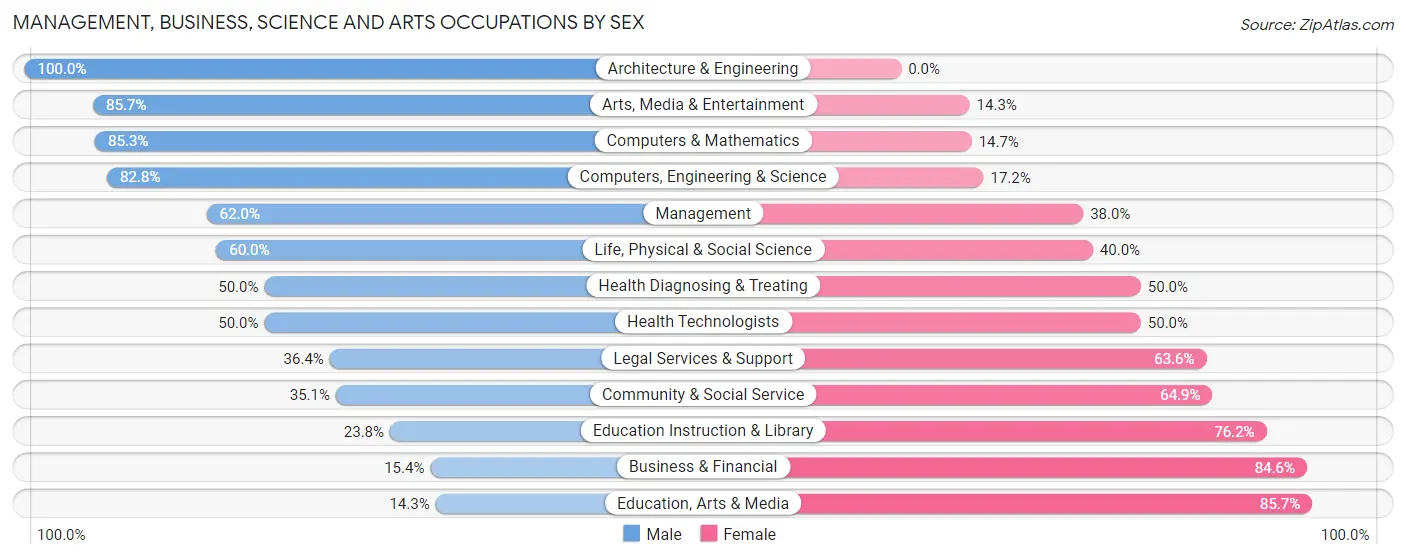
Management, Business, Science and Arts Occupations by Sex
Within the Management, Business, Science and Arts occupations in Laytonsville, the most male-oriented occupations are Architecture & Engineering (100.0%), Arts, Media & Entertainment (85.7%), and Computers & Mathematics (85.3%), while the most female-oriented occupations are Education, Arts & Media (85.7%), Business & Financial (84.6%), and Education Instruction & Library (76.2%).
| Occupation | Male | Female |
| Management | 49 (62.0%) | 30 (38.0%) |
| Business & Financial | 6 (15.4%) | 33 (84.6%) |
| Computers, Engineering & Science | 53 (82.8%) | 11 (17.2%) |
| Computers & Mathematics | 29 (85.3%) | 5 (14.7%) |
| Architecture & Engineering | 15 (100.0%) | 0 (0.0%) |
| Life, Physical & Social Science | 9 (60.0%) | 6 (40.0%) |
| Community & Social Service | 20 (35.1%) | 37 (64.9%) |
| Education, Arts & Media | 1 (14.3%) | 6 (85.7%) |
| Legal Services & Support | 8 (36.4%) | 14 (63.6%) |
| Education Instruction & Library | 5 (23.8%) | 16 (76.2%) |
| Arts, Media & Entertainment | 6 (85.7%) | 1 (14.3%) |
| Health Diagnosing & Treating | 3 (50.0%) | 3 (50.0%) |
| Health Technologists | 3 (50.0%) | 3 (50.0%) |
| Total (Category) | 131 (53.5%) | 114 (46.5%) |
| Total (Overall) | 212 (58.4%) | 151 (41.6%) |
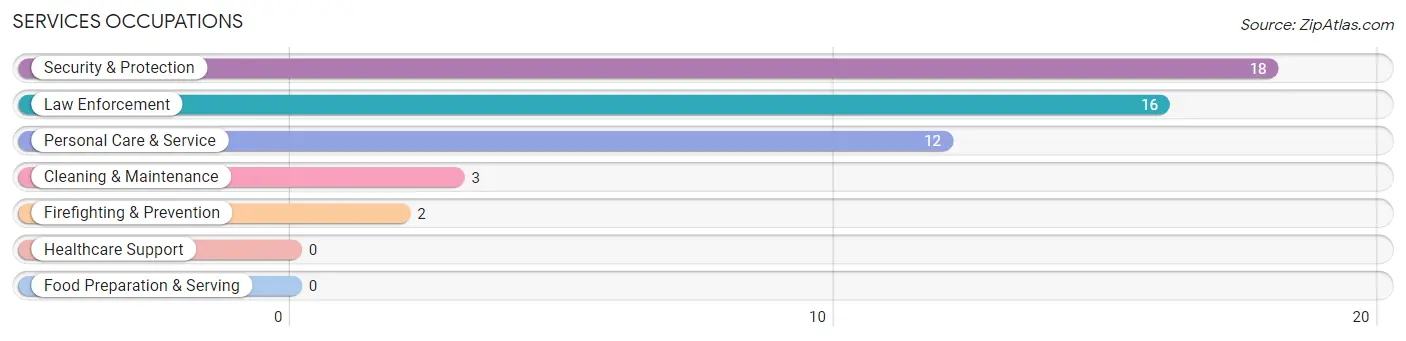
Services Occupations
The most common Services occupations in Laytonsville are Security & Protection (18 | 5.0%), Law Enforcement (16 | 4.4%), Personal Care & Service (12 | 3.3%), Cleaning & Maintenance (3 | 0.8%), and Firefighting & Prevention (2 | 0.5%).
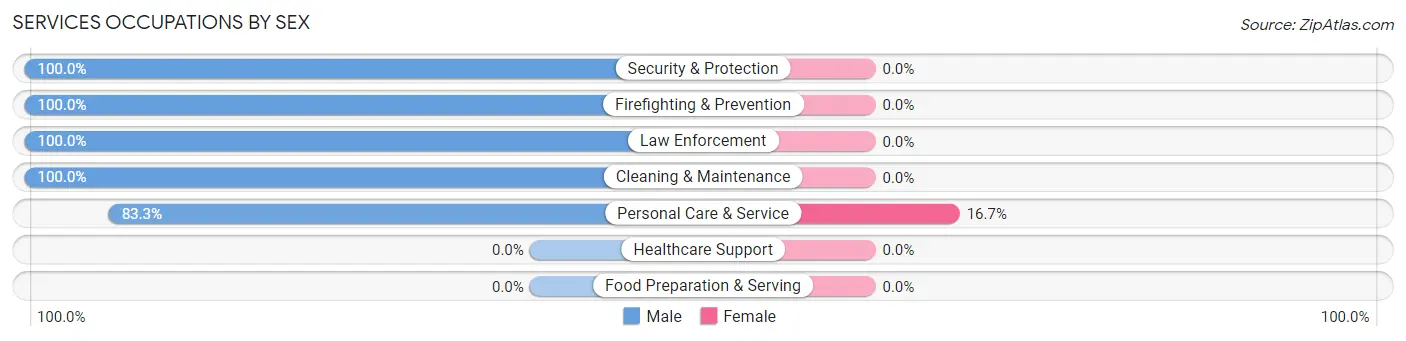
Services Occupations by Sex
| Occupation | Male | Female |
| Healthcare Support | 0 (0.0%) | 0 (0.0%) |
| Security & Protection | 18 (100.0%) | 0 (0.0%) |
| Firefighting & Prevention | 2 (100.0%) | 0 (0.0%) |
| Law Enforcement | 16 (100.0%) | 0 (0.0%) |
| Food Preparation & Serving | 0 (0.0%) | 0 (0.0%) |
| Cleaning & Maintenance | 3 (100.0%) | 0 (0.0%) |
| Personal Care & Service | 10 (83.3%) | 2 (16.7%) |
| Total (Category) | 31 (93.9%) | 2 (6.1%) |
| Total (Overall) | 212 (58.4%) | 151 (41.6%) |
Sales and Office Occupations
The most common Sales and Office occupations in Laytonsville are Sales & Related (33 | 9.1%), and Office & Administration (32 | 8.8%).
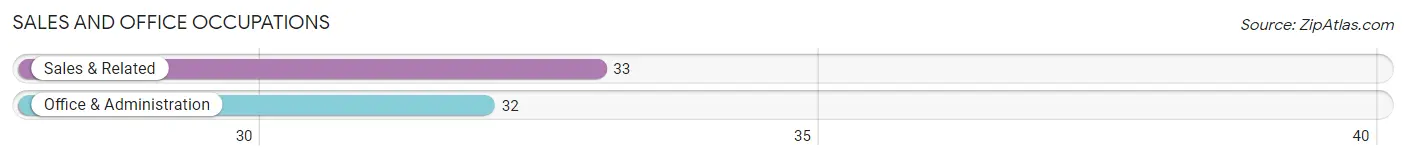
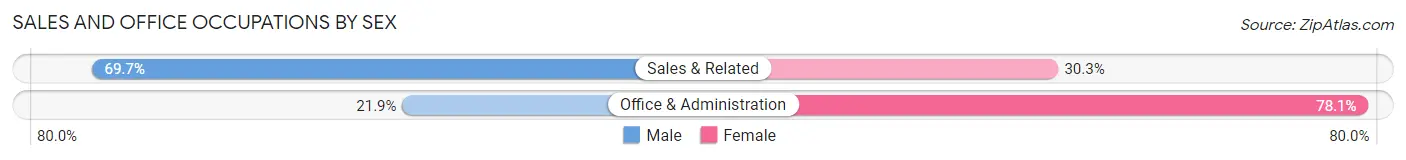
Sales and Office Occupations by Sex
| Occupation | Male | Female |
| Sales & Related | 23 (69.7%) | 10 (30.3%) |
| Office & Administration | 7 (21.9%) | 25 (78.1%) |
| Total (Category) | 30 (46.2%) | 35 (53.8%) |
| Total (Overall) | 212 (58.4%) | 151 (41.6%) |
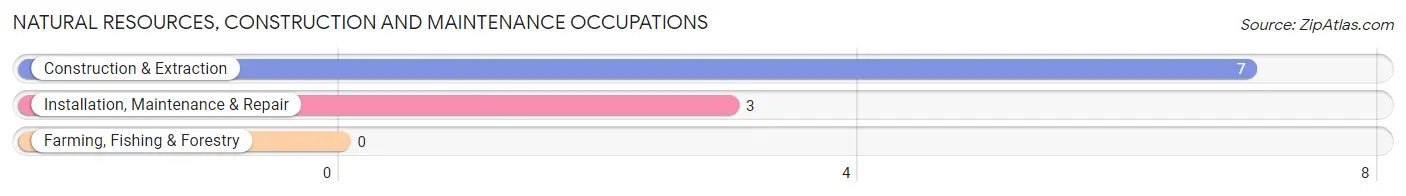
Natural Resources, Construction and Maintenance Occupations
The most common Natural Resources, Construction and Maintenance occupations in Laytonsville are Construction & Extraction (7 | 1.9%), and Installation, Maintenance & Repair (3 | 0.8%).
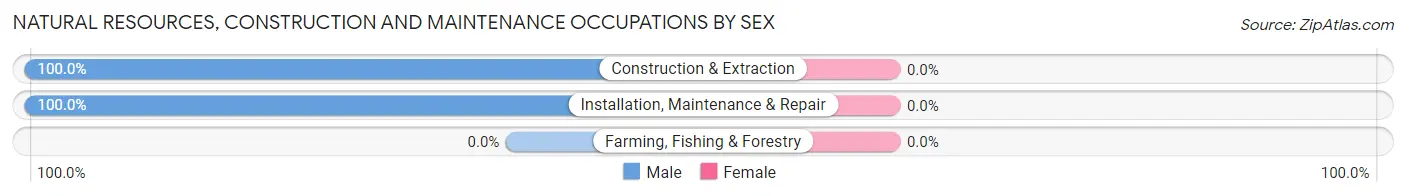
Natural Resources, Construction and Maintenance Occupations by Sex
| Occupation | Male | Female |
| Farming, Fishing & Forestry | 0 (0.0%) | 0 (0.0%) |
| Construction & Extraction | 7 (100.0%) | 0 (0.0%) |
| Installation, Maintenance & Repair | 3 (100.0%) | 0 (0.0%) |
| Total (Category) | 10 (100.0%) | 0 (0.0%) |
| Total (Overall) | 212 (58.4%) | 151 (41.6%) |
Production, Transportation and Moving Occupations
The most common Production, Transportation and Moving occupations in Laytonsville are Production (8 | 2.2%), and Transportation (2 | 0.5%).
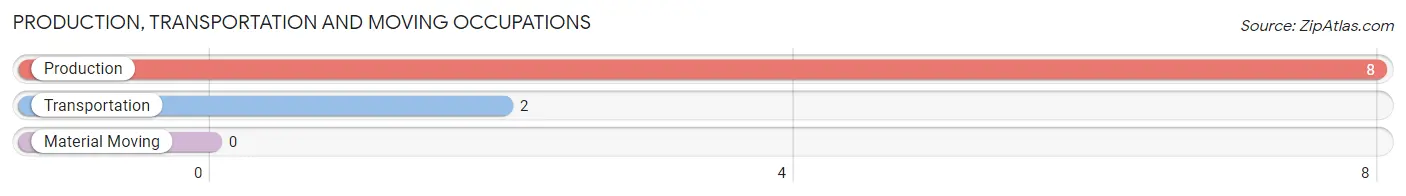
Production, Transportation and Moving Occupations by Sex
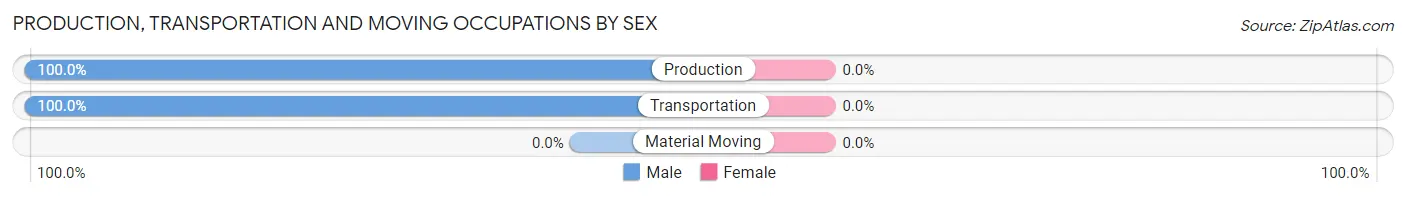
| Occupation | Male | Female |
| Production | 8 (100.0%) | 0 (0.0%) |
| Transportation | 2 (100.0%) | 0 (0.0%) |
| Material Moving | 0 (0.0%) | 0 (0.0%) |
| Total (Category) | 10 (100.0%) | 0 (0.0%) |
| Total (Overall) | 212 (58.4%) | 151 (41.6%) |
Employment Industries by Sex in Laytonsville
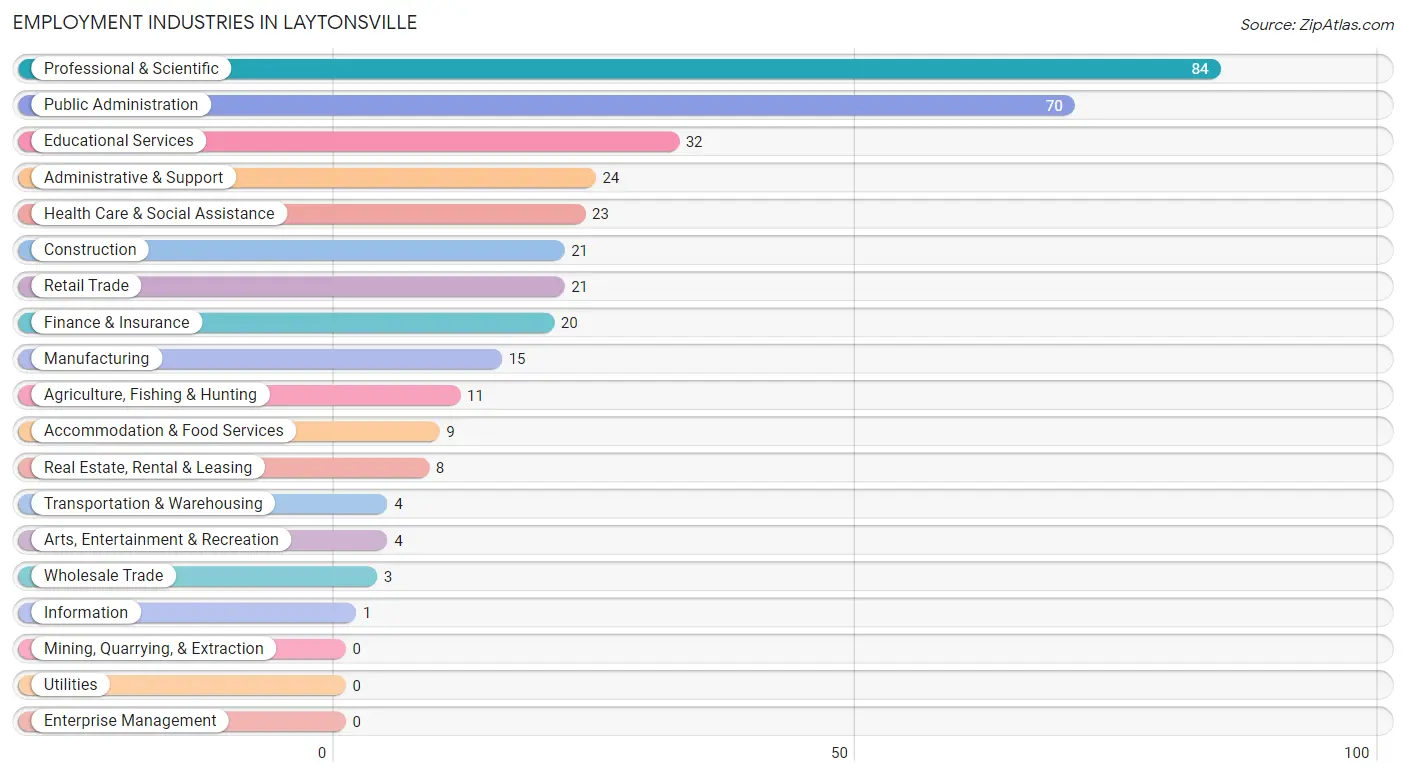
Employment Industries in Laytonsville
The major employment industries in Laytonsville include Professional & Scientific (84 | 23.1%), Public Administration (70 | 19.3%), Educational Services (32 | 8.8%), Administrative & Support (24 | 6.6%), and Health Care & Social Assistance (23 | 6.3%).
Employment Industries by Sex in Laytonsville
The Laytonsville industries that see more men than women are Agriculture, Fishing & Hunting (100.0%), Transportation & Warehousing (100.0%), and Information (100.0%), whereas the industries that tend to have a higher number of women are Accommodation & Food Services (77.8%), Real Estate, Rental & Leasing (75.0%), and Administrative & Support (70.8%).
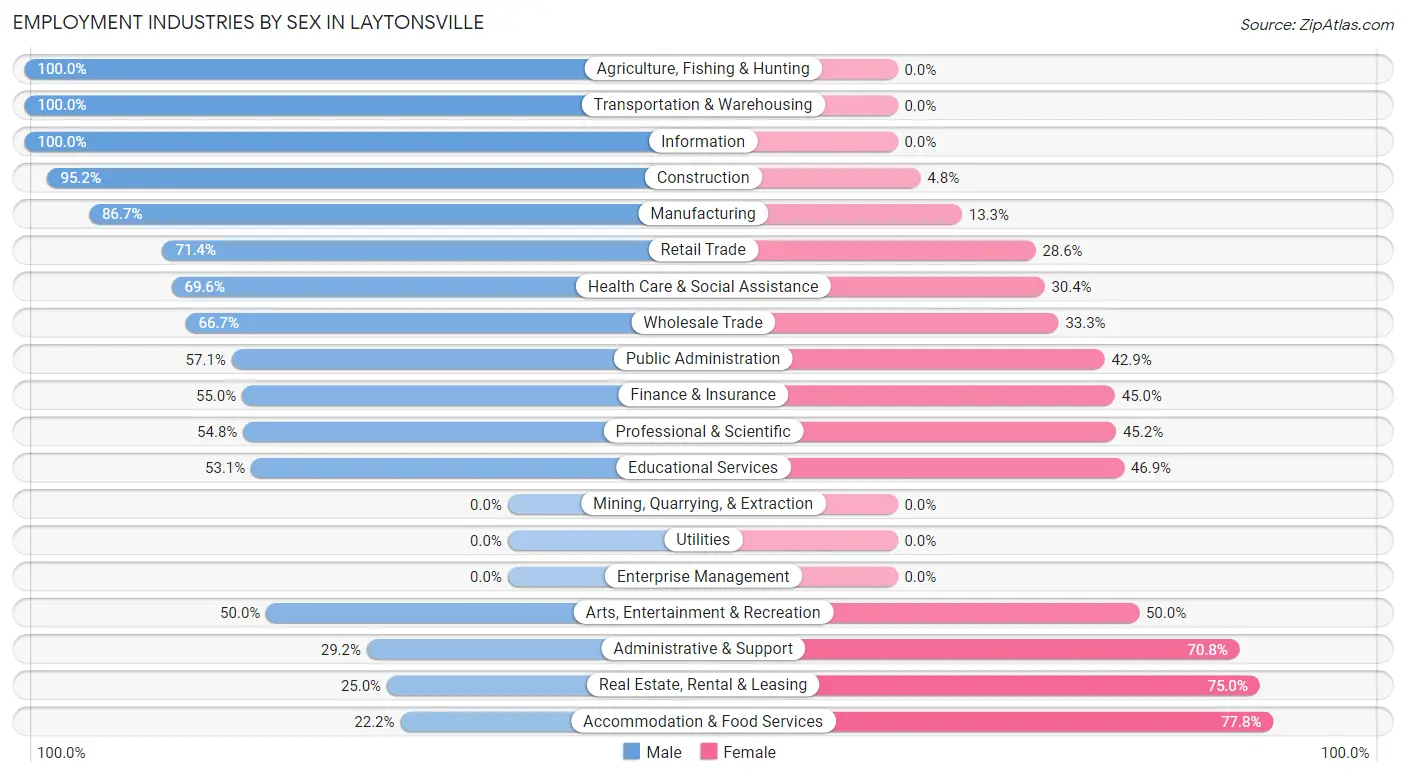
| Industry | Male | Female |
| Agriculture, Fishing & Hunting | 11 (100.0%) | 0 (0.0%) |
| Mining, Quarrying, & Extraction | 0 (0.0%) | 0 (0.0%) |
| Construction | 20 (95.2%) | 1 (4.8%) |
| Manufacturing | 13 (86.7%) | 2 (13.3%) |
| Wholesale Trade | 2 (66.7%) | 1 (33.3%) |
| Retail Trade | 15 (71.4%) | 6 (28.6%) |
| Transportation & Warehousing | 4 (100.0%) | 0 (0.0%) |
| Utilities | 0 (0.0%) | 0 (0.0%) |
| Information | 1 (100.0%) | 0 (0.0%) |
| Finance & Insurance | 11 (55.0%) | 9 (45.0%) |
| Real Estate, Rental & Leasing | 2 (25.0%) | 6 (75.0%) |
| Professional & Scientific | 46 (54.8%) | 38 (45.2%) |
| Enterprise Management | 0 (0.0%) | 0 (0.0%) |
| Administrative & Support | 7 (29.2%) | 17 (70.8%) |
| Educational Services | 17 (53.1%) | 15 (46.9%) |
| Health Care & Social Assistance | 16 (69.6%) | 7 (30.4%) |
| Arts, Entertainment & Recreation | 2 (50.0%) | 2 (50.0%) |
| Accommodation & Food Services | 2 (22.2%) | 7 (77.8%) |
| Public Administration | 40 (57.1%) | 30 (42.9%) |
| Total | 212 (58.4%) | 151 (41.6%) |
Education in Laytonsville
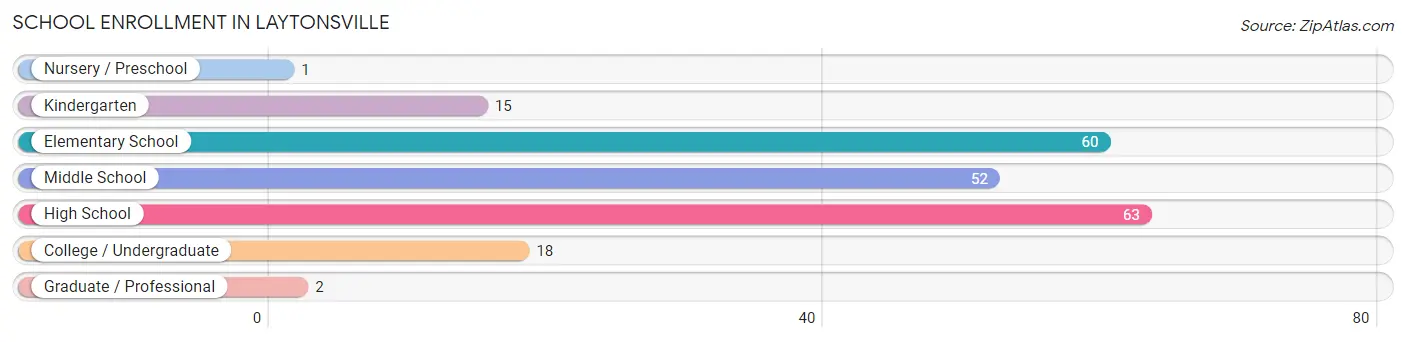
School Enrollment in Laytonsville
The most common levels of schooling among the 211 students in Laytonsville are high school (63 | 29.9%), elementary school (60 | 28.4%), and middle school (52 | 24.6%).
| School Level | # Students | % Students |
| Nursery / Preschool | 1 | 0.5% |
| Kindergarten | 15 | 7.1% |
| Elementary School | 60 | 28.4% |
| Middle School | 52 | 24.6% |
| High School | 63 | 29.9% |
| College / Undergraduate | 18 | 8.5% |
| Graduate / Professional | 2 | 0.9% |
| Total | 211 | 100.0% |
School Enrollment by Age by Funding Source in Laytonsville
Out of a total of 211 students who are enrolled in schools in Laytonsville, 97 (46.0%) attend a private institution, while the remaining 114 (54.0%) are enrolled in public schools. The age group of 3 to 4 year olds has the highest likelihood of being enrolled in private schools, with 1 (100.0% in the age bracket) enrolled. Conversely, the age group of 35 years and over has the lowest likelihood of being enrolled in a private school, with 5 (100.0% in the age bracket) attending a public institution.

| Age Bracket | Public School | Private School |
| 3 to 4 Year Olds | 0 (0.0%) | 1 (100.0%) |
| 5 to 9 Year Old | 32 (52.5%) | 29 (47.5%) |
| 10 to 14 Year Olds | 42 (52.5%) | 38 (47.5%) |
| 15 to 17 Year Olds | 22 (53.7%) | 19 (46.3%) |
| 18 to 19 Year Olds | 1 (14.3%) | 6 (85.7%) |
| 20 to 24 Year Olds | 12 (75.0%) | 4 (25.0%) |
| 25 to 34 Year Olds | 0 (0.0%) | 0 (0.0%) |
| 35 Years and over | 5 (100.0%) | 0 (0.0%) |
| Total | 114 (54.0%) | 97 (46.0%) |
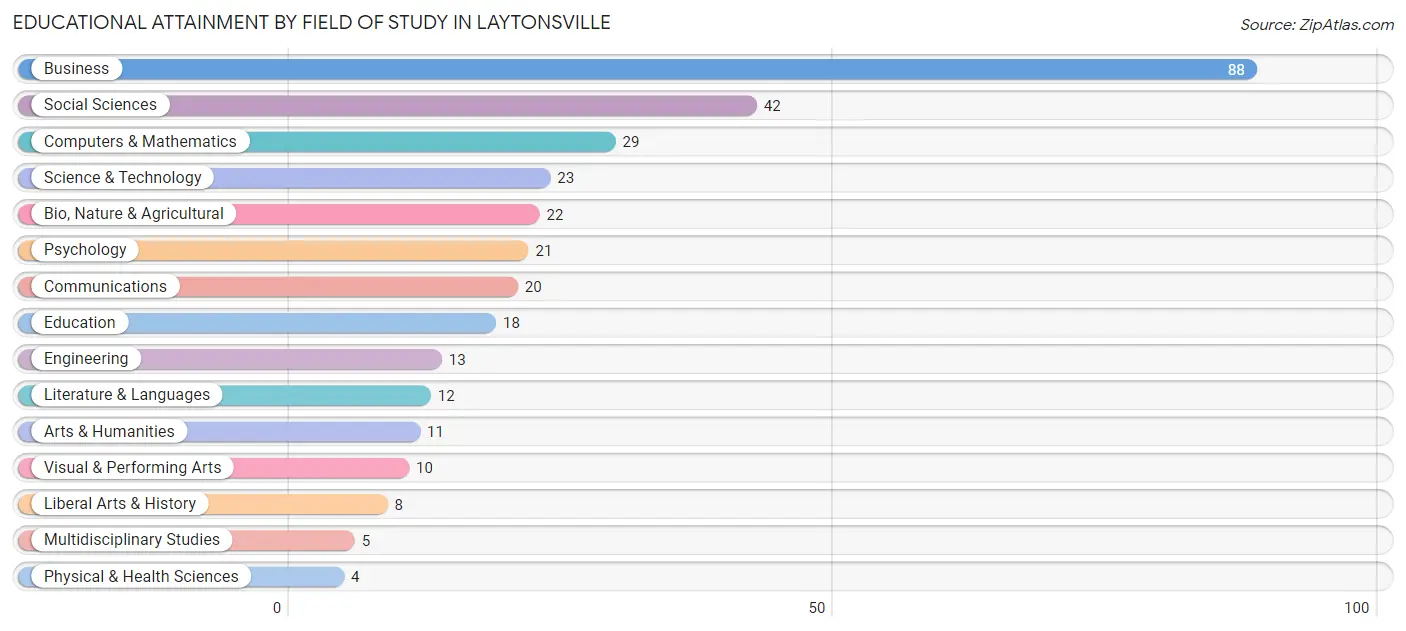
Educational Attainment by Field of Study in Laytonsville
Business (88 | 27.0%), social sciences (42 | 12.9%), computers & mathematics (29 | 8.9%), science & technology (23 | 7.1%), and bio, nature & agricultural (22 | 6.8%) are the most common fields of study among 326 individuals in Laytonsville who have obtained a bachelor's degree or higher.
| Field of Study | # Graduates | % Graduates |
| Computers & Mathematics | 29 | 8.9% |
| Bio, Nature & Agricultural | 22 | 6.8% |
| Physical & Health Sciences | 4 | 1.2% |
| Psychology | 21 | 6.4% |
| Social Sciences | 42 | 12.9% |
| Engineering | 13 | 4.0% |
| Multidisciplinary Studies | 5 | 1.5% |
| Science & Technology | 23 | 7.1% |
| Business | 88 | 27.0% |
| Education | 18 | 5.5% |
| Literature & Languages | 12 | 3.7% |
| Liberal Arts & History | 8 | 2.5% |
| Visual & Performing Arts | 10 | 3.1% |
| Communications | 20 | 6.1% |
| Arts & Humanities | 11 | 3.4% |
| Total | 326 | 100.0% |
Transportation & Commute in Laytonsville
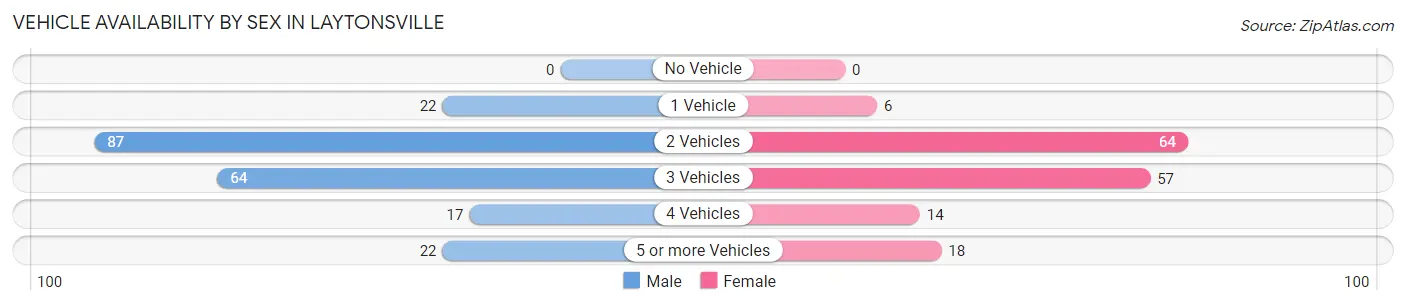
Vehicle Availability by Sex in Laytonsville
The most prevalent vehicle ownership categories in Laytonsville are males with 2 vehicles (87, accounting for 41.0%) and females with 2 vehicles (64, making up 54.7%).
| Vehicles Available | Male | Female |
| No Vehicle | 0 (0.0%) | 0 (0.0%) |
| 1 Vehicle | 22 (10.4%) | 6 (3.8%) |
| 2 Vehicles | 87 (41.0%) | 64 (40.3%) |
| 3 Vehicles | 64 (30.2%) | 57 (35.8%) |
| 4 Vehicles | 17 (8.0%) | 14 (8.8%) |
| 5 or more Vehicles | 22 (10.4%) | 18 (11.3%) |
| Total | 212 (100.0%) | 159 (100.0%) |
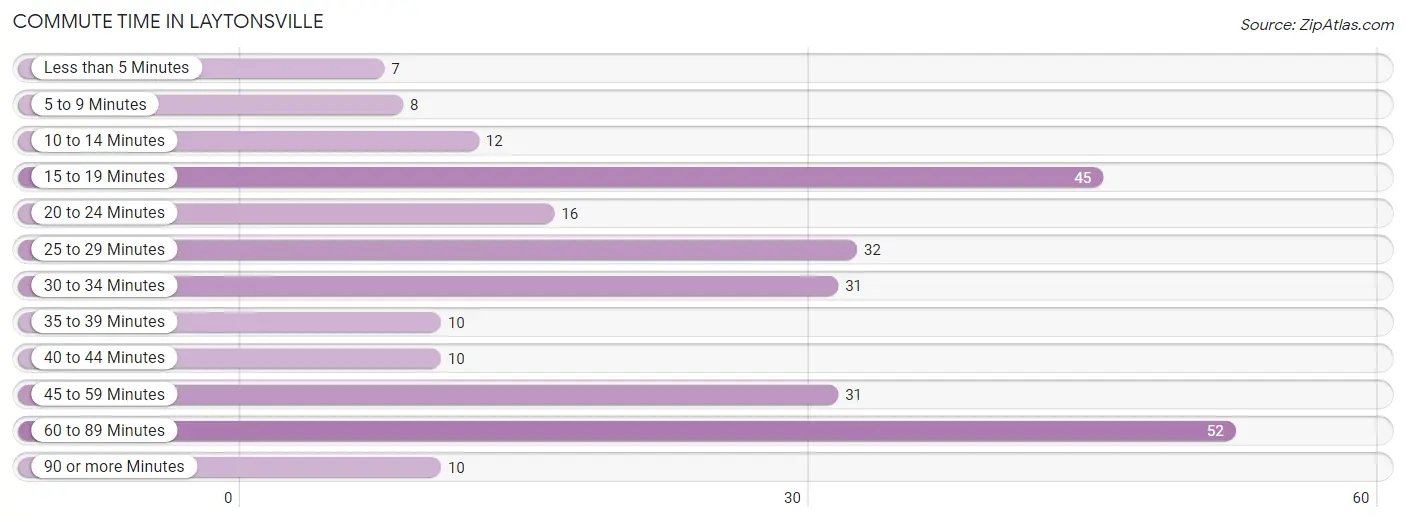
Commute Time in Laytonsville
The most frequently occuring commute durations in Laytonsville are 60 to 89 minutes (52 commuters, 19.7%), 15 to 19 minutes (45 commuters, 17.1%), and 25 to 29 minutes (32 commuters, 12.1%).
| Commute Time | # Commuters | % Commuters |
| Less than 5 Minutes | 7 | 2.6% |
| 5 to 9 Minutes | 8 | 3.0% |
| 10 to 14 Minutes | 12 | 4.5% |
| 15 to 19 Minutes | 45 | 17.1% |
| 20 to 24 Minutes | 16 | 6.1% |
| 25 to 29 Minutes | 32 | 12.1% |
| 30 to 34 Minutes | 31 | 11.7% |
| 35 to 39 Minutes | 10 | 3.8% |
| 40 to 44 Minutes | 10 | 3.8% |
| 45 to 59 Minutes | 31 | 11.7% |
| 60 to 89 Minutes | 52 | 19.7% |
| 90 or more Minutes | 10 | 3.8% |
Commute Time by Sex in Laytonsville
The most common commute times in Laytonsville are 60 to 89 minutes (31 commuters, 19.4%) for males and 60 to 89 minutes (21 commuters, 20.2%) for females.
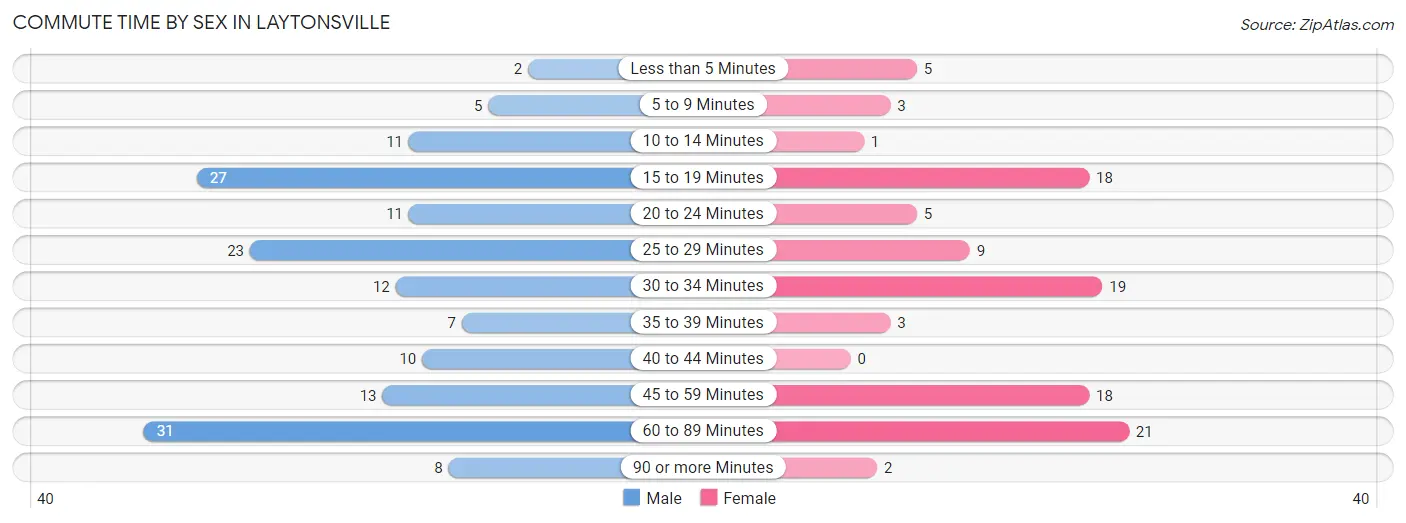
| Commute Time | Male | Female |
| Less than 5 Minutes | 2 (1.3%) | 5 (4.8%) |
| 5 to 9 Minutes | 5 (3.1%) | 3 (2.9%) |
| 10 to 14 Minutes | 11 (6.9%) | 1 (1.0%) |
| 15 to 19 Minutes | 27 (16.9%) | 18 (17.3%) |
| 20 to 24 Minutes | 11 (6.9%) | 5 (4.8%) |
| 25 to 29 Minutes | 23 (14.4%) | 9 (8.6%) |
| 30 to 34 Minutes | 12 (7.5%) | 19 (18.3%) |
| 35 to 39 Minutes | 7 (4.4%) | 3 (2.9%) |
| 40 to 44 Minutes | 10 (6.2%) | 0 (0.0%) |
| 45 to 59 Minutes | 13 (8.1%) | 18 (17.3%) |
| 60 to 89 Minutes | 31 (19.4%) | 21 (20.2%) |
| 90 or more Minutes | 8 (5.0%) | 2 (1.9%) |
Time of Departure to Work by Sex in Laytonsville
The most frequent times of departure to work in Laytonsville are 7:30 AM to 7:59 AM (31, 19.4%) for males and 7:30 AM to 7:59 AM (28, 26.9%) for females.
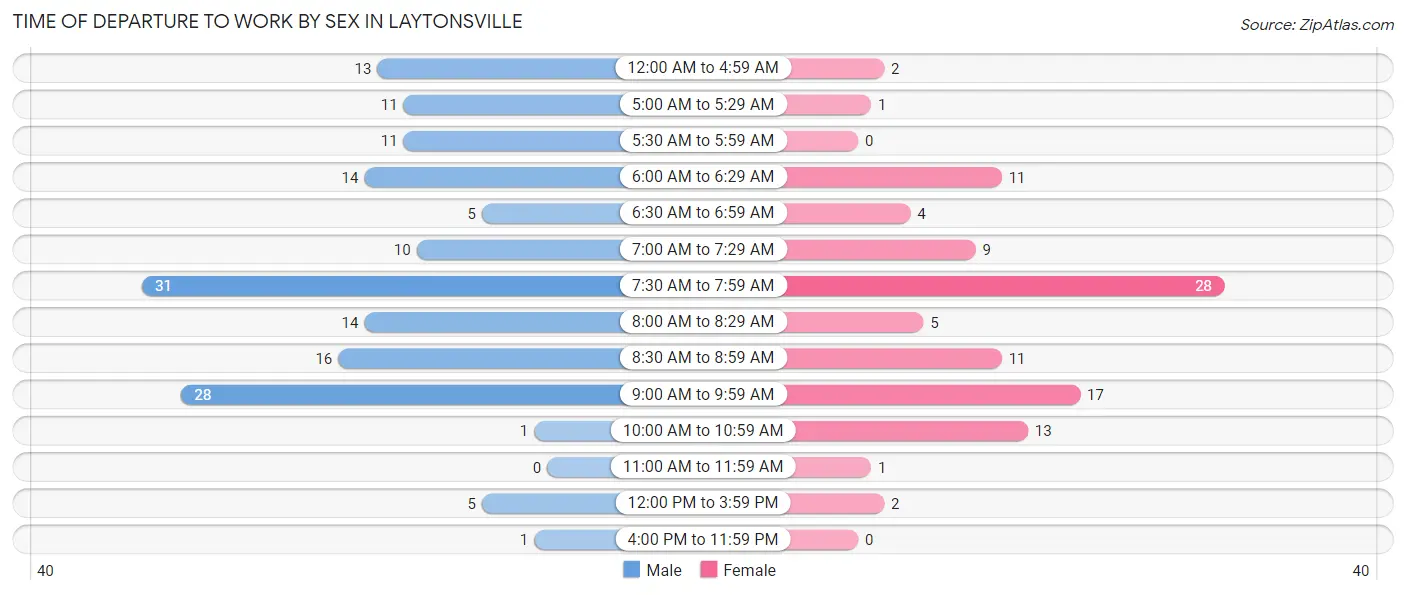
| Time of Departure | Male | Female |
| 12:00 AM to 4:59 AM | 13 (8.1%) | 2 (1.9%) |
| 5:00 AM to 5:29 AM | 11 (6.9%) | 1 (1.0%) |
| 5:30 AM to 5:59 AM | 11 (6.9%) | 0 (0.0%) |
| 6:00 AM to 6:29 AM | 14 (8.7%) | 11 (10.6%) |
| 6:30 AM to 6:59 AM | 5 (3.1%) | 4 (3.8%) |
| 7:00 AM to 7:29 AM | 10 (6.2%) | 9 (8.6%) |
| 7:30 AM to 7:59 AM | 31 (19.4%) | 28 (26.9%) |
| 8:00 AM to 8:29 AM | 14 (8.7%) | 5 (4.8%) |
| 8:30 AM to 8:59 AM | 16 (10.0%) | 11 (10.6%) |
| 9:00 AM to 9:59 AM | 28 (17.5%) | 17 (16.4%) |
| 10:00 AM to 10:59 AM | 1 (0.6%) | 13 (12.5%) |
| 11:00 AM to 11:59 AM | 0 (0.0%) | 1 (1.0%) |
| 12:00 PM to 3:59 PM | 5 (3.1%) | 2 (1.9%) |
| 4:00 PM to 11:59 PM | 1 (0.6%) | 0 (0.0%) |
| Total | 160 (100.0%) | 104 (100.0%) |
Housing Occupancy in Laytonsville
Occupancy by Ownership in Laytonsville
Of the total 242 dwellings in Laytonsville, owner-occupied units account for 223 (92.1%), while renter-occupied units make up 19 (7.9%).
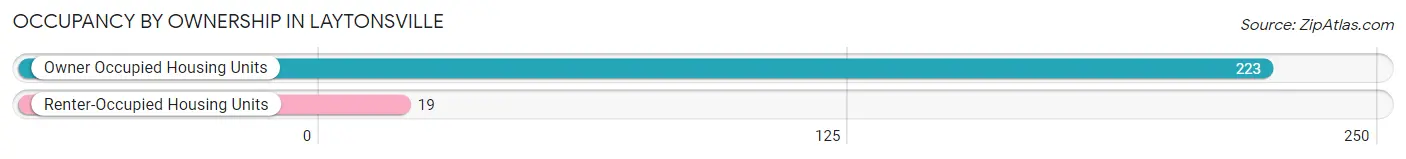
| Occupancy | # Housing Units | % Housing Units |
| Owner Occupied Housing Units | 223 | 92.1% |
| Renter-Occupied Housing Units | 19 | 7.9% |
| Total Occupied Housing Units | 242 | 100.0% |
Occupancy by Household Size in Laytonsville
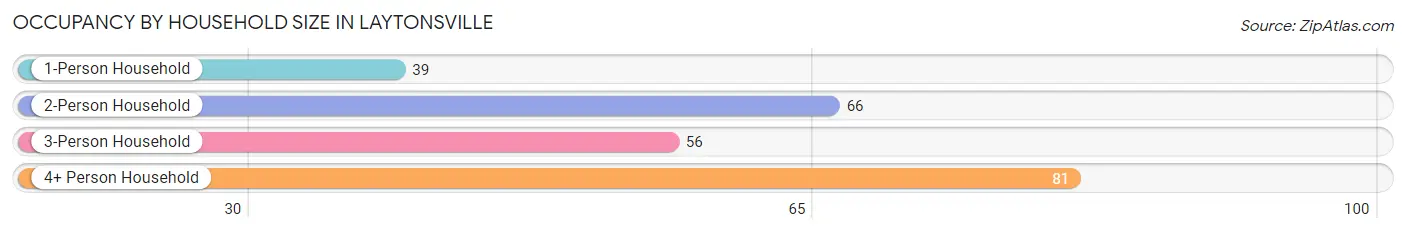
| Household Size | # Housing Units | % Housing Units |
| 1-Person Household | 39 | 16.1% |
| 2-Person Household | 66 | 27.3% |
| 3-Person Household | 56 | 23.1% |
| 4+ Person Household | 81 | 33.5% |
| Total Housing Units | 242 | 100.0% |
Occupancy by Ownership by Household Size in Laytonsville
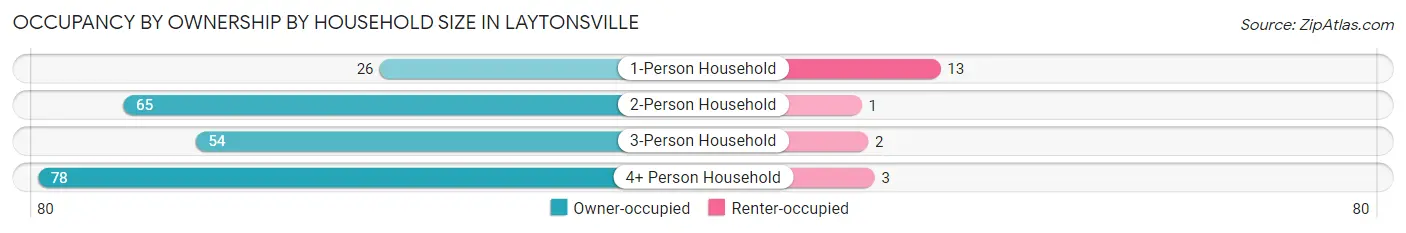
| Household Size | Owner-occupied | Renter-occupied |
| 1-Person Household | 26 (66.7%) | 13 (33.3%) |
| 2-Person Household | 65 (98.5%) | 1 (1.5%) |
| 3-Person Household | 54 (96.4%) | 2 (3.6%) |
| 4+ Person Household | 78 (96.3%) | 3 (3.7%) |
| Total Housing Units | 223 (92.1%) | 19 (7.9%) |
Occupancy by Educational Attainment in Laytonsville
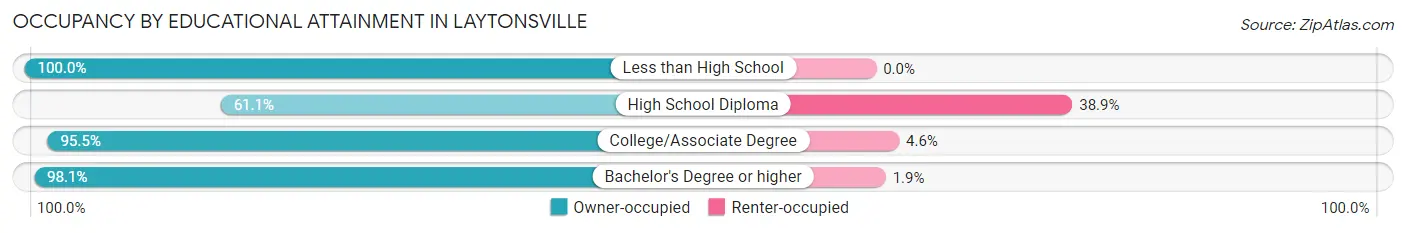
| Household Size | Owner-occupied | Renter-occupied |
| Less than High School | 4 (100.0%) | 0 (0.0%) |
| High School Diploma | 22 (61.1%) | 14 (38.9%) |
| College/Associate Degree | 42 (95.5%) | 2 (4.5%) |
| Bachelor's Degree or higher | 155 (98.1%) | 3 (1.9%) |
Occupancy by Age of Householder in Laytonsville
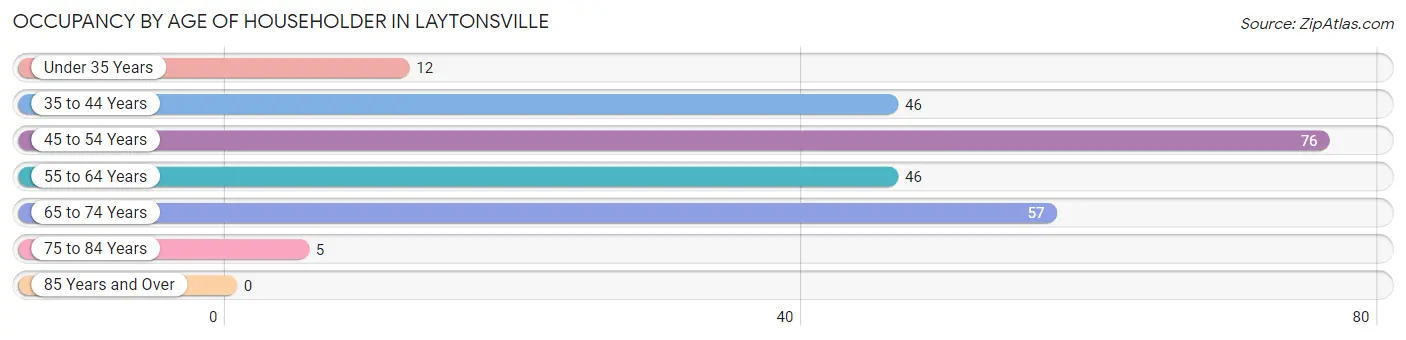
| Age Bracket | # Households | % Households |
| Under 35 Years | 12 | 5.0% |
| 35 to 44 Years | 46 | 19.0% |
| 45 to 54 Years | 76 | 31.4% |
| 55 to 64 Years | 46 | 19.0% |
| 65 to 74 Years | 57 | 23.5% |
| 75 to 84 Years | 5 | 2.1% |
| 85 Years and Over | 0 | 0.0% |
| Total | 242 | 100.0% |
Housing Finances in Laytonsville
Median Income by Occupancy in Laytonsville
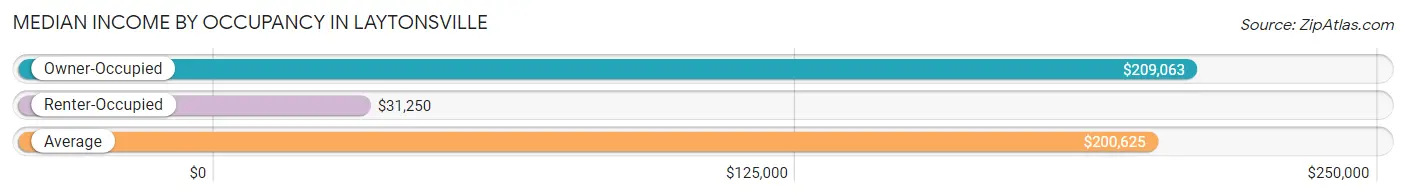
| Occupancy Type | # Households | Median Income |
| Owner-Occupied | 223 (92.1%) | $209,063 |
| Renter-Occupied | 19 (7.9%) | $31,250 |
| Average | 242 (100.0%) | $200,625 |
Occupancy by Householder Income Bracket in Laytonsville
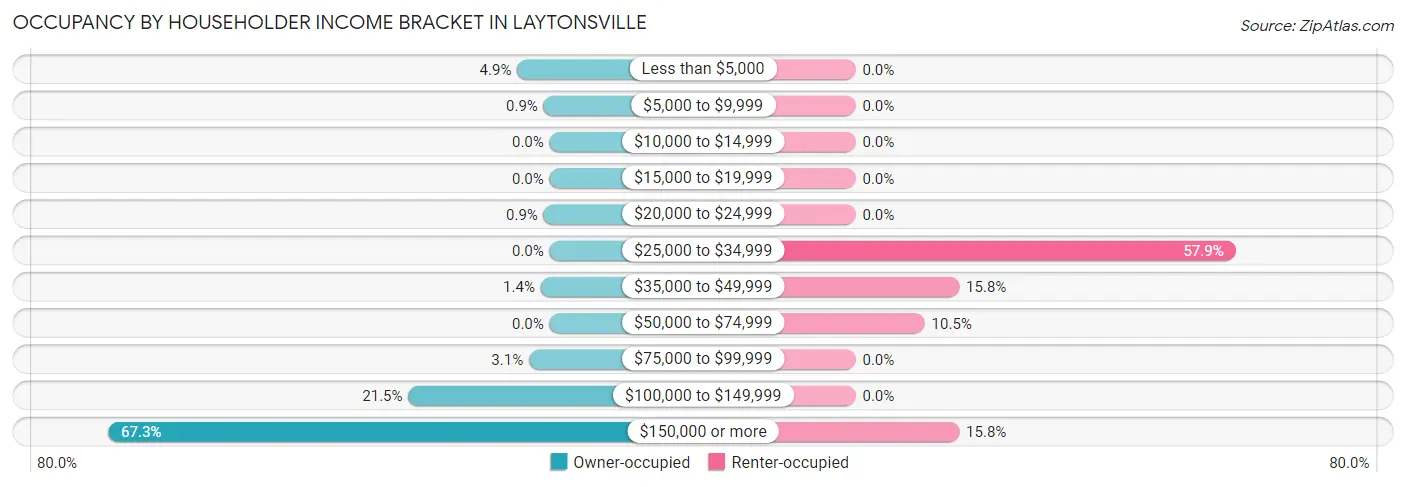
| Income Bracket | Owner-occupied | Renter-occupied |
| Less than $5,000 | 11 (4.9%) | 0 (0.0%) |
| $5,000 to $9,999 | 2 (0.9%) | 0 (0.0%) |
| $10,000 to $14,999 | 0 (0.0%) | 0 (0.0%) |
| $15,000 to $19,999 | 0 (0.0%) | 0 (0.0%) |
| $20,000 to $24,999 | 2 (0.9%) | 0 (0.0%) |
| $25,000 to $34,999 | 0 (0.0%) | 11 (57.9%) |
| $35,000 to $49,999 | 3 (1.3%) | 3 (15.8%) |
| $50,000 to $74,999 | 0 (0.0%) | 2 (10.5%) |
| $75,000 to $99,999 | 7 (3.1%) | 0 (0.0%) |
| $100,000 to $149,999 | 48 (21.5%) | 0 (0.0%) |
| $150,000 or more | 150 (67.3%) | 3 (15.8%) |
| Total | 223 (100.0%) | 19 (100.0%) |
Monthly Housing Cost Tiers in Laytonsville
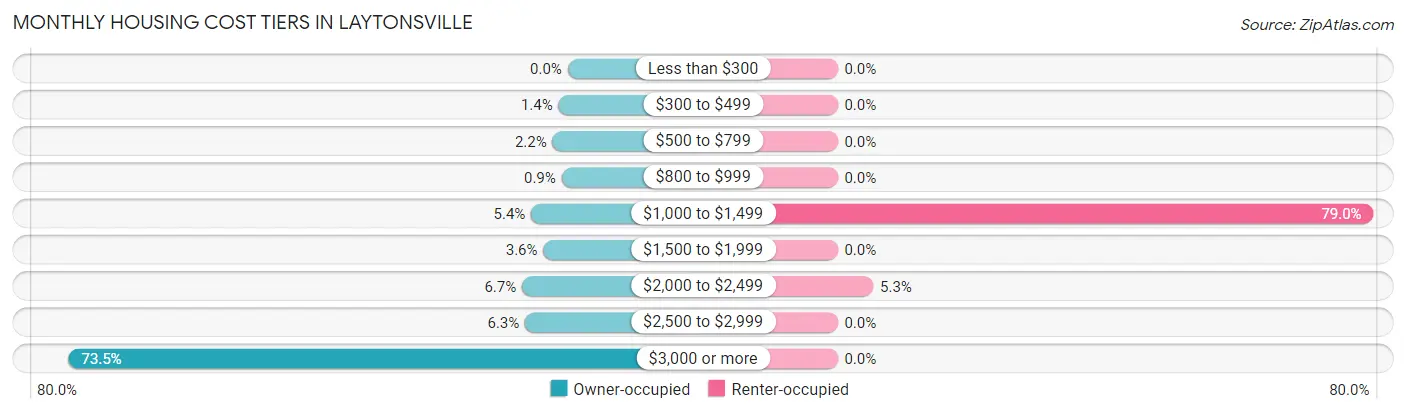
| Monthly Cost | Owner-occupied | Renter-occupied |
| Less than $300 | 0 (0.0%) | 0 (0.0%) |
| $300 to $499 | 3 (1.3%) | 0 (0.0%) |
| $500 to $799 | 5 (2.2%) | 0 (0.0%) |
| $800 to $999 | 2 (0.9%) | 0 (0.0%) |
| $1,000 to $1,499 | 12 (5.4%) | 15 (78.9%) |
| $1,500 to $1,999 | 8 (3.6%) | 0 (0.0%) |
| $2,000 to $2,499 | 15 (6.7%) | 1 (5.3%) |
| $2,500 to $2,999 | 14 (6.3%) | 0 (0.0%) |
| $3,000 or more | 164 (73.5%) | 0 (0.0%) |
| Total | 223 (100.0%) | 19 (100.0%) |
Physical Housing Characteristics in Laytonsville
Housing Structures in Laytonsville
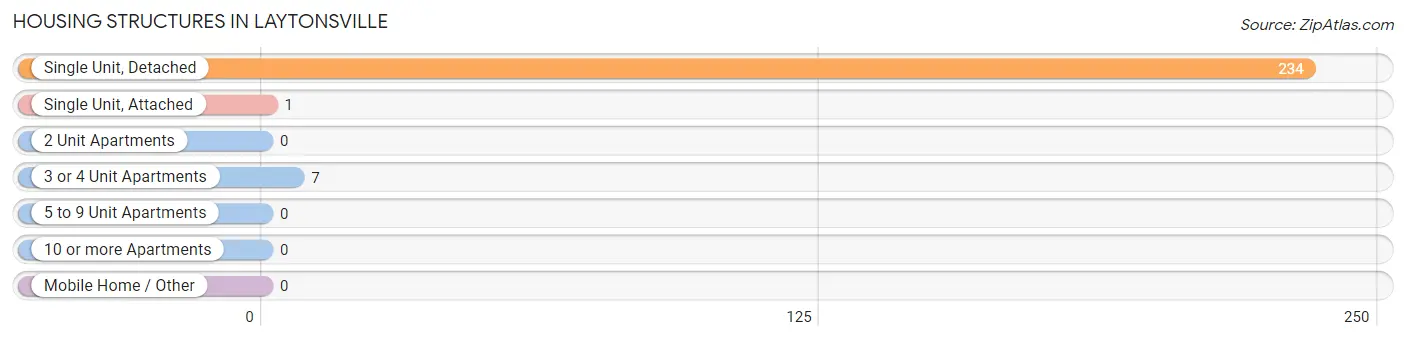
| Structure Type | # Housing Units | % Housing Units |
| Single Unit, Detached | 234 | 96.7% |
| Single Unit, Attached | 1 | 0.4% |
| 2 Unit Apartments | 0 | 0.0% |
| 3 or 4 Unit Apartments | 7 | 2.9% |
| 5 to 9 Unit Apartments | 0 | 0.0% |
| 10 or more Apartments | 0 | 0.0% |
| Mobile Home / Other | 0 | 0.0% |
| Total | 242 | 100.0% |
Housing Structures by Occupancy in Laytonsville
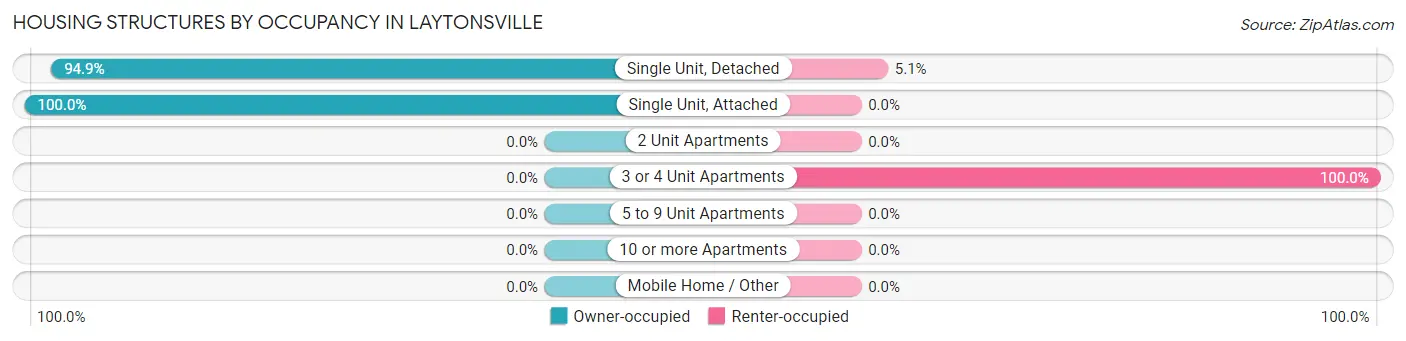
| Structure Type | Owner-occupied | Renter-occupied |
| Single Unit, Detached | 222 (94.9%) | 12 (5.1%) |
| Single Unit, Attached | 1 (100.0%) | 0 (0.0%) |
| 2 Unit Apartments | 0 (0.0%) | 0 (0.0%) |
| 3 or 4 Unit Apartments | 0 (0.0%) | 7 (100.0%) |
| 5 to 9 Unit Apartments | 0 (0.0%) | 0 (0.0%) |
| 10 or more Apartments | 0 (0.0%) | 0 (0.0%) |
| Mobile Home / Other | 0 (0.0%) | 0 (0.0%) |
| Total | 223 (92.1%) | 19 (7.9%) |
Housing Structures by Number of Rooms in Laytonsville
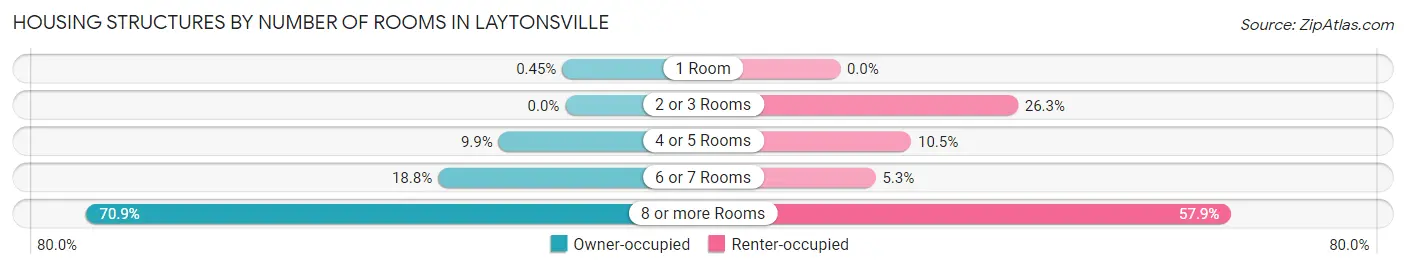
| Number of Rooms | Owner-occupied | Renter-occupied |
| 1 Room | 1 (0.4%) | 0 (0.0%) |
| 2 or 3 Rooms | 0 (0.0%) | 5 (26.3%) |
| 4 or 5 Rooms | 22 (9.9%) | 2 (10.5%) |
| 6 or 7 Rooms | 42 (18.8%) | 1 (5.3%) |
| 8 or more Rooms | 158 (70.9%) | 11 (57.9%) |
| Total | 223 (100.0%) | 19 (100.0%) |
Housing Structure by Heating Type in Laytonsville
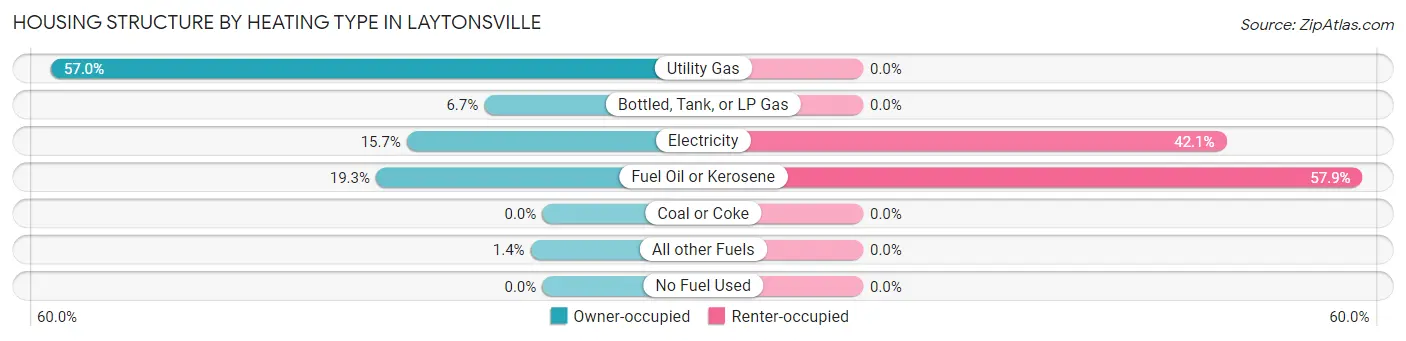
| Heating Type | Owner-occupied | Renter-occupied |
| Utility Gas | 127 (57.0%) | 0 (0.0%) |
| Bottled, Tank, or LP Gas | 15 (6.7%) | 0 (0.0%) |
| Electricity | 35 (15.7%) | 8 (42.1%) |
| Fuel Oil or Kerosene | 43 (19.3%) | 11 (57.9%) |
| Coal or Coke | 0 (0.0%) | 0 (0.0%) |
| All other Fuels | 3 (1.3%) | 0 (0.0%) |
| No Fuel Used | 0 (0.0%) | 0 (0.0%) |
| Total | 223 (100.0%) | 19 (100.0%) |
Household Vehicle Usage in Laytonsville
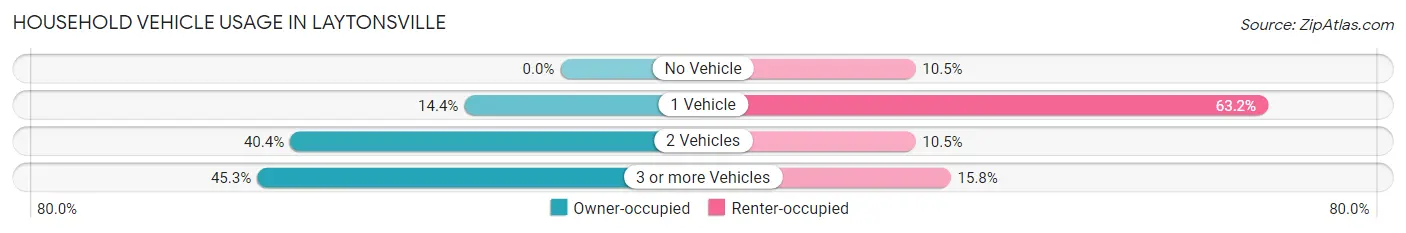
| Vehicles per Household | Owner-occupied | Renter-occupied |
| No Vehicle | 0 (0.0%) | 2 (10.5%) |
| 1 Vehicle | 32 (14.3%) | 12 (63.2%) |
| 2 Vehicles | 90 (40.4%) | 2 (10.5%) |
| 3 or more Vehicles | 101 (45.3%) | 3 (15.8%) |
| Total | 223 (100.0%) | 19 (100.0%) |
Real Estate & Mortgages in Laytonsville
Real Estate and Mortgage Overview in Laytonsville
| Characteristic | Without Mortgage | With Mortgage |
| Housing Units | 24 | 199 |
| Median Property Value | $666,700 | $1,043,600 |
| Median Household Income | $208,750 | $136 |
| Monthly Housing Costs | $1,133 | $164 |
| Real Estate Taxes | $6,875 | $1 |
Property Value by Mortgage Status in Laytonsville
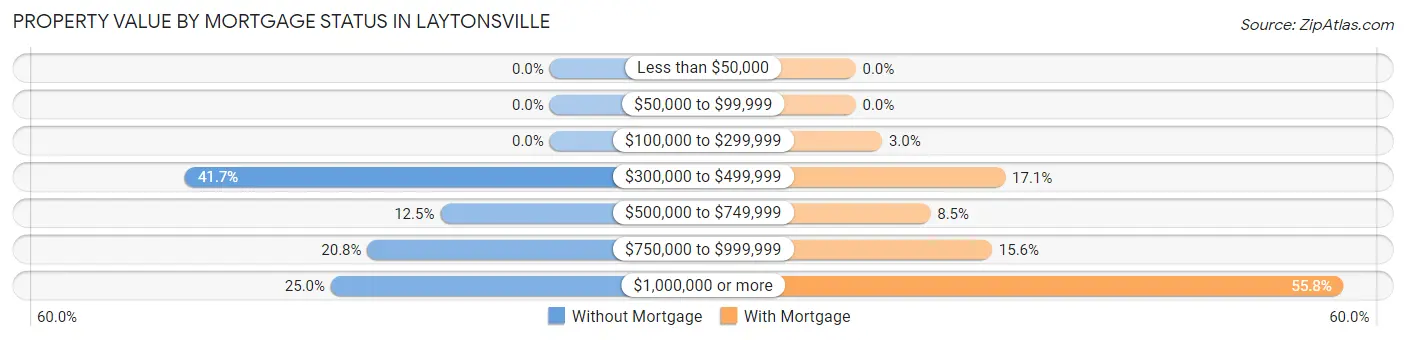
| Property Value | Without Mortgage | With Mortgage |
| Less than $50,000 | 0 (0.0%) | 0 (0.0%) |
| $50,000 to $99,999 | 0 (0.0%) | 0 (0.0%) |
| $100,000 to $299,999 | 0 (0.0%) | 6 (3.0%) |
| $300,000 to $499,999 | 10 (41.7%) | 34 (17.1%) |
| $500,000 to $749,999 | 3 (12.5%) | 17 (8.5%) |
| $750,000 to $999,999 | 5 (20.8%) | 31 (15.6%) |
| $1,000,000 or more | 6 (25.0%) | 111 (55.8%) |
| Total | 24 (100.0%) | 199 (100.0%) |
Household Income by Mortgage Status in Laytonsville
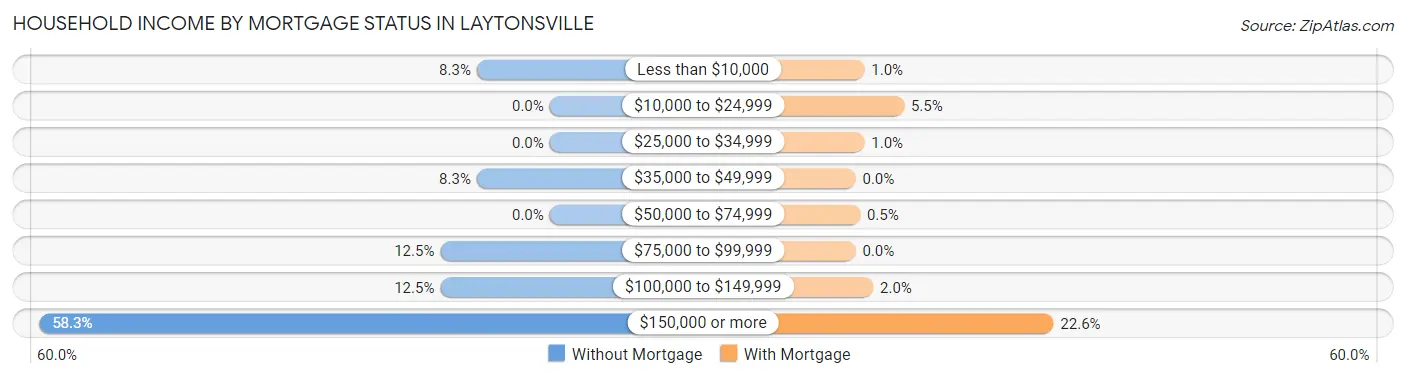
| Household Income | Without Mortgage | With Mortgage |
| Less than $10,000 | 2 (8.3%) | 2 (1.0%) |
| $10,000 to $24,999 | 0 (0.0%) | 11 (5.5%) |
| $25,000 to $34,999 | 0 (0.0%) | 2 (1.0%) |
| $35,000 to $49,999 | 2 (8.3%) | 0 (0.0%) |
| $50,000 to $74,999 | 0 (0.0%) | 1 (0.5%) |
| $75,000 to $99,999 | 3 (12.5%) | 0 (0.0%) |
| $100,000 to $149,999 | 3 (12.5%) | 4 (2.0%) |
| $150,000 or more | 14 (58.3%) | 45 (22.6%) |
| Total | 24 (100.0%) | 199 (100.0%) |
Property Value to Household Income Ratio in Laytonsville
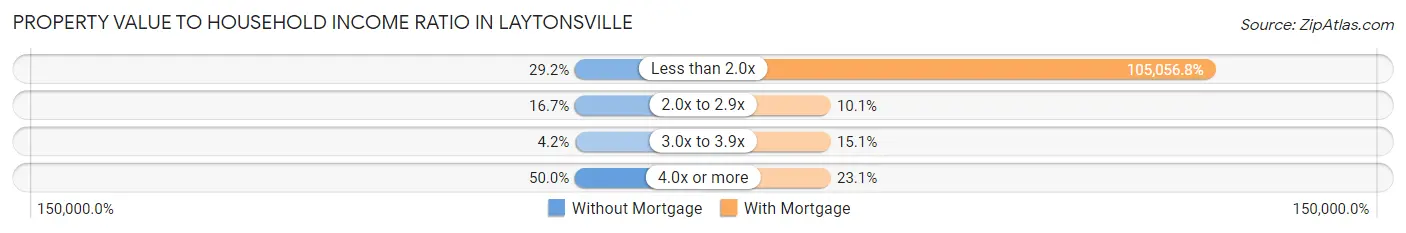
| Value-to-Income Ratio | Without Mortgage | With Mortgage |
| Less than 2.0x | 7 (29.2%) | 209,063 (105,056.8%) |
| 2.0x to 2.9x | 4 (16.7%) | 20 (10.1%) |
| 3.0x to 3.9x | 1 (4.2%) | 30 (15.1%) |
| 4.0x or more | 12 (50.0%) | 46 (23.1%) |
| Total | 24 (100.0%) | 199 (100.0%) |
Real Estate Taxes by Mortgage Status in Laytonsville
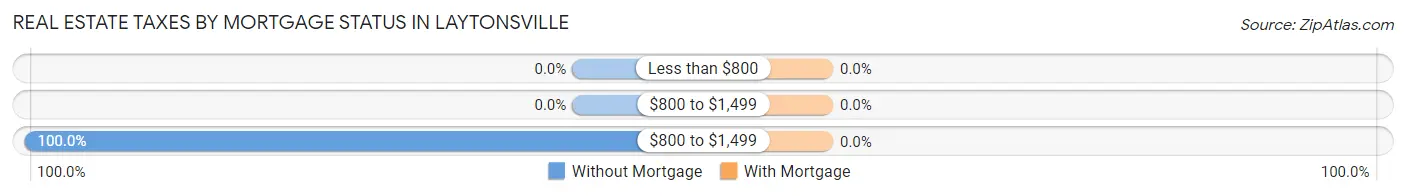
| Property Taxes | Without Mortgage | With Mortgage |
| Less than $800 | 0 (0.0%) | 0 (0.0%) |
| $800 to $1,499 | 0 (0.0%) | 0 (0.0%) |
| $800 to $1,499 | 24 (100.0%) | 0 (0.0%) |
| Total | 24 (100.0%) | 199 (100.0%) |
Health & Disability in Laytonsville
Health Insurance Coverage by Age in Laytonsville
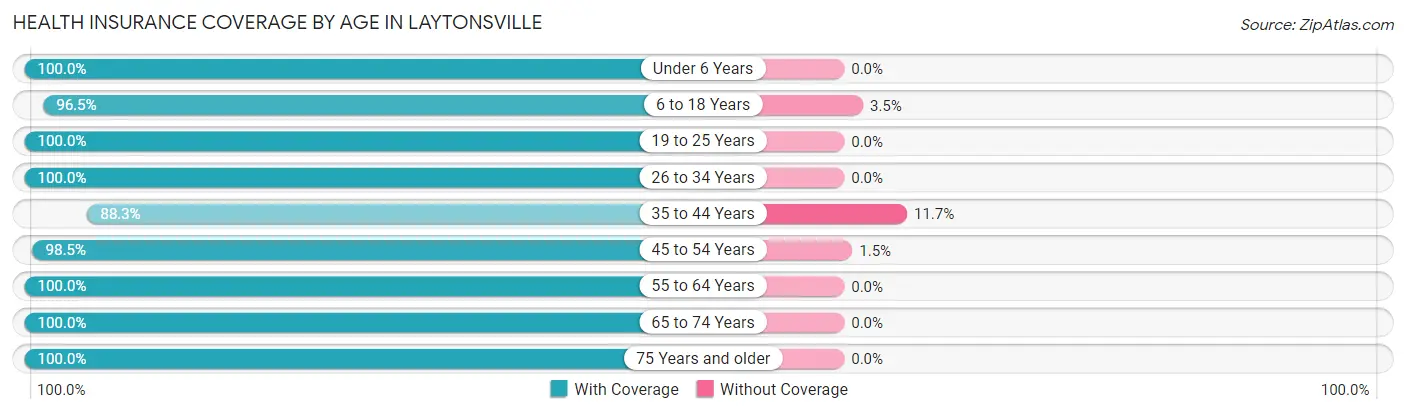
| Age Bracket | With Coverage | Without Coverage |
| Under 6 Years | 27 (100.0%) | 0 (0.0%) |
| 6 to 18 Years | 193 (96.5%) | 7 (3.5%) |
| 19 to 25 Years | 36 (100.0%) | 0 (0.0%) |
| 26 to 34 Years | 27 (100.0%) | 0 (0.0%) |
| 35 to 44 Years | 83 (88.3%) | 11 (11.7%) |
| 45 to 54 Years | 131 (98.5%) | 2 (1.5%) |
| 55 to 64 Years | 100 (100.0%) | 0 (0.0%) |
| 65 to 74 Years | 97 (100.0%) | 0 (0.0%) |
| 75 Years and older | 14 (100.0%) | 0 (0.0%) |
| Total | 708 (97.3%) | 20 (2.8%) |
Health Insurance Coverage by Citizenship Status in Laytonsville
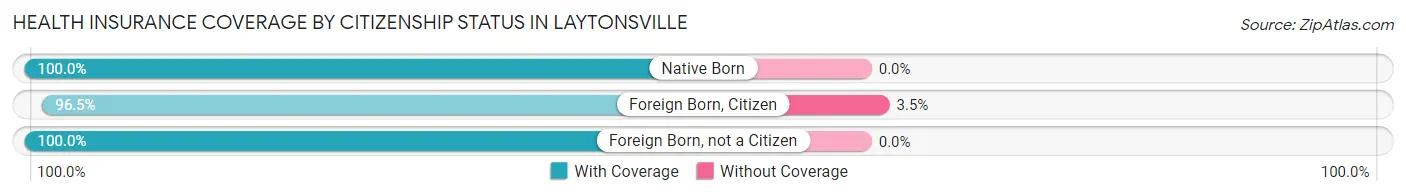
| Citizenship Status | With Coverage | Without Coverage |
| Native Born | 27 (100.0%) | 0 (0.0%) |
| Foreign Born, Citizen | 193 (96.5%) | 7 (3.5%) |
| Foreign Born, not a Citizen | 36 (100.0%) | 0 (0.0%) |
Health Insurance Coverage by Household Income in Laytonsville
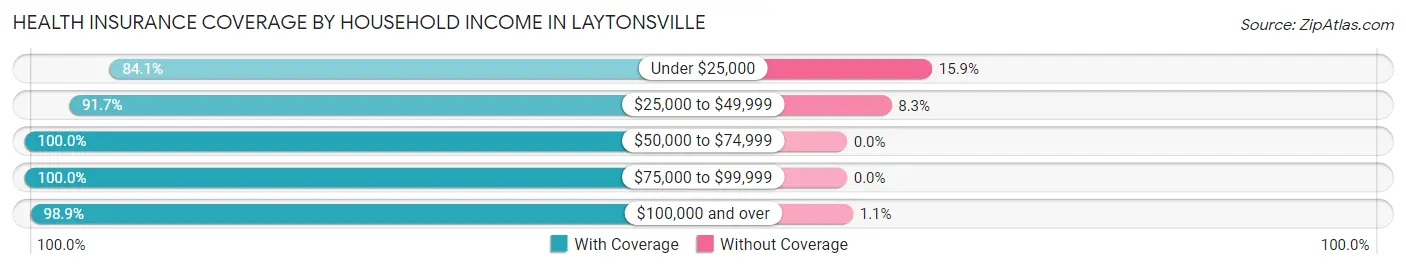
| Household Income | With Coverage | Without Coverage |
| Under $25,000 | 58 (84.1%) | 11 (15.9%) |
| $25,000 to $49,999 | 22 (91.7%) | 2 (8.3%) |
| $50,000 to $74,999 | 2 (100.0%) | 0 (0.0%) |
| $75,000 to $99,999 | 10 (100.0%) | 0 (0.0%) |
| $100,000 and over | 616 (98.9%) | 7 (1.1%) |
Public vs Private Health Insurance Coverage by Age in Laytonsville
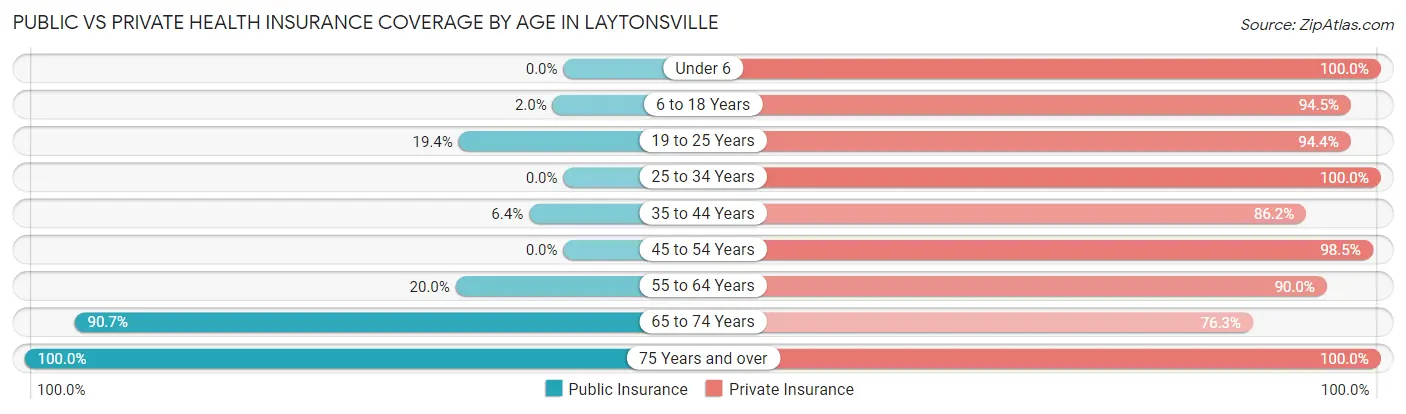
| Age Bracket | Public Insurance | Private Insurance |
| Under 6 | 0 (0.0%) | 27 (100.0%) |
| 6 to 18 Years | 4 (2.0%) | 189 (94.5%) |
| 19 to 25 Years | 7 (19.4%) | 34 (94.4%) |
| 25 to 34 Years | 0 (0.0%) | 27 (100.0%) |
| 35 to 44 Years | 6 (6.4%) | 81 (86.2%) |
| 45 to 54 Years | 0 (0.0%) | 131 (98.5%) |
| 55 to 64 Years | 20 (20.0%) | 90 (90.0%) |
| 65 to 74 Years | 88 (90.7%) | 74 (76.3%) |
| 75 Years and over | 14 (100.0%) | 14 (100.0%) |
| Total | 139 (19.1%) | 667 (91.6%) |
Disability Status by Sex by Age in Laytonsville
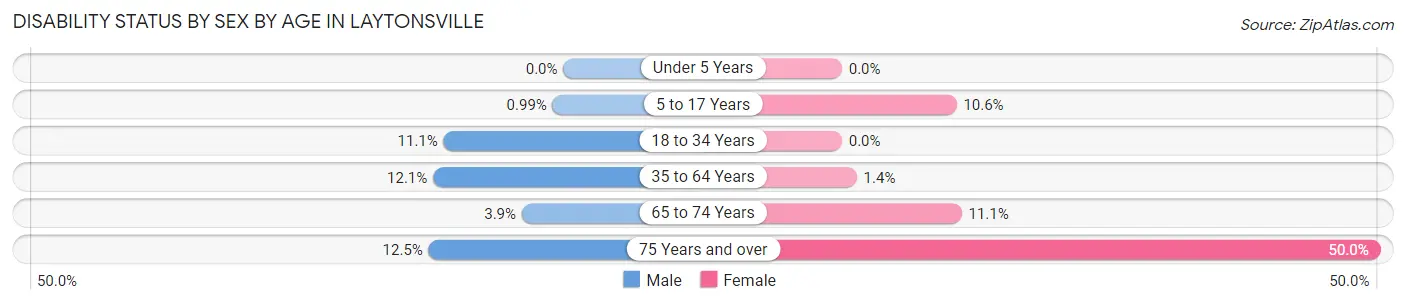
| Age Bracket | Male | Female |
| Under 5 Years | 0 (0.0%) | 0 (0.0%) |
| 5 to 17 Years | 1 (1.0%) | 10 (10.6%) |
| 18 to 34 Years | 5 (11.1%) | 0 (0.0%) |
| 35 to 64 Years | 22 (12.1%) | 2 (1.4%) |
| 65 to 74 Years | 2 (3.8%) | 5 (11.1%) |
| 75 Years and over | 1 (12.5%) | 3 (50.0%) |
Disability Class by Sex by Age in Laytonsville
Disability Class: Hearing Difficulty
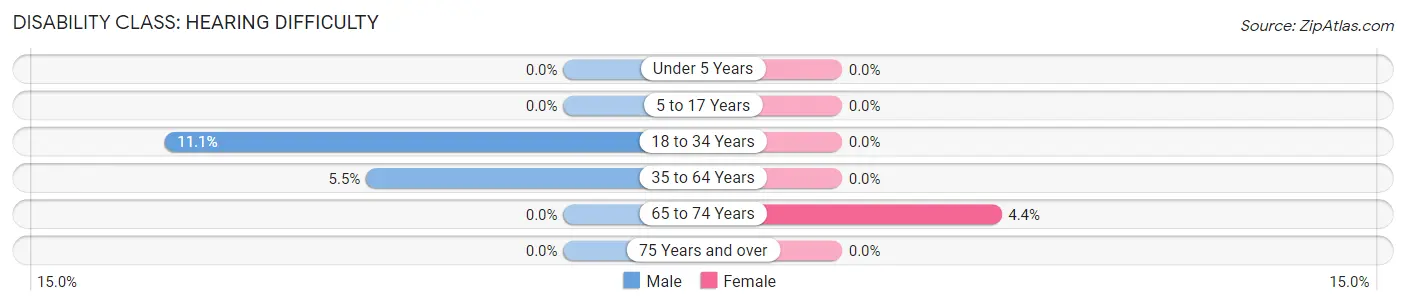
| Age Bracket | Male | Female |
| Under 5 Years | 0 (0.0%) | 0 (0.0%) |
| 5 to 17 Years | 0 (0.0%) | 0 (0.0%) |
| 18 to 34 Years | 5 (11.1%) | 0 (0.0%) |
| 35 to 64 Years | 10 (5.5%) | 0 (0.0%) |
| 65 to 74 Years | 0 (0.0%) | 2 (4.4%) |
| 75 Years and over | 0 (0.0%) | 0 (0.0%) |
Disability Class: Vision Difficulty
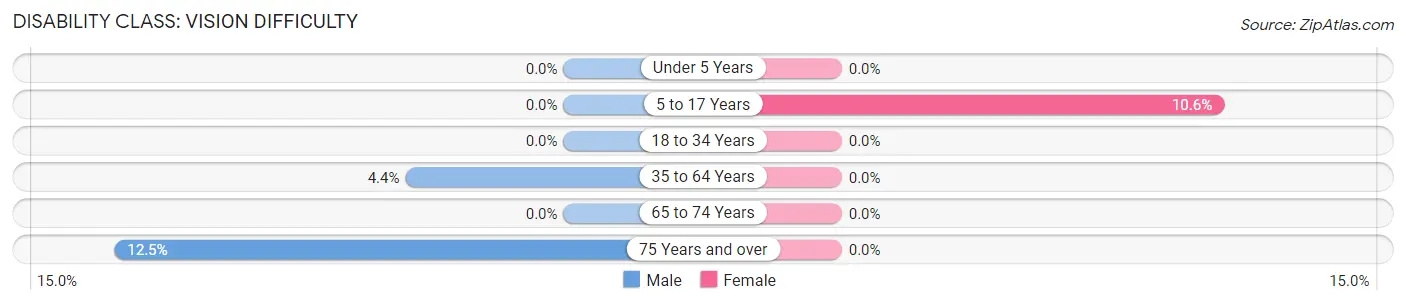
| Age Bracket | Male | Female |
| Under 5 Years | 0 (0.0%) | 0 (0.0%) |
| 5 to 17 Years | 0 (0.0%) | 10 (10.6%) |
| 18 to 34 Years | 0 (0.0%) | 0 (0.0%) |
| 35 to 64 Years | 8 (4.4%) | 0 (0.0%) |
| 65 to 74 Years | 0 (0.0%) | 0 (0.0%) |
| 75 Years and over | 1 (12.5%) | 0 (0.0%) |
Disability Class: Cognitive Difficulty
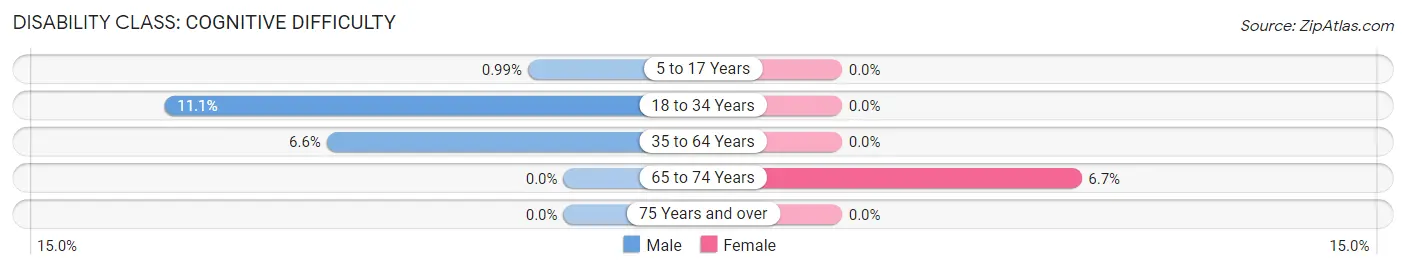
| Age Bracket | Male | Female |
| 5 to 17 Years | 1 (1.0%) | 0 (0.0%) |
| 18 to 34 Years | 5 (11.1%) | 0 (0.0%) |
| 35 to 64 Years | 12 (6.6%) | 0 (0.0%) |
| 65 to 74 Years | 0 (0.0%) | 3 (6.7%) |
| 75 Years and over | 0 (0.0%) | 0 (0.0%) |
Disability Class: Ambulatory Difficulty
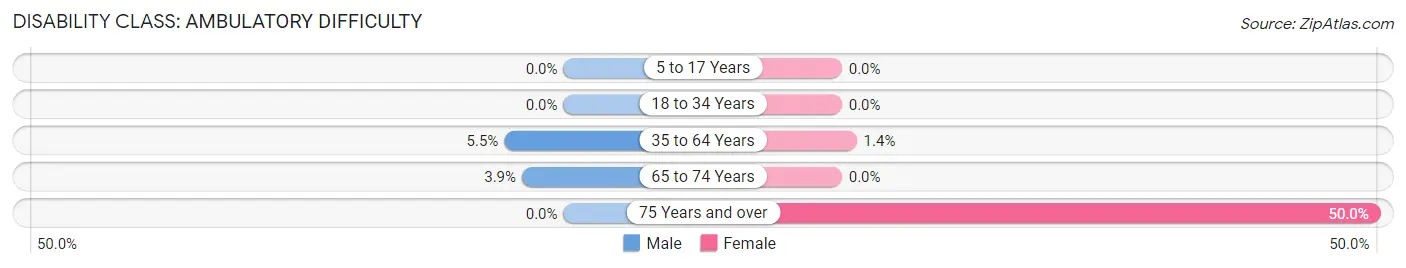
| Age Bracket | Male | Female |
| 5 to 17 Years | 0 (0.0%) | 0 (0.0%) |
| 18 to 34 Years | 0 (0.0%) | 0 (0.0%) |
| 35 to 64 Years | 10 (5.5%) | 2 (1.4%) |
| 65 to 74 Years | 2 (3.8%) | 0 (0.0%) |
| 75 Years and over | 0 (0.0%) | 3 (50.0%) |
Disability Class: Self-Care Difficulty
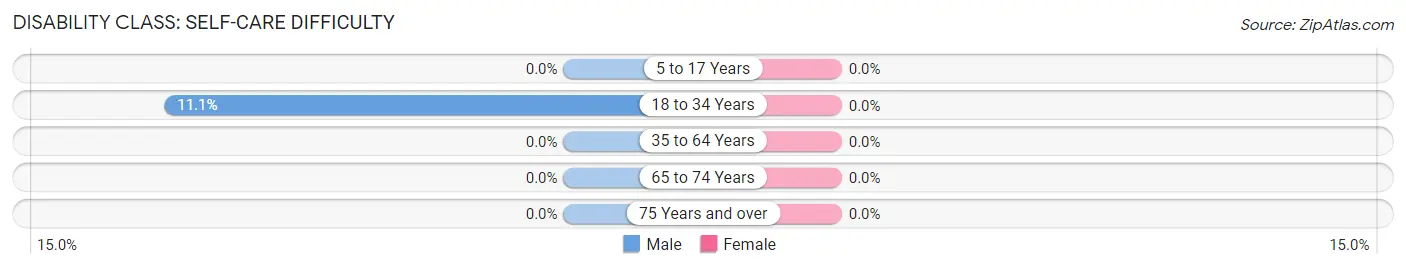
| Age Bracket | Male | Female |
| 5 to 17 Years | 0 (0.0%) | 0 (0.0%) |
| 18 to 34 Years | 5 (11.1%) | 0 (0.0%) |
| 35 to 64 Years | 0 (0.0%) | 0 (0.0%) |
| 65 to 74 Years | 0 (0.0%) | 0 (0.0%) |
| 75 Years and over | 0 (0.0%) | 0 (0.0%) |
Technology Access in Laytonsville
Computing Device Access in Laytonsville
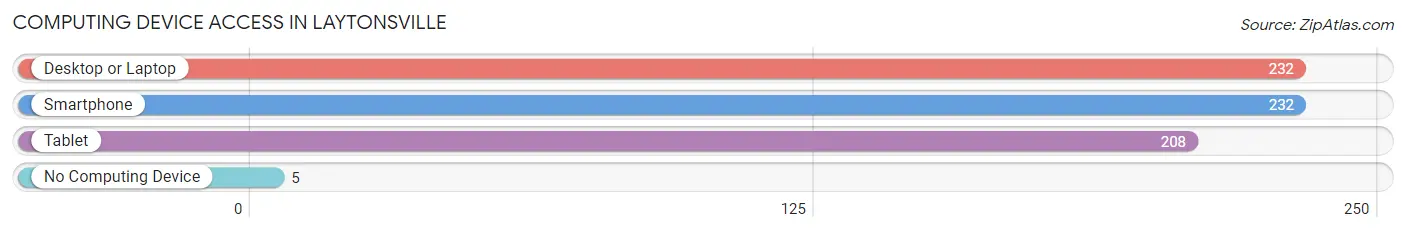
| Device Type | # Households | % Households |
| Desktop or Laptop | 232 | 95.9% |
| Smartphone | 232 | 95.9% |
| Tablet | 208 | 86.0% |
| No Computing Device | 5 | 2.1% |
| Total | 242 | 100.0% |
Internet Access in Laytonsville
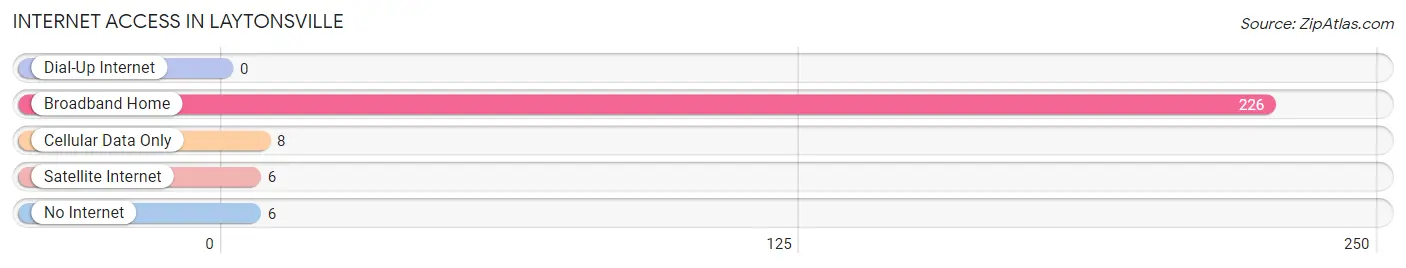
| Internet Type | # Households | % Households |
| Dial-Up Internet | 0 | 0.0% |
| Broadband Home | 226 | 93.4% |
| Cellular Data Only | 8 | 3.3% |
| Satellite Internet | 6 | 2.5% |
| No Internet | 6 | 2.5% |
| Total | 242 | 100.0% |
Laytonsville Summary
History
Laytonsville, Maryland is a small unincorporated community located in Montgomery County, Maryland. It is situated in the northern part of the county, about 20 miles northwest of Washington, D.C. The area was first settled in the late 1700s by the Layton family, who were Quakers from Pennsylvania. The Laytons were among the first settlers in the area, and the community was named after them.
The area was primarily agricultural until the mid-1800s, when the Baltimore and Ohio Railroad was built through the area. This brought new economic opportunities to the area, and the population began to grow. The town was officially incorporated in 1887, and the first post office was established in 1891.
In the early 1900s, Laytonsville was a thriving agricultural community, with several farms and businesses. The town also had a school, a church, and a general store. The town was also home to a number of small businesses, including a blacksmith, a mill, and a cannery.
In the 1950s, the area began to experience rapid growth as the Washington, D.C. metropolitan area expanded. This led to the development of new residential neighborhoods and businesses in the area. The population of Laytonsville grew from 1,000 in 1950 to over 5,000 by 2000.
Geography
Laytonsville is located in northern Montgomery County, Maryland, about 20 miles northwest of Washington, D.C. The town is situated in the Piedmont region of Maryland, and is surrounded by rolling hills and forests. The area is part of the Chesapeake Bay watershed, and is home to several creeks and streams.
The climate in Laytonsville is temperate, with hot summers and cold winters. The average annual temperature is around 55 degrees Fahrenheit. The area receives an average of 45 inches of precipitation per year, with most of it falling in the form of rain.
Economy
The economy of Laytonsville is largely based on the service industry. The town is home to a number of small businesses, including restaurants, retail stores, and professional services. The town is also home to a number of government agencies, including the Montgomery County Department of Parks and Recreation and the Montgomery County Public Schools.
The town is also home to a number of technology companies, including the software company, Microsoft. The town is also home to a number of biotech companies, including the biopharmaceutical company, Novavax.
Demographics
As of the 2010 census, the population of Laytonsville was 5,837. The population is largely white (86.3%), with a small African American population (7.2%) and a small Hispanic population (3.2%). The median household income in the town is $107,945, and the median home value is $521,000. The town has a low unemployment rate (3.2%) and a high rate of homeownership (83.2%).
Common Questions
What is Per Capita Income in Laytonsville?
Per Capita income in Laytonsville is $76,757.
What is the Median Family Income in Laytonsville?
Median Family Income in Laytonsville is $227,500.
What is the Median Household income in Laytonsville?
Median Household Income in Laytonsville is $200,625.
What is Income or Wage Gap in Laytonsville?
Income or Wage Gap in Laytonsville is 28.6%.
Women in Laytonsville earn 71.4 cents for every dollar earned by a man.
What is Inequality or Gini Index in Laytonsville?
Inequality or Gini Index in Laytonsville is 0.41.
What is the Total Population of Laytonsville?
Total Population of Laytonsville is 736.
What is the Total Male Population of Laytonsville?
Total Male Population of Laytonsville is 393.
What is the Total Female Population of Laytonsville?
Total Female Population of Laytonsville is 343.
What is the Ratio of Males per 100 Females in Laytonsville?
There are 114.58 Males per 100 Females in Laytonsville.
What is the Ratio of Females per 100 Males in Laytonsville?
There are 87.28 Females per 100 Males in Laytonsville.
What is the Median Population Age in Laytonsville?
Median Population Age in Laytonsville is 43.4 Years.
What is the Average Family Size in Laytonsville
Average Family Size in Laytonsville is 3.5 People.
What is the Average Household Size in Laytonsville
Average Household Size in Laytonsville is 3.0 People.
How Large is the Labor Force in Laytonsville?
There are 385 People in the Labor Forcein in Laytonsville.
What is the Percentage of People in the Labor Force in Laytonsville?
69.1% of People are in the Labor Force in Laytonsville.
What is the Unemployment Rate in Laytonsville?
Unemployment Rate in Laytonsville is 3.7%.