Cities with the Highest Poverty Level Among Females Between Ages 18 and 24 in Maryland
RELATED REPORTS & OPTIONS
Highest Poverty | Female 18-24
Maryland
Compare Cities
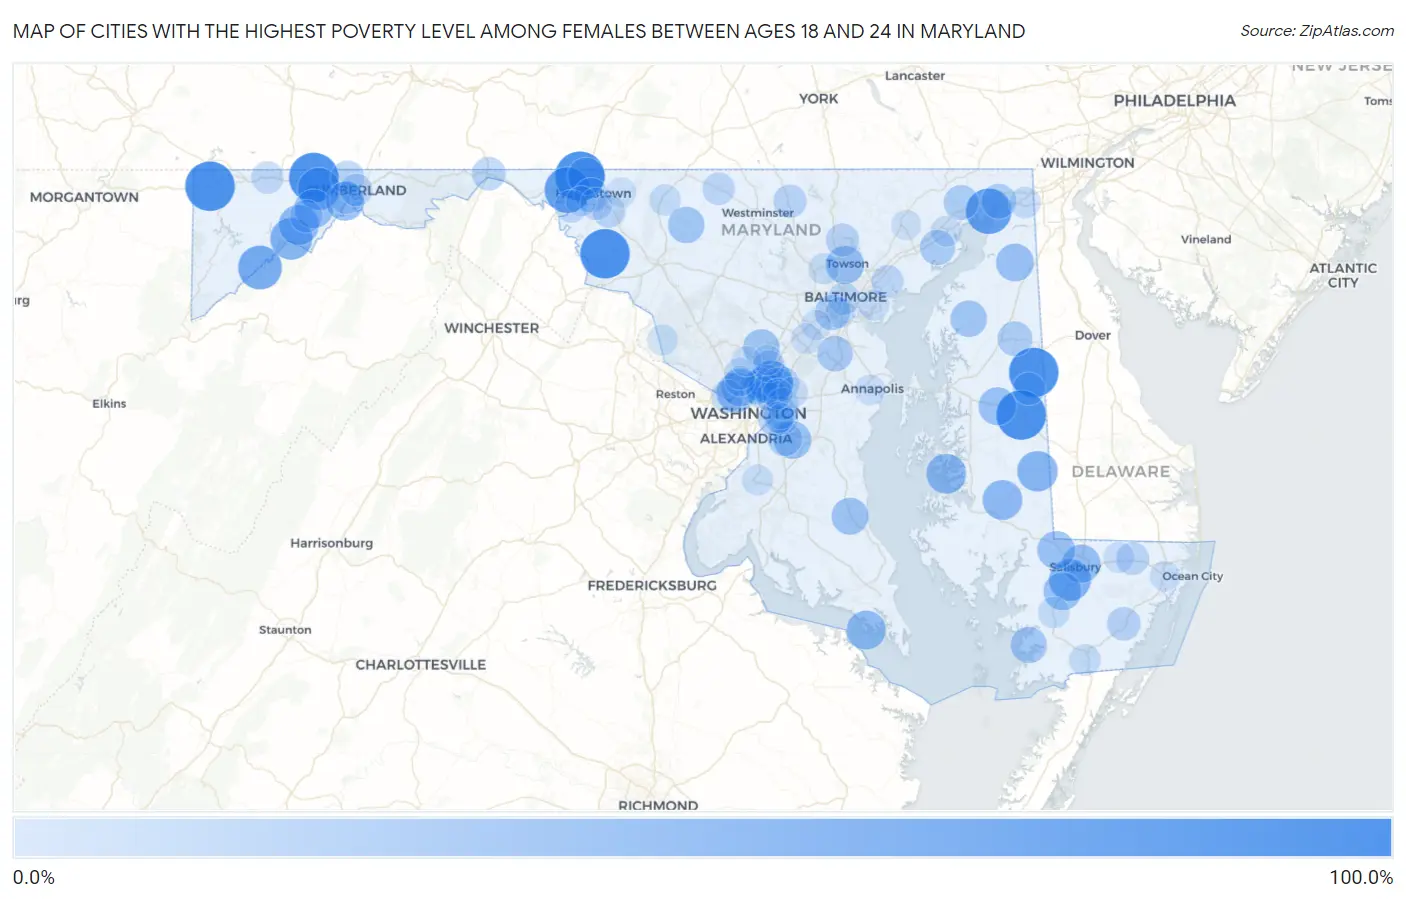
Map of Cities with the Highest Poverty Level Among Females Between Ages 18 and 24 in Maryland
0.0%
100.0%
Cities with the Highest Poverty Level Among Females Between Ages 18 and 24 in Maryland
| City | Female Poverty | vs State | vs National | |
| 1. | Finzel | 100.0% | 15.9%(+84.1)#1 | 21.6%(+78.4)#264 |
| 2. | Friendsville | 100.0% | 15.9%(+84.1)#2 | 21.6%(+78.4)#447 |
| 3. | Goldsboro | 100.0% | 15.9%(+84.1)#3 | 21.6%(+78.4)#664 |
| 4. | Rohrersville | 100.0% | 15.9%(+84.1)#4 | 21.6%(+78.4)#677 |
| 5. | Cearfoss | 100.0% | 15.9%(+84.1)#5 | 21.6%(+78.4)#767 |
| 6. | West Denton | 100.0% | 15.9%(+84.1)#6 | 21.6%(+78.4)#952 |
| 7. | Wilson Conococheague | 83.9% | 15.9%(+68.0)#7 | 21.6%(+62.3)#1,188 |
| 8. | Charlestown | 83.3% | 15.9%(+67.4)#8 | 21.6%(+61.7)#1,196 |
| 9. | Kitzmiller | 75.0% | 15.9%(+59.1)#9 | 21.6%(+53.4)#1,511 |
| 10. | College Park | 74.0% | 15.9%(+58.0)#10 | 21.6%(+52.4)#1,539 |
| 11. | Frostburg | 68.0% | 15.9%(+52.0)#11 | 21.6%(+46.4)#1,807 |
| 12. | Westernport | 66.7% | 15.9%(+50.7)#12 | 21.6%(+45.1)#1,858 |
| 13. | Fruitland | 66.6% | 15.9%(+50.7)#13 | 21.6%(+45.0)#1,950 |
| 14. | Federalsburg | 61.3% | 15.9%(+45.3)#14 | 21.6%(+39.7)#2,237 |
| 15. | Barton | 59.1% | 15.9%(+43.2)#15 | 21.6%(+37.5)#2,397 |
| 16. | Oxford | 57.9% | 15.9%(+42.0)#16 | 21.6%(+36.3)#2,488 |
| 17. | East New Market | 57.9% | 15.9%(+42.0)#17 | 21.6%(+36.3)#2,495 |
| 18. | Friendship Heights Village | 55.5% | 15.9%(+39.6)#18 | 21.6%(+33.9)#2,705 |
| 19. | Piney Point | 54.5% | 15.9%(+38.6)#19 | 21.6%(+32.9)#2,763 |
| 20. | Midland | 53.8% | 15.9%(+37.9)#20 | 21.6%(+32.2)#2,825 |
| 21. | Potomac Park | 53.1% | 15.9%(+37.2)#21 | 21.6%(+31.5)#2,914 |
| 22. | Salisbury | 51.7% | 15.9%(+35.7)#22 | 21.6%(+30.1)#3,054 |
| 23. | Towson | 51.1% | 15.9%(+35.2)#23 | 21.6%(+29.5)#3,094 |
| 24. | Hebron | 50.0% | 15.9%(+34.1)#24 | 21.6%(+28.4)#3,182 |
| 25. | Chevy Chase Section Three | 50.0% | 15.9%(+34.1)#25 | 21.6%(+28.4)#3,188 |
| 26. | Eden | 50.0% | 15.9%(+34.1)#26 | 21.6%(+28.4)#3,189 |
| 27. | Cecilton | 50.0% | 15.9%(+34.1)#27 | 21.6%(+28.4)#3,196 |
| 28. | Hillsboro | 50.0% | 15.9%(+34.1)#28 | 21.6%(+28.4)#3,325 |
| 29. | Melwood | 49.7% | 15.9%(+33.8)#29 | 21.6%(+28.1)#3,358 |
| 30. | Maugansville | 47.4% | 15.9%(+31.4)#30 | 21.6%(+25.8)#3,550 |
| 31. | Prince Frederick | 46.3% | 15.9%(+30.4)#31 | 21.6%(+24.7)#3,677 |
| 32. | Spencerville | 44.7% | 15.9%(+28.8)#32 | 21.6%(+23.1)#3,895 |
| 33. | Chestertown | 44.4% | 15.9%(+28.4)#33 | 21.6%(+22.8)#3,943 |
| 34. | Woodsboro | 43.9% | 15.9%(+28.0)#34 | 21.6%(+22.3)#3,977 |
| 35. | Fairmount | 43.4% | 15.9%(+27.5)#35 | 21.6%(+21.8)#4,037 |
| 36. | Ten Mile Creek | 42.9% | 15.9%(+26.9)#36 | 21.6%(+21.3)#4,098 |
| 37. | Adelphi | 41.1% | 15.9%(+25.2)#37 | 21.6%(+19.5)#4,384 |
| 38. | Gambrills | 40.0% | 15.9%(+24.1)#38 | 21.6%(+18.4)#4,515 |
| 39. | Lansdowne | 39.4% | 15.9%(+23.4)#39 | 21.6%(+17.8)#4,673 |
| 40. | Perryman | 38.8% | 15.9%(+22.9)#40 | 21.6%(+17.2)#4,755 |
| 41. | Flower Hill | 38.1% | 15.9%(+22.2)#41 | 21.6%(+16.5)#4,870 |
| 42. | Port Deposit | 37.9% | 15.9%(+22.0)#42 | 21.6%(+16.3)#4,887 |
| 43. | North East | 37.5% | 15.9%(+21.6)#43 | 21.6%(+15.9)#4,932 |
| 44. | Barclay | 37.5% | 15.9%(+21.6)#44 | 21.6%(+15.9)#4,987 |
| 45. | Andrews Afb | 36.2% | 15.9%(+20.3)#45 | 21.6%(+14.6)#5,178 |
| 46. | Coral Hills | 35.2% | 15.9%(+19.3)#46 | 21.6%(+13.6)#5,329 |
| 47. | Hagerstown | 34.4% | 15.9%(+18.5)#47 | 21.6%(+12.8)#5,462 |
| 48. | Langley Park | 34.3% | 15.9%(+18.4)#48 | 21.6%(+12.7)#5,476 |
| 49. | Takoma Park | 33.0% | 15.9%(+17.0)#49 | 21.6%(+11.4)#5,860 |
| 50. | Greenbelt | 32.5% | 15.9%(+16.5)#50 | 21.6%(+10.9)#5,941 |
| 51. | Hancock | 32.4% | 15.9%(+16.4)#51 | 21.6%(+10.8)#5,959 |
| 52. | Snow Hill | 32.2% | 15.9%(+16.3)#52 | 21.6%(+10.6)#5,985 |
| 53. | Corriganville | 31.8% | 15.9%(+15.9)#53 | 21.6%(+10.2)#6,053 |
| 54. | Seat Pleasant | 31.6% | 15.9%(+15.7)#54 | 21.6%(+9.98)#6,077 |
| 55. | Hampstead | 30.9% | 15.9%(+14.9)#55 | 21.6%(+9.27)#6,222 |
| 56. | Cockeysville | 30.7% | 15.9%(+14.8)#56 | 21.6%(+9.12)#6,268 |
| 57. | Bowling Green | 30.0% | 15.9%(+14.1)#57 | 21.6%(+8.40)#6,390 |
| 58. | Brookmont | 29.8% | 15.9%(+13.9)#58 | 21.6%(+8.23)#6,458 |
| 59. | Willards | 29.3% | 15.9%(+13.3)#59 | 21.6%(+7.67)#6,601 |
| 60. | Williamsport | 28.9% | 15.9%(+13.0)#60 | 21.6%(+7.29)#6,670 |
| 61. | Lonaconing | 28.6% | 15.9%(+12.7)#61 | 21.6%(+6.97)#6,730 |
| 62. | Beaver Creek | 28.6% | 15.9%(+12.7)#62 | 21.6%(+6.97)#6,754 |
| 63. | Taneytown | 28.0% | 15.9%(+12.1)#63 | 21.6%(+6.43)#6,908 |
| 64. | Cumberland | 27.9% | 15.9%(+12.0)#64 | 21.6%(+6.32)#6,935 |
| 65. | Greensboro | 27.8% | 15.9%(+11.9)#65 | 21.6%(+6.18)#6,955 |
| 66. | Middle River | 27.4% | 15.9%(+11.5)#66 | 21.6%(+5.81)#7,043 |
| 67. | Edmonston | 27.3% | 15.9%(+11.4)#67 | 21.6%(+5.68)#7,077 |
| 68. | Baltimore | 27.1% | 15.9%(+11.1)#68 | 21.6%(+5.47)#7,152 |
| 69. | Grantsville | 27.0% | 15.9%(+11.1)#69 | 21.6%(+5.39)#7,174 |
| 70. | Chillum | 26.5% | 15.9%(+10.6)#70 | 21.6%(+4.87)#7,293 |
| 71. | Funkstown | 26.3% | 15.9%(+10.4)#71 | 21.6%(+4.72)#7,330 |
| 72. | Calverton | 26.2% | 15.9%(+10.3)#72 | 21.6%(+4.65)#7,348 |
| 73. | Berwyn Heights | 25.9% | 15.9%(+9.97)#73 | 21.6%(+4.30)#7,449 |
| 74. | Landover | 25.7% | 15.9%(+9.78)#74 | 21.6%(+4.10)#7,498 |
| 75. | Kensington | 25.4% | 15.9%(+9.50)#75 | 21.6%(+3.83)#7,551 |
| 76. | Pocomoke City | 23.9% | 15.9%(+7.93)#76 | 21.6%(+2.26)#8,004 |
| 77. | Elkton | 23.5% | 15.9%(+7.63)#77 | 21.6%(+1.95)#8,073 |
| 78. | Princess Anne | 23.4% | 15.9%(+7.48)#78 | 21.6%(+1.80)#8,128 |
| 79. | Thurmont | 23.0% | 15.9%(+7.11)#79 | 21.6%(+1.43)#8,251 |
| 80. | Walker Mill | 22.7% | 15.9%(+6.76)#80 | 21.6%(+1.09)#8,332 |
| 81. | Pikesville | 22.6% | 15.9%(+6.68)#81 | 21.6%(+1.00)#8,351 |
| 82. | Capitol Heights | 22.2% | 15.9%(+6.30)#82 | 21.6%(+0.625)#8,447 |
| 83. | Accokeek | 21.5% | 15.9%(+5.54)#83 | 21.6%(-0.140)#8,700 |
| 84. | Pittsville | 21.4% | 15.9%(+5.44)#84 | 21.6%(-0.238)#8,766 |
| 85. | Jessup | 21.3% | 15.9%(+5.35)#85 | 21.6%(-0.331)#8,784 |
| 86. | Dundalk | 21.1% | 15.9%(+5.20)#86 | 21.6%(-0.475)#8,831 |
| 87. | Poolesville | 21.1% | 15.9%(+5.18)#87 | 21.6%(-0.501)#8,839 |
| 88. | Lanham | 21.1% | 15.9%(+5.17)#88 | 21.6%(-0.507)#8,842 |
| 89. | Aberdeen | 20.9% | 15.9%(+4.95)#89 | 21.6%(-0.723)#8,916 |
| 90. | Annapolis | 20.2% | 15.9%(+4.24)#90 | 21.6%(-1.44)#9,088 |
| 91. | Baltimore Highlands | 20.1% | 15.9%(+4.19)#91 | 21.6%(-1.49)#9,095 |
| 92. | Berlin | 19.8% | 15.9%(+3.87)#92 | 21.6%(-1.81)#9,270 |
| 93. | North Chevy Chase | 19.0% | 15.9%(+3.13)#93 | 21.6%(-2.55)#9,460 |
| 94. | Bel Air | 18.9% | 15.9%(+2.99)#94 | 21.6%(-2.69)#9,501 |
| 95. | Cavetown | 18.6% | 15.9%(+2.68)#95 | 21.6%(-2.99)#9,587 |
| 96. | East Riverdale | 18.4% | 15.9%(+2.50)#96 | 21.6%(-3.18)#9,648 |
| 97. | Glenmont | 18.4% | 15.9%(+2.48)#97 | 21.6%(-3.20)#9,652 |
| 98. | Halfway | 18.4% | 15.9%(+2.46)#98 | 21.6%(-3.22)#9,655 |
| 99. | Elkridge | 18.3% | 15.9%(+2.42)#99 | 21.6%(-3.25)#9,664 |
| 100. | Fairland | 18.3% | 15.9%(+2.34)#100 | 21.6%(-3.34)#9,690 |
Common Questions
What are the Top 10 Cities with the Highest Poverty Level Among Females Between Ages 18 and 24 in Maryland?
Top 10 Cities with the Highest Poverty Level Among Females Between Ages 18 and 24 in Maryland are:
#1
100.0%
#2
100.0%
#3
100.0%
#4
100.0%
#5
100.0%
#6
100.0%
#7
83.9%
#8
83.3%
#9
75.0%
#10
74.0%
What city has the Highest Poverty Level Among Females Between Ages 18 and 24 in Maryland?
Finzel has the Highest Poverty Level Among Females Between Ages 18 and 24 in Maryland with 100.0%.
What is the Poverty Level Among Females Between Ages 18 and 24 in the State of Maryland?
Poverty Level Among Females Between Ages 18 and 24 in Maryland is 15.9%.
What is the Poverty Level Among Females Between Ages 18 and 24 in the United States?
Poverty Level Among Females Between Ages 18 and 24 in the United States is 21.6%.