Cities with the Most Immigrants from Nicaragua in Maryland
RELATED REPORTS & OPTIONS
Nicaragua
Maryland
Compare Cities
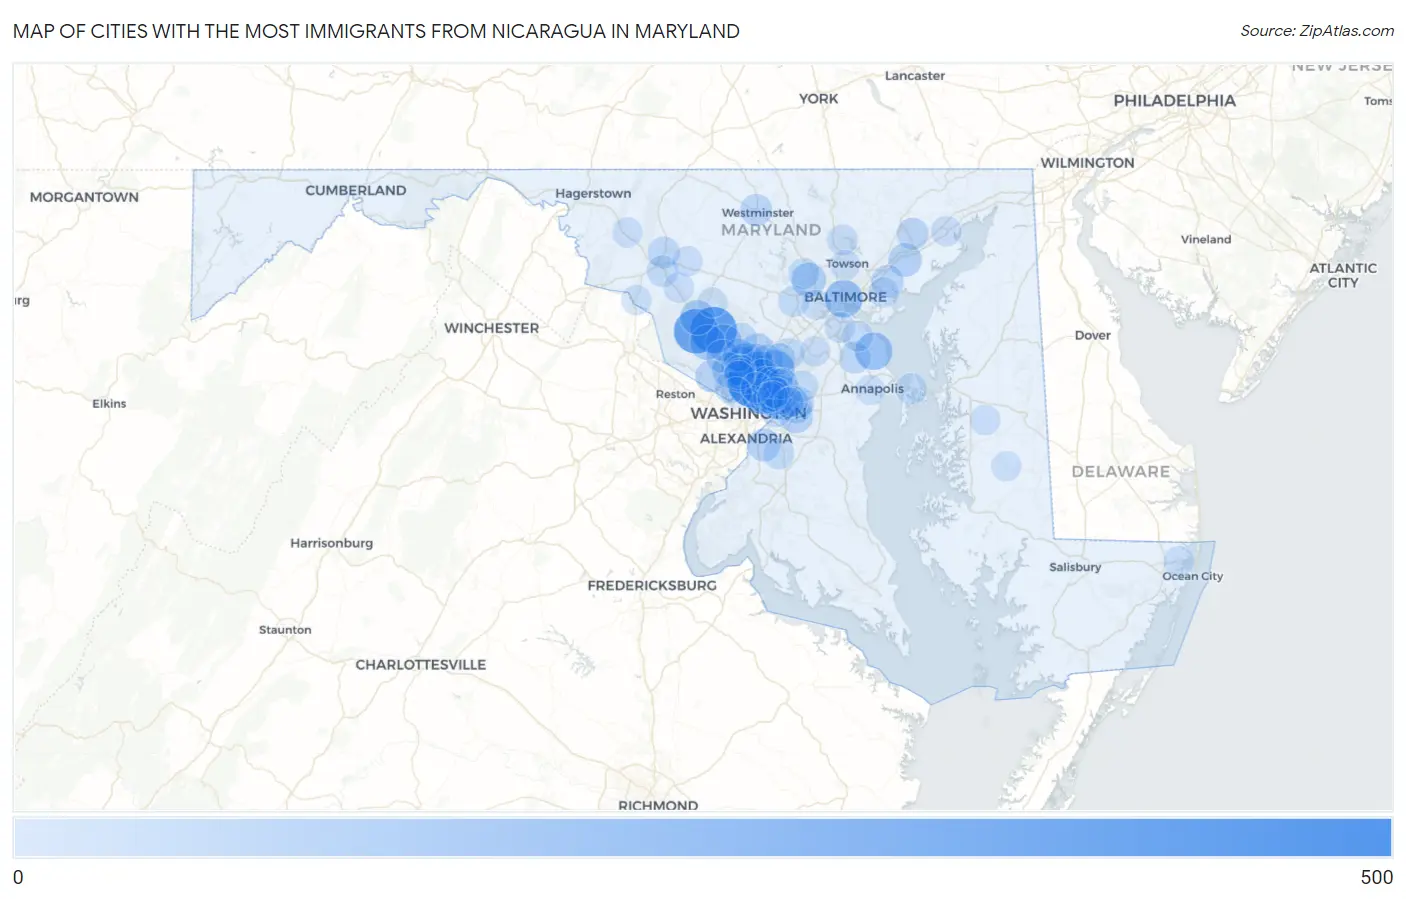
Map of Cities with the Most Immigrants from Nicaragua in Maryland
0
500
Cities with the Most Immigrants from Nicaragua in Maryland
| City | Nicaragua | vs State | vs National | |
| 1. | Silver Spring | 443 | 5,899(7.51%)#1 | 255,152(0.17%)#97 |
| 2. | Montgomery Village | 363 | 5,899(6.15%)#2 | 255,152(0.14%)#126 |
| 3. | Germantown | 327 | 5,899(5.54%)#3 | 255,152(0.13%)#136 |
| 4. | Chillum | 299 | 5,899(5.07%)#4 | 255,152(0.12%)#145 |
| 5. | Hyattsville | 291 | 5,899(4.93%)#5 | 255,152(0.11%)#148 |
| 6. | Langley Park | 273 | 5,899(4.63%)#6 | 255,152(0.11%)#158 |
| 7. | Wheaton | 240 | 5,899(4.07%)#7 | 255,152(0.09%)#176 |
| 8. | Beltsville | 214 | 5,899(3.63%)#8 | 255,152(0.08%)#195 |
| 9. | Baltimore | 173 | 5,899(2.93%)#9 | 255,152(0.07%)#237 |
| 10. | Lake Shore | 163 | 5,899(2.76%)#10 | 255,152(0.06%)#255 |
| 11. | Flower Hill | 151 | 5,899(2.56%)#11 | 255,152(0.06%)#273 |
| 12. | Glenmont | 139 | 5,899(2.36%)#12 | 255,152(0.05%)#290 |
| 13. | Redland | 135 | 5,899(2.29%)#13 | 255,152(0.05%)#295 |
| 14. | Forest Glen | 124 | 5,899(2.10%)#14 | 255,152(0.05%)#321 |
| 15. | Gaithersburg | 117 | 5,899(1.98%)#15 | 255,152(0.05%)#336 |
| 16. | North Bethesda | 113 | 5,899(1.92%)#16 | 255,152(0.04%)#349 |
| 17. | Clarksburg | 103 | 5,899(1.75%)#17 | 255,152(0.04%)#375 |
| 18. | White Oak | 100 | 5,899(1.70%)#18 | 255,152(0.04%)#383 |
| 19. | Milford Mill | 97 | 5,899(1.64%)#19 | 255,152(0.04%)#392 |
| 20. | Colesville | 97 | 5,899(1.64%)#20 | 255,152(0.04%)#394 |
| 21. | Largo | 77 | 5,899(1.31%)#21 | 255,152(0.03%)#475 |
| 22. | Bladensburg | 74 | 5,899(1.25%)#22 | 255,152(0.03%)#491 |
| 23. | Joppatowne | 72 | 5,899(1.22%)#23 | 255,152(0.03%)#498 |
| 24. | Cloverly | 69 | 5,899(1.17%)#24 | 255,152(0.03%)#516 |
| 25. | Woodlawn Cdp Prince George S County | 66 | 5,899(1.12%)#25 | 255,152(0.03%)#535 |
| 26. | Rockville | 65 | 5,899(1.10%)#26 | 255,152(0.03%)#536 |
| 27. | Landover | 64 | 5,899(1.08%)#27 | 255,152(0.03%)#543 |
| 28. | Oxon Hill | 59 | 5,899(1.00%)#28 | 255,152(0.02%)#583 |
| 29. | Middle River | 55 | 5,899(0.93%)#29 | 255,152(0.02%)#610 |
| 30. | Aspen Hill | 51 | 5,899(0.86%)#30 | 255,152(0.02%)#644 |
| 31. | Lake Arbor | 45 | 5,899(0.76%)#31 | 255,152(0.02%)#716 |
| 32. | Westminster | 43 | 5,899(0.73%)#32 | 255,152(0.02%)#735 |
| 33. | New Carrollton | 42 | 5,899(0.71%)#33 | 255,152(0.02%)#746 |
| 34. | Bel Air South | 41 | 5,899(0.70%)#34 | 255,152(0.02%)#754 |
| 35. | Potomac | 41 | 5,899(0.70%)#35 | 255,152(0.02%)#756 |
| 36. | Frederick | 40 | 5,899(0.68%)#36 | 255,152(0.02%)#766 |
| 37. | Severna Park | 39 | 5,899(0.66%)#37 | 255,152(0.02%)#782 |
| 38. | Olney | 35 | 5,899(0.59%)#38 | 255,152(0.01%)#831 |
| 39. | Fairland | 35 | 5,899(0.59%)#39 | 255,152(0.01%)#833 |
| 40. | Adelphi | 34 | 5,899(0.58%)#40 | 255,152(0.01%)#845 |
| 41. | Hillandale | 34 | 5,899(0.58%)#41 | 255,152(0.01%)#849 |
| 42. | Laurel | 32 | 5,899(0.54%)#42 | 255,152(0.01%)#865 |
| 43. | Ballenger Creek | 31 | 5,899(0.53%)#43 | 255,152(0.01%)#888 |
| 44. | Fairmount Heights | 31 | 5,899(0.53%)#44 | 255,152(0.01%)#892 |
| 45. | Bethesda | 26 | 5,899(0.44%)#45 | 255,152(0.01%)#972 |
| 46. | Landover Hills | 26 | 5,899(0.44%)#46 | 255,152(0.01%)#984 |
| 47. | Ellicott City | 25 | 5,899(0.42%)#47 | 255,152(0.01%)#990 |
| 48. | Clinton | 25 | 5,899(0.42%)#48 | 255,152(0.01%)#993 |
| 49. | Mitchellville | 24 | 5,899(0.41%)#49 | 255,152(0.01%)#1,015 |
| 50. | Cheverly | 24 | 5,899(0.41%)#50 | 255,152(0.01%)#1,018 |
| 51. | Glenn Dale | 23 | 5,899(0.39%)#51 | 255,152(0.01%)#1,030 |
| 52. | College Park | 22 | 5,899(0.37%)#52 | 255,152(0.01%)#1,044 |
| 53. | Konterra | 22 | 5,899(0.37%)#53 | 255,152(0.01%)#1,056 |
| 54. | Stevensville | 21 | 5,899(0.36%)#54 | 255,152(0.01%)#1,072 |
| 55. | Randallstown | 20 | 5,899(0.34%)#55 | 255,152(0.01%)#1,083 |
| 56. | East Riverdale | 20 | 5,899(0.34%)#56 | 255,152(0.01%)#1,087 |
| 57. | Berwyn Heights | 20 | 5,899(0.34%)#57 | 255,152(0.01%)#1,092 |
| 58. | Greenbelt | 19 | 5,899(0.32%)#58 | 255,152(0.01%)#1,108 |
| 59. | North Kensington | 19 | 5,899(0.32%)#59 | 255,152(0.01%)#1,117 |
| 60. | Kensington | 19 | 5,899(0.32%)#60 | 255,152(0.01%)#1,126 |
| 61. | Cockeysville | 18 | 5,899(0.31%)#61 | 255,152(0.01%)#1,141 |
| 62. | Pasadena | 17 | 5,899(0.29%)#62 | 255,152(0.01%)#1,159 |
| 63. | South Kensington | 16 | 5,899(0.27%)#63 | 255,152(0.01%)#1,202 |
| 64. | Springdale | 16 | 5,899(0.27%)#64 | 255,152(0.01%)#1,203 |
| 65. | Wildewood | 15 | 5,899(0.25%)#65 | 255,152(0.01%)#1,236 |
| 66. | Ferndale | 14 | 5,899(0.24%)#66 | 255,152(0.01%)#1,267 |
| 67. | Friendship Heights Village | 14 | 5,899(0.24%)#67 | 255,152(0.01%)#1,276 |
| 68. | North Brentwood | 14 | 5,899(0.24%)#68 | 255,152(0.01%)#1,284 |
| 69. | Essex | 11 | 5,899(0.19%)#69 | 255,152(0.00%)#1,360 |
| 70. | Takoma Park | 11 | 5,899(0.19%)#70 | 255,152(0.00%)#1,372 |
| 71. | Riverdale Park | 11 | 5,899(0.19%)#71 | 255,152(0.00%)#1,385 |
| 72. | Urbana | 10 | 5,899(0.17%)#72 | 255,152(0.00%)#1,421 |
| 73. | Green Valley | 10 | 5,899(0.17%)#73 | 255,152(0.00%)#1,422 |
| 74. | Ocean Pines | 10 | 5,899(0.17%)#74 | 255,152(0.00%)#1,423 |
| 75. | Cordova | 9 | 5,899(0.15%)#75 | 255,152(0.00%)#1,492 |
| 76. | Linganore | 7 | 5,899(0.12%)#76 | 255,152(0.00%)#1,552 |
| 77. | Aberdeen | 6 | 5,899(0.10%)#77 | 255,152(0.00%)#1,587 |
| 78. | Myersville | 6 | 5,899(0.10%)#78 | 255,152(0.00%)#1,598 |
| 79. | Edmonston | 6 | 5,899(0.10%)#79 | 255,152(0.00%)#1,602 |
| 80. | Point Of Rocks | 5 | 5,899(0.08%)#80 | 255,152(0.00%)#1,632 |
| 81. | Fort Meade | 4 | 5,899(0.07%)#81 | 255,152(0.00%)#1,655 |
| 82. | Glenarden | 4 | 5,899(0.07%)#82 | 255,152(0.00%)#1,657 |
| 83. | Towson | 3 | 5,899(0.05%)#83 | 255,152(0.00%)#1,678 |
| 84. | Catonsville | 3 | 5,899(0.05%)#84 | 255,152(0.00%)#1,679 |
| 85. | Preston | 2 | 5,899(0.03%)#85 | 255,152(0.00%)#1,726 |
| 86. | Annapolis | 1 | 5,899(0.02%)#86 | 255,152(0.00%)#1,737 |
| 87. | Damascus | 1 | 5,899(0.02%)#87 | 255,152(0.00%)#1,742 |
Common Questions
What are the Top 10 Cities with the Most Immigrants from Nicaragua in Maryland?
Top 10 Cities with the Most Immigrants from Nicaragua in Maryland are:
#1
443
#2
363
#3
327
#4
299
#5
291
#6
273
#7
240
#8
214
#9
173
#10
163
What city has the Most Immigrants from Nicaragua in Maryland?
Silver Spring has the Most Immigrants from Nicaragua in Maryland with 443.
What is the Total Immigrants from Nicaragua in the State of Maryland?
Total Immigrants from Nicaragua in Maryland is 5,899.
What is the Total Immigrants from Nicaragua in the United States?
Total Immigrants from Nicaragua in the United States is 255,152.