Walker Mill, MD Map & Demographics
Walker Mill Map
Walker Mill Overview
$40,540
PER CAPITA INCOME
$89,813
AVG FAMILY INCOME
$72,120
AVG HOUSEHOLD INCOME
10.6%
WAGE / INCOME GAP [ % ]
89.4¢/ $1
WAGE / INCOME GAP [ $ ]
$5,952
FAMILY INCOME DEFICIT
0.41
INEQUALITY / GINI INDEX
9,973
TOTAL POPULATION
4,206
MALE POPULATION
5,767
FEMALE POPULATION
72.93
MALES / 100 FEMALES
137.11
FEMALES / 100 MALES
40.8
MEDIAN AGE
3.0
AVG FAMILY SIZE
2.3
AVG HOUSEHOLD SIZE
5,155
LABOR FORCE [ PEOPLE ]
65.5%
PERCENT IN LABOR FORCE
6.0%
UNEMPLOYMENT RATE
Income in Walker Mill
Income Overview in Walker Mill
Per Capita Income in Walker Mill is $40,540, while median incomes of families and households are $89,813 and $72,120 respectively.
| Characteristic | Number | Measure |
| Per Capita Income | 9,973 | $40,540 |
| Median Family Income | 2,615 | $89,813 |
| Mean Family Income | 2,615 | $104,543 |
| Median Household Income | 4,284 | $72,120 |
| Mean Household Income | 4,284 | $91,645 |
| Income Deficit | 2,615 | $5,952 |
| Wage / Income Gap (%) | 9,973 | 10.58% |
| Wage / Income Gap ($) | 9,973 | 89.42¢ per $1 |
| Gini / Inequality Index | 9,973 | 0.41 |
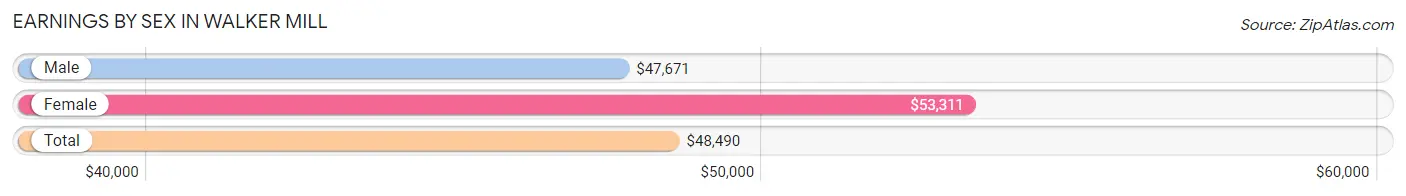
Earnings by Sex in Walker Mill
Average Earnings in Walker Mill are $48,490, $47,671 for men and $53,311 for women, a difference of 10.6%.
| Sex | Number | Average Earnings |
| Male | 2,268 (44.1%) | $47,671 |
| Female | 2,879 (55.9%) | $53,311 |
| Total | 5,147 (100.0%) | $48,490 |
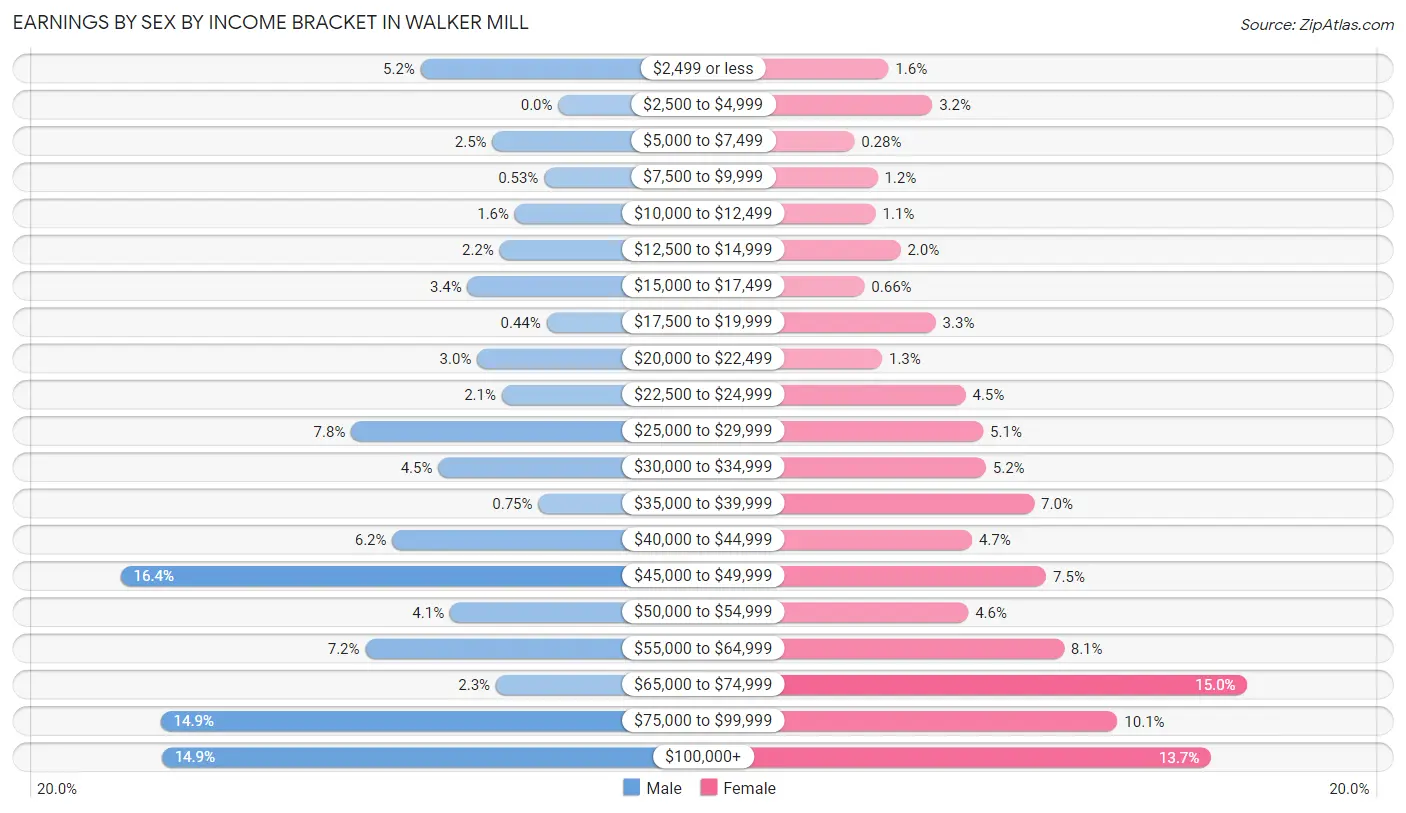
Earnings by Sex by Income Bracket in Walker Mill
The most common earnings brackets in Walker Mill are $45,000 to $49,999 for men (372 | 16.4%) and $65,000 to $74,999 for women (432 | 15.0%).
| Income | Male | Female |
| $2,499 or less | 117 (5.2%) | 45 (1.6%) |
| $2,500 to $4,999 | 0 (0.0%) | 92 (3.2%) |
| $5,000 to $7,499 | 56 (2.5%) | 8 (0.3%) |
| $7,500 to $9,999 | 12 (0.5%) | 33 (1.1%) |
| $10,000 to $12,499 | 37 (1.6%) | 31 (1.1%) |
| $12,500 to $14,999 | 50 (2.2%) | 58 (2.0%) |
| $15,000 to $17,499 | 77 (3.4%) | 19 (0.7%) |
| $17,500 to $19,999 | 10 (0.4%) | 96 (3.3%) |
| $20,000 to $22,499 | 69 (3.0%) | 38 (1.3%) |
| $22,500 to $24,999 | 48 (2.1%) | 128 (4.4%) |
| $25,000 to $29,999 | 176 (7.8%) | 147 (5.1%) |
| $30,000 to $34,999 | 102 (4.5%) | 150 (5.2%) |
| $35,000 to $39,999 | 17 (0.7%) | 202 (7.0%) |
| $40,000 to $44,999 | 141 (6.2%) | 135 (4.7%) |
| $45,000 to $49,999 | 372 (16.4%) | 215 (7.5%) |
| $50,000 to $54,999 | 92 (4.1%) | 131 (4.5%) |
| $55,000 to $64,999 | 164 (7.2%) | 234 (8.1%) |
| $65,000 to $74,999 | 53 (2.3%) | 432 (15.0%) |
| $75,000 to $99,999 | 338 (14.9%) | 292 (10.1%) |
| $100,000+ | 337 (14.9%) | 393 (13.7%) |
| Total | 2,268 (100.0%) | 2,879 (100.0%) |
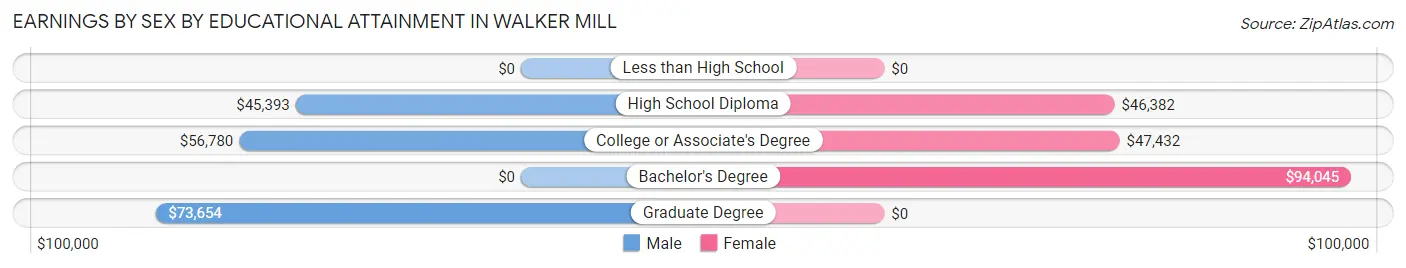
Earnings by Sex by Educational Attainment in Walker Mill
Average earnings in Walker Mill are $49,901 for men and $57,732 for women, a difference of 13.6%. Men with an educational attainment of graduate degree enjoy the highest average annual earnings of $73,654, while those with high school diploma education earn the least with $45,393. Women with an educational attainment of bachelor's degree earn the most with the average annual earnings of $94,045, while those with high school diploma education have the smallest earnings of $46,382.
| Educational Attainment | Male Income | Female Income |
| Less than High School | - | - |
| High School Diploma | $45,393 | $46,382 |
| College or Associate's Degree | $56,780 | $47,432 |
| Bachelor's Degree | - | - |
| Graduate Degree | $73,654 | $0 |
| Total | $49,901 | $57,732 |
Family Income in Walker Mill
Family Income Brackets in Walker Mill
According to the Walker Mill family income data, there are 439 families falling into the $100,000 to $149,999 income range, which is the most common income bracket and makes up 16.8% of all families.
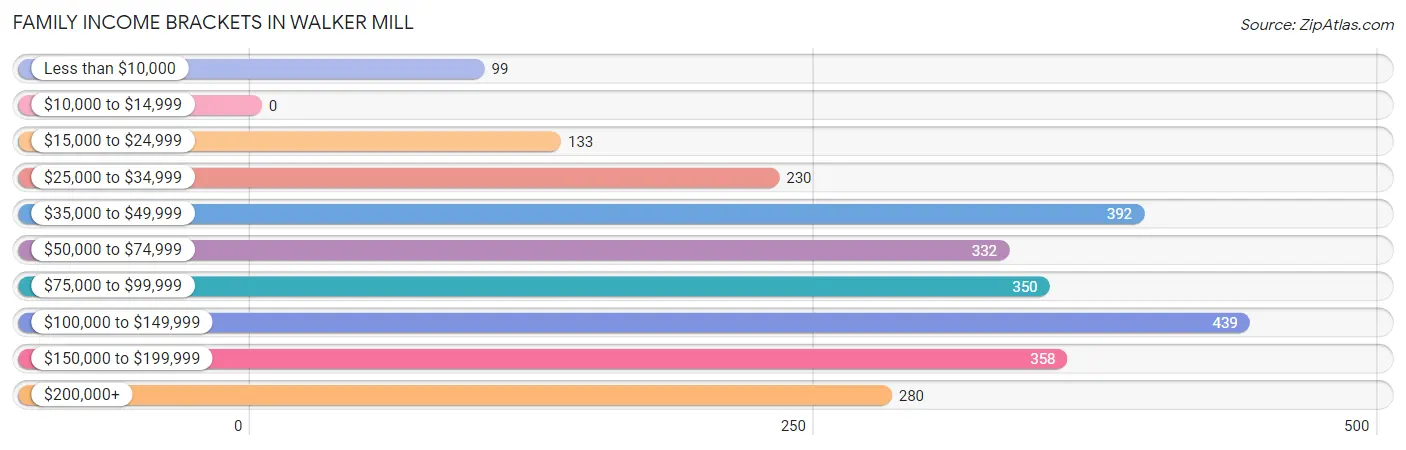
| Income Bracket | # Families | % Families |
| Less than $10,000 | 99 | 3.8% |
| $10,000 to $14,999 | 0 | 0.0% |
| $15,000 to $24,999 | 133 | 5.1% |
| $25,000 to $34,999 | 230 | 8.8% |
| $35,000 to $49,999 | 392 | 15.0% |
| $50,000 to $74,999 | 332 | 12.7% |
| $75,000 to $99,999 | 350 | 13.4% |
| $100,000 to $149,999 | 439 | 16.8% |
| $150,000 to $199,999 | 358 | 13.7% |
| $200,000+ | 280 | 10.7% |
Family Income by Famaliy Size in Walker Mill
4-person families (377 | 14.4%) account for the highest median family income in Walker Mill with $150,417 per family, while 2-person families (1,425 | 54.5%) have the highest median income of $39,493 per family member.
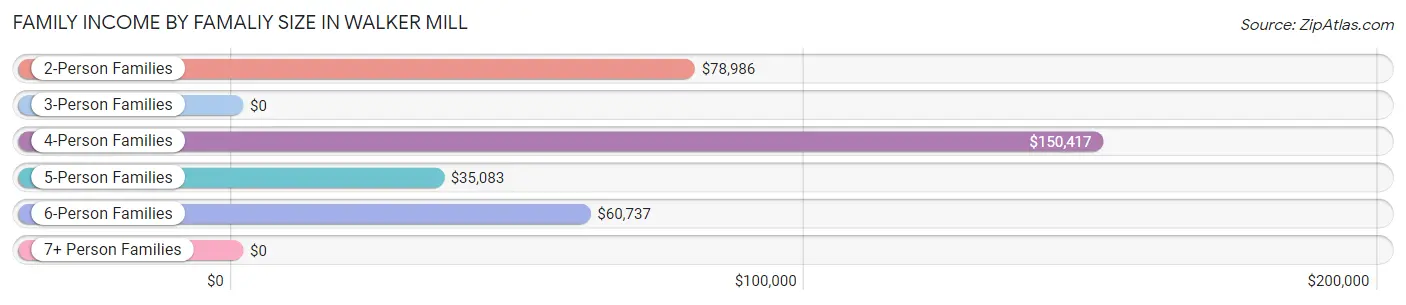
| Income Bracket | # Families | Median Income |
| 2-Person Families | 1,425 (54.5%) | $78,986 |
| 3-Person Families | 553 (21.1%) | $0 |
| 4-Person Families | 377 (14.4%) | $150,417 |
| 5-Person Families | 105 (4.0%) | $35,083 |
| 6-Person Families | 142 (5.4%) | $60,737 |
| 7+ Person Families | 13 (0.5%) | $0 |
| Total | 2,615 (100.0%) | $89,813 |
Family Income by Number of Earners in Walker Mill
The median family income in Walker Mill is $89,813, with families comprising 3+ earners (252) having the highest median family income of $193,551, while families with 1 earner (1,262) have the lowest median family income of $60,962, accounting for 9.6% and 48.3% of families, respectively.
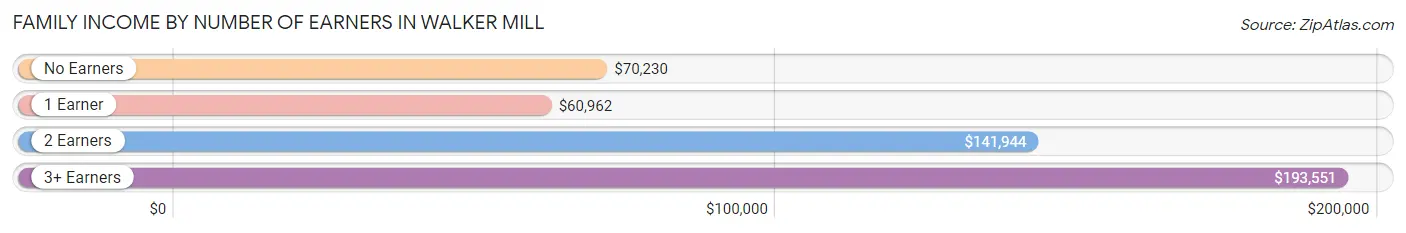
| Number of Earners | # Families | Median Income |
| No Earners | 331 (12.7%) | $70,230 |
| 1 Earner | 1,262 (48.3%) | $60,962 |
| 2 Earners | 770 (29.4%) | $141,944 |
| 3+ Earners | 252 (9.6%) | $193,551 |
| Total | 2,615 (100.0%) | $89,813 |
Household Income in Walker Mill
Household Income Brackets in Walker Mill
With 737 households falling in the category, the $100,000 to $149,999 income range is the most frequent in Walker Mill, accounting for 17.2% of all households. In contrast, only 77 households (1.8%) fall into the $10,000 to $14,999 income bracket, making it the least populous group.
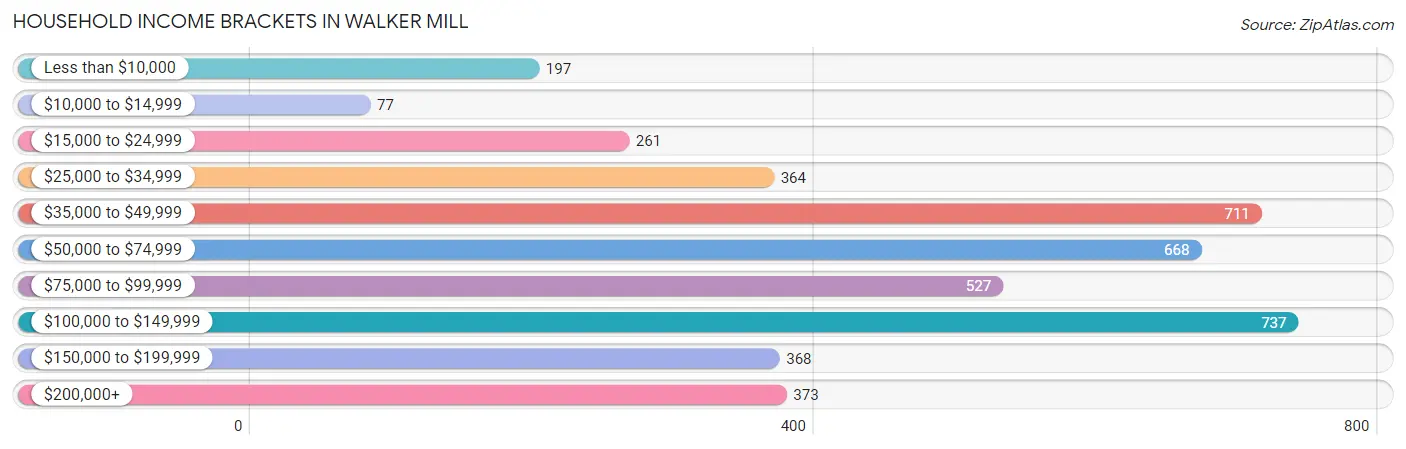
| Income Bracket | # Households | % Households |
| Less than $10,000 | 197 | 4.6% |
| $10,000 to $14,999 | 77 | 1.8% |
| $15,000 to $24,999 | 261 | 6.1% |
| $25,000 to $34,999 | 364 | 8.5% |
| $35,000 to $49,999 | 711 | 16.6% |
| $50,000 to $74,999 | 668 | 15.6% |
| $75,000 to $99,999 | 527 | 12.3% |
| $100,000 to $149,999 | 737 | 17.2% |
| $150,000 to $199,999 | 368 | 8.6% |
| $200,000+ | 373 | 8.7% |
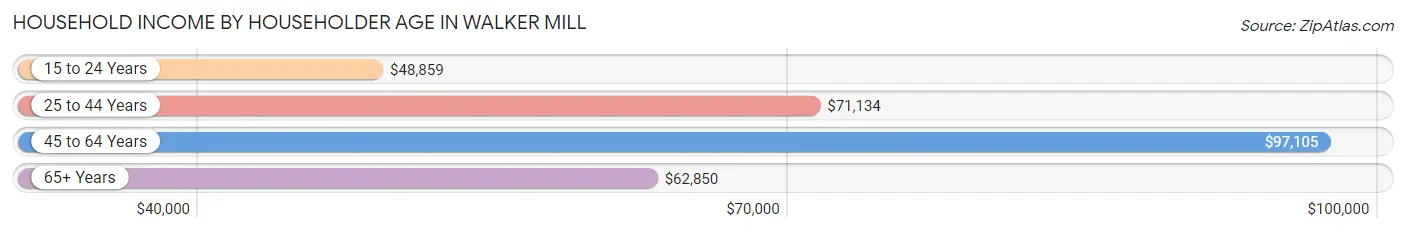
Household Income by Householder Age in Walker Mill
The median household income in Walker Mill is $72,120, with the highest median household income of $97,105 found in the 45 to 64 years age bracket for the primary householder. A total of 1,426 households (33.3%) fall into this category. Meanwhile, the 15 to 24 years age bracket for the primary householder has the lowest median household income of $48,859, with 367 households (8.6%) in this group.
| Income Bracket | # Households | Median Income |
| 15 to 24 Years | 367 (8.6%) | $48,859 |
| 25 to 44 Years | 1,219 (28.4%) | $71,134 |
| 45 to 64 Years | 1,426 (33.3%) | $97,105 |
| 65+ Years | 1,272 (29.7%) | $62,850 |
| Total | 4,284 (100.0%) | $72,120 |
Poverty in Walker Mill
Income Below Poverty by Sex and Age in Walker Mill
With 6.7% poverty level for males and 9.3% for females among the residents of Walker Mill, 16 and 17 year old males and 16 and 17 year old females are the most vulnerable to poverty, with 17 males (23.6%) and 31 females (26.5%) in their respective age groups living below the poverty level.
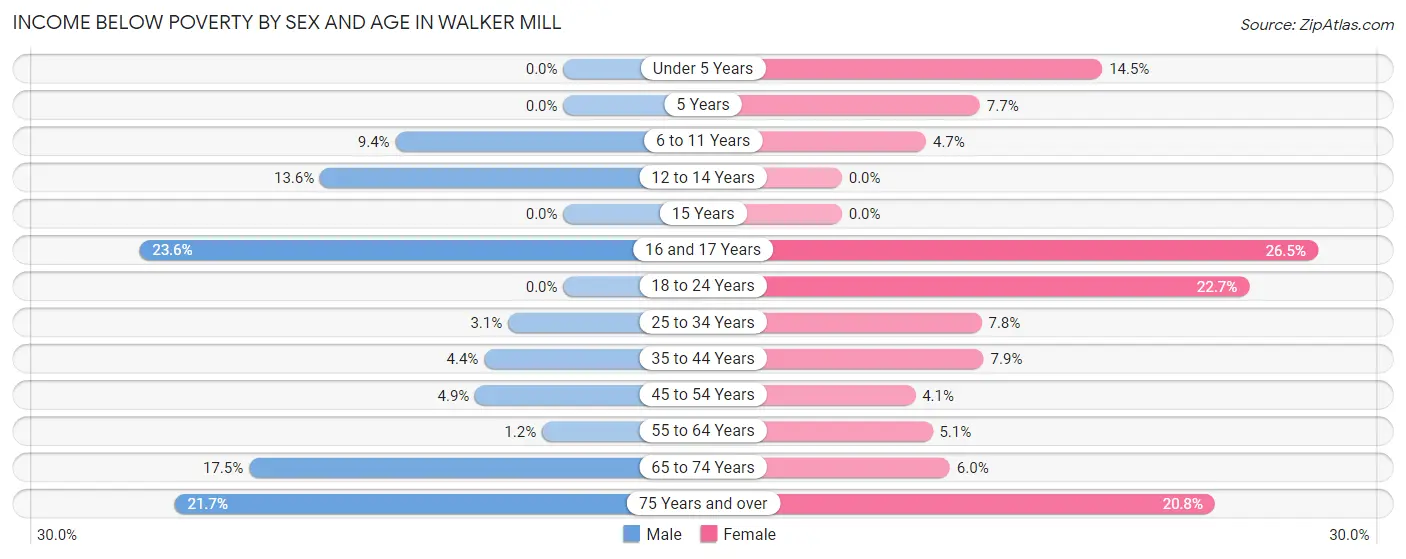
| Age Bracket | Male | Female |
| Under 5 Years | 0 (0.0%) | 38 (14.5%) |
| 5 Years | 0 (0.0%) | 5 (7.7%) |
| 6 to 11 Years | 36 (9.3%) | 25 (4.7%) |
| 12 to 14 Years | 34 (13.6%) | 0 (0.0%) |
| 15 Years | 0 (0.0%) | 0 (0.0%) |
| 16 and 17 Years | 17 (23.6%) | 31 (26.5%) |
| 18 to 24 Years | 0 (0.0%) | 93 (22.7%) |
| 25 to 34 Years | 21 (3.1%) | 57 (7.8%) |
| 35 to 44 Years | 20 (4.4%) | 43 (7.9%) |
| 45 to 54 Years | 20 (4.9%) | 30 (4.1%) |
| 55 to 64 Years | 9 (1.2%) | 37 (5.1%) |
| 65 to 74 Years | 35 (17.5%) | 39 (6.0%) |
| 75 Years and over | 89 (21.6%) | 135 (20.8%) |
| Total | 281 (6.7%) | 533 (9.3%) |
Income Above Poverty by Sex and Age in Walker Mill
According to the poverty statistics in Walker Mill, males aged under 5 years and females aged 12 to 14 years are the age groups that are most secure financially, with 100.0% of males and 100.0% of females in these age groups living above the poverty line.
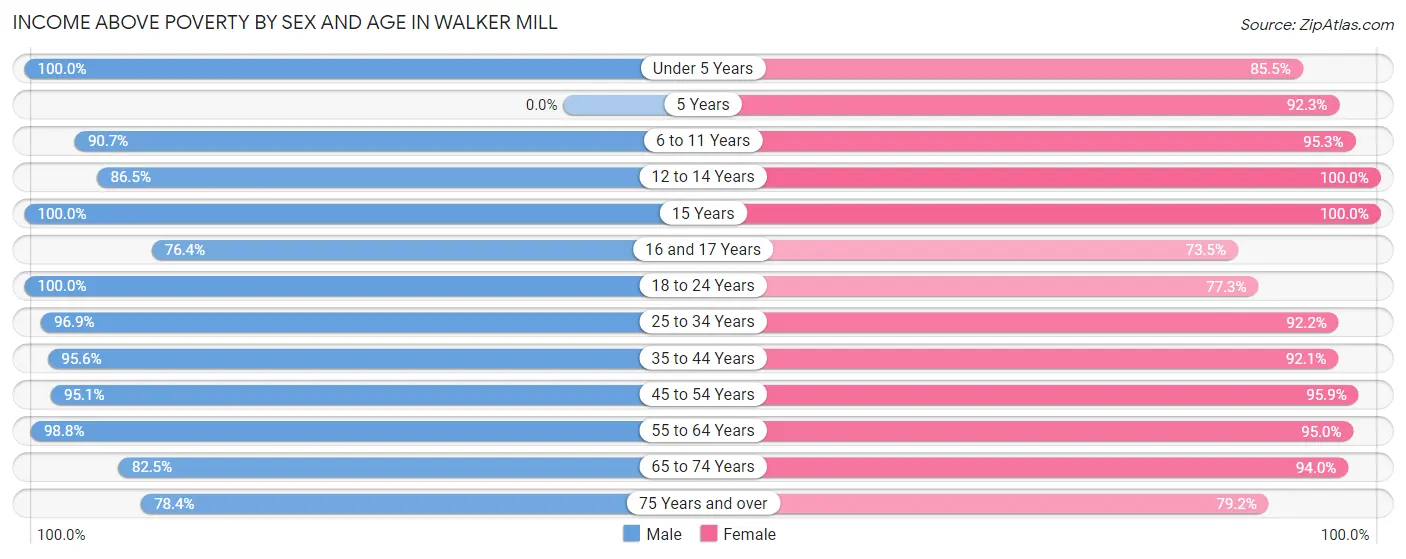
| Age Bracket | Male | Female |
| Under 5 Years | 227 (100.0%) | 224 (85.5%) |
| 5 Years | 0 (0.0%) | 60 (92.3%) |
| 6 to 11 Years | 349 (90.6%) | 508 (95.3%) |
| 12 to 14 Years | 217 (86.5%) | 237 (100.0%) |
| 15 Years | 41 (100.0%) | 75 (100.0%) |
| 16 and 17 Years | 55 (76.4%) | 86 (73.5%) |
| 18 to 24 Years | 318 (100.0%) | 317 (77.3%) |
| 25 to 34 Years | 661 (96.9%) | 676 (92.2%) |
| 35 to 44 Years | 434 (95.6%) | 501 (92.1%) |
| 45 to 54 Years | 387 (95.1%) | 703 (95.9%) |
| 55 to 64 Years | 748 (98.8%) | 696 (95.0%) |
| 65 to 74 Years | 165 (82.5%) | 609 (94.0%) |
| 75 Years and over | 322 (78.3%) | 515 (79.2%) |
| Total | 3,924 (93.3%) | 5,207 (90.7%) |
Income Below Poverty Among Married-Couple Families in Walker Mill
The poverty statistics for married-couple families in Walker Mill show that 8.3% or 94 of the total 1,130 families live below the poverty line. Families with no children have the highest poverty rate of 9.0%, comprising of 79 families. On the other hand, families with 3 or 4 children have the lowest poverty rate of 0.0%, which includes 0 families.
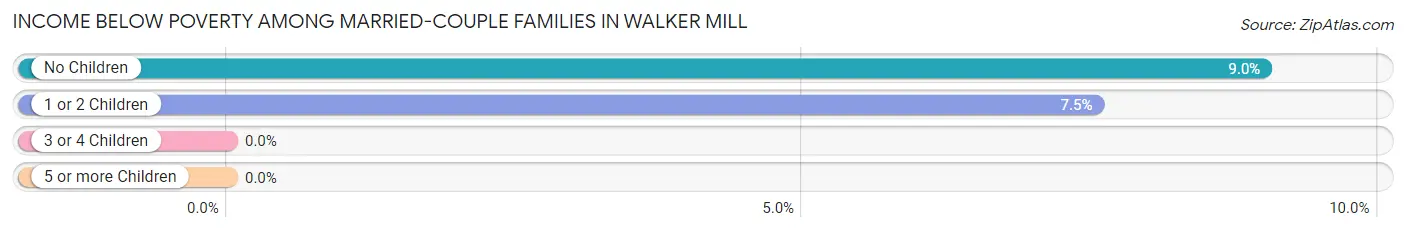
| Children | Above Poverty | Below Poverty |
| No Children | 799 (91.0%) | 79 (9.0%) |
| 1 or 2 Children | 184 (92.5%) | 15 (7.5%) |
| 3 or 4 Children | 53 (100.0%) | 0 (0.0%) |
| 5 or more Children | 0 (0.0%) | 0 (0.0%) |
| Total | 1,036 (91.7%) | 94 (8.3%) |
Income Below Poverty Among Single-Parent Households in Walker Mill
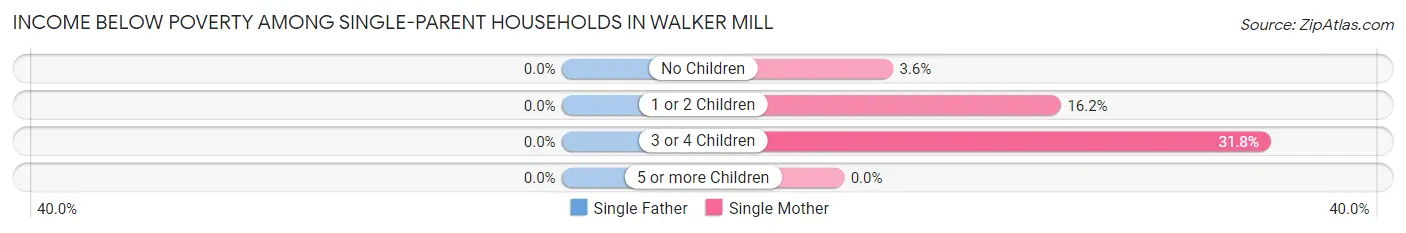
| Children | Single Father | Single Mother |
| No Children | 0 (0.0%) | 16 (3.6%) |
| 1 or 2 Children | 0 (0.0%) | 83 (16.2%) |
| 3 or 4 Children | 0 (0.0%) | 21 (31.8%) |
| 5 or more Children | 0 (0.0%) | 0 (0.0%) |
| Total | 0 (0.0%) | 120 (10.9%) |
Income Below Poverty Among Married-Couple vs Single-Parent Households in Walker Mill
The poverty data for Walker Mill shows that 94 of the married-couple family households (8.3%) and 120 of the single-parent households (8.1%) are living below the poverty level. Within the married-couple family households, those with no children have the highest poverty rate, with 79 households (9.0%) falling below the poverty line. Among the single-parent households, those with 3 or 4 children have the highest poverty rate, with 21 household (15.6%) living below poverty.
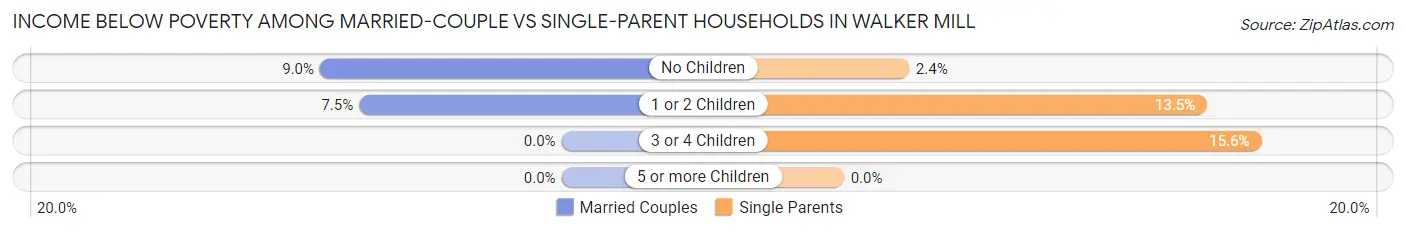
| Children | Married-Couple Families | Single-Parent Households |
| No Children | 79 (9.0%) | 16 (2.4%) |
| 1 or 2 Children | 15 (7.5%) | 83 (13.5%) |
| 3 or 4 Children | 0 (0.0%) | 21 (15.6%) |
| 5 or more Children | 0 (0.0%) | 0 (0.0%) |
| Total | 94 (8.3%) | 120 (8.1%) |
Race in Walker Mill
The most populous races in Walker Mill are Black / African American (8,742 | 87.7%), Hispanic or Latino (693 | 7.0%), and Two or more Races (422 | 4.2%).
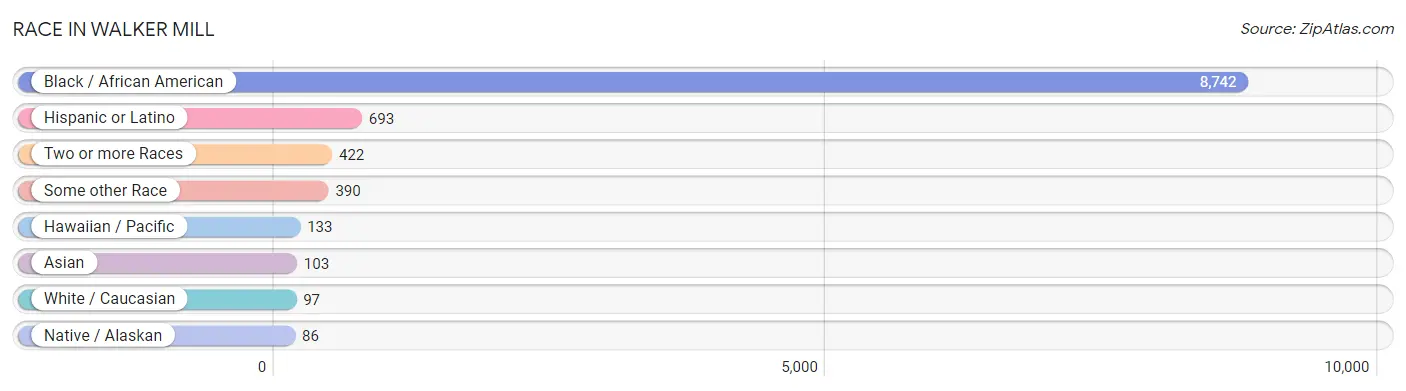
| Race | # Population | % Population |
| Asian | 103 | 1.0% |
| Black / African American | 8,742 | 87.7% |
| Hawaiian / Pacific | 133 | 1.3% |
| Hispanic or Latino | 693 | 7.0% |
| Native / Alaskan | 86 | 0.9% |
| White / Caucasian | 97 | 1.0% |
| Two or more Races | 422 | 4.2% |
| Some other Race | 390 | 3.9% |
| Total | 9,973 | 100.0% |
Ancestry in Walker Mill
The most populous ancestries reported in Walker Mill are Central American (426 | 4.3%), Salvadoran (277 | 2.8%), American (254 | 2.5%), Subsaharan African (232 | 2.3%), and Cherokee (204 | 2.1%), together accounting for 14.0% of all Walker Mill residents.
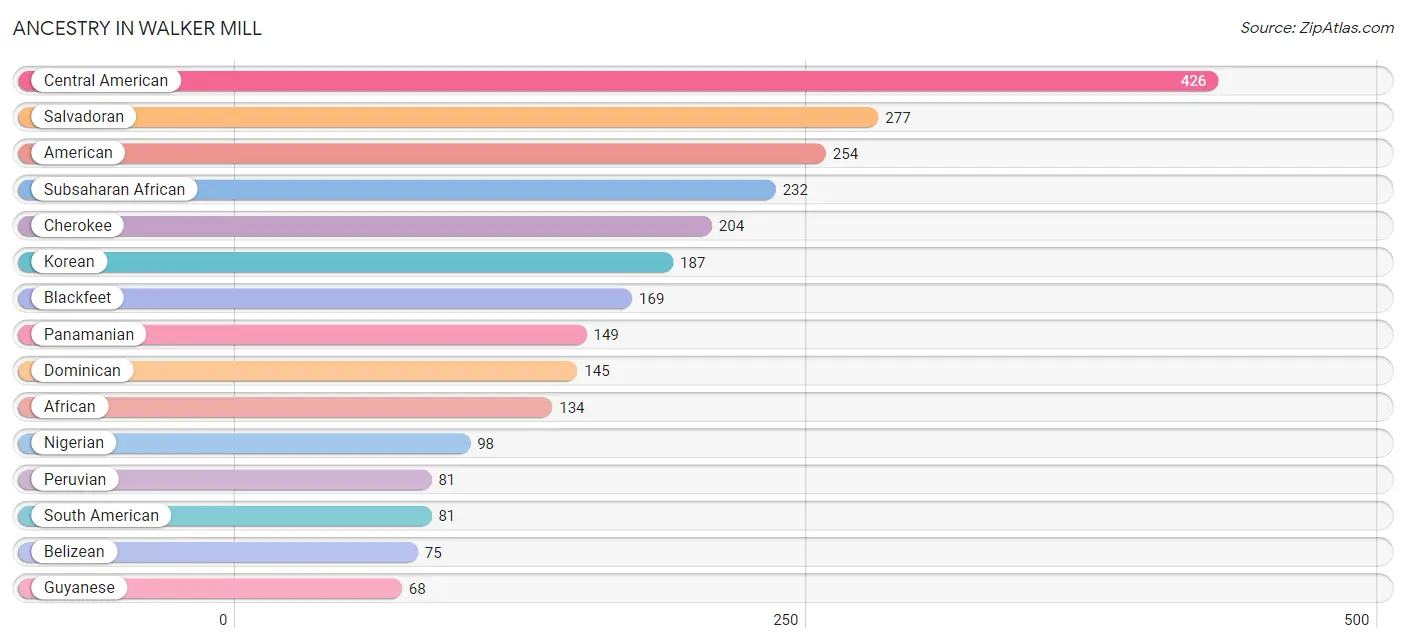
| Ancestry | # Population | % Population |
| African | 134 | 1.3% |
| American | 254 | 2.5% |
| Belizean | 75 | 0.7% |
| Blackfeet | 169 | 1.7% |
| Central American | 426 | 4.3% |
| Cherokee | 204 | 2.1% |
| Dominican | 145 | 1.5% |
| English | 8 | 0.1% |
| French | 8 | 0.1% |
| German | 2 | 0.0% |
| Guyanese | 68 | 0.7% |
| Indian (Asian) | 47 | 0.5% |
| Irish | 24 | 0.2% |
| Jamaican | 24 | 0.2% |
| Korean | 187 | 1.9% |
| Mexican | 4 | 0.0% |
| Nigerian | 98 | 1.0% |
| Panamanian | 149 | 1.5% |
| Peruvian | 81 | 0.8% |
| Polish | 27 | 0.3% |
| Puerto Rican | 37 | 0.4% |
| Salvadoran | 277 | 2.8% |
| Slovak | 27 | 0.3% |
| South American | 81 | 0.8% |
| Subsaharan African | 232 | 2.3% |
| Trinidadian and Tobagonian | 18 | 0.2% | View All 26 Rows |
Immigrants in Walker Mill
The most numerous immigrant groups reported in Walker Mill came from Latin America (372 | 3.7%), Asia (222 | 2.2%), Philippines (189 | 1.9%), South Eastern Asia (189 | 1.9%), and South America (133 | 1.3%), together accounting for 11.1% of all Walker Mill residents.
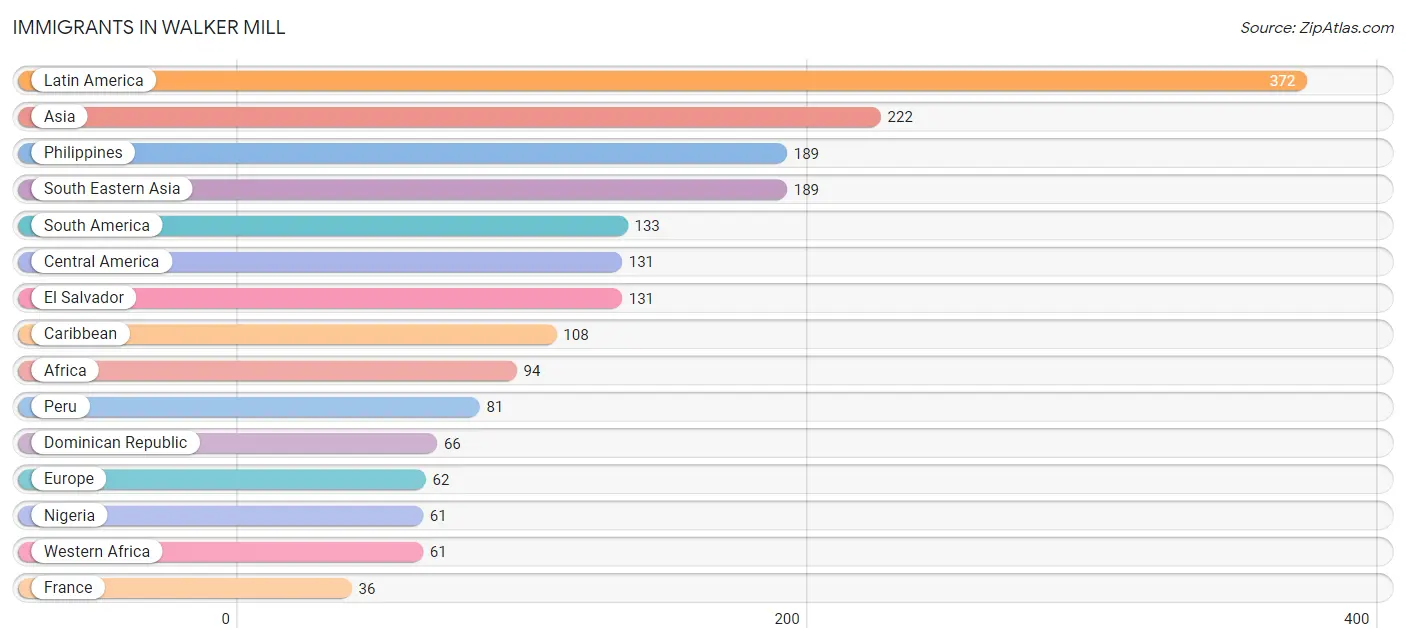
| Immigration Origin | # Population | % Population |
| Africa | 94 | 0.9% |
| Asia | 222 | 2.2% |
| Cameroon | 33 | 0.3% |
| Caribbean | 108 | 1.1% |
| Central America | 131 | 1.3% |
| China | 33 | 0.3% |
| Dominican Republic | 66 | 0.7% |
| Eastern Asia | 33 | 0.3% |
| El Salvador | 131 | 1.3% |
| Europe | 62 | 0.6% |
| France | 36 | 0.4% |
| Guyana | 35 | 0.4% |
| Italy | 26 | 0.3% |
| Jamaica | 24 | 0.2% |
| Latin America | 372 | 3.7% |
| Middle Africa | 33 | 0.3% |
| Nigeria | 61 | 0.6% |
| Peru | 81 | 0.8% |
| Philippines | 189 | 1.9% |
| South America | 133 | 1.3% |
| South Eastern Asia | 189 | 1.9% |
| Southern Europe | 26 | 0.3% |
| Trinidad and Tobago | 18 | 0.2% |
| Western Africa | 61 | 0.6% |
| Western Europe | 36 | 0.4% | View All 25 Rows |
Sex and Age in Walker Mill
Sex and Age in Walker Mill
The most populous age groups in Walker Mill are 10 to 14 Years (489 | 11.6%) for men and 30 to 34 Years (520 | 9.0%) for women.
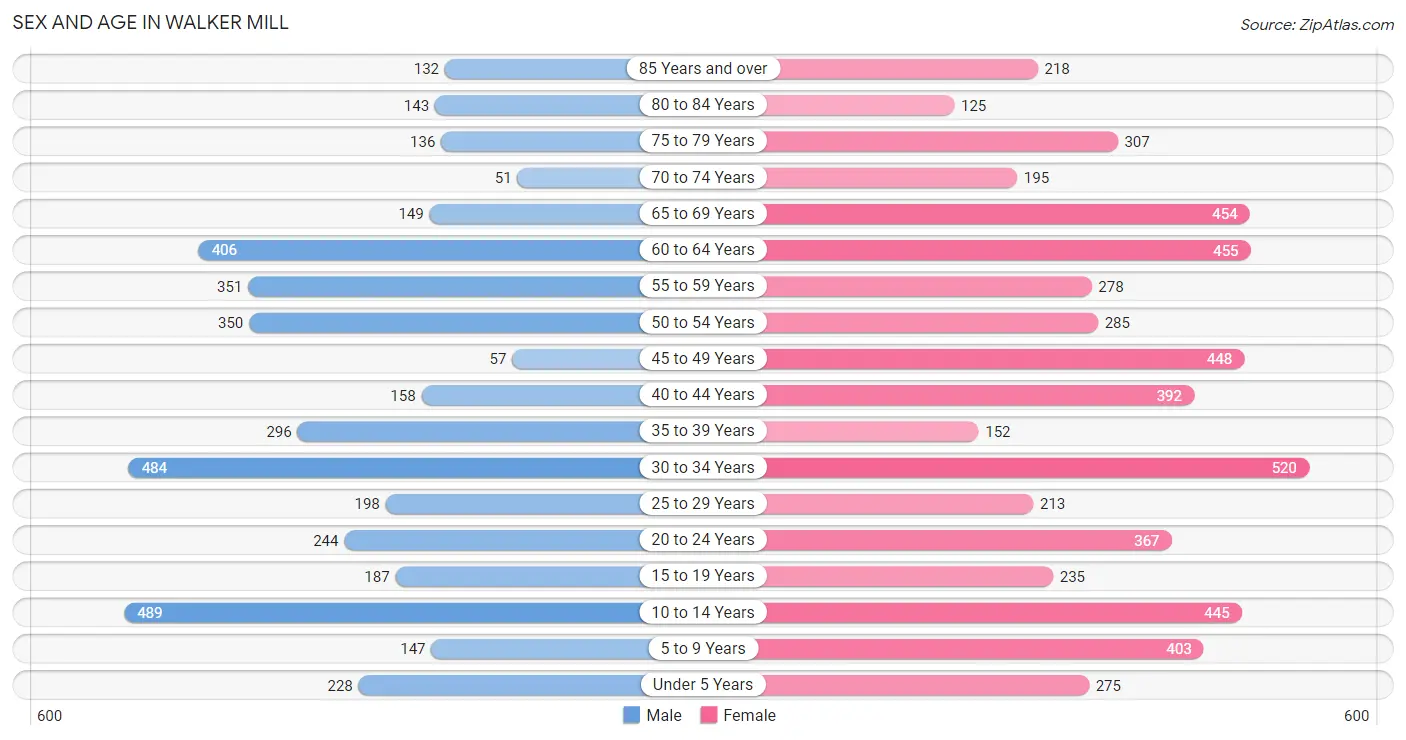
| Age Bracket | Male | Female |
| Under 5 Years | 228 (5.4%) | 275 (4.8%) |
| 5 to 9 Years | 147 (3.5%) | 403 (7.0%) |
| 10 to 14 Years | 489 (11.6%) | 445 (7.7%) |
| 15 to 19 Years | 187 (4.4%) | 235 (4.1%) |
| 20 to 24 Years | 244 (5.8%) | 367 (6.4%) |
| 25 to 29 Years | 198 (4.7%) | 213 (3.7%) |
| 30 to 34 Years | 484 (11.5%) | 520 (9.0%) |
| 35 to 39 Years | 296 (7.0%) | 152 (2.6%) |
| 40 to 44 Years | 158 (3.8%) | 392 (6.8%) |
| 45 to 49 Years | 57 (1.4%) | 448 (7.8%) |
| 50 to 54 Years | 350 (8.3%) | 285 (4.9%) |
| 55 to 59 Years | 351 (8.4%) | 278 (4.8%) |
| 60 to 64 Years | 406 (9.7%) | 455 (7.9%) |
| 65 to 69 Years | 149 (3.5%) | 454 (7.9%) |
| 70 to 74 Years | 51 (1.2%) | 195 (3.4%) |
| 75 to 79 Years | 136 (3.2%) | 307 (5.3%) |
| 80 to 84 Years | 143 (3.4%) | 125 (2.2%) |
| 85 Years and over | 132 (3.1%) | 218 (3.8%) |
| Total | 4,206 (100.0%) | 5,767 (100.0%) |
Families and Households in Walker Mill
Median Family Size in Walker Mill
The median family size in Walker Mill is 2.99 persons per family, with single female/mother families (1,098 | 42.0%) accounting for the largest median family size of 3.18 persons per family. On the other hand, married-couple families (1,130 | 43.2%) represent the smallest median family size with 2.85 persons per family.
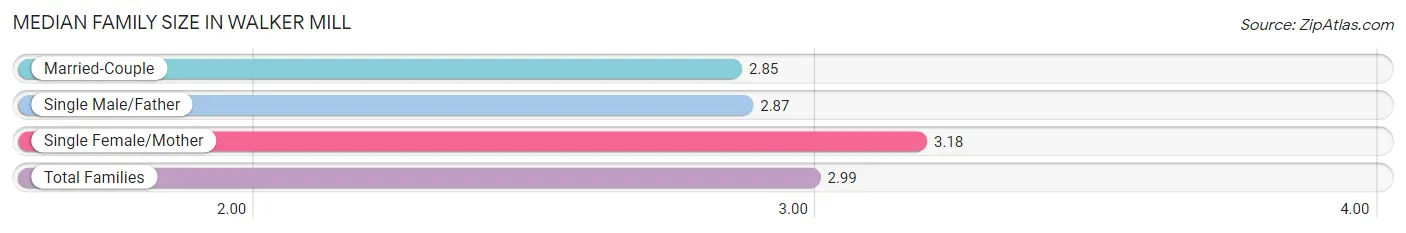
| Family Type | # Families | Family Size |
| Married-Couple | 1,130 (43.2%) | 2.85 |
| Single Male/Father | 387 (14.8%) | 2.87 |
| Single Female/Mother | 1,098 (42.0%) | 3.18 |
| Total Families | 2,615 (100.0%) | 2.99 |
Median Household Size in Walker Mill
The median household size in Walker Mill is 2.32 persons per household, with single male/father households (387 | 9.0%) accounting for the largest median household size of 3.36 persons per household. non-family households (1,669 | 39.0%) represent the smallest median household size with 1.05 persons per household.
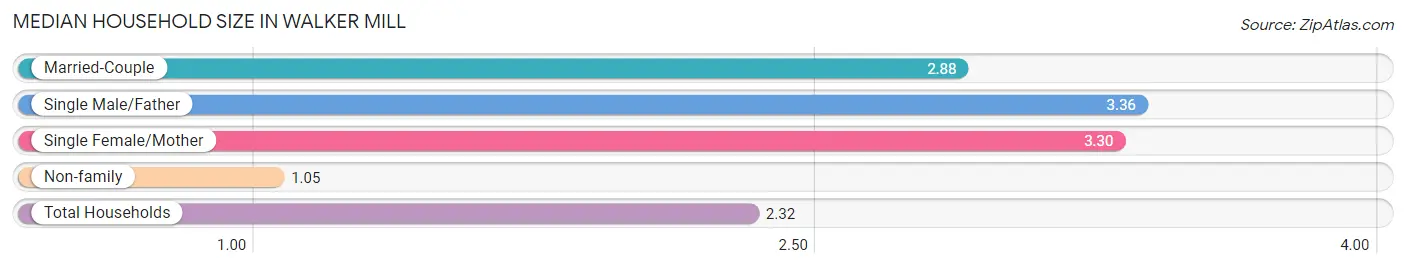
| Household Type | # Households | Household Size |
| Married-Couple | 1,130 (26.4%) | 2.88 |
| Single Male/Father | 387 (9.0%) | 3.36 |
| Single Female/Mother | 1,098 (25.6%) | 3.30 |
| Non-family | 1,669 (39.0%) | 1.05 |
| Total Households | 4,284 (100.0%) | 2.32 |
Household Size by Marriage Status in Walker Mill
Out of a total of 4,284 households in Walker Mill, 2,615 (61.0%) are family households, while 1,669 (39.0%) are nonfamily households. The most numerous type of family households are 2-person households, comprising 1,339, and the most common type of nonfamily households are 1-person households, comprising 1,579.
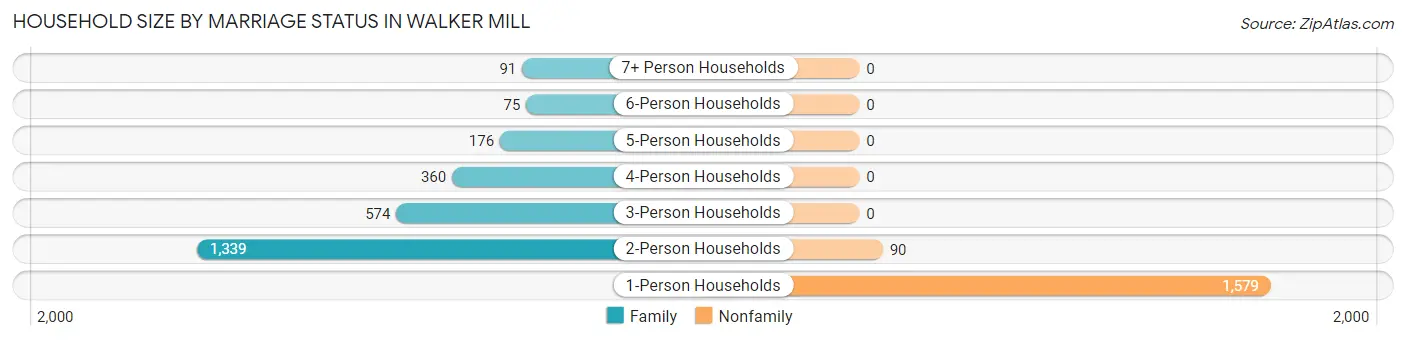
| Household Size | Family Households | Nonfamily Households |
| 1-Person Households | - | 1,579 (36.9%) |
| 2-Person Households | 1,339 (31.3%) | 90 (2.1%) |
| 3-Person Households | 574 (13.4%) | 0 (0.0%) |
| 4-Person Households | 360 (8.4%) | 0 (0.0%) |
| 5-Person Households | 176 (4.1%) | 0 (0.0%) |
| 6-Person Households | 75 (1.8%) | 0 (0.0%) |
| 7+ Person Households | 91 (2.1%) | 0 (0.0%) |
| Total | 2,615 (61.0%) | 1,669 (39.0%) |
Female Fertility in Walker Mill
Fertility by Age in Walker Mill
Average fertility rate in Walker Mill is 29.0 births per 1,000 women. Women in the age bracket of 20 to 34 years have the highest fertility rate with 61.0 births per 1,000 women. Women in the age bracket of 20 to 34 years acount for 100.0% of all women with births.
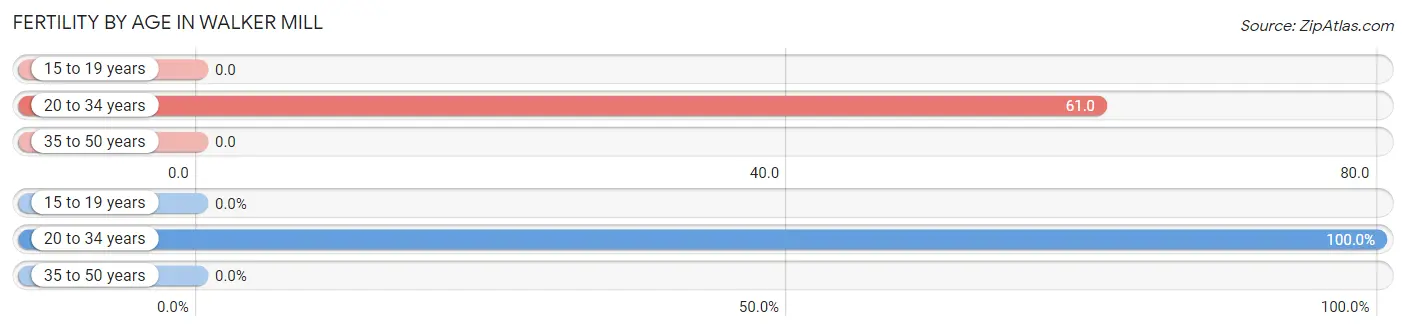
| Age Bracket | Women with Births | Births / 1,000 Women |
| 15 to 19 years | 0 (0.0%) | 0.0 |
| 20 to 34 years | 67 (100.0%) | 61.0 |
| 35 to 50 years | 0 (0.0%) | 0.0 |
| Total | 67 (100.0%) | 29.0 |
Fertility by Age by Marriage Status in Walker Mill
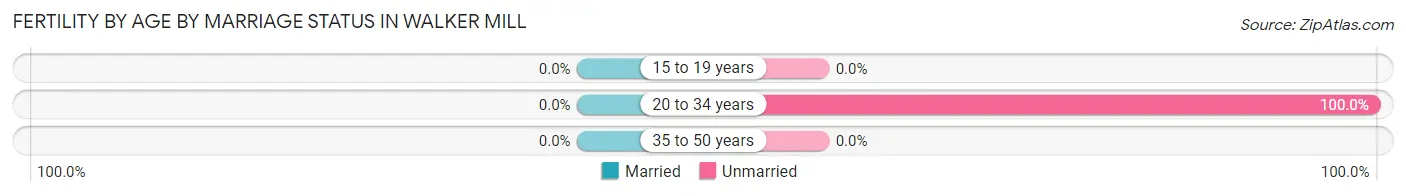
| Age Bracket | Married | Unmarried |
| 15 to 19 years | 0 (0.0%) | 0 (0.0%) |
| 20 to 34 years | 0 (0.0%) | 67 (100.0%) |
| 35 to 50 years | 0 (0.0%) | 0 (0.0%) |
| Total | 0 (0.0%) | 67 (100.0%) |
Fertility by Education in Walker Mill
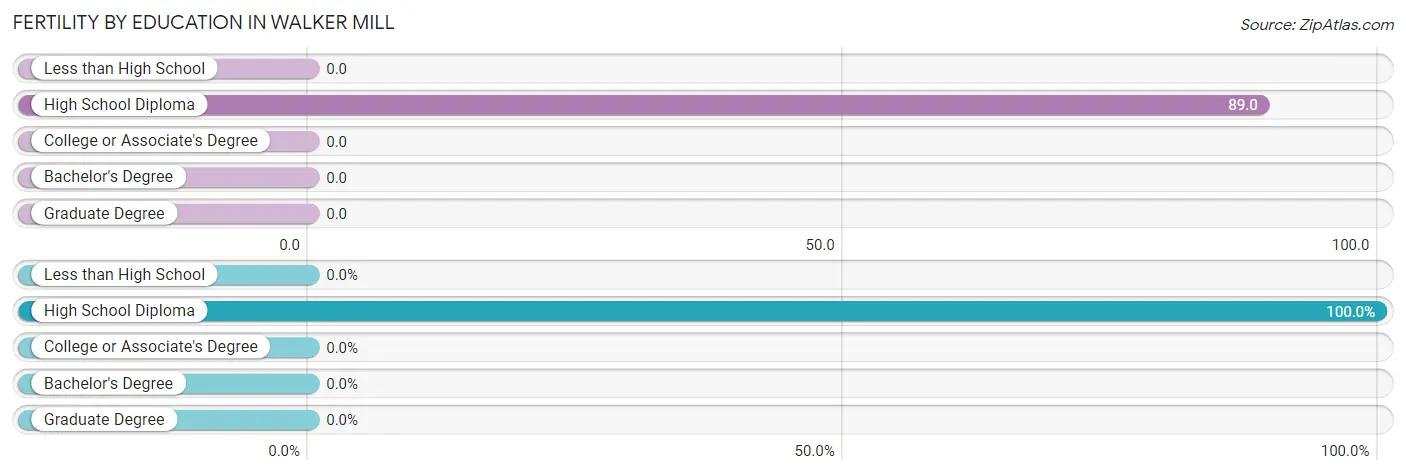
| Educational Attainment | Women with Births | Births / 1,000 Women |
| Less than High School | 0 (0.0%) | 0.0 |
| High School Diploma | 67 (100.0%) | 89.0 |
| College or Associate's Degree | 0 (0.0%) | 0.0 |
| Bachelor's Degree | 0 (0.0%) | 0.0 |
| Graduate Degree | 0 (0.0%) | 0.0 |
| Total | 67 (100.0%) | 29.0 |
Fertility by Education by Marriage Status in Walker Mill
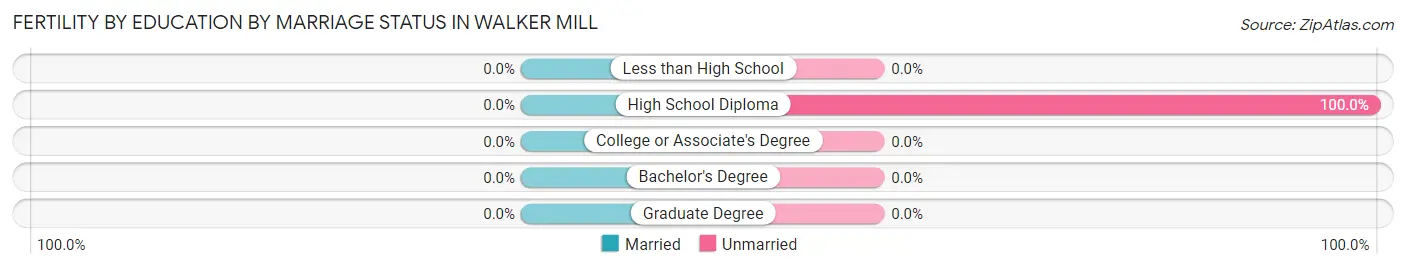
| Educational Attainment | Married | Unmarried |
| Less than High School | 0 (0.0%) | 0 (0.0%) |
| High School Diploma | 0 (0.0%) | 67 (100.0%) |
| College or Associate's Degree | 0 (0.0%) | 0 (0.0%) |
| Bachelor's Degree | 0 (0.0%) | 0 (0.0%) |
| Graduate Degree | 0 (0.0%) | 0 (0.0%) |
| Total | 0 (0.0%) | 67 (100.0%) |
Employment Characteristics in Walker Mill
Employment by Class of Employer in Walker Mill
Among the 4,747 employed individuals in Walker Mill, private company employees (2,118 | 44.6%), federal government employees (940 | 19.8%), and not-for-profit organizations (576 | 12.1%) make up the most common classes of employment.
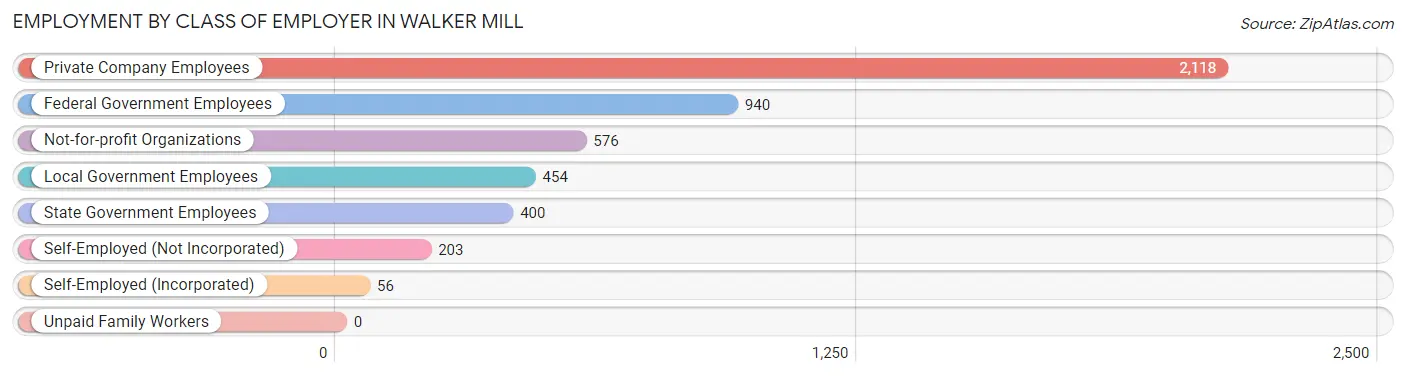
| Employer Class | # Employees | % Employees |
| Private Company Employees | 2,118 | 44.6% |
| Self-Employed (Incorporated) | 56 | 1.2% |
| Self-Employed (Not Incorporated) | 203 | 4.3% |
| Not-for-profit Organizations | 576 | 12.1% |
| Local Government Employees | 454 | 9.6% |
| State Government Employees | 400 | 8.4% |
| Federal Government Employees | 940 | 19.8% |
| Unpaid Family Workers | 0 | 0.0% |
| Total | 4,747 | 100.0% |
Employment Status by Age in Walker Mill
According to the labor force statistics for Walker Mill, out of the total population over 16 years of age (7,870), 65.5% or 5,155 individuals are in the labor force, with 6.0% or 309 of them unemployed. The age group with the highest labor force participation rate is 45 to 54 years, with 92.9% or 1,059 individuals in the labor force. Within the labor force, the 16 to 19 years age range has the highest percentage of unemployed individuals, with 32.2% or 58 of them being unemployed.
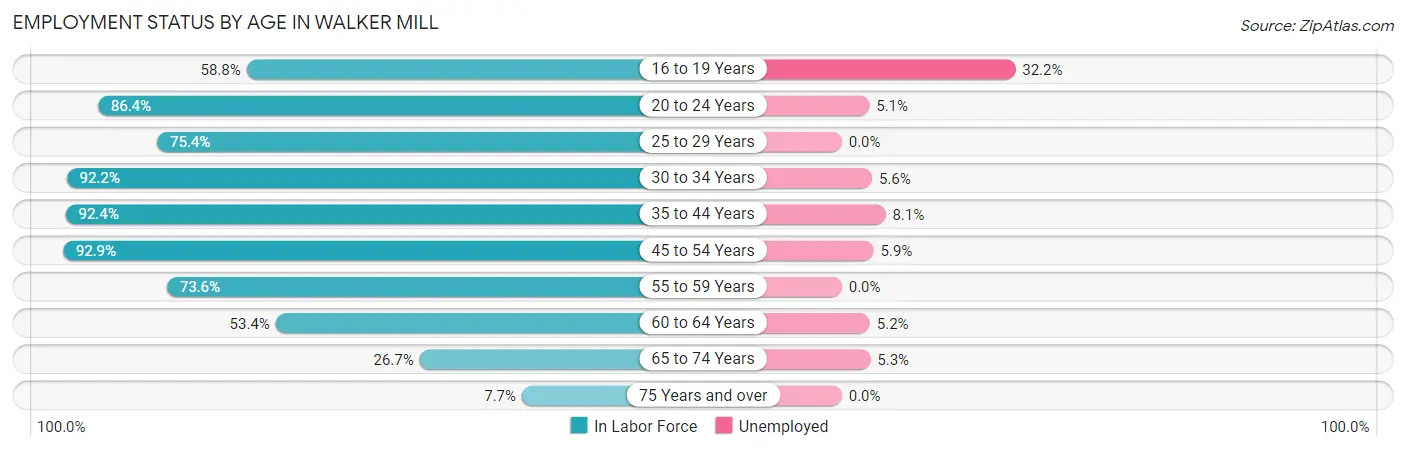
| Age Bracket | In Labor Force | Unemployed |
| 16 to 19 Years | 180 (58.8%) | 58 (32.2%) |
| 20 to 24 Years | 528 (86.4%) | 27 (5.1%) |
| 25 to 29 Years | 310 (75.4%) | 0 (0.0%) |
| 30 to 34 Years | 926 (92.2%) | 52 (5.6%) |
| 35 to 44 Years | 922 (92.4%) | 75 (8.1%) |
| 45 to 54 Years | 1,059 (92.9%) | 62 (5.9%) |
| 55 to 59 Years | 463 (73.6%) | 0 (0.0%) |
| 60 to 64 Years | 460 (53.4%) | 24 (5.2%) |
| 65 to 74 Years | 227 (26.7%) | 12 (5.3%) |
| 75 Years and over | 82 (7.7%) | 0 (0.0%) |
| Total | 5,155 (65.5%) | 309 (6.0%) |
Employment Status by Educational Attainment in Walker Mill
According to labor force statistics for Walker Mill, 82.1% of individuals (4,140) out of the total population between 25 and 64 years of age (5,043) are in the labor force, with 5.2% or 215 of them being unemployed. The group with the highest labor force participation rate are those with the educational attainment of bachelor's degree or higher, with 94.9% or 1,182 individuals in the labor force. Within the labor force, individuals with less than high school education have the highest percentage of unemployment, with 12.5% or 21 of them being unemployed.
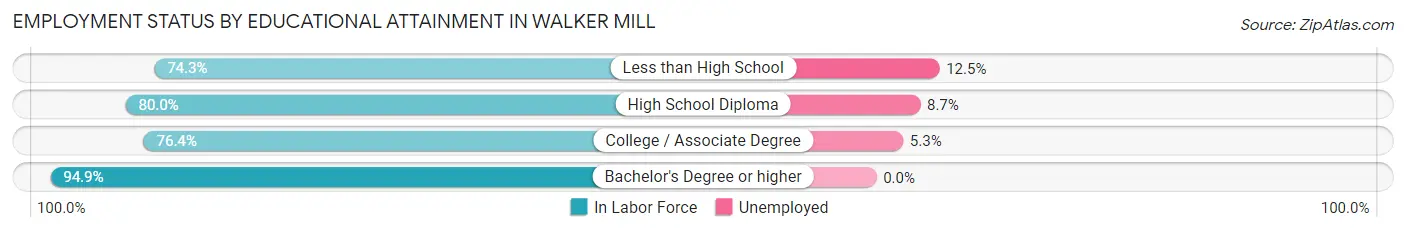
| Educational Attainment | In Labor Force | Unemployed |
| Less than High School | 168 (74.3%) | 28 (12.5%) |
| High School Diploma | 1,362 (80.0%) | 148 (8.7%) |
| College / Associate Degree | 1,427 (76.4%) | 99 (5.3%) |
| Bachelor's Degree or higher | 1,182 (94.9%) | 0 (0.0%) |
| Total | 4,140 (82.1%) | 262 (5.2%) |
Employment Occupations by Sex in Walker Mill
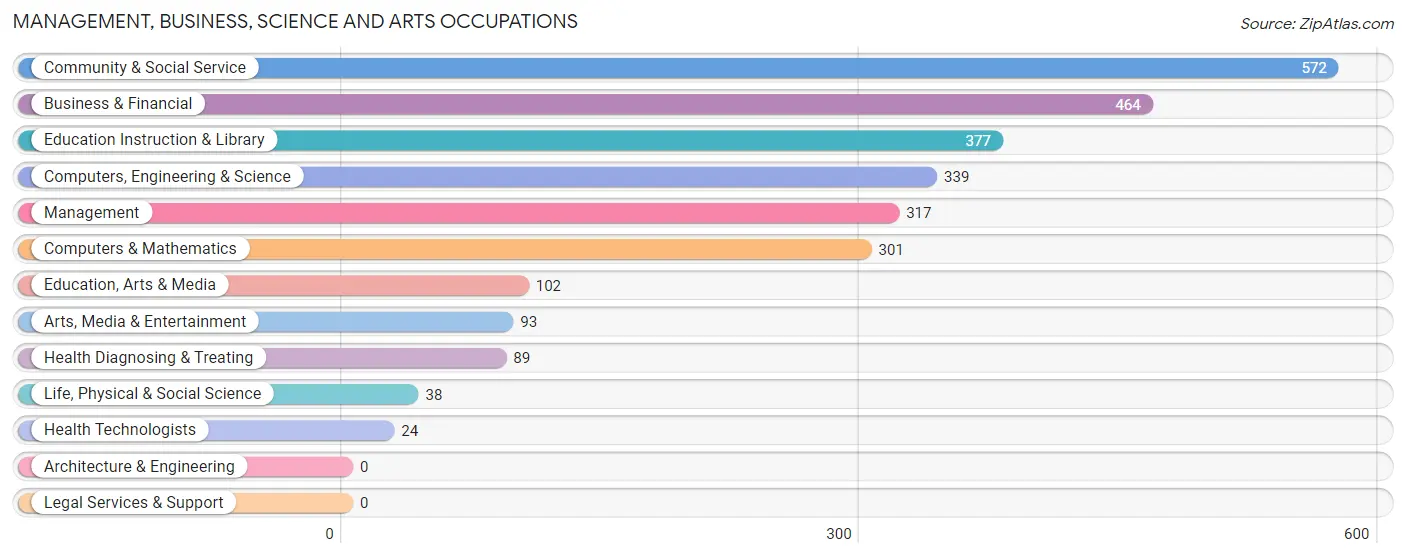
Management, Business, Science and Arts Occupations
The most common Management, Business, Science and Arts occupations in Walker Mill are Community & Social Service (572 | 11.8%), Business & Financial (464 | 9.6%), Education Instruction & Library (377 | 7.8%), Computers, Engineering & Science (339 | 7.0%), and Management (317 | 6.5%).
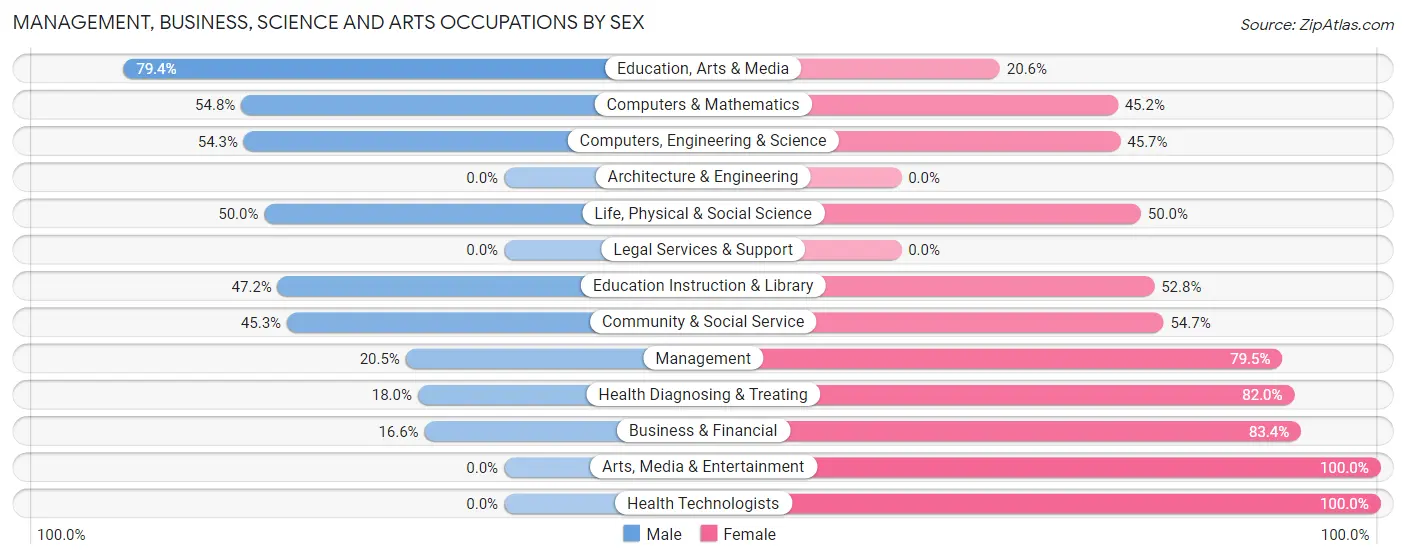
Management, Business, Science and Arts Occupations by Sex
Within the Management, Business, Science and Arts occupations in Walker Mill, the most male-oriented occupations are Education, Arts & Media (79.4%), Computers & Mathematics (54.8%), and Computers, Engineering & Science (54.3%), while the most female-oriented occupations are Arts, Media & Entertainment (100.0%), Health Technologists (100.0%), and Business & Financial (83.4%).
| Occupation | Male | Female |
| Management | 65 (20.5%) | 252 (79.5%) |
| Business & Financial | 77 (16.6%) | 387 (83.4%) |
| Computers, Engineering & Science | 184 (54.3%) | 155 (45.7%) |
| Computers & Mathematics | 165 (54.8%) | 136 (45.2%) |
| Architecture & Engineering | 0 (0.0%) | 0 (0.0%) |
| Life, Physical & Social Science | 19 (50.0%) | 19 (50.0%) |
| Community & Social Service | 259 (45.3%) | 313 (54.7%) |
| Education, Arts & Media | 81 (79.4%) | 21 (20.6%) |
| Legal Services & Support | 0 (0.0%) | 0 (0.0%) |
| Education Instruction & Library | 178 (47.2%) | 199 (52.8%) |
| Arts, Media & Entertainment | 0 (0.0%) | 93 (100.0%) |
| Health Diagnosing & Treating | 16 (18.0%) | 73 (82.0%) |
| Health Technologists | 0 (0.0%) | 24 (100.0%) |
| Total (Category) | 601 (33.8%) | 1,180 (66.2%) |
| Total (Overall) | 2,131 (44.0%) | 2,715 (56.0%) |
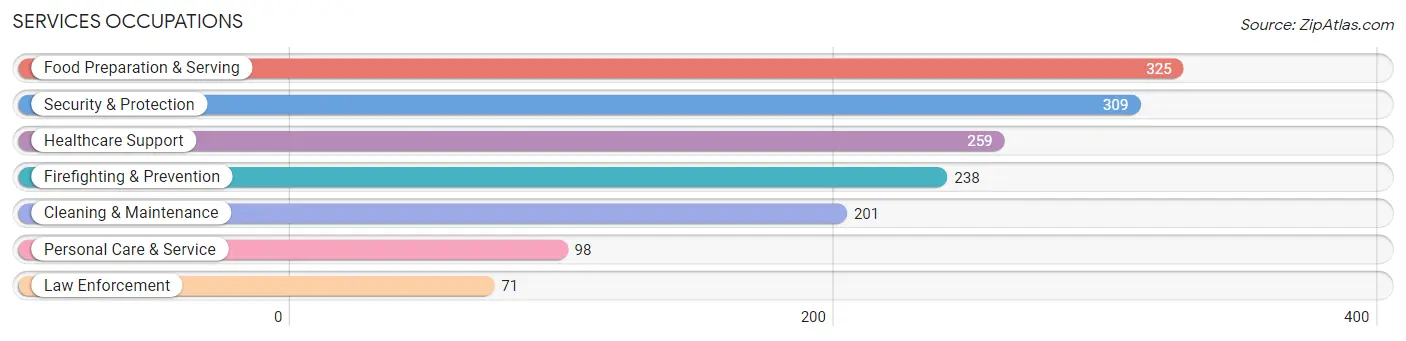
Services Occupations
The most common Services occupations in Walker Mill are Food Preparation & Serving (325 | 6.7%), Security & Protection (309 | 6.4%), Healthcare Support (259 | 5.3%), Firefighting & Prevention (238 | 4.9%), and Cleaning & Maintenance (201 | 4.2%).
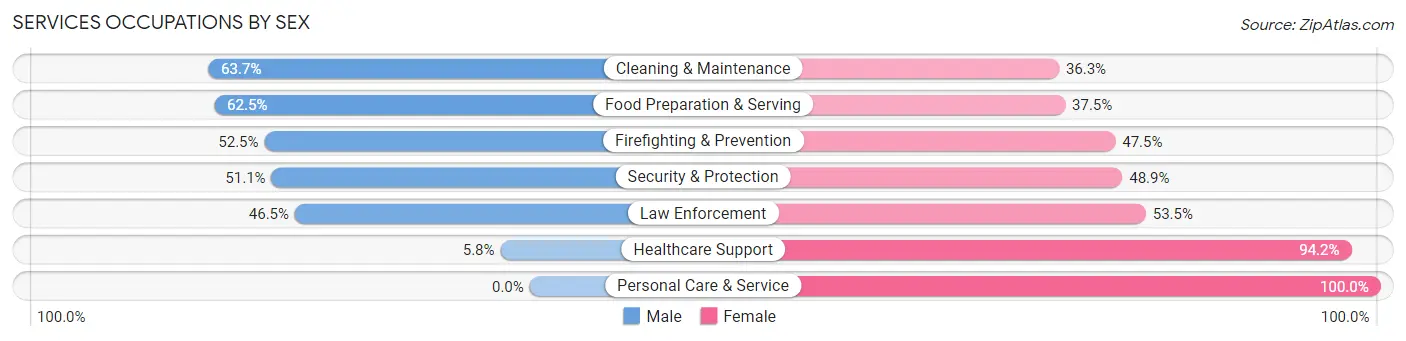
Services Occupations by Sex
Within the Services occupations in Walker Mill, the most male-oriented occupations are Cleaning & Maintenance (63.7%), Food Preparation & Serving (62.5%), and Firefighting & Prevention (52.5%), while the most female-oriented occupations are Personal Care & Service (100.0%), Healthcare Support (94.2%), and Law Enforcement (53.5%).
| Occupation | Male | Female |
| Healthcare Support | 15 (5.8%) | 244 (94.2%) |
| Security & Protection | 158 (51.1%) | 151 (48.9%) |
| Firefighting & Prevention | 125 (52.5%) | 113 (47.5%) |
| Law Enforcement | 33 (46.5%) | 38 (53.5%) |
| Food Preparation & Serving | 203 (62.5%) | 122 (37.5%) |
| Cleaning & Maintenance | 128 (63.7%) | 73 (36.3%) |
| Personal Care & Service | 0 (0.0%) | 98 (100.0%) |
| Total (Category) | 504 (42.3%) | 688 (57.7%) |
| Total (Overall) | 2,131 (44.0%) | 2,715 (56.0%) |
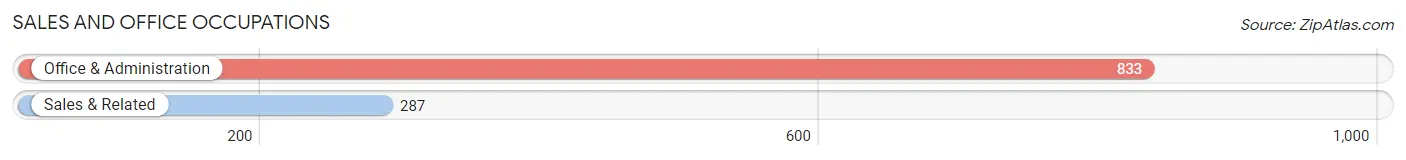
Sales and Office Occupations
The most common Sales and Office occupations in Walker Mill are Office & Administration (833 | 17.2%), and Sales & Related (287 | 5.9%).
Sales and Office Occupations by Sex
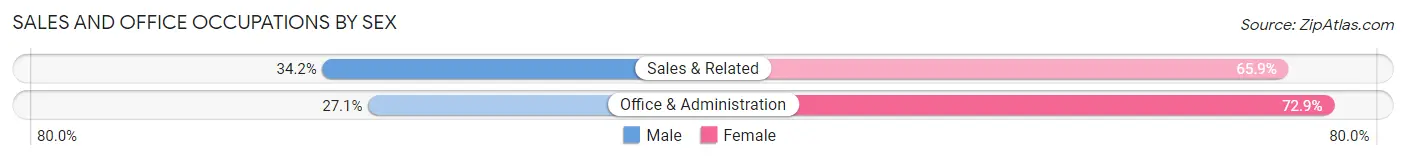
| Occupation | Male | Female |
| Sales & Related | 98 (34.2%) | 189 (65.8%) |
| Office & Administration | 226 (27.1%) | 607 (72.9%) |
| Total (Category) | 324 (28.9%) | 796 (71.1%) |
| Total (Overall) | 2,131 (44.0%) | 2,715 (56.0%) |
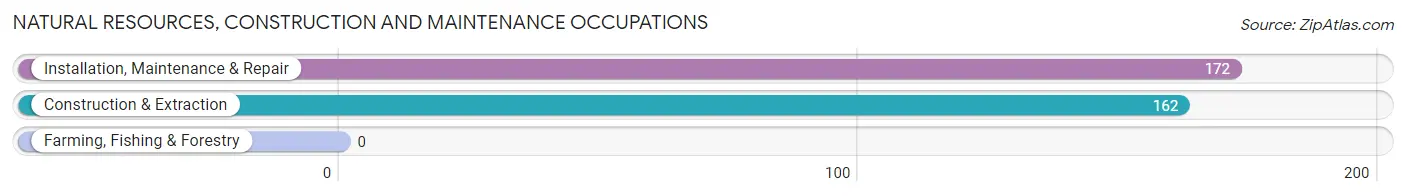
Natural Resources, Construction and Maintenance Occupations
The most common Natural Resources, Construction and Maintenance occupations in Walker Mill are Installation, Maintenance & Repair (172 | 3.5%), and Construction & Extraction (162 | 3.3%).
Natural Resources, Construction and Maintenance Occupations by Sex
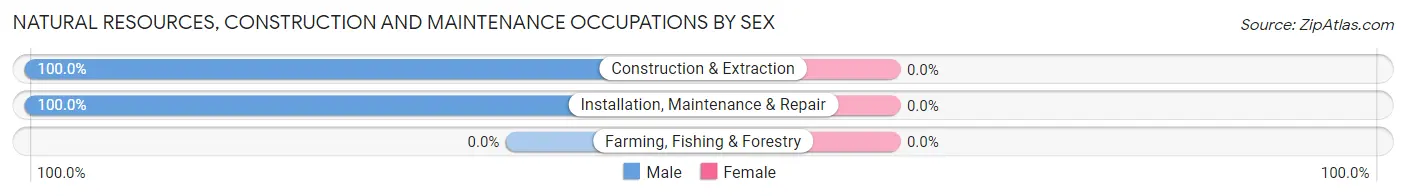
| Occupation | Male | Female |
| Farming, Fishing & Forestry | 0 (0.0%) | 0 (0.0%) |
| Construction & Extraction | 162 (100.0%) | 0 (0.0%) |
| Installation, Maintenance & Repair | 172 (100.0%) | 0 (0.0%) |
| Total (Category) | 334 (100.0%) | 0 (0.0%) |
| Total (Overall) | 2,131 (44.0%) | 2,715 (56.0%) |
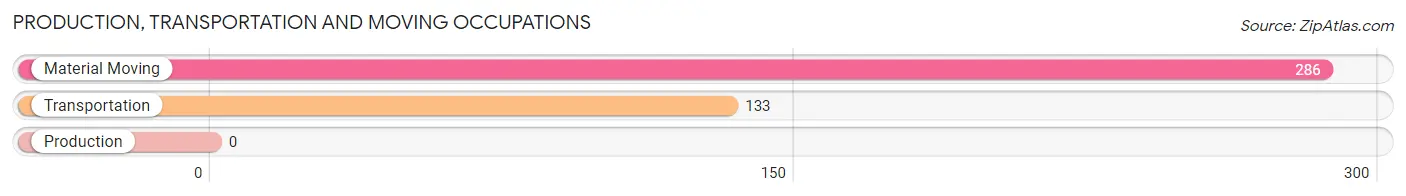
Production, Transportation and Moving Occupations
The most common Production, Transportation and Moving occupations in Walker Mill are Material Moving (286 | 5.9%), and Transportation (133 | 2.7%).
Production, Transportation and Moving Occupations by Sex
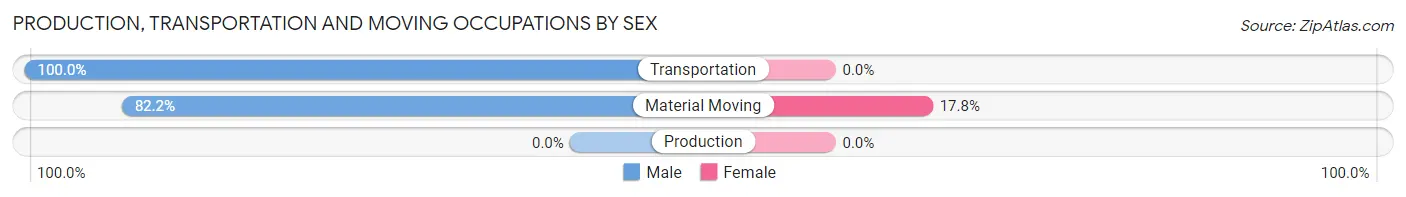
| Occupation | Male | Female |
| Production | 0 (0.0%) | 0 (0.0%) |
| Transportation | 133 (100.0%) | 0 (0.0%) |
| Material Moving | 235 (82.2%) | 51 (17.8%) |
| Total (Category) | 368 (87.8%) | 51 (12.2%) |
| Total (Overall) | 2,131 (44.0%) | 2,715 (56.0%) |
Employment Industries by Sex in Walker Mill
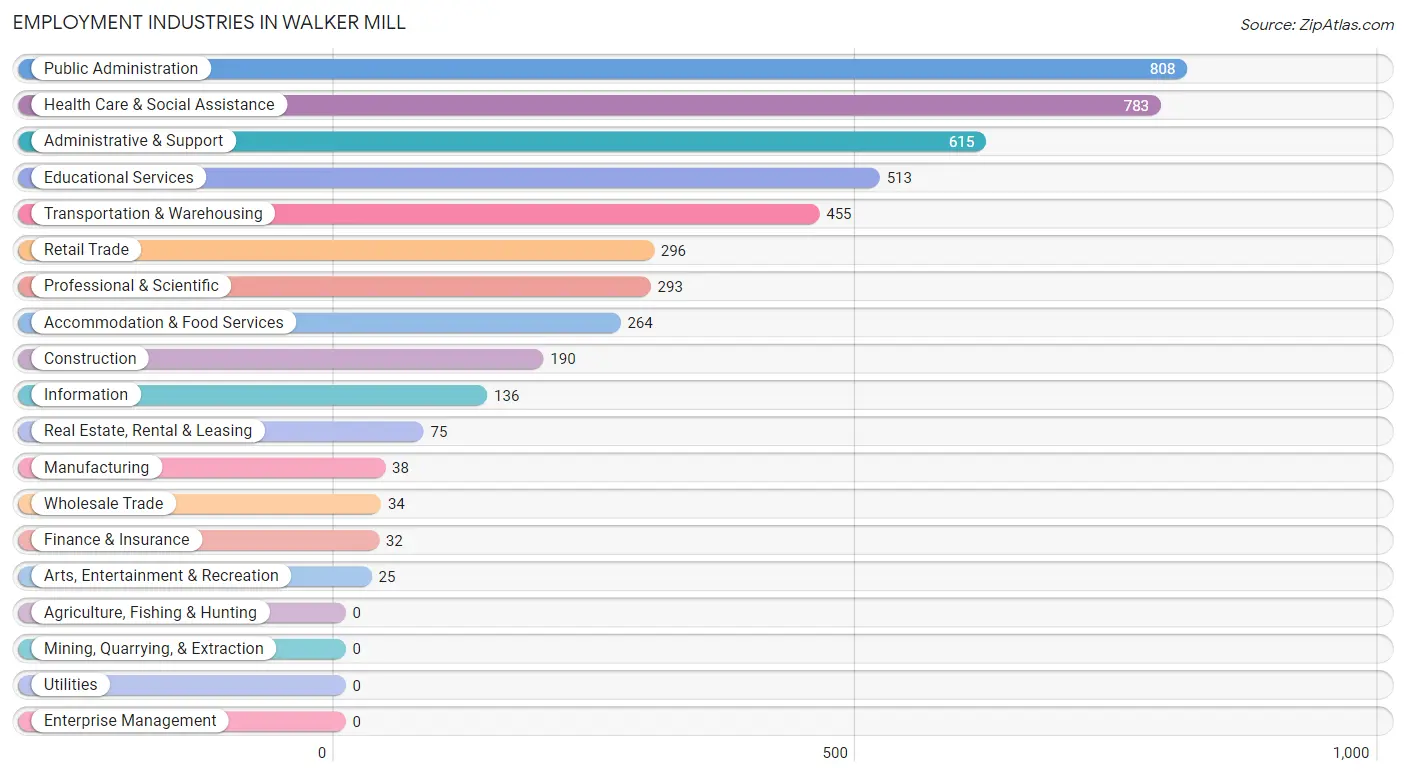
Employment Industries in Walker Mill
The major employment industries in Walker Mill include Public Administration (808 | 16.7%), Health Care & Social Assistance (783 | 16.2%), Administrative & Support (615 | 12.7%), Educational Services (513 | 10.6%), and Transportation & Warehousing (455 | 9.4%).
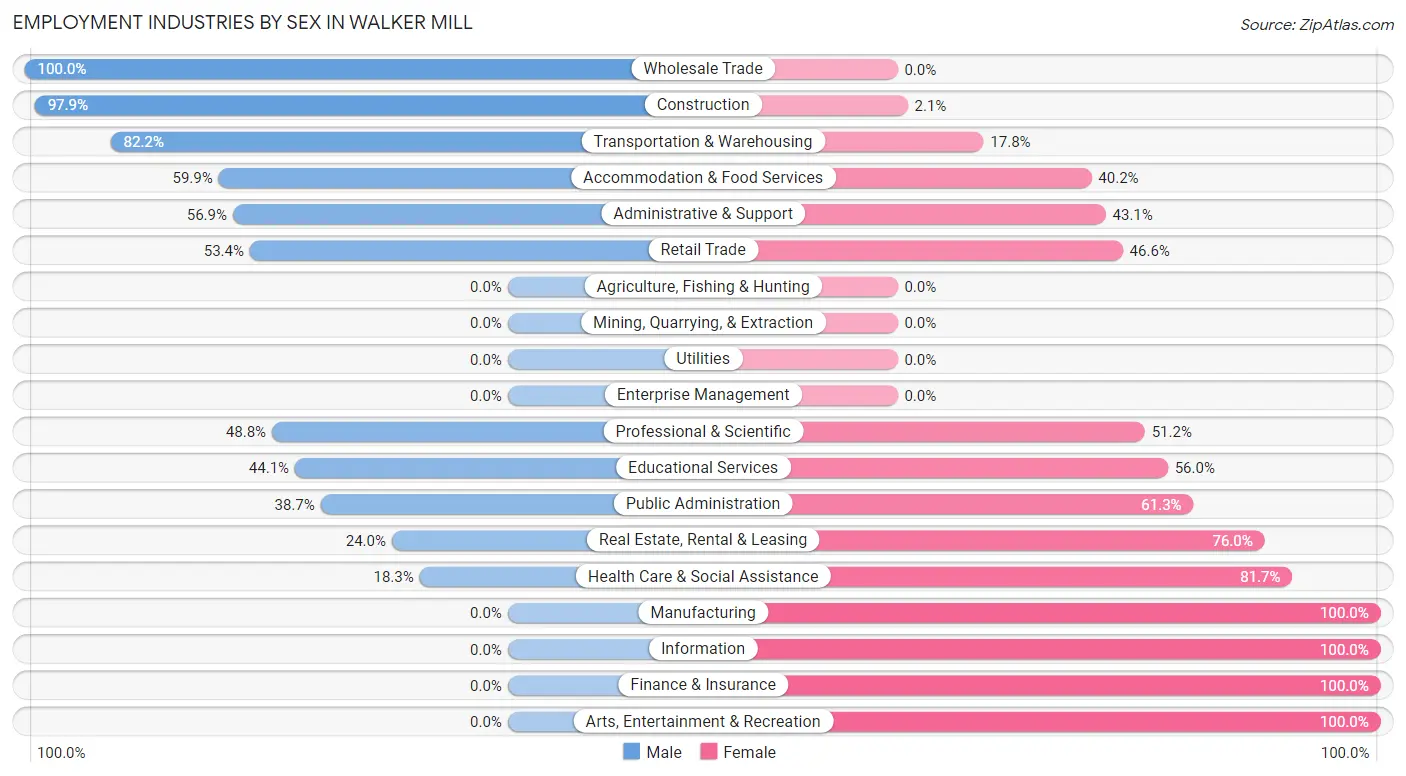
Employment Industries by Sex in Walker Mill
The Walker Mill industries that see more men than women are Wholesale Trade (100.0%), Construction (97.9%), and Transportation & Warehousing (82.2%), whereas the industries that tend to have a higher number of women are Manufacturing (100.0%), Information (100.0%), and Finance & Insurance (100.0%).
| Industry | Male | Female |
| Agriculture, Fishing & Hunting | 0 (0.0%) | 0 (0.0%) |
| Mining, Quarrying, & Extraction | 0 (0.0%) | 0 (0.0%) |
| Construction | 186 (97.9%) | 4 (2.1%) |
| Manufacturing | 0 (0.0%) | 38 (100.0%) |
| Wholesale Trade | 34 (100.0%) | 0 (0.0%) |
| Retail Trade | 158 (53.4%) | 138 (46.6%) |
| Transportation & Warehousing | 374 (82.2%) | 81 (17.8%) |
| Utilities | 0 (0.0%) | 0 (0.0%) |
| Information | 0 (0.0%) | 136 (100.0%) |
| Finance & Insurance | 0 (0.0%) | 32 (100.0%) |
| Real Estate, Rental & Leasing | 18 (24.0%) | 57 (76.0%) |
| Professional & Scientific | 143 (48.8%) | 150 (51.2%) |
| Enterprise Management | 0 (0.0%) | 0 (0.0%) |
| Administrative & Support | 350 (56.9%) | 265 (43.1%) |
| Educational Services | 226 (44.1%) | 287 (55.9%) |
| Health Care & Social Assistance | 143 (18.3%) | 640 (81.7%) |
| Arts, Entertainment & Recreation | 0 (0.0%) | 25 (100.0%) |
| Accommodation & Food Services | 158 (59.9%) | 106 (40.2%) |
| Public Administration | 313 (38.7%) | 495 (61.3%) |
| Total | 2,131 (44.0%) | 2,715 (56.0%) |
Education in Walker Mill
School Enrollment in Walker Mill
The most common levels of schooling among the 2,041 students in Walker Mill are middle school (714 | 35.0%), elementary school (525 | 25.7%), and high school (366 | 17.9%).
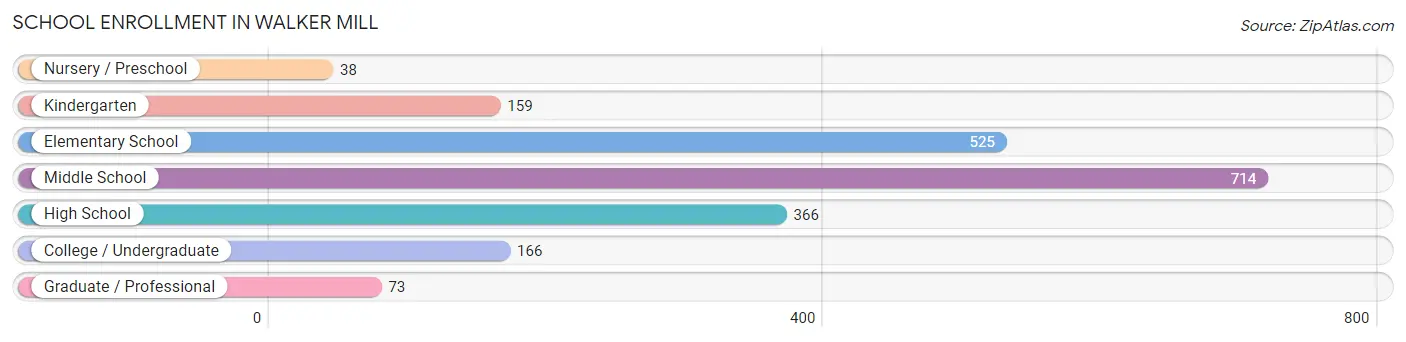
| School Level | # Students | % Students |
| Nursery / Preschool | 38 | 1.9% |
| Kindergarten | 159 | 7.8% |
| Elementary School | 525 | 25.7% |
| Middle School | 714 | 35.0% |
| High School | 366 | 17.9% |
| College / Undergraduate | 166 | 8.1% |
| Graduate / Professional | 73 | 3.6% |
| Total | 2,041 | 100.0% |
School Enrollment by Age by Funding Source in Walker Mill
Out of a total of 2,041 students who are enrolled in schools in Walker Mill, 116 (5.7%) attend a private institution, while the remaining 1,925 (94.3%) are enrolled in public schools. The age group of 35 years and over has the highest likelihood of being enrolled in private schools, with 52 (59.8% in the age bracket) enrolled. Conversely, the age group of 3 to 4 year olds has the lowest likelihood of being enrolled in a private school, with 124 (100.0% in the age bracket) attending a public institution.
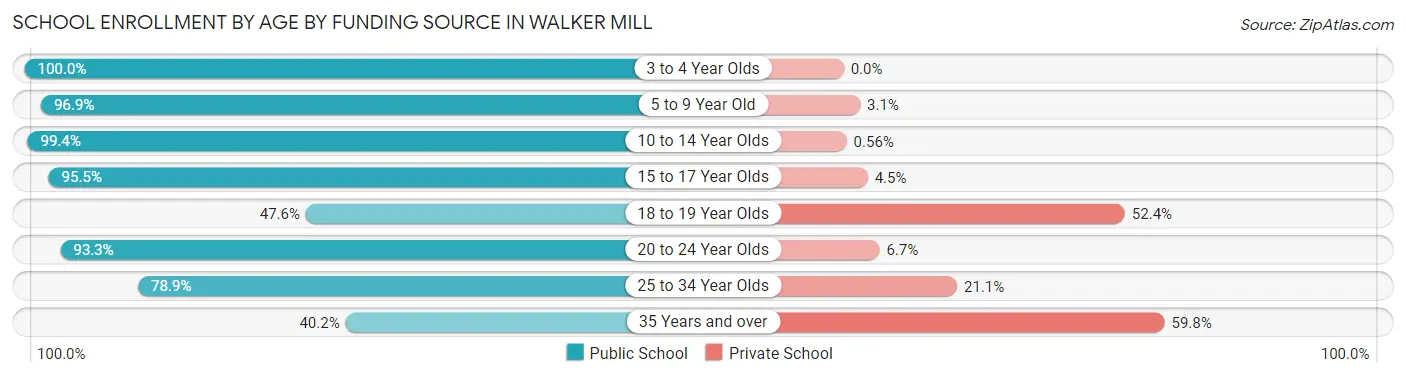
| Age Bracket | Public School | Private School |
| 3 to 4 Year Olds | 124 (100.0%) | 0 (0.0%) |
| 5 to 9 Year Old | 475 (96.9%) | 15 (3.1%) |
| 10 to 14 Year Olds | 885 (99.4%) | 5 (0.6%) |
| 15 to 17 Year Olds | 256 (95.5%) | 12 (4.5%) |
| 18 to 19 Year Olds | 10 (47.6%) | 11 (52.4%) |
| 20 to 24 Year Olds | 84 (93.3%) | 6 (6.7%) |
| 25 to 34 Year Olds | 56 (78.9%) | 15 (21.1%) |
| 35 Years and over | 35 (40.2%) | 52 (59.8%) |
| Total | 1,925 (94.3%) | 116 (5.7%) |
Educational Attainment by Field of Study in Walker Mill
Business (587 | 32.2%), education (217 | 11.9%), science & technology (190 | 10.4%), computers & mathematics (185 | 10.2%), and arts & humanities (177 | 9.7%) are the most common fields of study among 1,823 individuals in Walker Mill who have obtained a bachelor's degree or higher.
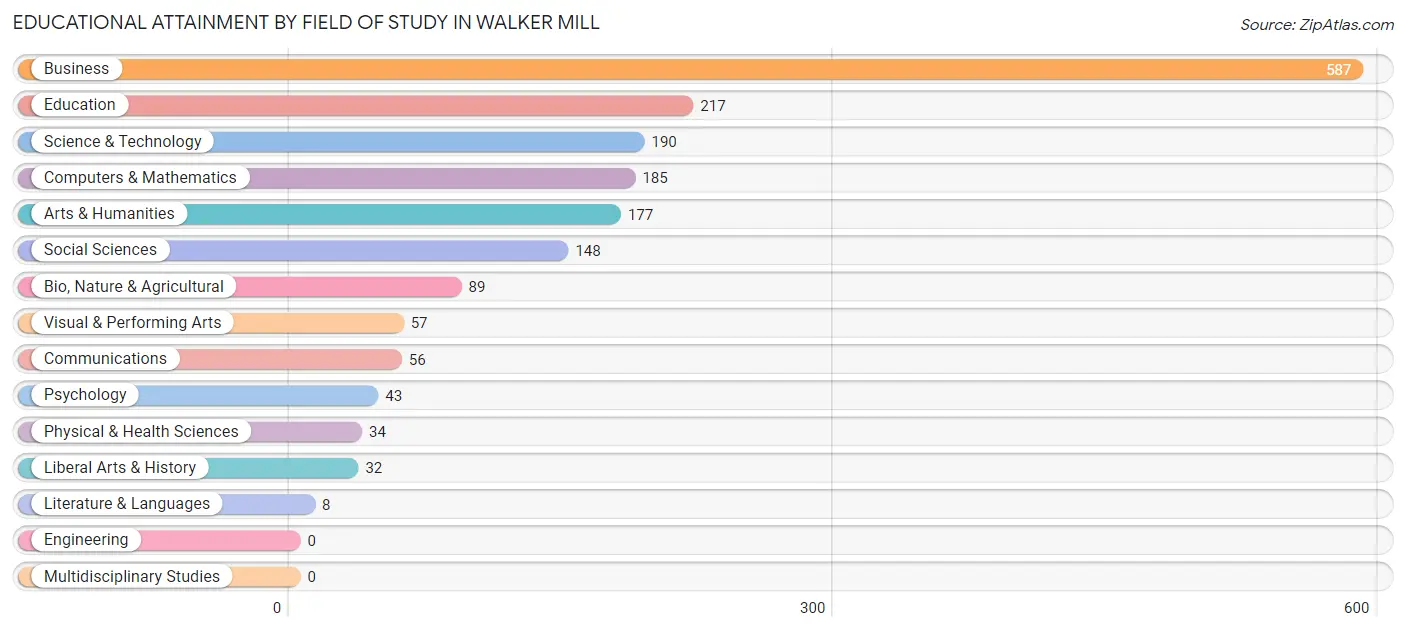
| Field of Study | # Graduates | % Graduates |
| Computers & Mathematics | 185 | 10.2% |
| Bio, Nature & Agricultural | 89 | 4.9% |
| Physical & Health Sciences | 34 | 1.9% |
| Psychology | 43 | 2.4% |
| Social Sciences | 148 | 8.1% |
| Engineering | 0 | 0.0% |
| Multidisciplinary Studies | 0 | 0.0% |
| Science & Technology | 190 | 10.4% |
| Business | 587 | 32.2% |
| Education | 217 | 11.9% |
| Literature & Languages | 8 | 0.4% |
| Liberal Arts & History | 32 | 1.8% |
| Visual & Performing Arts | 57 | 3.1% |
| Communications | 56 | 3.1% |
| Arts & Humanities | 177 | 9.7% |
| Total | 1,823 | 100.0% |
Transportation & Commute in Walker Mill
Vehicle Availability by Sex in Walker Mill
The most prevalent vehicle ownership categories in Walker Mill are males with 1 vehicle (760, accounting for 36.8%) and females with 1 vehicle (934, making up 28.4%).
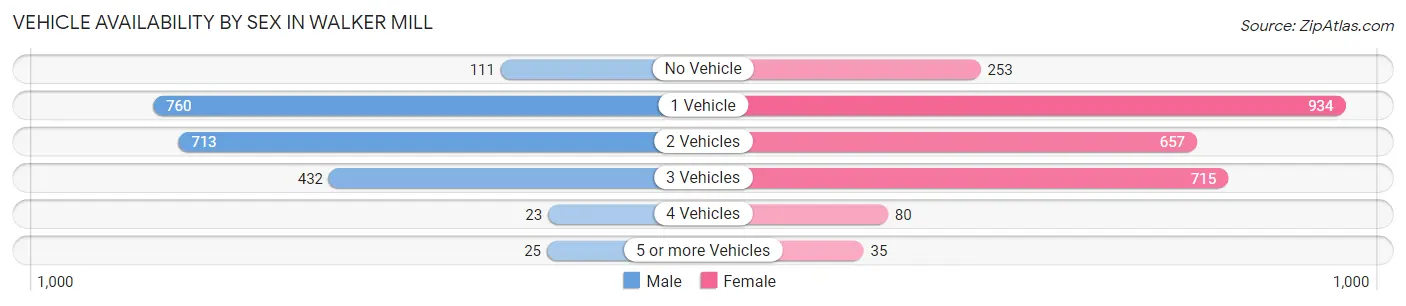
| Vehicles Available | Male | Female |
| No Vehicle | 111 (5.4%) | 253 (9.5%) |
| 1 Vehicle | 760 (36.8%) | 934 (34.9%) |
| 2 Vehicles | 713 (34.5%) | 657 (24.6%) |
| 3 Vehicles | 432 (20.9%) | 715 (26.7%) |
| 4 Vehicles | 23 (1.1%) | 80 (3.0%) |
| 5 or more Vehicles | 25 (1.2%) | 35 (1.3%) |
| Total | 2,064 (100.0%) | 2,674 (100.0%) |
Commute Time in Walker Mill
The most frequently occuring commute durations in Walker Mill are 30 to 34 minutes (794 commuters, 18.1%), 45 to 59 minutes (713 commuters, 16.3%), and 15 to 19 minutes (529 commuters, 12.0%).
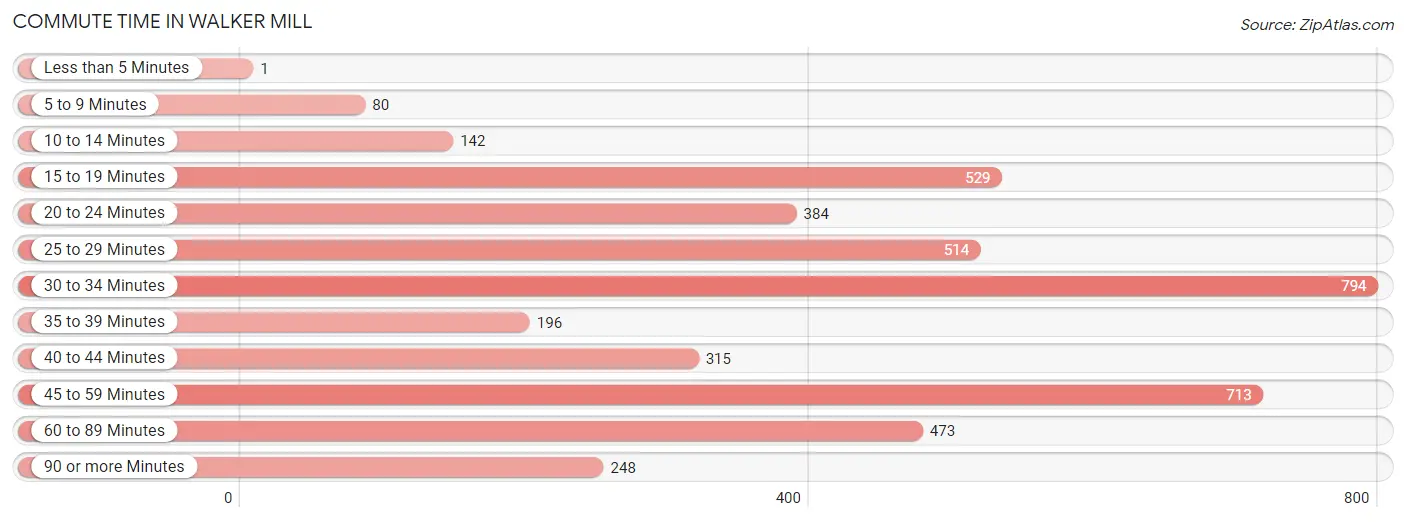
| Commute Time | # Commuters | % Commuters |
| Less than 5 Minutes | 1 | 0.0% |
| 5 to 9 Minutes | 80 | 1.8% |
| 10 to 14 Minutes | 142 | 3.2% |
| 15 to 19 Minutes | 529 | 12.0% |
| 20 to 24 Minutes | 384 | 8.7% |
| 25 to 29 Minutes | 514 | 11.7% |
| 30 to 34 Minutes | 794 | 18.1% |
| 35 to 39 Minutes | 196 | 4.5% |
| 40 to 44 Minutes | 315 | 7.2% |
| 45 to 59 Minutes | 713 | 16.3% |
| 60 to 89 Minutes | 473 | 10.8% |
| 90 or more Minutes | 248 | 5.7% |
Commute Time by Sex in Walker Mill
The most common commute times in Walker Mill are 30 to 34 minutes (323 commuters, 16.8%) for males and 45 to 59 minutes (480 commuters, 19.4%) for females.
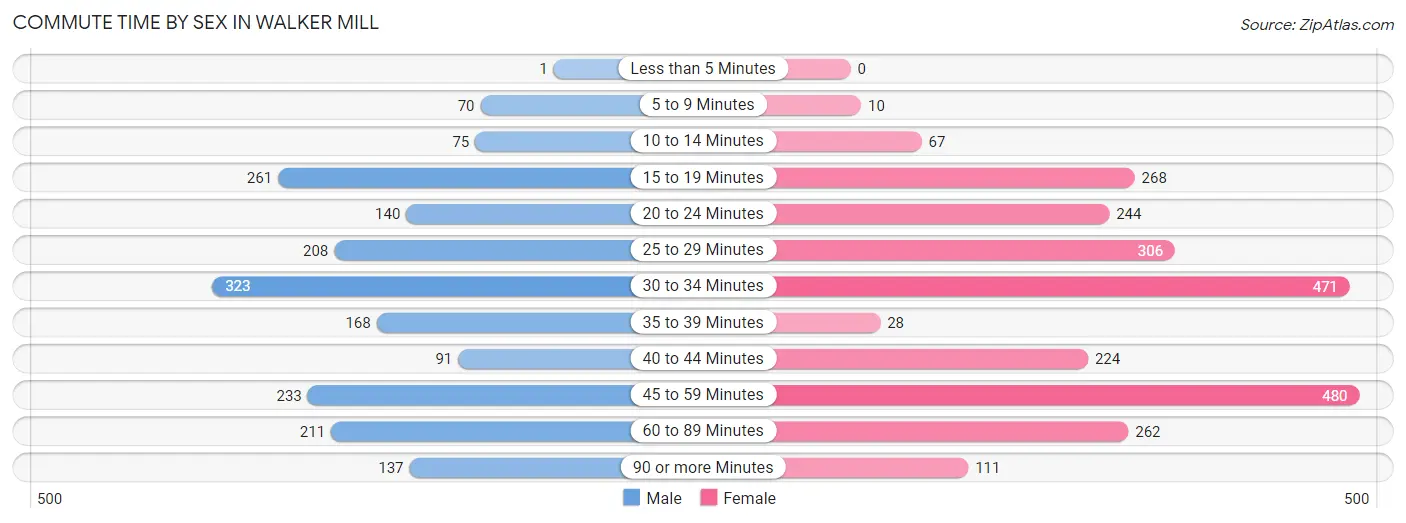
| Commute Time | Male | Female |
| Less than 5 Minutes | 1 (0.1%) | 0 (0.0%) |
| 5 to 9 Minutes | 70 (3.6%) | 10 (0.4%) |
| 10 to 14 Minutes | 75 (3.9%) | 67 (2.7%) |
| 15 to 19 Minutes | 261 (13.6%) | 268 (10.8%) |
| 20 to 24 Minutes | 140 (7.3%) | 244 (9.9%) |
| 25 to 29 Minutes | 208 (10.8%) | 306 (12.4%) |
| 30 to 34 Minutes | 323 (16.8%) | 471 (19.1%) |
| 35 to 39 Minutes | 168 (8.8%) | 28 (1.1%) |
| 40 to 44 Minutes | 91 (4.7%) | 224 (9.1%) |
| 45 to 59 Minutes | 233 (12.1%) | 480 (19.4%) |
| 60 to 89 Minutes | 211 (11.0%) | 262 (10.6%) |
| 90 or more Minutes | 137 (7.1%) | 111 (4.5%) |
Time of Departure to Work by Sex in Walker Mill
The most frequent times of departure to work in Walker Mill are 7:00 AM to 7:29 AM (395, 20.6%) for males and 7:30 AM to 7:59 AM (360, 14.6%) for females.
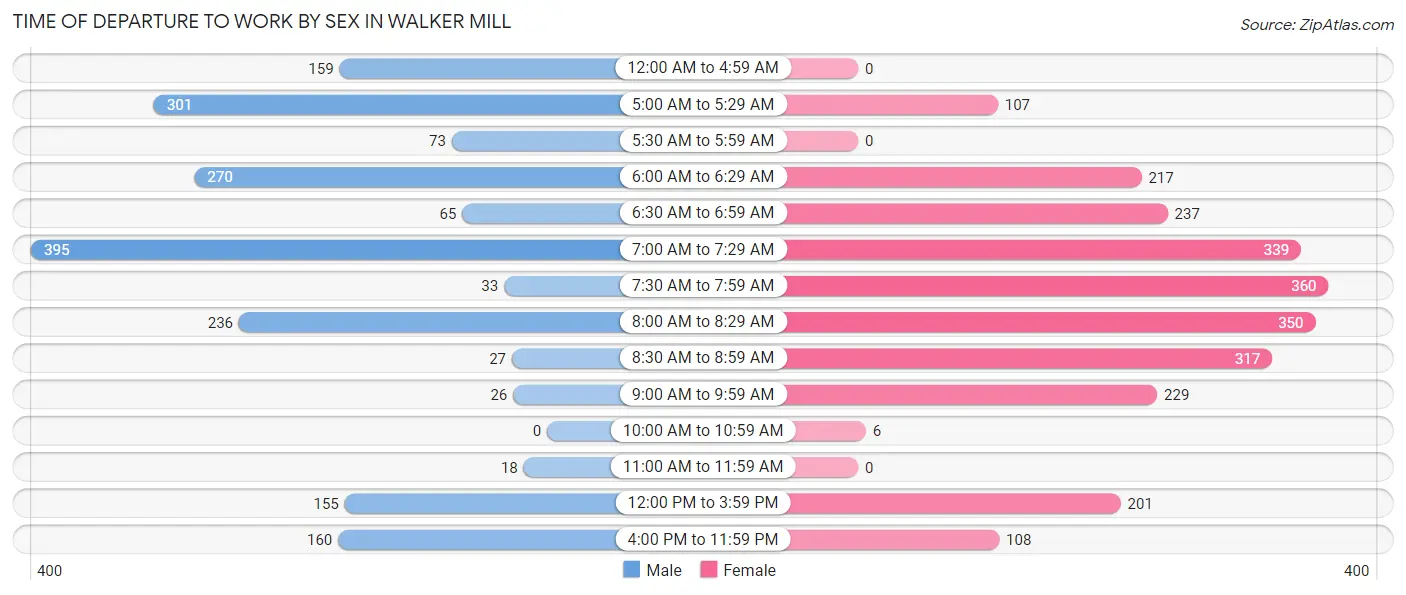
| Time of Departure | Male | Female |
| 12:00 AM to 4:59 AM | 159 (8.3%) | 0 (0.0%) |
| 5:00 AM to 5:29 AM | 301 (15.7%) | 107 (4.3%) |
| 5:30 AM to 5:59 AM | 73 (3.8%) | 0 (0.0%) |
| 6:00 AM to 6:29 AM | 270 (14.1%) | 217 (8.8%) |
| 6:30 AM to 6:59 AM | 65 (3.4%) | 237 (9.6%) |
| 7:00 AM to 7:29 AM | 395 (20.6%) | 339 (13.7%) |
| 7:30 AM to 7:59 AM | 33 (1.7%) | 360 (14.6%) |
| 8:00 AM to 8:29 AM | 236 (12.3%) | 350 (14.2%) |
| 8:30 AM to 8:59 AM | 27 (1.4%) | 317 (12.8%) |
| 9:00 AM to 9:59 AM | 26 (1.4%) | 229 (9.3%) |
| 10:00 AM to 10:59 AM | 0 (0.0%) | 6 (0.2%) |
| 11:00 AM to 11:59 AM | 18 (0.9%) | 0 (0.0%) |
| 12:00 PM to 3:59 PM | 155 (8.1%) | 201 (8.1%) |
| 4:00 PM to 11:59 PM | 160 (8.3%) | 108 (4.4%) |
| Total | 1,918 (100.0%) | 2,471 (100.0%) |
Housing Occupancy in Walker Mill
Occupancy by Ownership in Walker Mill
Of the total 4,284 dwellings in Walker Mill, owner-occupied units account for 2,353 (54.9%), while renter-occupied units make up 1,931 (45.1%).
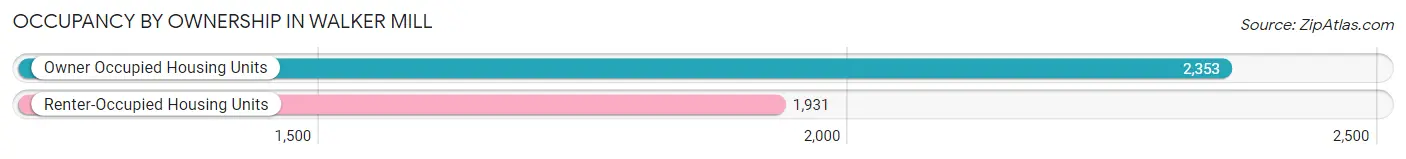
| Occupancy | # Housing Units | % Housing Units |
| Owner Occupied Housing Units | 2,353 | 54.9% |
| Renter-Occupied Housing Units | 1,931 | 45.1% |
| Total Occupied Housing Units | 4,284 | 100.0% |
Occupancy by Household Size in Walker Mill
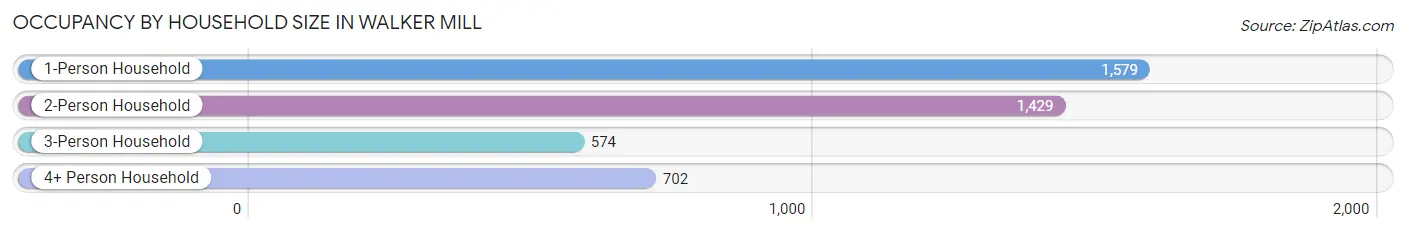
| Household Size | # Housing Units | % Housing Units |
| 1-Person Household | 1,579 | 36.9% |
| 2-Person Household | 1,429 | 33.4% |
| 3-Person Household | 574 | 13.4% |
| 4+ Person Household | 702 | 16.4% |
| Total Housing Units | 4,284 | 100.0% |
Occupancy by Ownership by Household Size in Walker Mill
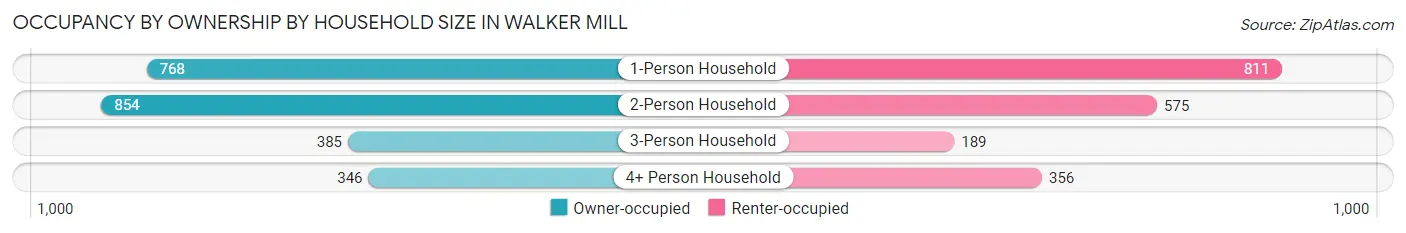
| Household Size | Owner-occupied | Renter-occupied |
| 1-Person Household | 768 (48.6%) | 811 (51.4%) |
| 2-Person Household | 854 (59.8%) | 575 (40.2%) |
| 3-Person Household | 385 (67.1%) | 189 (32.9%) |
| 4+ Person Household | 346 (49.3%) | 356 (50.7%) |
| Total Housing Units | 2,353 (54.9%) | 1,931 (45.1%) |
Occupancy by Educational Attainment in Walker Mill
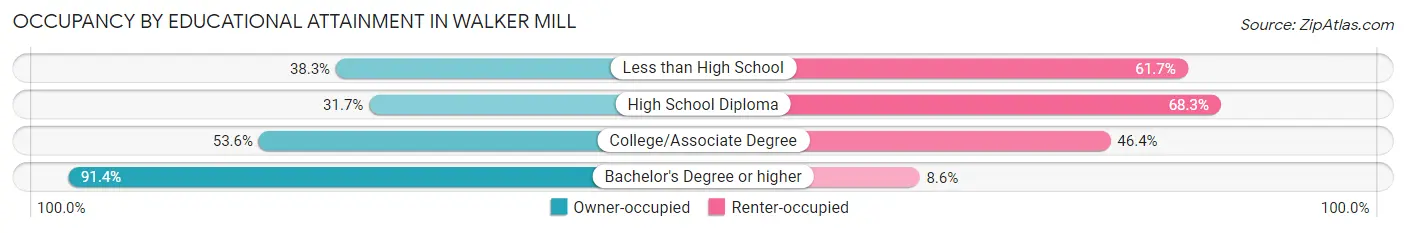
| Household Size | Owner-occupied | Renter-occupied |
| Less than High School | 124 (38.3%) | 200 (61.7%) |
| High School Diploma | 476 (31.7%) | 1,026 (68.3%) |
| College/Associate Degree | 699 (53.6%) | 606 (46.4%) |
| Bachelor's Degree or higher | 1,054 (91.4%) | 99 (8.6%) |
Occupancy by Age of Householder in Walker Mill
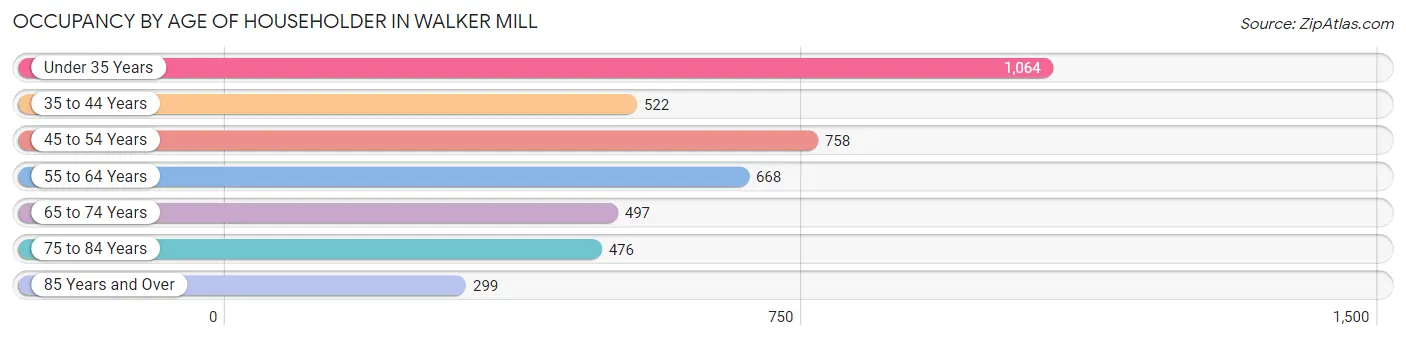
| Age Bracket | # Households | % Households |
| Under 35 Years | 1,064 | 24.8% |
| 35 to 44 Years | 522 | 12.2% |
| 45 to 54 Years | 758 | 17.7% |
| 55 to 64 Years | 668 | 15.6% |
| 65 to 74 Years | 497 | 11.6% |
| 75 to 84 Years | 476 | 11.1% |
| 85 Years and Over | 299 | 7.0% |
| Total | 4,284 | 100.0% |
Housing Finances in Walker Mill
Median Income by Occupancy in Walker Mill
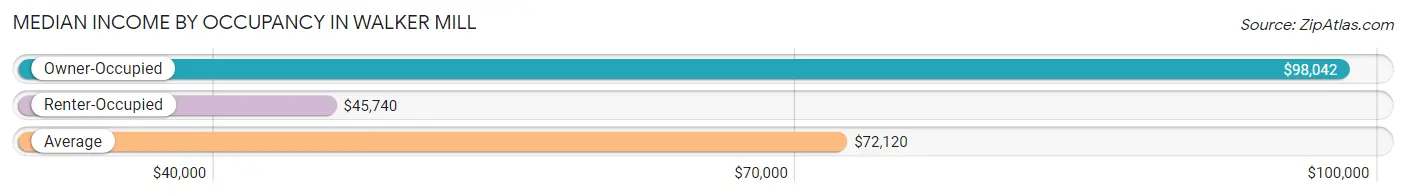
| Occupancy Type | # Households | Median Income |
| Owner-Occupied | 2,353 (54.9%) | $98,042 |
| Renter-Occupied | 1,931 (45.1%) | $45,740 |
| Average | 4,284 (100.0%) | $72,120 |
Occupancy by Householder Income Bracket in Walker Mill
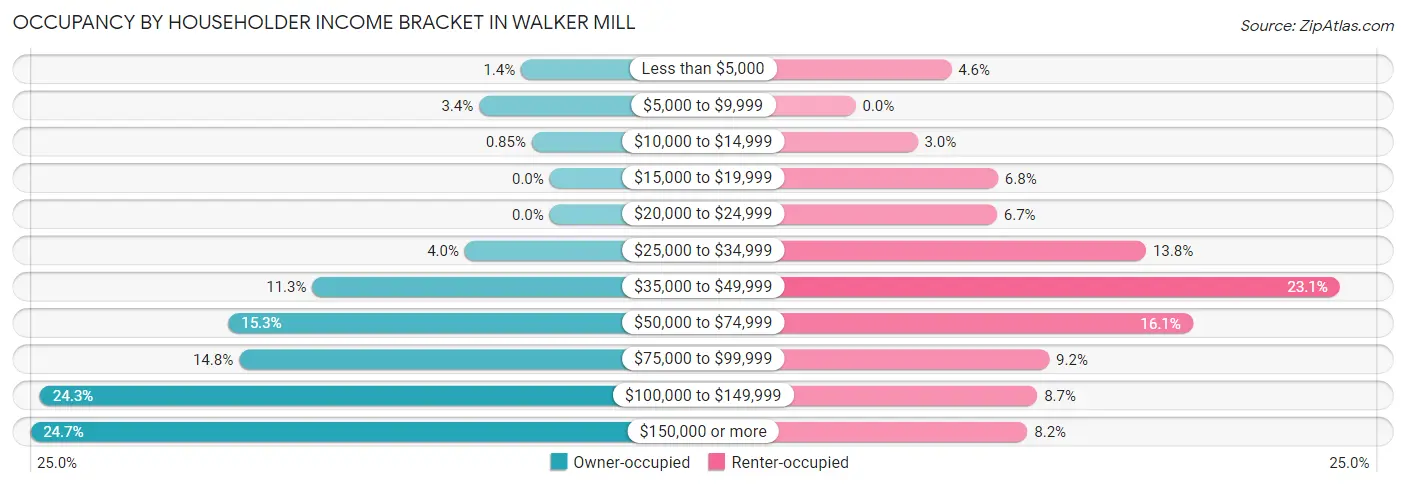
| Income Bracket | Owner-occupied | Renter-occupied |
| Less than $5,000 | 32 (1.4%) | 88 (4.6%) |
| $5,000 to $9,999 | 79 (3.4%) | 0 (0.0%) |
| $10,000 to $14,999 | 20 (0.9%) | 57 (2.9%) |
| $15,000 to $19,999 | 0 (0.0%) | 131 (6.8%) |
| $20,000 to $24,999 | 0 (0.0%) | 130 (6.7%) |
| $25,000 to $34,999 | 95 (4.0%) | 267 (13.8%) |
| $35,000 to $49,999 | 266 (11.3%) | 445 (23.1%) |
| $50,000 to $74,999 | 360 (15.3%) | 310 (16.1%) |
| $75,000 to $99,999 | 348 (14.8%) | 178 (9.2%) |
| $100,000 to $149,999 | 571 (24.3%) | 167 (8.6%) |
| $150,000 or more | 582 (24.7%) | 158 (8.2%) |
| Total | 2,353 (100.0%) | 1,931 (100.0%) |
Monthly Housing Cost Tiers in Walker Mill
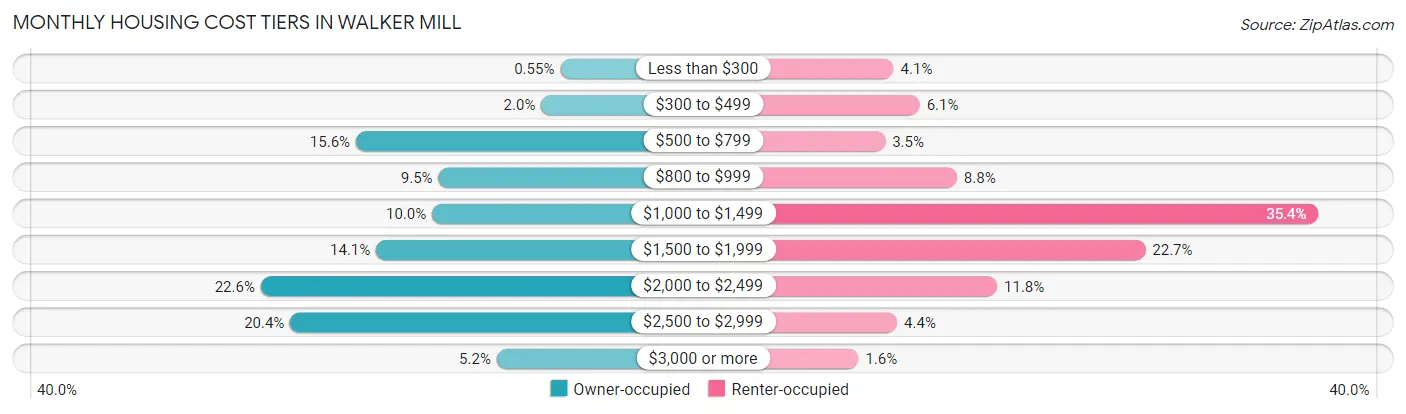
| Monthly Cost | Owner-occupied | Renter-occupied |
| Less than $300 | 13 (0.5%) | 80 (4.1%) |
| $300 to $499 | 46 (1.9%) | 117 (6.1%) |
| $500 to $799 | 367 (15.6%) | 68 (3.5%) |
| $800 to $999 | 224 (9.5%) | 170 (8.8%) |
| $1,000 to $1,499 | 235 (10.0%) | 684 (35.4%) |
| $1,500 to $1,999 | 332 (14.1%) | 438 (22.7%) |
| $2,000 to $2,499 | 532 (22.6%) | 227 (11.8%) |
| $2,500 to $2,999 | 481 (20.4%) | 85 (4.4%) |
| $3,000 or more | 123 (5.2%) | 30 (1.5%) |
| Total | 2,353 (100.0%) | 1,931 (100.0%) |
Physical Housing Characteristics in Walker Mill
Housing Structures in Walker Mill
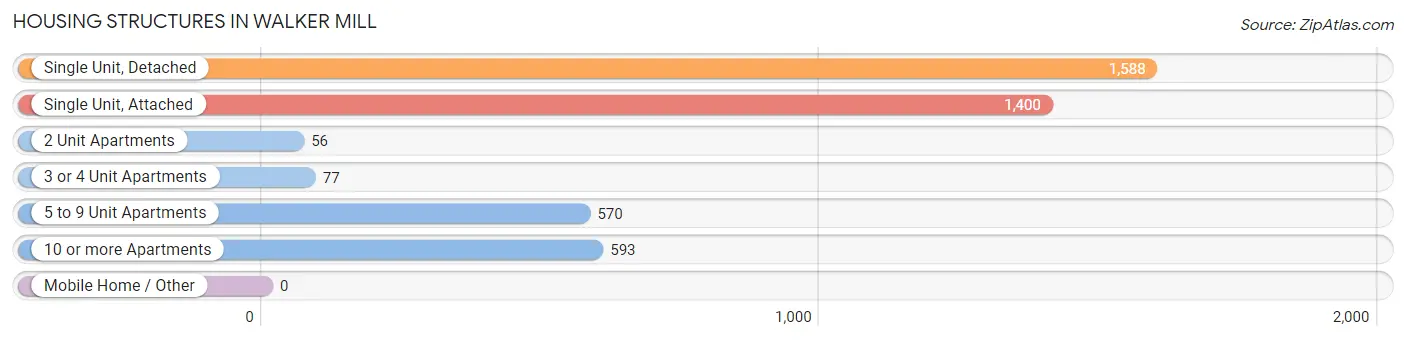
| Structure Type | # Housing Units | % Housing Units |
| Single Unit, Detached | 1,588 | 37.1% |
| Single Unit, Attached | 1,400 | 32.7% |
| 2 Unit Apartments | 56 | 1.3% |
| 3 or 4 Unit Apartments | 77 | 1.8% |
| 5 to 9 Unit Apartments | 570 | 13.3% |
| 10 or more Apartments | 593 | 13.8% |
| Mobile Home / Other | 0 | 0.0% |
| Total | 4,284 | 100.0% |
Housing Structures by Occupancy in Walker Mill
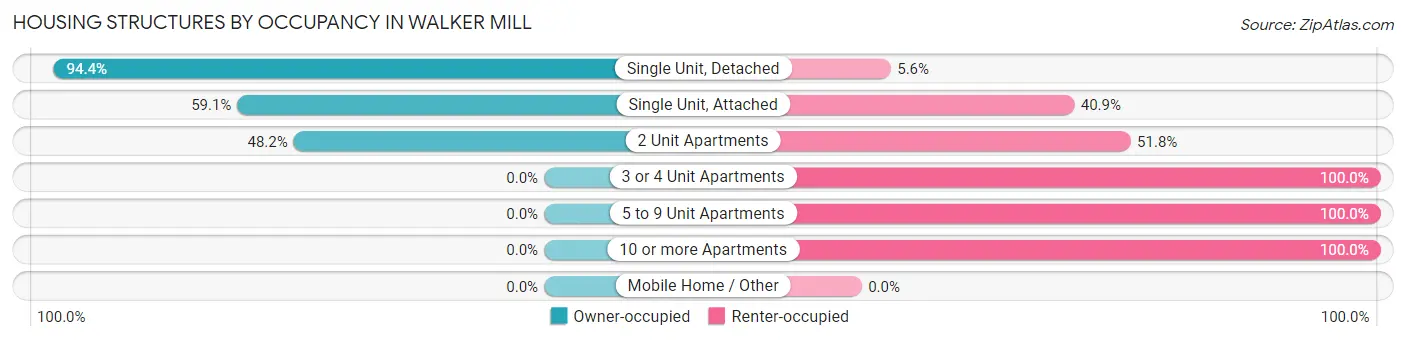
| Structure Type | Owner-occupied | Renter-occupied |
| Single Unit, Detached | 1,499 (94.4%) | 89 (5.6%) |
| Single Unit, Attached | 827 (59.1%) | 573 (40.9%) |
| 2 Unit Apartments | 27 (48.2%) | 29 (51.8%) |
| 3 or 4 Unit Apartments | 0 (0.0%) | 77 (100.0%) |
| 5 to 9 Unit Apartments | 0 (0.0%) | 570 (100.0%) |
| 10 or more Apartments | 0 (0.0%) | 593 (100.0%) |
| Mobile Home / Other | 0 (0.0%) | 0 (0.0%) |
| Total | 2,353 (54.9%) | 1,931 (45.1%) |
Housing Structures by Number of Rooms in Walker Mill
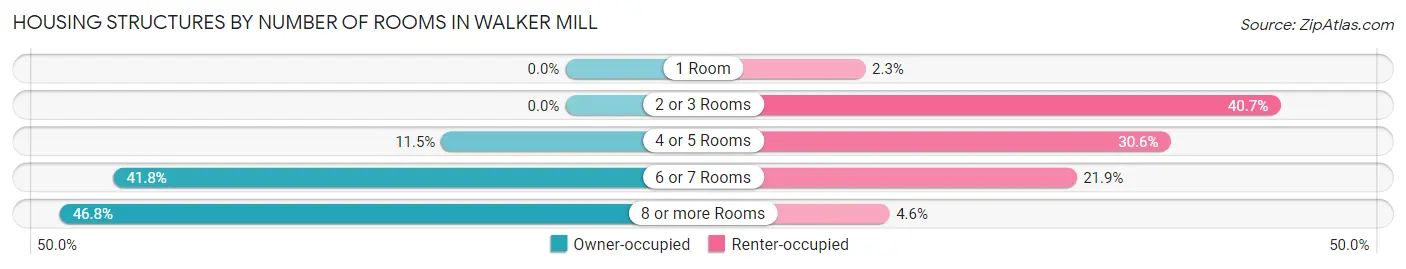
| Number of Rooms | Owner-occupied | Renter-occupied |
| 1 Room | 0 (0.0%) | 45 (2.3%) |
| 2 or 3 Rooms | 0 (0.0%) | 786 (40.7%) |
| 4 or 5 Rooms | 270 (11.5%) | 590 (30.5%) |
| 6 or 7 Rooms | 983 (41.8%) | 422 (21.8%) |
| 8 or more Rooms | 1,100 (46.8%) | 88 (4.6%) |
| Total | 2,353 (100.0%) | 1,931 (100.0%) |
Housing Structure by Heating Type in Walker Mill
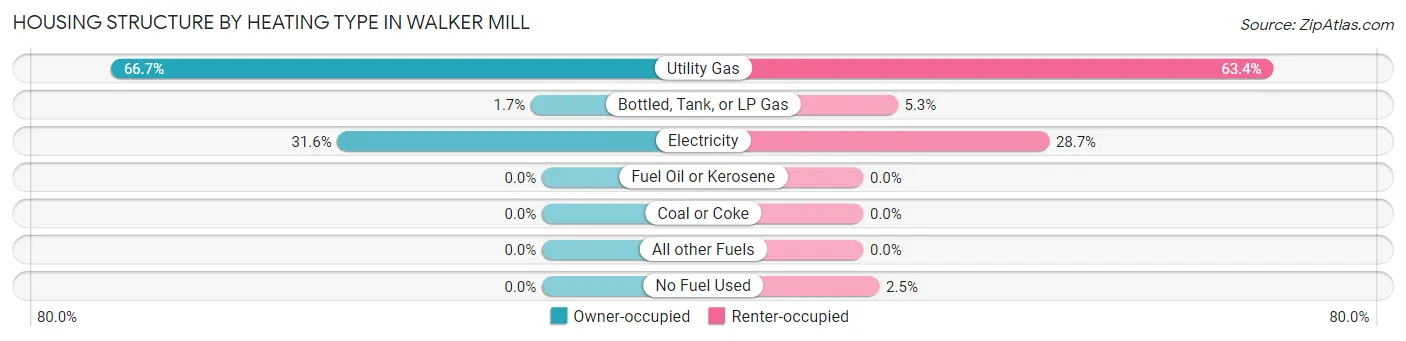
| Heating Type | Owner-occupied | Renter-occupied |
| Utility Gas | 1,569 (66.7%) | 1,225 (63.4%) |
| Bottled, Tank, or LP Gas | 40 (1.7%) | 103 (5.3%) |
| Electricity | 744 (31.6%) | 555 (28.7%) |
| Fuel Oil or Kerosene | 0 (0.0%) | 0 (0.0%) |
| Coal or Coke | 0 (0.0%) | 0 (0.0%) |
| All other Fuels | 0 (0.0%) | 0 (0.0%) |
| No Fuel Used | 0 (0.0%) | 48 (2.5%) |
| Total | 2,353 (100.0%) | 1,931 (100.0%) |
Household Vehicle Usage in Walker Mill
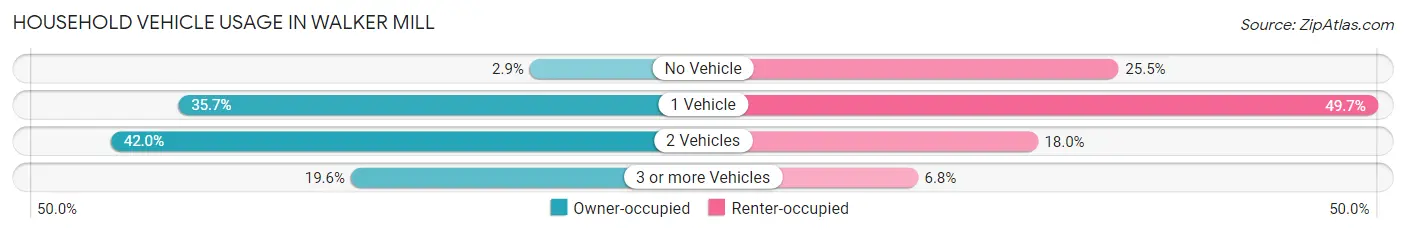
| Vehicles per Household | Owner-occupied | Renter-occupied |
| No Vehicle | 67 (2.9%) | 493 (25.5%) |
| 1 Vehicle | 839 (35.7%) | 960 (49.7%) |
| 2 Vehicles | 987 (41.9%) | 347 (18.0%) |
| 3 or more Vehicles | 460 (19.6%) | 131 (6.8%) |
| Total | 2,353 (100.0%) | 1,931 (100.0%) |
Real Estate & Mortgages in Walker Mill
Real Estate and Mortgage Overview in Walker Mill
| Characteristic | Without Mortgage | With Mortgage |
| Housing Units | 705 | 1,648 |
| Median Property Value | $334,900 | $342,200 |
| Median Household Income | $68,750 | $558 |
| Monthly Housing Costs | $733 | $123 |
| Real Estate Taxes | $3,596 | $0 |
Property Value by Mortgage Status in Walker Mill
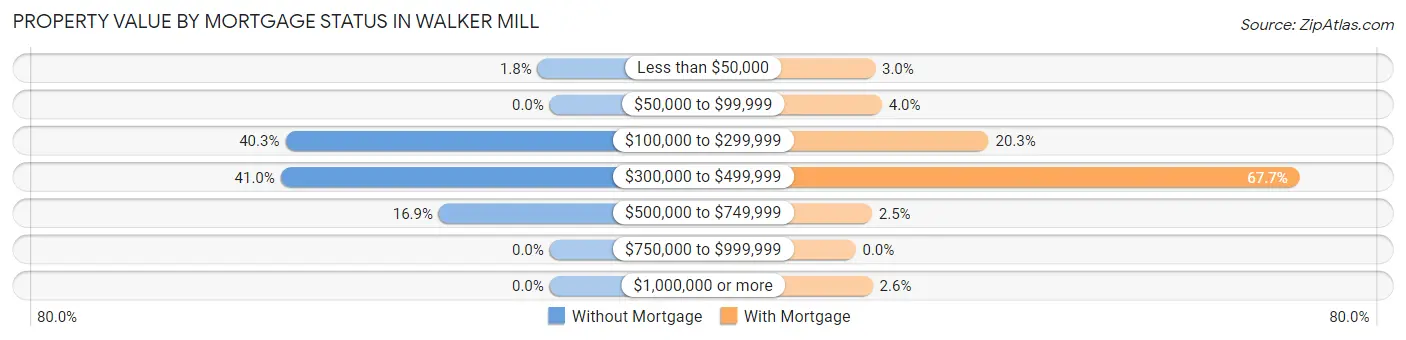
| Property Value | Without Mortgage | With Mortgage |
| Less than $50,000 | 13 (1.8%) | 49 (3.0%) |
| $50,000 to $99,999 | 0 (0.0%) | 66 (4.0%) |
| $100,000 to $299,999 | 284 (40.3%) | 334 (20.3%) |
| $300,000 to $499,999 | 289 (41.0%) | 1,115 (67.7%) |
| $500,000 to $749,999 | 119 (16.9%) | 41 (2.5%) |
| $750,000 to $999,999 | 0 (0.0%) | 0 (0.0%) |
| $1,000,000 or more | 0 (0.0%) | 43 (2.6%) |
| Total | 705 (100.0%) | 1,648 (100.0%) |
Household Income by Mortgage Status in Walker Mill
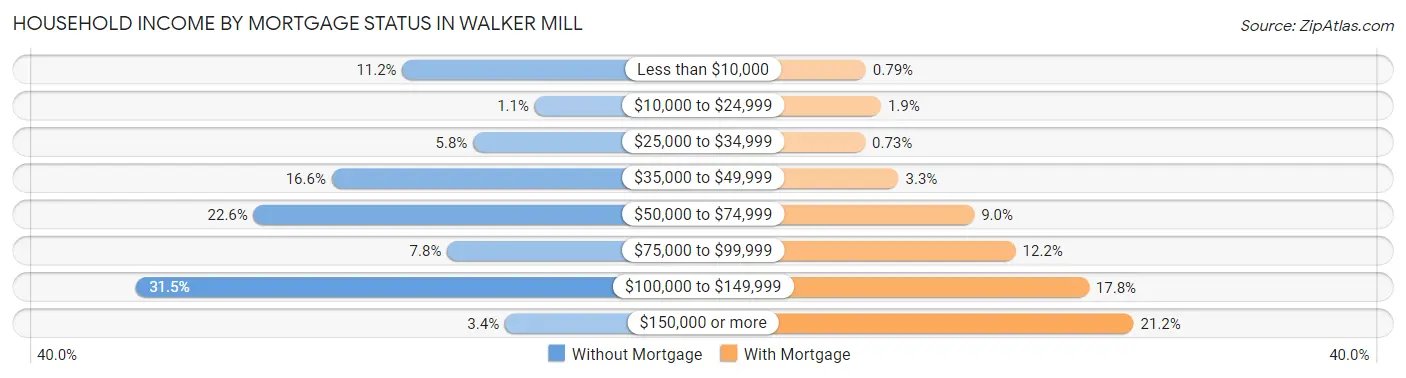
| Household Income | Without Mortgage | With Mortgage |
| Less than $10,000 | 79 (11.2%) | 13 (0.8%) |
| $10,000 to $24,999 | 8 (1.1%) | 32 (1.9%) |
| $25,000 to $34,999 | 41 (5.8%) | 12 (0.7%) |
| $35,000 to $49,999 | 117 (16.6%) | 54 (3.3%) |
| $50,000 to $74,999 | 159 (22.6%) | 149 (9.0%) |
| $75,000 to $99,999 | 55 (7.8%) | 201 (12.2%) |
| $100,000 to $149,999 | 222 (31.5%) | 293 (17.8%) |
| $150,000 or more | 24 (3.4%) | 349 (21.2%) |
| Total | 705 (100.0%) | 1,648 (100.0%) |
Property Value to Household Income Ratio in Walker Mill
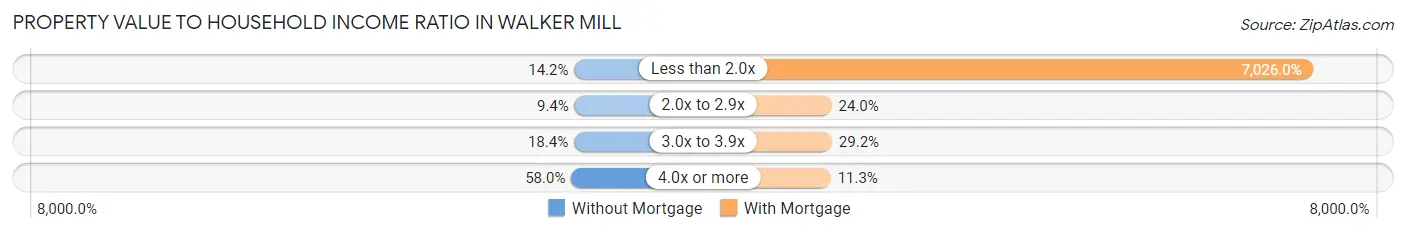
| Value-to-Income Ratio | Without Mortgage | With Mortgage |
| Less than 2.0x | 100 (14.2%) | 115,789 (7,026.0%) |
| 2.0x to 2.9x | 66 (9.4%) | 396 (24.0%) |
| 3.0x to 3.9x | 130 (18.4%) | 481 (29.2%) |
| 4.0x or more | 409 (58.0%) | 186 (11.3%) |
| Total | 705 (100.0%) | 1,648 (100.0%) |
Real Estate Taxes by Mortgage Status in Walker Mill
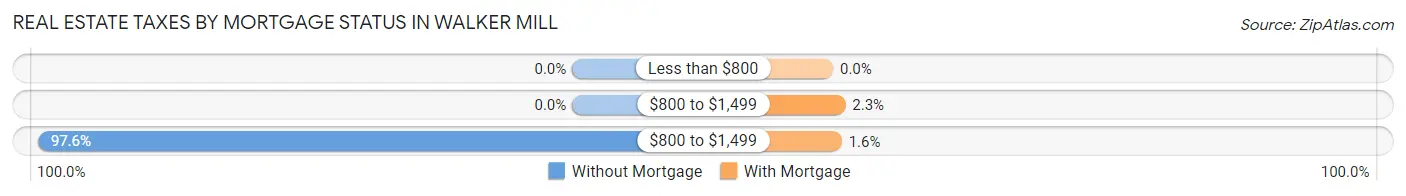
| Property Taxes | Without Mortgage | With Mortgage |
| Less than $800 | 0 (0.0%) | 0 (0.0%) |
| $800 to $1,499 | 0 (0.0%) | 37 (2.2%) |
| $800 to $1,499 | 688 (97.6%) | 26 (1.6%) |
| Total | 705 (100.0%) | 1,648 (100.0%) |
Health & Disability in Walker Mill
Health Insurance Coverage by Age in Walker Mill
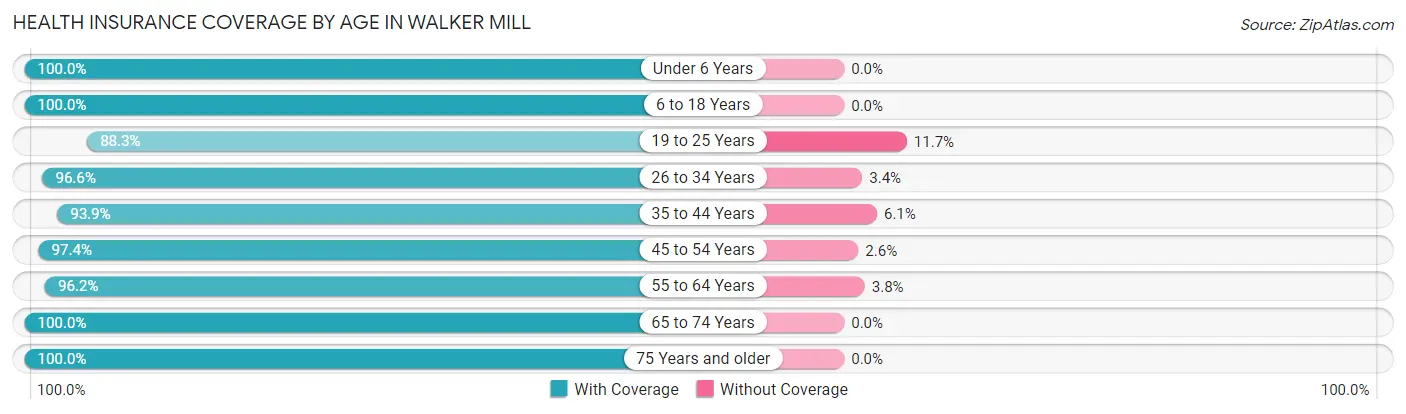
| Age Bracket | With Coverage | Without Coverage |
| Under 6 Years | 568 (100.0%) | 0 (0.0%) |
| 6 to 18 Years | 1,782 (100.0%) | 0 (0.0%) |
| 19 to 25 Years | 605 (88.3%) | 80 (11.7%) |
| 26 to 34 Years | 1,353 (96.6%) | 47 (3.4%) |
| 35 to 44 Years | 937 (93.9%) | 61 (6.1%) |
| 45 to 54 Years | 1,110 (97.4%) | 30 (2.6%) |
| 55 to 64 Years | 1,433 (96.2%) | 57 (3.8%) |
| 65 to 74 Years | 848 (100.0%) | 0 (0.0%) |
| 75 Years and older | 1,061 (100.0%) | 0 (0.0%) |
| Total | 9,697 (97.2%) | 275 (2.8%) |
Health Insurance Coverage by Citizenship Status in Walker Mill
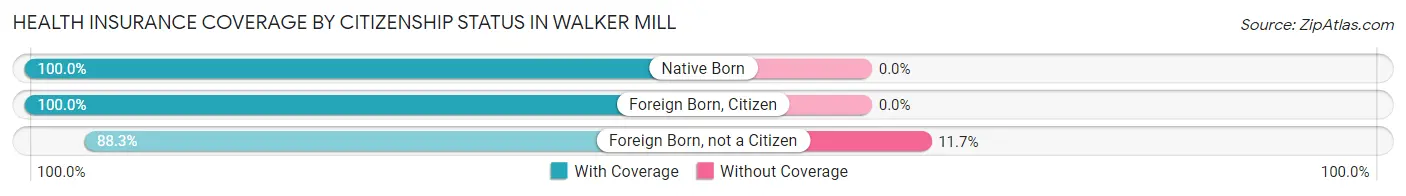
| Citizenship Status | With Coverage | Without Coverage |
| Native Born | 568 (100.0%) | 0 (0.0%) |
| Foreign Born, Citizen | 1,782 (100.0%) | 0 (0.0%) |
| Foreign Born, not a Citizen | 605 (88.3%) | 80 (11.7%) |
Health Insurance Coverage by Household Income in Walker Mill
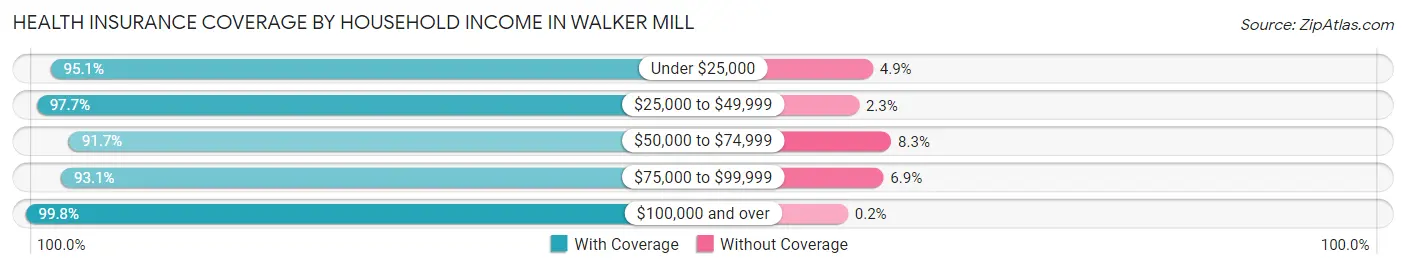
| Household Income | With Coverage | Without Coverage |
| Under $25,000 | 761 (95.1%) | 39 (4.9%) |
| $25,000 to $49,999 | 2,445 (97.7%) | 57 (2.3%) |
| $50,000 to $74,999 | 1,026 (91.7%) | 93 (8.3%) |
| $75,000 to $99,999 | 1,046 (93.1%) | 77 (6.9%) |
| $100,000 and over | 4,392 (99.8%) | 9 (0.2%) |
Public vs Private Health Insurance Coverage by Age in Walker Mill
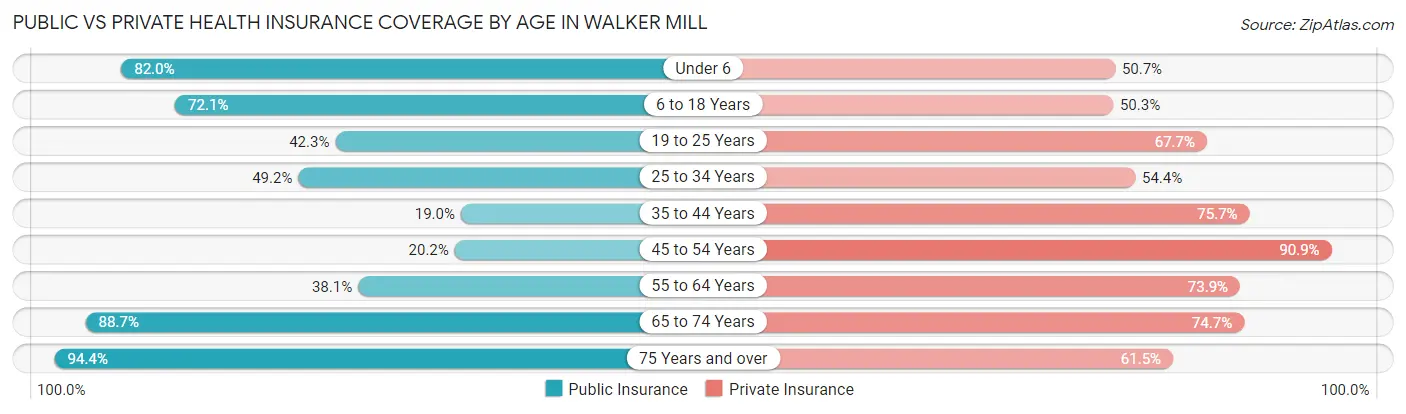
| Age Bracket | Public Insurance | Private Insurance |
| Under 6 | 466 (82.0%) | 288 (50.7%) |
| 6 to 18 Years | 1,284 (72.1%) | 897 (50.3%) |
| 19 to 25 Years | 290 (42.3%) | 464 (67.7%) |
| 25 to 34 Years | 689 (49.2%) | 762 (54.4%) |
| 35 to 44 Years | 190 (19.0%) | 755 (75.6%) |
| 45 to 54 Years | 230 (20.2%) | 1,036 (90.9%) |
| 55 to 64 Years | 568 (38.1%) | 1,101 (73.9%) |
| 65 to 74 Years | 752 (88.7%) | 633 (74.7%) |
| 75 Years and over | 1,002 (94.4%) | 652 (61.5%) |
| Total | 5,471 (54.9%) | 6,588 (66.1%) |
Disability Status by Sex by Age in Walker Mill
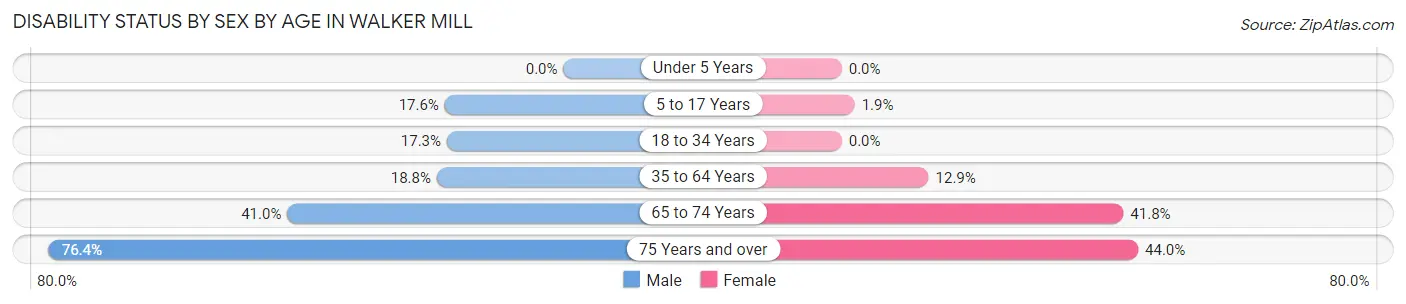
| Age Bracket | Male | Female |
| Under 5 Years | 0 (0.0%) | 0 (0.0%) |
| 5 to 17 Years | 132 (17.6%) | 20 (1.9%) |
| 18 to 34 Years | 173 (17.3%) | 0 (0.0%) |
| 35 to 64 Years | 304 (18.8%) | 259 (12.9%) |
| 65 to 74 Years | 82 (41.0%) | 271 (41.8%) |
| 75 Years and over | 314 (76.4%) | 286 (44.0%) |
Disability Class by Sex by Age in Walker Mill
Disability Class: Hearing Difficulty
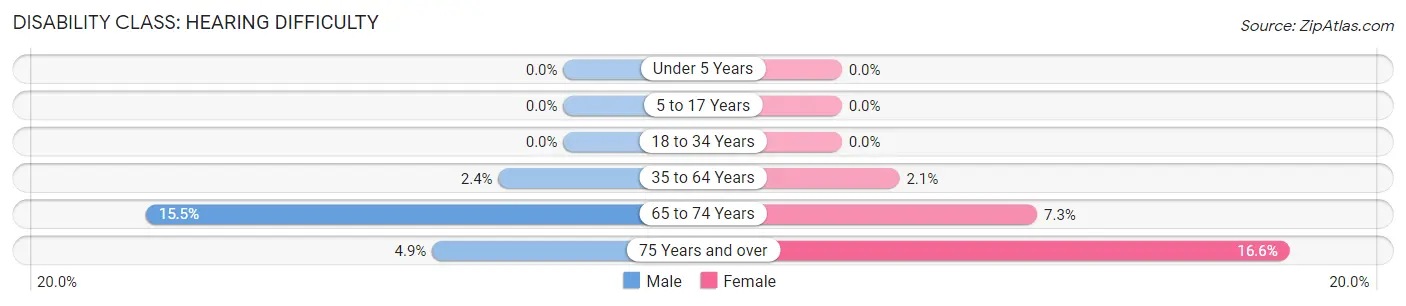
| Age Bracket | Male | Female |
| Under 5 Years | 0 (0.0%) | 0 (0.0%) |
| 5 to 17 Years | 0 (0.0%) | 0 (0.0%) |
| 18 to 34 Years | 0 (0.0%) | 0 (0.0%) |
| 35 to 64 Years | 39 (2.4%) | 43 (2.1%) |
| 65 to 74 Years | 31 (15.5%) | 47 (7.2%) |
| 75 Years and over | 20 (4.9%) | 108 (16.6%) |
Disability Class: Vision Difficulty
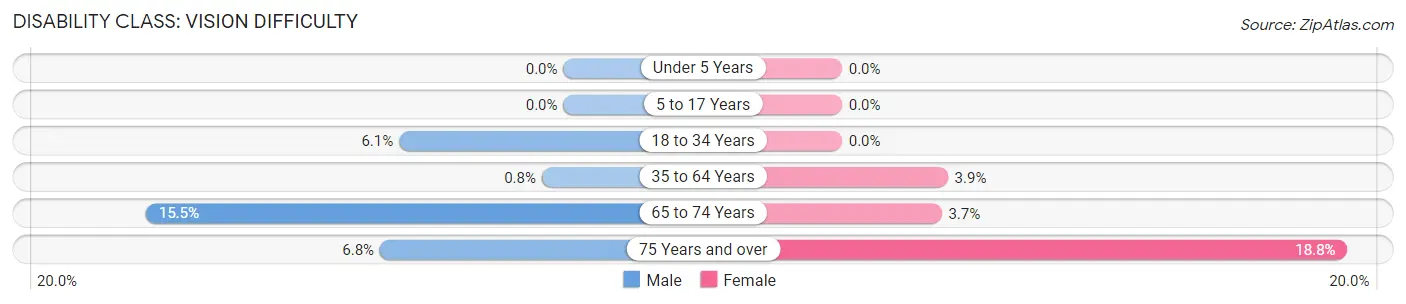
| Age Bracket | Male | Female |
| Under 5 Years | 0 (0.0%) | 0 (0.0%) |
| 5 to 17 Years | 0 (0.0%) | 0 (0.0%) |
| 18 to 34 Years | 61 (6.1%) | 0 (0.0%) |
| 35 to 64 Years | 13 (0.8%) | 79 (3.9%) |
| 65 to 74 Years | 31 (15.5%) | 24 (3.7%) |
| 75 Years and over | 28 (6.8%) | 122 (18.8%) |
Disability Class: Cognitive Difficulty
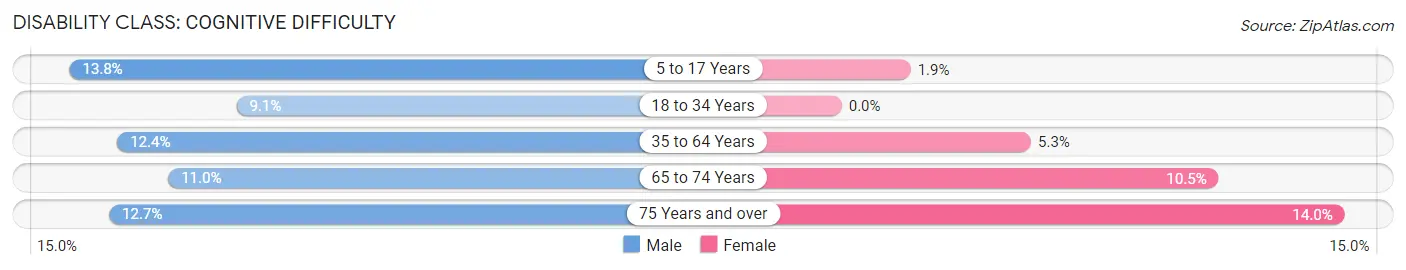
| Age Bracket | Male | Female |
| 5 to 17 Years | 103 (13.8%) | 20 (1.9%) |
| 18 to 34 Years | 91 (9.1%) | 0 (0.0%) |
| 35 to 64 Years | 201 (12.4%) | 106 (5.3%) |
| 65 to 74 Years | 22 (11.0%) | 68 (10.5%) |
| 75 Years and over | 52 (12.7%) | 91 (14.0%) |
Disability Class: Ambulatory Difficulty
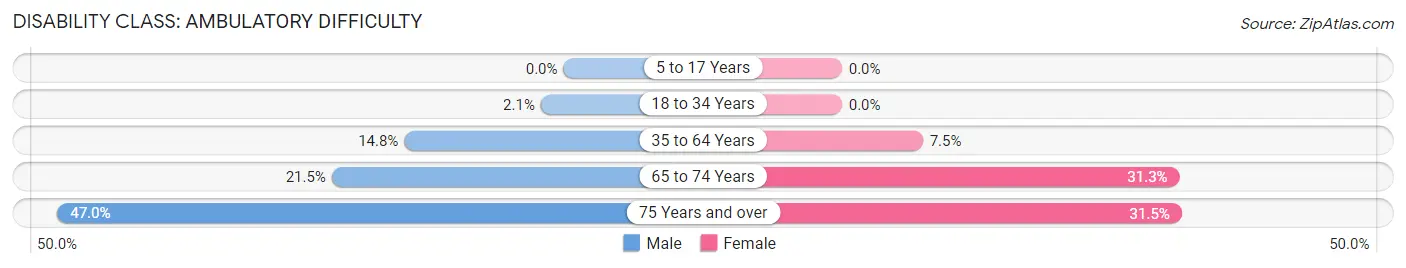
| Age Bracket | Male | Female |
| 5 to 17 Years | 0 (0.0%) | 0 (0.0%) |
| 18 to 34 Years | 21 (2.1%) | 0 (0.0%) |
| 35 to 64 Years | 239 (14.8%) | 151 (7.5%) |
| 65 to 74 Years | 43 (21.5%) | 203 (31.3%) |
| 75 Years and over | 193 (47.0%) | 205 (31.5%) |
Disability Class: Self-Care Difficulty
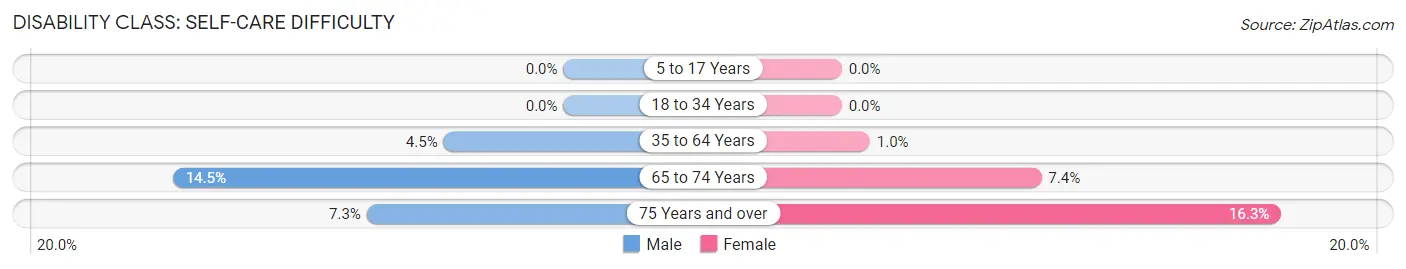
| Age Bracket | Male | Female |
| 5 to 17 Years | 0 (0.0%) | 0 (0.0%) |
| 18 to 34 Years | 0 (0.0%) | 0 (0.0%) |
| 35 to 64 Years | 72 (4.4%) | 21 (1.0%) |
| 65 to 74 Years | 29 (14.5%) | 48 (7.4%) |
| 75 Years and over | 30 (7.3%) | 106 (16.3%) |
Technology Access in Walker Mill
Computing Device Access in Walker Mill
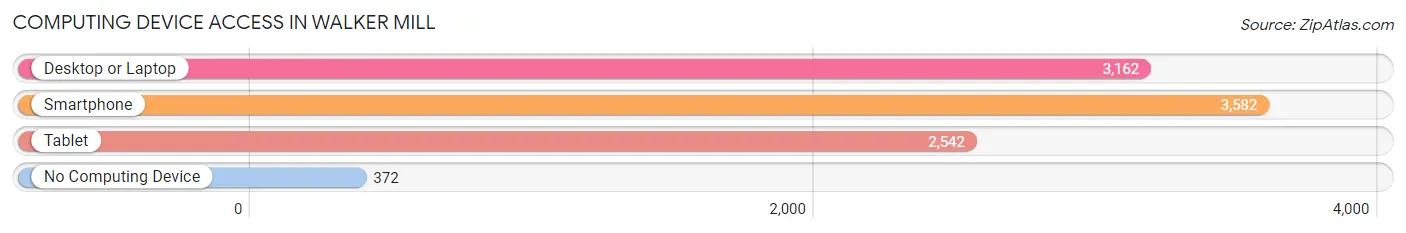
| Device Type | # Households | % Households |
| Desktop or Laptop | 3,162 | 73.8% |
| Smartphone | 3,582 | 83.6% |
| Tablet | 2,542 | 59.3% |
| No Computing Device | 372 | 8.7% |
| Total | 4,284 | 100.0% |
Internet Access in Walker Mill
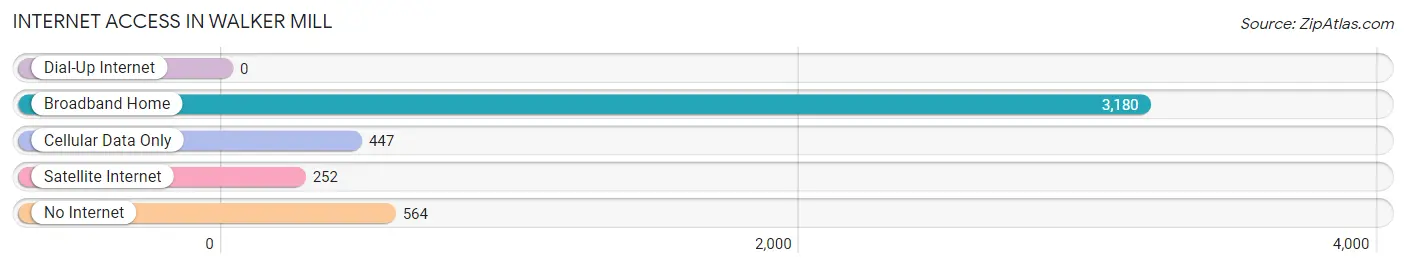
| Internet Type | # Households | % Households |
| Dial-Up Internet | 0 | 0.0% |
| Broadband Home | 3,180 | 74.2% |
| Cellular Data Only | 447 | 10.4% |
| Satellite Internet | 252 | 5.9% |
| No Internet | 564 | 13.2% |
| Total | 4,284 | 100.0% |
Walker Mill Summary
Mill History
Walker Mill is a census-designated place located in Prince George’s County, Maryland. It is located in the southeastern part of the county, just north of the Washington, D.C. border. The area was first settled in the late 1700s by the Walker family, who established a mill on the banks of the Patuxent River. The mill was used to grind grain and other products, and was a major source of income for the family. The mill was in operation until the early 1900s, when it was destroyed by a flood.
The area remained largely rural until the 1950s, when the population began to grow rapidly. The area was annexed by the City of Bowie in the 1960s, and the population continued to grow. In the 1970s, the area was rezoned for residential development, and the population continued to grow. Today, Walker Mill is a thriving community with a population of over 10,000 people.
Geography
Walker Mill is located in Prince George’s County, Maryland. It is situated in the southeastern part of the county, just north of the Washington, D.C. border. The area is bordered by the Patuxent River to the east, and is located approximately 20 miles from downtown Washington, D.C. The area is mostly flat, with some rolling hills in the northern part of the community. The climate is temperate, with hot summers and mild winters.
Economy
Walker Mill is a primarily residential community, with a few small businesses located in the area. The largest employer in the area is the Prince George’s County Public Schools, which employs over 1,000 people. Other major employers include the University of Maryland Medical Center, the National Institutes of Health, and the U.S. Department of Agriculture.
Demographics
As of the 2010 census, the population of Walker Mill was 10,845. The population is primarily African American, with a small percentage of White, Hispanic, and Asian residents. The median household income is $68,000, and the median home value is $250,000. The area is served by the Prince George’s County Public Schools, and is home to several parks and recreational facilities.
Common Questions
What is Per Capita Income in Walker Mill?
Per Capita income in Walker Mill is $40,540.
What is the Median Family Income in Walker Mill?
Median Family Income in Walker Mill is $89,813.
What is the Median Household income in Walker Mill?
Median Household Income in Walker Mill is $72,120.
What is Income or Wage Gap in Walker Mill?
Income or Wage Gap in Walker Mill is 10.6%.
Women in Walker Mill earn 89.4 cents for every dollar earned by a man.
What is Family Income Deficit in Walker Mill?
Family Income Deficit in Walker Mill is $5,952.
Families that are below poverty line in Walker Mill earn $5,952 less on average than the poverty threshold level.
What is Inequality or Gini Index in Walker Mill?
Inequality or Gini Index in Walker Mill is 0.41.
What is the Total Population of Walker Mill?
Total Population of Walker Mill is 9,973.
What is the Total Male Population of Walker Mill?
Total Male Population of Walker Mill is 4,206.
What is the Total Female Population of Walker Mill?
Total Female Population of Walker Mill is 5,767.
What is the Ratio of Males per 100 Females in Walker Mill?
There are 72.93 Males per 100 Females in Walker Mill.
What is the Ratio of Females per 100 Males in Walker Mill?
There are 137.11 Females per 100 Males in Walker Mill.
What is the Median Population Age in Walker Mill?
Median Population Age in Walker Mill is 40.8 Years.
What is the Average Family Size in Walker Mill
Average Family Size in Walker Mill is 3.0 People.
What is the Average Household Size in Walker Mill
Average Household Size in Walker Mill is 2.3 People.
How Large is the Labor Force in Walker Mill?
There are 5,155 People in the Labor Forcein in Walker Mill.
What is the Percentage of People in the Labor Force in Walker Mill?
65.5% of People are in the Labor Force in Walker Mill.
What is the Unemployment Rate in Walker Mill?
Unemployment Rate in Walker Mill is 6.0%.