Parsonsburg, MD Map & Demographics
Parsonsburg Map
Parsonsburg Overview
$32,093
PER CAPITA INCOME
0.41
INEQUALITY / GINI INDEX
200
TOTAL POPULATION
134
MALE POPULATION
66
FEMALE POPULATION
203.03
MALES / 100 FEMALES
49.25
FEMALES / 100 MALES
12.4
MEDIAN AGE
5.1
AVG FAMILY SIZE
5.1
AVG HOUSEHOLD SIZE
91
LABOR FORCE [ PEOPLE ]
100.0%
PERCENT IN LABOR FORCE
Parsonsburg Zip Codes
Parsonsburg Area Codes
Income in Parsonsburg
Income Overview in Parsonsburg
| Characteristic | Number | Measure |
| Per Capita Income | 200 | $32,093 |
| Median Family Income | 39 | $0 |
| Mean Family Income | 39 | $0 |
| Median Household Income | 39 | $0 |
| Mean Household Income | 39 | $0 |
| Income Deficit | 39 | $0 |
| Wage / Income Gap (%) | 200 | 0.00% |
| Wage / Income Gap ($) | 200 | 100.00¢ per $1 |
| Gini / Inequality Index | 200 | 0.41 |
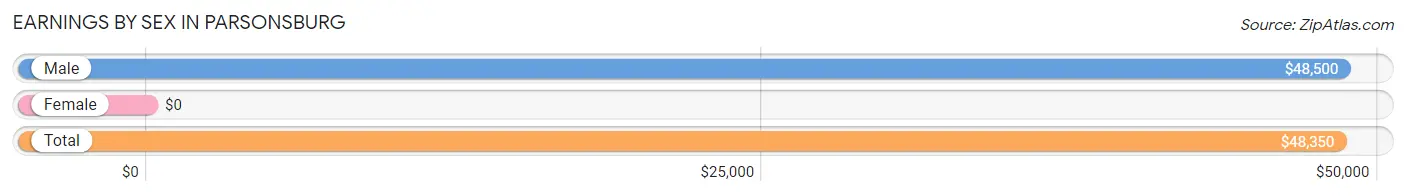
Earnings by Sex in Parsonsburg
| Sex | Number | Average Earnings |
| Male | 58 (63.7%) | $48,500 |
| Female | 33 (36.3%) | $0 |
| Total | 91 (100.0%) | $48,350 |
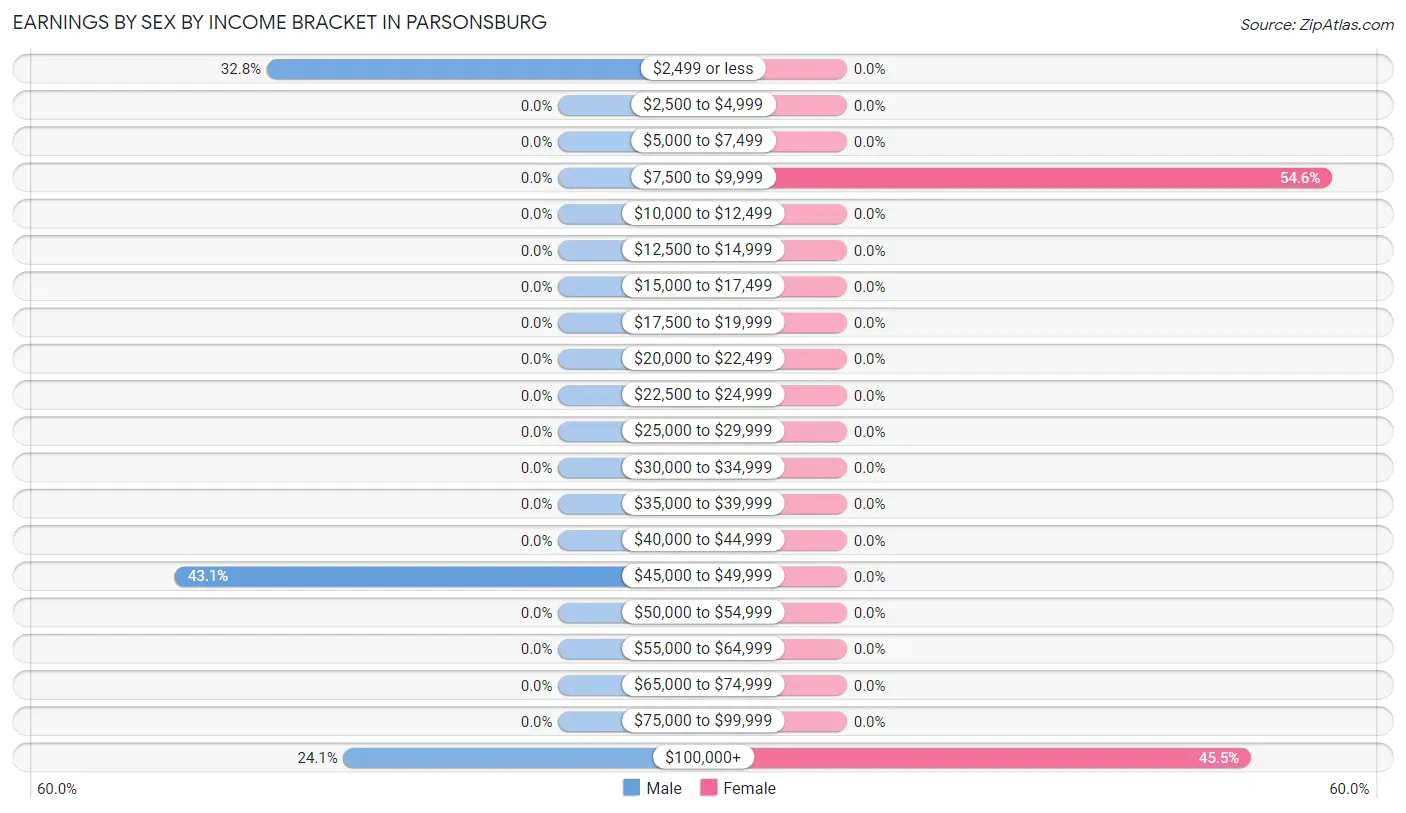
Earnings by Sex by Income Bracket in Parsonsburg
The most common earnings brackets in Parsonsburg are $45,000 to $49,999 for men (25 | 43.1%) and $7,500 to $9,999 for women (18 | 54.5%).
| Income | Male | Female |
| $2,499 or less | 19 (32.8%) | 0 (0.0%) |
| $2,500 to $4,999 | 0 (0.0%) | 0 (0.0%) |
| $5,000 to $7,499 | 0 (0.0%) | 0 (0.0%) |
| $7,500 to $9,999 | 0 (0.0%) | 18 (54.5%) |
| $10,000 to $12,499 | 0 (0.0%) | 0 (0.0%) |
| $12,500 to $14,999 | 0 (0.0%) | 0 (0.0%) |
| $15,000 to $17,499 | 0 (0.0%) | 0 (0.0%) |
| $17,500 to $19,999 | 0 (0.0%) | 0 (0.0%) |
| $20,000 to $22,499 | 0 (0.0%) | 0 (0.0%) |
| $22,500 to $24,999 | 0 (0.0%) | 0 (0.0%) |
| $25,000 to $29,999 | 0 (0.0%) | 0 (0.0%) |
| $30,000 to $34,999 | 0 (0.0%) | 0 (0.0%) |
| $35,000 to $39,999 | 0 (0.0%) | 0 (0.0%) |
| $40,000 to $44,999 | 0 (0.0%) | 0 (0.0%) |
| $45,000 to $49,999 | 25 (43.1%) | 0 (0.0%) |
| $50,000 to $54,999 | 0 (0.0%) | 0 (0.0%) |
| $55,000 to $64,999 | 0 (0.0%) | 0 (0.0%) |
| $65,000 to $74,999 | 0 (0.0%) | 0 (0.0%) |
| $75,000 to $99,999 | 0 (0.0%) | 0 (0.0%) |
| $100,000+ | 14 (24.1%) | 15 (45.5%) |
| Total | 58 (100.0%) | 33 (100.0%) |
Earnings by Sex by Educational Attainment in Parsonsburg
| Educational Attainment | Male Income | Female Income |
| Less than High School | - | - |
| High School Diploma | - | - |
| College or Associate's Degree | - | - |
| Bachelor's Degree | - | - |
| Graduate Degree | - | - |
| Total | - | - |
Family Income in Parsonsburg
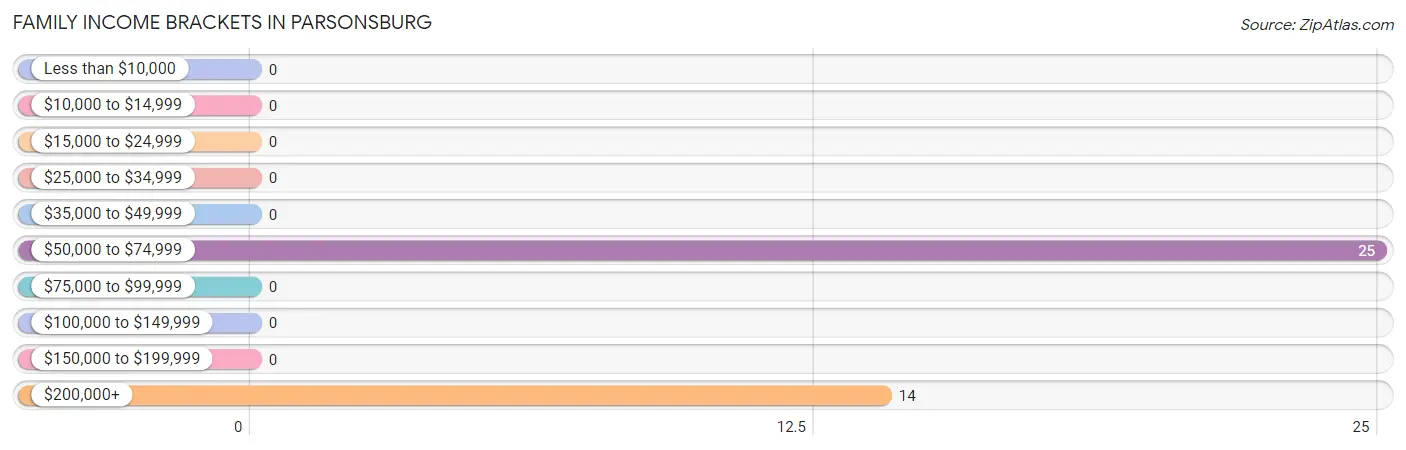
Family Income Brackets in Parsonsburg
According to the Parsonsburg family income data, there are 25 families falling into the $50,000 to $74,999 income range, which is the most common income bracket and makes up 64.1% of all families.
| Income Bracket | # Families | % Families |
| Less than $10,000 | 0 | 0.0% |
| $10,000 to $14,999 | 0 | 0.0% |
| $15,000 to $24,999 | 0 | 0.0% |
| $25,000 to $34,999 | 0 | 0.0% |
| $35,000 to $49,999 | 0 | 0.0% |
| $50,000 to $74,999 | 25 | 64.1% |
| $75,000 to $99,999 | 0 | 0.0% |
| $100,000 to $149,999 | 0 | 0.0% |
| $150,000 to $199,999 | 0 | 0.0% |
| $200,000+ | 14 | 35.9% |
Family Income by Famaliy Size in Parsonsburg
| Income Bracket | # Families | Median Income |
| 2-Person Families | 0 (0.0%) | $0 |
| 3-Person Families | 0 (0.0%) | $0 |
| 4-Person Families | 0 (0.0%) | $0 |
| 5-Person Families | 25 (64.1%) | $0 |
| 6-Person Families | 14 (35.9%) | $0 |
| 7+ Person Families | 0 (0.0%) | $0 |
| Total | 39 (100.0%) | $0 |
Family Income by Number of Earners in Parsonsburg
| Number of Earners | # Families | Median Income |
| No Earners | 0 (0.0%) | $0 |
| 1 Earner | 0 (0.0%) | $0 |
| 2 Earners | 25 (64.1%) | $0 |
| 3+ Earners | 14 (35.9%) | $0 |
| Total | 39 (100.0%) | $0 |
Household Income in Parsonsburg
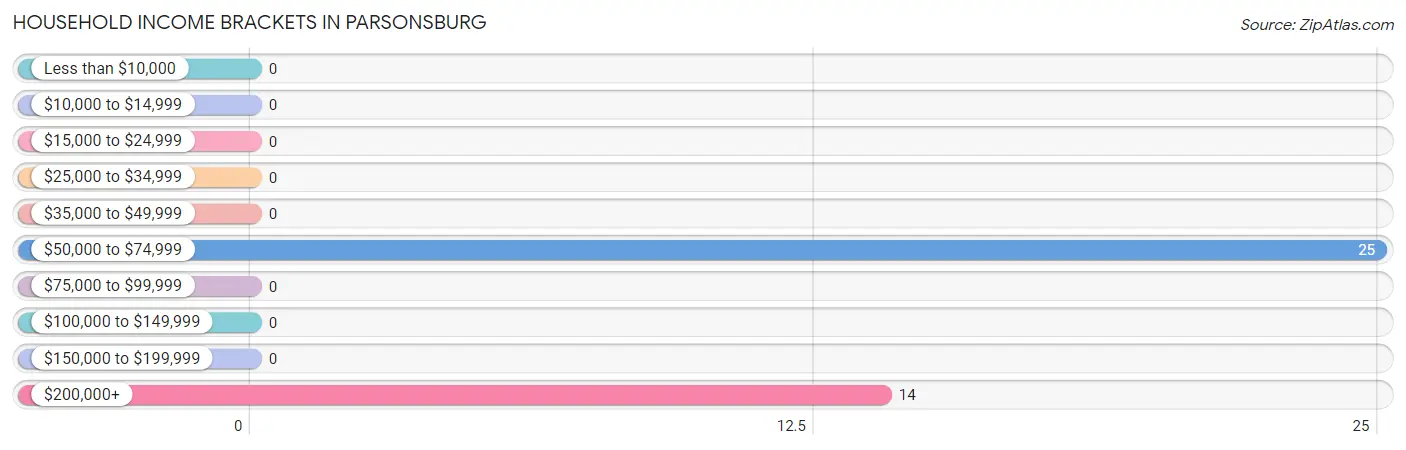
Household Income Brackets in Parsonsburg
With 25 households falling in the category, the $50,000 to $74,999 income range is the most frequent in Parsonsburg, accounting for 64.1% of all households.
| Income Bracket | # Households | % Households |
| Less than $10,000 | 0 | 0.0% |
| $10,000 to $14,999 | 0 | 0.0% |
| $15,000 to $24,999 | 0 | 0.0% |
| $25,000 to $34,999 | 0 | 0.0% |
| $35,000 to $49,999 | 0 | 0.0% |
| $50,000 to $74,999 | 25 | 64.1% |
| $75,000 to $99,999 | 0 | 0.0% |
| $100,000 to $149,999 | 0 | 0.0% |
| $150,000 to $199,999 | 0 | 0.0% |
| $200,000+ | 14 | 35.9% |
Household Income by Householder Age in Parsonsburg
| Income Bracket | # Households | Median Income |
| 15 to 24 Years | 0 (0.0%) | $0 |
| 25 to 44 Years | 39 (100.0%) | $0 |
| 45 to 64 Years | 0 (0.0%) | $0 |
| 65+ Years | 0 (0.0%) | $0 |
| Total | 39 (100.0%) | $0 |
Poverty in Parsonsburg
Income Below Poverty by Sex and Age in Parsonsburg
| Age Bracket | Male | Female |
| Under 5 Years | 0 (0.0%) | 0 (0.0%) |
| 5 Years | 0 (0.0%) | 0 (0.0%) |
| 6 to 11 Years | 0 (0.0%) | 0 (0.0%) |
| 12 to 14 Years | 0 (0.0%) | 0 (0.0%) |
| 15 Years | 0 (0.0%) | 0 (0.0%) |
| 16 and 17 Years | 0 (0.0%) | 0 (0.0%) |
| 18 to 24 Years | 0 (0.0%) | 0 (0.0%) |
| 25 to 34 Years | 0 (0.0%) | 0 (0.0%) |
| 35 to 44 Years | 0 (0.0%) | 0 (0.0%) |
| 45 to 54 Years | 0 (0.0%) | 0 (0.0%) |
| 55 to 64 Years | 0 (0.0%) | 0 (0.0%) |
| 65 to 74 Years | 0 (0.0%) | 0 (0.0%) |
| 75 Years and over | 0 (0.0%) | 0 (0.0%) |
| Total | 0 (0.0%) | 0 (0.0%) |
Income Above Poverty by Sex and Age in Parsonsburg
According to the poverty statistics in Parsonsburg, males aged under 5 years and females aged under 5 years are the age groups that are most secure financially, with 100.0% of males and 100.0% of females in these age groups living above the poverty line.
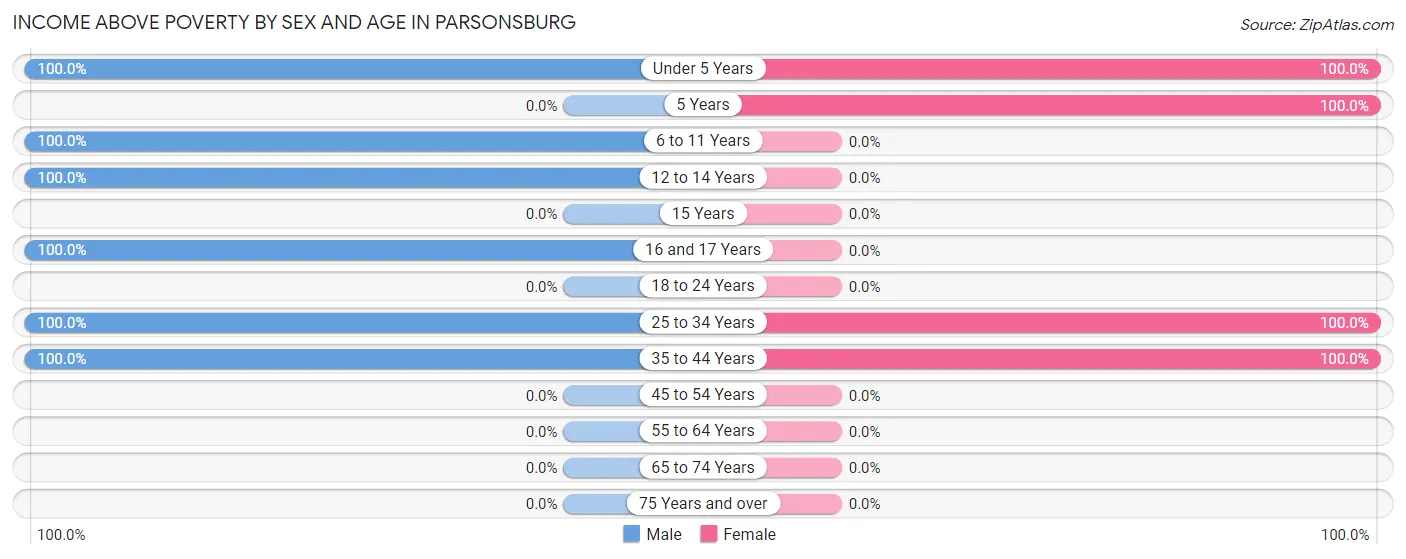
| Age Bracket | Male | Female |
| Under 5 Years | 26 (100.0%) | 13 (100.0%) |
| 5 Years | 0 (0.0%) | 20 (100.0%) |
| 6 to 11 Years | 36 (100.0%) | 0 (0.0%) |
| 12 to 14 Years | 14 (100.0%) | 0 (0.0%) |
| 15 Years | 0 (0.0%) | 0 (0.0%) |
| 16 and 17 Years | 19 (100.0%) | 0 (0.0%) |
| 18 to 24 Years | 0 (0.0%) | 0 (0.0%) |
| 25 to 34 Years | 25 (100.0%) | 18 (100.0%) |
| 35 to 44 Years | 14 (100.0%) | 15 (100.0%) |
| 45 to 54 Years | 0 (0.0%) | 0 (0.0%) |
| 55 to 64 Years | 0 (0.0%) | 0 (0.0%) |
| 65 to 74 Years | 0 (0.0%) | 0 (0.0%) |
| 75 Years and over | 0 (0.0%) | 0 (0.0%) |
| Total | 134 (100.0%) | 66 (100.0%) |
Income Below Poverty Among Married-Couple Families in Parsonsburg
| Children | Above Poverty | Below Poverty |
| No Children | 0 (0.0%) | 0 (0.0%) |
| 1 or 2 Children | 0 (0.0%) | 0 (0.0%) |
| 3 or 4 Children | 39 (100.0%) | 0 (0.0%) |
| 5 or more Children | 0 (0.0%) | 0 (0.0%) |
| Total | 39 (100.0%) | 0 (0.0%) |
Income Below Poverty Among Single-Parent Households in Parsonsburg
| Children | Single Father | Single Mother |
| No Children | 0 (0.0%) | 0 (0.0%) |
| 1 or 2 Children | 0 (0.0%) | 0 (0.0%) |
| 3 or 4 Children | 0 (0.0%) | 0 (0.0%) |
| 5 or more Children | 0 (0.0%) | 0 (0.0%) |
| Total | 0 (0.0%) | 0 (0.0%) |
Income Below Poverty Among Married-Couple vs Single-Parent Households in Parsonsburg
| Children | Married-Couple Families | Single-Parent Households |
| No Children | 0 (0.0%) | 0 (0.0%) |
| 1 or 2 Children | 0 (0.0%) | 0 (0.0%) |
| 3 or 4 Children | 0 (0.0%) | 0 (0.0%) |
| 5 or more Children | 0 (0.0%) | 0 (0.0%) |
| Total | 0 (0.0%) | 0 (0.0%) |
Race in Parsonsburg
The most populous races in Parsonsburg are White / Caucasian (186 | 93.0%), and Two or more Races (14 | 7.0%).
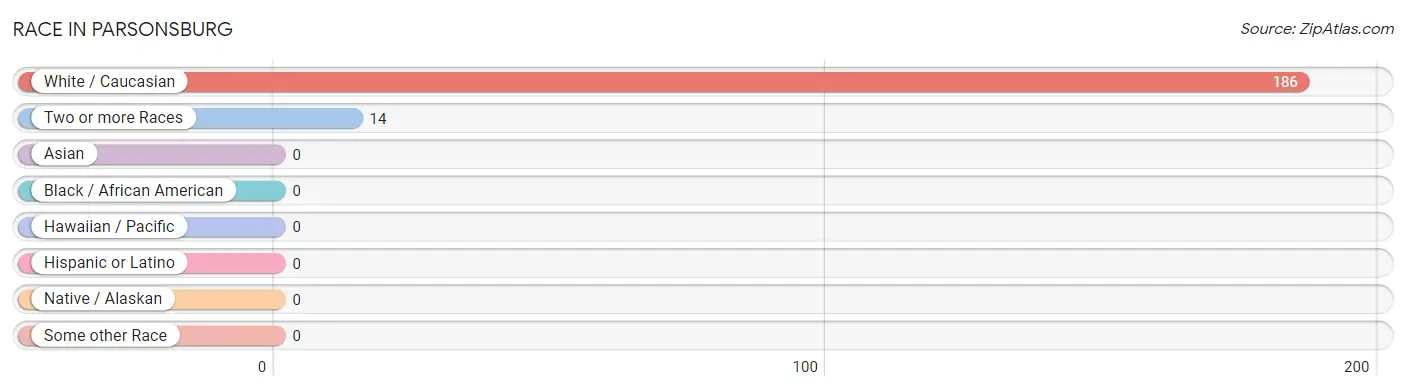
| Race | # Population | % Population |
| Asian | 0 | 0.0% |
| Black / African American | 0 | 0.0% |
| Hawaiian / Pacific | 0 | 0.0% |
| Hispanic or Latino | 0 | 0.0% |
| Native / Alaskan | 0 | 0.0% |
| White / Caucasian | 186 | 93.0% |
| Two or more Races | 14 | 7.0% |
| Some other Race | 0 | 0.0% |
| Total | 200 | 100.0% |
Ancestry in Parsonsburg
The most populous ancestries reported in Parsonsburg are Polish (74 | 37.0%), Pennsylvania German (56 | 28.0%), American (43 | 21.5%), German (33 | 16.5%), and Russian (15 | 7.5%), together accounting for 110.5% of all Parsonsburg residents.
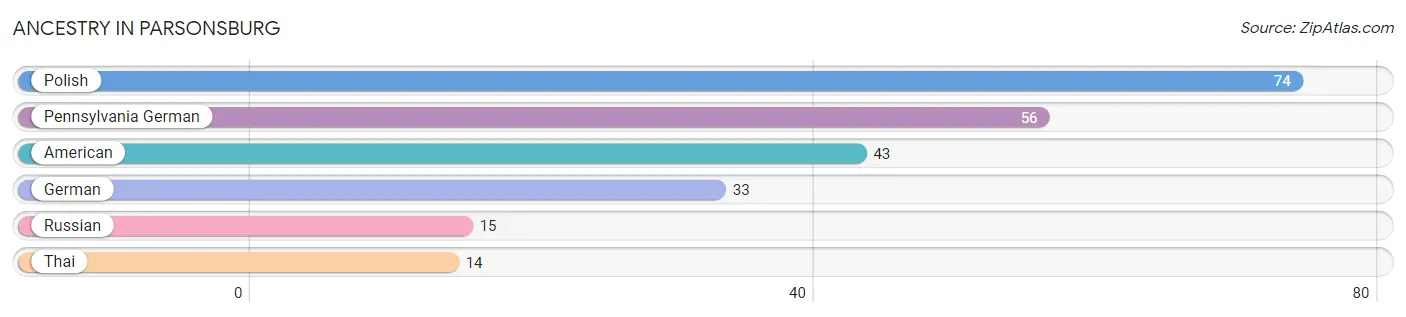
| Ancestry | # Population | % Population |
| American | 43 | 21.5% |
| German | 33 | 16.5% |
| Pennsylvania German | 56 | 28.0% |
| Polish | 74 | 37.0% |
| Russian | 15 | 7.5% |
| Thai | 14 | 7.0% | View All 6 Rows |
Immigrants in Parsonsburg

| Immigration Origin | # Population | % Population | View All 0 Rows |
Sex and Age in Parsonsburg
Sex and Age in Parsonsburg
The most populous age groups in Parsonsburg are 10 to 14 Years (36 | 26.9%) for men and 5 to 9 Years (20 | 30.3%) for women.
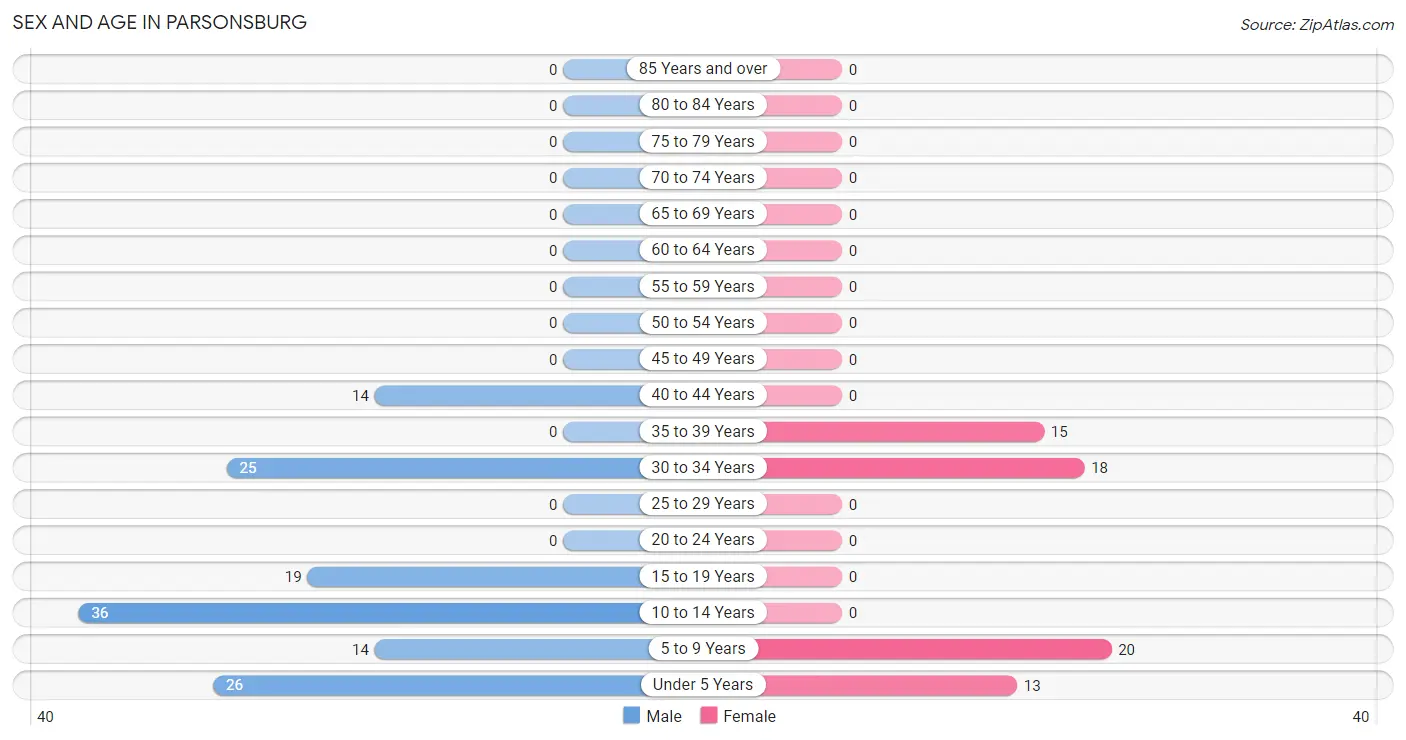
| Age Bracket | Male | Female |
| Under 5 Years | 26 (19.4%) | 13 (19.7%) |
| 5 to 9 Years | 14 (10.4%) | 20 (30.3%) |
| 10 to 14 Years | 36 (26.9%) | 0 (0.0%) |
| 15 to 19 Years | 19 (14.2%) | 0 (0.0%) |
| 20 to 24 Years | 0 (0.0%) | 0 (0.0%) |
| 25 to 29 Years | 0 (0.0%) | 0 (0.0%) |
| 30 to 34 Years | 25 (18.7%) | 18 (27.3%) |
| 35 to 39 Years | 0 (0.0%) | 15 (22.7%) |
| 40 to 44 Years | 14 (10.4%) | 0 (0.0%) |
| 45 to 49 Years | 0 (0.0%) | 0 (0.0%) |
| 50 to 54 Years | 0 (0.0%) | 0 (0.0%) |
| 55 to 59 Years | 0 (0.0%) | 0 (0.0%) |
| 60 to 64 Years | 0 (0.0%) | 0 (0.0%) |
| 65 to 69 Years | 0 (0.0%) | 0 (0.0%) |
| 70 to 74 Years | 0 (0.0%) | 0 (0.0%) |
| 75 to 79 Years | 0 (0.0%) | 0 (0.0%) |
| 80 to 84 Years | 0 (0.0%) | 0 (0.0%) |
| 85 Years and over | 0 (0.0%) | 0 (0.0%) |
| Total | 134 (100.0%) | 66 (100.0%) |
Families and Households in Parsonsburg
Median Family Size in Parsonsburg
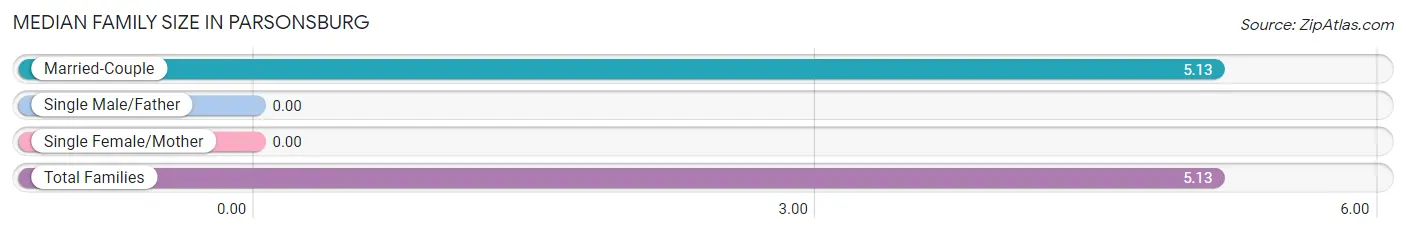
| Family Type | # Families | Family Size |
| Married-Couple | 39 (100.0%) | 5.13 |
| Single Male/Father | 0 (0.0%) | - |
| Single Female/Mother | 0 (0.0%) | - |
| Total Families | 39 (100.0%) | 5.13 |
Median Household Size in Parsonsburg
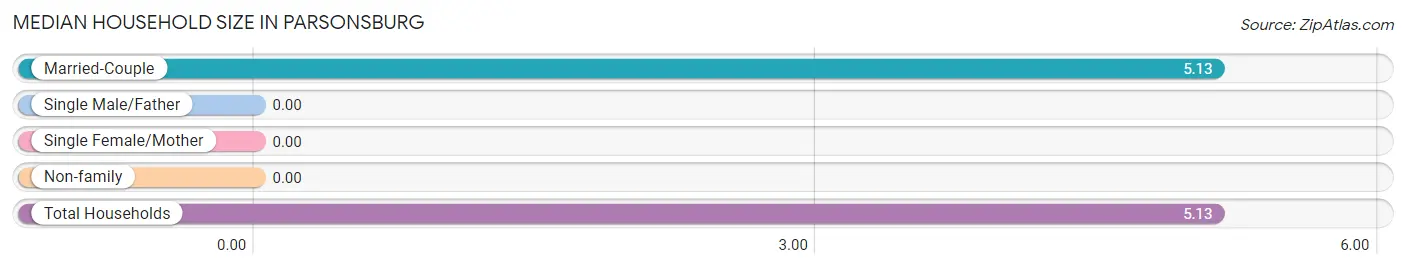
| Household Type | # Households | Household Size |
| Married-Couple | 39 (100.0%) | 5.13 |
| Single Male/Father | 0 (0.0%) | - |
| Single Female/Mother | 0 (0.0%) | - |
| Non-family | 0 (0.0%) | - |
| Total Households | 39 (100.0%) | 5.13 |
Household Size by Marriage Status in Parsonsburg
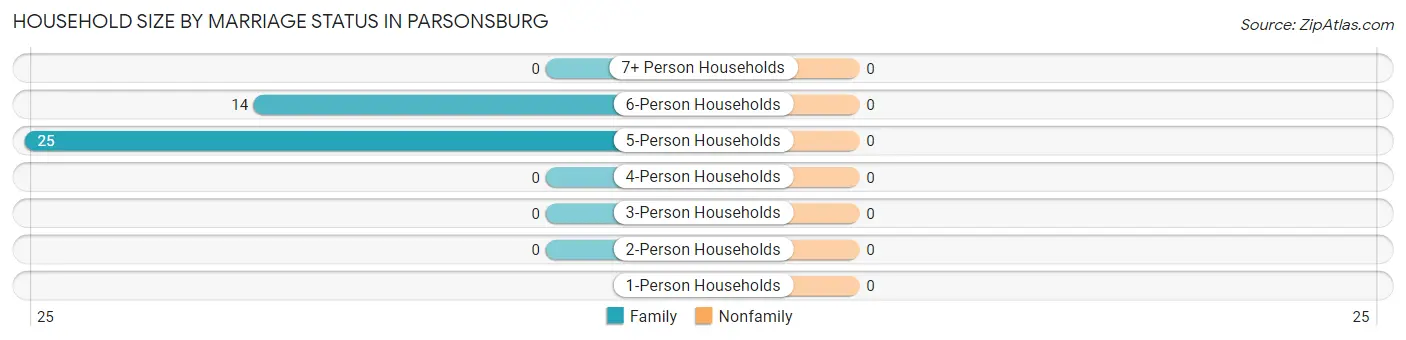
| Household Size | Family Households | Nonfamily Households |
| 1-Person Households | - | 0 (0.0%) |
| 2-Person Households | 0 (0.0%) | 0 (0.0%) |
| 3-Person Households | 0 (0.0%) | 0 (0.0%) |
| 4-Person Households | 0 (0.0%) | 0 (0.0%) |
| 5-Person Households | 25 (64.1%) | 0 (0.0%) |
| 6-Person Households | 14 (35.9%) | 0 (0.0%) |
| 7+ Person Households | 0 (0.0%) | 0 (0.0%) |
| Total | 39 (100.0%) | 0 (0.0%) |
Female Fertility in Parsonsburg
Fertility by Age in Parsonsburg
| Age Bracket | Women with Births | Births / 1,000 Women |
| 15 to 19 years | 0 (0.0%) | 0.0 |
| 20 to 34 years | 0 (0.0%) | 0.0 |
| 35 to 50 years | 0 (0.0%) | 0.0 |
| Total | 0 (0.0%) | 0.0 |
Fertility by Age by Marriage Status in Parsonsburg
| Age Bracket | Married | Unmarried |
| 15 to 19 years | 0 (0.0%) | 0 (0.0%) |
| 20 to 34 years | 0 (0.0%) | 0 (0.0%) |
| 35 to 50 years | 0 (0.0%) | 0 (0.0%) |
| Total | 0 (0.0%) | 0 (0.0%) |
Fertility by Education in Parsonsburg
| Educational Attainment | Women with Births | Births / 1,000 Women |
| Less than High School | 0 (0.0%) | 0.0 |
| High School Diploma | 0 (0.0%) | 0.0 |
| College or Associate's Degree | 0 (0.0%) | 0.0 |
| Bachelor's Degree | 0 (0.0%) | 0.0 |
| Graduate Degree | 0 (0.0%) | 0.0 |
| Total | 0 (0.0%) | 0.0 |
Fertility by Education by Marriage Status in Parsonsburg
| Educational Attainment | Married | Unmarried |
| Less than High School | 0 (0.0%) | 0 (0.0%) |
| High School Diploma | 0 (0.0%) | 0 (0.0%) |
| College or Associate's Degree | 0 (0.0%) | 0 (0.0%) |
| Bachelor's Degree | 0 (0.0%) | 0 (0.0%) |
| Graduate Degree | 0 (0.0%) | 0 (0.0%) |
| Total | 0 (0.0%) | 0 (0.0%) |
Employment Characteristics in Parsonsburg
Employment by Class of Employer in Parsonsburg
Among the 91 employed individuals in Parsonsburg, local government employees (43 | 47.2%), private company employees (19 | 20.9%), and unpaid family workers (15 | 16.5%) make up the most common classes of employment.
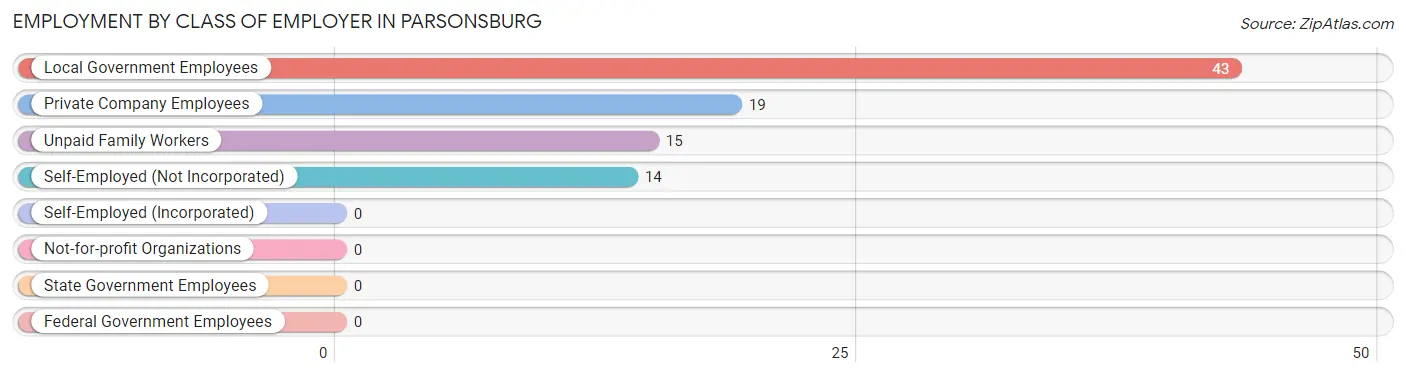
| Employer Class | # Employees | % Employees |
| Private Company Employees | 19 | 20.9% |
| Self-Employed (Incorporated) | 0 | 0.0% |
| Self-Employed (Not Incorporated) | 14 | 15.4% |
| Not-for-profit Organizations | 0 | 0.0% |
| Local Government Employees | 43 | 47.2% |
| State Government Employees | 0 | 0.0% |
| Federal Government Employees | 0 | 0.0% |
| Unpaid Family Workers | 15 | 16.5% |
| Total | 91 | 100.0% |
Employment Status by Age in Parsonsburg
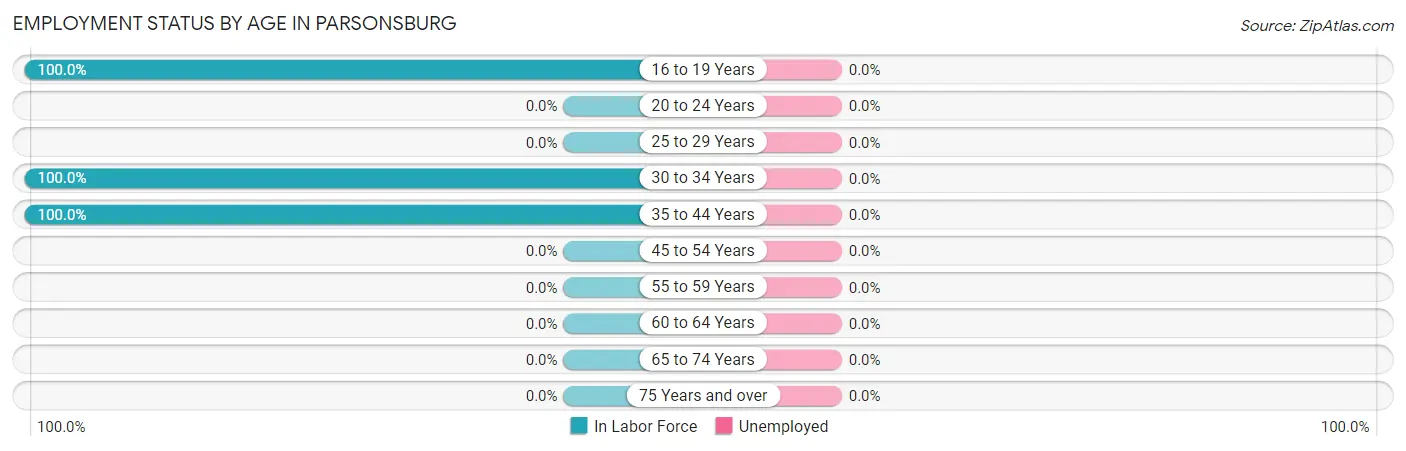
| Age Bracket | In Labor Force | Unemployed |
| 16 to 19 Years | 19 (100.0%) | 0 (0.0%) |
| 20 to 24 Years | 0 (0.0%) | 0 (0.0%) |
| 25 to 29 Years | 0 (0.0%) | 0 (0.0%) |
| 30 to 34 Years | 43 (100.0%) | 0 (0.0%) |
| 35 to 44 Years | 29 (100.0%) | 0 (0.0%) |
| 45 to 54 Years | 0 (0.0%) | 0 (0.0%) |
| 55 to 59 Years | 0 (0.0%) | 0 (0.0%) |
| 60 to 64 Years | 0 (0.0%) | 0 (0.0%) |
| 65 to 74 Years | 0 (0.0%) | 0 (0.0%) |
| 75 Years and over | 0 (0.0%) | 0 (0.0%) |
| Total | 91 (100.0%) | 0 (0.0%) |
Employment Status by Educational Attainment in Parsonsburg
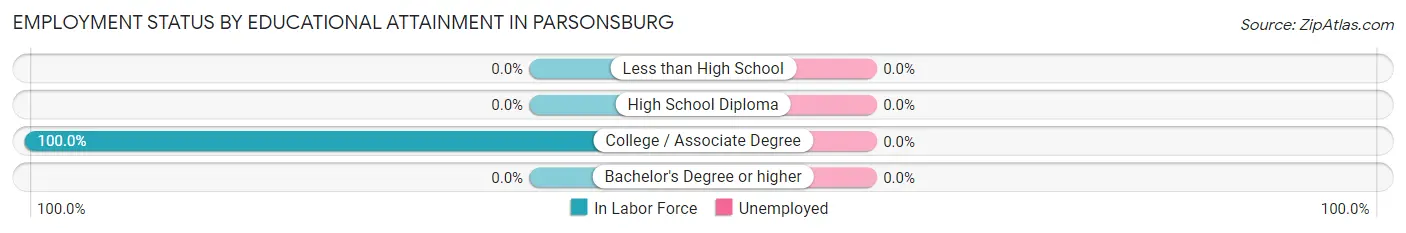
| Educational Attainment | In Labor Force | Unemployed |
| Less than High School | 0 (0.0%) | 0 (0.0%) |
| High School Diploma | 0 (0.0%) | 0 (0.0%) |
| College / Associate Degree | 72 (100.0%) | 0 (0.0%) |
| Bachelor's Degree or higher | 0 (0.0%) | 0 (0.0%) |
| Total | 72 (100.0%) | 0 (0.0%) |
Employment Occupations by Sex in Parsonsburg
Management, Business, Science and Arts Occupations
The most common Management, Business, Science and Arts occupations in Parsonsburg are Community & Social Service (18 | 19.8%), and Education Instruction & Library (18 | 19.8%).
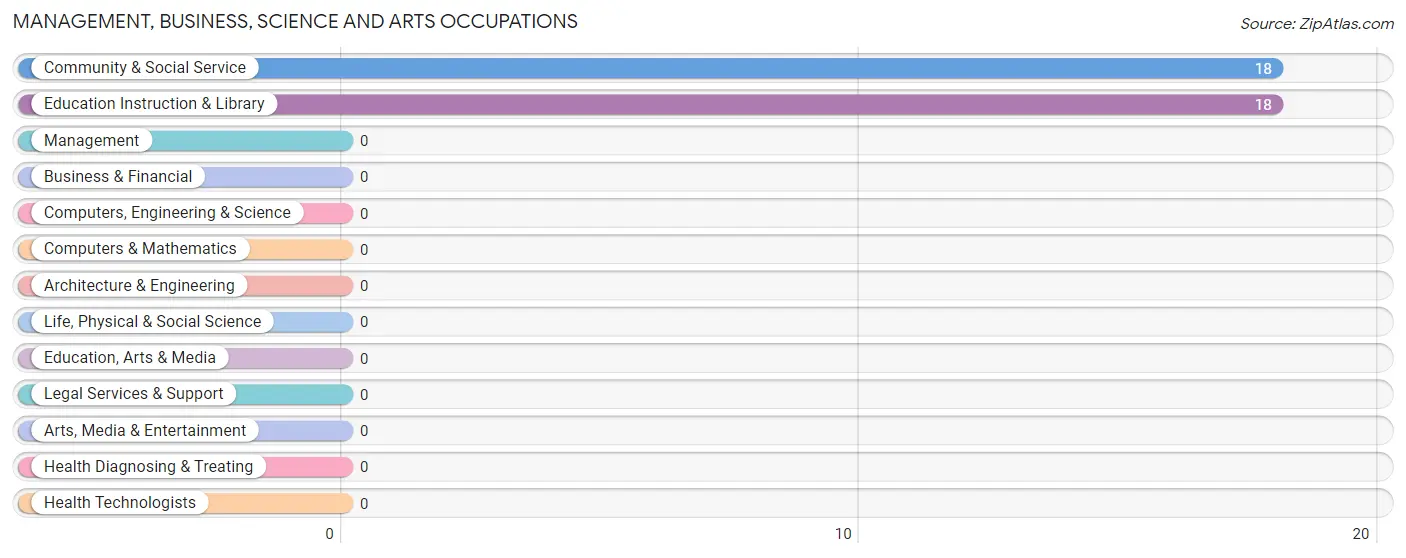
Management, Business, Science and Arts Occupations by Sex
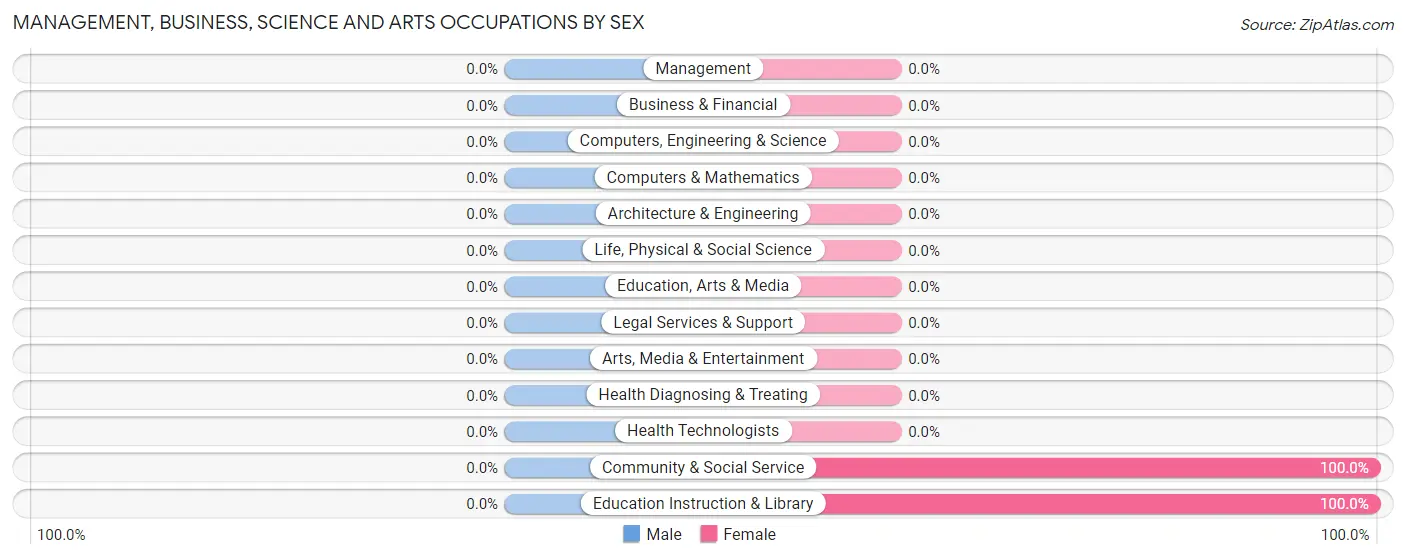
| Occupation | Male | Female |
| Management | 0 (0.0%) | 0 (0.0%) |
| Business & Financial | 0 (0.0%) | 0 (0.0%) |
| Computers, Engineering & Science | 0 (0.0%) | 0 (0.0%) |
| Computers & Mathematics | 0 (0.0%) | 0 (0.0%) |
| Architecture & Engineering | 0 (0.0%) | 0 (0.0%) |
| Life, Physical & Social Science | 0 (0.0%) | 0 (0.0%) |
| Community & Social Service | 0 (0.0%) | 18 (100.0%) |
| Education, Arts & Media | 0 (0.0%) | 0 (0.0%) |
| Legal Services & Support | 0 (0.0%) | 0 (0.0%) |
| Education Instruction & Library | 0 (0.0%) | 18 (100.0%) |
| Arts, Media & Entertainment | 0 (0.0%) | 0 (0.0%) |
| Health Diagnosing & Treating | 0 (0.0%) | 0 (0.0%) |
| Health Technologists | 0 (0.0%) | 0 (0.0%) |
| Total (Category) | 0 (0.0%) | 18 (100.0%) |
| Total (Overall) | 58 (63.7%) | 33 (36.3%) |
Services Occupations
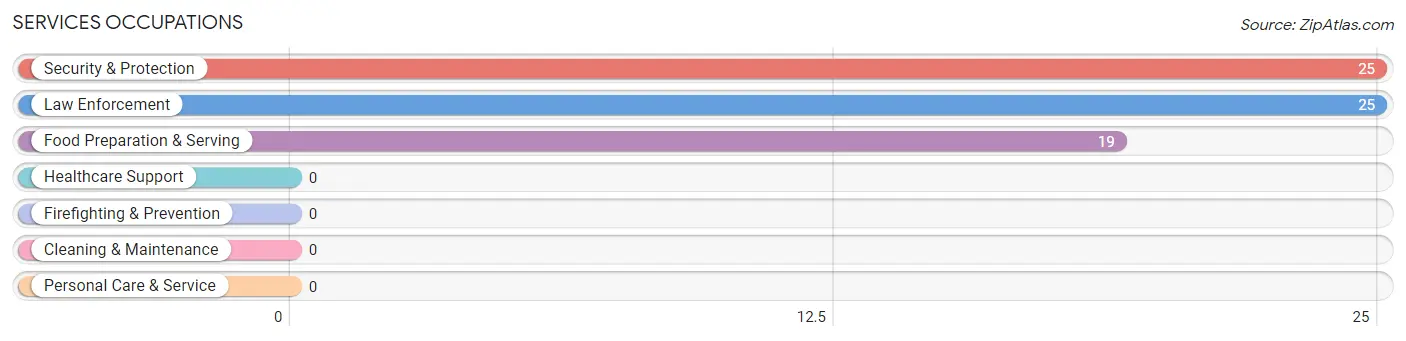
The most common Services occupations in Parsonsburg are Security & Protection (25 | 27.5%), Law Enforcement (25 | 27.5%), and Food Preparation & Serving (19 | 20.9%).
Services Occupations by Sex
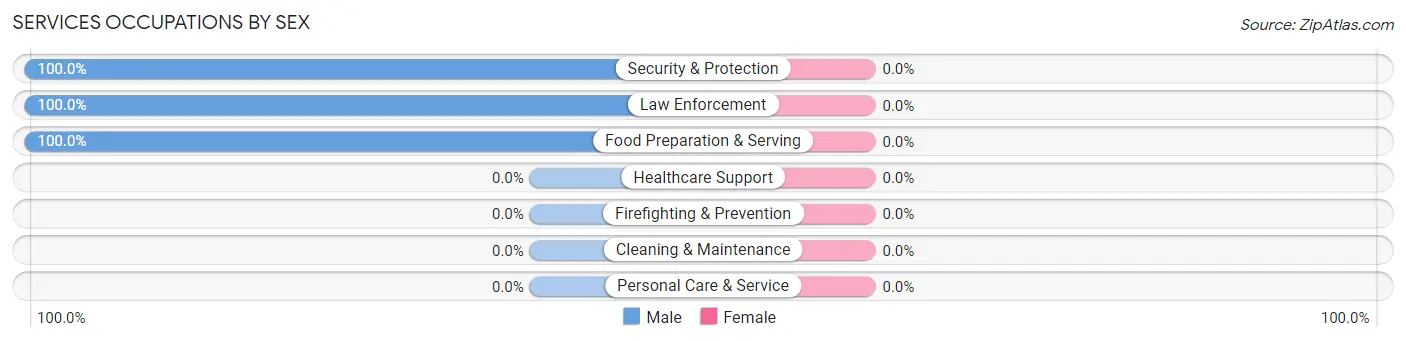
| Occupation | Male | Female |
| Healthcare Support | 0 (0.0%) | 0 (0.0%) |
| Security & Protection | 25 (100.0%) | 0 (0.0%) |
| Firefighting & Prevention | 0 (0.0%) | 0 (0.0%) |
| Law Enforcement | 25 (100.0%) | 0 (0.0%) |
| Food Preparation & Serving | 19 (100.0%) | 0 (0.0%) |
| Cleaning & Maintenance | 0 (0.0%) | 0 (0.0%) |
| Personal Care & Service | 0 (0.0%) | 0 (0.0%) |
| Total (Category) | 44 (100.0%) | 0 (0.0%) |
| Total (Overall) | 58 (63.7%) | 33 (36.3%) |
Sales and Office Occupations
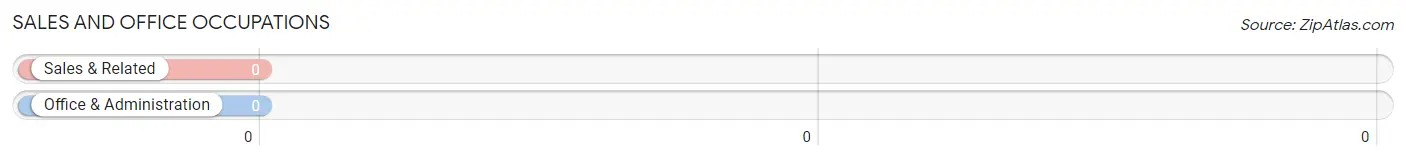
Sales and Office Occupations by Sex
| Occupation | Male | Female |
| Sales & Related | 0 (0.0%) | 0 (0.0%) |
| Office & Administration | 0 (0.0%) | 0 (0.0%) |
| Total (Category) | 0 (0.0%) | 0 (0.0%) |
| Total (Overall) | 58 (63.7%) | 33 (36.3%) |
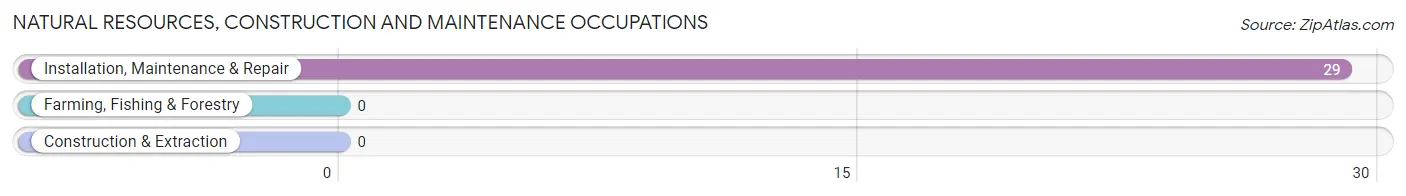
Natural Resources, Construction and Maintenance Occupations
The most common Natural Resources, Construction and Maintenance occupations in Parsonsburg are , and Installation, Maintenance & Repair (29 | 31.9%).
Natural Resources, Construction and Maintenance Occupations by Sex
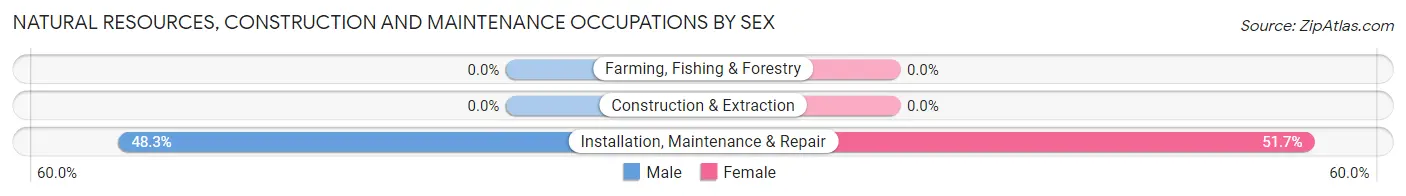
| Occupation | Male | Female |
| Farming, Fishing & Forestry | 0 (0.0%) | 0 (0.0%) |
| Construction & Extraction | 0 (0.0%) | 0 (0.0%) |
| Installation, Maintenance & Repair | 14 (48.3%) | 15 (51.7%) |
| Total (Category) | 14 (48.3%) | 15 (51.7%) |
| Total (Overall) | 58 (63.7%) | 33 (36.3%) |
Production, Transportation and Moving Occupations
Production, Transportation and Moving Occupations by Sex
| Occupation | Male | Female |
| Production | 0 (0.0%) | 0 (0.0%) |
| Transportation | 0 (0.0%) | 0 (0.0%) |
| Material Moving | 0 (0.0%) | 0 (0.0%) |
| Total (Category) | 0 (0.0%) | 0 (0.0%) |
| Total (Overall) | 58 (63.7%) | 33 (36.3%) |
Employment Industries by Sex in Parsonsburg
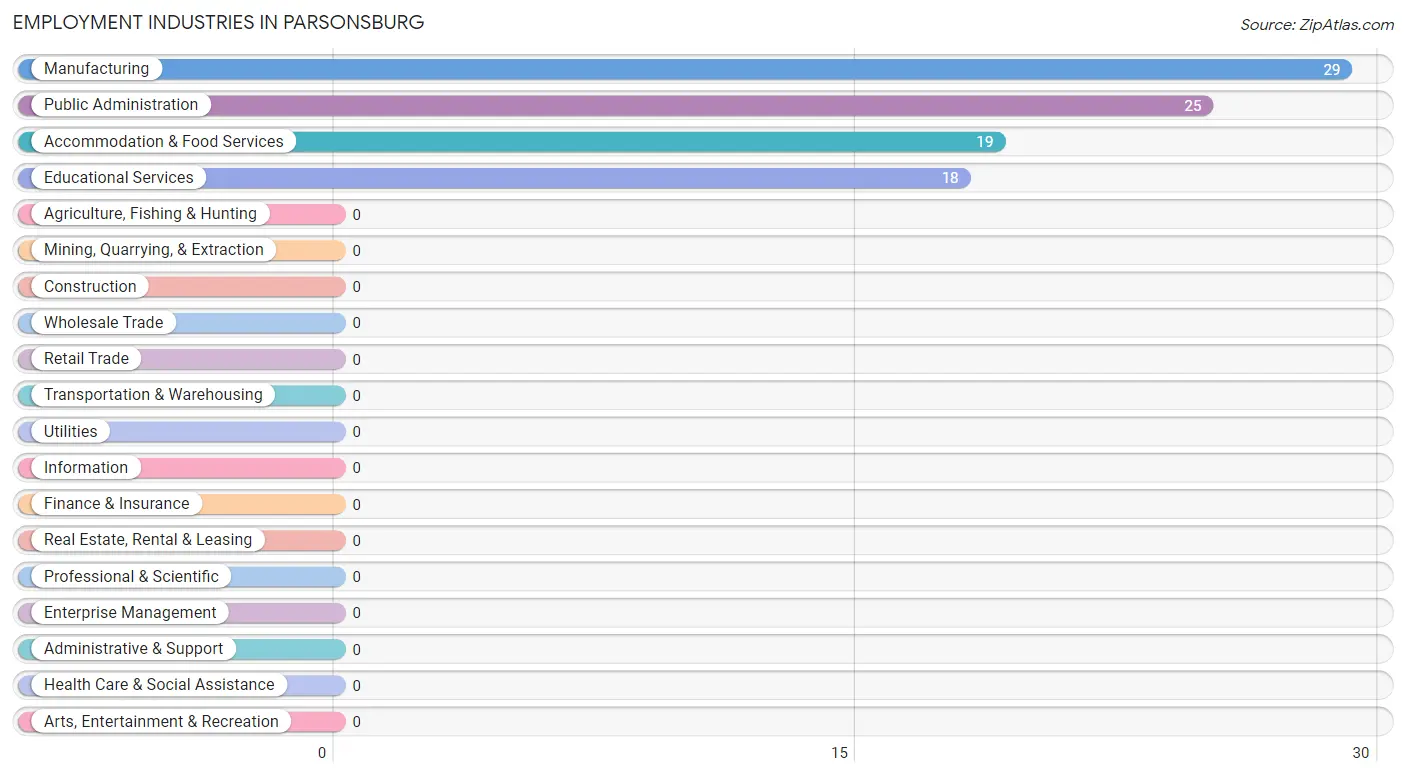
Employment Industries in Parsonsburg
The major employment industries in Parsonsburg include Manufacturing (29 | 31.9%), Public Administration (25 | 27.5%), Accommodation & Food Services (19 | 20.9%), and Educational Services (18 | 19.8%).
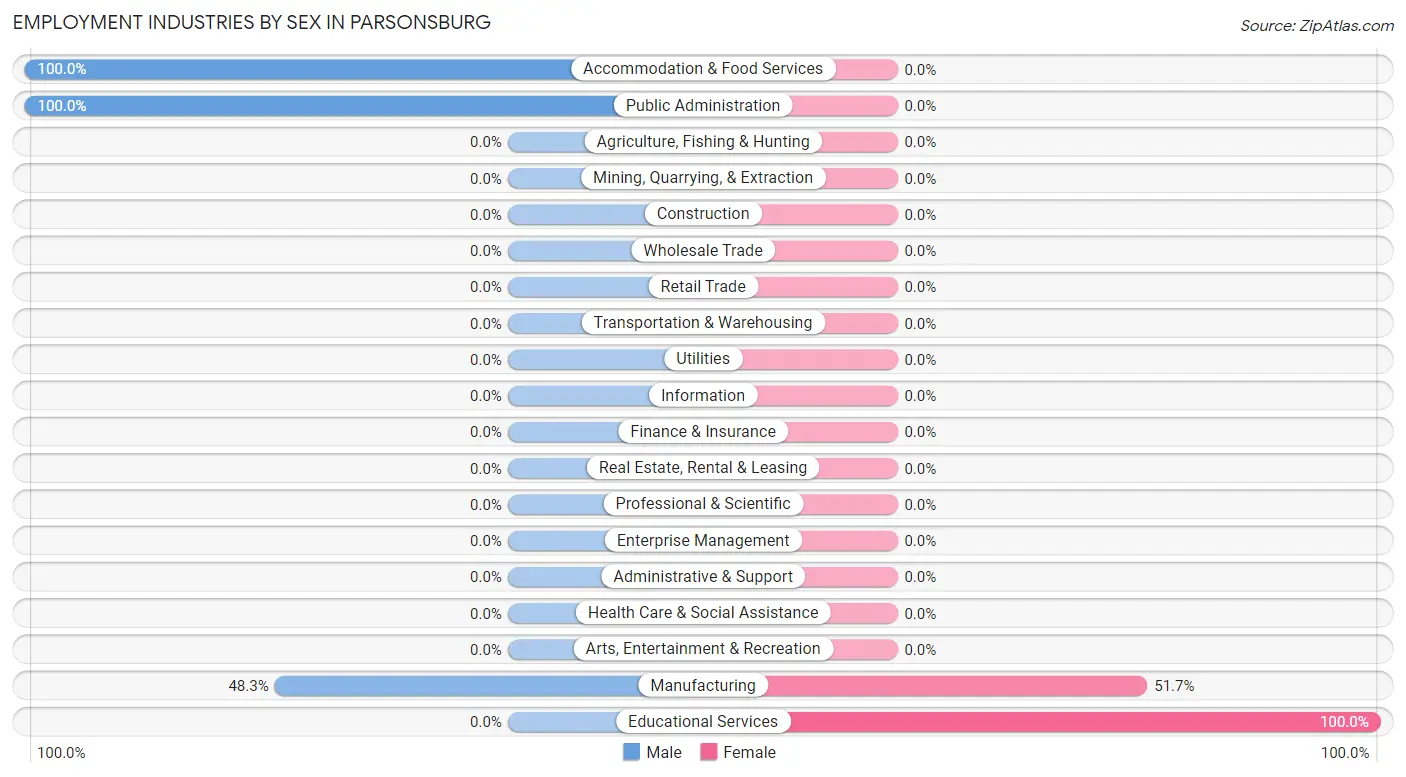
Employment Industries by Sex in Parsonsburg
The Parsonsburg industries that see more men than women are Accommodation & Food Services (100.0%), Public Administration (100.0%), and Manufacturing (48.3%), whereas the industries that tend to have a higher number of women are Educational Services (100.0%), and Manufacturing (51.7%).
| Industry | Male | Female |
| Agriculture, Fishing & Hunting | 0 (0.0%) | 0 (0.0%) |
| Mining, Quarrying, & Extraction | 0 (0.0%) | 0 (0.0%) |
| Construction | 0 (0.0%) | 0 (0.0%) |
| Manufacturing | 14 (48.3%) | 15 (51.7%) |
| Wholesale Trade | 0 (0.0%) | 0 (0.0%) |
| Retail Trade | 0 (0.0%) | 0 (0.0%) |
| Transportation & Warehousing | 0 (0.0%) | 0 (0.0%) |
| Utilities | 0 (0.0%) | 0 (0.0%) |
| Information | 0 (0.0%) | 0 (0.0%) |
| Finance & Insurance | 0 (0.0%) | 0 (0.0%) |
| Real Estate, Rental & Leasing | 0 (0.0%) | 0 (0.0%) |
| Professional & Scientific | 0 (0.0%) | 0 (0.0%) |
| Enterprise Management | 0 (0.0%) | 0 (0.0%) |
| Administrative & Support | 0 (0.0%) | 0 (0.0%) |
| Educational Services | 0 (0.0%) | 18 (100.0%) |
| Health Care & Social Assistance | 0 (0.0%) | 0 (0.0%) |
| Arts, Entertainment & Recreation | 0 (0.0%) | 0 (0.0%) |
| Accommodation & Food Services | 19 (100.0%) | 0 (0.0%) |
| Public Administration | 25 (100.0%) | 0 (0.0%) |
| Total | 58 (63.7%) | 33 (36.3%) |
Education in Parsonsburg
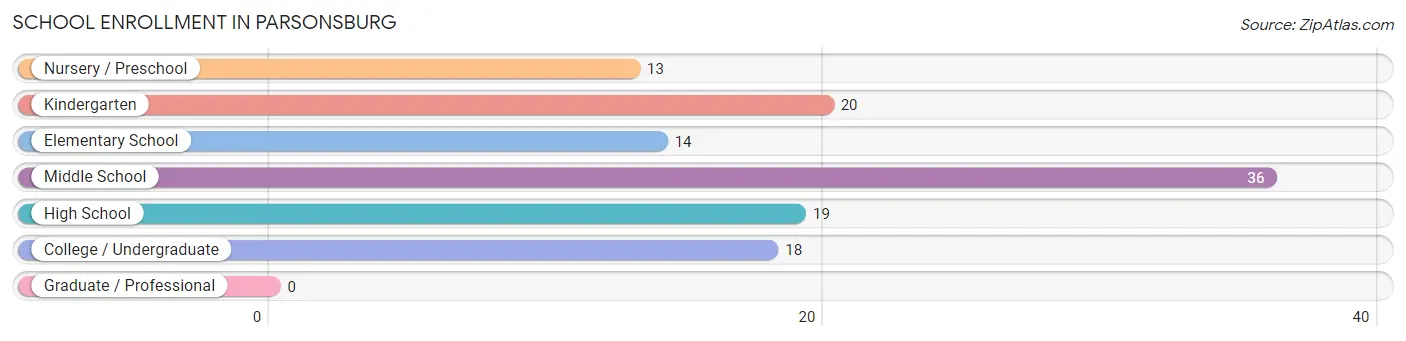
School Enrollment in Parsonsburg
The most common levels of schooling among the 120 students in Parsonsburg are middle school (36 | 30.0%), kindergarten (20 | 16.7%), and high school (19 | 15.8%).
| School Level | # Students | % Students |
| Nursery / Preschool | 13 | 10.8% |
| Kindergarten | 20 | 16.7% |
| Elementary School | 14 | 11.7% |
| Middle School | 36 | 30.0% |
| High School | 19 | 15.8% |
| College / Undergraduate | 18 | 15.0% |
| Graduate / Professional | 0 | 0.0% |
| Total | 120 | 100.0% |
School Enrollment by Age by Funding Source in Parsonsburg
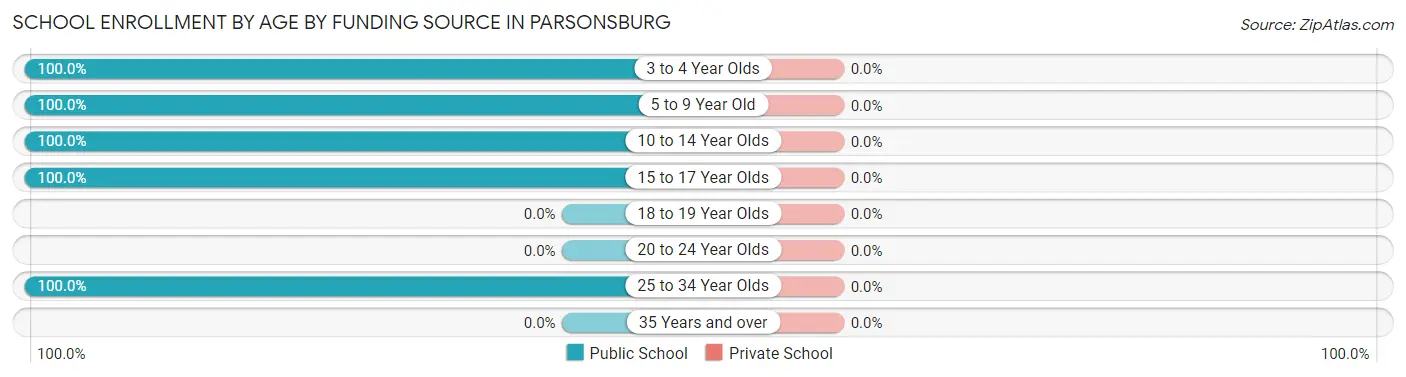
| Age Bracket | Public School | Private School |
| 3 to 4 Year Olds | 13 (100.0%) | 0 (0.0%) |
| 5 to 9 Year Old | 34 (100.0%) | 0 (0.0%) |
| 10 to 14 Year Olds | 36 (100.0%) | 0 (0.0%) |
| 15 to 17 Year Olds | 19 (100.0%) | 0 (0.0%) |
| 18 to 19 Year Olds | 0 (0.0%) | 0 (0.0%) |
| 20 to 24 Year Olds | 0 (0.0%) | 0 (0.0%) |
| 25 to 34 Year Olds | 18 (100.0%) | 0 (0.0%) |
| 35 Years and over | 0 (0.0%) | 0 (0.0%) |
| Total | 120 (100.0%) | 0 (0.0%) |
Educational Attainment by Field of Study in Parsonsburg
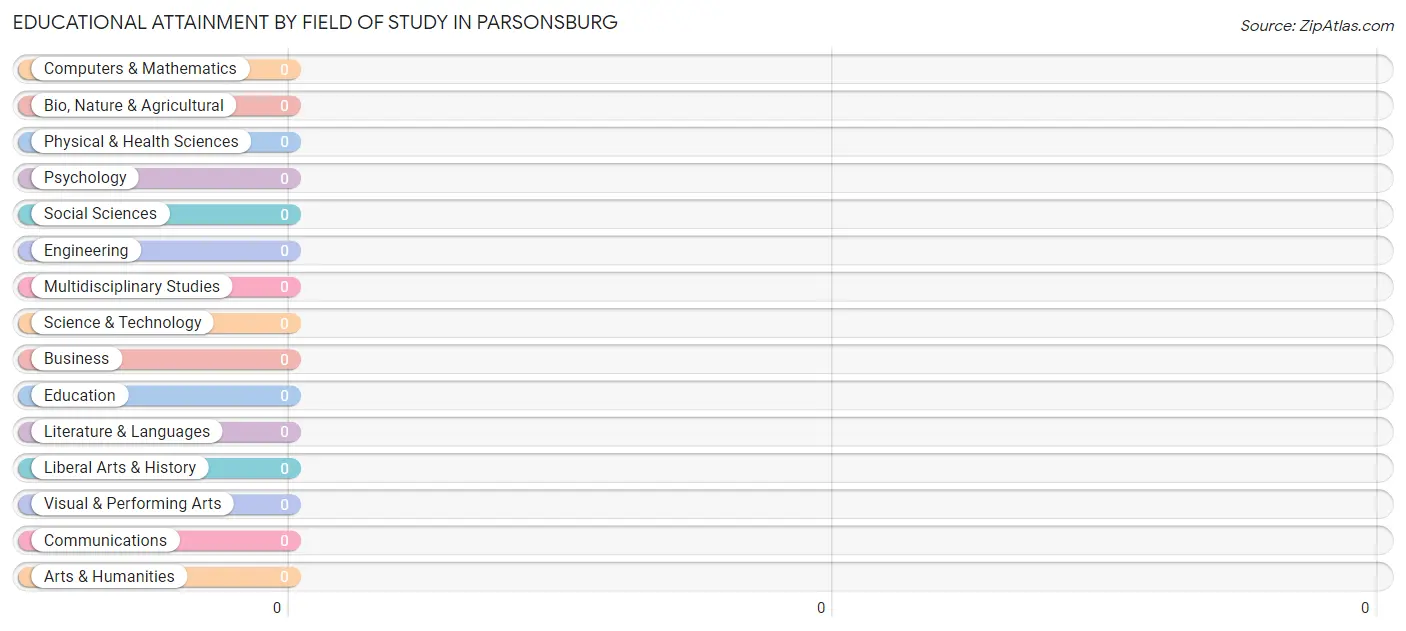
| Field of Study | # Graduates | % Graduates |
| Computers & Mathematics | 0 | 0.0% |
| Bio, Nature & Agricultural | 0 | 0.0% |
| Physical & Health Sciences | 0 | 0.0% |
| Psychology | 0 | 0.0% |
| Social Sciences | 0 | 0.0% |
| Engineering | 0 | 0.0% |
| Multidisciplinary Studies | 0 | 0.0% |
| Science & Technology | 0 | 0.0% |
| Business | 0 | 0.0% |
| Education | 0 | 0.0% |
| Literature & Languages | 0 | 0.0% |
| Liberal Arts & History | 0 | 0.0% |
| Visual & Performing Arts | 0 | 0.0% |
| Communications | 0 | 0.0% |
| Arts & Humanities | 0 | 0.0% |
| Total | 0 | 0.0% |
Transportation & Commute in Parsonsburg
Vehicle Availability by Sex in Parsonsburg
The most prevalent vehicle ownership categories in Parsonsburg are males with 5 or more vehicles (33, accounting for 56.9%) and females with 5 or more vehicles (15, making up 100.0%).
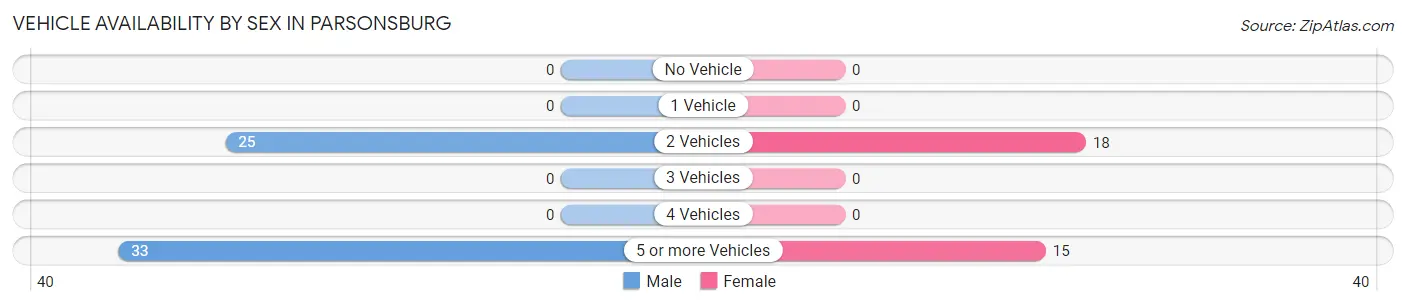
| Vehicles Available | Male | Female |
| No Vehicle | 0 (0.0%) | 0 (0.0%) |
| 1 Vehicle | 0 (0.0%) | 0 (0.0%) |
| 2 Vehicles | 25 (43.1%) | 18 (54.5%) |
| 3 Vehicles | 0 (0.0%) | 0 (0.0%) |
| 4 Vehicles | 0 (0.0%) | 0 (0.0%) |
| 5 or more Vehicles | 33 (56.9%) | 15 (45.5%) |
| Total | 58 (100.0%) | 33 (100.0%) |
Commute Time in Parsonsburg
The most frequently occuring commute durations in Parsonsburg are 15 to 19 minutes (47 commuters, 51.6%), 20 to 24 minutes (44 commuters, 48.3%), and less than 5 minutes (0 commuters, 0.0%).
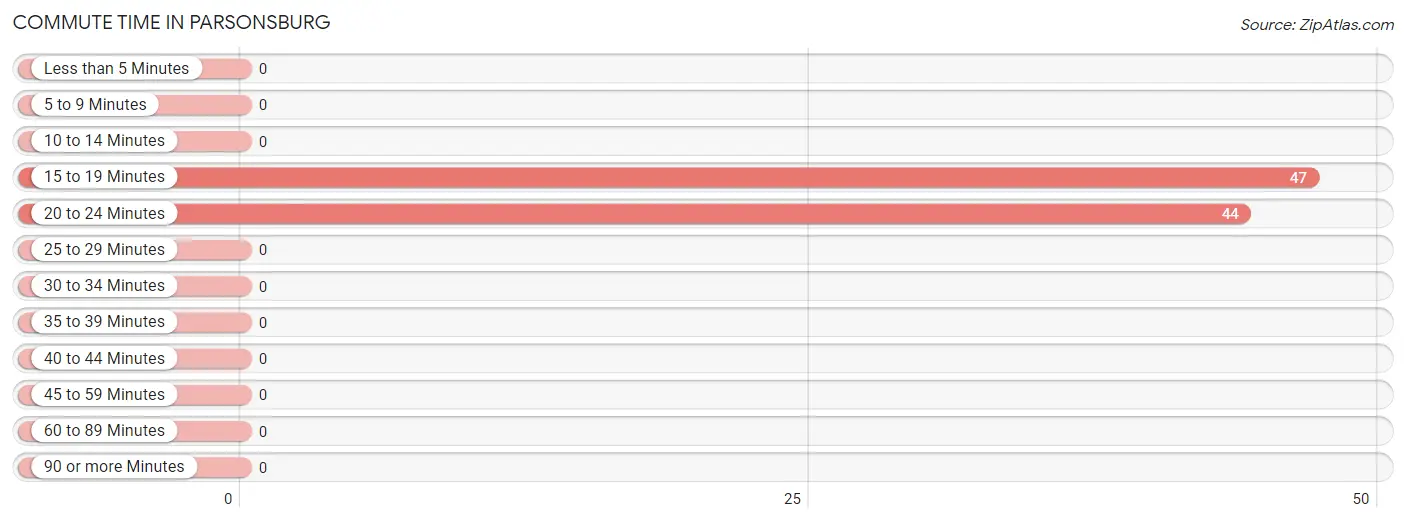
| Commute Time | # Commuters | % Commuters |
| Less than 5 Minutes | 0 | 0.0% |
| 5 to 9 Minutes | 0 | 0.0% |
| 10 to 14 Minutes | 0 | 0.0% |
| 15 to 19 Minutes | 47 | 51.6% |
| 20 to 24 Minutes | 44 | 48.3% |
| 25 to 29 Minutes | 0 | 0.0% |
| 30 to 34 Minutes | 0 | 0.0% |
| 35 to 39 Minutes | 0 | 0.0% |
| 40 to 44 Minutes | 0 | 0.0% |
| 45 to 59 Minutes | 0 | 0.0% |
| 60 to 89 Minutes | 0 | 0.0% |
| 90 or more Minutes | 0 | 0.0% |
Commute Time by Sex in Parsonsburg
The most common commute times in Parsonsburg are 20 to 24 minutes (44 commuters, 75.9%) for males and 15 to 19 minutes (33 commuters, 100.0%) for females.
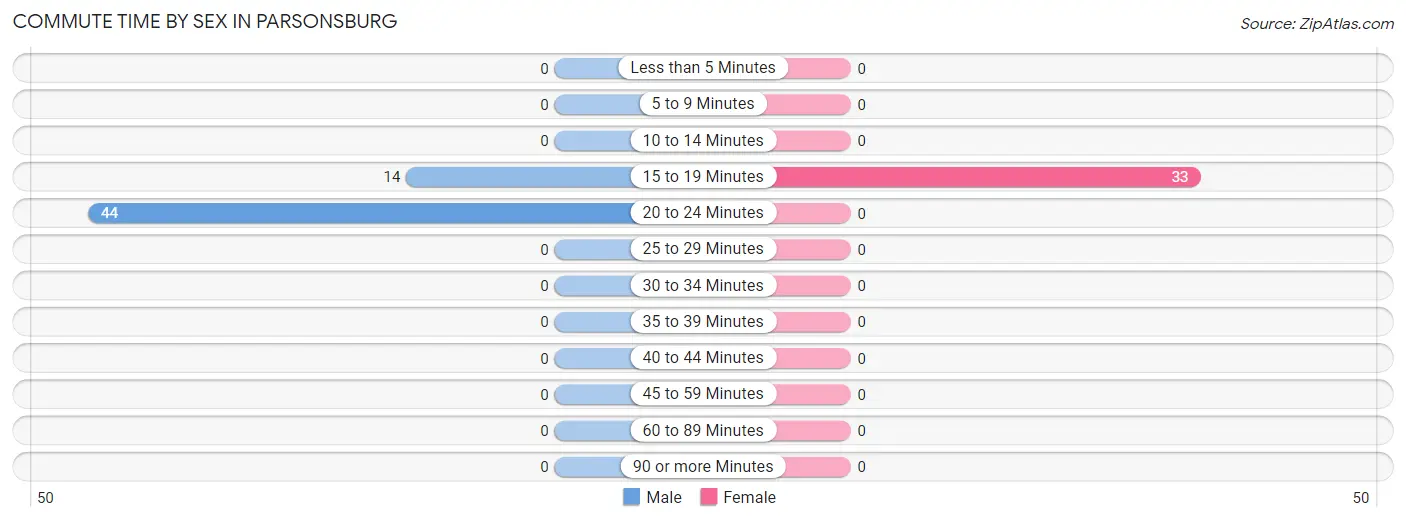
| Commute Time | Male | Female |
| Less than 5 Minutes | 0 (0.0%) | 0 (0.0%) |
| 5 to 9 Minutes | 0 (0.0%) | 0 (0.0%) |
| 10 to 14 Minutes | 0 (0.0%) | 0 (0.0%) |
| 15 to 19 Minutes | 14 (24.1%) | 33 (100.0%) |
| 20 to 24 Minutes | 44 (75.9%) | 0 (0.0%) |
| 25 to 29 Minutes | 0 (0.0%) | 0 (0.0%) |
| 30 to 34 Minutes | 0 (0.0%) | 0 (0.0%) |
| 35 to 39 Minutes | 0 (0.0%) | 0 (0.0%) |
| 40 to 44 Minutes | 0 (0.0%) | 0 (0.0%) |
| 45 to 59 Minutes | 0 (0.0%) | 0 (0.0%) |
| 60 to 89 Minutes | 0 (0.0%) | 0 (0.0%) |
| 90 or more Minutes | 0 (0.0%) | 0 (0.0%) |
Time of Departure to Work by Sex in Parsonsburg
The most frequent times of departure to work in Parsonsburg are 6:30 AM to 6:59 AM (25, 43.1%) for males and 7:00 AM to 7:29 AM (18, 54.5%) for females.
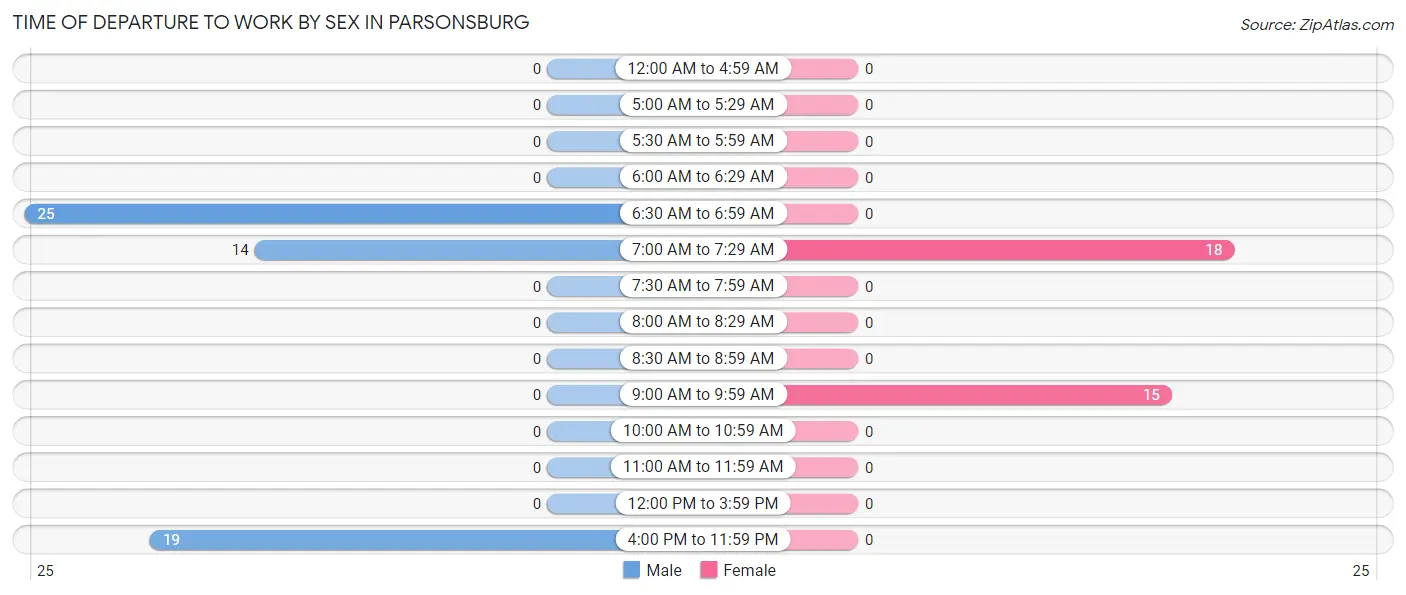
| Time of Departure | Male | Female |
| 12:00 AM to 4:59 AM | 0 (0.0%) | 0 (0.0%) |
| 5:00 AM to 5:29 AM | 0 (0.0%) | 0 (0.0%) |
| 5:30 AM to 5:59 AM | 0 (0.0%) | 0 (0.0%) |
| 6:00 AM to 6:29 AM | 0 (0.0%) | 0 (0.0%) |
| 6:30 AM to 6:59 AM | 25 (43.1%) | 0 (0.0%) |
| 7:00 AM to 7:29 AM | 14 (24.1%) | 18 (54.5%) |
| 7:30 AM to 7:59 AM | 0 (0.0%) | 0 (0.0%) |
| 8:00 AM to 8:29 AM | 0 (0.0%) | 0 (0.0%) |
| 8:30 AM to 8:59 AM | 0 (0.0%) | 0 (0.0%) |
| 9:00 AM to 9:59 AM | 0 (0.0%) | 15 (45.5%) |
| 10:00 AM to 10:59 AM | 0 (0.0%) | 0 (0.0%) |
| 11:00 AM to 11:59 AM | 0 (0.0%) | 0 (0.0%) |
| 12:00 PM to 3:59 PM | 0 (0.0%) | 0 (0.0%) |
| 4:00 PM to 11:59 PM | 19 (32.8%) | 0 (0.0%) |
| Total | 58 (100.0%) | 33 (100.0%) |
Housing Occupancy in Parsonsburg
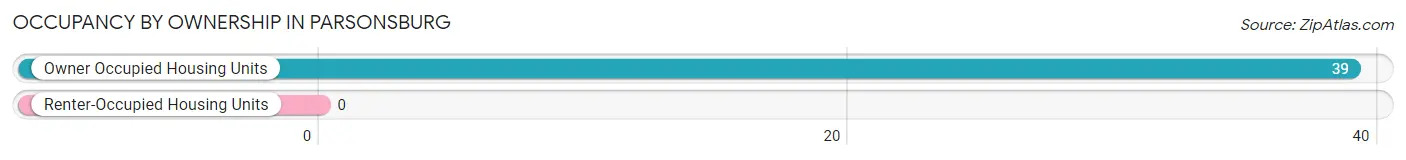
Occupancy by Ownership in Parsonsburg
Of the total 39 dwellings in Parsonsburg, owner-occupied units account for 39 (100.0%), while renter-occupied units make up 0 (0.0%).
| Occupancy | # Housing Units | % Housing Units |
| Owner Occupied Housing Units | 39 | 100.0% |
| Renter-Occupied Housing Units | 0 | 0.0% |
| Total Occupied Housing Units | 39 | 100.0% |
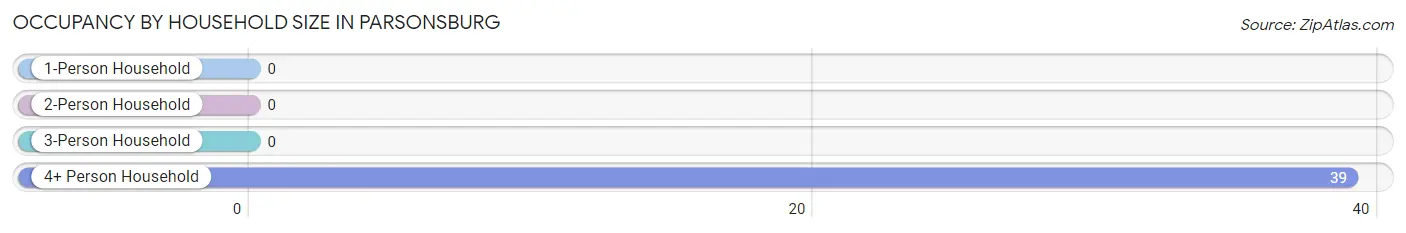
Occupancy by Household Size in Parsonsburg
| Household Size | # Housing Units | % Housing Units |
| 1-Person Household | 0 | 0.0% |
| 2-Person Household | 0 | 0.0% |
| 3-Person Household | 0 | 0.0% |
| 4+ Person Household | 39 | 100.0% |
| Total Housing Units | 39 | 100.0% |
Occupancy by Ownership by Household Size in Parsonsburg
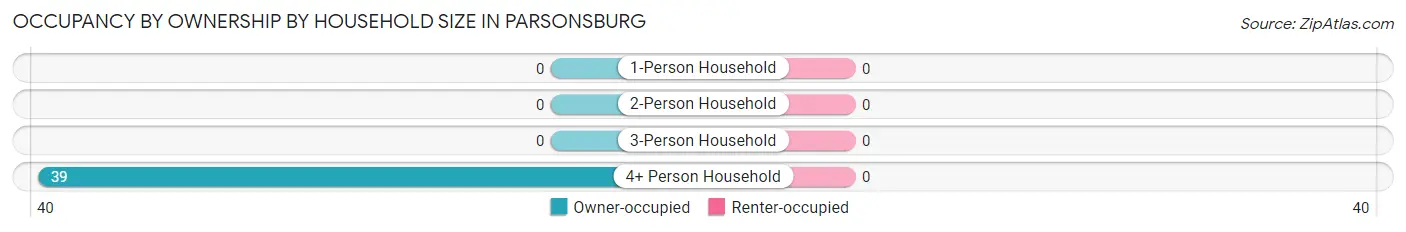
| Household Size | Owner-occupied | Renter-occupied |
| 1-Person Household | 0 (0.0%) | 0 (0.0%) |
| 2-Person Household | 0 (0.0%) | 0 (0.0%) |
| 3-Person Household | 0 (0.0%) | 0 (0.0%) |
| 4+ Person Household | 39 (100.0%) | 0 (0.0%) |
| Total Housing Units | 39 (100.0%) | 0 (0.0%) |
Occupancy by Educational Attainment in Parsonsburg
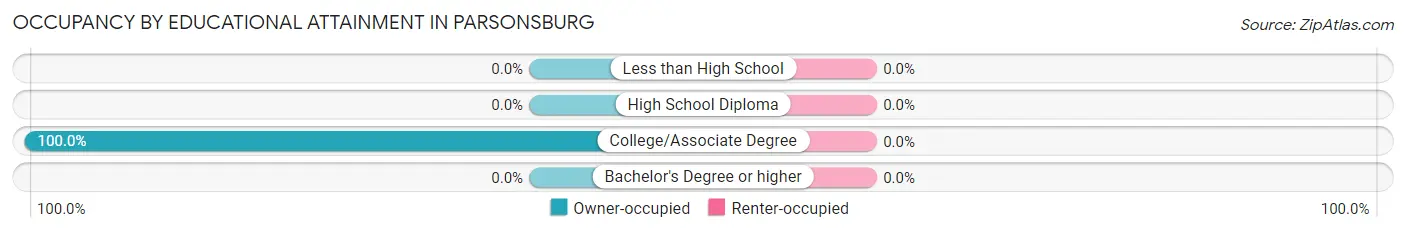
| Household Size | Owner-occupied | Renter-occupied |
| Less than High School | 0 (0.0%) | 0 (0.0%) |
| High School Diploma | 0 (0.0%) | 0 (0.0%) |
| College/Associate Degree | 39 (100.0%) | 0 (0.0%) |
| Bachelor's Degree or higher | 0 (0.0%) | 0 (0.0%) |
Occupancy by Age of Householder in Parsonsburg
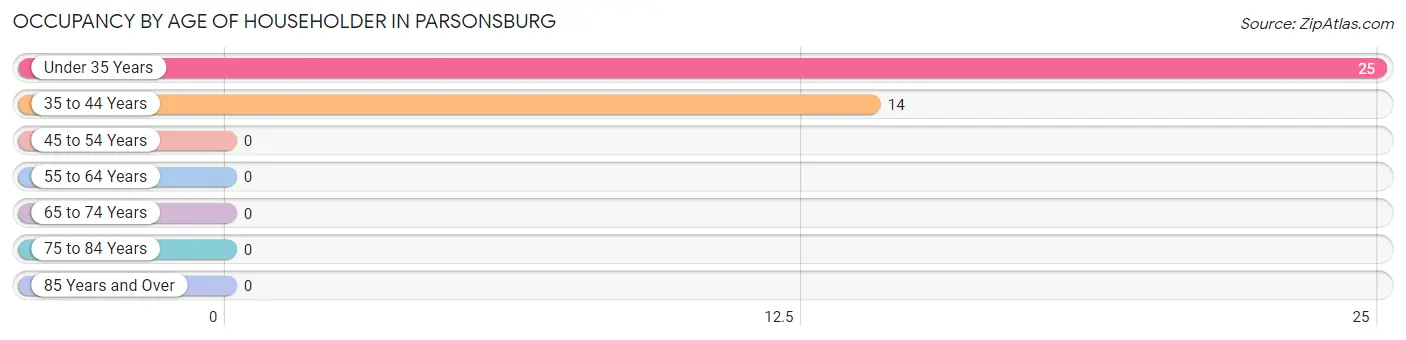
| Age Bracket | # Households | % Households |
| Under 35 Years | 25 | 64.1% |
| 35 to 44 Years | 14 | 35.9% |
| 45 to 54 Years | 0 | 0.0% |
| 55 to 64 Years | 0 | 0.0% |
| 65 to 74 Years | 0 | 0.0% |
| 75 to 84 Years | 0 | 0.0% |
| 85 Years and Over | 0 | 0.0% |
| Total | 39 | 100.0% |
Housing Finances in Parsonsburg
Median Income by Occupancy in Parsonsburg
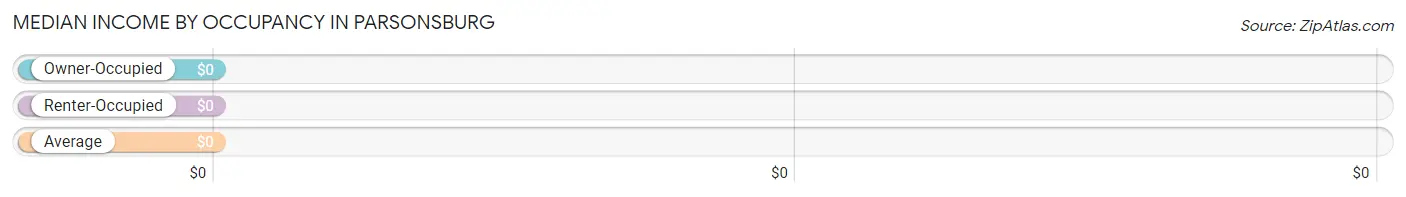
| Occupancy Type | # Households | Median Income |
| Owner-Occupied | 39 (100.0%) | $0 |
| Renter-Occupied | 0 (0.0%) | $0 |
| Average | 39 (100.0%) | $0 |
Occupancy by Householder Income Bracket in Parsonsburg
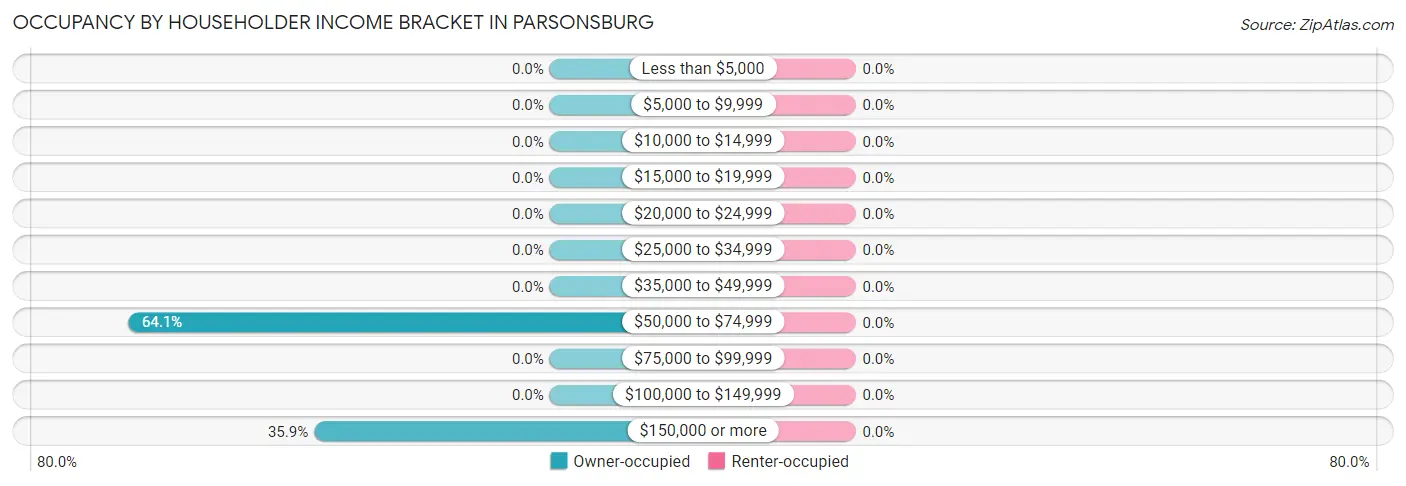
| Income Bracket | Owner-occupied | Renter-occupied |
| Less than $5,000 | 0 (0.0%) | 0 (0.0%) |
| $5,000 to $9,999 | 0 (0.0%) | 0 (0.0%) |
| $10,000 to $14,999 | 0 (0.0%) | 0 (0.0%) |
| $15,000 to $19,999 | 0 (0.0%) | 0 (0.0%) |
| $20,000 to $24,999 | 0 (0.0%) | 0 (0.0%) |
| $25,000 to $34,999 | 0 (0.0%) | 0 (0.0%) |
| $35,000 to $49,999 | 0 (0.0%) | 0 (0.0%) |
| $50,000 to $74,999 | 25 (64.1%) | 0 (0.0%) |
| $75,000 to $99,999 | 0 (0.0%) | 0 (0.0%) |
| $100,000 to $149,999 | 0 (0.0%) | 0 (0.0%) |
| $150,000 or more | 14 (35.9%) | 0 (0.0%) |
| Total | 39 (100.0%) | 0 (0.0%) |
Monthly Housing Cost Tiers in Parsonsburg
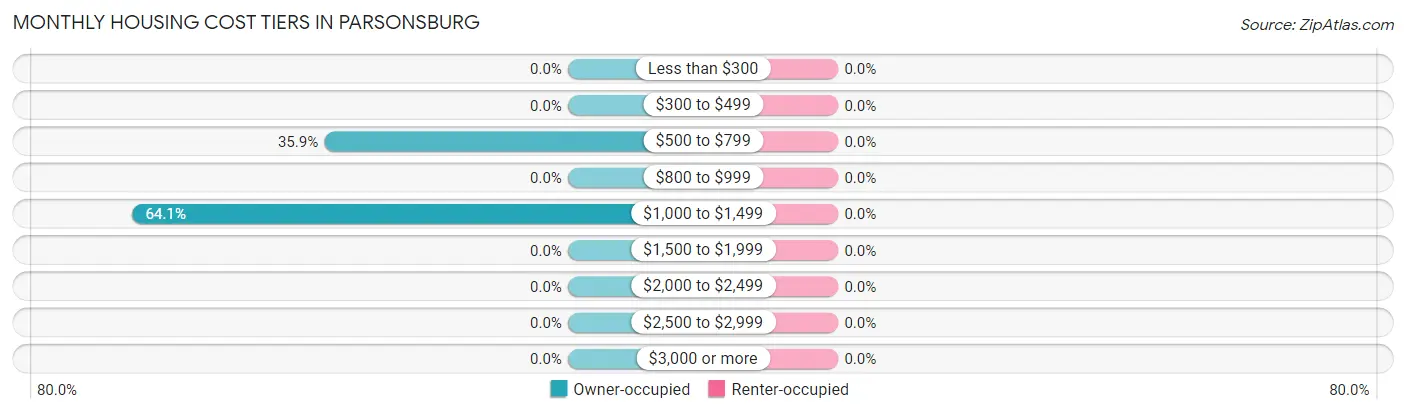
| Monthly Cost | Owner-occupied | Renter-occupied |
| Less than $300 | 0 (0.0%) | 0 (0.0%) |
| $300 to $499 | 0 (0.0%) | 0 (0.0%) |
| $500 to $799 | 14 (35.9%) | 0 (0.0%) |
| $800 to $999 | 0 (0.0%) | 0 (0.0%) |
| $1,000 to $1,499 | 25 (64.1%) | 0 (0.0%) |
| $1,500 to $1,999 | 0 (0.0%) | 0 (0.0%) |
| $2,000 to $2,499 | 0 (0.0%) | 0 (0.0%) |
| $2,500 to $2,999 | 0 (0.0%) | 0 (0.0%) |
| $3,000 or more | 0 (0.0%) | 0 (0.0%) |
| Total | 39 (100.0%) | 0 (0.0%) |
Physical Housing Characteristics in Parsonsburg
Housing Structures in Parsonsburg
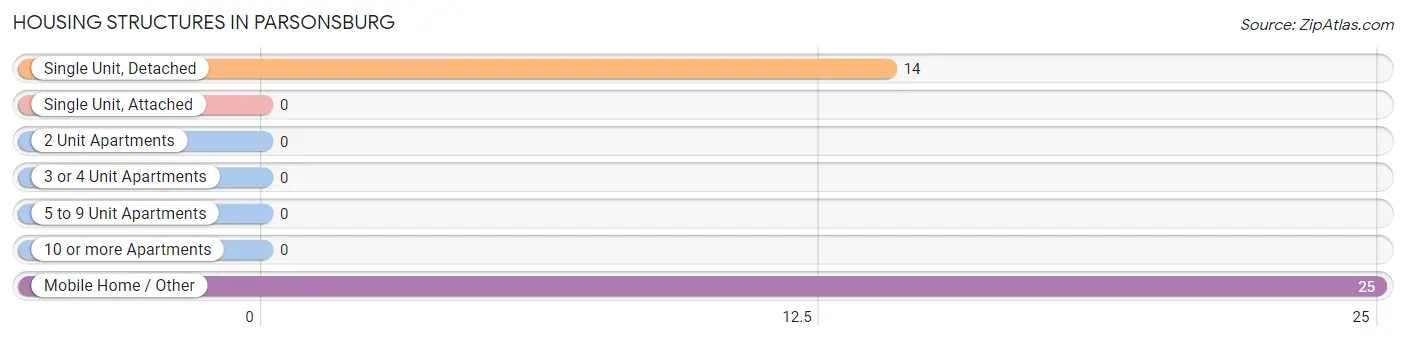
| Structure Type | # Housing Units | % Housing Units |
| Single Unit, Detached | 14 | 35.9% |
| Single Unit, Attached | 0 | 0.0% |
| 2 Unit Apartments | 0 | 0.0% |
| 3 or 4 Unit Apartments | 0 | 0.0% |
| 5 to 9 Unit Apartments | 0 | 0.0% |
| 10 or more Apartments | 0 | 0.0% |
| Mobile Home / Other | 25 | 64.1% |
| Total | 39 | 100.0% |
Housing Structures by Occupancy in Parsonsburg
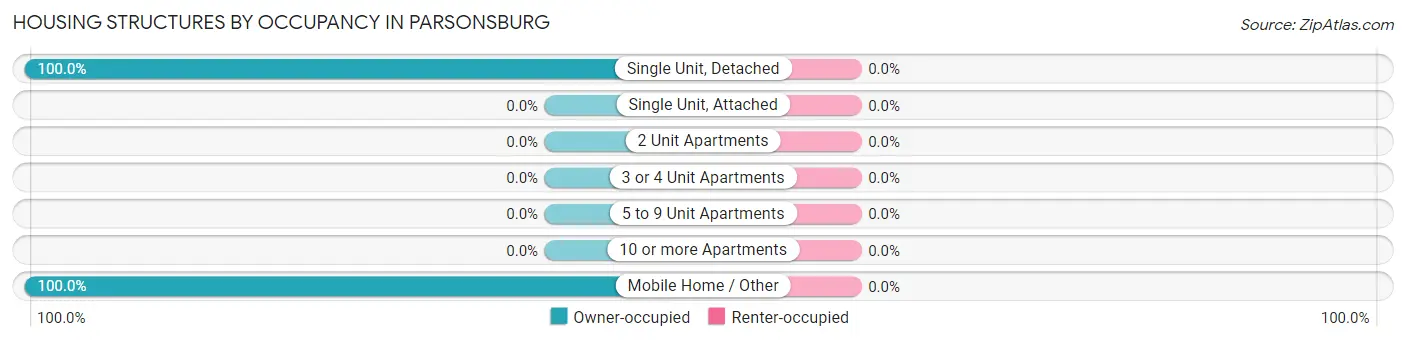
| Structure Type | Owner-occupied | Renter-occupied |
| Single Unit, Detached | 14 (100.0%) | 0 (0.0%) |
| Single Unit, Attached | 0 (0.0%) | 0 (0.0%) |
| 2 Unit Apartments | 0 (0.0%) | 0 (0.0%) |
| 3 or 4 Unit Apartments | 0 (0.0%) | 0 (0.0%) |
| 5 to 9 Unit Apartments | 0 (0.0%) | 0 (0.0%) |
| 10 or more Apartments | 0 (0.0%) | 0 (0.0%) |
| Mobile Home / Other | 25 (100.0%) | 0 (0.0%) |
| Total | 39 (100.0%) | 0 (0.0%) |
Housing Structures by Number of Rooms in Parsonsburg
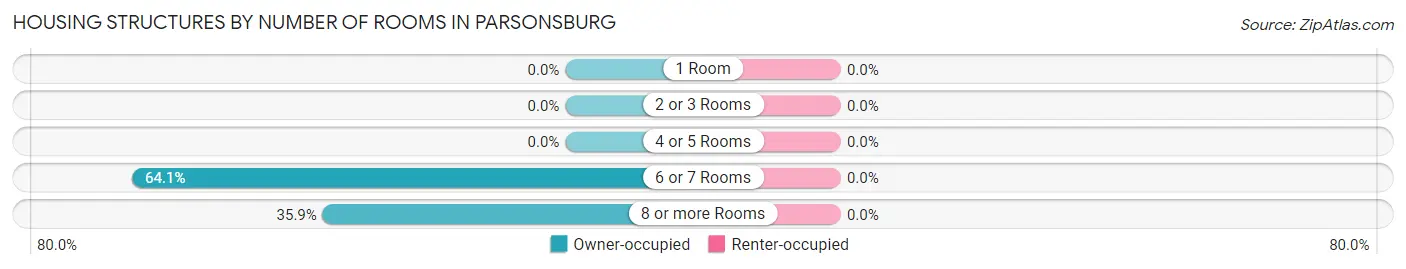
| Number of Rooms | Owner-occupied | Renter-occupied |
| 1 Room | 0 (0.0%) | 0 (0.0%) |
| 2 or 3 Rooms | 0 (0.0%) | 0 (0.0%) |
| 4 or 5 Rooms | 0 (0.0%) | 0 (0.0%) |
| 6 or 7 Rooms | 25 (64.1%) | 0 (0.0%) |
| 8 or more Rooms | 14 (35.9%) | 0 (0.0%) |
| Total | 39 (100.0%) | 0 (0.0%) |
Housing Structure by Heating Type in Parsonsburg
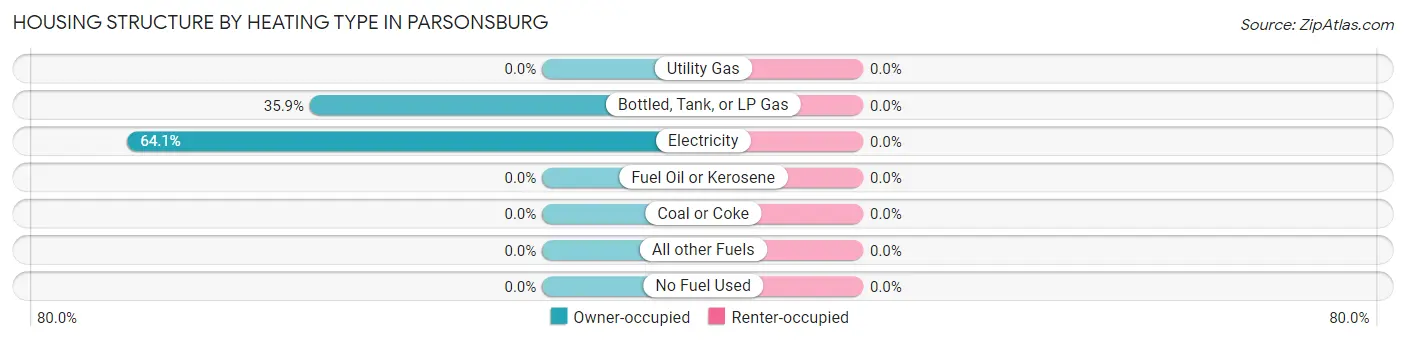
| Heating Type | Owner-occupied | Renter-occupied |
| Utility Gas | 0 (0.0%) | 0 (0.0%) |
| Bottled, Tank, or LP Gas | 14 (35.9%) | 0 (0.0%) |
| Electricity | 25 (64.1%) | 0 (0.0%) |
| Fuel Oil or Kerosene | 0 (0.0%) | 0 (0.0%) |
| Coal or Coke | 0 (0.0%) | 0 (0.0%) |
| All other Fuels | 0 (0.0%) | 0 (0.0%) |
| No Fuel Used | 0 (0.0%) | 0 (0.0%) |
| Total | 39 (100.0%) | 0 (0.0%) |
Household Vehicle Usage in Parsonsburg
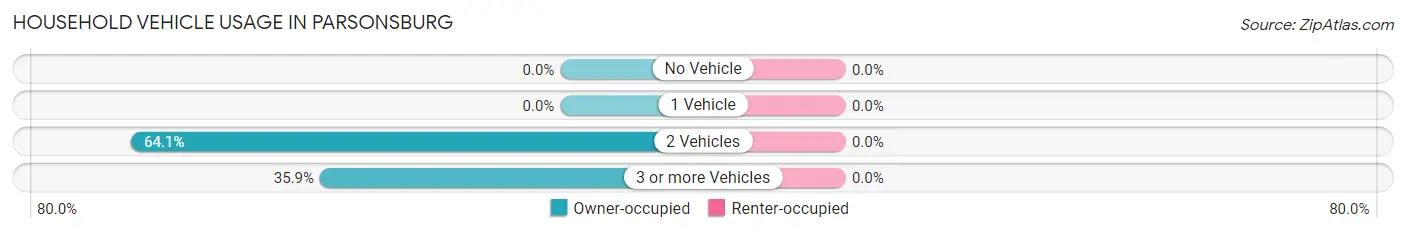
| Vehicles per Household | Owner-occupied | Renter-occupied |
| No Vehicle | 0 (0.0%) | 0 (0.0%) |
| 1 Vehicle | 0 (0.0%) | 0 (0.0%) |
| 2 Vehicles | 25 (64.1%) | 0 (0.0%) |
| 3 or more Vehicles | 14 (35.9%) | 0 (0.0%) |
| Total | 39 (100.0%) | 0 (0.0%) |
Real Estate & Mortgages in Parsonsburg
Real Estate and Mortgage Overview in Parsonsburg
| Characteristic | Without Mortgage | With Mortgage |
| Housing Units | 14 | 25 |
| Median Property Value | - | - |
| Median Household Income | - | - |
| Monthly Housing Costs | - | - |
| Real Estate Taxes | - | - |
Property Value by Mortgage Status in Parsonsburg
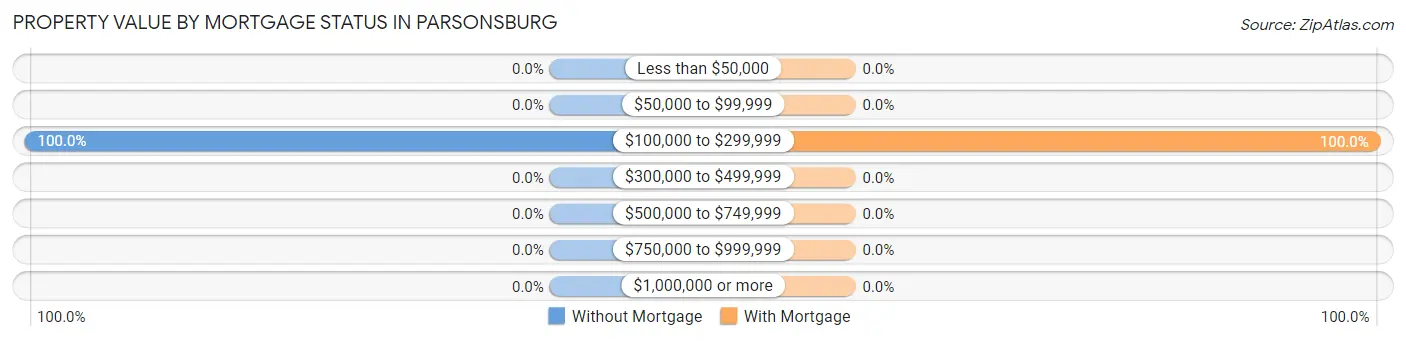
| Property Value | Without Mortgage | With Mortgage |
| Less than $50,000 | 0 (0.0%) | 0 (0.0%) |
| $50,000 to $99,999 | 0 (0.0%) | 0 (0.0%) |
| $100,000 to $299,999 | 14 (100.0%) | 25 (100.0%) |
| $300,000 to $499,999 | 0 (0.0%) | 0 (0.0%) |
| $500,000 to $749,999 | 0 (0.0%) | 0 (0.0%) |
| $750,000 to $999,999 | 0 (0.0%) | 0 (0.0%) |
| $1,000,000 or more | 0 (0.0%) | 0 (0.0%) |
| Total | 14 (100.0%) | 25 (100.0%) |
Household Income by Mortgage Status in Parsonsburg
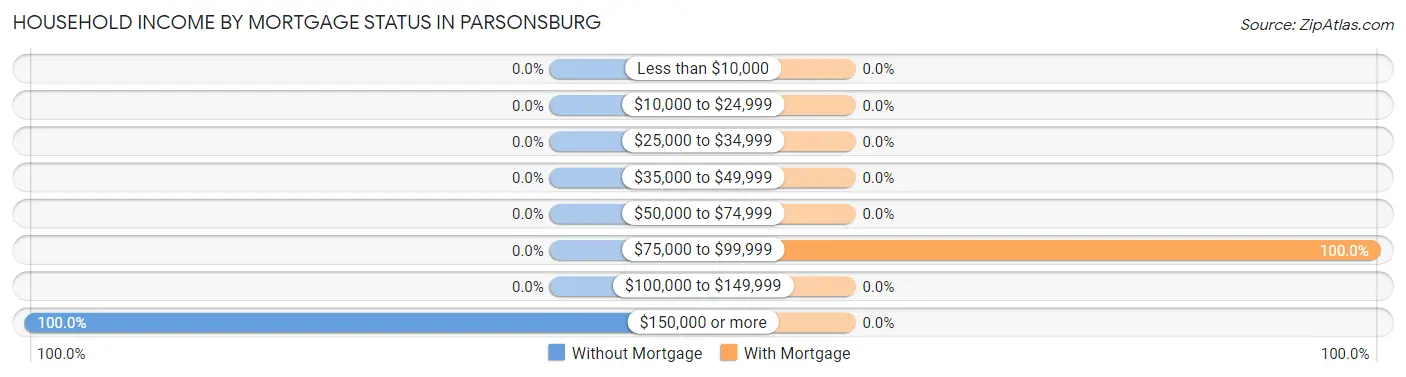
| Household Income | Without Mortgage | With Mortgage |
| Less than $10,000 | 0 (0.0%) | 0 (0.0%) |
| $10,000 to $24,999 | 0 (0.0%) | 0 (0.0%) |
| $25,000 to $34,999 | 0 (0.0%) | 0 (0.0%) |
| $35,000 to $49,999 | 0 (0.0%) | 0 (0.0%) |
| $50,000 to $74,999 | 0 (0.0%) | 0 (0.0%) |
| $75,000 to $99,999 | 0 (0.0%) | 25 (100.0%) |
| $100,000 to $149,999 | 0 (0.0%) | 0 (0.0%) |
| $150,000 or more | 14 (100.0%) | 0 (0.0%) |
| Total | 14 (100.0%) | 25 (100.0%) |
Property Value to Household Income Ratio in Parsonsburg
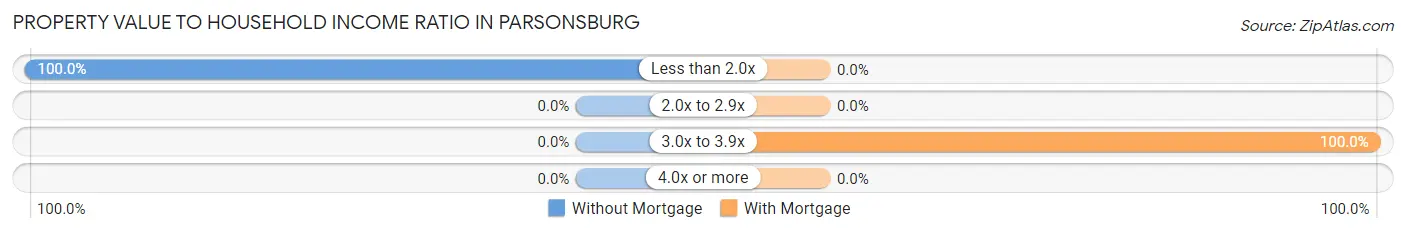
| Value-to-Income Ratio | Without Mortgage | With Mortgage |
| Less than 2.0x | 14 (100.0%) | 0 (0.0%) |
| 2.0x to 2.9x | 0 (0.0%) | 0 (0.0%) |
| 3.0x to 3.9x | 0 (0.0%) | 25 (100.0%) |
| 4.0x or more | 0 (0.0%) | 0 (0.0%) |
| Total | 14 (100.0%) | 25 (100.0%) |
Real Estate Taxes by Mortgage Status in Parsonsburg
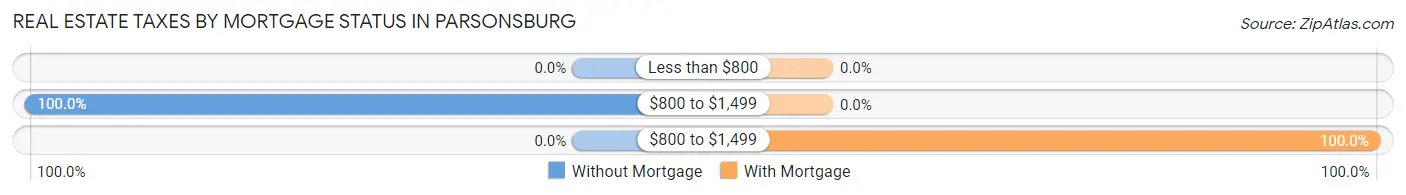
| Property Taxes | Without Mortgage | With Mortgage |
| Less than $800 | 0 (0.0%) | 0 (0.0%) |
| $800 to $1,499 | 14 (100.0%) | 0 (0.0%) |
| $800 to $1,499 | 0 (0.0%) | 25 (100.0%) |
| Total | 14 (100.0%) | 25 (100.0%) |
Health & Disability in Parsonsburg
Health Insurance Coverage by Age in Parsonsburg
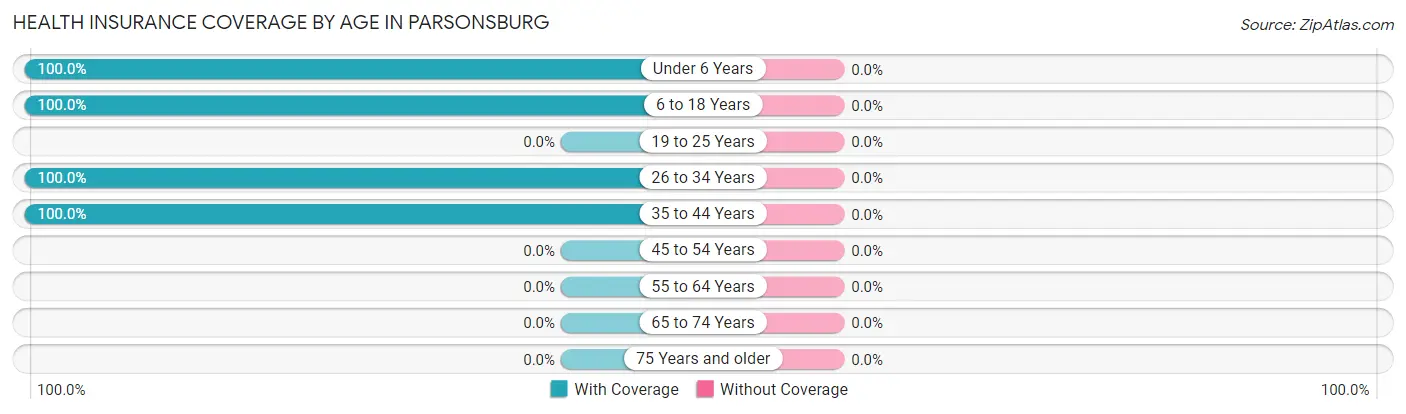
| Age Bracket | With Coverage | Without Coverage |
| Under 6 Years | 59 (100.0%) | 0 (0.0%) |
| 6 to 18 Years | 69 (100.0%) | 0 (0.0%) |
| 19 to 25 Years | 0 (0.0%) | 0 (0.0%) |
| 26 to 34 Years | 43 (100.0%) | 0 (0.0%) |
| 35 to 44 Years | 29 (100.0%) | 0 (0.0%) |
| 45 to 54 Years | 0 (0.0%) | 0 (0.0%) |
| 55 to 64 Years | 0 (0.0%) | 0 (0.0%) |
| 65 to 74 Years | 0 (0.0%) | 0 (0.0%) |
| 75 Years and older | 0 (0.0%) | 0 (0.0%) |
| Total | 200 (100.0%) | 0 (0.0%) |
Health Insurance Coverage by Citizenship Status in Parsonsburg
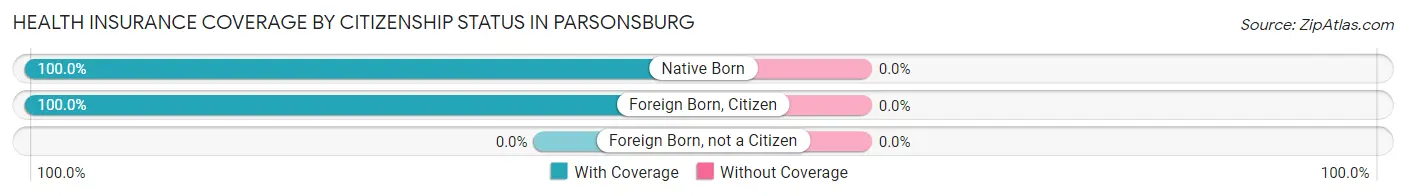
| Citizenship Status | With Coverage | Without Coverage |
| Native Born | 59 (100.0%) | 0 (0.0%) |
| Foreign Born, Citizen | 69 (100.0%) | 0 (0.0%) |
| Foreign Born, not a Citizen | 0 (0.0%) | 0 (0.0%) |
Health Insurance Coverage by Household Income in Parsonsburg
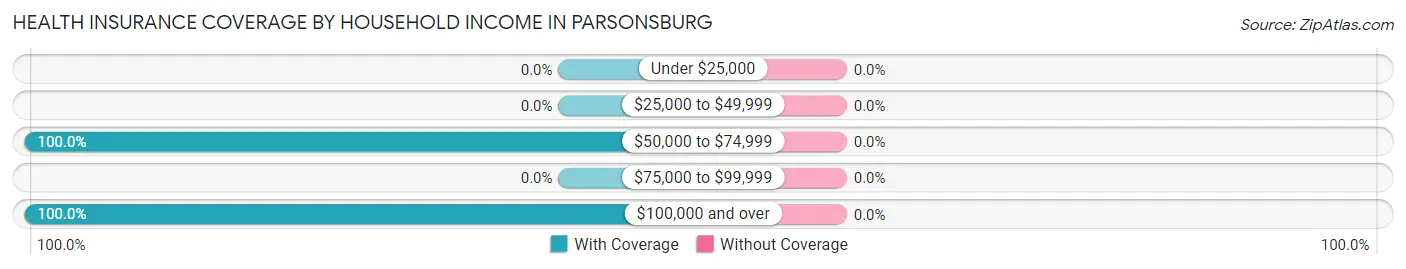
| Household Income | With Coverage | Without Coverage |
| Under $25,000 | 0 (0.0%) | 0 (0.0%) |
| $25,000 to $49,999 | 0 (0.0%) | 0 (0.0%) |
| $50,000 to $74,999 | 111 (100.0%) | 0 (0.0%) |
| $75,000 to $99,999 | 0 (0.0%) | 0 (0.0%) |
| $100,000 and over | 89 (100.0%) | 0 (0.0%) |
Public vs Private Health Insurance Coverage by Age in Parsonsburg
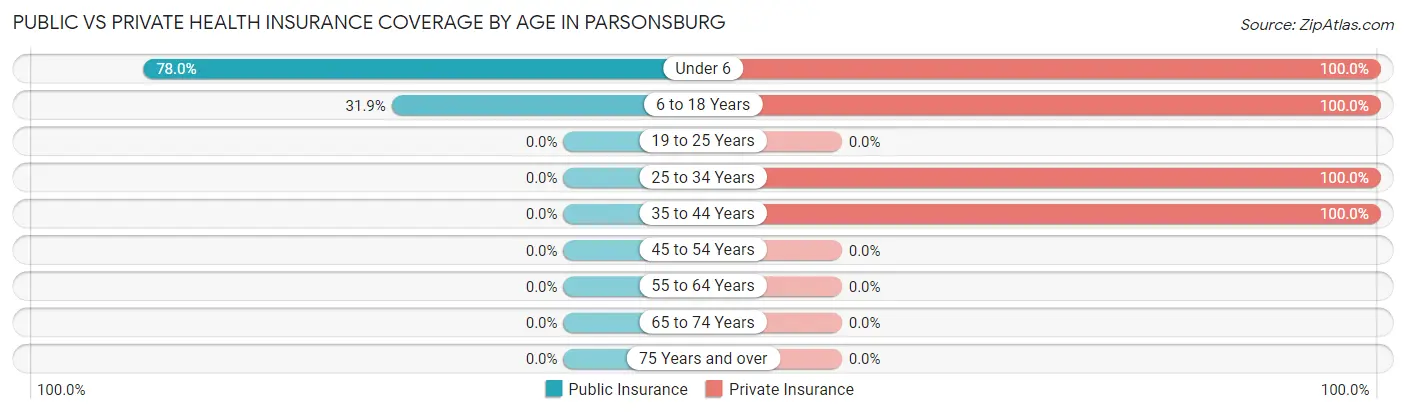
| Age Bracket | Public Insurance | Private Insurance |
| Under 6 | 46 (78.0%) | 59 (100.0%) |
| 6 to 18 Years | 22 (31.9%) | 69 (100.0%) |
| 19 to 25 Years | 0 (0.0%) | 0 (0.0%) |
| 25 to 34 Years | 0 (0.0%) | 43 (100.0%) |
| 35 to 44 Years | 0 (0.0%) | 29 (100.0%) |
| 45 to 54 Years | 0 (0.0%) | 0 (0.0%) |
| 55 to 64 Years | 0 (0.0%) | 0 (0.0%) |
| 65 to 74 Years | 0 (0.0%) | 0 (0.0%) |
| 75 Years and over | 0 (0.0%) | 0 (0.0%) |
| Total | 68 (34.0%) | 200 (100.0%) |
Disability Status by Sex by Age in Parsonsburg
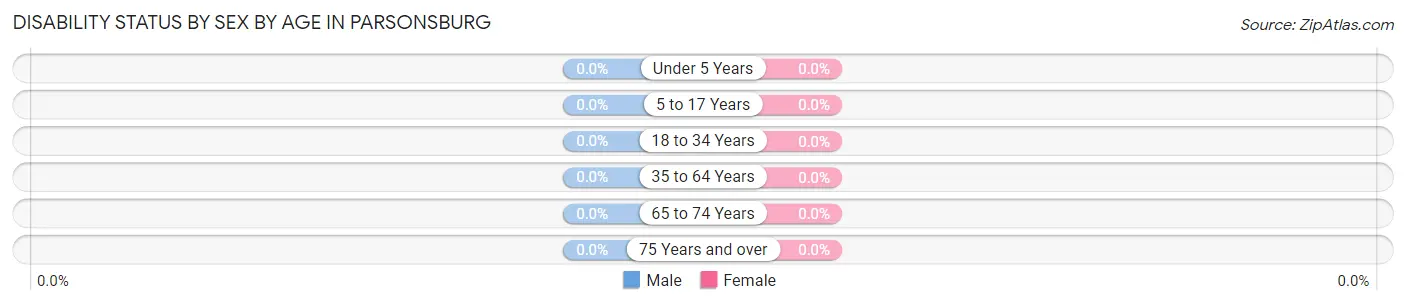
| Age Bracket | Male | Female |
| Under 5 Years | 0 (0.0%) | 0 (0.0%) |
| 5 to 17 Years | 0 (0.0%) | 0 (0.0%) |
| 18 to 34 Years | 0 (0.0%) | 0 (0.0%) |
| 35 to 64 Years | 0 (0.0%) | 0 (0.0%) |
| 65 to 74 Years | 0 (0.0%) | 0 (0.0%) |
| 75 Years and over | 0 (0.0%) | 0 (0.0%) |
Disability Class by Sex by Age in Parsonsburg
Disability Class: Hearing Difficulty
| Age Bracket | Male | Female |
| Under 5 Years | 0 (0.0%) | 0 (0.0%) |
| 5 to 17 Years | 0 (0.0%) | 0 (0.0%) |
| 18 to 34 Years | 0 (0.0%) | 0 (0.0%) |
| 35 to 64 Years | 0 (0.0%) | 0 (0.0%) |
| 65 to 74 Years | 0 (0.0%) | 0 (0.0%) |
| 75 Years and over | 0 (0.0%) | 0 (0.0%) |
Disability Class: Vision Difficulty
| Age Bracket | Male | Female |
| Under 5 Years | 0 (0.0%) | 0 (0.0%) |
| 5 to 17 Years | 0 (0.0%) | 0 (0.0%) |
| 18 to 34 Years | 0 (0.0%) | 0 (0.0%) |
| 35 to 64 Years | 0 (0.0%) | 0 (0.0%) |
| 65 to 74 Years | 0 (0.0%) | 0 (0.0%) |
| 75 Years and over | 0 (0.0%) | 0 (0.0%) |
Disability Class: Cognitive Difficulty
| Age Bracket | Male | Female |
| 5 to 17 Years | 0 (0.0%) | 0 (0.0%) |
| 18 to 34 Years | 0 (0.0%) | 0 (0.0%) |
| 35 to 64 Years | 0 (0.0%) | 0 (0.0%) |
| 65 to 74 Years | 0 (0.0%) | 0 (0.0%) |
| 75 Years and over | 0 (0.0%) | 0 (0.0%) |
Disability Class: Ambulatory Difficulty
| Age Bracket | Male | Female |
| 5 to 17 Years | 0 (0.0%) | 0 (0.0%) |
| 18 to 34 Years | 0 (0.0%) | 0 (0.0%) |
| 35 to 64 Years | 0 (0.0%) | 0 (0.0%) |
| 65 to 74 Years | 0 (0.0%) | 0 (0.0%) |
| 75 Years and over | 0 (0.0%) | 0 (0.0%) |
Disability Class: Self-Care Difficulty

| Age Bracket | Male | Female |
| 5 to 17 Years | 0 (0.0%) | 0 (0.0%) |
| 18 to 34 Years | 0 (0.0%) | 0 (0.0%) |
| 35 to 64 Years | 0 (0.0%) | 0 (0.0%) |
| 65 to 74 Years | 0 (0.0%) | 0 (0.0%) |
| 75 Years and over | 0 (0.0%) | 0 (0.0%) |
Technology Access in Parsonsburg
Computing Device Access in Parsonsburg
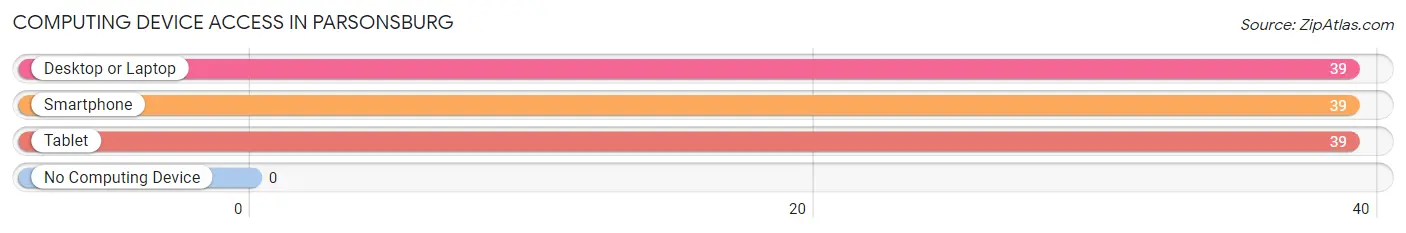
| Device Type | # Households | % Households |
| Desktop or Laptop | 39 | 100.0% |
| Smartphone | 39 | 100.0% |
| Tablet | 39 | 100.0% |
| No Computing Device | 0 | 0.0% |
| Total | 39 | 100.0% |
Internet Access in Parsonsburg
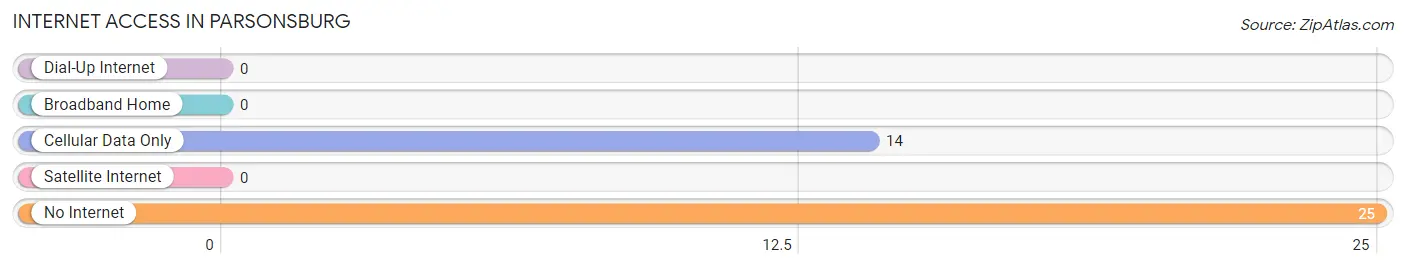
| Internet Type | # Households | % Households |
| Dial-Up Internet | 0 | 0.0% |
| Broadband Home | 0 | 0.0% |
| Cellular Data Only | 14 | 35.9% |
| Satellite Internet | 0 | 0.0% |
| No Internet | 25 | 64.1% |
| Total | 39 | 100.0% |
Parsonsburg Summary
Parsonsburg is a small town located in Wicomico County, Maryland. It is situated on the Eastern Shore of the Chesapeake Bay, approximately 10 miles south of Salisbury. The town has a population of 1,845 people, according to the 2010 census.
History
Parsonsburg was first settled in the early 1700s by the Parsons family, who were among the first settlers in the area. The town was originally known as Parsonsburg, but the name was changed to Parsonsburg in 1867. The town was incorporated in 1872.
The town was a major agricultural center in the 19th century, with many farms and orchards in the area. The town was also home to several mills, including a grist mill, a saw mill, and a paper mill.
Geography
Parsonsburg is located in the Eastern Shore region of Maryland, approximately 10 miles south of Salisbury. The town is situated on the Eastern Shore of the Chesapeake Bay, and is bordered by the towns of Hebron, Pittsville, and Willards. The town is located in a rural area, with many farms and orchards in the surrounding area.
Economy
The economy of Parsonsburg is largely based on agriculture. The town is home to several farms and orchards, and is a major producer of apples, peaches, and other fruits. The town is also home to several businesses, including a grocery store, a hardware store, and a restaurant.
Demographics
According to the 2010 census, the population of Parsonsburg was 1,845 people. The racial makeup of the town was 94.3% White, 2.7% African American, 0.3% Native American, 0.7% Asian, 0.1% Pacific Islander, 0.7% from other races, and 1.2% from two or more races. Hispanic or Latino of any race were 1.7% of the population.
The median household income in Parsonsburg was $45,938, and the median family income was $51,250. The per capita income for the town was $20,945. About 8.3% of families and 10.2% of the population were below the poverty line, including 14.2% of those under age 18 and 8.3% of those age 65 or over.
Common Questions
What is Per Capita Income in Parsonsburg?
Per Capita income in Parsonsburg is $32,093.
What is Inequality or Gini Index in Parsonsburg?
Inequality or Gini Index in Parsonsburg is 0.41.
What is the Total Population of Parsonsburg?
Total Population of Parsonsburg is 200.
What is the Total Male Population of Parsonsburg?
Total Male Population of Parsonsburg is 134.
What is the Total Female Population of Parsonsburg?
Total Female Population of Parsonsburg is 66.
What is the Ratio of Males per 100 Females in Parsonsburg?
There are 203.03 Males per 100 Females in Parsonsburg.
What is the Ratio of Females per 100 Males in Parsonsburg?
There are 49.25 Females per 100 Males in Parsonsburg.
What is the Median Population Age in Parsonsburg?
Median Population Age in Parsonsburg is 12.4 Years.
What is the Average Family Size in Parsonsburg
Average Family Size in Parsonsburg is 5.1 People.
What is the Average Household Size in Parsonsburg
Average Household Size in Parsonsburg is 5.1 People.
How Large is the Labor Force in Parsonsburg?
There are 91 People in the Labor Forcein in Parsonsburg.
What is the Percentage of People in the Labor Force in Parsonsburg?
100.0% of People are in the Labor Force in Parsonsburg.