St James, MD Map & Demographics
St James Map
St James Overview
$42,143
PER CAPITA INCOME
$125,324
AVG FAMILY INCOME
$105,962
AVG HOUSEHOLD INCOME
39.0%
WAGE / INCOME GAP [ % ]
61.0¢/ $1
WAGE / INCOME GAP [ $ ]
0.33
INEQUALITY / GINI INDEX
4,106
TOTAL POPULATION
2,032
MALE POPULATION
2,074
FEMALE POPULATION
97.97
MALES / 100 FEMALES
102.07
FEMALES / 100 MALES
43.2
MEDIAN AGE
3.0
AVG FAMILY SIZE
2.6
AVG HOUSEHOLD SIZE
2,155
LABOR FORCE [ PEOPLE ]
66.2%
PERCENT IN LABOR FORCE
0.5%
UNEMPLOYMENT RATE
St James Area Codes
Income in St James
Income Overview in St James
Per Capita Income in St James is $42,143, while median incomes of families and households are $125,324 and $105,962 respectively.
| Characteristic | Number | Measure |
| Per Capita Income | 4,106 | $42,143 |
| Median Family Income | 1,204 | $125,324 |
| Mean Family Income | 1,204 | $122,221 |
| Median Household Income | 1,570 | $105,962 |
| Mean Household Income | 1,570 | $108,891 |
| Income Deficit | 1,204 | $0 |
| Wage / Income Gap (%) | 4,106 | 38.96% |
| Wage / Income Gap ($) | 4,106 | 61.04¢ per $1 |
| Gini / Inequality Index | 4,106 | 0.33 |
Earnings by Sex in St James
Average Earnings in St James are $59,485, $71,678 for men and $43,750 for women, a difference of 39.0%.
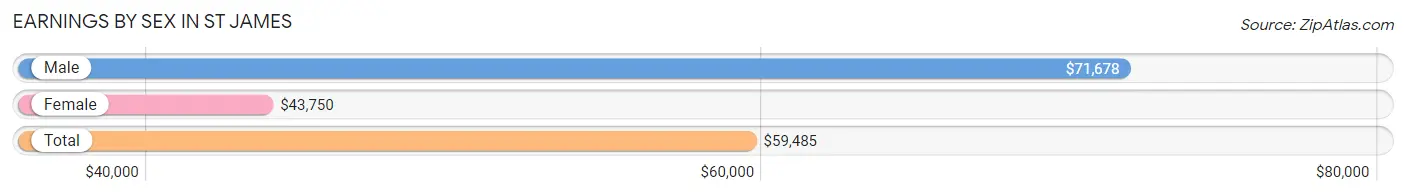
| Sex | Number | Average Earnings |
| Male | 1,274 (58.4%) | $71,678 |
| Female | 906 (41.6%) | $43,750 |
| Total | 2,180 (100.0%) | $59,485 |
Earnings by Sex by Income Bracket in St James
The most common earnings brackets in St James are $100,000+ for men (306 | 24.0%) and $55,000 to $64,999 for women (137 | 15.1%).
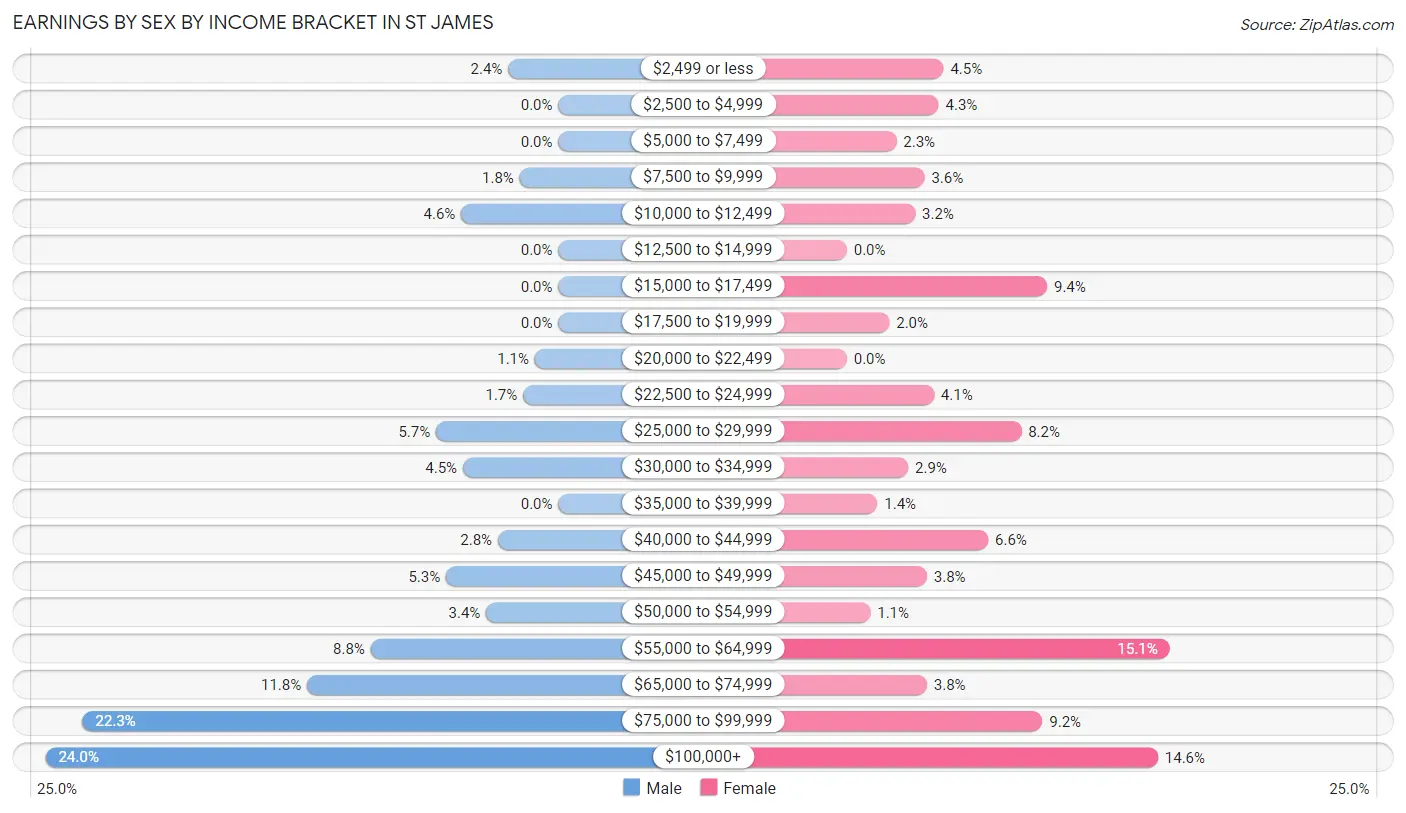
| Income | Male | Female |
| $2,499 or less | 30 (2.4%) | 41 (4.5%) |
| $2,500 to $4,999 | 0 (0.0%) | 39 (4.3%) |
| $5,000 to $7,499 | 0 (0.0%) | 21 (2.3%) |
| $7,500 to $9,999 | 23 (1.8%) | 33 (3.6%) |
| $10,000 to $12,499 | 58 (4.5%) | 29 (3.2%) |
| $12,500 to $14,999 | 0 (0.0%) | 0 (0.0%) |
| $15,000 to $17,499 | 0 (0.0%) | 85 (9.4%) |
| $17,500 to $19,999 | 0 (0.0%) | 18 (2.0%) |
| $20,000 to $22,499 | 14 (1.1%) | 0 (0.0%) |
| $22,500 to $24,999 | 21 (1.7%) | 37 (4.1%) |
| $25,000 to $29,999 | 73 (5.7%) | 74 (8.2%) |
| $30,000 to $34,999 | 57 (4.5%) | 26 (2.9%) |
| $35,000 to $39,999 | 0 (0.0%) | 13 (1.4%) |
| $40,000 to $44,999 | 36 (2.8%) | 60 (6.6%) |
| $45,000 to $49,999 | 67 (5.3%) | 34 (3.7%) |
| $50,000 to $54,999 | 43 (3.4%) | 10 (1.1%) |
| $55,000 to $64,999 | 112 (8.8%) | 137 (15.1%) |
| $65,000 to $74,999 | 150 (11.8%) | 34 (3.7%) |
| $75,000 to $99,999 | 284 (22.3%) | 83 (9.2%) |
| $100,000+ | 306 (24.0%) | 132 (14.6%) |
| Total | 1,274 (100.0%) | 906 (100.0%) |
Earnings by Sex by Educational Attainment in St James
Average earnings in St James are $78,287 for men and $55,919 for women, a difference of 28.6%. Men with an educational attainment of graduate degree enjoy the highest average annual earnings of $115,313, while those with college or associate's degree education earn the least with $48,819. Women with an educational attainment of graduate degree earn the most with the average annual earnings of $61,853, while those with college or associate's degree education have the smallest earnings of $26,995.
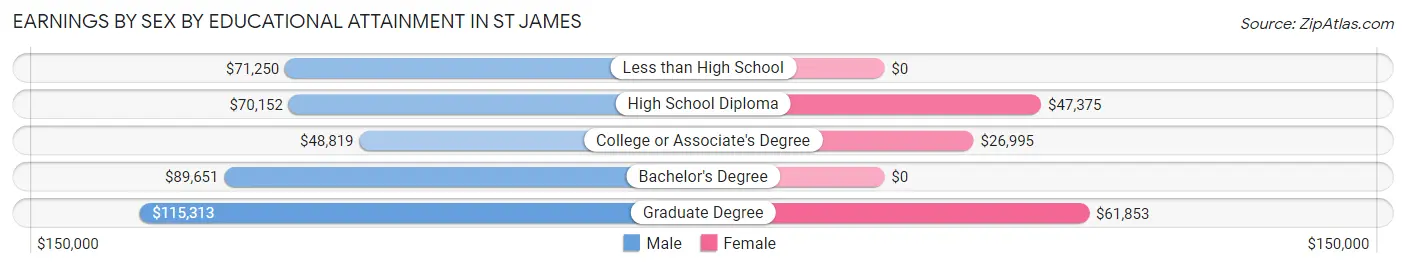
| Educational Attainment | Male Income | Female Income |
| Less than High School | $71,250 | $0 |
| High School Diploma | $70,152 | $47,375 |
| College or Associate's Degree | $48,819 | $26,995 |
| Bachelor's Degree | $89,651 | $0 |
| Graduate Degree | $115,313 | $61,853 |
| Total | $78,287 | $55,919 |
Family Income in St James
Family Income Brackets in St James
According to the St James family income data, there are 354 families falling into the $100,000 to $149,999 income range, which is the most common income bracket and makes up 29.4% of all families.
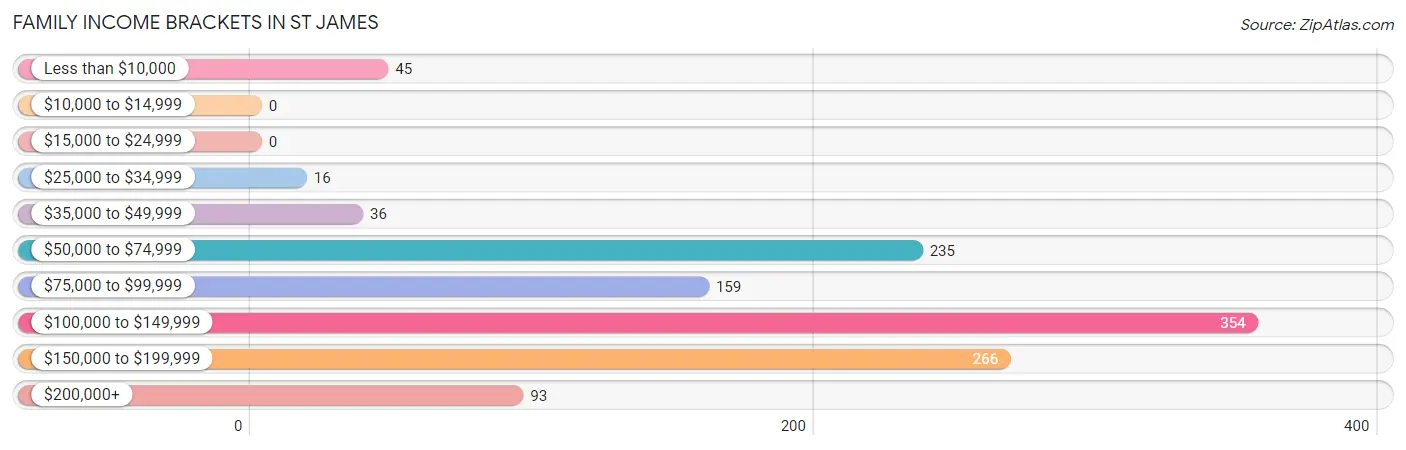
| Income Bracket | # Families | % Families |
| Less than $10,000 | 45 | 3.7% |
| $10,000 to $14,999 | 0 | 0.0% |
| $15,000 to $24,999 | 0 | 0.0% |
| $25,000 to $34,999 | 16 | 1.3% |
| $35,000 to $49,999 | 36 | 3.0% |
| $50,000 to $74,999 | 235 | 19.5% |
| $75,000 to $99,999 | 159 | 13.2% |
| $100,000 to $149,999 | 354 | 29.4% |
| $150,000 to $199,999 | 266 | 22.1% |
| $200,000+ | 93 | 7.7% |
Family Income by Famaliy Size in St James
5-person families (144 | 12.0%) account for the highest median family income in St James with $197,576 per family, while 4-person families (358 | 29.7%) have the highest median income of $43,808 per family member.
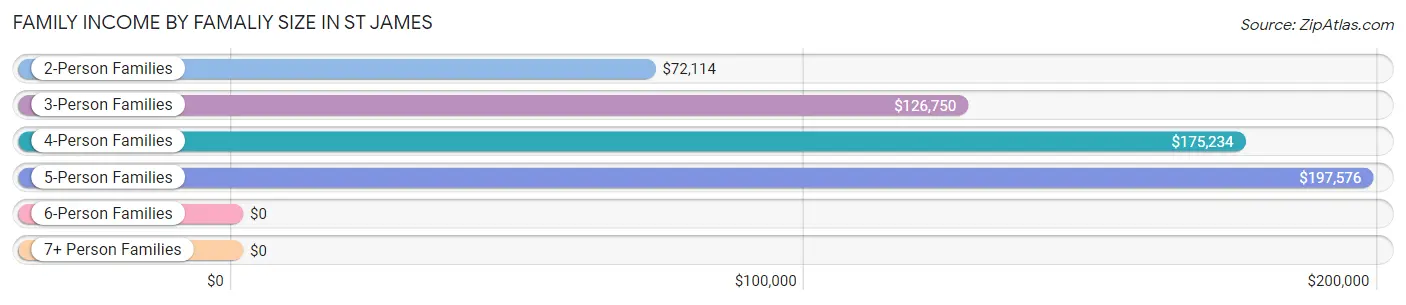
| Income Bracket | # Families | Median Income |
| 2-Person Families | 540 (44.9%) | $72,114 |
| 3-Person Families | 105 (8.7%) | $126,750 |
| 4-Person Families | 358 (29.7%) | $175,234 |
| 5-Person Families | 144 (12.0%) | $197,576 |
| 6-Person Families | 57 (4.7%) | $0 |
| 7+ Person Families | 0 (0.0%) | $0 |
| Total | 1,204 (100.0%) | $125,324 |
Family Income by Number of Earners in St James
The median family income in St James is $125,324, with families comprising 3+ earners (115) having the highest median family income of $168,405, while families with 1 earner (311) have the lowest median family income of $71,108, accounting for 9.6% and 25.8% of families, respectively.
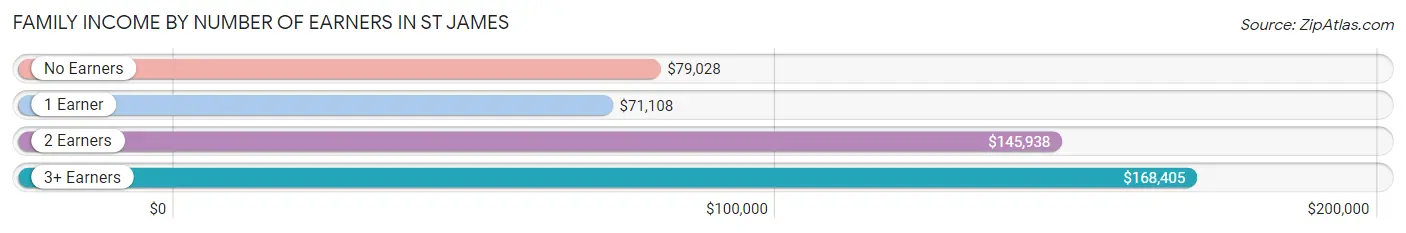
| Number of Earners | # Families | Median Income |
| No Earners | 177 (14.7%) | $79,028 |
| 1 Earner | 311 (25.8%) | $71,108 |
| 2 Earners | 601 (49.9%) | $145,938 |
| 3+ Earners | 115 (9.6%) | $168,405 |
| Total | 1,204 (100.0%) | $125,324 |
Household Income in St James
Household Income Brackets in St James
With 429 households falling in the category, the $100,000 to $149,999 income range is the most frequent in St James, accounting for 27.3% of all households.
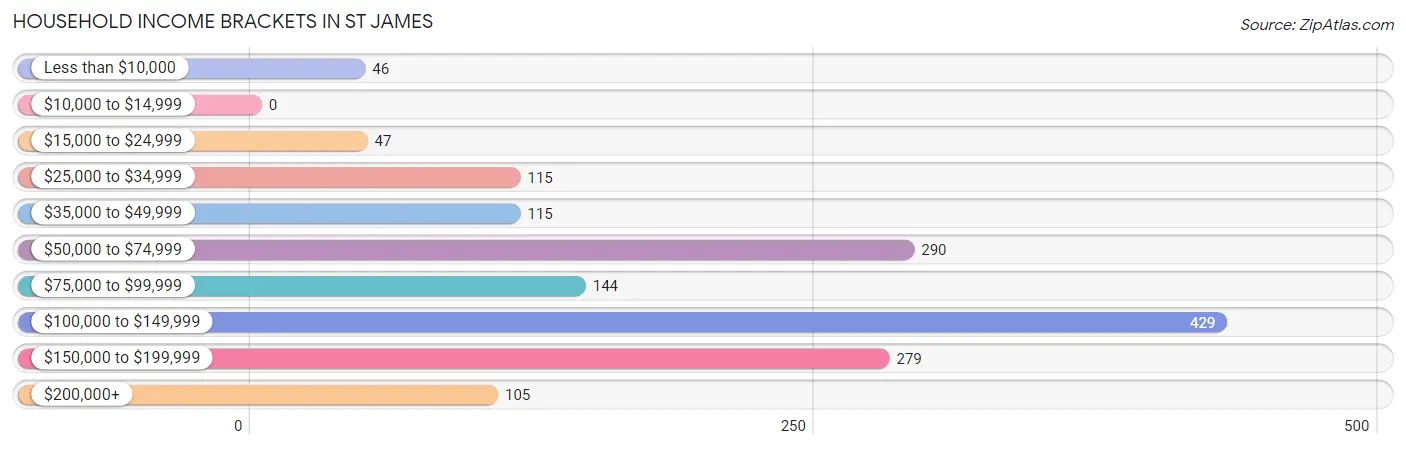
| Income Bracket | # Households | % Households |
| Less than $10,000 | 46 | 2.9% |
| $10,000 to $14,999 | 0 | 0.0% |
| $15,000 to $24,999 | 47 | 3.0% |
| $25,000 to $34,999 | 115 | 7.3% |
| $35,000 to $49,999 | 115 | 7.3% |
| $50,000 to $74,999 | 290 | 18.5% |
| $75,000 to $99,999 | 144 | 9.2% |
| $100,000 to $149,999 | 429 | 27.3% |
| $150,000 to $199,999 | 279 | 17.8% |
| $200,000+ | 105 | 6.7% |
Household Income by Householder Age in St James
The median household income in St James is $105,962, with the highest median household income of $140,700 found in the 45 to 64 years age bracket for the primary householder. A total of 686 households (43.7%) fall into this category.
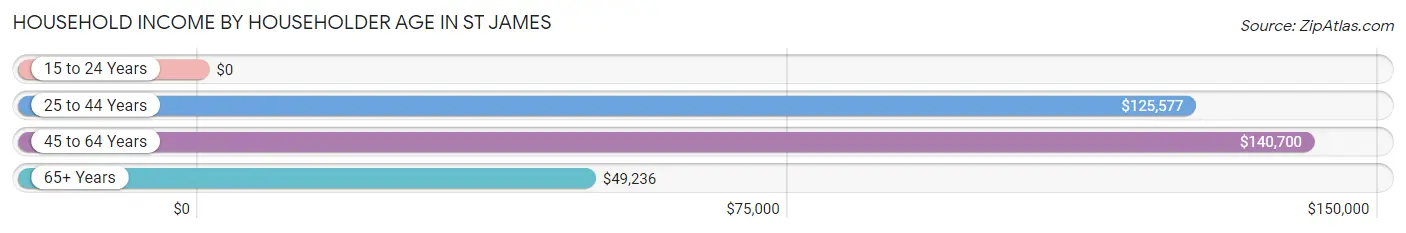
| Income Bracket | # Households | Median Income |
| 15 to 24 Years | 0 (0.0%) | $0 |
| 25 to 44 Years | 492 (31.3%) | $125,577 |
| 45 to 64 Years | 686 (43.7%) | $140,700 |
| 65+ Years | 392 (25.0%) | $49,236 |
| Total | 1,570 (100.0%) | $105,962 |
Poverty in St James
Income Below Poverty by Sex and Age in St James
With 1.9% poverty level for males and 3.2% for females among the residents of St James, 65 to 74 year old males and 18 to 24 year old females are the most vulnerable to poverty, with 19 males (17.8%) and 21 females (12.1%) in their respective age groups living below the poverty level.
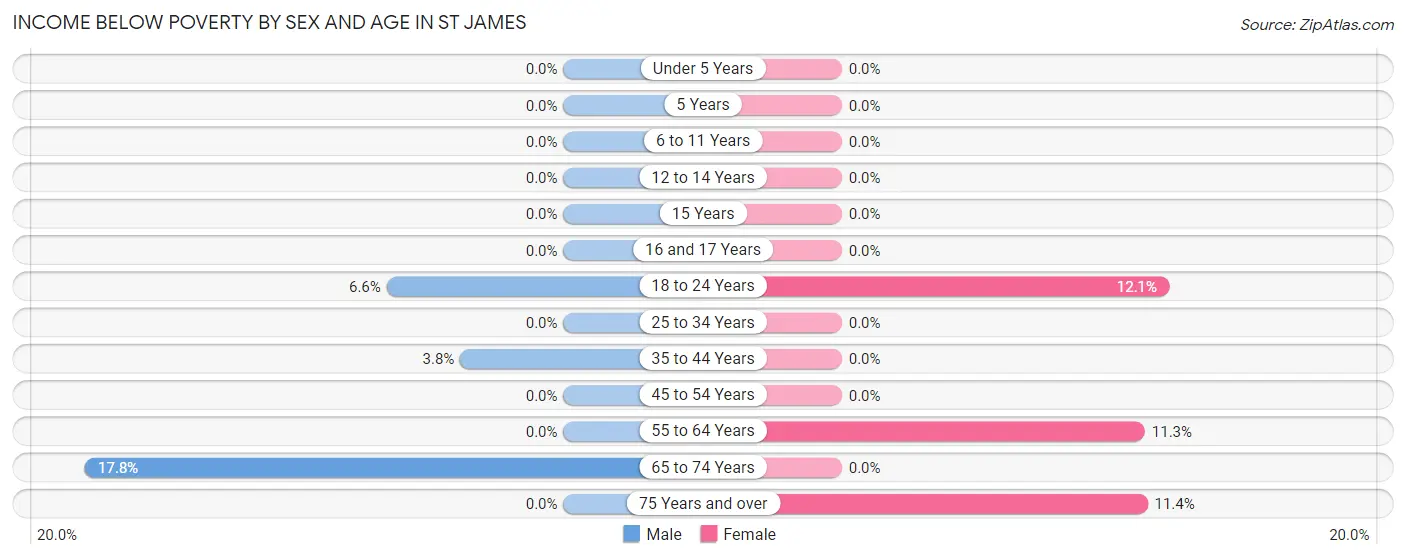
| Age Bracket | Male | Female |
| Under 5 Years | 0 (0.0%) | 0 (0.0%) |
| 5 Years | 0 (0.0%) | 0 (0.0%) |
| 6 to 11 Years | 0 (0.0%) | 0 (0.0%) |
| 12 to 14 Years | 0 (0.0%) | 0 (0.0%) |
| 15 Years | 0 (0.0%) | 0 (0.0%) |
| 16 and 17 Years | 0 (0.0%) | 0 (0.0%) |
| 18 to 24 Years | 8 (6.6%) | 21 (12.1%) |
| 25 to 34 Years | 0 (0.0%) | 0 (0.0%) |
| 35 to 44 Years | 11 (3.8%) | 0 (0.0%) |
| 45 to 54 Years | 0 (0.0%) | 0 (0.0%) |
| 55 to 64 Years | 0 (0.0%) | 18 (11.3%) |
| 65 to 74 Years | 19 (17.8%) | 0 (0.0%) |
| 75 Years and over | 0 (0.0%) | 26 (11.4%) |
| Total | 38 (1.9%) | 65 (3.2%) |
Income Above Poverty by Sex and Age in St James
According to the poverty statistics in St James, males aged under 5 years and females aged under 5 years are the age groups that are most secure financially, with 100.0% of males and 100.0% of females in these age groups living above the poverty line.
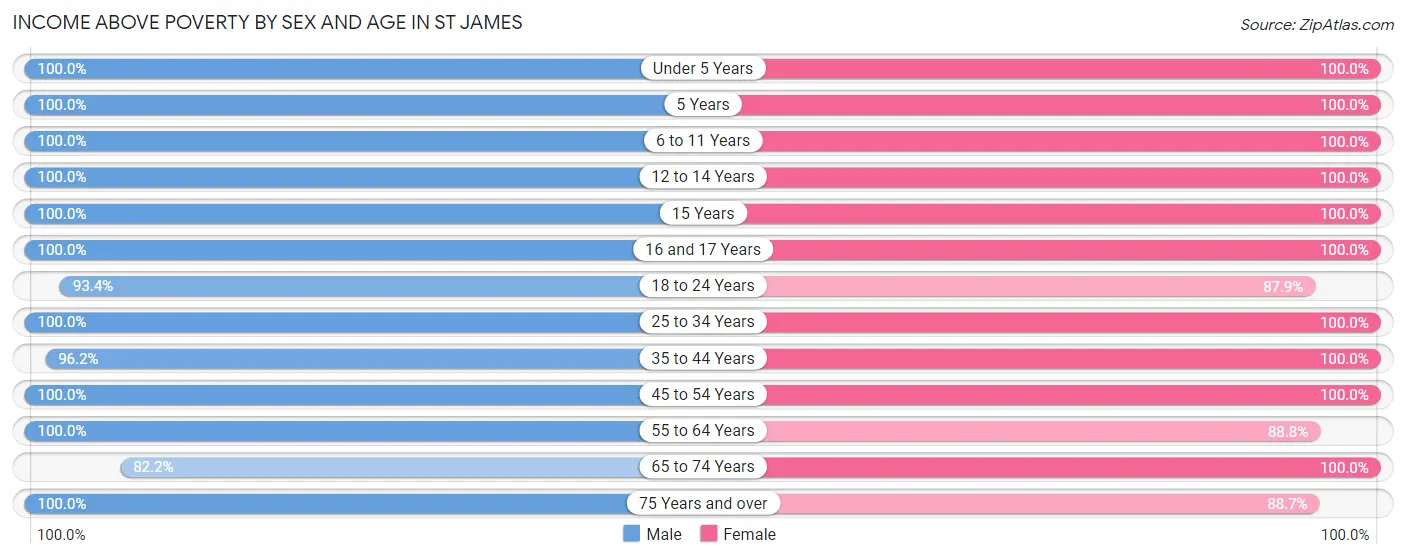
| Age Bracket | Male | Female |
| Under 5 Years | 27 (100.0%) | 65 (100.0%) |
| 5 Years | 7 (100.0%) | 14 (100.0%) |
| 6 to 11 Years | 139 (100.0%) | 180 (100.0%) |
| 12 to 14 Years | 167 (100.0%) | 169 (100.0%) |
| 15 Years | 29 (100.0%) | 54 (100.0%) |
| 16 and 17 Years | 102 (100.0%) | 45 (100.0%) |
| 18 to 24 Years | 114 (93.4%) | 152 (87.9%) |
| 25 to 34 Years | 175 (100.0%) | 134 (100.0%) |
| 35 to 44 Years | 276 (96.2%) | 271 (100.0%) |
| 45 to 54 Years | 590 (100.0%) | 360 (100.0%) |
| 55 to 64 Years | 127 (100.0%) | 142 (88.7%) |
| 65 to 74 Years | 88 (82.2%) | 169 (100.0%) |
| 75 Years and over | 133 (100.0%) | 203 (88.6%) |
| Total | 1,974 (98.1%) | 1,958 (96.8%) |
Income Below Poverty Among Married-Couple Families in St James
The poverty statistics for married-couple families in St James show that 2.0% or 19 of the total 948 families live below the poverty line. Families with no children have the highest poverty rate of 5.0%, comprising of 19 families. On the other hand, families with 1 or 2 children have the lowest poverty rate of 0.0%, which includes 0 families.
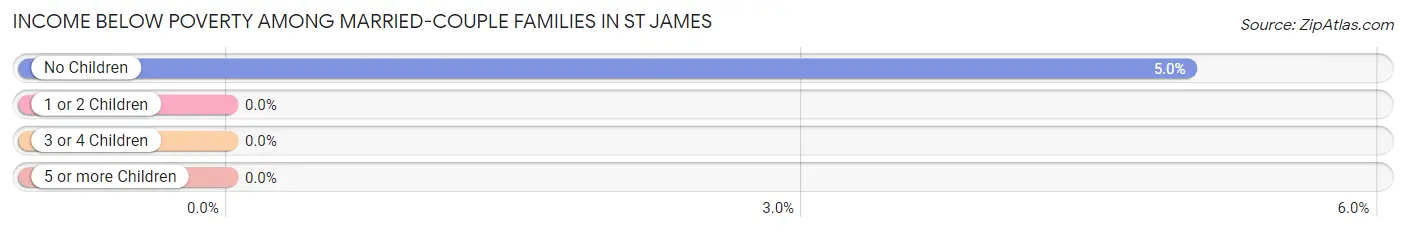
| Children | Above Poverty | Below Poverty |
| No Children | 360 (95.0%) | 19 (5.0%) |
| 1 or 2 Children | 537 (100.0%) | 0 (0.0%) |
| 3 or 4 Children | 32 (100.0%) | 0 (0.0%) |
| 5 or more Children | 0 (0.0%) | 0 (0.0%) |
| Total | 929 (98.0%) | 19 (2.0%) |
Income Below Poverty Among Single-Parent Households in St James
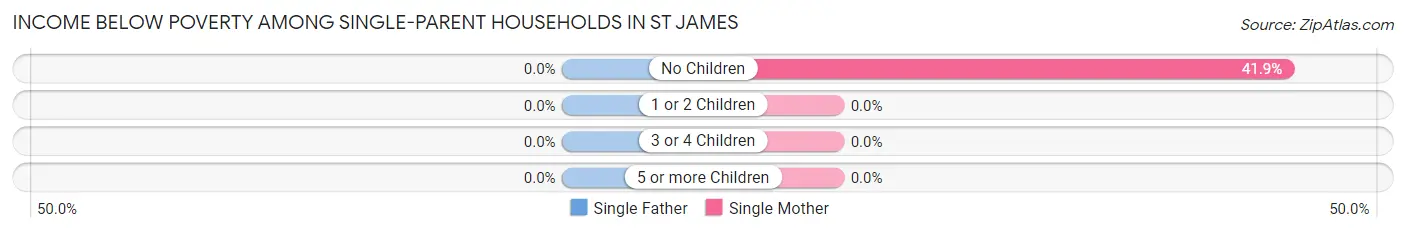
| Children | Single Father | Single Mother |
| No Children | 0 (0.0%) | 26 (41.9%) |
| 1 or 2 Children | 0 (0.0%) | 0 (0.0%) |
| 3 or 4 Children | 0 (0.0%) | 0 (0.0%) |
| 5 or more Children | 0 (0.0%) | 0 (0.0%) |
| Total | 0 (0.0%) | 26 (27.7%) |
Income Below Poverty Among Married-Couple vs Single-Parent Households in St James
The poverty data for St James shows that 19 of the married-couple family households (2.0%) and 26 of the single-parent households (10.2%) are living below the poverty level. Within the married-couple family households, those with no children have the highest poverty rate, with 19 households (5.0%) falling below the poverty line. Among the single-parent households, those with no children have the highest poverty rate, with 26 household (29.9%) living below poverty.
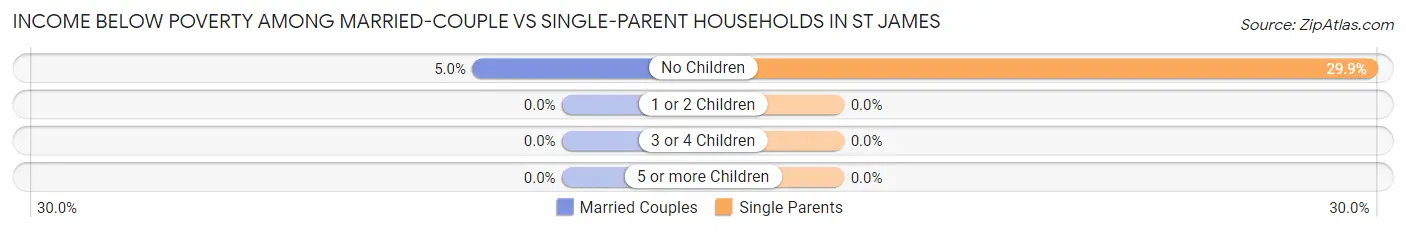
| Children | Married-Couple Families | Single-Parent Households |
| No Children | 19 (5.0%) | 26 (29.9%) |
| 1 or 2 Children | 0 (0.0%) | 0 (0.0%) |
| 3 or 4 Children | 0 (0.0%) | 0 (0.0%) |
| 5 or more Children | 0 (0.0%) | 0 (0.0%) |
| Total | 19 (2.0%) | 26 (10.2%) |
Race in St James
The most populous races in St James are White / Caucasian (2,810 | 68.4%), Black / African American (589 | 14.3%), and Two or more Races (459 | 11.2%).
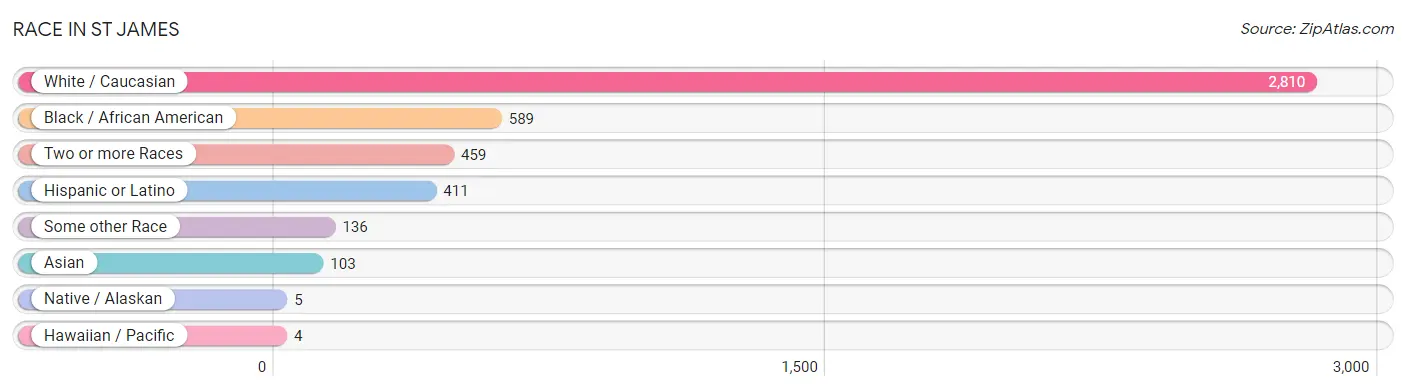
| Race | # Population | % Population |
| Asian | 103 | 2.5% |
| Black / African American | 589 | 14.3% |
| Hawaiian / Pacific | 4 | 0.1% |
| Hispanic or Latino | 411 | 10.0% |
| Native / Alaskan | 5 | 0.1% |
| White / Caucasian | 2,810 | 68.4% |
| Two or more Races | 459 | 11.2% |
| Some other Race | 136 | 3.3% |
| Total | 4,106 | 100.0% |
Ancestry in St James
The most populous ancestries reported in St James are English (581 | 14.1%), German (493 | 12.0%), Irish (341 | 8.3%), American (321 | 7.8%), and Puerto Rican (205 | 5.0%), together accounting for 47.3% of all St James residents.
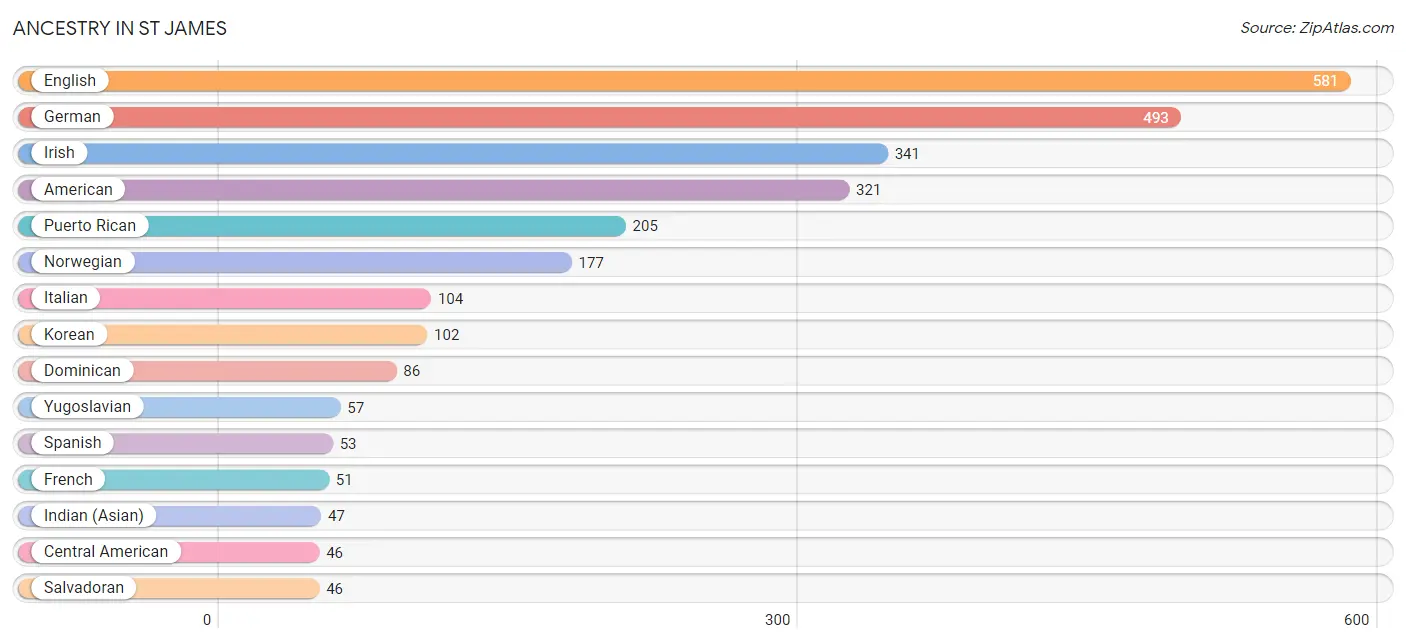
| Ancestry | # Population | % Population |
| American | 321 | 7.8% |
| Bhutanese | 12 | 0.3% |
| British | 11 | 0.3% |
| Burmese | 3 | 0.1% |
| Cambodian | 4 | 0.1% |
| Central American | 46 | 1.1% |
| Central American Indian | 5 | 0.1% |
| Choctaw | 2 | 0.1% |
| Cuban | 13 | 0.3% |
| Dominican | 86 | 2.1% |
| Dutch | 19 | 0.5% |
| English | 581 | 14.1% |
| European | 32 | 0.8% |
| French | 51 | 1.2% |
| French Canadian | 17 | 0.4% |
| German | 493 | 12.0% |
| Greek | 13 | 0.3% |
| Guamanian / Chamorro | 4 | 0.1% |
| Haitian | 26 | 0.6% |
| Indian (Asian) | 47 | 1.1% |
| Irish | 341 | 8.3% |
| Italian | 104 | 2.5% |
| Korean | 102 | 2.5% |
| Mexican | 8 | 0.2% |
| Mexican American Indian | 5 | 0.1% |
| Norwegian | 177 | 4.3% |
| Pennsylvania German | 24 | 0.6% |
| Polish | 25 | 0.6% |
| Puerto Rican | 205 | 5.0% |
| Salvadoran | 46 | 1.1% |
| Scottish | 28 | 0.7% |
| Spanish | 53 | 1.3% |
| Welsh | 24 | 0.6% |
| Yugoslavian | 57 | 1.4% | View All 34 Rows |
Immigrants in St James
The most numerous immigrant groups reported in St James came from Latin America (243 | 5.9%), Central America (131 | 3.2%), Asia (119 | 2.9%), Caribbean (112 | 2.7%), and Dominican Republic (86 | 2.1%), together accounting for 16.8% of all St James residents.
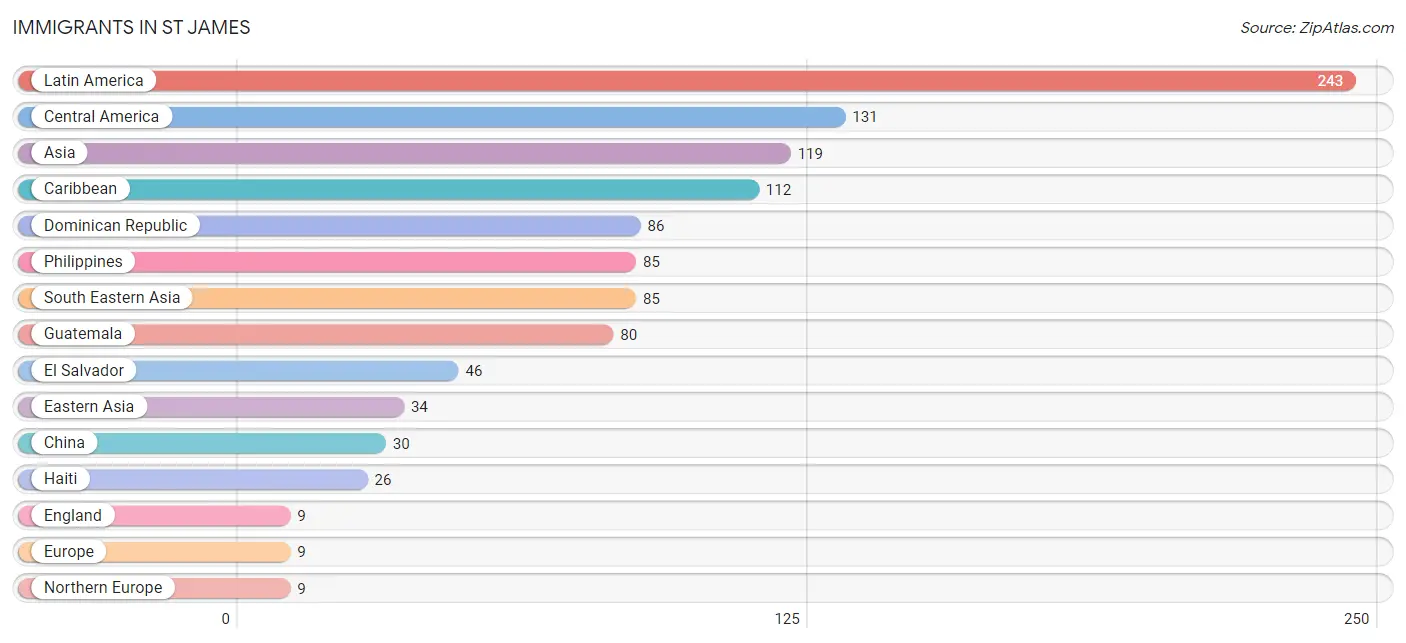
| Immigration Origin | # Population | % Population |
| Africa | 2 | 0.1% |
| Asia | 119 | 2.9% |
| Caribbean | 112 | 2.7% |
| Central America | 131 | 3.2% |
| China | 30 | 0.7% |
| Dominican Republic | 86 | 2.1% |
| Eastern Asia | 34 | 0.8% |
| El Salvador | 46 | 1.1% |
| England | 9 | 0.2% |
| Europe | 9 | 0.2% |
| Ghana | 2 | 0.1% |
| Guatemala | 80 | 1.9% |
| Haiti | 26 | 0.6% |
| Latin America | 243 | 5.9% |
| Mexico | 5 | 0.1% |
| Northern Europe | 9 | 0.2% |
| Philippines | 85 | 2.1% |
| South Eastern Asia | 85 | 2.1% |
| Western Africa | 2 | 0.1% | View All 19 Rows |
Sex and Age in St James
Sex and Age in St James
The most populous age groups in St James are 50 to 54 Years (319 | 15.7%) for men and 10 to 14 Years (241 | 11.6%) for women.
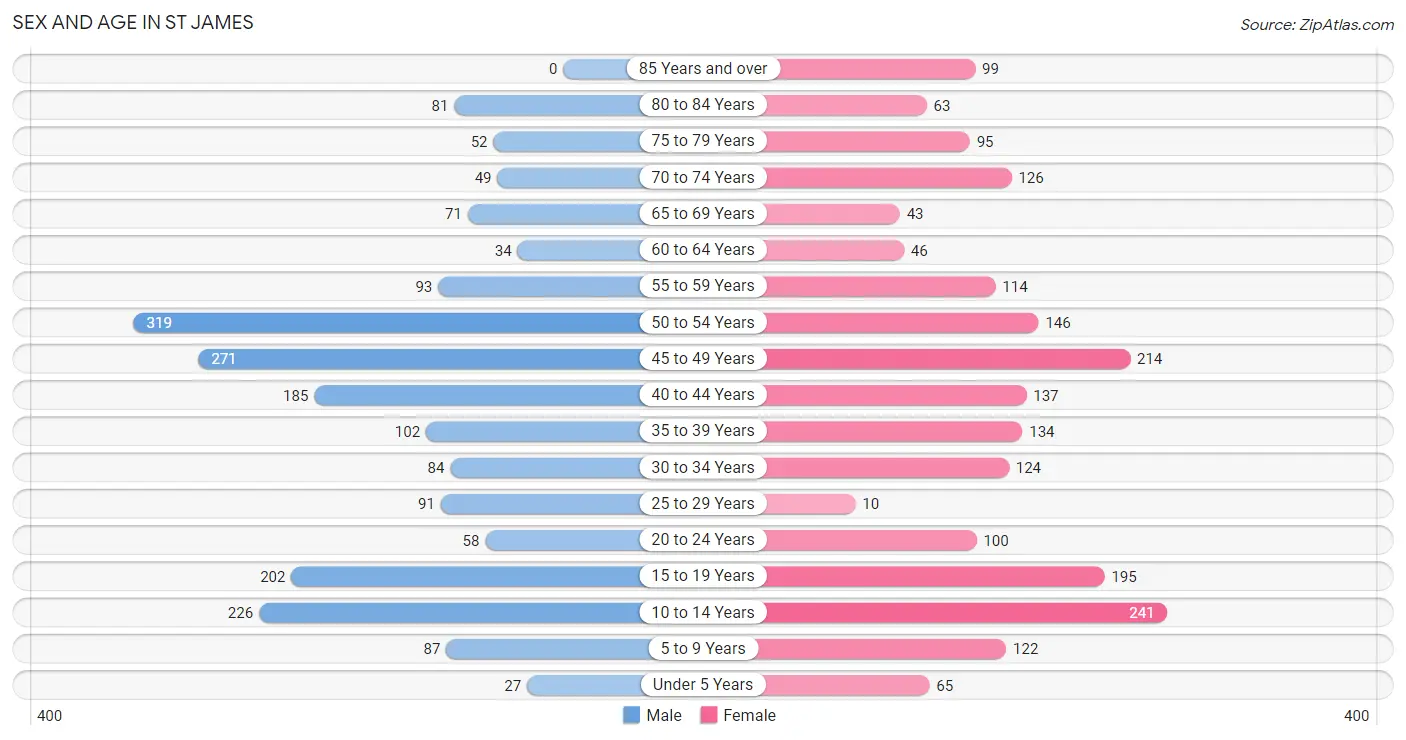
| Age Bracket | Male | Female |
| Under 5 Years | 27 (1.3%) | 65 (3.1%) |
| 5 to 9 Years | 87 (4.3%) | 122 (5.9%) |
| 10 to 14 Years | 226 (11.1%) | 241 (11.6%) |
| 15 to 19 Years | 202 (9.9%) | 195 (9.4%) |
| 20 to 24 Years | 58 (2.9%) | 100 (4.8%) |
| 25 to 29 Years | 91 (4.5%) | 10 (0.5%) |
| 30 to 34 Years | 84 (4.1%) | 124 (6.0%) |
| 35 to 39 Years | 102 (5.0%) | 134 (6.5%) |
| 40 to 44 Years | 185 (9.1%) | 137 (6.6%) |
| 45 to 49 Years | 271 (13.3%) | 214 (10.3%) |
| 50 to 54 Years | 319 (15.7%) | 146 (7.0%) |
| 55 to 59 Years | 93 (4.6%) | 114 (5.5%) |
| 60 to 64 Years | 34 (1.7%) | 46 (2.2%) |
| 65 to 69 Years | 71 (3.5%) | 43 (2.1%) |
| 70 to 74 Years | 49 (2.4%) | 126 (6.1%) |
| 75 to 79 Years | 52 (2.6%) | 95 (4.6%) |
| 80 to 84 Years | 81 (4.0%) | 63 (3.0%) |
| 85 Years and over | 0 (0.0%) | 99 (4.8%) |
| Total | 2,032 (100.0%) | 2,074 (100.0%) |
Families and Households in St James
Median Family Size in St James
The median family size in St James is 2.96 persons per family, with married-couple families (948 | 78.7%) accounting for the largest median family size of 3.27 persons per family. On the other hand, single female/mother families (94 | 7.8%) represent the smallest median family size with 1.74 persons per family.
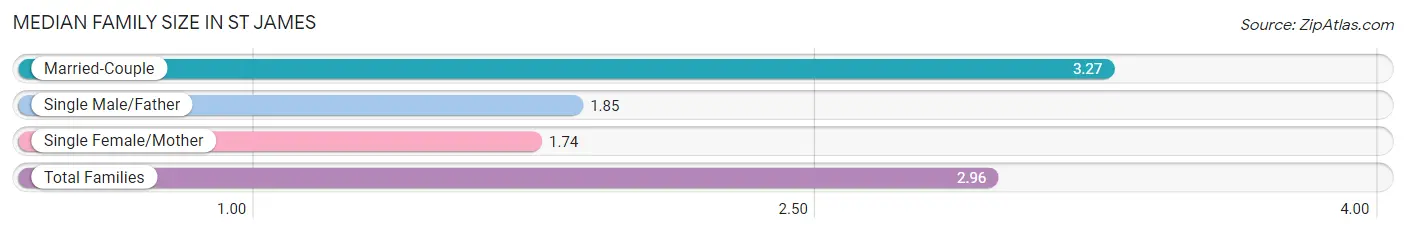
| Family Type | # Families | Family Size |
| Married-Couple | 948 (78.7%) | 3.27 |
| Single Male/Father | 162 (13.5%) | 1.85 |
| Single Female/Mother | 94 (7.8%) | 1.74 |
| Total Families | 1,204 (100.0%) | 2.96 |
Median Household Size in St James
The median household size in St James is 2.56 persons per household, with married-couple households (948 | 60.4%) accounting for the largest median household size of 3.27 persons per household. non-family households (366 | 23.3%) represent the smallest median household size with 1.23 persons per household.
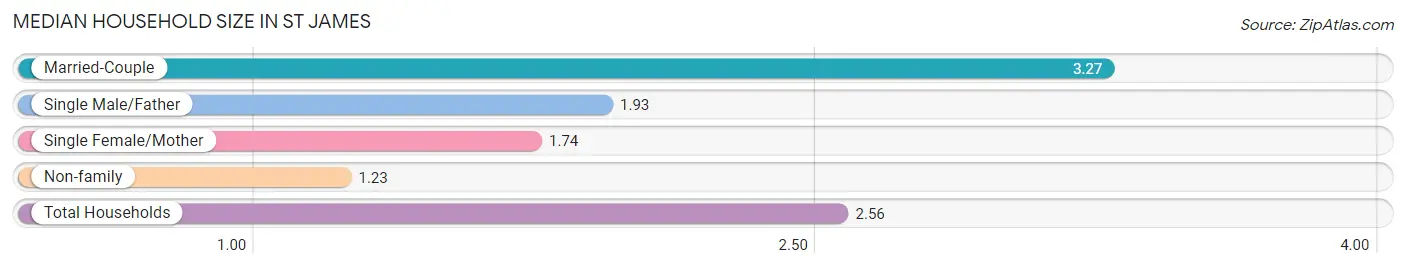
| Household Type | # Households | Household Size |
| Married-Couple | 948 (60.4%) | 3.27 |
| Single Male/Father | 162 (10.3%) | 1.93 |
| Single Female/Mother | 94 (6.0%) | 1.74 |
| Non-family | 366 (23.3%) | 1.23 |
| Total Households | 1,570 (100.0%) | 2.56 |
Household Size by Marriage Status in St James
Out of a total of 1,570 households in St James, 1,204 (76.7%) are family households, while 366 (23.3%) are nonfamily households. The most numerous type of family households are 2-person households, comprising 540, and the most common type of nonfamily households are 1-person households, comprising 297.
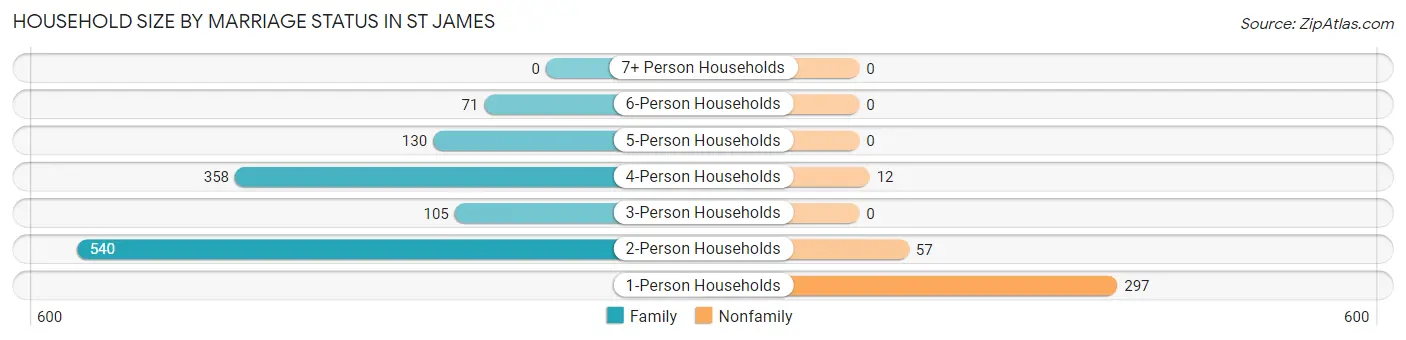
| Household Size | Family Households | Nonfamily Households |
| 1-Person Households | - | 297 (18.9%) |
| 2-Person Households | 540 (34.4%) | 57 (3.6%) |
| 3-Person Households | 105 (6.7%) | 0 (0.0%) |
| 4-Person Households | 358 (22.8%) | 12 (0.8%) |
| 5-Person Households | 130 (8.3%) | 0 (0.0%) |
| 6-Person Households | 71 (4.5%) | 0 (0.0%) |
| 7+ Person Households | 0 (0.0%) | 0 (0.0%) |
| Total | 1,204 (76.7%) | 366 (23.3%) |
Female Fertility in St James
Fertility by Age in St James
Average fertility rate in St James is 24.0 births per 1,000 women. Women in the age bracket of 20 to 34 years have the highest fertility rate with 81.0 births per 1,000 women. Women in the age bracket of 20 to 34 years acount for 79.2% of all women with births.
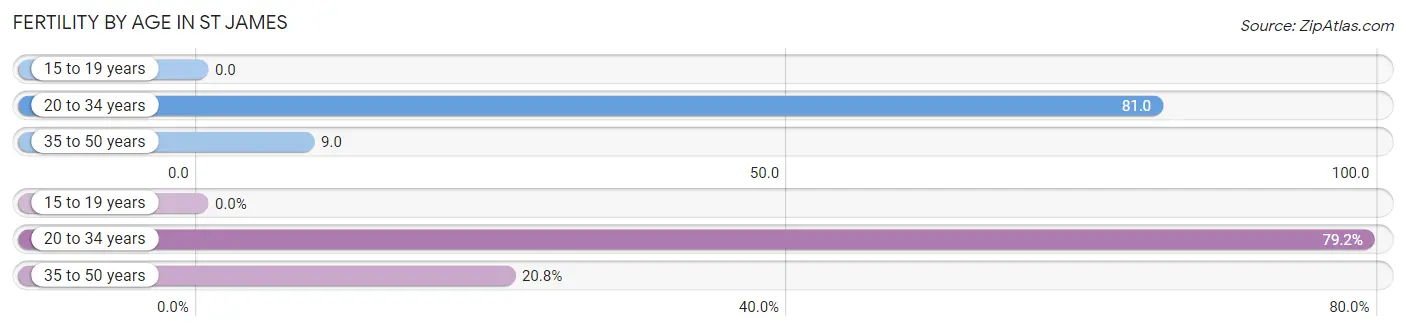
| Age Bracket | Women with Births | Births / 1,000 Women |
| 15 to 19 years | 0 (0.0%) | 0.0 |
| 20 to 34 years | 19 (79.2%) | 81.0 |
| 35 to 50 years | 5 (20.8%) | 9.0 |
| Total | 24 (100.0%) | 24.0 |
Fertility by Age by Marriage Status in St James
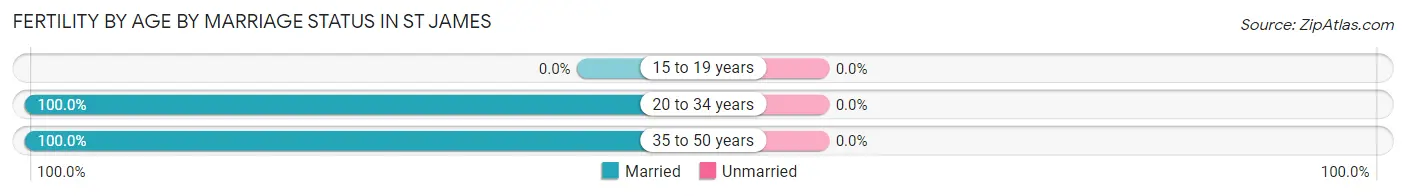
| Age Bracket | Married | Unmarried |
| 15 to 19 years | 0 (0.0%) | 0 (0.0%) |
| 20 to 34 years | 19 (100.0%) | 0 (0.0%) |
| 35 to 50 years | 5 (100.0%) | 0 (0.0%) |
| Total | 24 (100.0%) | 0 (0.0%) |
Fertility by Education in St James
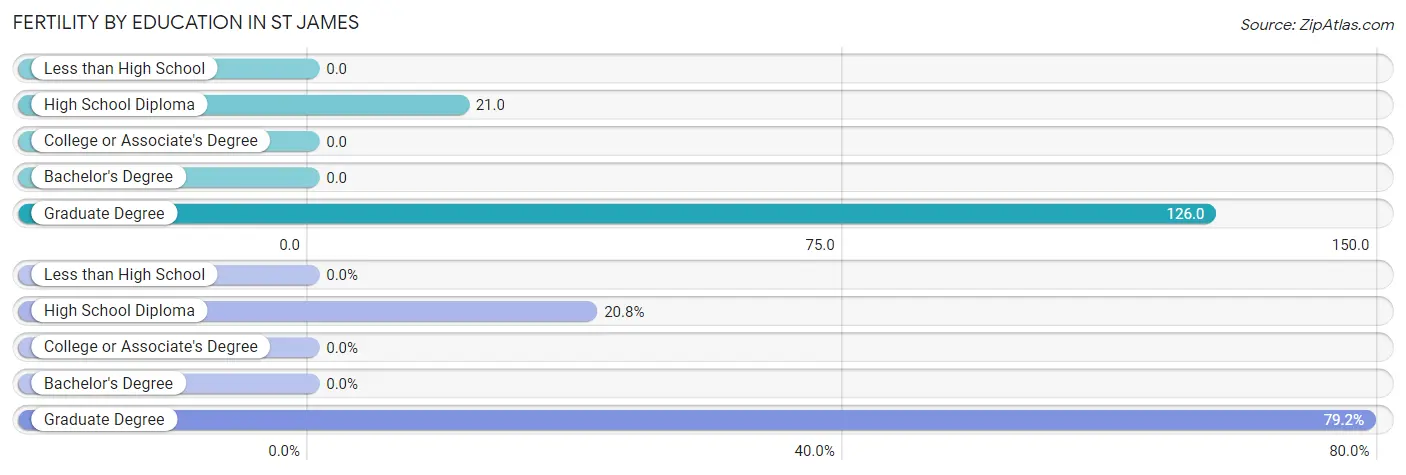
| Educational Attainment | Women with Births | Births / 1,000 Women |
| Less than High School | 0 (0.0%) | 0.0 |
| High School Diploma | 5 (20.8%) | 21.0 |
| College or Associate's Degree | 0 (0.0%) | 0.0 |
| Bachelor's Degree | 0 (0.0%) | 0.0 |
| Graduate Degree | 19 (79.2%) | 126.0 |
| Total | 24 (100.0%) | 24.0 |
Fertility by Education by Marriage Status in St James
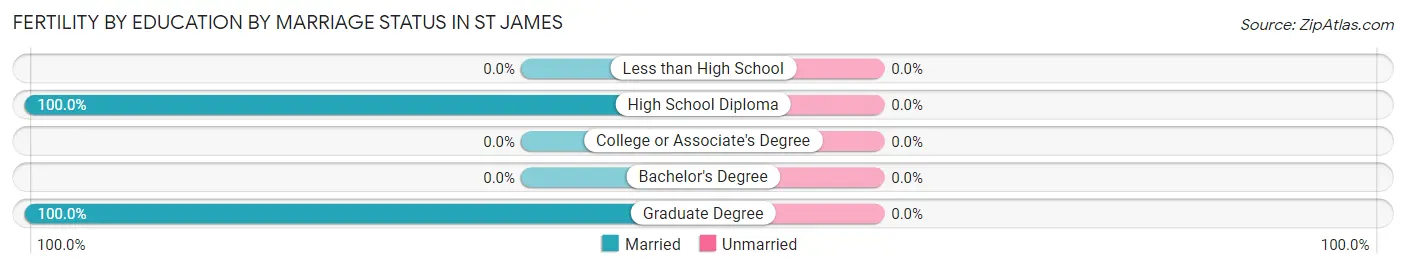
| Educational Attainment | Married | Unmarried |
| Less than High School | 0 (0.0%) | 0 (0.0%) |
| High School Diploma | 5 (100.0%) | 0 (0.0%) |
| College or Associate's Degree | 0 (0.0%) | 0 (0.0%) |
| Bachelor's Degree | 0 (0.0%) | 0 (0.0%) |
| Graduate Degree | 19 (100.0%) | 0 (0.0%) |
| Total | 24 (100.0%) | 0 (0.0%) |
Employment Characteristics in St James
Employment by Class of Employer in St James
Among the 2,145 employed individuals in St James, private company employees (1,337 | 62.3%), local government employees (302 | 14.1%), and state government employees (165 | 7.7%) make up the most common classes of employment.
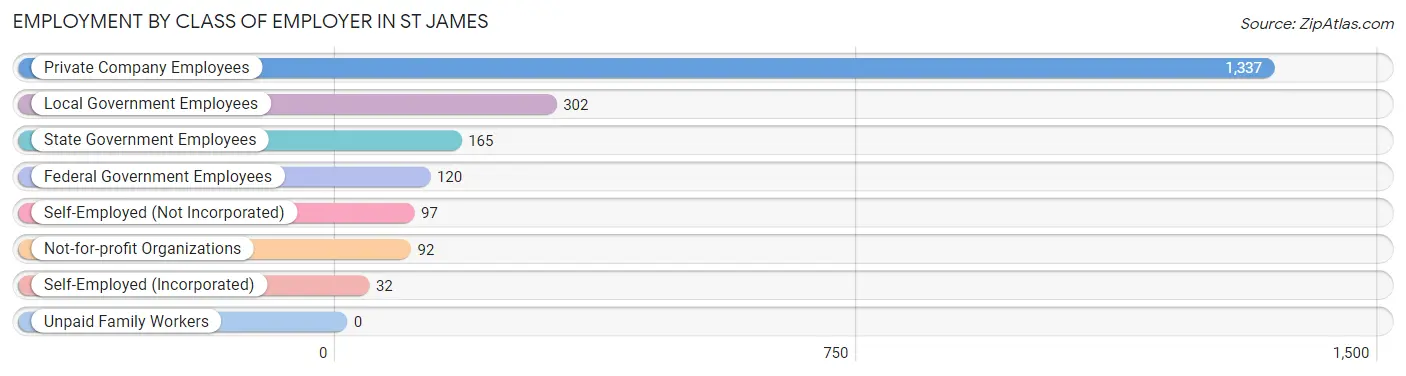
| Employer Class | # Employees | % Employees |
| Private Company Employees | 1,337 | 62.3% |
| Self-Employed (Incorporated) | 32 | 1.5% |
| Self-Employed (Not Incorporated) | 97 | 4.5% |
| Not-for-profit Organizations | 92 | 4.3% |
| Local Government Employees | 302 | 14.1% |
| State Government Employees | 165 | 7.7% |
| Federal Government Employees | 120 | 5.6% |
| Unpaid Family Workers | 0 | 0.0% |
| Total | 2,145 | 100.0% |
Employment Status by Age in St James
According to the labor force statistics for St James, out of the total population over 16 years of age (3,255), 66.2% or 2,155 individuals are in the labor force, with 0.5% or 11 of them unemployed. The age group with the highest labor force participation rate is 25 to 29 years, with 100.0% or 101 individuals in the labor force. Within the labor force, the 35 to 44 years age range has the highest percentage of unemployed individuals, with 2.4% or 11 of them being unemployed.
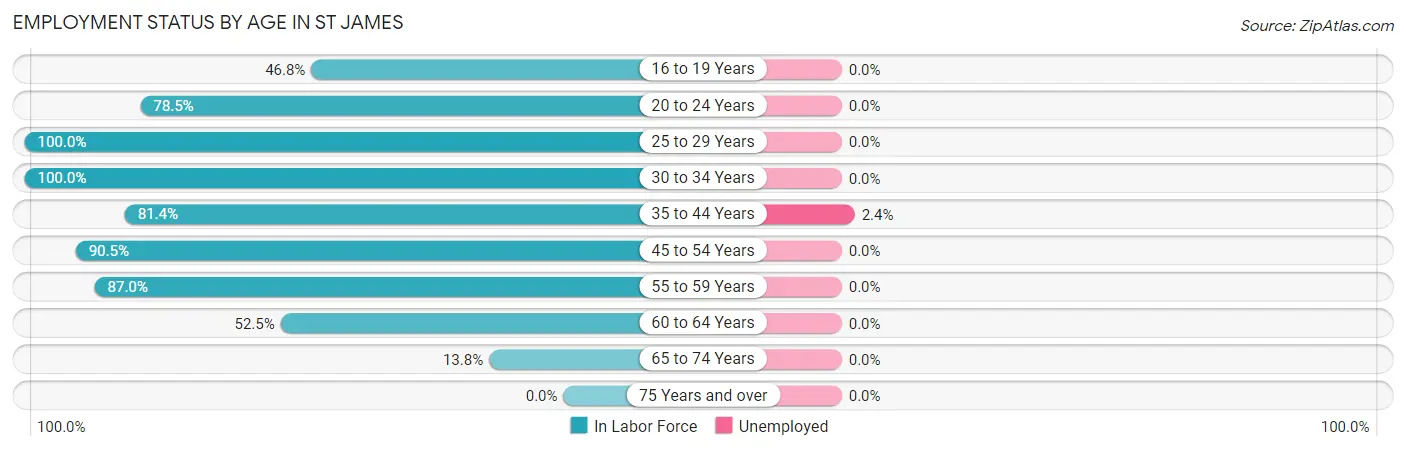
| Age Bracket | In Labor Force | Unemployed |
| 16 to 19 Years | 147 (46.8%) | 0 (0.0%) |
| 20 to 24 Years | 124 (78.5%) | 0 (0.0%) |
| 25 to 29 Years | 101 (100.0%) | 0 (0.0%) |
| 30 to 34 Years | 208 (100.0%) | 0 (0.0%) |
| 35 to 44 Years | 454 (81.4%) | 11 (2.4%) |
| 45 to 54 Years | 860 (90.5%) | 0 (0.0%) |
| 55 to 59 Years | 180 (87.0%) | 0 (0.0%) |
| 60 to 64 Years | 42 (52.5%) | 0 (0.0%) |
| 65 to 74 Years | 40 (13.8%) | 0 (0.0%) |
| 75 Years and over | 0 (0.0%) | 0 (0.0%) |
| Total | 2,155 (66.2%) | 11 (0.5%) |
Employment Status by Educational Attainment in St James
According to labor force statistics for St James, 87.7% of individuals (1,845) out of the total population between 25 and 64 years of age (2,104) are in the labor force, with 0.6% or 11 of them being unemployed. The group with the highest labor force participation rate are those with the educational attainment of college / associate degree, with 93.4% or 464 individuals in the labor force. Within the labor force, individuals with less than high school education have the highest percentage of unemployment, with 20.0% or 11 of them being unemployed.
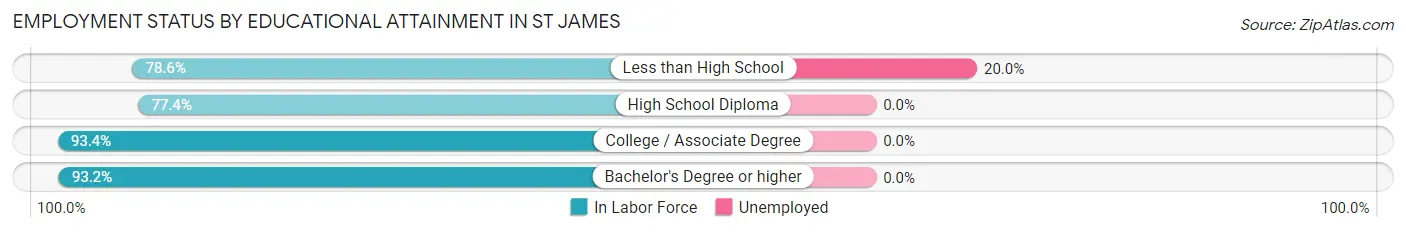
| Educational Attainment | In Labor Force | Unemployed |
| Less than High School | 55 (78.6%) | 14 (20.0%) |
| High School Diploma | 525 (77.4%) | 0 (0.0%) |
| College / Associate Degree | 464 (93.4%) | 0 (0.0%) |
| Bachelor's Degree or higher | 801 (93.2%) | 0 (0.0%) |
| Total | 1,845 (87.7%) | 13 (0.6%) |
Employment Occupations by Sex in St James
Management, Business, Science and Arts Occupations
The most common Management, Business, Science and Arts occupations in St James are Management (340 | 15.9%), Computers, Engineering & Science (180 | 8.4%), Computers & Mathematics (161 | 7.5%), Community & Social Service (148 | 6.9%), and Business & Financial (146 | 6.8%).
Management, Business, Science and Arts Occupations by Sex
Within the Management, Business, Science and Arts occupations in St James, the most male-oriented occupations are Life, Physical & Social Science (100.0%), Computers, Engineering & Science (75.6%), and Computers & Mathematics (72.7%), while the most female-oriented occupations are Community & Social Service (100.0%), Education, Arts & Media (100.0%), and Education Instruction & Library (100.0%).
| Occupation | Male | Female |
| Management | 212 (62.4%) | 128 (37.7%) |
| Business & Financial | 41 (28.1%) | 105 (71.9%) |
| Computers, Engineering & Science | 136 (75.6%) | 44 (24.4%) |
| Computers & Mathematics | 117 (72.7%) | 44 (27.3%) |
| Architecture & Engineering | 0 (0.0%) | 0 (0.0%) |
| Life, Physical & Social Science | 19 (100.0%) | 0 (0.0%) |
| Community & Social Service | 0 (0.0%) | 148 (100.0%) |
| Education, Arts & Media | 0 (0.0%) | 10 (100.0%) |
| Legal Services & Support | 0 (0.0%) | 0 (0.0%) |
| Education Instruction & Library | 0 (0.0%) | 81 (100.0%) |
| Arts, Media & Entertainment | 0 (0.0%) | 57 (100.0%) |
| Health Diagnosing & Treating | 0 (0.0%) | 41 (100.0%) |
| Health Technologists | 0 (0.0%) | 30 (100.0%) |
| Total (Category) | 389 (45.5%) | 466 (54.5%) |
| Total (Overall) | 1,274 (59.4%) | 871 (40.6%) |
Services Occupations
The most common Services occupations in St James are Security & Protection (183 | 8.5%), Firefighting & Prevention (105 | 4.9%), Food Preparation & Serving (101 | 4.7%), Law Enforcement (78 | 3.6%), and Cleaning & Maintenance (68 | 3.2%).
Services Occupations by Sex
Within the Services occupations in St James, the most male-oriented occupations are Law Enforcement (100.0%), Cleaning & Maintenance (100.0%), and Security & Protection (92.3%), while the most female-oriented occupations are Healthcare Support (100.0%), Food Preparation & Serving (77.2%), and Firefighting & Prevention (13.3%).
| Occupation | Male | Female |
| Healthcare Support | 0 (0.0%) | 18 (100.0%) |
| Security & Protection | 169 (92.3%) | 14 (7.6%) |
| Firefighting & Prevention | 91 (86.7%) | 14 (13.3%) |
| Law Enforcement | 78 (100.0%) | 0 (0.0%) |
| Food Preparation & Serving | 23 (22.8%) | 78 (77.2%) |
| Cleaning & Maintenance | 68 (100.0%) | 0 (0.0%) |
| Personal Care & Service | 0 (0.0%) | 0 (0.0%) |
| Total (Category) | 260 (70.3%) | 110 (29.7%) |
| Total (Overall) | 1,274 (59.4%) | 871 (40.6%) |
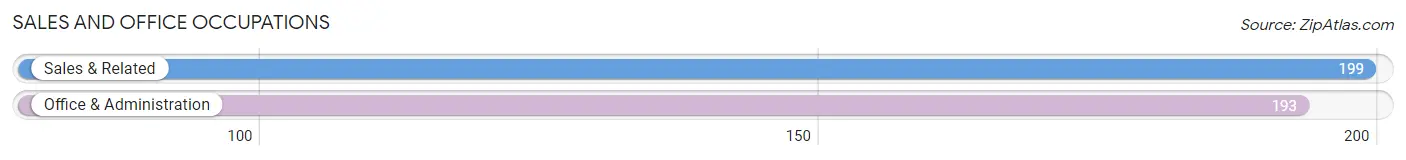
Sales and Office Occupations
The most common Sales and Office occupations in St James are Sales & Related (199 | 9.3%), and Office & Administration (193 | 9.0%).
Sales and Office Occupations by Sex
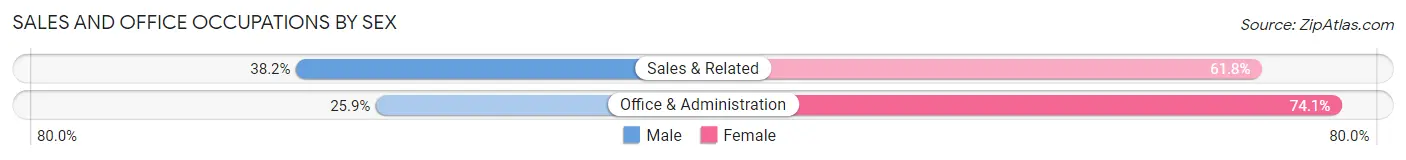
| Occupation | Male | Female |
| Sales & Related | 76 (38.2%) | 123 (61.8%) |
| Office & Administration | 50 (25.9%) | 143 (74.1%) |
| Total (Category) | 126 (32.1%) | 266 (67.9%) |
| Total (Overall) | 1,274 (59.4%) | 871 (40.6%) |
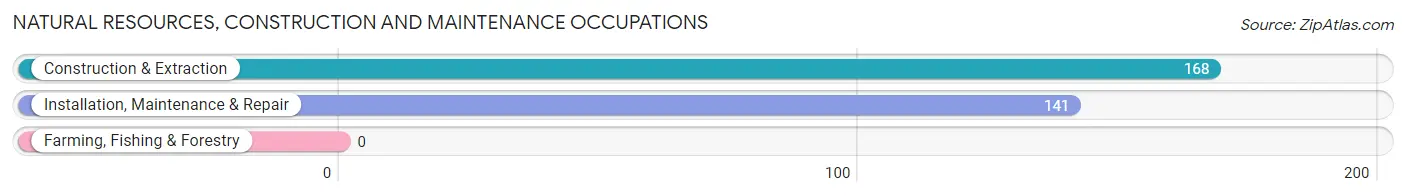
Natural Resources, Construction and Maintenance Occupations
The most common Natural Resources, Construction and Maintenance occupations in St James are Construction & Extraction (168 | 7.8%), and Installation, Maintenance & Repair (141 | 6.6%).
Natural Resources, Construction and Maintenance Occupations by Sex
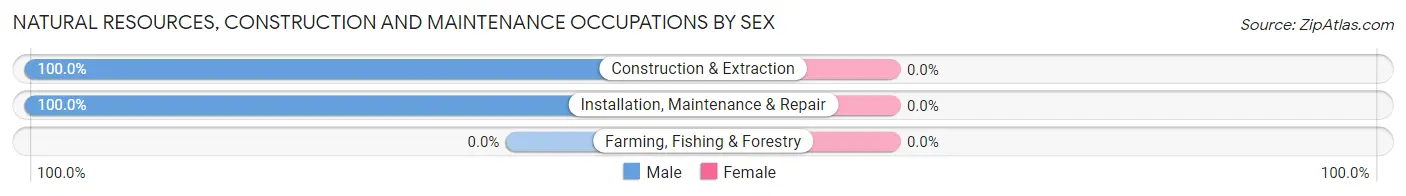
| Occupation | Male | Female |
| Farming, Fishing & Forestry | 0 (0.0%) | 0 (0.0%) |
| Construction & Extraction | 168 (100.0%) | 0 (0.0%) |
| Installation, Maintenance & Repair | 141 (100.0%) | 0 (0.0%) |
| Total (Category) | 309 (100.0%) | 0 (0.0%) |
| Total (Overall) | 1,274 (59.4%) | 871 (40.6%) |
Production, Transportation and Moving Occupations
The most common Production, Transportation and Moving occupations in St James are Transportation (169 | 7.9%), Production (29 | 1.3%), and Material Moving (21 | 1.0%).
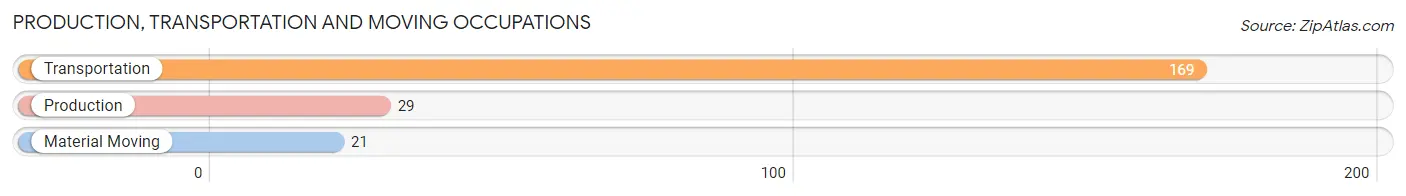
Production, Transportation and Moving Occupations by Sex
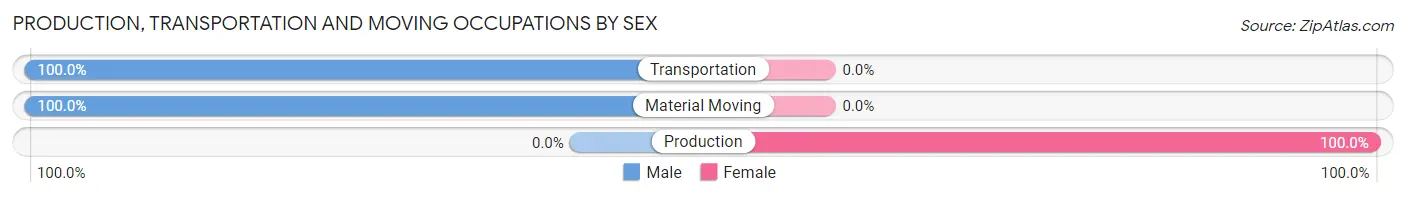
| Occupation | Male | Female |
| Production | 0 (0.0%) | 29 (100.0%) |
| Transportation | 169 (100.0%) | 0 (0.0%) |
| Material Moving | 21 (100.0%) | 0 (0.0%) |
| Total (Category) | 190 (86.8%) | 29 (13.2%) |
| Total (Overall) | 1,274 (59.4%) | 871 (40.6%) |
Employment Industries by Sex in St James
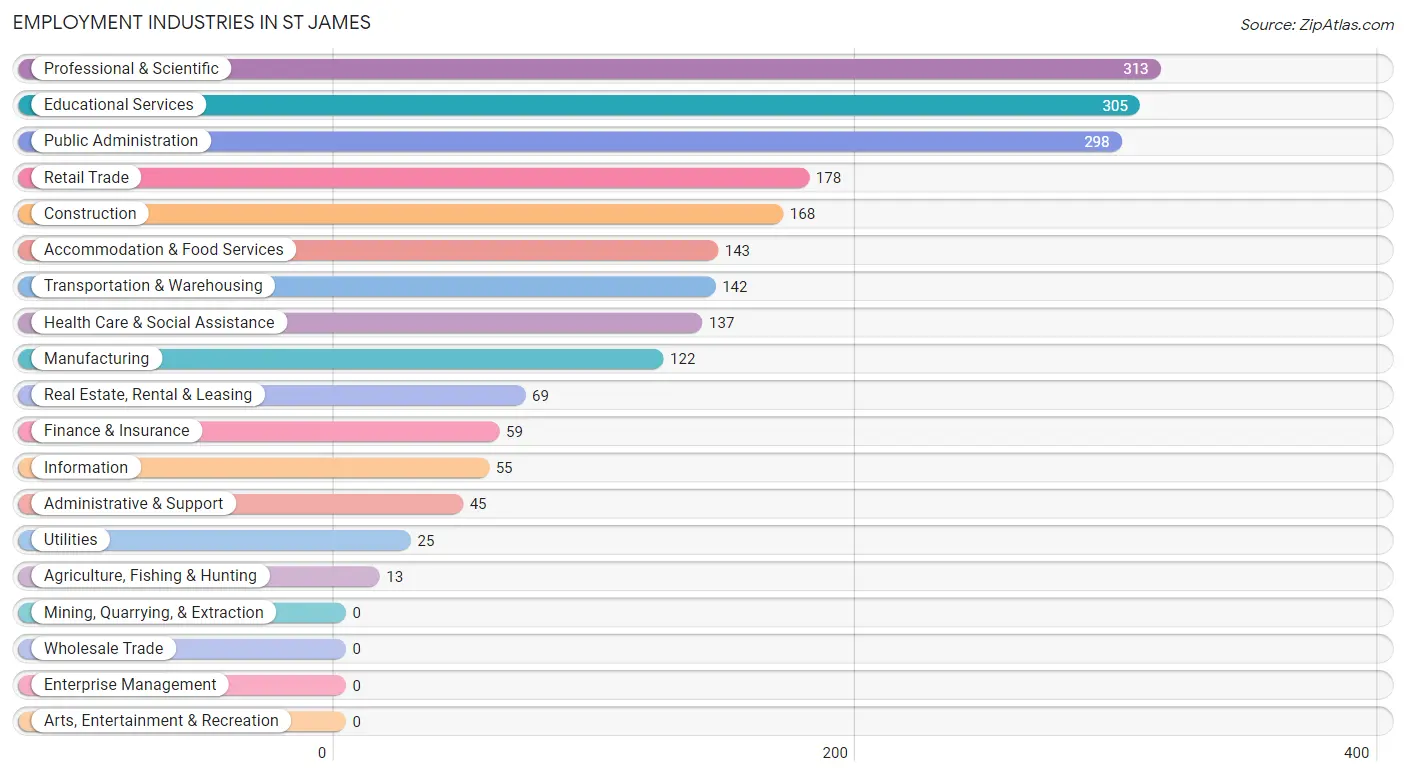
Employment Industries in St James
The major employment industries in St James include Professional & Scientific (313 | 14.6%), Educational Services (305 | 14.2%), Public Administration (298 | 13.9%), Retail Trade (178 | 8.3%), and Construction (168 | 7.8%).
Employment Industries by Sex in St James
The St James industries that see more men than women are Agriculture, Fishing & Hunting (100.0%), Construction (100.0%), and Transportation & Warehousing (100.0%), whereas the industries that tend to have a higher number of women are Health Care & Social Assistance (86.1%), Information (80.0%), and Real Estate, Rental & Leasing (79.7%).
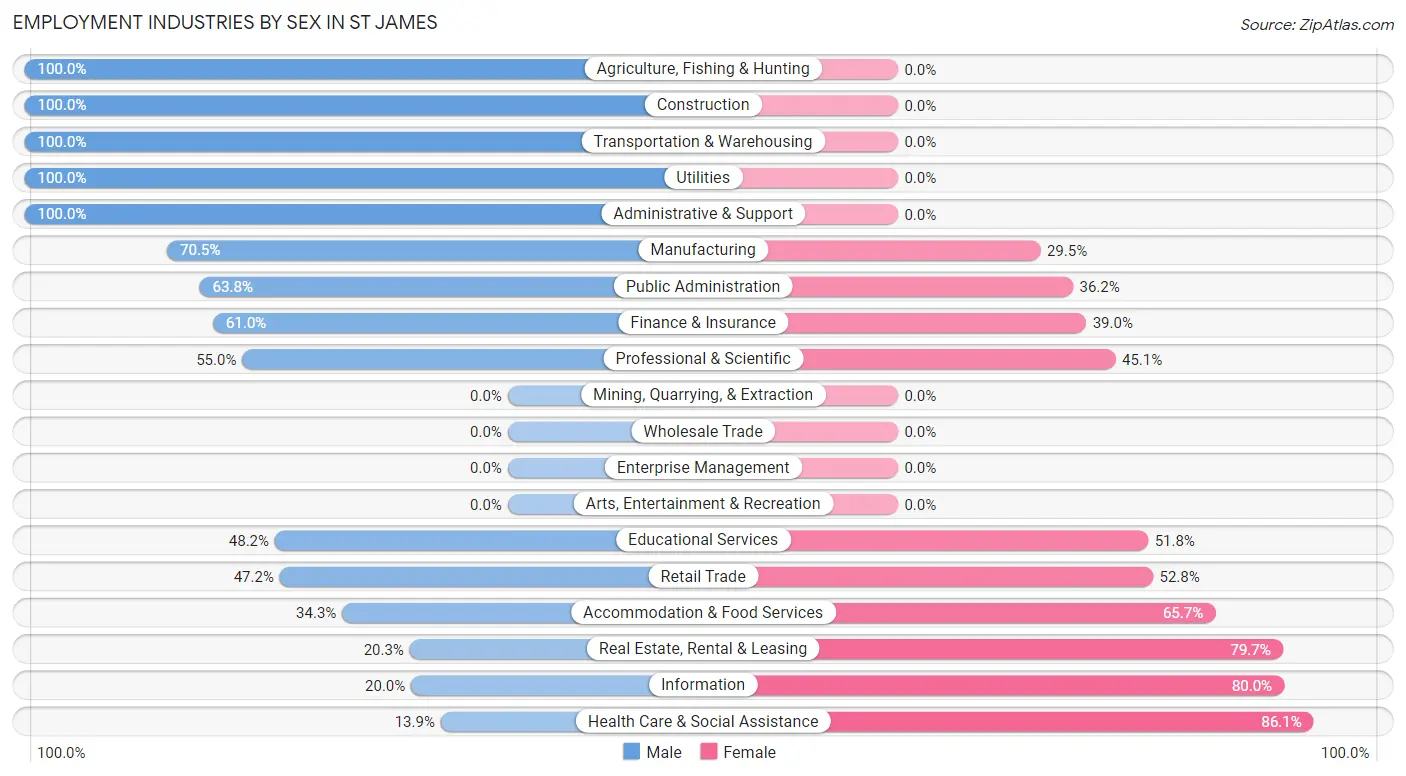
| Industry | Male | Female |
| Agriculture, Fishing & Hunting | 13 (100.0%) | 0 (0.0%) |
| Mining, Quarrying, & Extraction | 0 (0.0%) | 0 (0.0%) |
| Construction | 168 (100.0%) | 0 (0.0%) |
| Manufacturing | 86 (70.5%) | 36 (29.5%) |
| Wholesale Trade | 0 (0.0%) | 0 (0.0%) |
| Retail Trade | 84 (47.2%) | 94 (52.8%) |
| Transportation & Warehousing | 142 (100.0%) | 0 (0.0%) |
| Utilities | 25 (100.0%) | 0 (0.0%) |
| Information | 11 (20.0%) | 44 (80.0%) |
| Finance & Insurance | 36 (61.0%) | 23 (39.0%) |
| Real Estate, Rental & Leasing | 14 (20.3%) | 55 (79.7%) |
| Professional & Scientific | 172 (54.9%) | 141 (45.1%) |
| Enterprise Management | 0 (0.0%) | 0 (0.0%) |
| Administrative & Support | 45 (100.0%) | 0 (0.0%) |
| Educational Services | 147 (48.2%) | 158 (51.8%) |
| Health Care & Social Assistance | 19 (13.9%) | 118 (86.1%) |
| Arts, Entertainment & Recreation | 0 (0.0%) | 0 (0.0%) |
| Accommodation & Food Services | 49 (34.3%) | 94 (65.7%) |
| Public Administration | 190 (63.8%) | 108 (36.2%) |
| Total | 1,274 (59.4%) | 871 (40.6%) |
Education in St James
School Enrollment in St James
The most common levels of schooling among the 1,156 students in St James are high school (421 | 36.4%), middle school (318 | 27.5%), and college / undergraduate (197 | 17.0%).
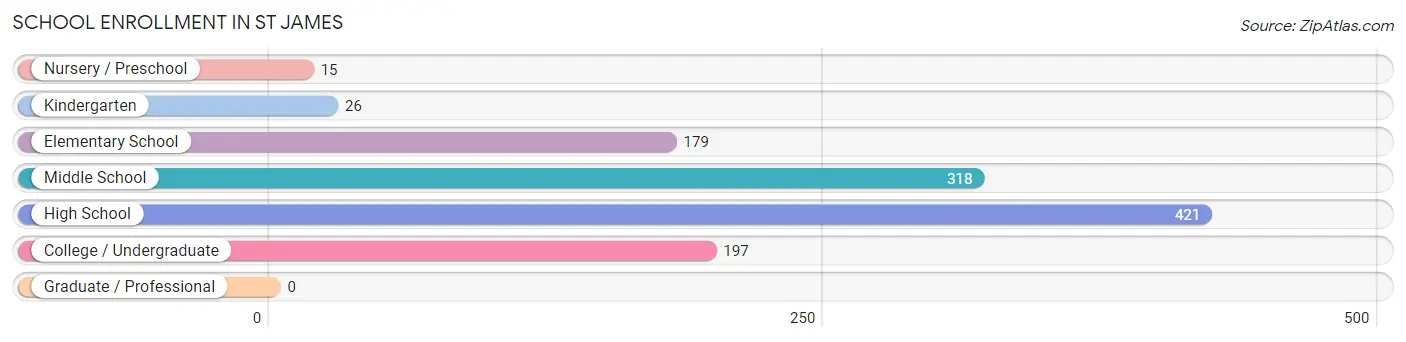
| School Level | # Students | % Students |
| Nursery / Preschool | 15 | 1.3% |
| Kindergarten | 26 | 2.2% |
| Elementary School | 179 | 15.5% |
| Middle School | 318 | 27.5% |
| High School | 421 | 36.4% |
| College / Undergraduate | 197 | 17.0% |
| Graduate / Professional | 0 | 0.0% |
| Total | 1,156 | 100.0% |
School Enrollment by Age by Funding Source in St James
Out of a total of 1,156 students who are enrolled in schools in St James, 180 (15.6%) attend a private institution, while the remaining 976 (84.4%) are enrolled in public schools. The age group of 3 to 4 year olds has the highest likelihood of being enrolled in private schools, with 15 (100.0% in the age bracket) enrolled. Conversely, the age group of 25 to 34 year olds has the lowest likelihood of being enrolled in a private school, with 18 (100.0% in the age bracket) attending a public institution.
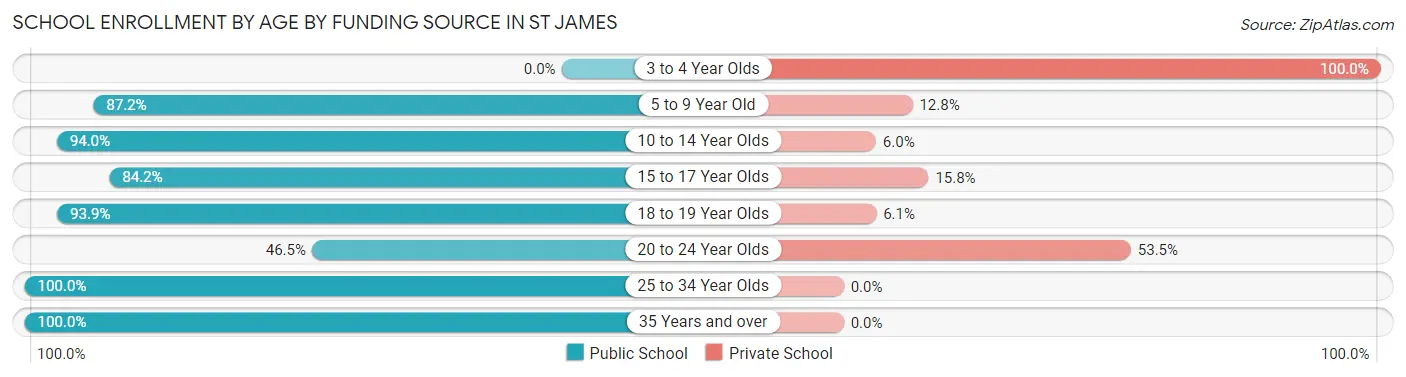
| Age Bracket | Public School | Private School |
| 3 to 4 Year Olds | 0 (0.0%) | 15 (100.0%) |
| 5 to 9 Year Old | 170 (87.2%) | 25 (12.8%) |
| 10 to 14 Year Olds | 439 (94.0%) | 28 (6.0%) |
| 15 to 17 Year Olds | 208 (84.2%) | 39 (15.8%) |
| 18 to 19 Year Olds | 62 (93.9%) | 4 (6.1%) |
| 20 to 24 Year Olds | 60 (46.5%) | 69 (53.5%) |
| 25 to 34 Year Olds | 18 (100.0%) | 0 (0.0%) |
| 35 Years and over | 19 (100.0%) | 0 (0.0%) |
| Total | 976 (84.4%) | 180 (15.6%) |
Educational Attainment by Field of Study in St James
Education (177 | 17.4%), bio, nature & agricultural (129 | 12.7%), computers & mathematics (119 | 11.7%), social sciences (106 | 10.4%), and engineering (92 | 9.0%) are the most common fields of study among 1,017 individuals in St James who have obtained a bachelor's degree or higher.
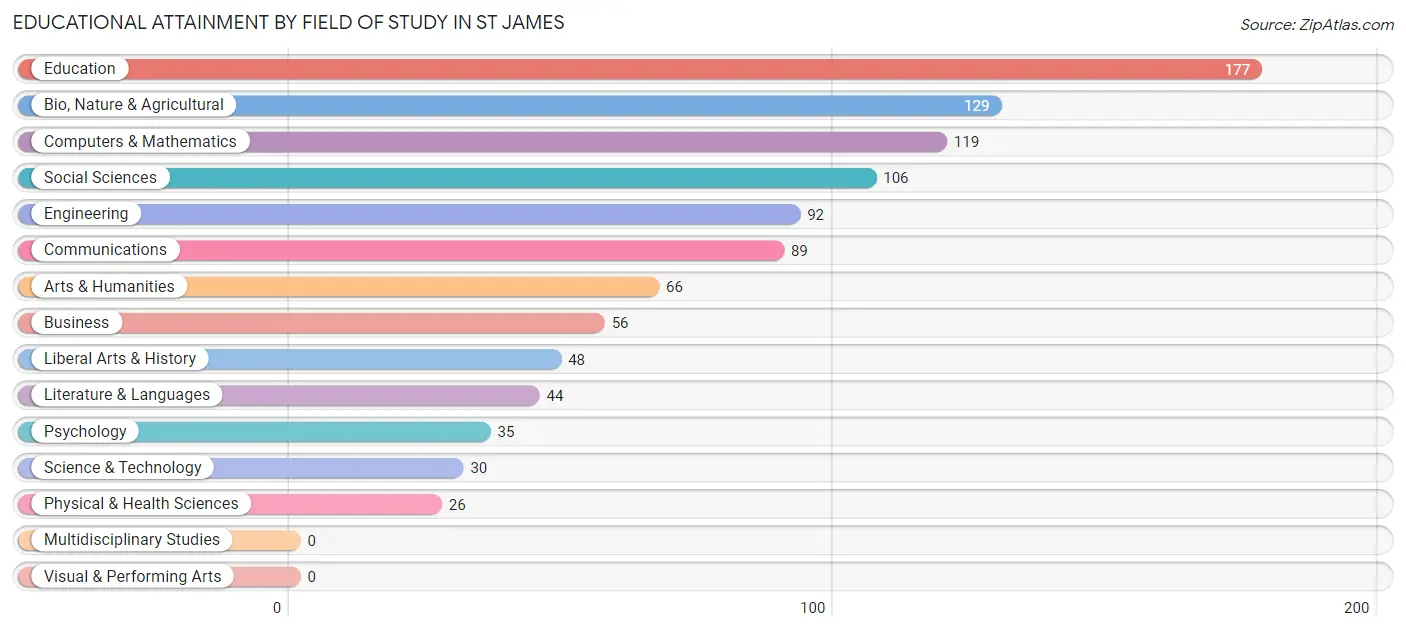
| Field of Study | # Graduates | % Graduates |
| Computers & Mathematics | 119 | 11.7% |
| Bio, Nature & Agricultural | 129 | 12.7% |
| Physical & Health Sciences | 26 | 2.6% |
| Psychology | 35 | 3.4% |
| Social Sciences | 106 | 10.4% |
| Engineering | 92 | 9.0% |
| Multidisciplinary Studies | 0 | 0.0% |
| Science & Technology | 30 | 2.9% |
| Business | 56 | 5.5% |
| Education | 177 | 17.4% |
| Literature & Languages | 44 | 4.3% |
| Liberal Arts & History | 48 | 4.7% |
| Visual & Performing Arts | 0 | 0.0% |
| Communications | 89 | 8.7% |
| Arts & Humanities | 66 | 6.5% |
| Total | 1,017 | 100.0% |
Transportation & Commute in St James
Vehicle Availability by Sex in St James
The most prevalent vehicle ownership categories in St James are males with 2 vehicles (447, accounting for 35.1%) and females with 2 vehicles (334, making up 51.6%).
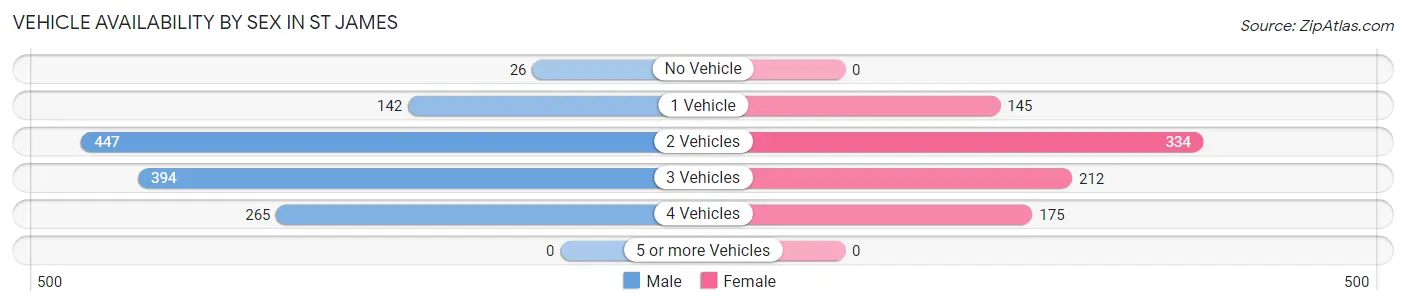
| Vehicles Available | Male | Female |
| No Vehicle | 26 (2.0%) | 0 (0.0%) |
| 1 Vehicle | 142 (11.2%) | 145 (16.7%) |
| 2 Vehicles | 447 (35.1%) | 334 (38.6%) |
| 3 Vehicles | 394 (30.9%) | 212 (24.5%) |
| 4 Vehicles | 265 (20.8%) | 175 (20.2%) |
| 5 or more Vehicles | 0 (0.0%) | 0 (0.0%) |
| Total | 1,274 (100.0%) | 866 (100.0%) |
Commute Time in St James
The most frequently occuring commute durations in St James are 15 to 19 minutes (341 commuters, 18.6%), 45 to 59 minutes (264 commuters, 14.4%), and 10 to 14 minutes (262 commuters, 14.3%).
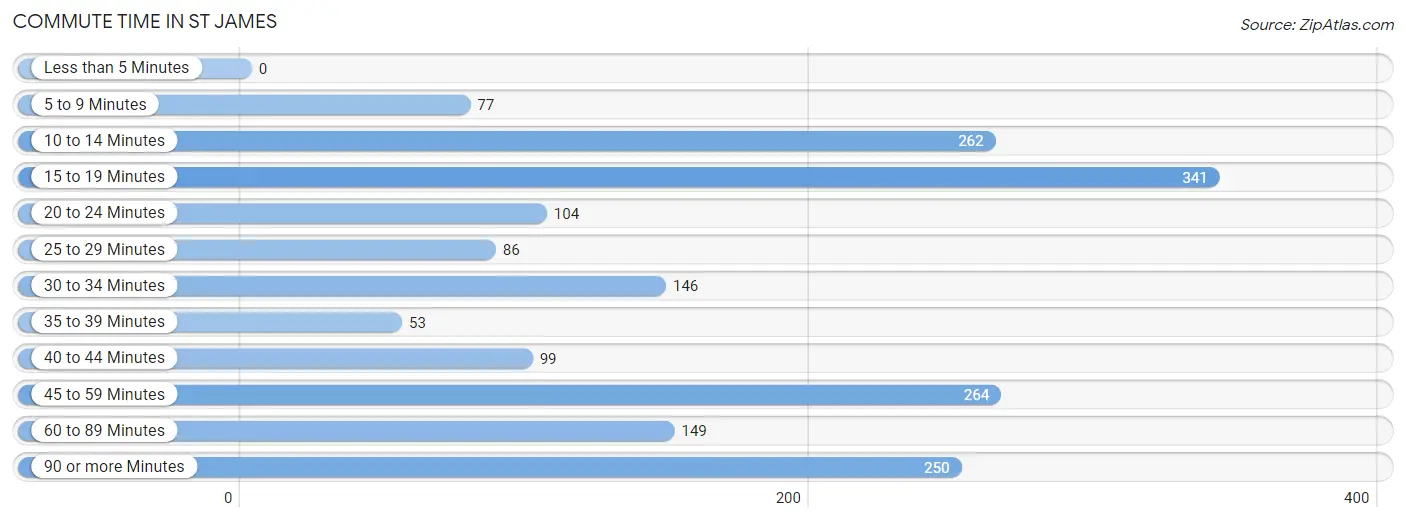
| Commute Time | # Commuters | % Commuters |
| Less than 5 Minutes | 0 | 0.0% |
| 5 to 9 Minutes | 77 | 4.2% |
| 10 to 14 Minutes | 262 | 14.3% |
| 15 to 19 Minutes | 341 | 18.6% |
| 20 to 24 Minutes | 104 | 5.7% |
| 25 to 29 Minutes | 86 | 4.7% |
| 30 to 34 Minutes | 146 | 8.0% |
| 35 to 39 Minutes | 53 | 2.9% |
| 40 to 44 Minutes | 99 | 5.4% |
| 45 to 59 Minutes | 264 | 14.4% |
| 60 to 89 Minutes | 149 | 8.1% |
| 90 or more Minutes | 250 | 13.7% |
Commute Time by Sex in St James
The most common commute times in St James are 10 to 14 minutes (215 commuters, 18.7%) for males and 15 to 19 minutes (177 commuters, 26.0%) for females.
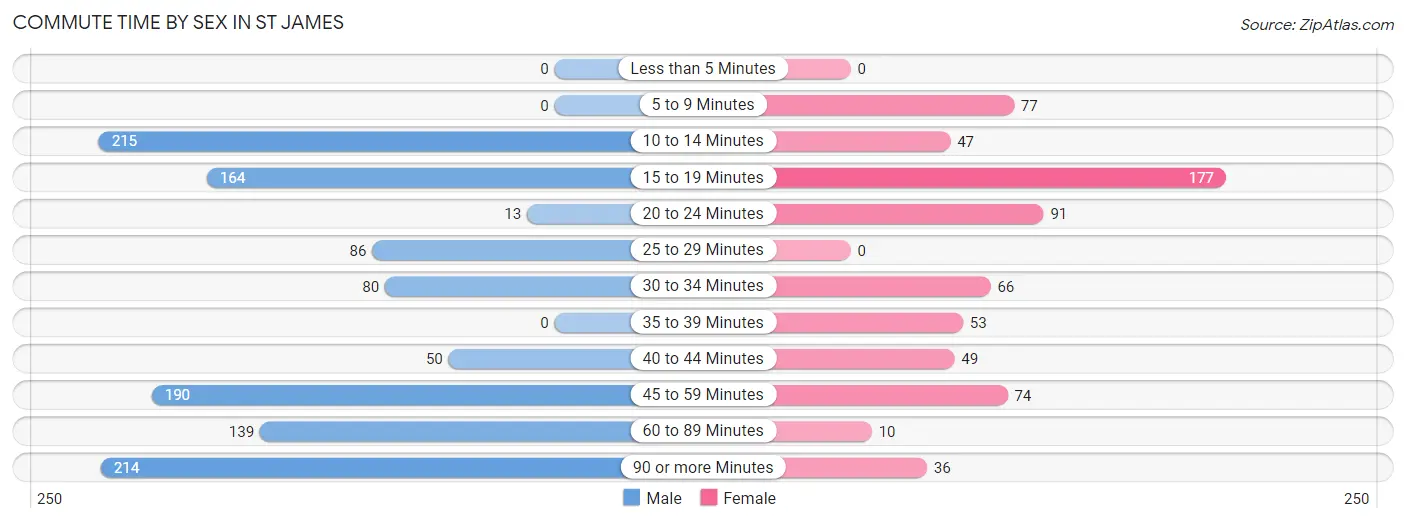
| Commute Time | Male | Female |
| Less than 5 Minutes | 0 (0.0%) | 0 (0.0%) |
| 5 to 9 Minutes | 0 (0.0%) | 77 (11.3%) |
| 10 to 14 Minutes | 215 (18.7%) | 47 (6.9%) |
| 15 to 19 Minutes | 164 (14.2%) | 177 (26.0%) |
| 20 to 24 Minutes | 13 (1.1%) | 91 (13.4%) |
| 25 to 29 Minutes | 86 (7.5%) | 0 (0.0%) |
| 30 to 34 Minutes | 80 (7.0%) | 66 (9.7%) |
| 35 to 39 Minutes | 0 (0.0%) | 53 (7.8%) |
| 40 to 44 Minutes | 50 (4.3%) | 49 (7.2%) |
| 45 to 59 Minutes | 190 (16.5%) | 74 (10.9%) |
| 60 to 89 Minutes | 139 (12.1%) | 10 (1.5%) |
| 90 or more Minutes | 214 (18.6%) | 36 (5.3%) |
Time of Departure to Work by Sex in St James
The most frequent times of departure to work in St James are 7:30 AM to 7:59 AM (161, 14.0%) for males and 7:00 AM to 7:29 AM (128, 18.8%) for females.
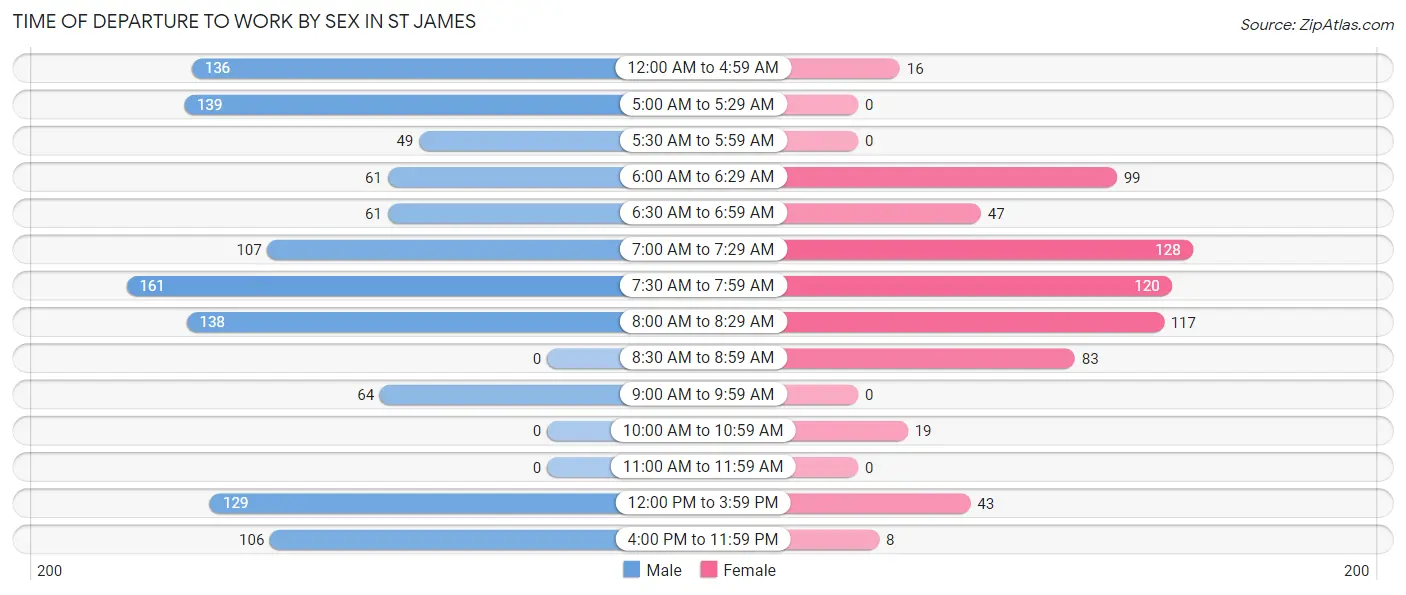
| Time of Departure | Male | Female |
| 12:00 AM to 4:59 AM | 136 (11.8%) | 16 (2.4%) |
| 5:00 AM to 5:29 AM | 139 (12.1%) | 0 (0.0%) |
| 5:30 AM to 5:59 AM | 49 (4.3%) | 0 (0.0%) |
| 6:00 AM to 6:29 AM | 61 (5.3%) | 99 (14.6%) |
| 6:30 AM to 6:59 AM | 61 (5.3%) | 47 (6.9%) |
| 7:00 AM to 7:29 AM | 107 (9.3%) | 128 (18.8%) |
| 7:30 AM to 7:59 AM | 161 (14.0%) | 120 (17.6%) |
| 8:00 AM to 8:29 AM | 138 (12.0%) | 117 (17.2%) |
| 8:30 AM to 8:59 AM | 0 (0.0%) | 83 (12.2%) |
| 9:00 AM to 9:59 AM | 64 (5.6%) | 0 (0.0%) |
| 10:00 AM to 10:59 AM | 0 (0.0%) | 19 (2.8%) |
| 11:00 AM to 11:59 AM | 0 (0.0%) | 0 (0.0%) |
| 12:00 PM to 3:59 PM | 129 (11.2%) | 43 (6.3%) |
| 4:00 PM to 11:59 PM | 106 (9.2%) | 8 (1.2%) |
| Total | 1,151 (100.0%) | 680 (100.0%) |
Housing Occupancy in St James
Occupancy by Ownership in St James
Of the total 1,570 dwellings in St James, owner-occupied units account for 1,254 (79.9%), while renter-occupied units make up 316 (20.1%).
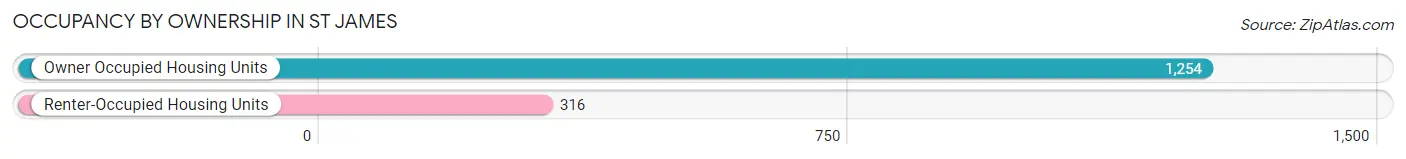
| Occupancy | # Housing Units | % Housing Units |
| Owner Occupied Housing Units | 1,254 | 79.9% |
| Renter-Occupied Housing Units | 316 | 20.1% |
| Total Occupied Housing Units | 1,570 | 100.0% |
Occupancy by Household Size in St James
| Household Size | # Housing Units | % Housing Units |
| 1-Person Household | 297 | 18.9% |
| 2-Person Household | 597 | 38.0% |
| 3-Person Household | 105 | 6.7% |
| 4+ Person Household | 571 | 36.4% |
| Total Housing Units | 1,570 | 100.0% |
Occupancy by Ownership by Household Size in St James
| Household Size | Owner-occupied | Renter-occupied |
| 1-Person Household | 152 (51.2%) | 145 (48.8%) |
| 2-Person Household | 442 (74.0%) | 155 (26.0%) |
| 3-Person Household | 89 (84.8%) | 16 (15.2%) |
| 4+ Person Household | 571 (100.0%) | 0 (0.0%) |
| Total Housing Units | 1,254 (79.9%) | 316 (20.1%) |
Occupancy by Educational Attainment in St James
| Household Size | Owner-occupied | Renter-occupied |
| Less than High School | 39 (100.0%) | 0 (0.0%) |
| High School Diploma | 269 (59.1%) | 186 (40.9%) |
| College/Associate Degree | 300 (69.8%) | 130 (30.2%) |
| Bachelor's Degree or higher | 646 (100.0%) | 0 (0.0%) |
Occupancy by Age of Householder in St James
| Age Bracket | # Households | % Households |
| Under 35 Years | 151 | 9.6% |
| 35 to 44 Years | 341 | 21.7% |
| 45 to 54 Years | 523 | 33.3% |
| 55 to 64 Years | 163 | 10.4% |
| 65 to 74 Years | 186 | 11.8% |
| 75 to 84 Years | 159 | 10.1% |
| 85 Years and Over | 47 | 3.0% |
| Total | 1,570 | 100.0% |
Housing Finances in St James
Median Income by Occupancy in St James
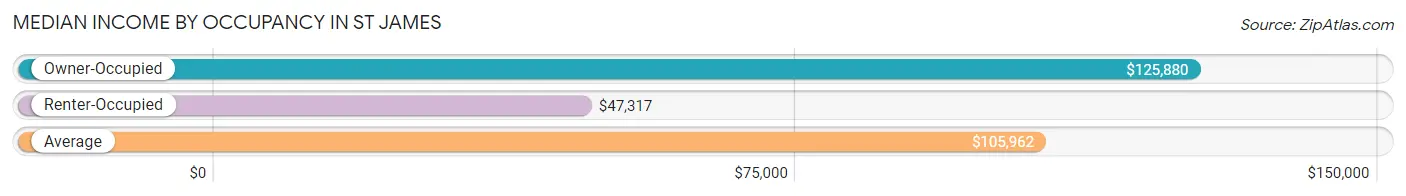
| Occupancy Type | # Households | Median Income |
| Owner-Occupied | 1,254 (79.9%) | $125,880 |
| Renter-Occupied | 316 (20.1%) | $47,317 |
| Average | 1,570 (100.0%) | $105,962 |
Occupancy by Householder Income Bracket in St James
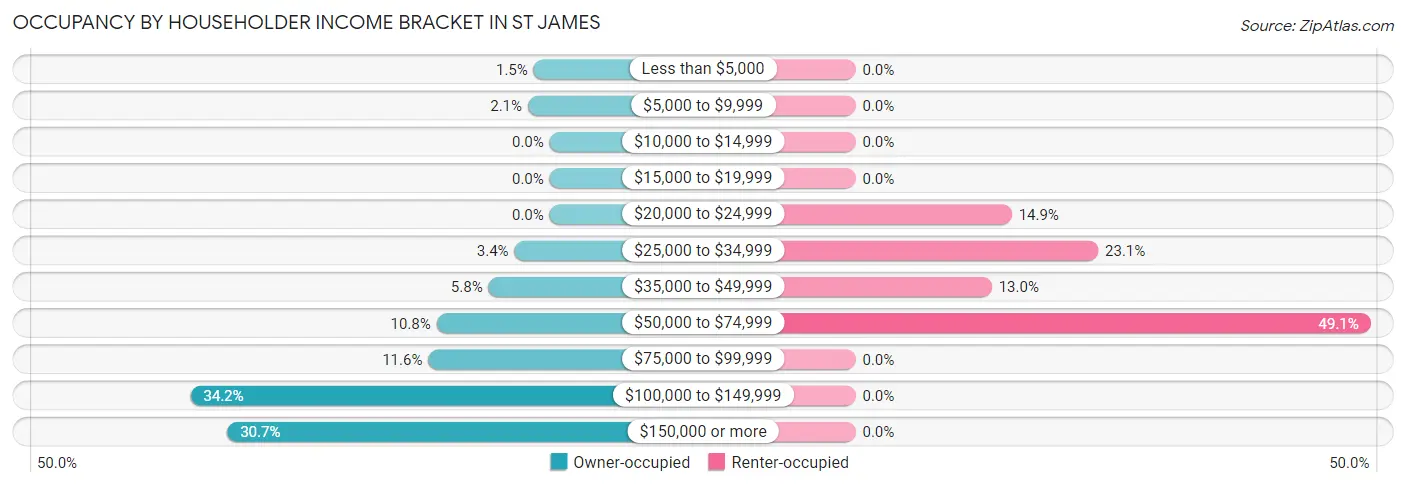
| Income Bracket | Owner-occupied | Renter-occupied |
| Less than $5,000 | 19 (1.5%) | 0 (0.0%) |
| $5,000 to $9,999 | 26 (2.1%) | 0 (0.0%) |
| $10,000 to $14,999 | 0 (0.0%) | 0 (0.0%) |
| $15,000 to $19,999 | 0 (0.0%) | 0 (0.0%) |
| $20,000 to $24,999 | 0 (0.0%) | 47 (14.9%) |
| $25,000 to $34,999 | 42 (3.4%) | 73 (23.1%) |
| $35,000 to $49,999 | 73 (5.8%) | 41 (13.0%) |
| $50,000 to $74,999 | 135 (10.8%) | 155 (49.0%) |
| $75,000 to $99,999 | 145 (11.6%) | 0 (0.0%) |
| $100,000 to $149,999 | 429 (34.2%) | 0 (0.0%) |
| $150,000 or more | 385 (30.7%) | 0 (0.0%) |
| Total | 1,254 (100.0%) | 316 (100.0%) |
Monthly Housing Cost Tiers in St James
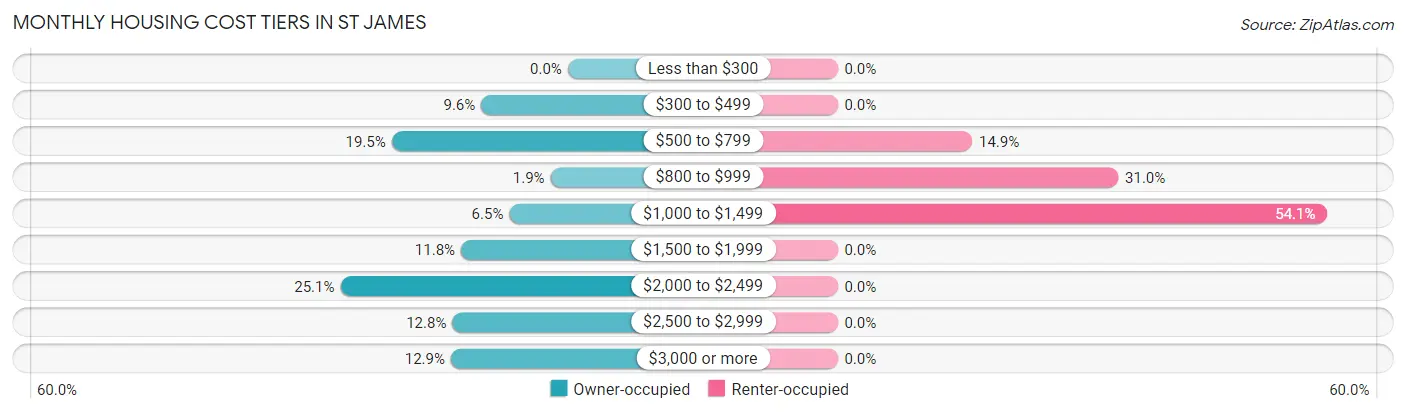
| Monthly Cost | Owner-occupied | Renter-occupied |
| Less than $300 | 0 (0.0%) | 0 (0.0%) |
| $300 to $499 | 120 (9.6%) | 0 (0.0%) |
| $500 to $799 | 244 (19.5%) | 47 (14.9%) |
| $800 to $999 | 24 (1.9%) | 98 (31.0%) |
| $1,000 to $1,499 | 81 (6.5%) | 171 (54.1%) |
| $1,500 to $1,999 | 148 (11.8%) | 0 (0.0%) |
| $2,000 to $2,499 | 315 (25.1%) | 0 (0.0%) |
| $2,500 to $2,999 | 160 (12.8%) | 0 (0.0%) |
| $3,000 or more | 162 (12.9%) | 0 (0.0%) |
| Total | 1,254 (100.0%) | 316 (100.0%) |
Physical Housing Characteristics in St James
Housing Structures in St James
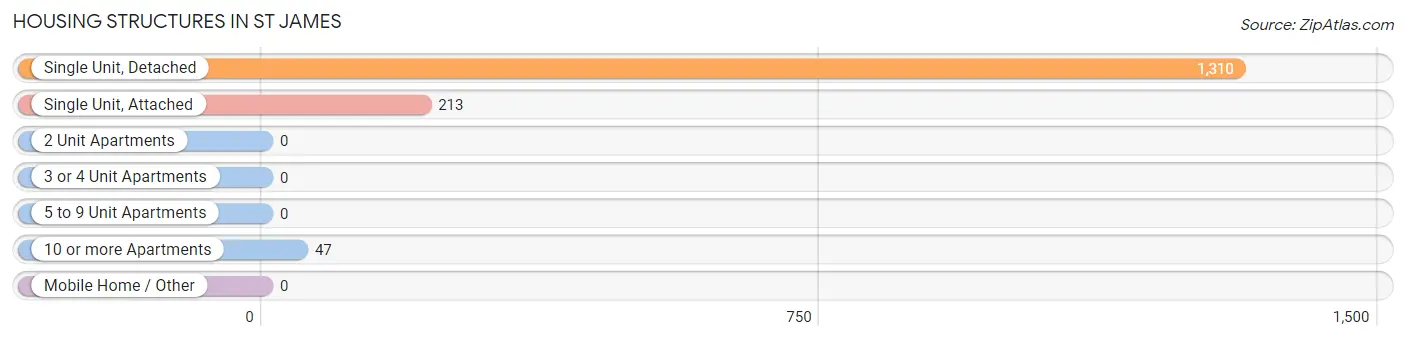
| Structure Type | # Housing Units | % Housing Units |
| Single Unit, Detached | 1,310 | 83.4% |
| Single Unit, Attached | 213 | 13.6% |
| 2 Unit Apartments | 0 | 0.0% |
| 3 or 4 Unit Apartments | 0 | 0.0% |
| 5 to 9 Unit Apartments | 0 | 0.0% |
| 10 or more Apartments | 47 | 3.0% |
| Mobile Home / Other | 0 | 0.0% |
| Total | 1,570 | 100.0% |
Housing Structures by Occupancy in St James
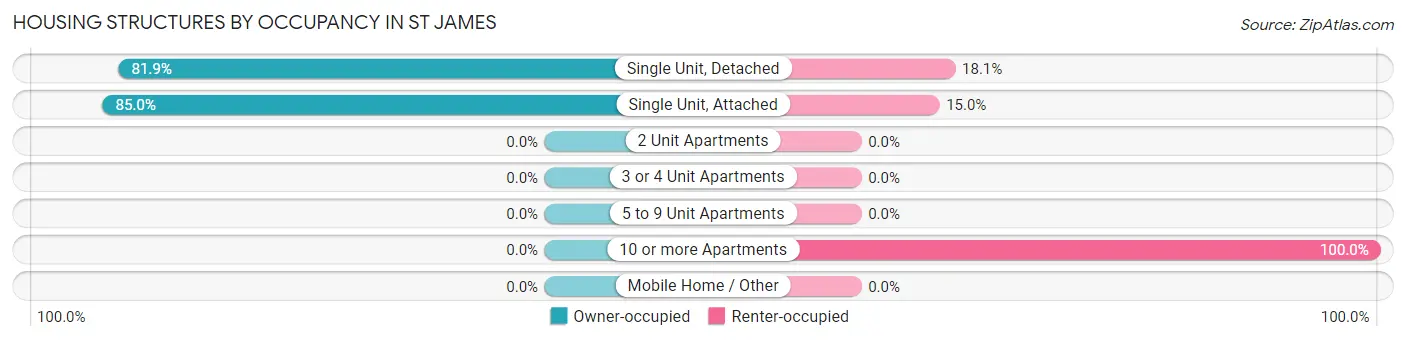
| Structure Type | Owner-occupied | Renter-occupied |
| Single Unit, Detached | 1,073 (81.9%) | 237 (18.1%) |
| Single Unit, Attached | 181 (85.0%) | 32 (15.0%) |
| 2 Unit Apartments | 0 (0.0%) | 0 (0.0%) |
| 3 or 4 Unit Apartments | 0 (0.0%) | 0 (0.0%) |
| 5 to 9 Unit Apartments | 0 (0.0%) | 0 (0.0%) |
| 10 or more Apartments | 0 (0.0%) | 47 (100.0%) |
| Mobile Home / Other | 0 (0.0%) | 0 (0.0%) |
| Total | 1,254 (79.9%) | 316 (20.1%) |
Housing Structures by Number of Rooms in St James
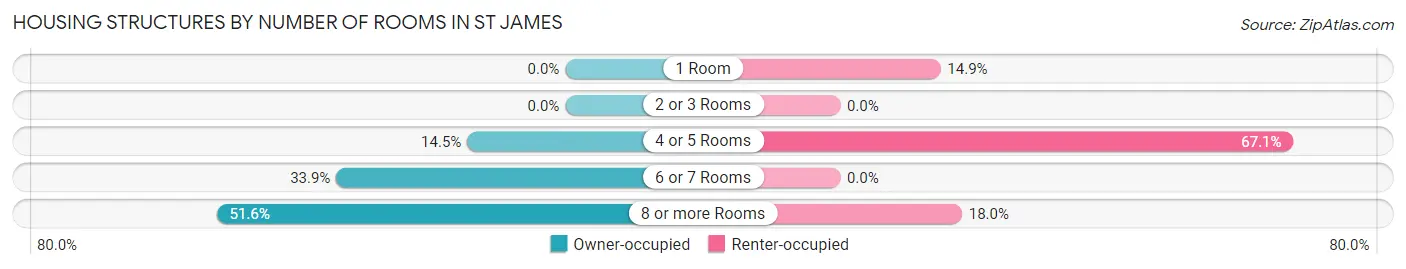
| Number of Rooms | Owner-occupied | Renter-occupied |
| 1 Room | 0 (0.0%) | 47 (14.9%) |
| 2 or 3 Rooms | 0 (0.0%) | 0 (0.0%) |
| 4 or 5 Rooms | 182 (14.5%) | 212 (67.1%) |
| 6 or 7 Rooms | 425 (33.9%) | 0 (0.0%) |
| 8 or more Rooms | 647 (51.6%) | 57 (18.0%) |
| Total | 1,254 (100.0%) | 316 (100.0%) |
Housing Structure by Heating Type in St James
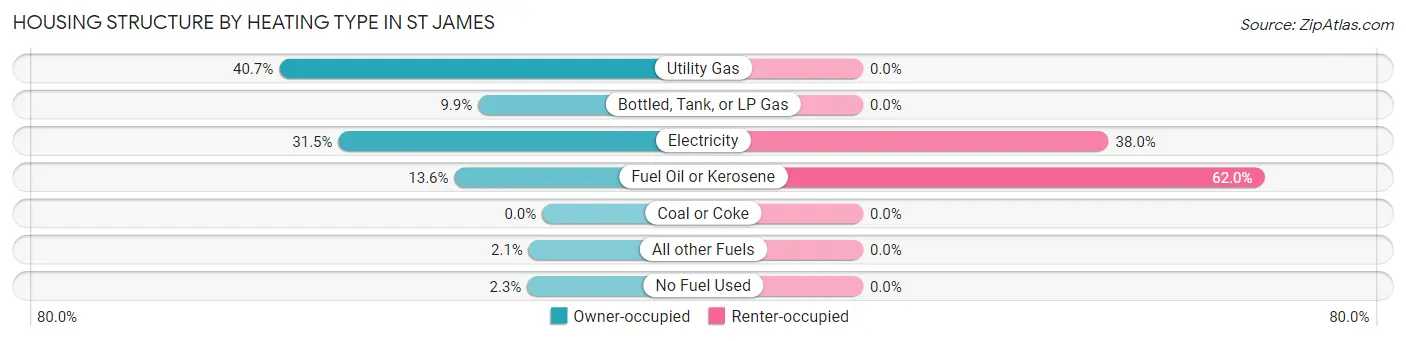
| Heating Type | Owner-occupied | Renter-occupied |
| Utility Gas | 510 (40.7%) | 0 (0.0%) |
| Bottled, Tank, or LP Gas | 124 (9.9%) | 0 (0.0%) |
| Electricity | 395 (31.5%) | 120 (38.0%) |
| Fuel Oil or Kerosene | 170 (13.6%) | 196 (62.0%) |
| Coal or Coke | 0 (0.0%) | 0 (0.0%) |
| All other Fuels | 26 (2.1%) | 0 (0.0%) |
| No Fuel Used | 29 (2.3%) | 0 (0.0%) |
| Total | 1,254 (100.0%) | 316 (100.0%) |
Household Vehicle Usage in St James
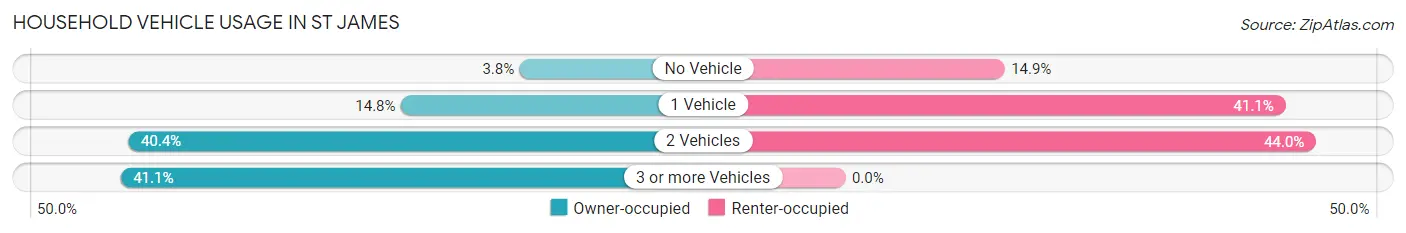
| Vehicles per Household | Owner-occupied | Renter-occupied |
| No Vehicle | 47 (3.7%) | 47 (14.9%) |
| 1 Vehicle | 186 (14.8%) | 130 (41.1%) |
| 2 Vehicles | 506 (40.4%) | 139 (44.0%) |
| 3 or more Vehicles | 515 (41.1%) | 0 (0.0%) |
| Total | 1,254 (100.0%) | 316 (100.0%) |
Real Estate & Mortgages in St James
Real Estate and Mortgage Overview in St James
| Characteristic | Without Mortgage | With Mortgage |
| Housing Units | 388 | 866 |
| Median Property Value | $336,400 | $397,000 |
| Median Household Income | $53,229 | $361 |
| Monthly Housing Costs | $554 | $162 |
| Real Estate Taxes | $2,686 | $0 |
Property Value by Mortgage Status in St James
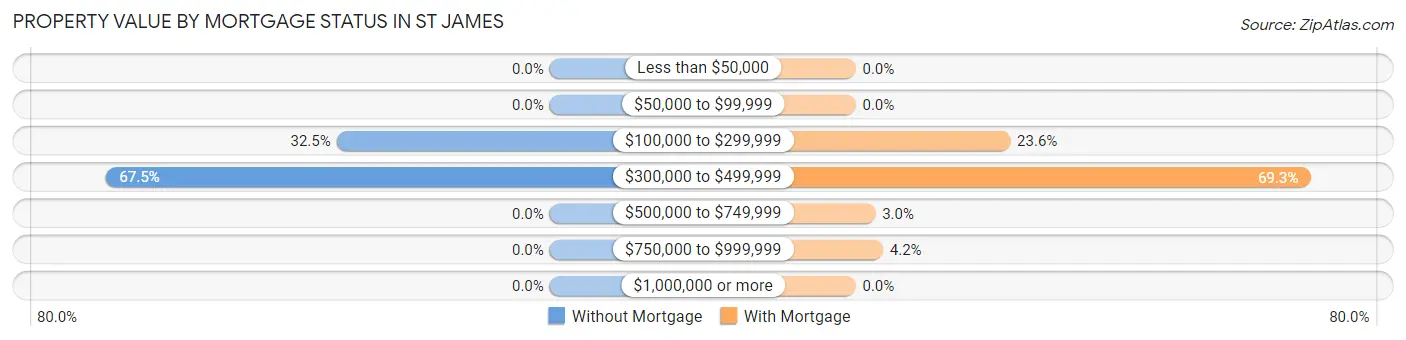
| Property Value | Without Mortgage | With Mortgage |
| Less than $50,000 | 0 (0.0%) | 0 (0.0%) |
| $50,000 to $99,999 | 0 (0.0%) | 0 (0.0%) |
| $100,000 to $299,999 | 126 (32.5%) | 204 (23.6%) |
| $300,000 to $499,999 | 262 (67.5%) | 600 (69.3%) |
| $500,000 to $749,999 | 0 (0.0%) | 26 (3.0%) |
| $750,000 to $999,999 | 0 (0.0%) | 36 (4.2%) |
| $1,000,000 or more | 0 (0.0%) | 0 (0.0%) |
| Total | 388 (100.0%) | 866 (100.0%) |
Household Income by Mortgage Status in St James
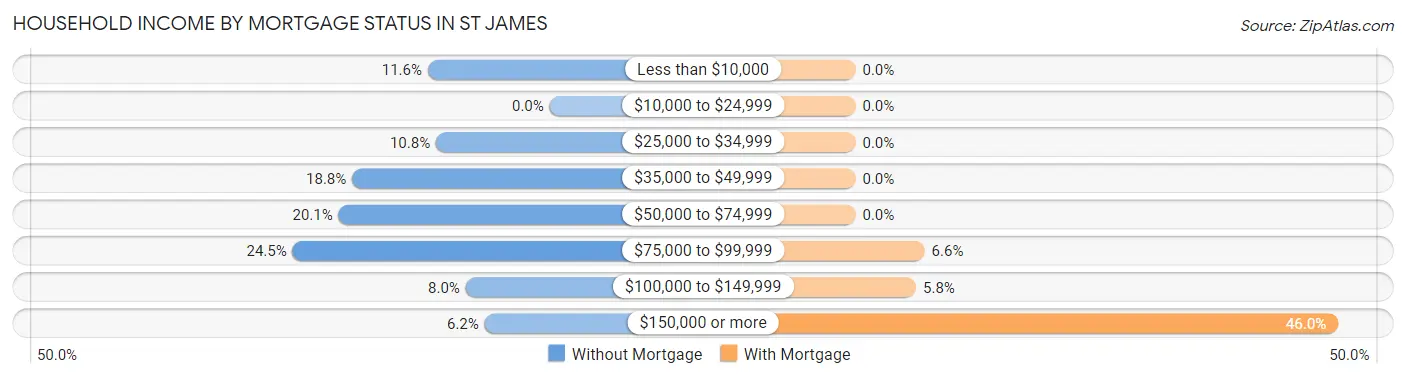
| Household Income | Without Mortgage | With Mortgage |
| Less than $10,000 | 45 (11.6%) | 0 (0.0%) |
| $10,000 to $24,999 | 0 (0.0%) | 0 (0.0%) |
| $25,000 to $34,999 | 42 (10.8%) | 0 (0.0%) |
| $35,000 to $49,999 | 73 (18.8%) | 0 (0.0%) |
| $50,000 to $74,999 | 78 (20.1%) | 0 (0.0%) |
| $75,000 to $99,999 | 95 (24.5%) | 57 (6.6%) |
| $100,000 to $149,999 | 31 (8.0%) | 50 (5.8%) |
| $150,000 or more | 24 (6.2%) | 398 (46.0%) |
| Total | 388 (100.0%) | 866 (100.0%) |
Property Value to Household Income Ratio in St James
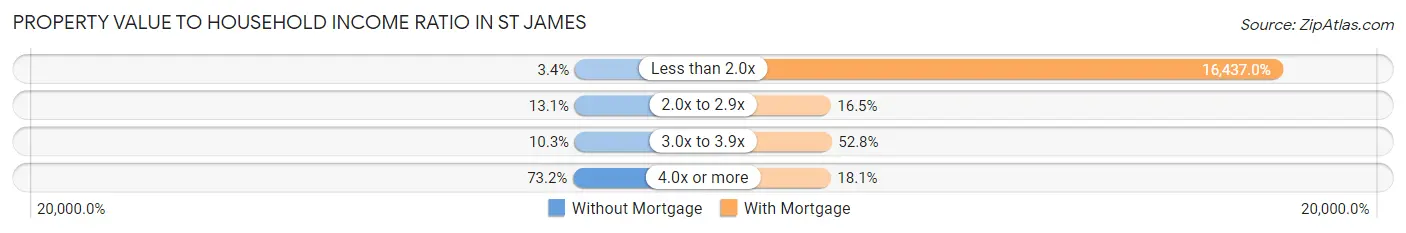
| Value-to-Income Ratio | Without Mortgage | With Mortgage |
| Less than 2.0x | 13 (3.4%) | 142,344 (16,436.9%) |
| 2.0x to 2.9x | 51 (13.1%) | 143 (16.5%) |
| 3.0x to 3.9x | 40 (10.3%) | 457 (52.8%) |
| 4.0x or more | 284 (73.2%) | 157 (18.1%) |
| Total | 388 (100.0%) | 866 (100.0%) |
Real Estate Taxes by Mortgage Status in St James
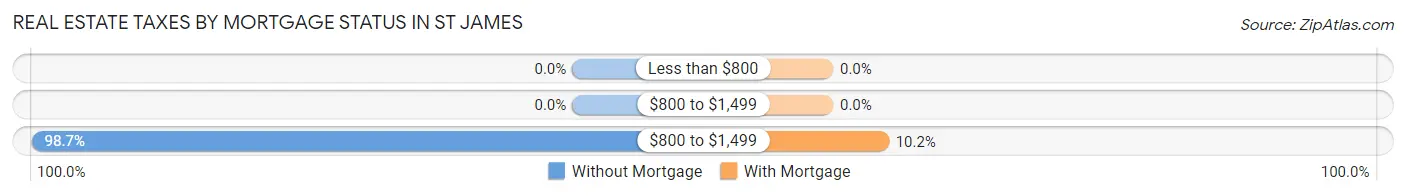
| Property Taxes | Without Mortgage | With Mortgage |
| Less than $800 | 0 (0.0%) | 0 (0.0%) |
| $800 to $1,499 | 0 (0.0%) | 0 (0.0%) |
| $800 to $1,499 | 383 (98.7%) | 88 (10.2%) |
| Total | 388 (100.0%) | 866 (100.0%) |
Health & Disability in St James
Health Insurance Coverage by Age in St James
| Age Bracket | With Coverage | Without Coverage |
| Under 6 Years | 113 (100.0%) | 0 (0.0%) |
| 6 to 18 Years | 986 (100.0%) | 0 (0.0%) |
| 19 to 25 Years | 224 (100.0%) | 0 (0.0%) |
| 26 to 34 Years | 309 (100.0%) | 0 (0.0%) |
| 35 to 44 Years | 522 (93.5%) | 36 (6.5%) |
| 45 to 54 Years | 950 (100.0%) | 0 (0.0%) |
| 55 to 64 Years | 269 (93.7%) | 18 (6.3%) |
| 65 to 74 Years | 276 (100.0%) | 0 (0.0%) |
| 75 Years and older | 362 (100.0%) | 0 (0.0%) |
| Total | 4,011 (98.7%) | 54 (1.3%) |
Health Insurance Coverage by Citizenship Status in St James
| Citizenship Status | With Coverage | Without Coverage |
| Native Born | 113 (100.0%) | 0 (0.0%) |
| Foreign Born, Citizen | 986 (100.0%) | 0 (0.0%) |
| Foreign Born, not a Citizen | 224 (100.0%) | 0 (0.0%) |
Health Insurance Coverage by Household Income in St James
| Household Income | With Coverage | Without Coverage |
| Under $25,000 | 113 (86.3%) | 18 (13.7%) |
| $25,000 to $49,999 | 297 (100.0%) | 0 (0.0%) |
| $50,000 to $74,999 | 540 (100.0%) | 0 (0.0%) |
| $75,000 to $99,999 | 369 (100.0%) | 0 (0.0%) |
| $100,000 and over | 2,651 (98.7%) | 36 (1.3%) |
Public vs Private Health Insurance Coverage by Age in St James
| Age Bracket | Public Insurance | Private Insurance |
| Under 6 | 0 (0.0%) | 113 (100.0%) |
| 6 to 18 Years | 130 (13.2%) | 856 (86.8%) |
| 19 to 25 Years | 21 (9.4%) | 203 (90.6%) |
| 25 to 34 Years | 20 (6.5%) | 293 (94.8%) |
| 35 to 44 Years | 48 (8.6%) | 511 (91.6%) |
| 45 to 54 Years | 0 (0.0%) | 950 (100.0%) |
| 55 to 64 Years | 34 (11.8%) | 254 (88.5%) |
| 65 to 74 Years | 257 (93.1%) | 213 (77.2%) |
| 75 Years and over | 362 (100.0%) | 239 (66.0%) |
| Total | 872 (21.4%) | 3,632 (89.3%) |
Disability Status by Sex by Age in St James
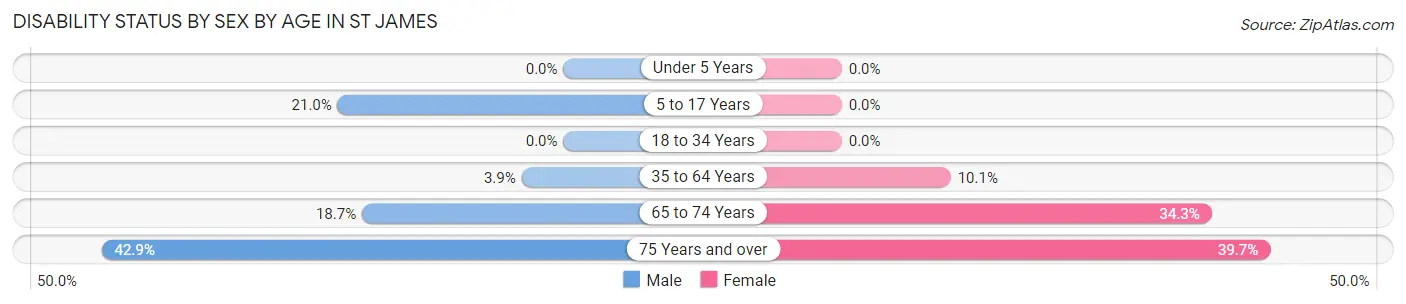
| Age Bracket | Male | Female |
| Under 5 Years | 0 (0.0%) | 0 (0.0%) |
| 5 to 17 Years | 93 (20.9%) | 0 (0.0%) |
| 18 to 34 Years | 0 (0.0%) | 0 (0.0%) |
| 35 to 64 Years | 39 (3.9%) | 80 (10.1%) |
| 65 to 74 Years | 20 (18.7%) | 58 (34.3%) |
| 75 Years and over | 57 (42.9%) | 91 (39.7%) |
Disability Class by Sex by Age in St James
Disability Class: Hearing Difficulty
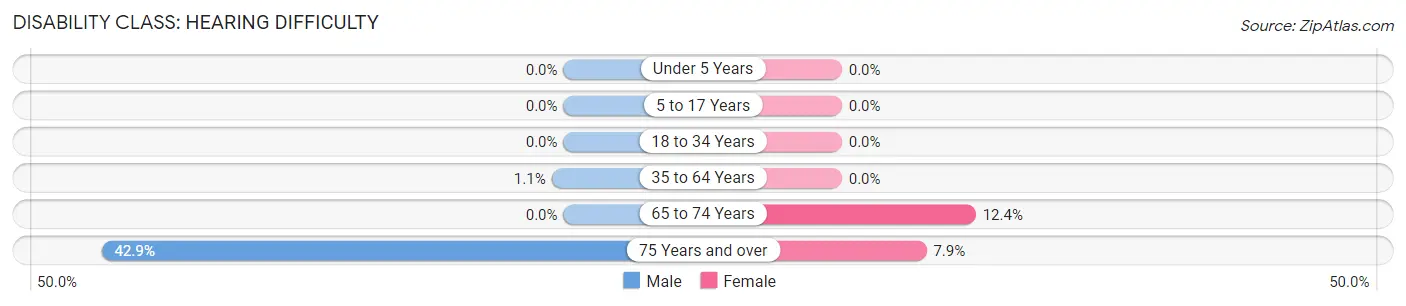
| Age Bracket | Male | Female |
| Under 5 Years | 0 (0.0%) | 0 (0.0%) |
| 5 to 17 Years | 0 (0.0%) | 0 (0.0%) |
| 18 to 34 Years | 0 (0.0%) | 0 (0.0%) |
| 35 to 64 Years | 11 (1.1%) | 0 (0.0%) |
| 65 to 74 Years | 0 (0.0%) | 21 (12.4%) |
| 75 Years and over | 57 (42.9%) | 18 (7.9%) |
Disability Class: Vision Difficulty
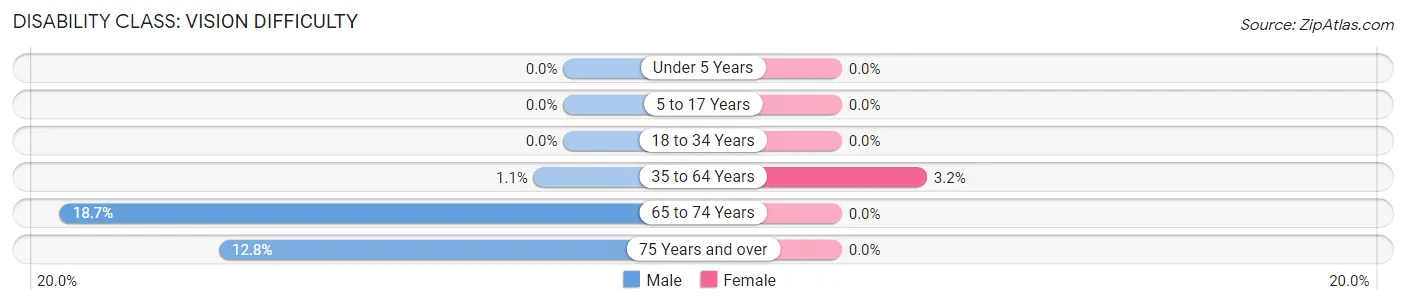
| Age Bracket | Male | Female |
| Under 5 Years | 0 (0.0%) | 0 (0.0%) |
| 5 to 17 Years | 0 (0.0%) | 0 (0.0%) |
| 18 to 34 Years | 0 (0.0%) | 0 (0.0%) |
| 35 to 64 Years | 11 (1.1%) | 25 (3.2%) |
| 65 to 74 Years | 20 (18.7%) | 0 (0.0%) |
| 75 Years and over | 17 (12.8%) | 0 (0.0%) |
Disability Class: Cognitive Difficulty
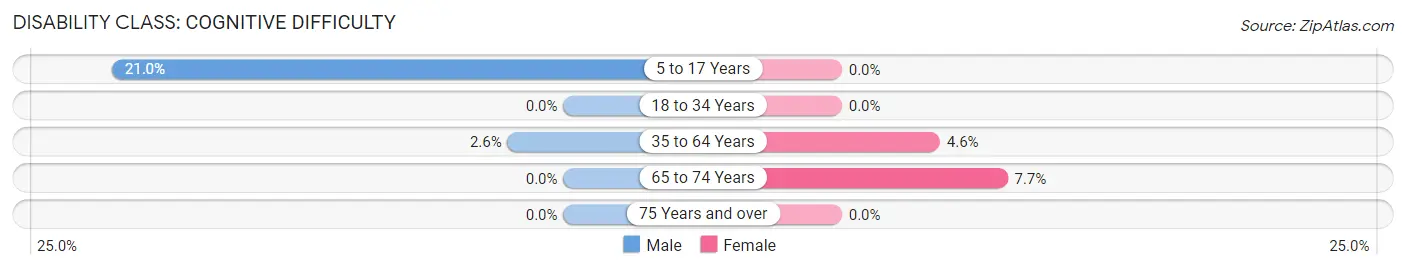
| Age Bracket | Male | Female |
| 5 to 17 Years | 93 (20.9%) | 0 (0.0%) |
| 18 to 34 Years | 0 (0.0%) | 0 (0.0%) |
| 35 to 64 Years | 26 (2.6%) | 36 (4.5%) |
| 65 to 74 Years | 0 (0.0%) | 13 (7.7%) |
| 75 Years and over | 0 (0.0%) | 0 (0.0%) |
Disability Class: Ambulatory Difficulty
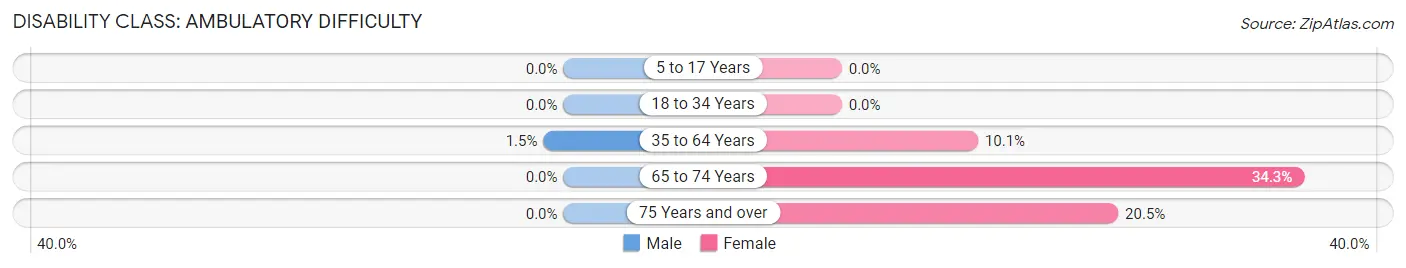
| Age Bracket | Male | Female |
| 5 to 17 Years | 0 (0.0%) | 0 (0.0%) |
| 18 to 34 Years | 0 (0.0%) | 0 (0.0%) |
| 35 to 64 Years | 15 (1.5%) | 80 (10.1%) |
| 65 to 74 Years | 0 (0.0%) | 58 (34.3%) |
| 75 Years and over | 0 (0.0%) | 47 (20.5%) |
Disability Class: Self-Care Difficulty
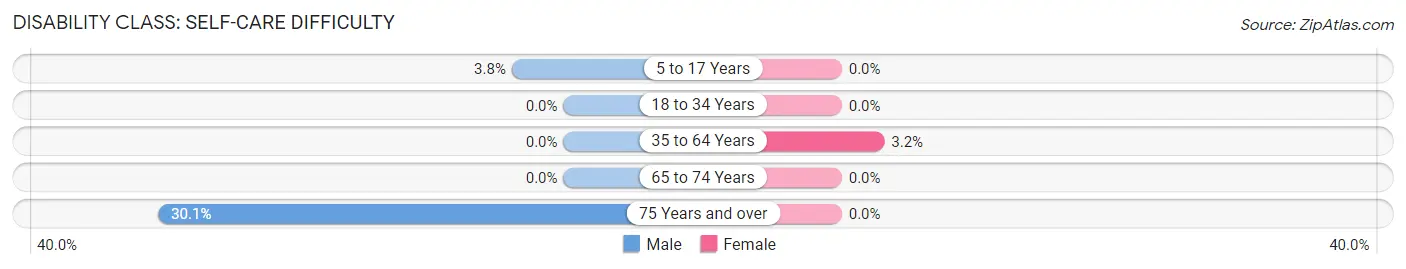
| Age Bracket | Male | Female |
| 5 to 17 Years | 17 (3.8%) | 0 (0.0%) |
| 18 to 34 Years | 0 (0.0%) | 0 (0.0%) |
| 35 to 64 Years | 0 (0.0%) | 25 (3.2%) |
| 65 to 74 Years | 0 (0.0%) | 0 (0.0%) |
| 75 Years and over | 40 (30.1%) | 0 (0.0%) |
Technology Access in St James
Computing Device Access in St James
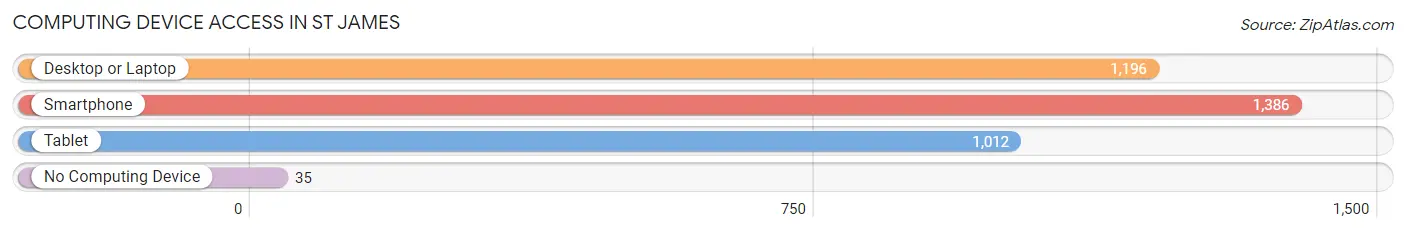
| Device Type | # Households | % Households |
| Desktop or Laptop | 1,196 | 76.2% |
| Smartphone | 1,386 | 88.3% |
| Tablet | 1,012 | 64.5% |
| No Computing Device | 35 | 2.2% |
| Total | 1,570 | 100.0% |
Internet Access in St James
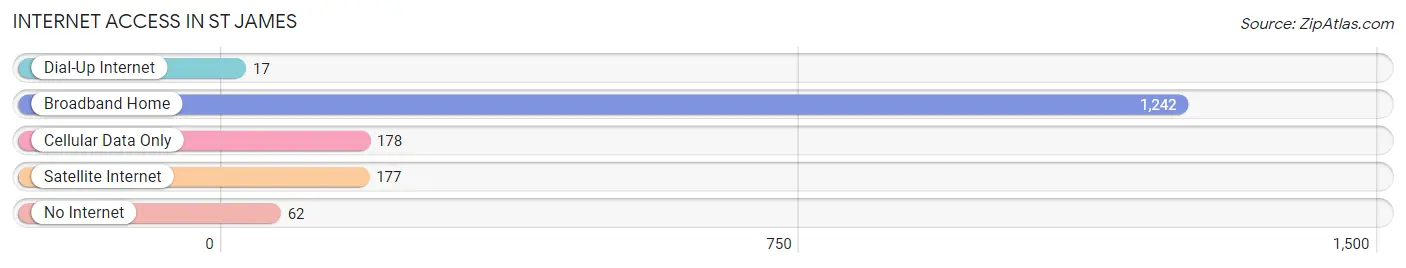
| Internet Type | # Households | % Households |
| Dial-Up Internet | 17 | 1.1% |
| Broadband Home | 1,242 | 79.1% |
| Cellular Data Only | 178 | 11.3% |
| Satellite Internet | 177 | 11.3% |
| No Internet | 62 | 4.0% |
| Total | 1,570 | 100.0% |
St James Summary
St. James is a small town located in Maryland, United States. It is situated in St. Mary’s County, and is part of the Lexington Park Metropolitan Statistical Area. The town has a population of approximately 1,500 people, and is located on the banks of the Patuxent River.
History
St. James was founded in 1706 by a group of English settlers. The town was named after the patron saint of England, St. James. The settlers were attracted to the area due to its fertile soil and abundant natural resources. The town quickly grew and became a thriving agricultural community.
In the late 19th century, St. James began to experience a period of industrialization. The town was home to several factories, including a cannery, a sawmill, and a brickyard. The town also had a thriving shipbuilding industry, which produced a variety of vessels, including schooners and sloops.
In the early 20th century, St. James experienced a period of decline. The factories and shipyards closed, and the population began to decline. However, in the late 20th century, the town experienced a resurgence. The town was revitalized with the construction of a new marina and the opening of several new businesses.
Geography
St. James is located in St. Mary’s County, Maryland. The town is situated on the banks of the Patuxent River, and is surrounded by lush forests and rolling hills. The town is located approximately 30 miles south of Washington, D.C.
The climate in St. James is humid subtropical, with hot, humid summers and mild winters. The average annual temperature is around 60 degrees Fahrenheit. The town receives an average of 45 inches of precipitation per year.
Economy
St. James has a diverse economy. The town is home to several businesses, including restaurants, retail stores, and professional services. The town is also home to a marina, which provides a variety of services to boaters.
The town is also home to several government agencies, including the St. Mary’s County Sheriff’s Office and the St. Mary’s County Health Department. The town is also home to a branch of the University of Maryland.
Demographics
As of the 2010 census, St. James had a population of 1,500 people. The racial makeup of the town was 94.7% White, 2.7% African American, 0.7% Native American, 0.3% Asian, and 1.6% from other races. The median household income was $50,000, and the median age was 40.
St. James is a small town with a rich history and a diverse economy. The town is home to a variety of businesses, government agencies, and educational institutions. The town has a population of approximately 1,500 people, and is located on the banks of the Patuxent River. The town has a humid subtropical climate, with hot, humid summers and mild winters. The town has a median household income of $50,000, and a median age of 40.
Common Questions
What is Per Capita Income in St James?
Per Capita income in St James is $42,143.
What is the Median Family Income in St James?
Median Family Income in St James is $125,324.
What is the Median Household income in St James?
Median Household Income in St James is $105,962.
What is Income or Wage Gap in St James?
Income or Wage Gap in St James is 39.0%.
Women in St James earn 61.0 cents for every dollar earned by a man.
What is Inequality or Gini Index in St James?
Inequality or Gini Index in St James is 0.33.
What is the Total Population of St James?
Total Population of St James is 4,106.
What is the Total Male Population of St James?
Total Male Population of St James is 2,032.
What is the Total Female Population of St James?
Total Female Population of St James is 2,074.
What is the Ratio of Males per 100 Females in St James?
There are 97.97 Males per 100 Females in St James.
What is the Ratio of Females per 100 Males in St James?
There are 102.07 Females per 100 Males in St James.
What is the Median Population Age in St James?
Median Population Age in St James is 43.2 Years.
What is the Average Family Size in St James
Average Family Size in St James is 3.0 People.
What is the Average Household Size in St James
Average Household Size in St James is 2.6 People.
How Large is the Labor Force in St James?
There are 2,155 People in the Labor Forcein in St James.
What is the Percentage of People in the Labor Force in St James?
66.2% of People are in the Labor Force in St James.
What is the Unemployment Rate in St James?
Unemployment Rate in St James is 0.5%.