Cities with the Most Immigrants from Eastern Asia in Maryland
RELATED REPORTS & OPTIONS
Eastern Asia
Maryland
Compare Cities
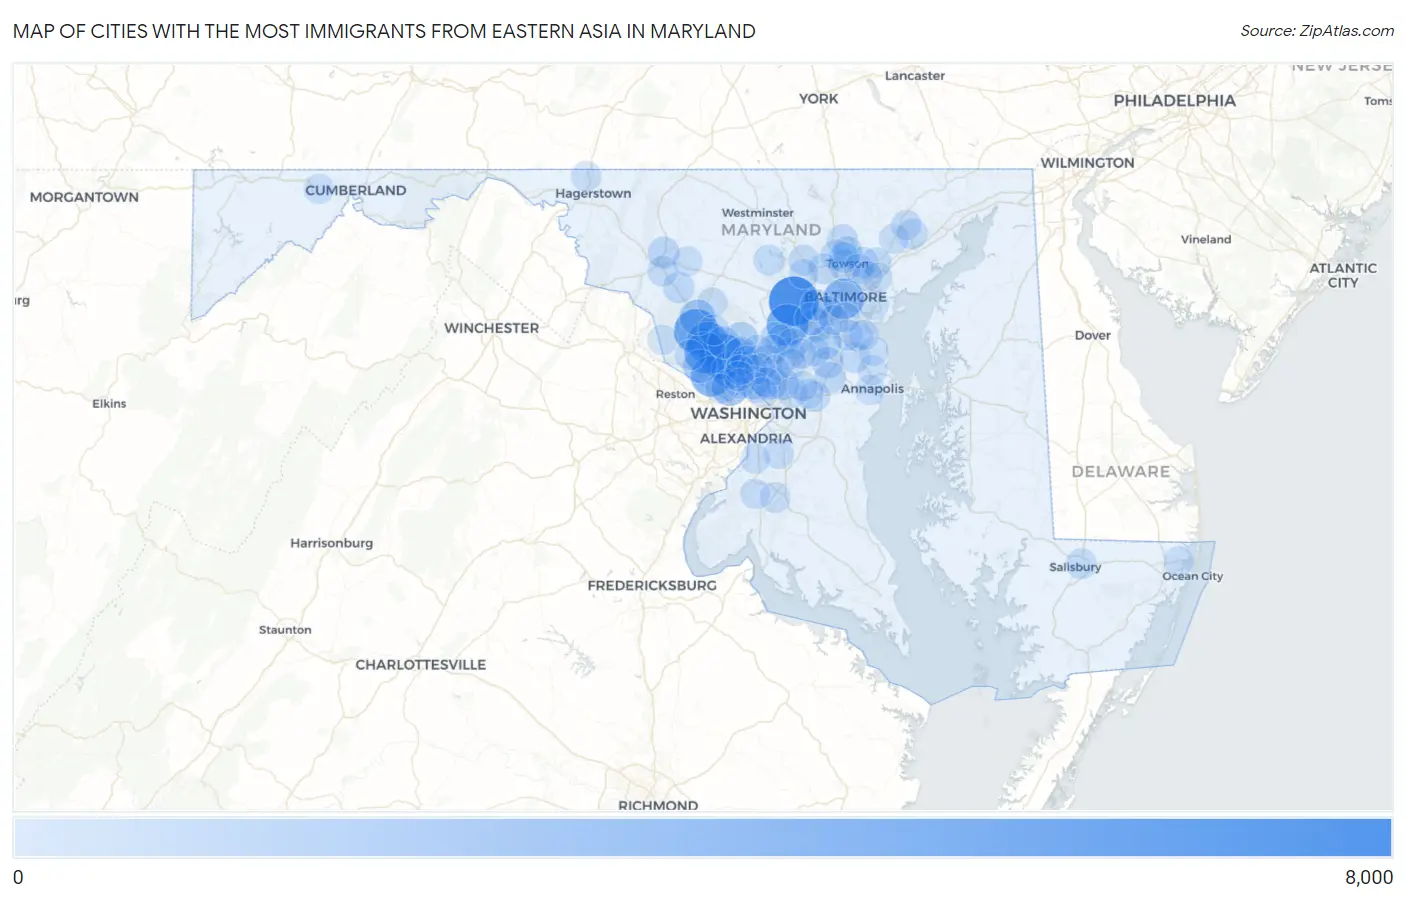
Map of Cities with the Most Immigrants from Eastern Asia in Maryland
0
8,000
Cities with the Most Immigrants from Eastern Asia in Maryland
| City | Eastern Asia | vs State | vs National | |
| 1. | Ellicott City | 7,179 | 95,370(7.53%)#1 | 4,223,726(0.17%)#72 |
| 2. | Rockville | 5,674 | 95,370(5.95%)#2 | 4,223,726(0.13%)#95 |
| 3. | Germantown | 5,259 | 95,370(5.51%)#3 | 4,223,726(0.12%)#105 |
| 4. | Columbia | 4,296 | 95,370(4.50%)#4 | 4,223,726(0.10%)#137 |
| 5. | Gaithersburg | 4,155 | 95,370(4.36%)#5 | 4,223,726(0.10%)#141 |
| 6. | North Potomac | 4,139 | 95,370(4.34%)#6 | 4,223,726(0.10%)#142 |
| 7. | Potomac | 3,904 | 95,370(4.09%)#7 | 4,223,726(0.09%)#149 |
| 8. | Baltimore | 3,846 | 95,370(4.03%)#8 | 4,223,726(0.09%)#150 |
| 9. | North Bethesda | 2,685 | 95,370(2.82%)#9 | 4,223,726(0.06%)#208 |
| 10. | Bethesda | 2,457 | 95,370(2.58%)#10 | 4,223,726(0.06%)#228 |
| 11. | Clarksburg | 2,089 | 95,370(2.19%)#11 | 4,223,726(0.05%)#275 |
| 12. | College Park | 1,396 | 95,370(1.46%)#12 | 4,223,726(0.03%)#409 |
| 13. | Travilah | 1,394 | 95,370(1.46%)#13 | 4,223,726(0.03%)#412 |
| 14. | Olney | 1,332 | 95,370(1.40%)#14 | 4,223,726(0.03%)#428 |
| 15. | Elkridge | 1,303 | 95,370(1.37%)#15 | 4,223,726(0.03%)#436 |
| 16. | Silver Spring | 1,280 | 95,370(1.34%)#16 | 4,223,726(0.03%)#447 |
| 17. | Severn | 1,209 | 95,370(1.27%)#17 | 4,223,726(0.03%)#470 |
| 18. | Aspen Hill | 1,123 | 95,370(1.18%)#18 | 4,223,726(0.03%)#498 |
| 19. | Ilchester | 1,121 | 95,370(1.18%)#19 | 4,223,726(0.03%)#499 |
| 20. | Greenbelt | 973 | 95,370(1.02%)#20 | 4,223,726(0.02%)#554 |
| 21. | Redland | 902 | 95,370(0.95%)#21 | 4,223,726(0.02%)#589 |
| 22. | Wheaton | 874 | 95,370(0.92%)#22 | 4,223,726(0.02%)#601 |
| 23. | Towson | 768 | 95,370(0.81%)#23 | 4,223,726(0.02%)#662 |
| 24. | Frederick | 753 | 95,370(0.79%)#24 | 4,223,726(0.02%)#672 |
| 25. | Laurel | 735 | 95,370(0.77%)#25 | 4,223,726(0.02%)#686 |
| 26. | Leisure World | 694 | 95,370(0.73%)#26 | 4,223,726(0.02%)#719 |
| 27. | Odenton | 672 | 95,370(0.70%)#27 | 4,223,726(0.02%)#736 |
| 28. | Catonsville | 641 | 95,370(0.67%)#28 | 4,223,726(0.02%)#770 |
| 29. | Urbana | 619 | 95,370(0.65%)#29 | 4,223,726(0.01%)#808 |
| 30. | Scaggsville | 619 | 95,370(0.65%)#30 | 4,223,726(0.01%)#809 |
| 31. | Crofton | 585 | 95,370(0.61%)#31 | 4,223,726(0.01%)#841 |
| 32. | Carney | 561 | 95,370(0.59%)#32 | 4,223,726(0.01%)#870 |
| 33. | Cockeysville | 538 | 95,370(0.56%)#33 | 4,223,726(0.01%)#900 |
| 34. | Woodlawn Cdp Baltimore County | 525 | 95,370(0.55%)#34 | 4,223,726(0.01%)#915 |
| 35. | North Laurel | 472 | 95,370(0.49%)#35 | 4,223,726(0.01%)#981 |
| 36. | Fulton | 455 | 95,370(0.48%)#36 | 4,223,726(0.01%)#1,014 |
| 37. | Mays Chapel | 453 | 95,370(0.47%)#37 | 4,223,726(0.01%)#1,022 |
| 38. | Pikesville | 425 | 95,370(0.45%)#38 | 4,223,726(0.01%)#1,067 |
| 39. | Colesville | 423 | 95,370(0.44%)#39 | 4,223,726(0.01%)#1,071 |
| 40. | Eldersburg | 395 | 95,370(0.41%)#40 | 4,223,726(0.01%)#1,127 |
| 41. | Severna Park | 394 | 95,370(0.41%)#41 | 4,223,726(0.01%)#1,131 |
| 42. | Glen Burnie | 392 | 95,370(0.41%)#42 | 4,223,726(0.01%)#1,134 |
| 43. | Bel Air South | 382 | 95,370(0.40%)#43 | 4,223,726(0.01%)#1,156 |
| 44. | Salisbury | 381 | 95,370(0.40%)#44 | 4,223,726(0.01%)#1,159 |
| 45. | Lutherville | 374 | 95,370(0.39%)#45 | 4,223,726(0.01%)#1,175 |
| 46. | Montgomery Village | 371 | 95,370(0.39%)#46 | 4,223,726(0.01%)#1,181 |
| 47. | Glenmont | 371 | 95,370(0.39%)#47 | 4,223,726(0.01%)#1,183 |
| 48. | Fairland | 363 | 95,370(0.38%)#48 | 4,223,726(0.01%)#1,208 |
| 49. | Perry Hall | 356 | 95,370(0.37%)#49 | 4,223,726(0.01%)#1,236 |
| 50. | Cloverly | 341 | 95,370(0.36%)#50 | 4,223,726(0.01%)#1,275 |
| 51. | Flower Hill | 339 | 95,370(0.36%)#51 | 4,223,726(0.01%)#1,285 |
| 52. | Ballenger Creek | 314 | 95,370(0.33%)#52 | 4,223,726(0.01%)#1,354 |
| 53. | Bowie | 311 | 95,370(0.33%)#53 | 4,223,726(0.01%)#1,361 |
| 54. | Owings Mills | 311 | 95,370(0.33%)#54 | 4,223,726(0.01%)#1,363 |
| 55. | Waldorf | 297 | 95,370(0.31%)#55 | 4,223,726(0.01%)#1,399 |
| 56. | Pasadena | 290 | 95,370(0.30%)#56 | 4,223,726(0.01%)#1,428 |
| 57. | Darnestown | 290 | 95,370(0.30%)#57 | 4,223,726(0.01%)#1,429 |
| 58. | Burtonsville | 280 | 95,370(0.29%)#58 | 4,223,726(0.01%)#1,460 |
| 59. | White Oak | 265 | 95,370(0.28%)#59 | 4,223,726(0.01%)#1,515 |
| 60. | Timonium | 241 | 95,370(0.25%)#60 | 4,223,726(0.01%)#1,615 |
| 61. | Clinton | 236 | 95,370(0.25%)#61 | 4,223,726(0.01%)#1,635 |
| 62. | Beltsville | 234 | 95,370(0.25%)#62 | 4,223,726(0.01%)#1,648 |
| 63. | Bel Air | 227 | 95,370(0.24%)#63 | 4,223,726(0.01%)#1,689 |
| 64. | Kemp Mill | 219 | 95,370(0.23%)#64 | 4,223,726(0.01%)#1,724 |
| 65. | Fort Meade | 215 | 95,370(0.23%)#65 | 4,223,726(0.01%)#1,756 |
| 66. | Maugansville | 208 | 95,370(0.22%)#66 | 4,223,726(0.00%)#1,787 |
| 67. | Fort Washington | 200 | 95,370(0.21%)#67 | 4,223,726(0.00%)#1,829 |
| 68. | Riviera Beach | 200 | 95,370(0.21%)#68 | 4,223,726(0.00%)#1,834 |
| 69. | Arbutus | 195 | 95,370(0.20%)#69 | 4,223,726(0.00%)#1,862 |
| 70. | South Laurel | 188 | 95,370(0.20%)#70 | 4,223,726(0.00%)#1,901 |
| 71. | Adelphi | 184 | 95,370(0.19%)#71 | 4,223,726(0.00%)#1,924 |
| 72. | Poolesville | 177 | 95,370(0.19%)#72 | 4,223,726(0.00%)#1,977 |
| 73. | Annapolis | 167 | 95,370(0.18%)#73 | 4,223,726(0.00%)#2,048 |
| 74. | Takoma Park | 167 | 95,370(0.18%)#74 | 4,223,726(0.00%)#2,051 |
| 75. | Damascus | 166 | 95,370(0.17%)#75 | 4,223,726(0.00%)#2,059 |
| 76. | Chevy Chase | 163 | 95,370(0.17%)#76 | 4,223,726(0.00%)#2,083 |
| 77. | Linthicum | 159 | 95,370(0.17%)#77 | 4,223,726(0.00%)#2,111 |
| 78. | Lanham | 158 | 95,370(0.17%)#78 | 4,223,726(0.00%)#2,124 |
| 79. | Honeygo | 157 | 95,370(0.16%)#79 | 4,223,726(0.00%)#2,136 |
| 80. | Arnold | 155 | 95,370(0.16%)#80 | 4,223,726(0.00%)#2,154 |
| 81. | Ocean Pines | 152 | 95,370(0.16%)#81 | 4,223,726(0.00%)#2,187 |
| 82. | Frostburg | 149 | 95,370(0.16%)#82 | 4,223,726(0.00%)#2,218 |
| 83. | Cabin John | 148 | 95,370(0.16%)#83 | 4,223,726(0.00%)#2,227 |
| 84. | Parkville | 143 | 95,370(0.15%)#84 | 4,223,726(0.00%)#2,263 |
| 85. | Brooklyn Park | 139 | 95,370(0.15%)#85 | 4,223,726(0.00%)#2,305 |
| 86. | Fairwood | 139 | 95,370(0.15%)#86 | 4,223,726(0.00%)#2,309 |
| 87. | Dundalk | 137 | 95,370(0.14%)#87 | 4,223,726(0.00%)#2,319 |
| 88. | Bensville | 137 | 95,370(0.14%)#88 | 4,223,726(0.00%)#2,325 |
| 89. | North Kensington | 137 | 95,370(0.14%)#89 | 4,223,726(0.00%)#2,328 |
| 90. | Linganore | 136 | 95,370(0.14%)#90 | 4,223,726(0.00%)#2,334 |
| 91. | Pleasant Hills | 136 | 95,370(0.14%)#91 | 4,223,726(0.00%)#2,341 |
| 92. | Glenn Dale | 134 | 95,370(0.14%)#92 | 4,223,726(0.00%)#2,350 |
| 93. | Rossville | 133 | 95,370(0.14%)#93 | 4,223,726(0.00%)#2,366 |
| 94. | Overlea | 129 | 95,370(0.14%)#94 | 4,223,726(0.00%)#2,405 |
| 95. | Green Valley | 128 | 95,370(0.13%)#95 | 4,223,726(0.00%)#2,413 |
| 96. | Chillum | 122 | 95,370(0.13%)#96 | 4,223,726(0.00%)#2,467 |
| 97. | South Kensington | 119 | 95,370(0.12%)#97 | 4,223,726(0.00%)#2,502 |
| 98. | Maryland City | 116 | 95,370(0.12%)#98 | 4,223,726(0.00%)#2,530 |
| 99. | Lake Shore | 113 | 95,370(0.12%)#99 | 4,223,726(0.00%)#2,565 |
| 100. | Randallstown | 111 | 95,370(0.12%)#100 | 4,223,726(0.00%)#2,596 |
Common Questions
What are the Top 10 Cities with the Most Immigrants from Eastern Asia in Maryland?
Top 10 Cities with the Most Immigrants from Eastern Asia in Maryland are:
#1
7,179
#2
5,674
#3
5,259
#4
4,296
#5
4,155
#6
4,139
#7
3,904
#8
3,846
#9
2,685
#10
2,457
What city has the Most Immigrants from Eastern Asia in Maryland?
Ellicott City has the Most Immigrants from Eastern Asia in Maryland with 7,179.
What is the Total Immigrants from Eastern Asia in the State of Maryland?
Total Immigrants from Eastern Asia in Maryland is 95,370.
What is the Total Immigrants from Eastern Asia in the United States?
Total Immigrants from Eastern Asia in the United States is 4,223,726.