Cedarville, MD Map & Demographics
Cedarville Map
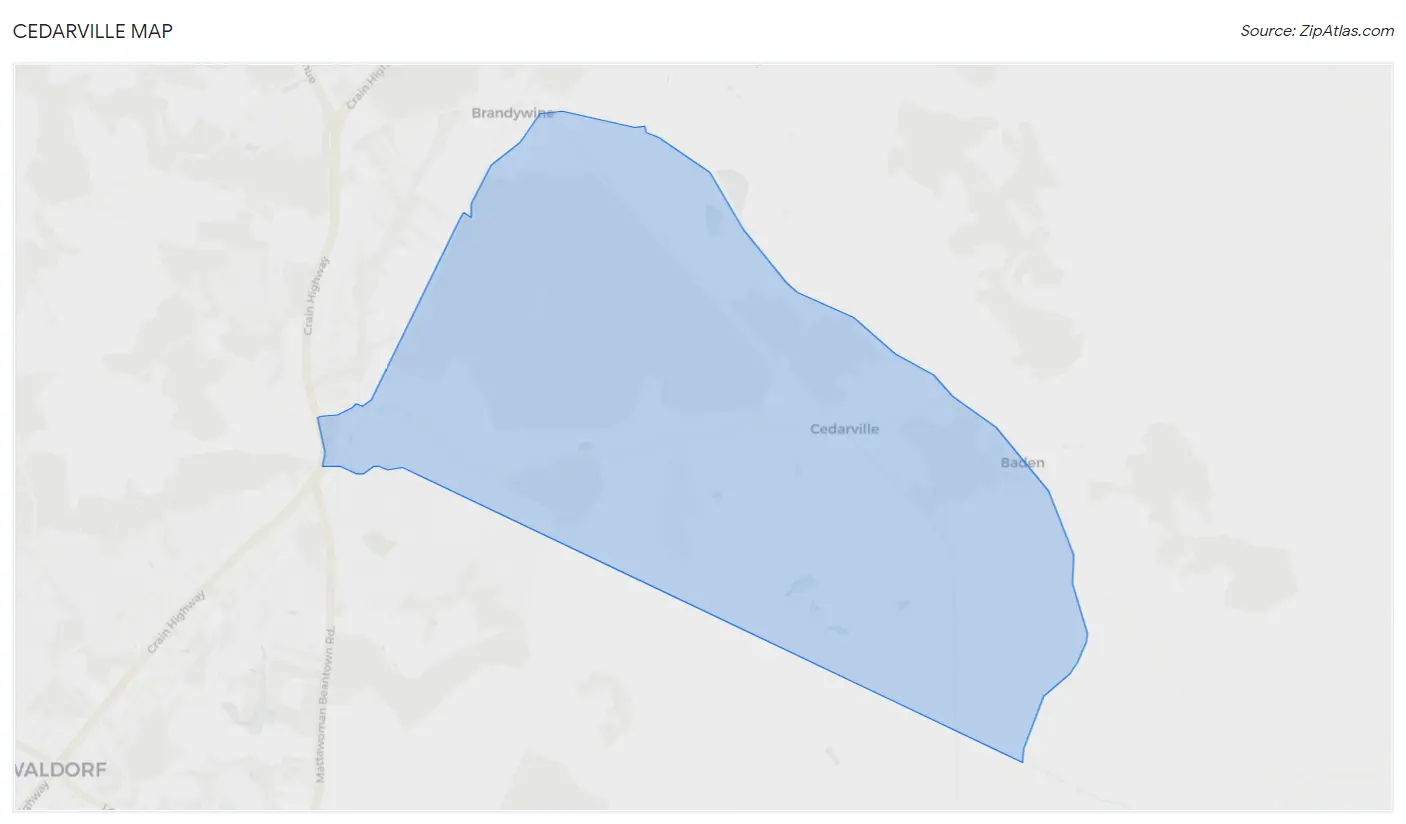
Cedarville Overview
$43,249
PER CAPITA INCOME
$148,409
AVG FAMILY INCOME
$108,125
AVG HOUSEHOLD INCOME
0.34
INEQUALITY / GINI INDEX
827
TOTAL POPULATION
523
MALE POPULATION
304
FEMALE POPULATION
172.04
MALES / 100 FEMALES
58.13
FEMALES / 100 MALES
53.6
MEDIAN AGE
3.3
AVG FAMILY SIZE
2.7
AVG HOUSEHOLD SIZE
466
LABOR FORCE [ PEOPLE ]
68.6%
PERCENT IN LABOR FORCE
2.6%
UNEMPLOYMENT RATE
Income in Cedarville
Income Overview in Cedarville
Per Capita Income in Cedarville is $43,249, while median incomes of families and households are $148,409 and $108,125 respectively.
| Characteristic | Number | Measure |
| Per Capita Income | 827 | $43,249 |
| Median Family Income | 230 | $148,409 |
| Mean Family Income | 230 | $138,680 |
| Median Household Income | 302 | $108,125 |
| Mean Household Income | 302 | $117,109 |
| Income Deficit | 230 | $0 |
| Wage / Income Gap (%) | 827 | 0.00% |
| Wage / Income Gap ($) | 827 | 100.00¢ per $1 |
| Gini / Inequality Index | 827 | 0.34 |
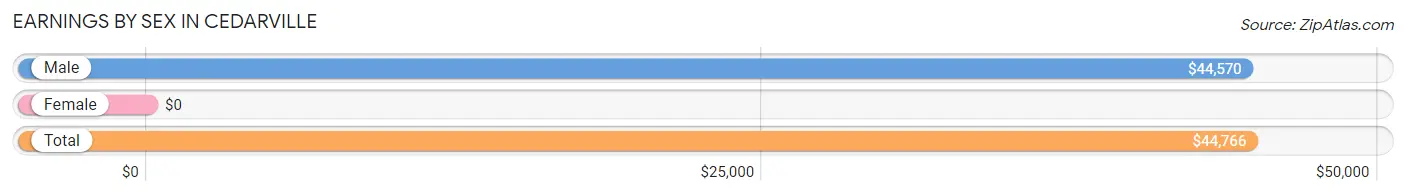
Earnings by Sex in Cedarville
| Sex | Number | Average Earnings |
| Male | 283 (58.2%) | $44,570 |
| Female | 203 (41.8%) | $0 |
| Total | 486 (100.0%) | $44,766 |
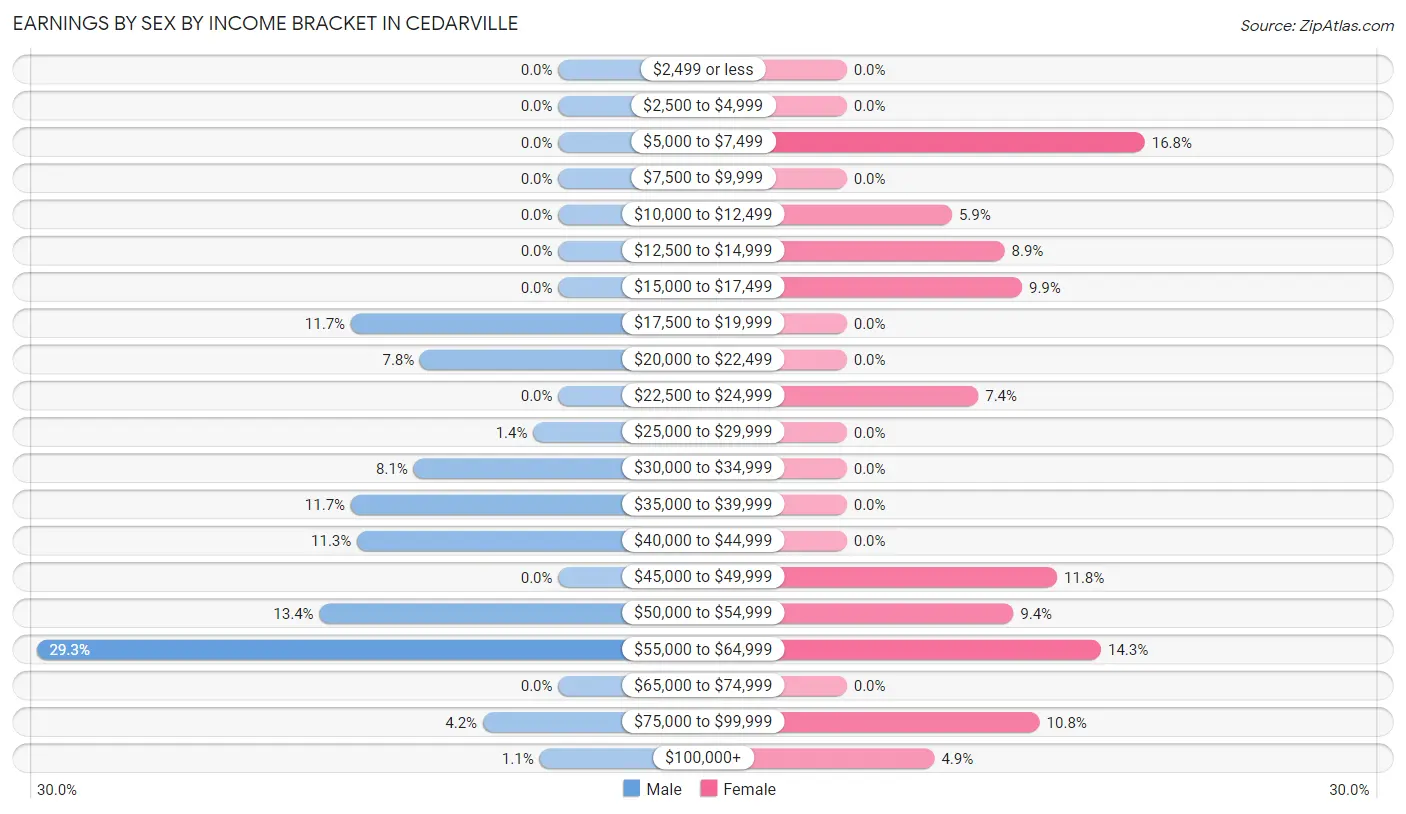
Earnings by Sex by Income Bracket in Cedarville
The most common earnings brackets in Cedarville are $55,000 to $64,999 for men (83 | 29.3%) and $5,000 to $7,499 for women (34 | 16.8%).
| Income | Male | Female |
| $2,499 or less | 0 (0.0%) | 0 (0.0%) |
| $2,500 to $4,999 | 0 (0.0%) | 0 (0.0%) |
| $5,000 to $7,499 | 0 (0.0%) | 34 (16.8%) |
| $7,500 to $9,999 | 0 (0.0%) | 0 (0.0%) |
| $10,000 to $12,499 | 0 (0.0%) | 12 (5.9%) |
| $12,500 to $14,999 | 0 (0.0%) | 18 (8.9%) |
| $15,000 to $17,499 | 0 (0.0%) | 20 (9.9%) |
| $17,500 to $19,999 | 33 (11.7%) | 0 (0.0%) |
| $20,000 to $22,499 | 22 (7.8%) | 0 (0.0%) |
| $22,500 to $24,999 | 0 (0.0%) | 15 (7.4%) |
| $25,000 to $29,999 | 4 (1.4%) | 0 (0.0%) |
| $30,000 to $34,999 | 23 (8.1%) | 0 (0.0%) |
| $35,000 to $39,999 | 33 (11.7%) | 0 (0.0%) |
| $40,000 to $44,999 | 32 (11.3%) | 0 (0.0%) |
| $45,000 to $49,999 | 0 (0.0%) | 24 (11.8%) |
| $50,000 to $54,999 | 38 (13.4%) | 19 (9.4%) |
| $55,000 to $64,999 | 83 (29.3%) | 29 (14.3%) |
| $65,000 to $74,999 | 0 (0.0%) | 0 (0.0%) |
| $75,000 to $99,999 | 12 (4.2%) | 22 (10.8%) |
| $100,000+ | 3 (1.1%) | 10 (4.9%) |
| Total | 283 (100.0%) | 203 (100.0%) |
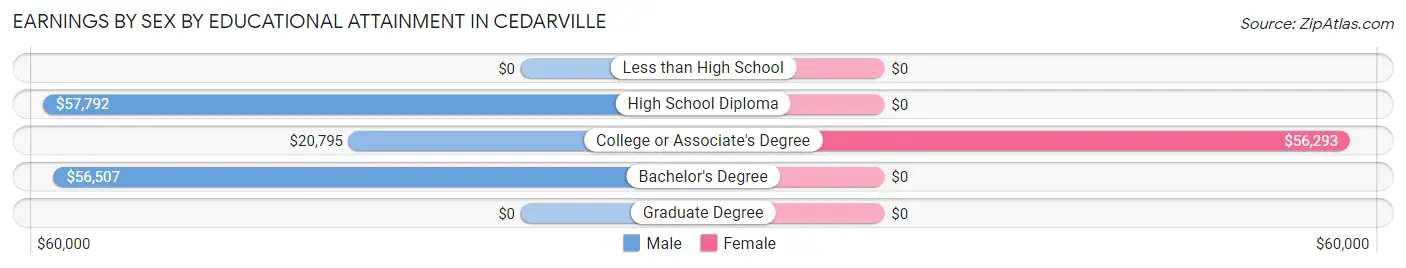
Earnings by Sex by Educational Attainment in Cedarville
Average earnings in Cedarville are $52,664 for men and $49,427 for women, a difference of 6.1%. Men with an educational attainment of high school diploma enjoy the highest average annual earnings of $57,792, while those with college or associate's degree education earn the least with $20,795. Women with an educational attainment of college or associate's degree earn the most with the average annual earnings of $56,293, while those with college or associate's degree education have the smallest earnings of $56,293.
| Educational Attainment | Male Income | Female Income |
| Less than High School | - | - |
| High School Diploma | $57,792 | $0 |
| College or Associate's Degree | $20,795 | $56,293 |
| Bachelor's Degree | $56,507 | $0 |
| Graduate Degree | - | - |
| Total | $52,664 | $49,427 |
Family Income in Cedarville
Family Income Brackets in Cedarville
According to the Cedarville family income data, there are 64 families falling into the $100,000 to $149,999 income range, which is the most common income bracket and makes up 27.8% of all families.
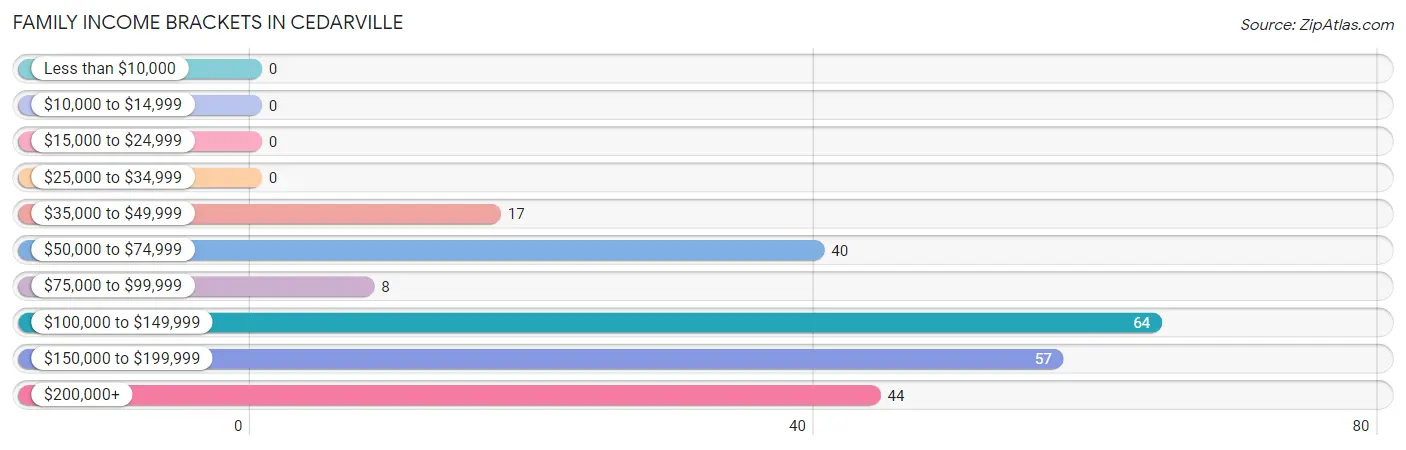
| Income Bracket | # Families | % Families |
| Less than $10,000 | 0 | 0.0% |
| $10,000 to $14,999 | 0 | 0.0% |
| $15,000 to $24,999 | 0 | 0.0% |
| $25,000 to $34,999 | 0 | 0.0% |
| $35,000 to $49,999 | 17 | 7.4% |
| $50,000 to $74,999 | 40 | 17.4% |
| $75,000 to $99,999 | 8 | 3.5% |
| $100,000 to $149,999 | 64 | 27.8% |
| $150,000 to $199,999 | 57 | 24.8% |
| $200,000+ | 44 | 19.1% |
Family Income by Famaliy Size in Cedarville
3-person families (67 | 29.1%) account for the highest median family income in Cedarville with $160,679 per family, while 2-person families (82 | 35.6%) have the highest median income of $67,422 per family member.
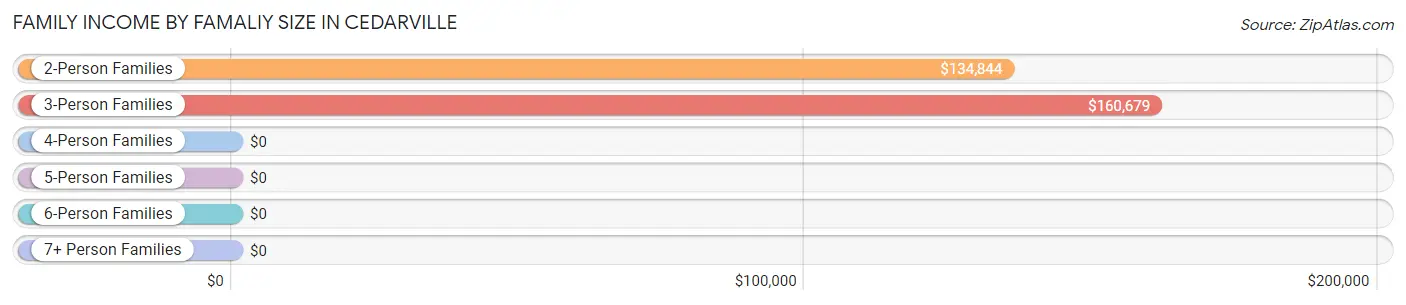
| Income Bracket | # Families | Median Income |
| 2-Person Families | 82 (35.6%) | $134,844 |
| 3-Person Families | 67 (29.1%) | $160,679 |
| 4-Person Families | 47 (20.4%) | $0 |
| 5-Person Families | 3 (1.3%) | $0 |
| 6-Person Families | 31 (13.5%) | $0 |
| 7+ Person Families | 0 (0.0%) | $0 |
| Total | 230 (100.0%) | $148,409 |
Family Income by Number of Earners in Cedarville
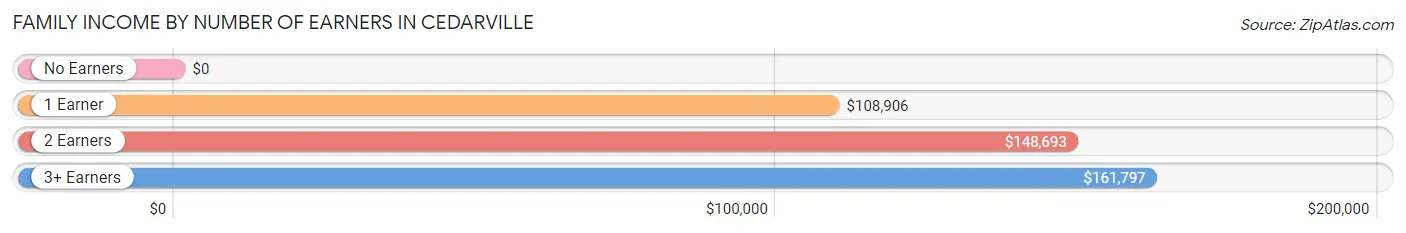
| Number of Earners | # Families | Median Income |
| No Earners | 27 (11.7%) | $0 |
| 1 Earner | 60 (26.1%) | $108,906 |
| 2 Earners | 51 (22.2%) | $148,693 |
| 3+ Earners | 92 (40.0%) | $161,797 |
| Total | 230 (100.0%) | $148,409 |
Household Income in Cedarville
Household Income Brackets in Cedarville
With 85 households falling in the category, the $50,000 to $74,999 income range is the most frequent in Cedarville, accounting for 28.1% of all households.
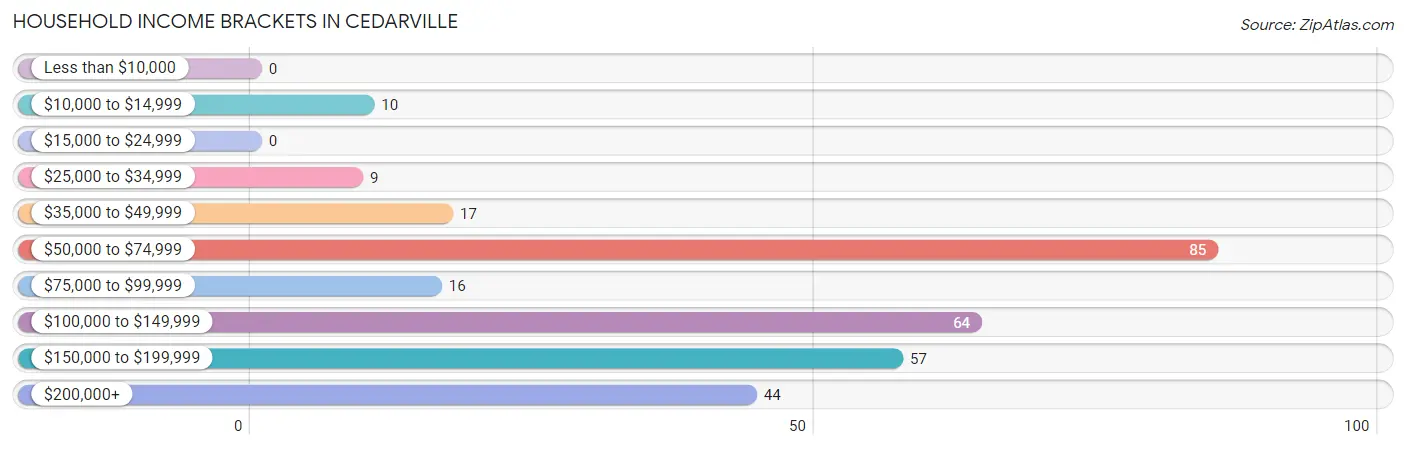
| Income Bracket | # Households | % Households |
| Less than $10,000 | 0 | 0.0% |
| $10,000 to $14,999 | 10 | 3.3% |
| $15,000 to $24,999 | 0 | 0.0% |
| $25,000 to $34,999 | 9 | 3.0% |
| $35,000 to $49,999 | 17 | 5.6% |
| $50,000 to $74,999 | 85 | 28.1% |
| $75,000 to $99,999 | 16 | 5.3% |
| $100,000 to $149,999 | 64 | 21.2% |
| $150,000 to $199,999 | 57 | 18.9% |
| $200,000+ | 44 | 14.6% |
Household Income by Householder Age in Cedarville
The median household income in Cedarville is $108,125, with the highest median household income of $134,766 found in the 45 to 64 years age bracket for the primary householder. A total of 135 households (44.7%) fall into this category.
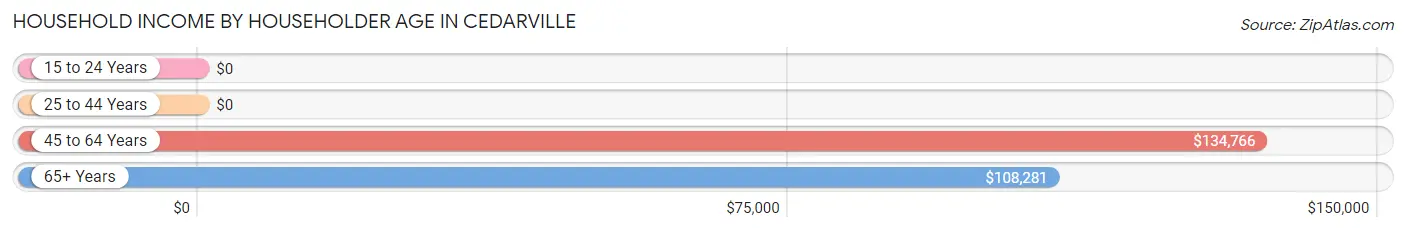
| Income Bracket | # Households | Median Income |
| 15 to 24 Years | 0 (0.0%) | $0 |
| 25 to 44 Years | 31 (10.3%) | $0 |
| 45 to 64 Years | 135 (44.7%) | $134,766 |
| 65+ Years | 136 (45.0%) | $108,281 |
| Total | 302 (100.0%) | $108,125 |
Poverty in Cedarville
Income Below Poverty by Sex and Age in Cedarville
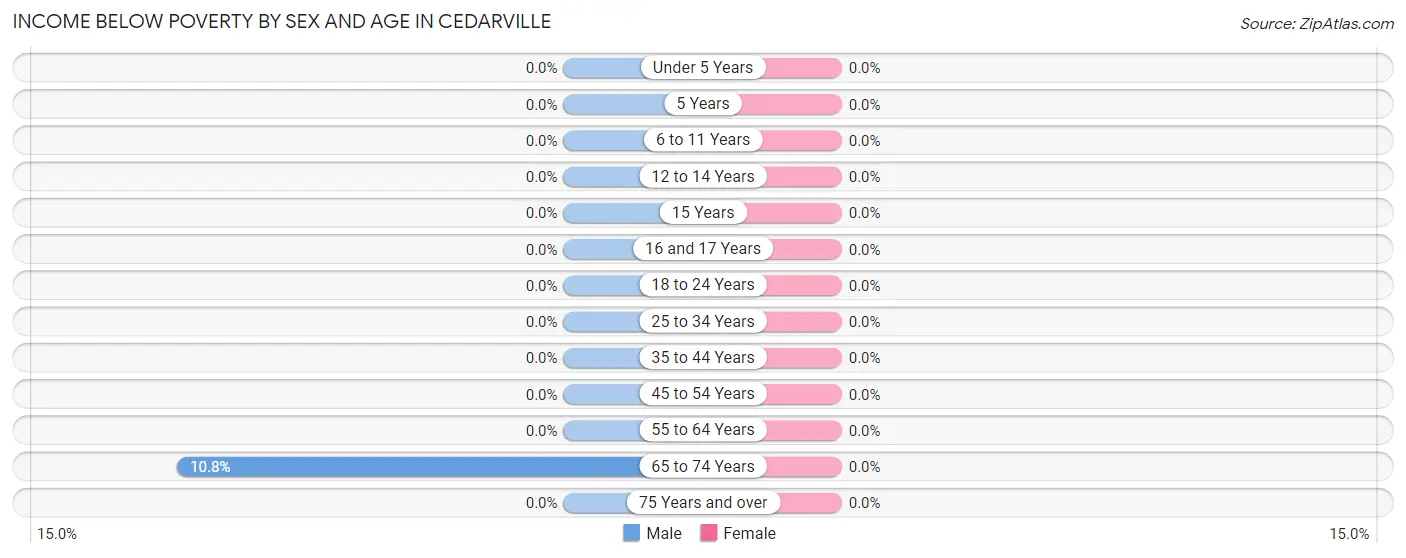
| Age Bracket | Male | Female |
| Under 5 Years | 0 (0.0%) | 0 (0.0%) |
| 5 Years | 0 (0.0%) | 0 (0.0%) |
| 6 to 11 Years | 0 (0.0%) | 0 (0.0%) |
| 12 to 14 Years | 0 (0.0%) | 0 (0.0%) |
| 15 Years | 0 (0.0%) | 0 (0.0%) |
| 16 and 17 Years | 0 (0.0%) | 0 (0.0%) |
| 18 to 24 Years | 0 (0.0%) | 0 (0.0%) |
| 25 to 34 Years | 0 (0.0%) | 0 (0.0%) |
| 35 to 44 Years | 0 (0.0%) | 0 (0.0%) |
| 45 to 54 Years | 0 (0.0%) | 0 (0.0%) |
| 55 to 64 Years | 0 (0.0%) | 0 (0.0%) |
| 65 to 74 Years | 10 (10.7%) | 0 (0.0%) |
| 75 Years and over | 0 (0.0%) | 0 (0.0%) |
| Total | 10 (1.9%) | 0 (0.0%) |
Income Above Poverty by Sex and Age in Cedarville
According to the poverty statistics in Cedarville, males aged under 5 years and females aged under 5 years are the age groups that are most secure financially, with 100.0% of males and 100.0% of females in these age groups living above the poverty line.
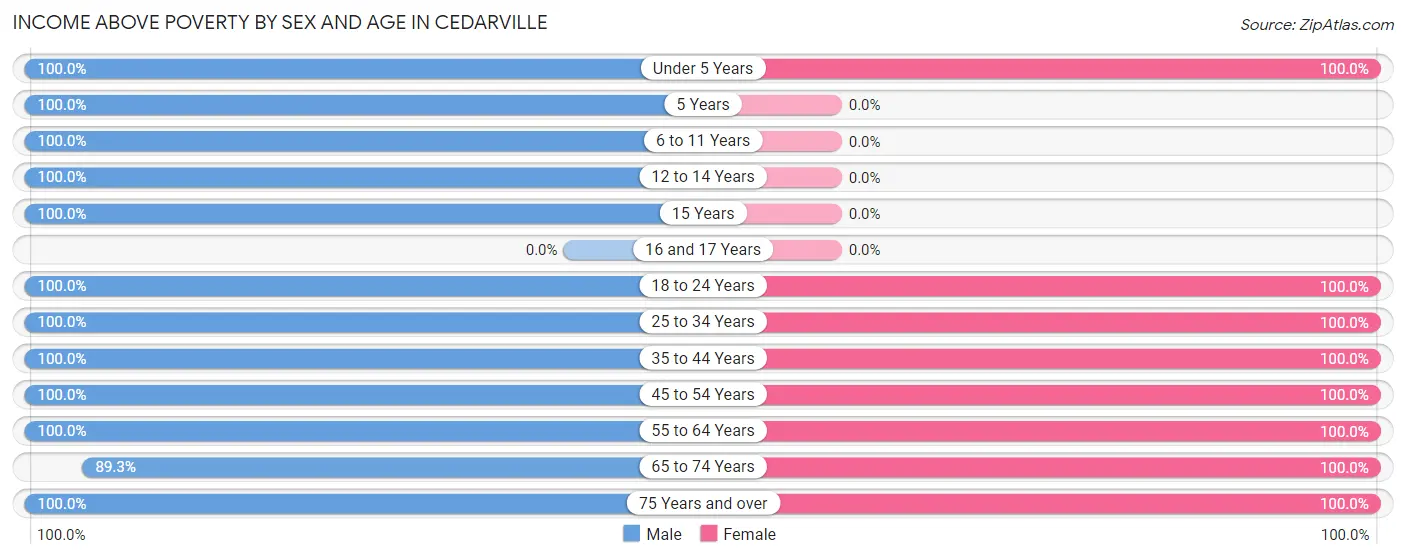
| Age Bracket | Male | Female |
| Under 5 Years | 18 (100.0%) | 8 (100.0%) |
| 5 Years | 31 (100.0%) | 0 (0.0%) |
| 6 to 11 Years | 23 (100.0%) | 0 (0.0%) |
| 12 to 14 Years | 65 (100.0%) | 0 (0.0%) |
| 15 Years | 3 (100.0%) | 0 (0.0%) |
| 16 and 17 Years | 0 (0.0%) | 0 (0.0%) |
| 18 to 24 Years | 19 (100.0%) | 32 (100.0%) |
| 25 to 34 Years | 38 (100.0%) | 8 (100.0%) |
| 35 to 44 Years | 64 (100.0%) | 30 (100.0%) |
| 45 to 54 Years | 35 (100.0%) | 83 (100.0%) |
| 55 to 64 Years | 87 (100.0%) | 99 (100.0%) |
| 65 to 74 Years | 83 (89.2%) | 22 (100.0%) |
| 75 Years and over | 47 (100.0%) | 22 (100.0%) |
| Total | 513 (98.1%) | 304 (100.0%) |
Income Below Poverty Among Married-Couple Families in Cedarville
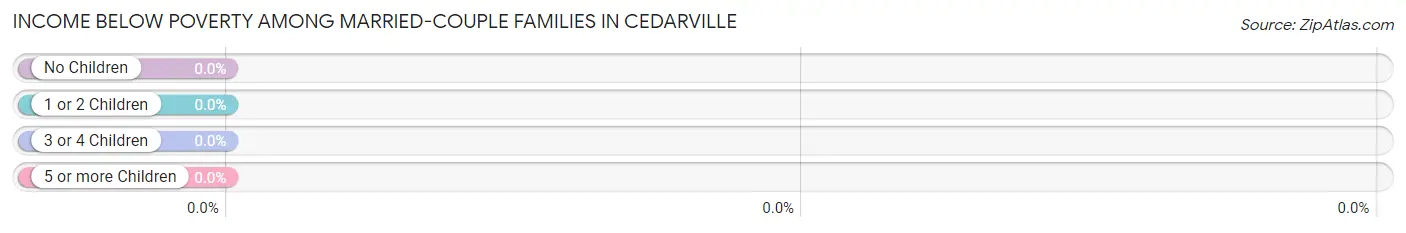
| Children | Above Poverty | Below Poverty |
| No Children | 142 (100.0%) | 0 (0.0%) |
| 1 or 2 Children | 3 (100.0%) | 0 (0.0%) |
| 3 or 4 Children | 31 (100.0%) | 0 (0.0%) |
| 5 or more Children | 0 (0.0%) | 0 (0.0%) |
| Total | 176 (100.0%) | 0 (0.0%) |
Income Below Poverty Among Single-Parent Households in Cedarville
| Children | Single Father | Single Mother |
| No Children | 0 (0.0%) | 0 (0.0%) |
| 1 or 2 Children | 0 (0.0%) | 0 (0.0%) |
| 3 or 4 Children | 0 (0.0%) | 0 (0.0%) |
| 5 or more Children | 0 (0.0%) | 0 (0.0%) |
| Total | 0 (0.0%) | 0 (0.0%) |
Income Below Poverty Among Married-Couple vs Single-Parent Households in Cedarville
| Children | Married-Couple Families | Single-Parent Households |
| No Children | 0 (0.0%) | 0 (0.0%) |
| 1 or 2 Children | 0 (0.0%) | 0 (0.0%) |
| 3 or 4 Children | 0 (0.0%) | 0 (0.0%) |
| 5 or more Children | 0 (0.0%) | 0 (0.0%) |
| Total | 0 (0.0%) | 0 (0.0%) |
Race in Cedarville
The most populous races in Cedarville are White / Caucasian (520 | 62.9%), Hispanic or Latino (140 | 16.9%), and Some other Race (134 | 16.2%).
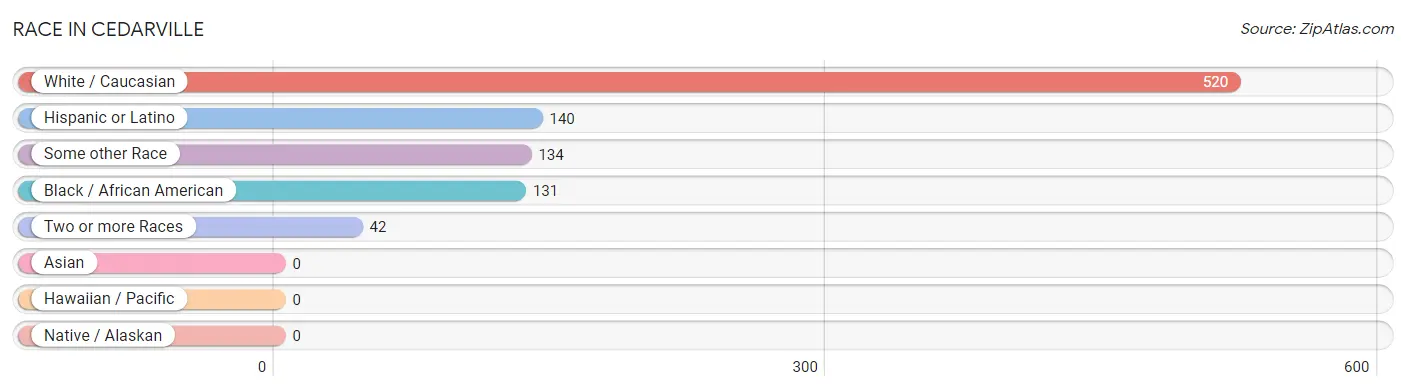
| Race | # Population | % Population |
| Asian | 0 | 0.0% |
| Black / African American | 131 | 15.8% |
| Hawaiian / Pacific | 0 | 0.0% |
| Hispanic or Latino | 140 | 16.9% |
| Native / Alaskan | 0 | 0.0% |
| White / Caucasian | 520 | 62.9% |
| Two or more Races | 42 | 5.1% |
| Some other Race | 134 | 16.2% |
| Total | 827 | 100.0% |
Ancestry in Cedarville
The most populous ancestries reported in Cedarville are English (283 | 34.2%), Irish (141 | 17.1%), American (58 | 7.0%), Central American (41 | 5.0%), and Salvadoran (41 | 5.0%), together accounting for 68.2% of all Cedarville residents.
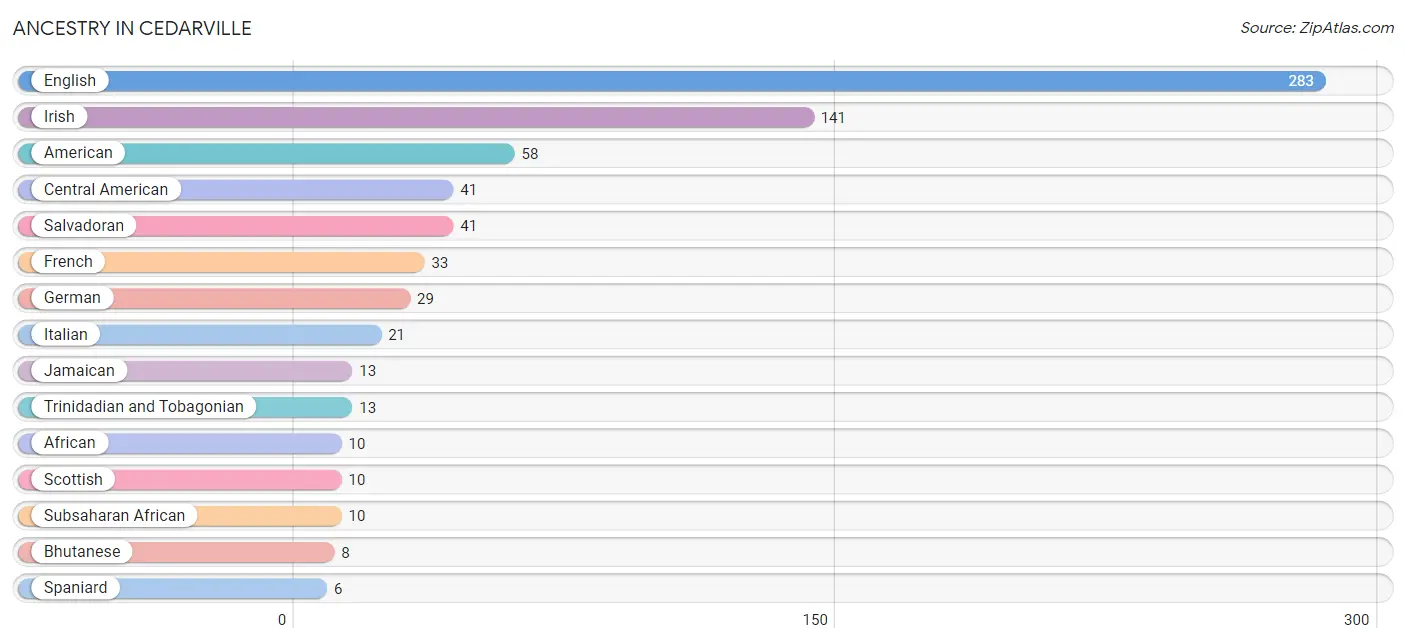
| Ancestry | # Population | % Population |
| African | 10 | 1.2% |
| American | 58 | 7.0% |
| Bhutanese | 8 | 1.0% |
| Central American | 41 | 5.0% |
| Czech | 5 | 0.6% |
| English | 283 | 34.2% |
| French | 33 | 4.0% |
| German | 29 | 3.5% |
| Irish | 141 | 17.1% |
| Italian | 21 | 2.5% |
| Jamaican | 13 | 1.6% |
| Puerto Rican | 4 | 0.5% |
| Salvadoran | 41 | 5.0% |
| Scottish | 10 | 1.2% |
| Spaniard | 6 | 0.7% |
| Subsaharan African | 10 | 1.2% |
| Trinidadian and Tobagonian | 13 | 1.6% | View All 17 Rows |
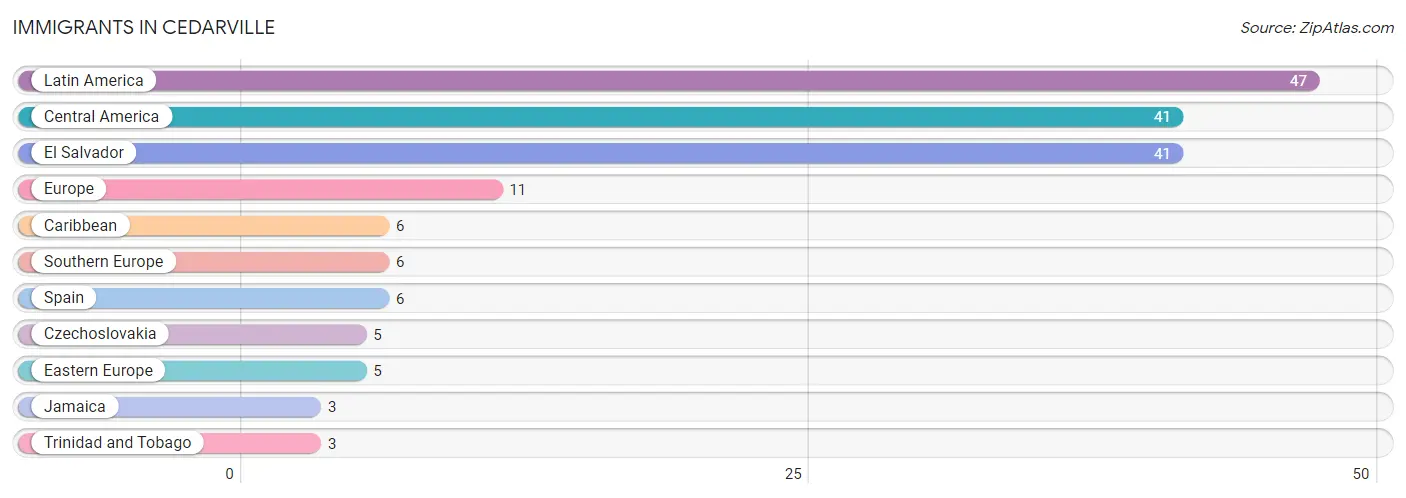
Immigrants in Cedarville
The most numerous immigrant groups reported in Cedarville came from Latin America (47 | 5.7%), Central America (41 | 5.0%), El Salvador (41 | 5.0%), Europe (11 | 1.3%), and Caribbean (6 | 0.7%), together accounting for 17.7% of all Cedarville residents.
| Immigration Origin | # Population | % Population |
| Caribbean | 6 | 0.7% |
| Central America | 41 | 5.0% |
| Czechoslovakia | 5 | 0.6% |
| Eastern Europe | 5 | 0.6% |
| El Salvador | 41 | 5.0% |
| Europe | 11 | 1.3% |
| Jamaica | 3 | 0.4% |
| Latin America | 47 | 5.7% |
| Southern Europe | 6 | 0.7% |
| Spain | 6 | 0.7% |
| Trinidad and Tobago | 3 | 0.4% | View All 11 Rows |
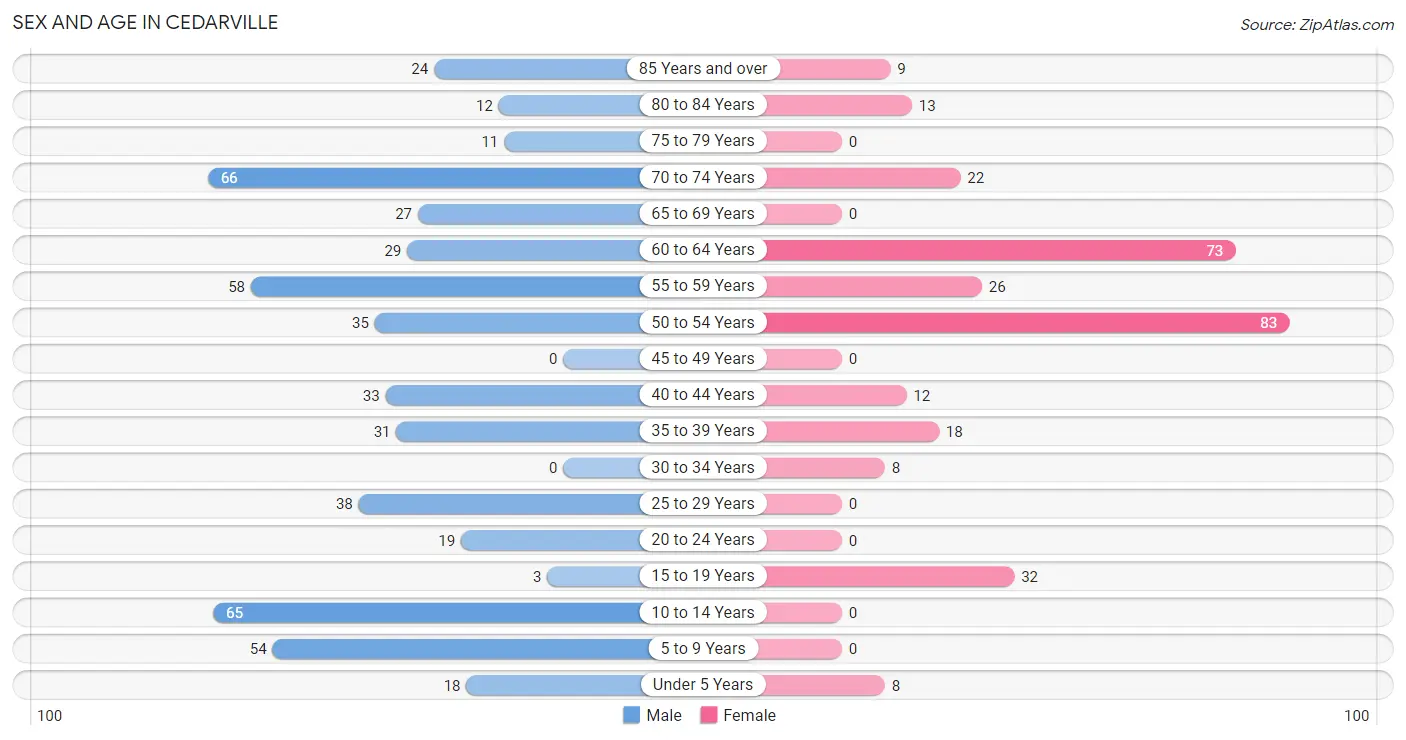
Sex and Age in Cedarville
Sex and Age in Cedarville
The most populous age groups in Cedarville are 70 to 74 Years (66 | 12.6%) for men and 50 to 54 Years (83 | 27.3%) for women.
| Age Bracket | Male | Female |
| Under 5 Years | 18 (3.4%) | 8 (2.6%) |
| 5 to 9 Years | 54 (10.3%) | 0 (0.0%) |
| 10 to 14 Years | 65 (12.4%) | 0 (0.0%) |
| 15 to 19 Years | 3 (0.6%) | 32 (10.5%) |
| 20 to 24 Years | 19 (3.6%) | 0 (0.0%) |
| 25 to 29 Years | 38 (7.3%) | 0 (0.0%) |
| 30 to 34 Years | 0 (0.0%) | 8 (2.6%) |
| 35 to 39 Years | 31 (5.9%) | 18 (5.9%) |
| 40 to 44 Years | 33 (6.3%) | 12 (4.0%) |
| 45 to 49 Years | 0 (0.0%) | 0 (0.0%) |
| 50 to 54 Years | 35 (6.7%) | 83 (27.3%) |
| 55 to 59 Years | 58 (11.1%) | 26 (8.6%) |
| 60 to 64 Years | 29 (5.5%) | 73 (24.0%) |
| 65 to 69 Years | 27 (5.2%) | 0 (0.0%) |
| 70 to 74 Years | 66 (12.6%) | 22 (7.2%) |
| 75 to 79 Years | 11 (2.1%) | 0 (0.0%) |
| 80 to 84 Years | 12 (2.3%) | 13 (4.3%) |
| 85 Years and over | 24 (4.6%) | 9 (3.0%) |
| Total | 523 (100.0%) | 304 (100.0%) |
Families and Households in Cedarville
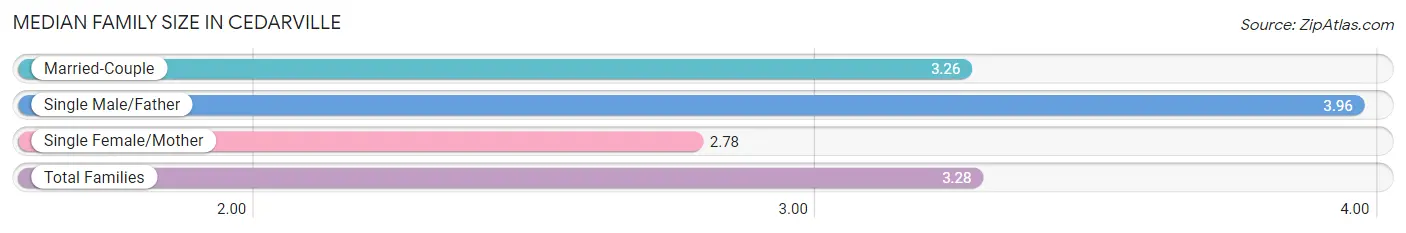
Median Family Size in Cedarville
The median family size in Cedarville is 3.28 persons per family, with single male/father families (27 | 11.7%) accounting for the largest median family size of 3.96 persons per family. On the other hand, single female/mother families (27 | 11.7%) represent the smallest median family size with 2.78 persons per family.
| Family Type | # Families | Family Size |
| Married-Couple | 176 (76.5%) | 3.26 |
| Single Male/Father | 27 (11.7%) | 3.96 |
| Single Female/Mother | 27 (11.7%) | 2.78 |
| Total Families | 230 (100.0%) | 3.28 |
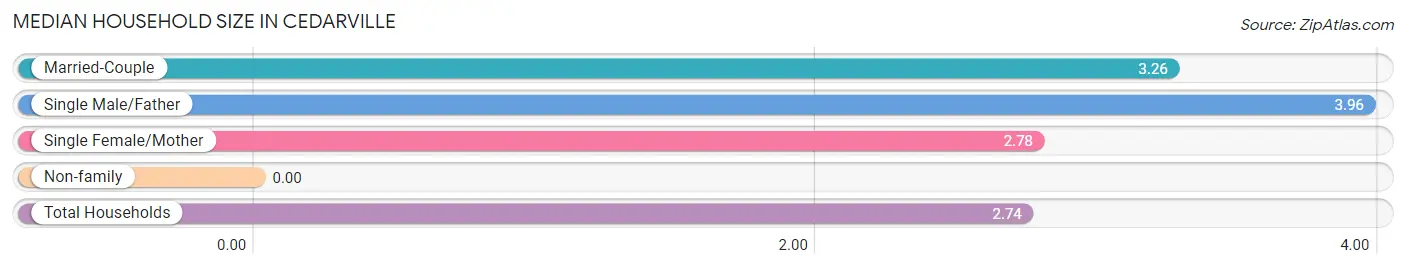
Median Household Size in Cedarville
| Household Type | # Households | Household Size |
| Married-Couple | 176 (58.3%) | 3.26 |
| Single Male/Father | 27 (8.9%) | 3.96 |
| Single Female/Mother | 27 (8.9%) | 2.78 |
| Non-family | 72 (23.8%) | - |
| Total Households | 302 (100.0%) | 2.74 |
Household Size by Marriage Status in Cedarville
Out of a total of 302 households in Cedarville, 230 (76.2%) are family households, while 72 (23.8%) are nonfamily households. The most numerous type of family households are 2-person households, comprising 82, and the most common type of nonfamily households are 1-person households, comprising 72.
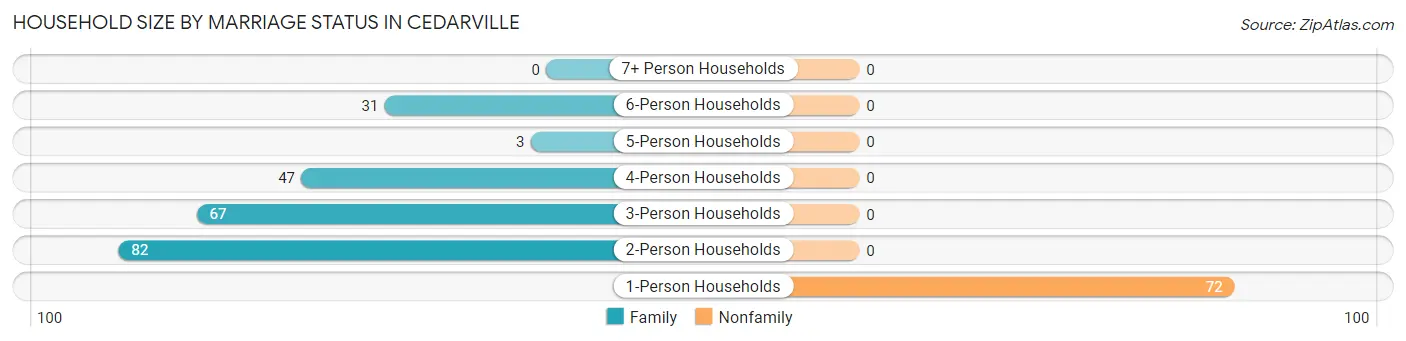
| Household Size | Family Households | Nonfamily Households |
| 1-Person Households | - | 72 (23.8%) |
| 2-Person Households | 82 (27.2%) | 0 (0.0%) |
| 3-Person Households | 67 (22.2%) | 0 (0.0%) |
| 4-Person Households | 47 (15.6%) | 0 (0.0%) |
| 5-Person Households | 3 (1.0%) | 0 (0.0%) |
| 6-Person Households | 31 (10.3%) | 0 (0.0%) |
| 7+ Person Households | 0 (0.0%) | 0 (0.0%) |
| Total | 230 (76.2%) | 72 (23.8%) |
Female Fertility in Cedarville
Fertility by Age in Cedarville
| Age Bracket | Women with Births | Births / 1,000 Women |
| 15 to 19 years | 0 (0.0%) | 0.0 |
| 20 to 34 years | 0 (0.0%) | 0.0 |
| 35 to 50 years | 0 (0.0%) | 0.0 |
| Total | 0 (0.0%) | 0.0 |
Fertility by Age by Marriage Status in Cedarville
| Age Bracket | Married | Unmarried |
| 15 to 19 years | 0 (0.0%) | 0 (0.0%) |
| 20 to 34 years | 0 (0.0%) | 0 (0.0%) |
| 35 to 50 years | 0 (0.0%) | 0 (0.0%) |
| Total | 0 (0.0%) | 0 (0.0%) |
Fertility by Education in Cedarville
| Educational Attainment | Women with Births | Births / 1,000 Women |
| Less than High School | 0 (0.0%) | 0.0 |
| High School Diploma | 0 (0.0%) | 0.0 |
| College or Associate's Degree | 0 (0.0%) | 0.0 |
| Bachelor's Degree | 0 (0.0%) | 0.0 |
| Graduate Degree | 0 (0.0%) | 0.0 |
| Total | 0 (0.0%) | 0.0 |
Fertility by Education by Marriage Status in Cedarville
| Educational Attainment | Married | Unmarried |
| Less than High School | 0 (0.0%) | 0 (0.0%) |
| High School Diploma | 0 (0.0%) | 0 (0.0%) |
| College or Associate's Degree | 0 (0.0%) | 0 (0.0%) |
| Bachelor's Degree | 0 (0.0%) | 0 (0.0%) |
| Graduate Degree | 0 (0.0%) | 0 (0.0%) |
| Total | 0 (0.0%) | 0 (0.0%) |
Employment Characteristics in Cedarville
Employment by Class of Employer in Cedarville
Among the 454 employed individuals in Cedarville, private company employees (183 | 40.3%), local government employees (95 | 20.9%), and not-for-profit organizations (68 | 15.0%) make up the most common classes of employment.
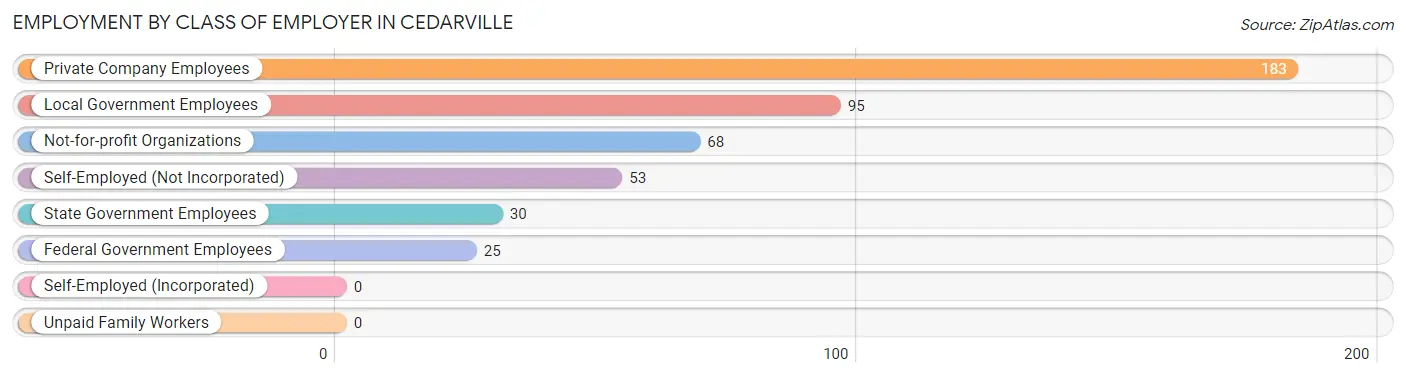
| Employer Class | # Employees | % Employees |
| Private Company Employees | 183 | 40.3% |
| Self-Employed (Incorporated) | 0 | 0.0% |
| Self-Employed (Not Incorporated) | 53 | 11.7% |
| Not-for-profit Organizations | 68 | 15.0% |
| Local Government Employees | 95 | 20.9% |
| State Government Employees | 30 | 6.6% |
| Federal Government Employees | 25 | 5.5% |
| Unpaid Family Workers | 0 | 0.0% |
| Total | 454 | 100.0% |
Employment Status by Age in Cedarville
According to the labor force statistics for Cedarville, out of the total population over 16 years of age (679), 68.6% or 466 individuals are in the labor force, with 2.6% or 12 of them unemployed. The age group with the highest labor force participation rate is 16 to 19 years, with 100.0% or 32 individuals in the labor force. Within the labor force, the 35 to 44 years age range has the highest percentage of unemployed individuals, with 12.8% or 12 of them being unemployed.
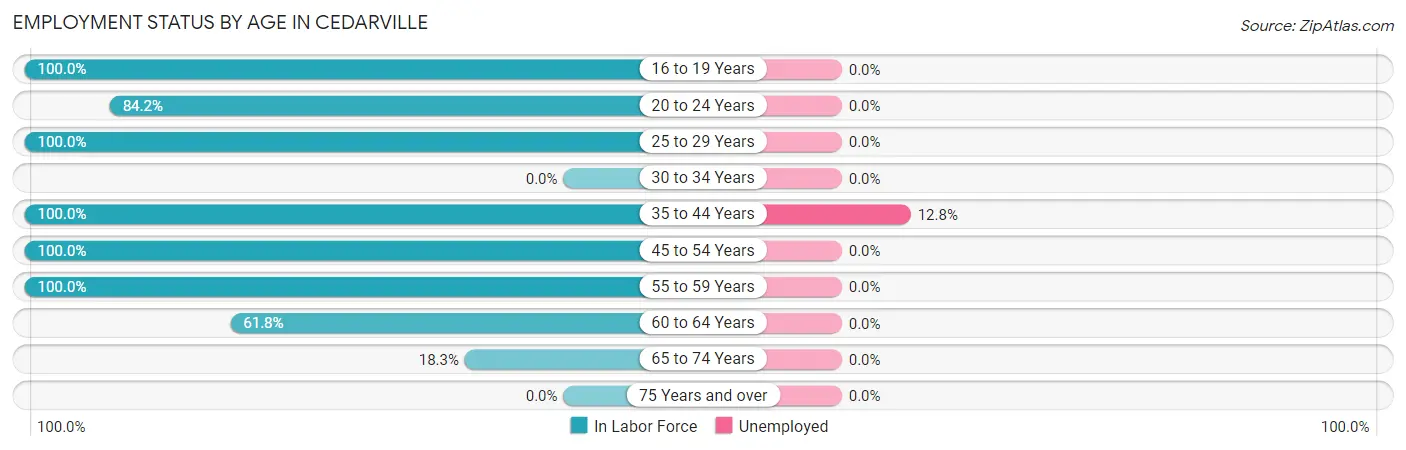
| Age Bracket | In Labor Force | Unemployed |
| 16 to 19 Years | 32 (100.0%) | 0 (0.0%) |
| 20 to 24 Years | 16 (84.2%) | 0 (0.0%) |
| 25 to 29 Years | 38 (100.0%) | 0 (0.0%) |
| 30 to 34 Years | 0 (0.0%) | 0 (0.0%) |
| 35 to 44 Years | 94 (100.0%) | 12 (12.8%) |
| 45 to 54 Years | 118 (100.0%) | 0 (0.0%) |
| 55 to 59 Years | 84 (100.0%) | 0 (0.0%) |
| 60 to 64 Years | 63 (61.8%) | 0 (0.0%) |
| 65 to 74 Years | 21 (18.3%) | 0 (0.0%) |
| 75 Years and over | 0 (0.0%) | 0 (0.0%) |
| Total | 466 (68.6%) | 12 (2.6%) |
Employment Status by Educational Attainment in Cedarville
According to labor force statistics for Cedarville, 89.4% of individuals (397) out of the total population between 25 and 64 years of age (444) are in the labor force, with 3.0% or 12 of them being unemployed. The group with the highest labor force participation rate are those with the educational attainment of less than high school, with 100.0% or 46 individuals in the labor force. Within the labor force, individuals with less than high school education have the highest percentage of unemployment, with 26.1% or 12 of them being unemployed.
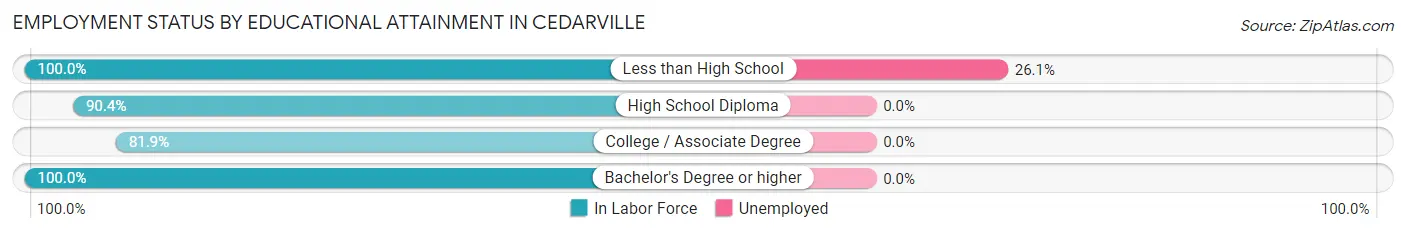
| Educational Attainment | In Labor Force | Unemployed |
| Less than High School | 46 (100.0%) | 12 (26.1%) |
| High School Diploma | 122 (90.4%) | 0 (0.0%) |
| College / Associate Degree | 154 (81.9%) | 0 (0.0%) |
| Bachelor's Degree or higher | 75 (100.0%) | 0 (0.0%) |
| Total | 397 (89.4%) | 13 (3.0%) |
Employment Occupations by Sex in Cedarville
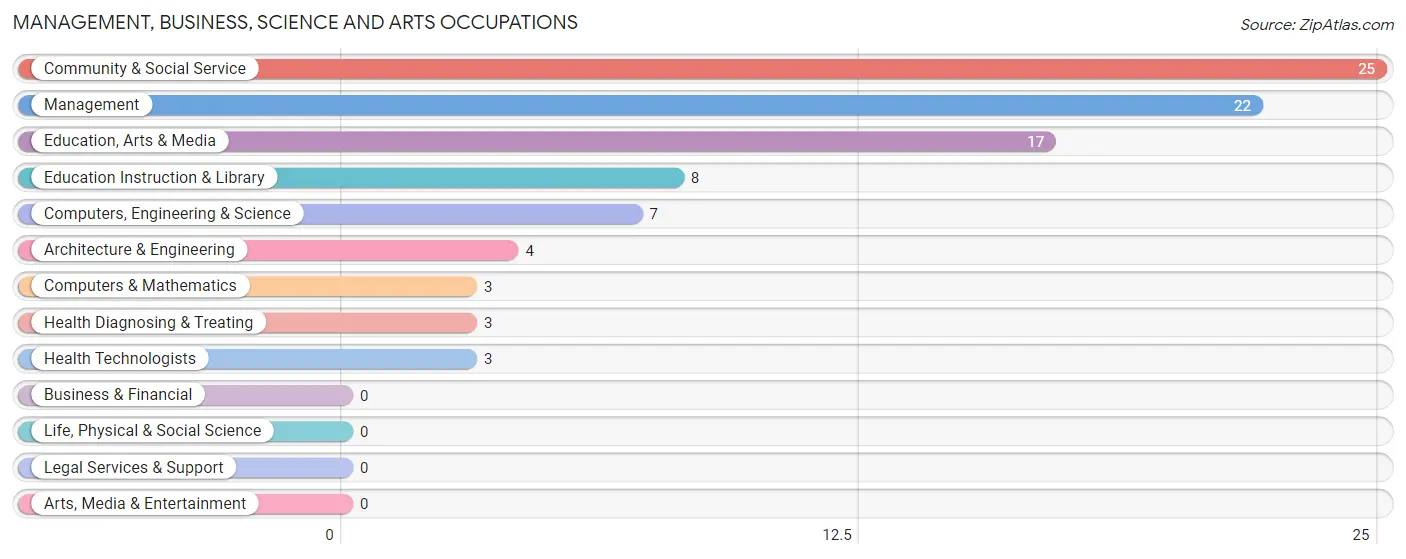
Management, Business, Science and Arts Occupations
The most common Management, Business, Science and Arts occupations in Cedarville are Community & Social Service (25 | 5.5%), Management (22 | 4.9%), Education, Arts & Media (17 | 3.7%), Education Instruction & Library (8 | 1.8%), and Computers, Engineering & Science (7 | 1.5%).
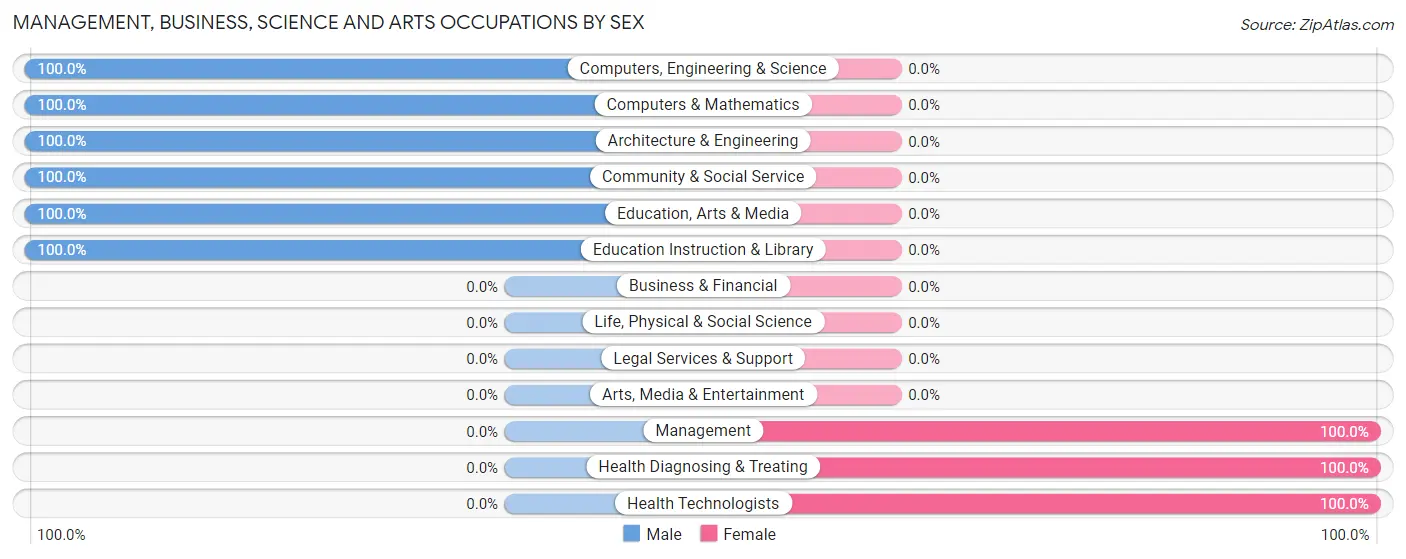
Management, Business, Science and Arts Occupations by Sex
Within the Management, Business, Science and Arts occupations in Cedarville, the most male-oriented occupations are Computers, Engineering & Science (100.0%), Computers & Mathematics (100.0%), and Architecture & Engineering (100.0%), while the most female-oriented occupations are Management (100.0%), Health Diagnosing & Treating (100.0%), and Health Technologists (100.0%).
| Occupation | Male | Female |
| Management | 0 (0.0%) | 22 (100.0%) |
| Business & Financial | 0 (0.0%) | 0 (0.0%) |
| Computers, Engineering & Science | 7 (100.0%) | 0 (0.0%) |
| Computers & Mathematics | 3 (100.0%) | 0 (0.0%) |
| Architecture & Engineering | 4 (100.0%) | 0 (0.0%) |
| Life, Physical & Social Science | 0 (0.0%) | 0 (0.0%) |
| Community & Social Service | 25 (100.0%) | 0 (0.0%) |
| Education, Arts & Media | 17 (100.0%) | 0 (0.0%) |
| Legal Services & Support | 0 (0.0%) | 0 (0.0%) |
| Education Instruction & Library | 8 (100.0%) | 0 (0.0%) |
| Arts, Media & Entertainment | 0 (0.0%) | 0 (0.0%) |
| Health Diagnosing & Treating | 0 (0.0%) | 3 (100.0%) |
| Health Technologists | 0 (0.0%) | 3 (100.0%) |
| Total (Category) | 32 (56.1%) | 25 (43.9%) |
| Total (Overall) | 251 (55.3%) | 203 (44.7%) |
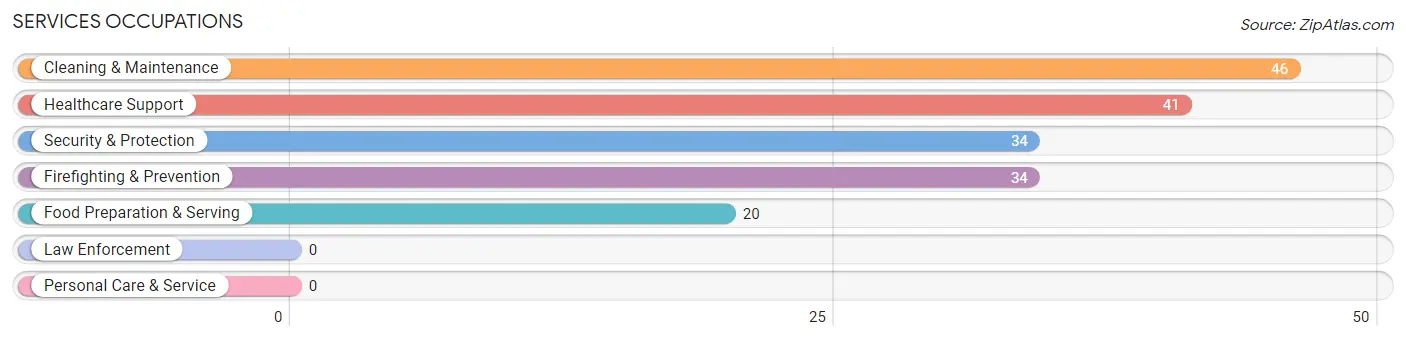
Services Occupations
The most common Services occupations in Cedarville are Cleaning & Maintenance (46 | 10.1%), Healthcare Support (41 | 9.0%), Security & Protection (34 | 7.5%), Firefighting & Prevention (34 | 7.5%), and Food Preparation & Serving (20 | 4.4%).
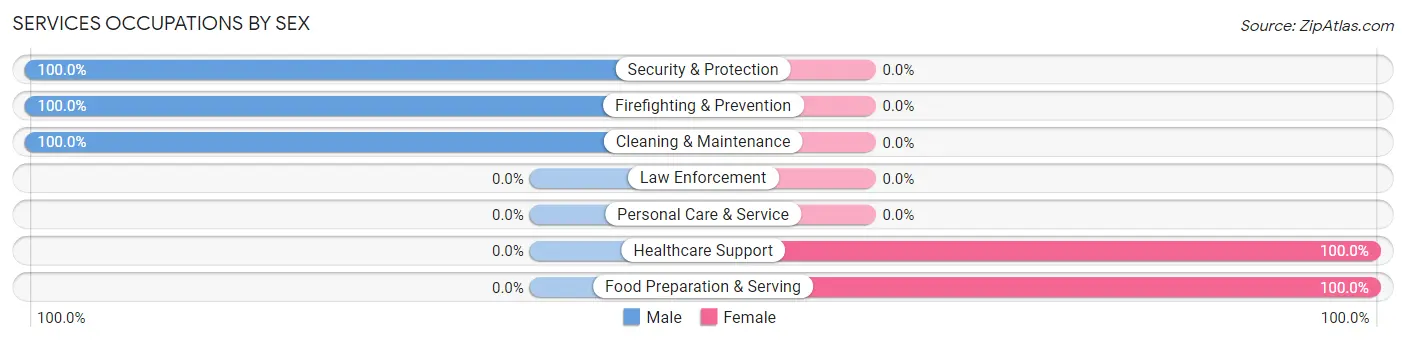
Services Occupations by Sex
Within the Services occupations in Cedarville, the most male-oriented occupations are Security & Protection (100.0%), Firefighting & Prevention (100.0%), and Cleaning & Maintenance (100.0%), while the most female-oriented occupations are Healthcare Support (100.0%), and Food Preparation & Serving (100.0%).
| Occupation | Male | Female |
| Healthcare Support | 0 (0.0%) | 41 (100.0%) |
| Security & Protection | 34 (100.0%) | 0 (0.0%) |
| Firefighting & Prevention | 34 (100.0%) | 0 (0.0%) |
| Law Enforcement | 0 (0.0%) | 0 (0.0%) |
| Food Preparation & Serving | 0 (0.0%) | 20 (100.0%) |
| Cleaning & Maintenance | 46 (100.0%) | 0 (0.0%) |
| Personal Care & Service | 0 (0.0%) | 0 (0.0%) |
| Total (Category) | 80 (56.7%) | 61 (43.3%) |
| Total (Overall) | 251 (55.3%) | 203 (44.7%) |
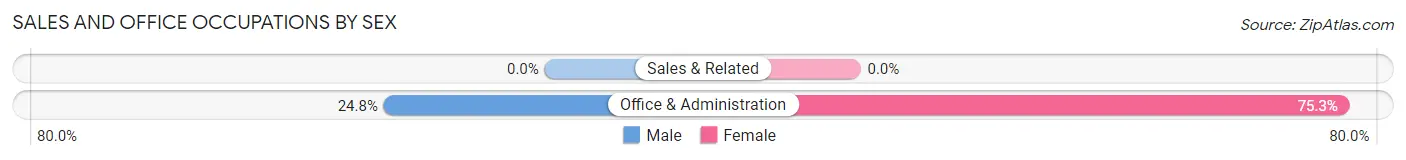
Sales and Office Occupations
The most common Sales and Office occupations in Cedarville are , and Office & Administration (101 | 22.3%).

Sales and Office Occupations by Sex
| Occupation | Male | Female |
| Sales & Related | 0 (0.0%) | 0 (0.0%) |
| Office & Administration | 25 (24.7%) | 76 (75.2%) |
| Total (Category) | 25 (24.7%) | 76 (75.2%) |
| Total (Overall) | 251 (55.3%) | 203 (44.7%) |
Natural Resources, Construction and Maintenance Occupations
The most common Natural Resources, Construction and Maintenance occupations in Cedarville are Construction & Extraction (68 | 15.0%), and Installation, Maintenance & Repair (8 | 1.8%).
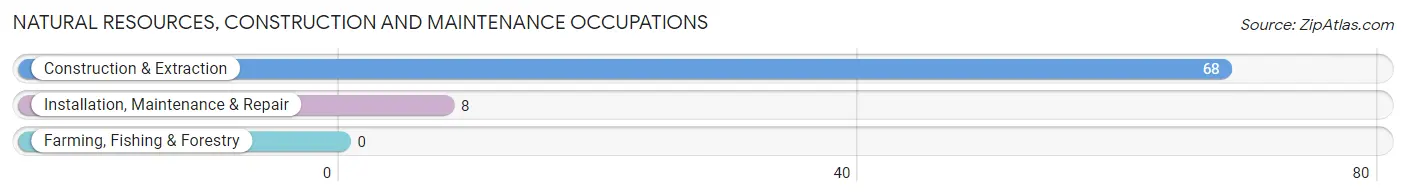
Natural Resources, Construction and Maintenance Occupations by Sex

| Occupation | Male | Female |
| Farming, Fishing & Forestry | 0 (0.0%) | 0 (0.0%) |
| Construction & Extraction | 68 (100.0%) | 0 (0.0%) |
| Installation, Maintenance & Repair | 4 (50.0%) | 4 (50.0%) |
| Total (Category) | 72 (94.7%) | 4 (5.3%) |
| Total (Overall) | 251 (55.3%) | 203 (44.7%) |
Production, Transportation and Moving Occupations
The most common Production, Transportation and Moving occupations in Cedarville are Transportation (61 | 13.4%), and Production (18 | 4.0%).
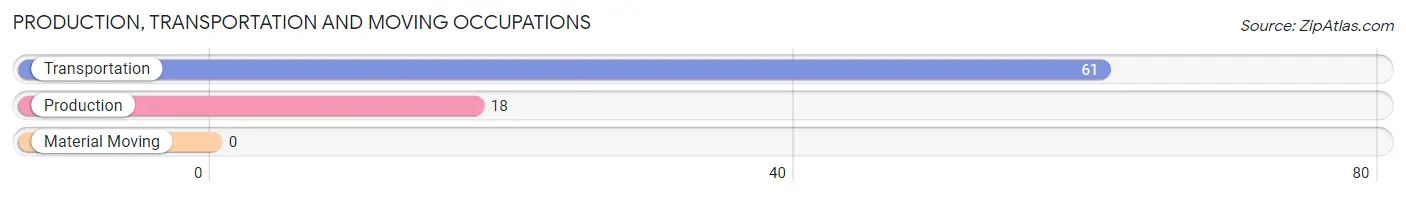
Production, Transportation and Moving Occupations by Sex

| Occupation | Male | Female |
| Production | 0 (0.0%) | 18 (100.0%) |
| Transportation | 42 (68.9%) | 19 (31.1%) |
| Material Moving | 0 (0.0%) | 0 (0.0%) |
| Total (Category) | 42 (53.2%) | 37 (46.8%) |
| Total (Overall) | 251 (55.3%) | 203 (44.7%) |
Employment Industries by Sex in Cedarville
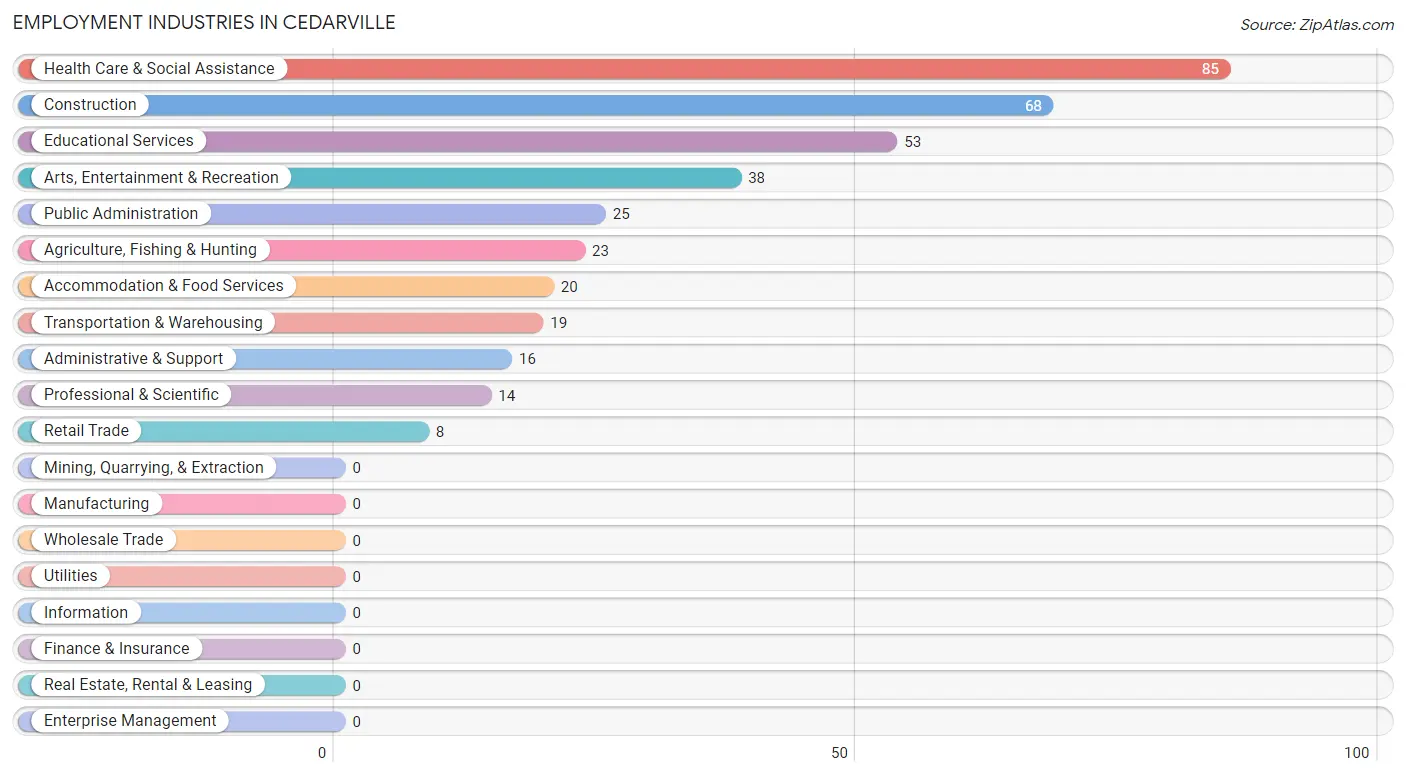
Employment Industries in Cedarville
The major employment industries in Cedarville include Health Care & Social Assistance (85 | 18.7%), Construction (68 | 15.0%), Educational Services (53 | 11.7%), Arts, Entertainment & Recreation (38 | 8.4%), and Public Administration (25 | 5.5%).
Employment Industries by Sex in Cedarville
The Cedarville industries that see more men than women are Agriculture, Fishing & Hunting (100.0%), Construction (100.0%), and Transportation & Warehousing (100.0%), whereas the industries that tend to have a higher number of women are Educational Services (100.0%), Accommodation & Food Services (100.0%), and Health Care & Social Assistance (80.0%).
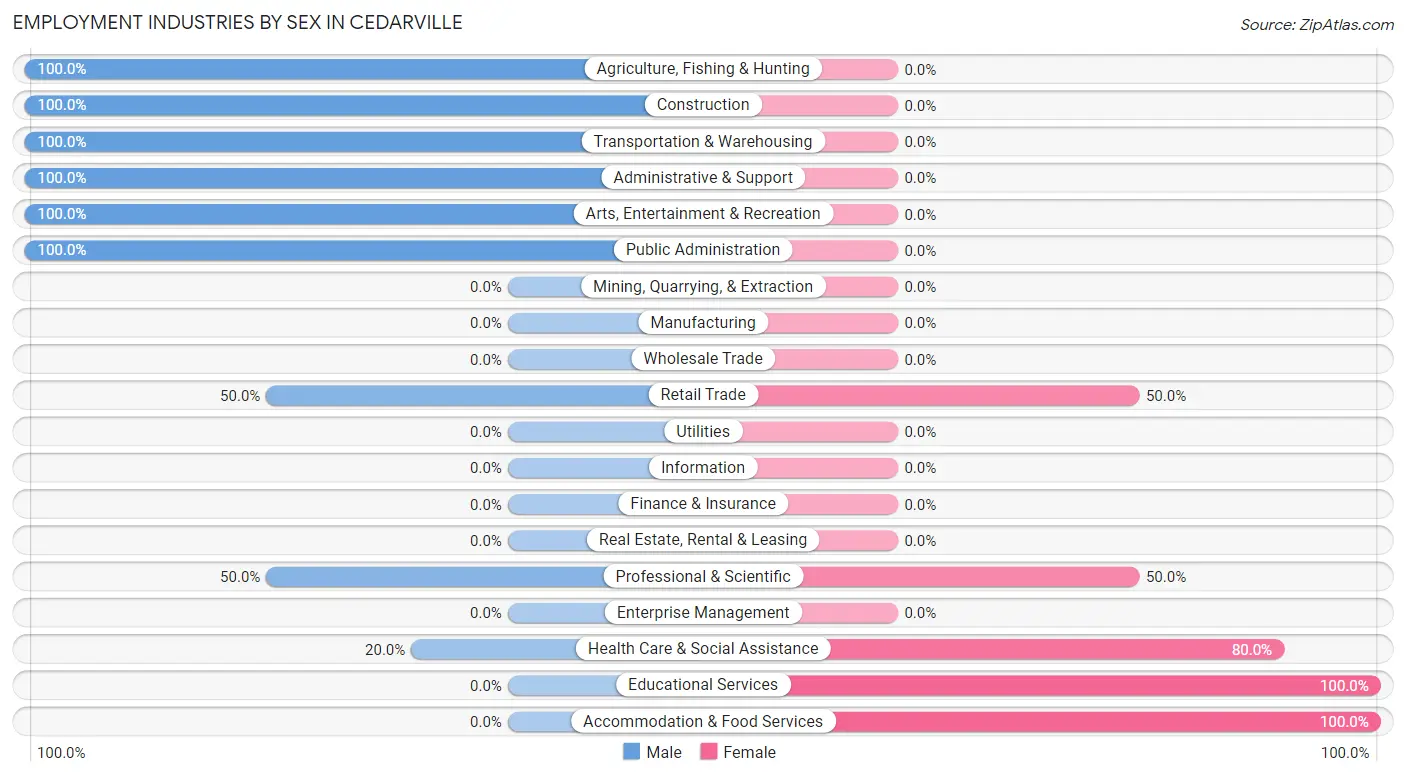
| Industry | Male | Female |
| Agriculture, Fishing & Hunting | 23 (100.0%) | 0 (0.0%) |
| Mining, Quarrying, & Extraction | 0 (0.0%) | 0 (0.0%) |
| Construction | 68 (100.0%) | 0 (0.0%) |
| Manufacturing | 0 (0.0%) | 0 (0.0%) |
| Wholesale Trade | 0 (0.0%) | 0 (0.0%) |
| Retail Trade | 4 (50.0%) | 4 (50.0%) |
| Transportation & Warehousing | 19 (100.0%) | 0 (0.0%) |
| Utilities | 0 (0.0%) | 0 (0.0%) |
| Information | 0 (0.0%) | 0 (0.0%) |
| Finance & Insurance | 0 (0.0%) | 0 (0.0%) |
| Real Estate, Rental & Leasing | 0 (0.0%) | 0 (0.0%) |
| Professional & Scientific | 7 (50.0%) | 7 (50.0%) |
| Enterprise Management | 0 (0.0%) | 0 (0.0%) |
| Administrative & Support | 16 (100.0%) | 0 (0.0%) |
| Educational Services | 0 (0.0%) | 53 (100.0%) |
| Health Care & Social Assistance | 17 (20.0%) | 68 (80.0%) |
| Arts, Entertainment & Recreation | 38 (100.0%) | 0 (0.0%) |
| Accommodation & Food Services | 0 (0.0%) | 20 (100.0%) |
| Public Administration | 25 (100.0%) | 0 (0.0%) |
| Total | 251 (55.3%) | 203 (44.7%) |
Education in Cedarville
School Enrollment in Cedarville
The most common levels of schooling among the 149 students in Cedarville are middle school (65 | 43.6%), nursery / preschool (23 | 15.4%), and college / undergraduate (23 | 15.4%).
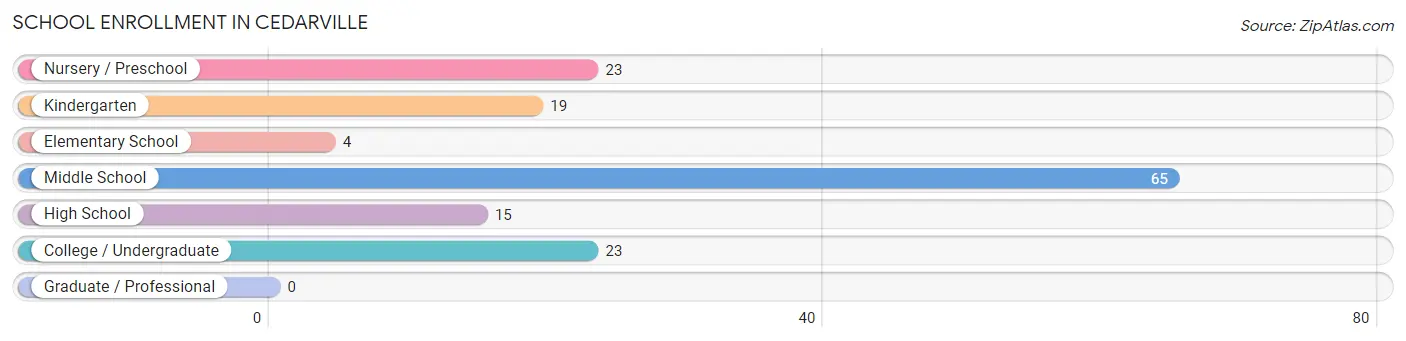
| School Level | # Students | % Students |
| Nursery / Preschool | 23 | 15.4% |
| Kindergarten | 19 | 12.8% |
| Elementary School | 4 | 2.7% |
| Middle School | 65 | 43.6% |
| High School | 15 | 10.1% |
| College / Undergraduate | 23 | 15.4% |
| Graduate / Professional | 0 | 0.0% |
| Total | 149 | 100.0% |
School Enrollment by Age by Funding Source in Cedarville
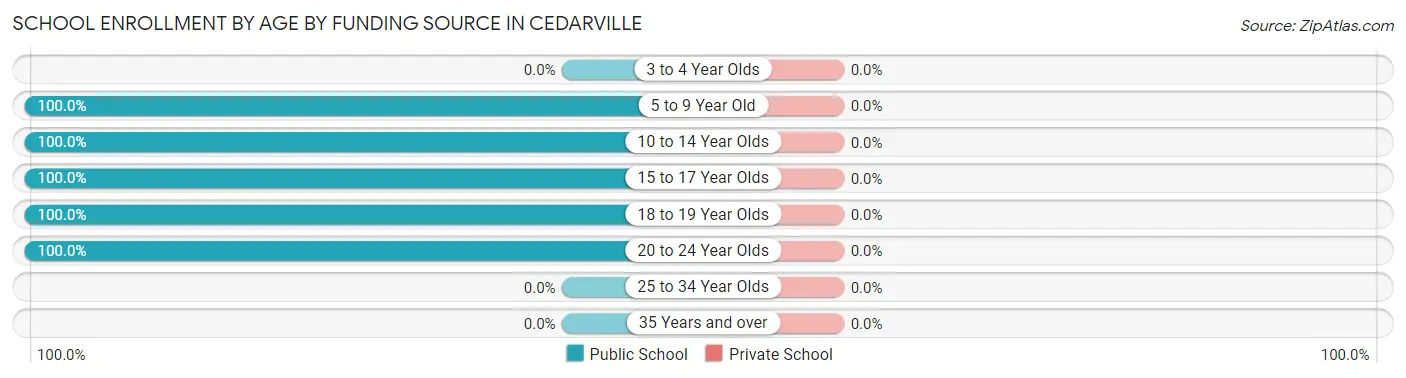
| Age Bracket | Public School | Private School |
| 3 to 4 Year Olds | 0 (0.0%) | 0 (0.0%) |
| 5 to 9 Year Old | 46 (100.0%) | 0 (0.0%) |
| 10 to 14 Year Olds | 65 (100.0%) | 0 (0.0%) |
| 15 to 17 Year Olds | 3 (100.0%) | 0 (0.0%) |
| 18 to 19 Year Olds | 32 (100.0%) | 0 (0.0%) |
| 20 to 24 Year Olds | 3 (100.0%) | 0 (0.0%) |
| 25 to 34 Year Olds | 0 (0.0%) | 0 (0.0%) |
| 35 Years and over | 0 (0.0%) | 0 (0.0%) |
| Total | 149 (100.0%) | 0 (0.0%) |
Educational Attainment by Field of Study in Cedarville
Arts & humanities (73 | 57.9%), business (32 | 25.4%), engineering (18 | 14.3%), and computers & mathematics (3 | 2.4%) are the most common fields of study among 126 individuals in Cedarville who have obtained a bachelor's degree or higher.
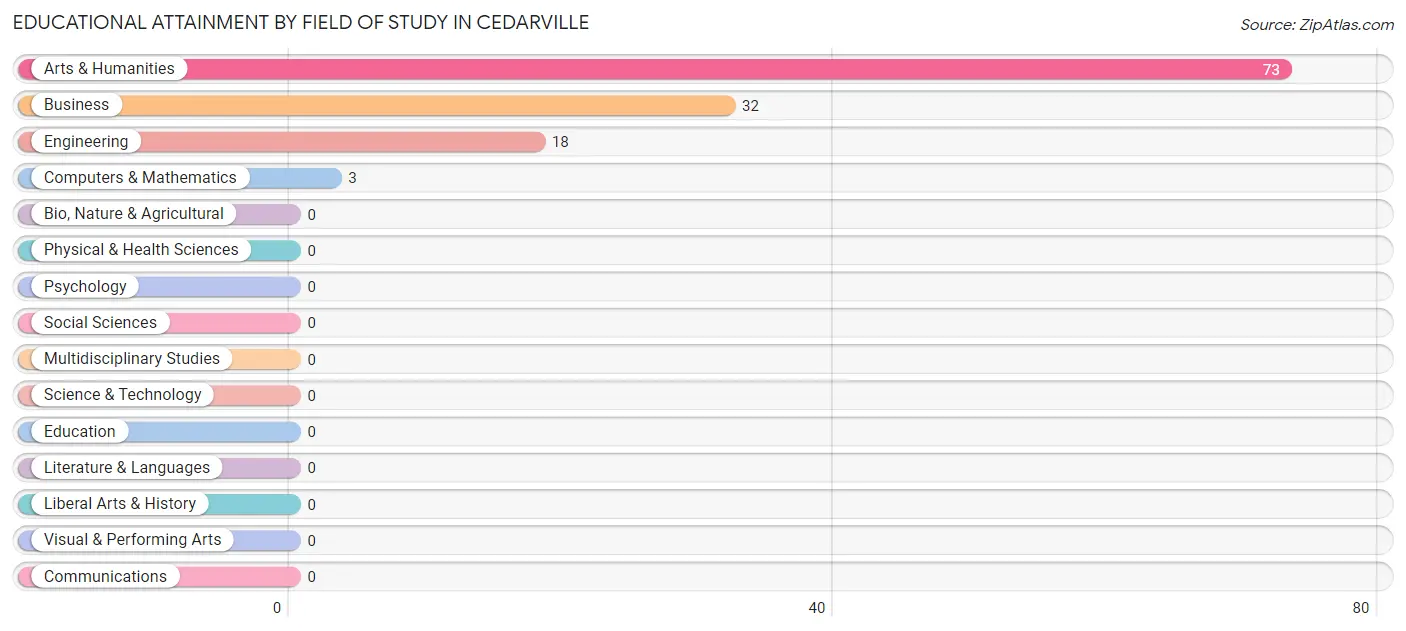
| Field of Study | # Graduates | % Graduates |
| Computers & Mathematics | 3 | 2.4% |
| Bio, Nature & Agricultural | 0 | 0.0% |
| Physical & Health Sciences | 0 | 0.0% |
| Psychology | 0 | 0.0% |
| Social Sciences | 0 | 0.0% |
| Engineering | 18 | 14.3% |
| Multidisciplinary Studies | 0 | 0.0% |
| Science & Technology | 0 | 0.0% |
| Business | 32 | 25.4% |
| Education | 0 | 0.0% |
| Literature & Languages | 0 | 0.0% |
| Liberal Arts & History | 0 | 0.0% |
| Visual & Performing Arts | 0 | 0.0% |
| Communications | 0 | 0.0% |
| Arts & Humanities | 73 | 57.9% |
| Total | 126 | 100.0% |
Transportation & Commute in Cedarville
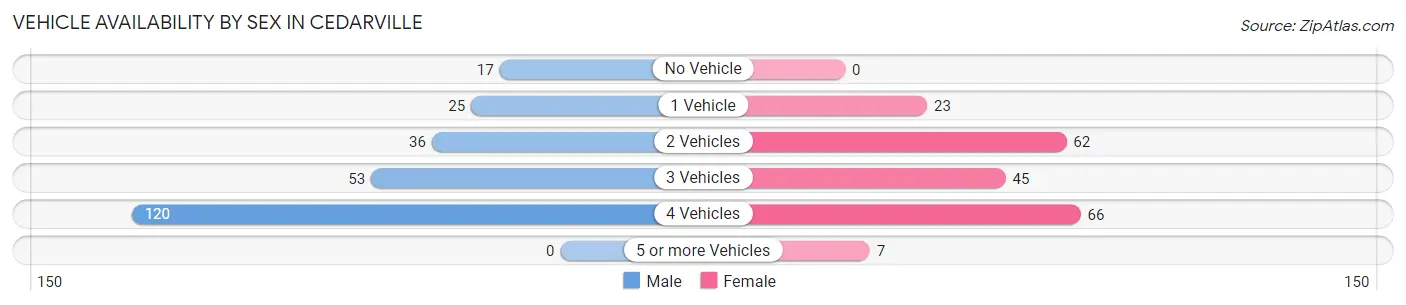
Vehicle Availability by Sex in Cedarville
The most prevalent vehicle ownership categories in Cedarville are males with 4 vehicles (120, accounting for 47.8%) and females with 4 vehicles (66, making up 59.1%).
| Vehicles Available | Male | Female |
| No Vehicle | 17 (6.8%) | 0 (0.0%) |
| 1 Vehicle | 25 (10.0%) | 23 (11.3%) |
| 2 Vehicles | 36 (14.3%) | 62 (30.5%) |
| 3 Vehicles | 53 (21.1%) | 45 (22.2%) |
| 4 Vehicles | 120 (47.8%) | 66 (32.5%) |
| 5 or more Vehicles | 0 (0.0%) | 7 (3.5%) |
| Total | 251 (100.0%) | 203 (100.0%) |
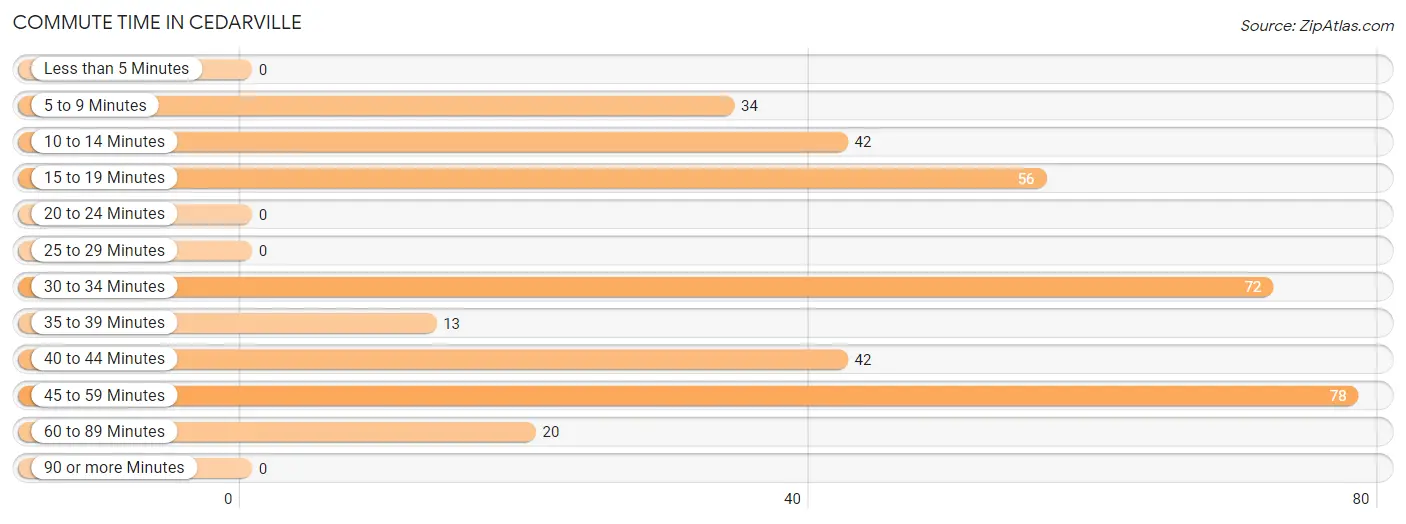
Commute Time in Cedarville
The most frequently occuring commute durations in Cedarville are 45 to 59 minutes (78 commuters, 21.8%), 30 to 34 minutes (72 commuters, 20.2%), and 15 to 19 minutes (56 commuters, 15.7%).
| Commute Time | # Commuters | % Commuters |
| Less than 5 Minutes | 0 | 0.0% |
| 5 to 9 Minutes | 34 | 9.5% |
| 10 to 14 Minutes | 42 | 11.8% |
| 15 to 19 Minutes | 56 | 15.7% |
| 20 to 24 Minutes | 0 | 0.0% |
| 25 to 29 Minutes | 0 | 0.0% |
| 30 to 34 Minutes | 72 | 20.2% |
| 35 to 39 Minutes | 13 | 3.6% |
| 40 to 44 Minutes | 42 | 11.8% |
| 45 to 59 Minutes | 78 | 21.8% |
| 60 to 89 Minutes | 20 | 5.6% |
| 90 or more Minutes | 0 | 0.0% |
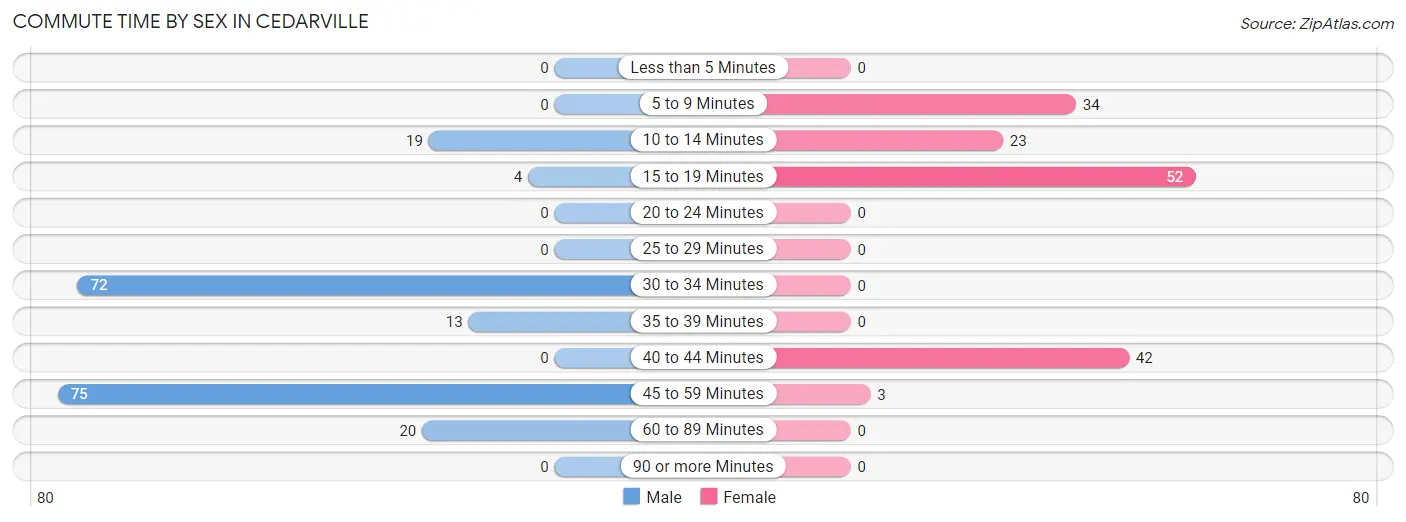
Commute Time by Sex in Cedarville
The most common commute times in Cedarville are 45 to 59 minutes (75 commuters, 36.9%) for males and 15 to 19 minutes (52 commuters, 33.8%) for females.
| Commute Time | Male | Female |
| Less than 5 Minutes | 0 (0.0%) | 0 (0.0%) |
| 5 to 9 Minutes | 0 (0.0%) | 34 (22.1%) |
| 10 to 14 Minutes | 19 (9.4%) | 23 (14.9%) |
| 15 to 19 Minutes | 4 (2.0%) | 52 (33.8%) |
| 20 to 24 Minutes | 0 (0.0%) | 0 (0.0%) |
| 25 to 29 Minutes | 0 (0.0%) | 0 (0.0%) |
| 30 to 34 Minutes | 72 (35.5%) | 0 (0.0%) |
| 35 to 39 Minutes | 13 (6.4%) | 0 (0.0%) |
| 40 to 44 Minutes | 0 (0.0%) | 42 (27.3%) |
| 45 to 59 Minutes | 75 (36.9%) | 3 (1.9%) |
| 60 to 89 Minutes | 20 (9.9%) | 0 (0.0%) |
| 90 or more Minutes | 0 (0.0%) | 0 (0.0%) |
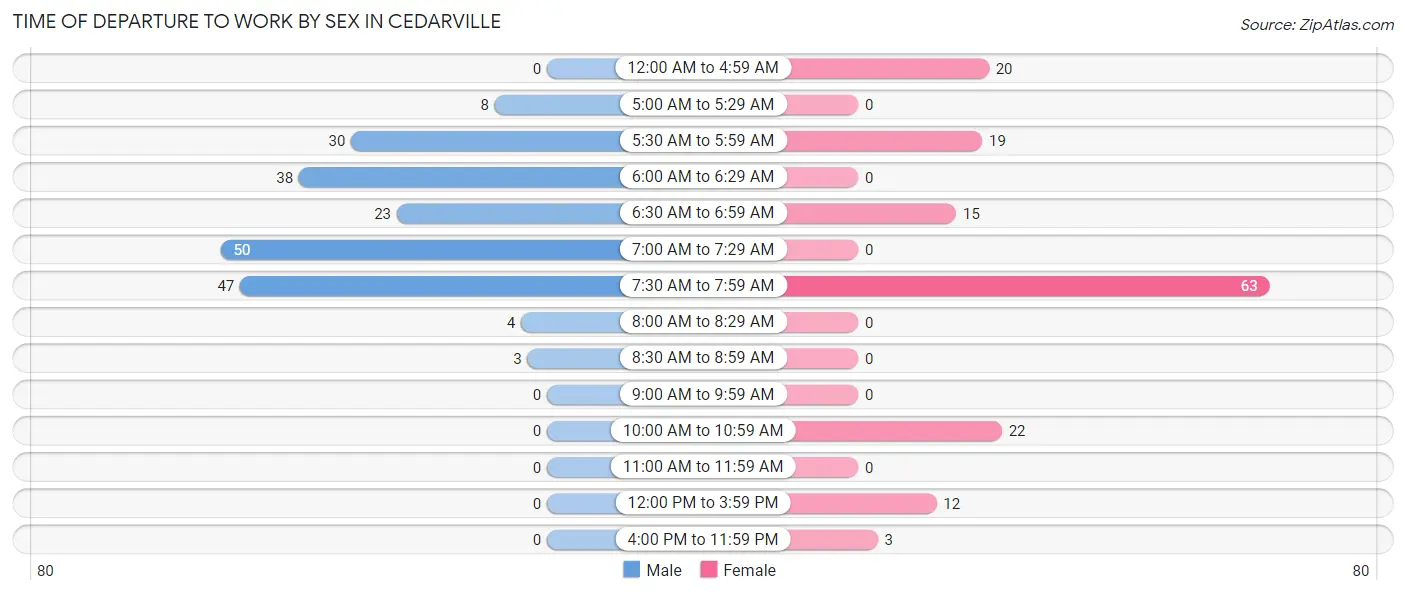
Time of Departure to Work by Sex in Cedarville
The most frequent times of departure to work in Cedarville are 7:00 AM to 7:29 AM (50, 24.6%) for males and 7:30 AM to 7:59 AM (63, 40.9%) for females.
| Time of Departure | Male | Female |
| 12:00 AM to 4:59 AM | 0 (0.0%) | 20 (13.0%) |
| 5:00 AM to 5:29 AM | 8 (3.9%) | 0 (0.0%) |
| 5:30 AM to 5:59 AM | 30 (14.8%) | 19 (12.3%) |
| 6:00 AM to 6:29 AM | 38 (18.7%) | 0 (0.0%) |
| 6:30 AM to 6:59 AM | 23 (11.3%) | 15 (9.7%) |
| 7:00 AM to 7:29 AM | 50 (24.6%) | 0 (0.0%) |
| 7:30 AM to 7:59 AM | 47 (23.2%) | 63 (40.9%) |
| 8:00 AM to 8:29 AM | 4 (2.0%) | 0 (0.0%) |
| 8:30 AM to 8:59 AM | 3 (1.5%) | 0 (0.0%) |
| 9:00 AM to 9:59 AM | 0 (0.0%) | 0 (0.0%) |
| 10:00 AM to 10:59 AM | 0 (0.0%) | 22 (14.3%) |
| 11:00 AM to 11:59 AM | 0 (0.0%) | 0 (0.0%) |
| 12:00 PM to 3:59 PM | 0 (0.0%) | 12 (7.8%) |
| 4:00 PM to 11:59 PM | 0 (0.0%) | 3 (1.9%) |
| Total | 203 (100.0%) | 154 (100.0%) |
Housing Occupancy in Cedarville
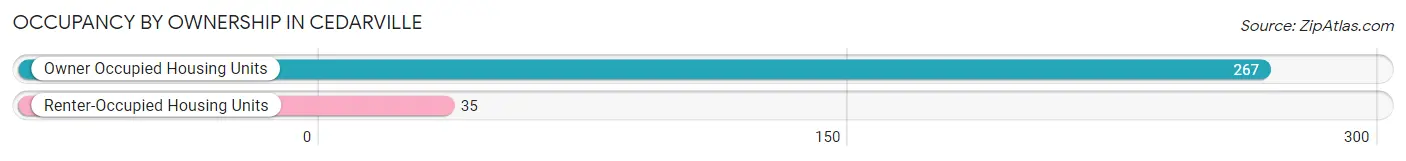
Occupancy by Ownership in Cedarville
Of the total 302 dwellings in Cedarville, owner-occupied units account for 267 (88.4%), while renter-occupied units make up 35 (11.6%).
| Occupancy | # Housing Units | % Housing Units |
| Owner Occupied Housing Units | 267 | 88.4% |
| Renter-Occupied Housing Units | 35 | 11.6% |
| Total Occupied Housing Units | 302 | 100.0% |
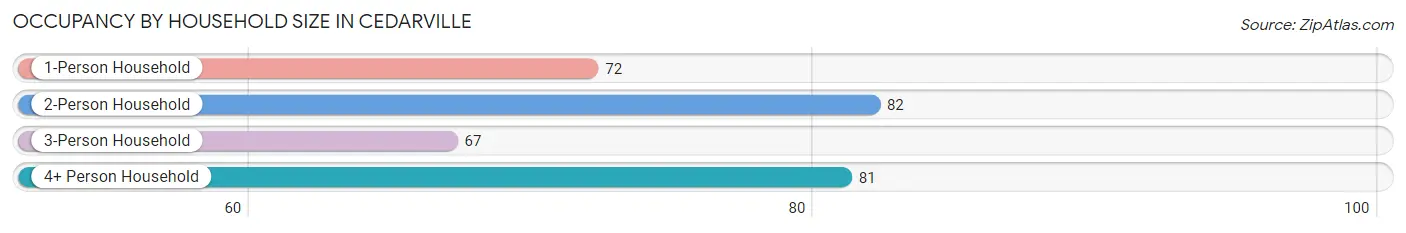
Occupancy by Household Size in Cedarville
| Household Size | # Housing Units | % Housing Units |
| 1-Person Household | 72 | 23.8% |
| 2-Person Household | 82 | 27.2% |
| 3-Person Household | 67 | 22.2% |
| 4+ Person Household | 81 | 26.8% |
| Total Housing Units | 302 | 100.0% |
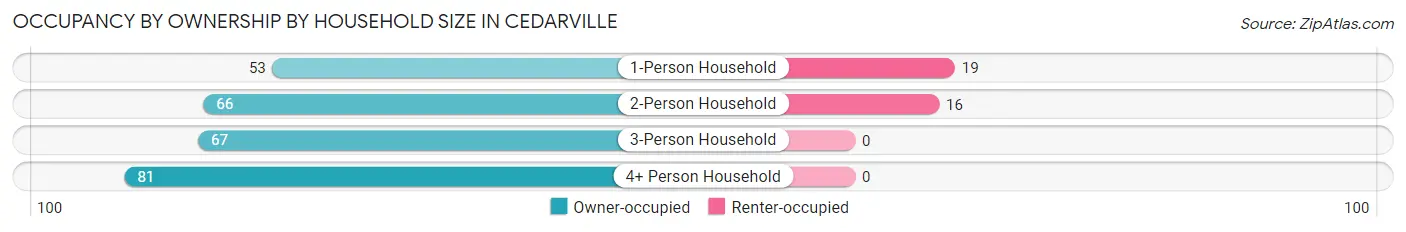
Occupancy by Ownership by Household Size in Cedarville
| Household Size | Owner-occupied | Renter-occupied |
| 1-Person Household | 53 (73.6%) | 19 (26.4%) |
| 2-Person Household | 66 (80.5%) | 16 (19.5%) |
| 3-Person Household | 67 (100.0%) | 0 (0.0%) |
| 4+ Person Household | 81 (100.0%) | 0 (0.0%) |
| Total Housing Units | 267 (88.4%) | 35 (11.6%) |
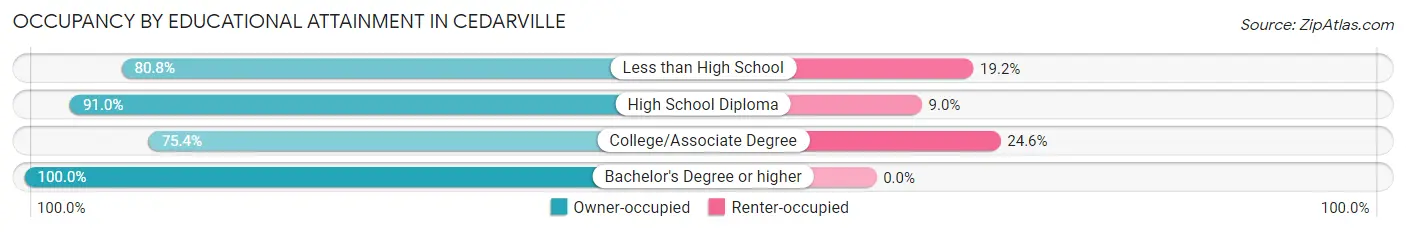
Occupancy by Educational Attainment in Cedarville
| Household Size | Owner-occupied | Renter-occupied |
| Less than High School | 42 (80.8%) | 10 (19.2%) |
| High School Diploma | 91 (91.0%) | 9 (9.0%) |
| College/Associate Degree | 49 (75.4%) | 16 (24.6%) |
| Bachelor's Degree or higher | 85 (100.0%) | 0 (0.0%) |
Occupancy by Age of Householder in Cedarville
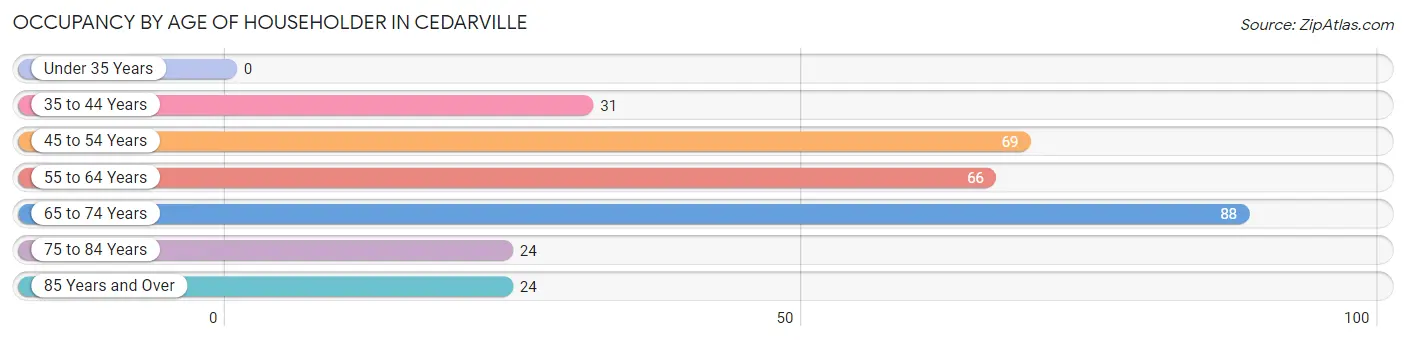
| Age Bracket | # Households | % Households |
| Under 35 Years | 0 | 0.0% |
| 35 to 44 Years | 31 | 10.3% |
| 45 to 54 Years | 69 | 22.9% |
| 55 to 64 Years | 66 | 21.8% |
| 65 to 74 Years | 88 | 29.1% |
| 75 to 84 Years | 24 | 8.0% |
| 85 Years and Over | 24 | 8.0% |
| Total | 302 | 100.0% |
Housing Finances in Cedarville
Median Income by Occupancy in Cedarville
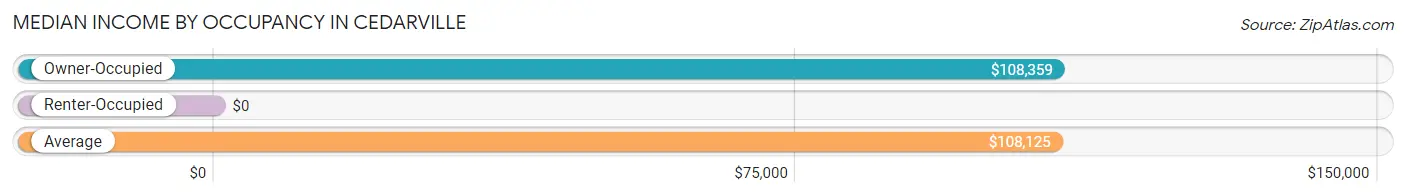
| Occupancy Type | # Households | Median Income |
| Owner-Occupied | 267 (88.4%) | $108,359 |
| Renter-Occupied | 35 (11.6%) | $0 |
| Average | 302 (100.0%) | $108,125 |
Occupancy by Householder Income Bracket in Cedarville
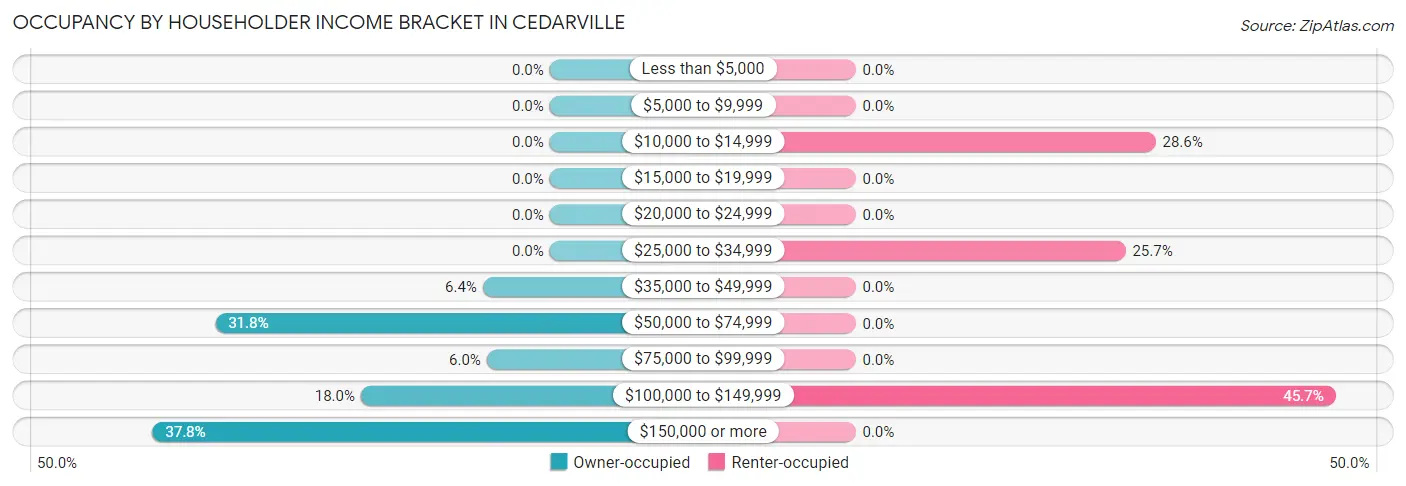
| Income Bracket | Owner-occupied | Renter-occupied |
| Less than $5,000 | 0 (0.0%) | 0 (0.0%) |
| $5,000 to $9,999 | 0 (0.0%) | 0 (0.0%) |
| $10,000 to $14,999 | 0 (0.0%) | 10 (28.6%) |
| $15,000 to $19,999 | 0 (0.0%) | 0 (0.0%) |
| $20,000 to $24,999 | 0 (0.0%) | 0 (0.0%) |
| $25,000 to $34,999 | 0 (0.0%) | 9 (25.7%) |
| $35,000 to $49,999 | 17 (6.4%) | 0 (0.0%) |
| $50,000 to $74,999 | 85 (31.8%) | 0 (0.0%) |
| $75,000 to $99,999 | 16 (6.0%) | 0 (0.0%) |
| $100,000 to $149,999 | 48 (18.0%) | 16 (45.7%) |
| $150,000 or more | 101 (37.8%) | 0 (0.0%) |
| Total | 267 (100.0%) | 35 (100.0%) |
Monthly Housing Cost Tiers in Cedarville
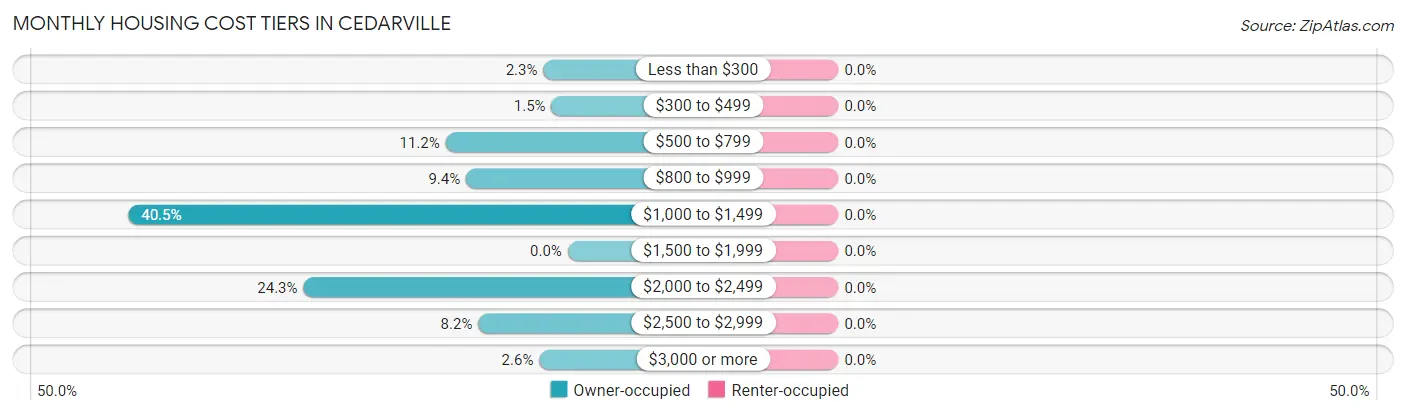
| Monthly Cost | Owner-occupied | Renter-occupied |
| Less than $300 | 6 (2.2%) | 0 (0.0%) |
| $300 to $499 | 4 (1.5%) | 0 (0.0%) |
| $500 to $799 | 30 (11.2%) | 0 (0.0%) |
| $800 to $999 | 25 (9.4%) | 0 (0.0%) |
| $1,000 to $1,499 | 108 (40.5%) | 0 (0.0%) |
| $1,500 to $1,999 | 0 (0.0%) | 0 (0.0%) |
| $2,000 to $2,499 | 65 (24.3%) | 0 (0.0%) |
| $2,500 to $2,999 | 22 (8.2%) | 0 (0.0%) |
| $3,000 or more | 7 (2.6%) | 0 (0.0%) |
| Total | 267 (100.0%) | 35 (100.0%) |
Physical Housing Characteristics in Cedarville
Housing Structures in Cedarville
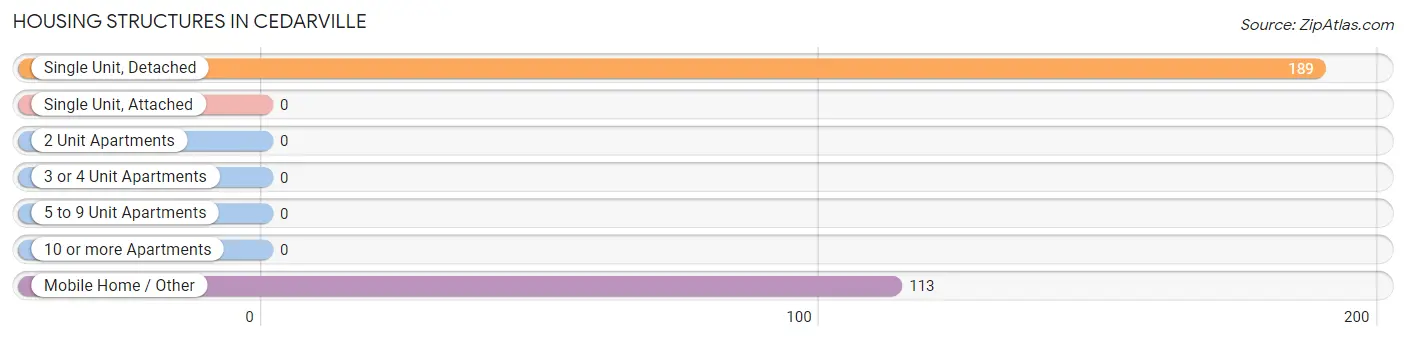
| Structure Type | # Housing Units | % Housing Units |
| Single Unit, Detached | 189 | 62.6% |
| Single Unit, Attached | 0 | 0.0% |
| 2 Unit Apartments | 0 | 0.0% |
| 3 or 4 Unit Apartments | 0 | 0.0% |
| 5 to 9 Unit Apartments | 0 | 0.0% |
| 10 or more Apartments | 0 | 0.0% |
| Mobile Home / Other | 113 | 37.4% |
| Total | 302 | 100.0% |
Housing Structures by Occupancy in Cedarville
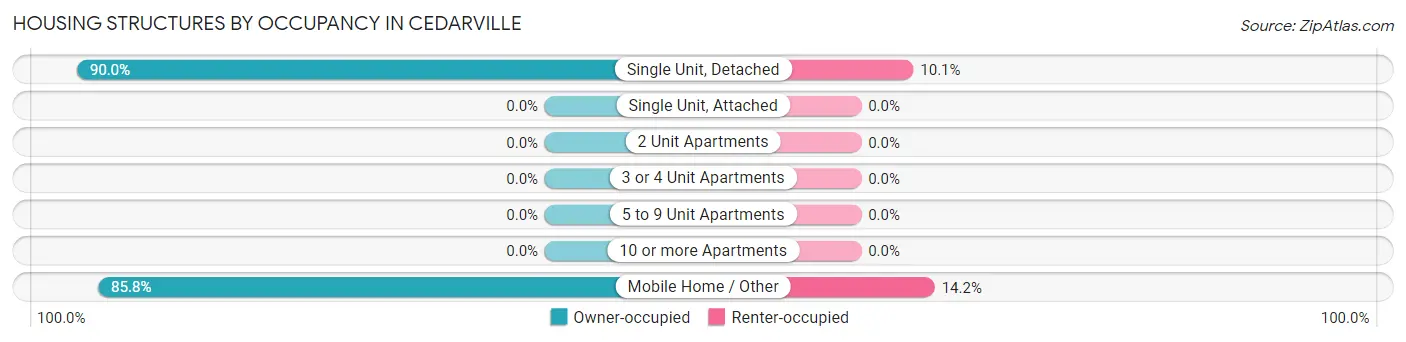
| Structure Type | Owner-occupied | Renter-occupied |
| Single Unit, Detached | 170 (89.9%) | 19 (10.1%) |
| Single Unit, Attached | 0 (0.0%) | 0 (0.0%) |
| 2 Unit Apartments | 0 (0.0%) | 0 (0.0%) |
| 3 or 4 Unit Apartments | 0 (0.0%) | 0 (0.0%) |
| 5 to 9 Unit Apartments | 0 (0.0%) | 0 (0.0%) |
| 10 or more Apartments | 0 (0.0%) | 0 (0.0%) |
| Mobile Home / Other | 97 (85.8%) | 16 (14.2%) |
| Total | 267 (88.4%) | 35 (11.6%) |
Housing Structures by Number of Rooms in Cedarville
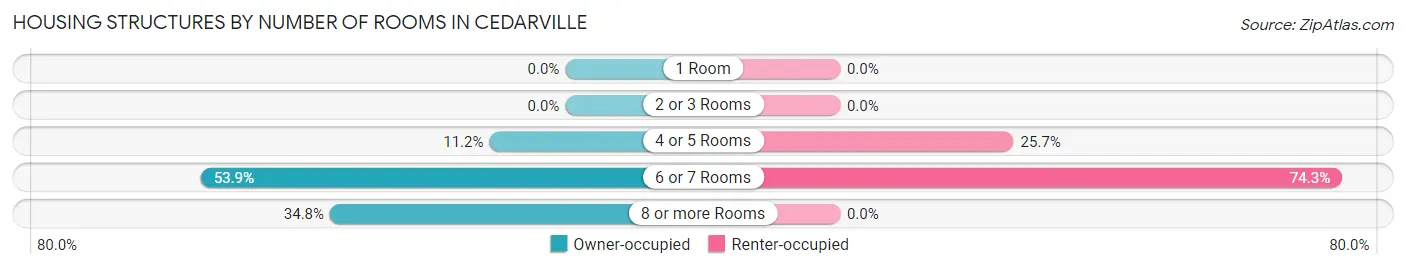
| Number of Rooms | Owner-occupied | Renter-occupied |
| 1 Room | 0 (0.0%) | 0 (0.0%) |
| 2 or 3 Rooms | 0 (0.0%) | 0 (0.0%) |
| 4 or 5 Rooms | 30 (11.2%) | 9 (25.7%) |
| 6 or 7 Rooms | 144 (53.9%) | 26 (74.3%) |
| 8 or more Rooms | 93 (34.8%) | 0 (0.0%) |
| Total | 267 (100.0%) | 35 (100.0%) |
Housing Structure by Heating Type in Cedarville
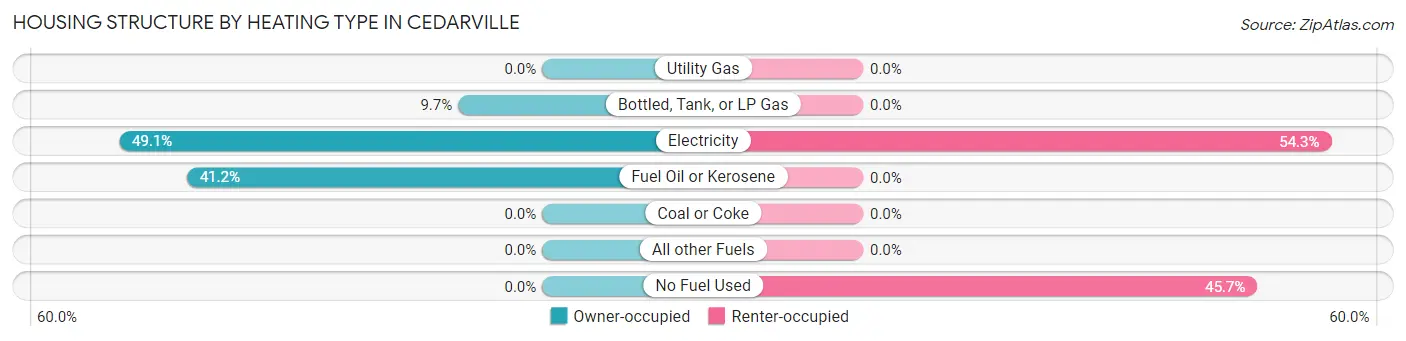
| Heating Type | Owner-occupied | Renter-occupied |
| Utility Gas | 0 (0.0%) | 0 (0.0%) |
| Bottled, Tank, or LP Gas | 26 (9.7%) | 0 (0.0%) |
| Electricity | 131 (49.1%) | 19 (54.3%) |
| Fuel Oil or Kerosene | 110 (41.2%) | 0 (0.0%) |
| Coal or Coke | 0 (0.0%) | 0 (0.0%) |
| All other Fuels | 0 (0.0%) | 0 (0.0%) |
| No Fuel Used | 0 (0.0%) | 16 (45.7%) |
| Total | 267 (100.0%) | 35 (100.0%) |
Household Vehicle Usage in Cedarville
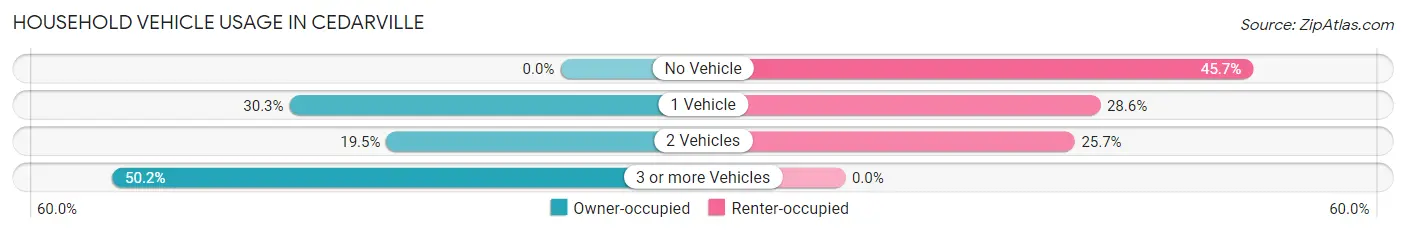
| Vehicles per Household | Owner-occupied | Renter-occupied |
| No Vehicle | 0 (0.0%) | 16 (45.7%) |
| 1 Vehicle | 81 (30.3%) | 10 (28.6%) |
| 2 Vehicles | 52 (19.5%) | 9 (25.7%) |
| 3 or more Vehicles | 134 (50.2%) | 0 (0.0%) |
| Total | 267 (100.0%) | 35 (100.0%) |
Real Estate & Mortgages in Cedarville
Real Estate and Mortgage Overview in Cedarville
| Characteristic | Without Mortgage | With Mortgage |
| Housing Units | 118 | 149 |
| Median Property Value | - | - |
| Median Household Income | $108,438 | $52 |
| Monthly Housing Costs | $1,059 | $7 |
| Real Estate Taxes | $3,625 | $47 |
Property Value by Mortgage Status in Cedarville
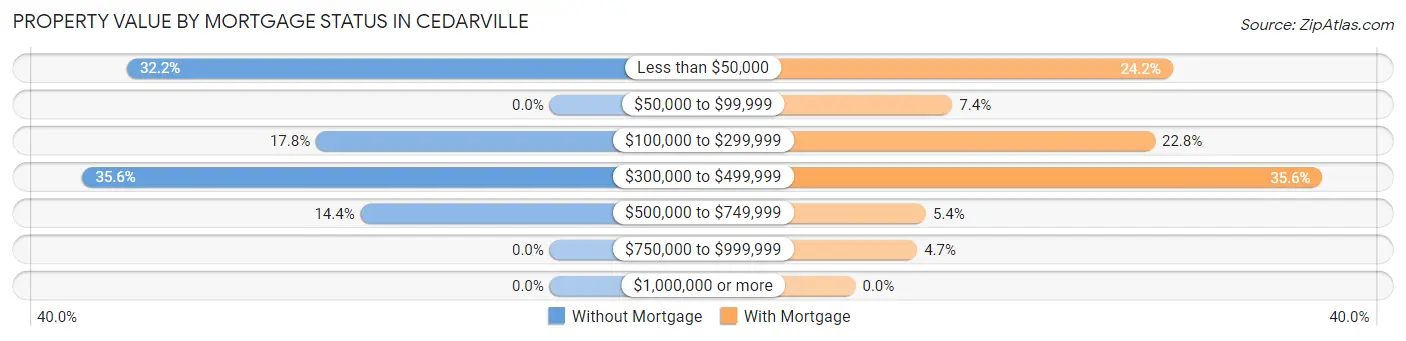
| Property Value | Without Mortgage | With Mortgage |
| Less than $50,000 | 38 (32.2%) | 36 (24.2%) |
| $50,000 to $99,999 | 0 (0.0%) | 11 (7.4%) |
| $100,000 to $299,999 | 21 (17.8%) | 34 (22.8%) |
| $300,000 to $499,999 | 42 (35.6%) | 53 (35.6%) |
| $500,000 to $749,999 | 17 (14.4%) | 8 (5.4%) |
| $750,000 to $999,999 | 0 (0.0%) | 7 (4.7%) |
| $1,000,000 or more | 0 (0.0%) | 0 (0.0%) |
| Total | 118 (100.0%) | 149 (100.0%) |
Household Income by Mortgage Status in Cedarville
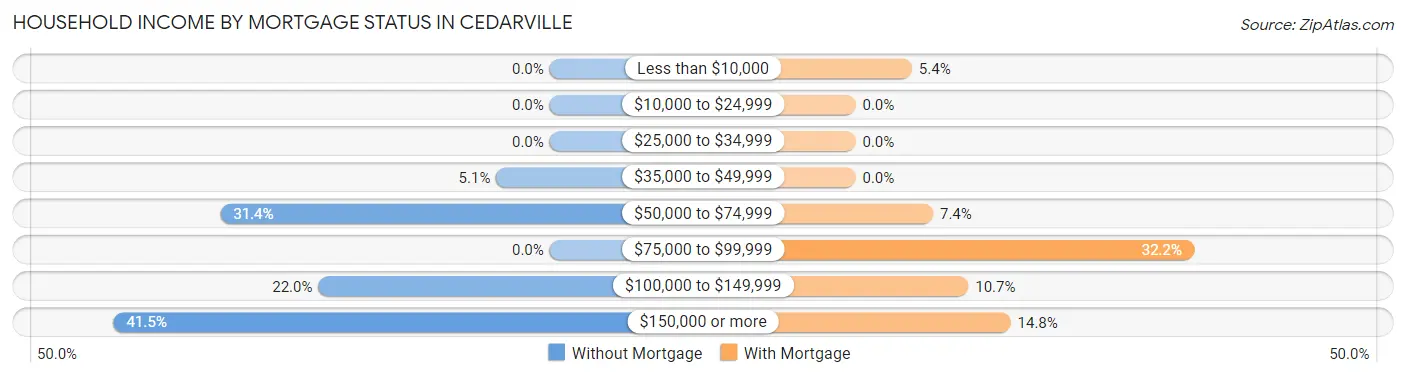
| Household Income | Without Mortgage | With Mortgage |
| Less than $10,000 | 0 (0.0%) | 8 (5.4%) |
| $10,000 to $24,999 | 0 (0.0%) | 0 (0.0%) |
| $25,000 to $34,999 | 0 (0.0%) | 0 (0.0%) |
| $35,000 to $49,999 | 6 (5.1%) | 0 (0.0%) |
| $50,000 to $74,999 | 37 (31.4%) | 11 (7.4%) |
| $75,000 to $99,999 | 0 (0.0%) | 48 (32.2%) |
| $100,000 to $149,999 | 26 (22.0%) | 16 (10.7%) |
| $150,000 or more | 49 (41.5%) | 22 (14.8%) |
| Total | 118 (100.0%) | 149 (100.0%) |
Property Value to Household Income Ratio in Cedarville
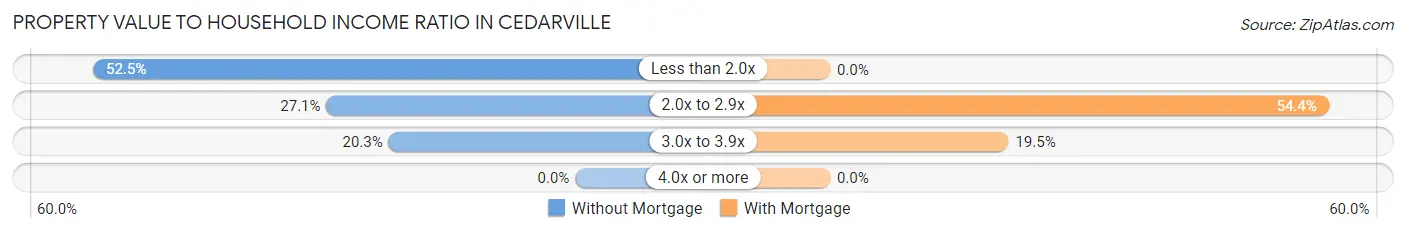
| Value-to-Income Ratio | Without Mortgage | With Mortgage |
| Less than 2.0x | 62 (52.5%) | 0 (0.0%) |
| 2.0x to 2.9x | 32 (27.1%) | 81 (54.4%) |
| 3.0x to 3.9x | 24 (20.3%) | 29 (19.5%) |
| 4.0x or more | 0 (0.0%) | 0 (0.0%) |
| Total | 118 (100.0%) | 149 (100.0%) |
Real Estate Taxes by Mortgage Status in Cedarville
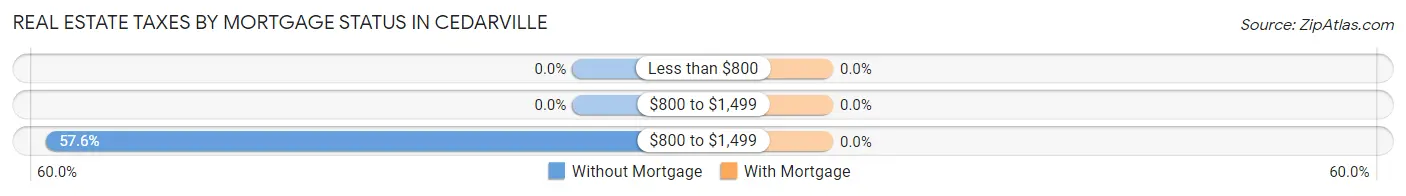
| Property Taxes | Without Mortgage | With Mortgage |
| Less than $800 | 0 (0.0%) | 0 (0.0%) |
| $800 to $1,499 | 0 (0.0%) | 0 (0.0%) |
| $800 to $1,499 | 68 (57.6%) | 0 (0.0%) |
| Total | 118 (100.0%) | 149 (100.0%) |
Health & Disability in Cedarville
Health Insurance Coverage by Age in Cedarville
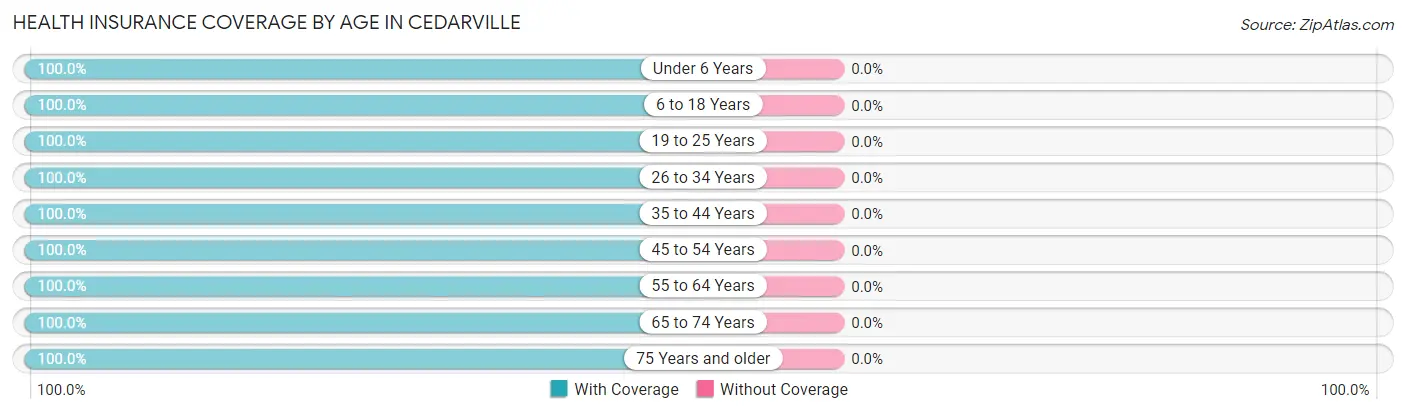
| Age Bracket | With Coverage | Without Coverage |
| Under 6 Years | 57 (100.0%) | 0 (0.0%) |
| 6 to 18 Years | 103 (100.0%) | 0 (0.0%) |
| 19 to 25 Years | 39 (100.0%) | 0 (0.0%) |
| 26 to 34 Years | 46 (100.0%) | 0 (0.0%) |
| 35 to 44 Years | 94 (100.0%) | 0 (0.0%) |
| 45 to 54 Years | 118 (100.0%) | 0 (0.0%) |
| 55 to 64 Years | 186 (100.0%) | 0 (0.0%) |
| 65 to 74 Years | 115 (100.0%) | 0 (0.0%) |
| 75 Years and older | 69 (100.0%) | 0 (0.0%) |
| Total | 827 (100.0%) | 0 (0.0%) |
Health Insurance Coverage by Citizenship Status in Cedarville

| Citizenship Status | With Coverage | Without Coverage |
| Native Born | 57 (100.0%) | 0 (0.0%) |
| Foreign Born, Citizen | 103 (100.0%) | 0 (0.0%) |
| Foreign Born, not a Citizen | 39 (100.0%) | 0 (0.0%) |
Health Insurance Coverage by Household Income in Cedarville
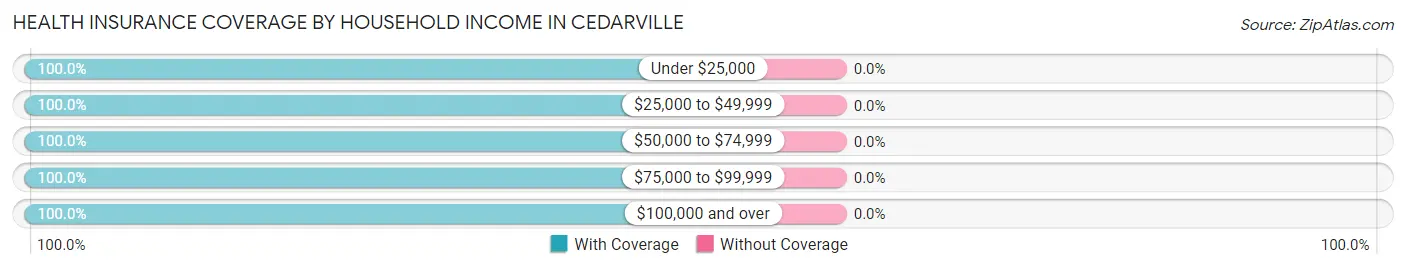
| Household Income | With Coverage | Without Coverage |
| Under $25,000 | 10 (100.0%) | 0 (0.0%) |
| $25,000 to $49,999 | 56 (100.0%) | 0 (0.0%) |
| $50,000 to $74,999 | 238 (100.0%) | 0 (0.0%) |
| $75,000 to $99,999 | 58 (100.0%) | 0 (0.0%) |
| $100,000 and over | 465 (100.0%) | 0 (0.0%) |
Public vs Private Health Insurance Coverage by Age in Cedarville
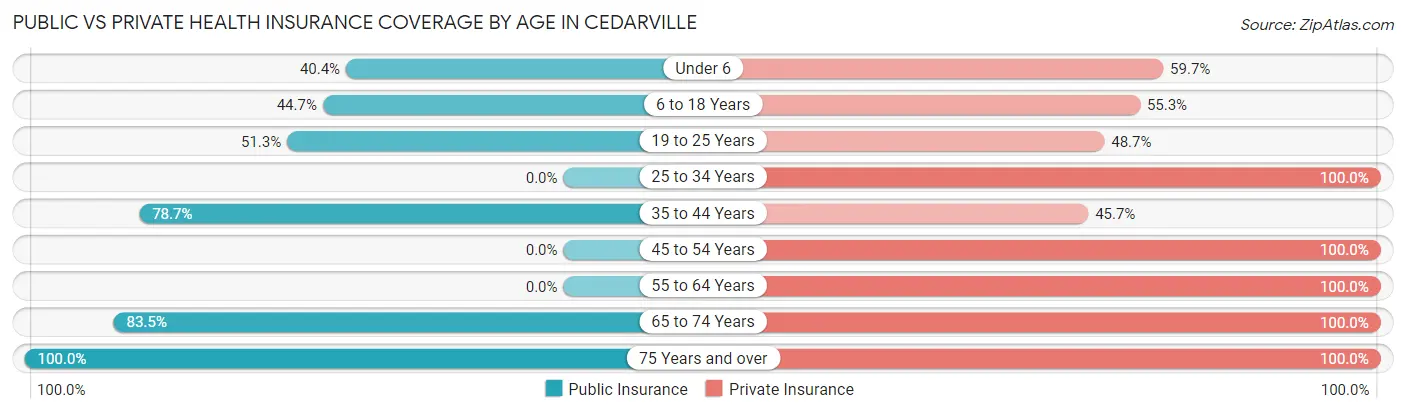
| Age Bracket | Public Insurance | Private Insurance |
| Under 6 | 23 (40.4%) | 34 (59.7%) |
| 6 to 18 Years | 46 (44.7%) | 57 (55.3%) |
| 19 to 25 Years | 20 (51.3%) | 19 (48.7%) |
| 25 to 34 Years | 0 (0.0%) | 46 (100.0%) |
| 35 to 44 Years | 74 (78.7%) | 43 (45.7%) |
| 45 to 54 Years | 0 (0.0%) | 118 (100.0%) |
| 55 to 64 Years | 0 (0.0%) | 186 (100.0%) |
| 65 to 74 Years | 96 (83.5%) | 115 (100.0%) |
| 75 Years and over | 69 (100.0%) | 69 (100.0%) |
| Total | 328 (39.7%) | 687 (83.1%) |
Disability Status by Sex by Age in Cedarville
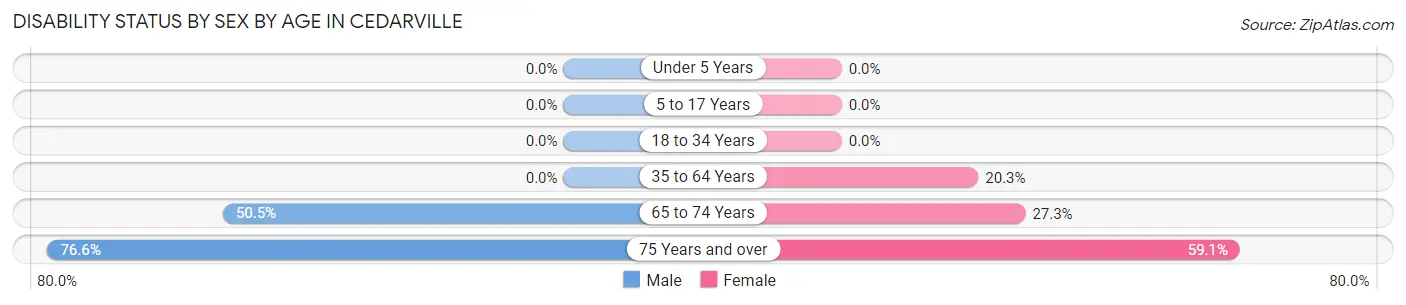
| Age Bracket | Male | Female |
| Under 5 Years | 0 (0.0%) | 0 (0.0%) |
| 5 to 17 Years | 0 (0.0%) | 0 (0.0%) |
| 18 to 34 Years | 0 (0.0%) | 0 (0.0%) |
| 35 to 64 Years | 0 (0.0%) | 43 (20.3%) |
| 65 to 74 Years | 47 (50.5%) | 6 (27.3%) |
| 75 Years and over | 36 (76.6%) | 13 (59.1%) |
Disability Class by Sex by Age in Cedarville
Disability Class: Hearing Difficulty
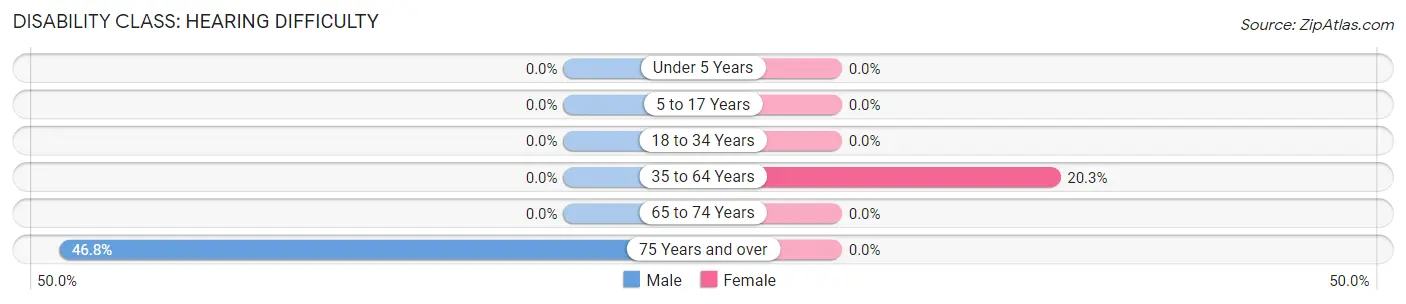
| Age Bracket | Male | Female |
| Under 5 Years | 0 (0.0%) | 0 (0.0%) |
| 5 to 17 Years | 0 (0.0%) | 0 (0.0%) |
| 18 to 34 Years | 0 (0.0%) | 0 (0.0%) |
| 35 to 64 Years | 0 (0.0%) | 43 (20.3%) |
| 65 to 74 Years | 0 (0.0%) | 0 (0.0%) |
| 75 Years and over | 22 (46.8%) | 0 (0.0%) |
Disability Class: Vision Difficulty
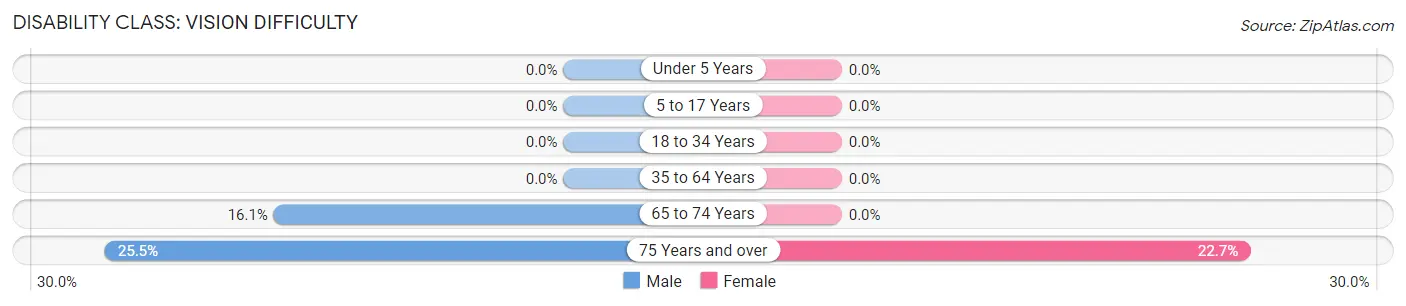
| Age Bracket | Male | Female |
| Under 5 Years | 0 (0.0%) | 0 (0.0%) |
| 5 to 17 Years | 0 (0.0%) | 0 (0.0%) |
| 18 to 34 Years | 0 (0.0%) | 0 (0.0%) |
| 35 to 64 Years | 0 (0.0%) | 0 (0.0%) |
| 65 to 74 Years | 15 (16.1%) | 0 (0.0%) |
| 75 Years and over | 12 (25.5%) | 5 (22.7%) |
Disability Class: Cognitive Difficulty
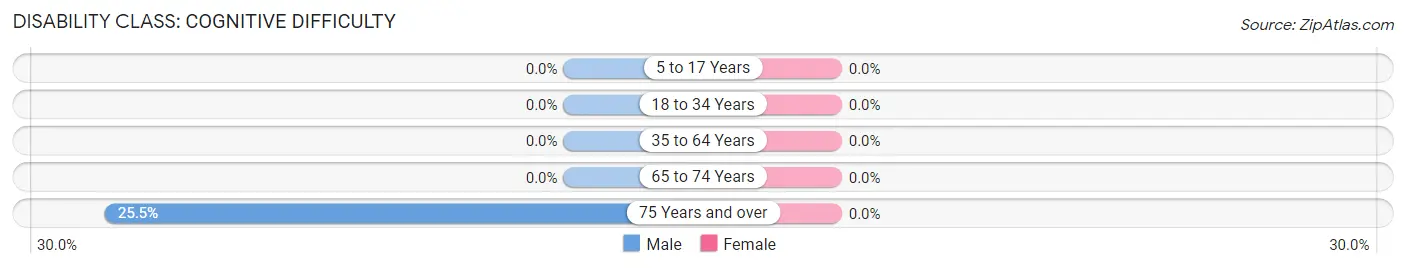
| Age Bracket | Male | Female |
| 5 to 17 Years | 0 (0.0%) | 0 (0.0%) |
| 18 to 34 Years | 0 (0.0%) | 0 (0.0%) |
| 35 to 64 Years | 0 (0.0%) | 0 (0.0%) |
| 65 to 74 Years | 0 (0.0%) | 0 (0.0%) |
| 75 Years and over | 12 (25.5%) | 0 (0.0%) |
Disability Class: Ambulatory Difficulty
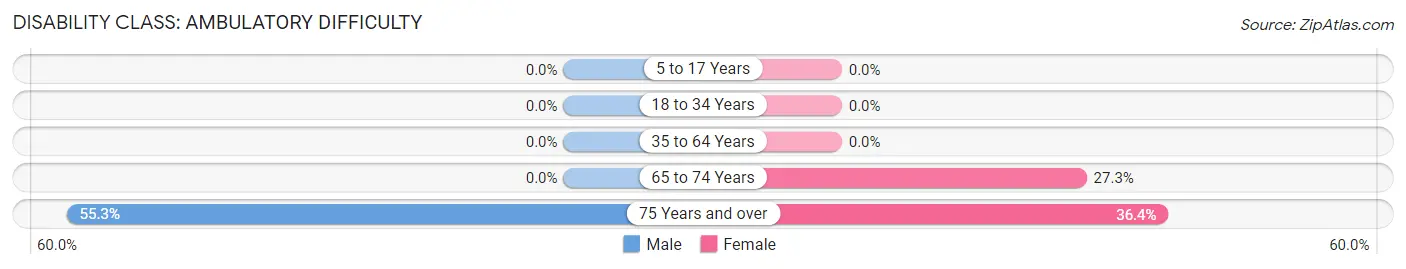
| Age Bracket | Male | Female |
| 5 to 17 Years | 0 (0.0%) | 0 (0.0%) |
| 18 to 34 Years | 0 (0.0%) | 0 (0.0%) |
| 35 to 64 Years | 0 (0.0%) | 0 (0.0%) |
| 65 to 74 Years | 0 (0.0%) | 6 (27.3%) |
| 75 Years and over | 26 (55.3%) | 8 (36.4%) |
Disability Class: Self-Care Difficulty
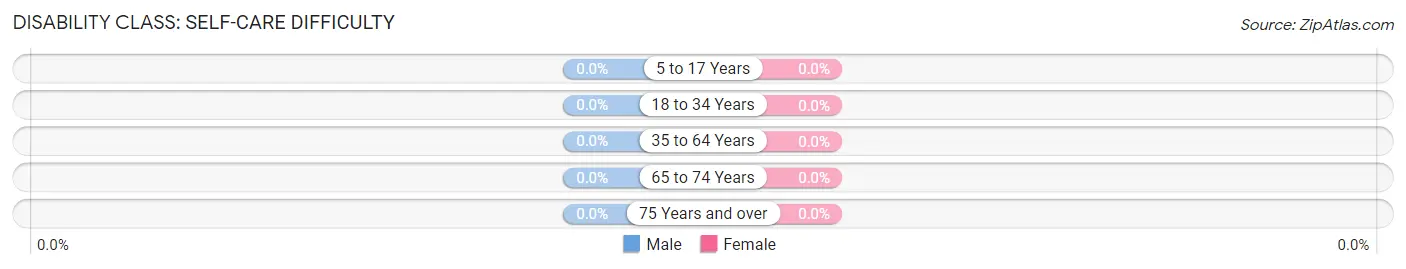
| Age Bracket | Male | Female |
| 5 to 17 Years | 0 (0.0%) | 0 (0.0%) |
| 18 to 34 Years | 0 (0.0%) | 0 (0.0%) |
| 35 to 64 Years | 0 (0.0%) | 0 (0.0%) |
| 65 to 74 Years | 0 (0.0%) | 0 (0.0%) |
| 75 Years and over | 0 (0.0%) | 0 (0.0%) |
Technology Access in Cedarville
Computing Device Access in Cedarville
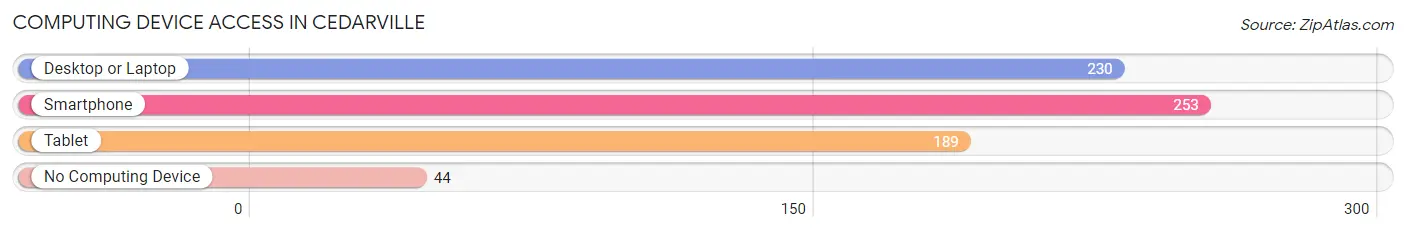
| Device Type | # Households | % Households |
| Desktop or Laptop | 230 | 76.2% |
| Smartphone | 253 | 83.8% |
| Tablet | 189 | 62.6% |
| No Computing Device | 44 | 14.6% |
| Total | 302 | 100.0% |
Internet Access in Cedarville
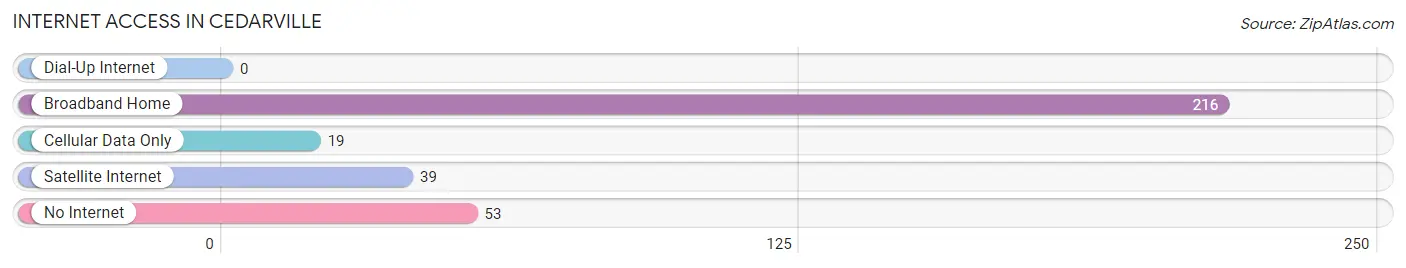
| Internet Type | # Households | % Households |
| Dial-Up Internet | 0 | 0.0% |
| Broadband Home | 216 | 71.5% |
| Cellular Data Only | 19 | 6.3% |
| Satellite Internet | 39 | 12.9% |
| No Internet | 53 | 17.5% |
| Total | 302 | 100.0% |
Cedarville Summary
Cedarville is a small unincorporated community located in Calvert County, Maryland. It is situated on the Patuxent River, approximately 25 miles south of Washington, D.C. and 25 miles north of Annapolis. The population of Cedarville was estimated to be 1,845 in 2019.
History
Cedarville was first settled in the early 1700s by English settlers. The town was originally known as “Cedar Point” and was a popular spot for fishing and hunting. In 1790, the town was officially incorporated as “Cedarville”.
In the early 1800s, Cedarville was a thriving port town. It was a major hub for the Chesapeake Bay oyster industry and was home to several shipbuilding companies. The town also had a thriving lumber industry, with several sawmills located along the Patuxent River.
In the late 1800s, Cedarville began to decline as the oyster industry declined and the lumber industry moved elsewhere. The town was further impacted by the Great Depression and World War II.
Geography
Cedarville is located in Calvert County, Maryland. It is situated on the Patuxent River, approximately 25 miles south of Washington, D.C. and 25 miles north of Annapolis. The town is bordered by the Patuxent River to the east, the Chesapeake Bay to the south, and the Patuxent Wildlife Refuge to the west.
The town is located in a rural area and is surrounded by farmland and forests. The terrain is mostly flat, with some rolling hills. The climate is humid subtropical, with hot, humid summers and mild winters.
Economy
Cedarville’s economy is largely based on agriculture and tourism. The town is home to several farms, including a dairy farm, a vegetable farm, and a Christmas tree farm. The town also has several restaurants, a marina, and a few small shops.
Tourism is an important part of the local economy. The town is home to several historic sites, including the Cedarville Historic District, which is listed on the National Register of Historic Places. The town also has several parks and recreational areas, including the Patuxent River Park and the Cedarville State Forest.
Demographics
As of 2019, the population of Cedarville was estimated to be 1,845. The population is predominantly white (90.2%), with small percentages of African American (4.2%), Asian (2.2%), and Hispanic (2.2%) residents. The median household income is $77,917, and the median home value is $346,400.
Cedarville is a small, rural community with a strong sense of community. The town is home to several churches, a volunteer fire department, and a public library. The town also has several parks and recreational areas, making it a great place to live and visit.
Common Questions
What is Per Capita Income in Cedarville?
Per Capita income in Cedarville is $43,249.
What is the Median Family Income in Cedarville?
Median Family Income in Cedarville is $148,409.
What is the Median Household income in Cedarville?
Median Household Income in Cedarville is $108,125.
What is Inequality or Gini Index in Cedarville?
Inequality or Gini Index in Cedarville is 0.34.
What is the Total Population of Cedarville?
Total Population of Cedarville is 827.
What is the Total Male Population of Cedarville?
Total Male Population of Cedarville is 523.
What is the Total Female Population of Cedarville?
Total Female Population of Cedarville is 304.
What is the Ratio of Males per 100 Females in Cedarville?
There are 172.04 Males per 100 Females in Cedarville.
What is the Ratio of Females per 100 Males in Cedarville?
There are 58.13 Females per 100 Males in Cedarville.
What is the Median Population Age in Cedarville?
Median Population Age in Cedarville is 53.6 Years.
What is the Average Family Size in Cedarville
Average Family Size in Cedarville is 3.3 People.
What is the Average Household Size in Cedarville
Average Household Size in Cedarville is 2.7 People.
How Large is the Labor Force in Cedarville?
There are 466 People in the Labor Forcein in Cedarville.
What is the Percentage of People in the Labor Force in Cedarville?
68.6% of People are in the Labor Force in Cedarville.
What is the Unemployment Rate in Cedarville?
Unemployment Rate in Cedarville is 2.6%.