Grahamtown, MD Map & Demographics
Grahamtown Map
Grahamtown Overview
$36,622
PER CAPITA INCOME
$129,760
AVG HOUSEHOLD INCOME
0.22
INEQUALITY / GINI INDEX
325
TOTAL POPULATION
188
MALE POPULATION
137
FEMALE POPULATION
137.23
MALES / 100 FEMALES
72.87
FEMALES / 100 MALES
30.1
MEDIAN AGE
4.8
AVG FAMILY SIZE
3.3
AVG HOUSEHOLD SIZE
140
LABOR FORCE [ PEOPLE ]
71.1%
PERCENT IN LABOR FORCE
13.6%
UNEMPLOYMENT RATE
Income in Grahamtown
Income Overview in Grahamtown
| Characteristic | Number | Measure |
| Per Capita Income | 325 | $36,622 |
| Median Family Income | 57 | $0 |
| Mean Family Income | 57 | $0 |
| Median Household Income | 99 | $129,760 |
| Mean Household Income | 99 | $115,789 |
| Income Deficit | 57 | $0 |
| Wage / Income Gap (%) | 325 | 0.00% |
| Wage / Income Gap ($) | 325 | 100.00¢ per $1 |
| Gini / Inequality Index | 325 | 0.22 |
Earnings by Sex in Grahamtown
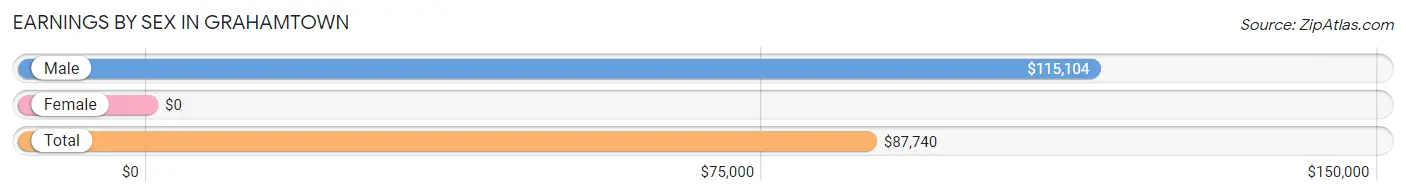
| Sex | Number | Average Earnings |
| Male | 101 (66.9%) | $115,104 |
| Female | 50 (33.1%) | $0 |
| Total | 151 (100.0%) | $87,740 |
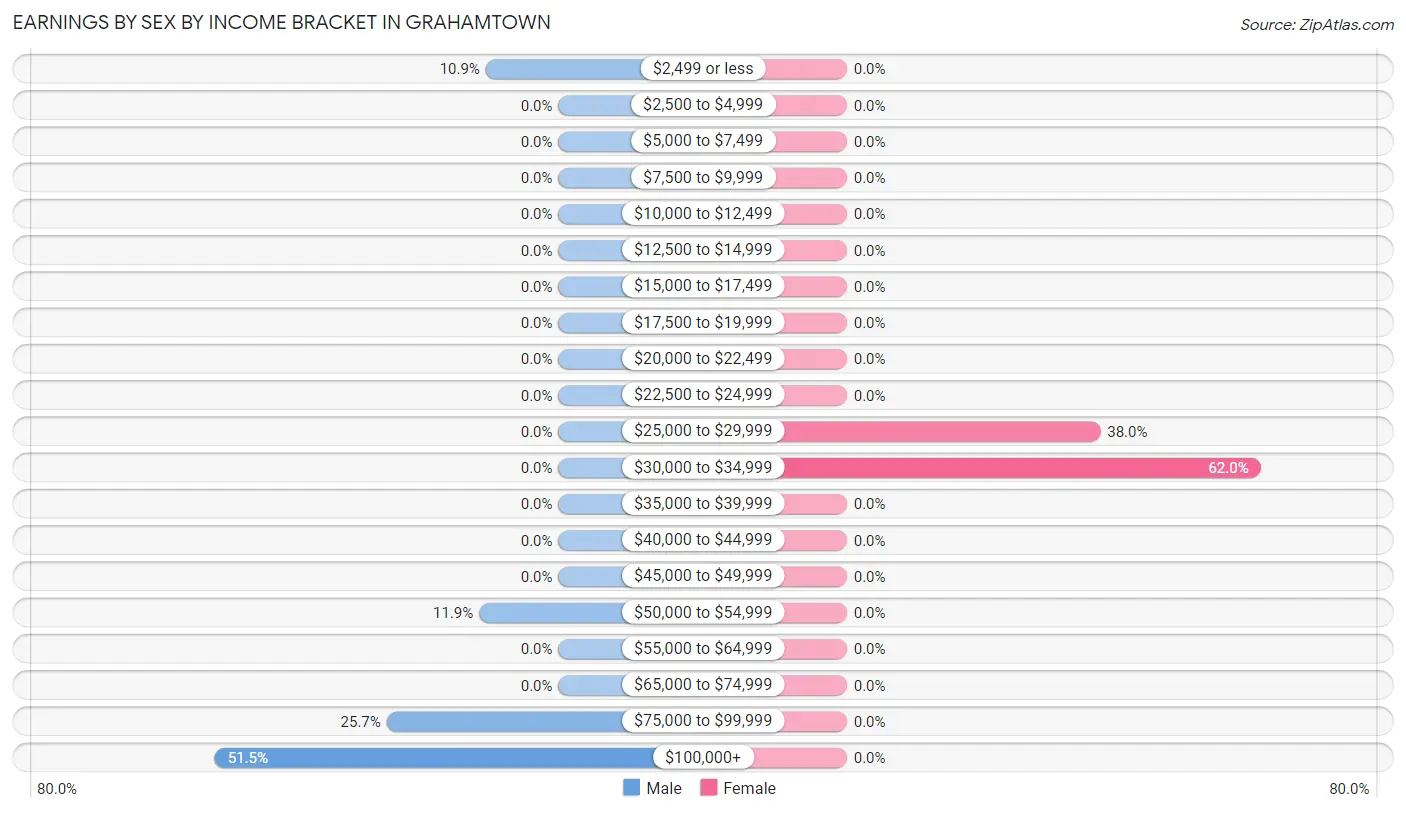
Earnings by Sex by Income Bracket in Grahamtown
The most common earnings brackets in Grahamtown are $100,000+ for men (52 | 51.5%) and $30,000 to $34,999 for women (31 | 62.0%).
| Income | Male | Female |
| $2,499 or less | 11 (10.9%) | 0 (0.0%) |
| $2,500 to $4,999 | 0 (0.0%) | 0 (0.0%) |
| $5,000 to $7,499 | 0 (0.0%) | 0 (0.0%) |
| $7,500 to $9,999 | 0 (0.0%) | 0 (0.0%) |
| $10,000 to $12,499 | 0 (0.0%) | 0 (0.0%) |
| $12,500 to $14,999 | 0 (0.0%) | 0 (0.0%) |
| $15,000 to $17,499 | 0 (0.0%) | 0 (0.0%) |
| $17,500 to $19,999 | 0 (0.0%) | 0 (0.0%) |
| $20,000 to $22,499 | 0 (0.0%) | 0 (0.0%) |
| $22,500 to $24,999 | 0 (0.0%) | 0 (0.0%) |
| $25,000 to $29,999 | 0 (0.0%) | 19 (38.0%) |
| $30,000 to $34,999 | 0 (0.0%) | 31 (62.0%) |
| $35,000 to $39,999 | 0 (0.0%) | 0 (0.0%) |
| $40,000 to $44,999 | 0 (0.0%) | 0 (0.0%) |
| $45,000 to $49,999 | 0 (0.0%) | 0 (0.0%) |
| $50,000 to $54,999 | 12 (11.9%) | 0 (0.0%) |
| $55,000 to $64,999 | 0 (0.0%) | 0 (0.0%) |
| $65,000 to $74,999 | 0 (0.0%) | 0 (0.0%) |
| $75,000 to $99,999 | 26 (25.7%) | 0 (0.0%) |
| $100,000+ | 52 (51.5%) | 0 (0.0%) |
| Total | 101 (100.0%) | 50 (100.0%) |
Earnings by Sex by Educational Attainment in Grahamtown
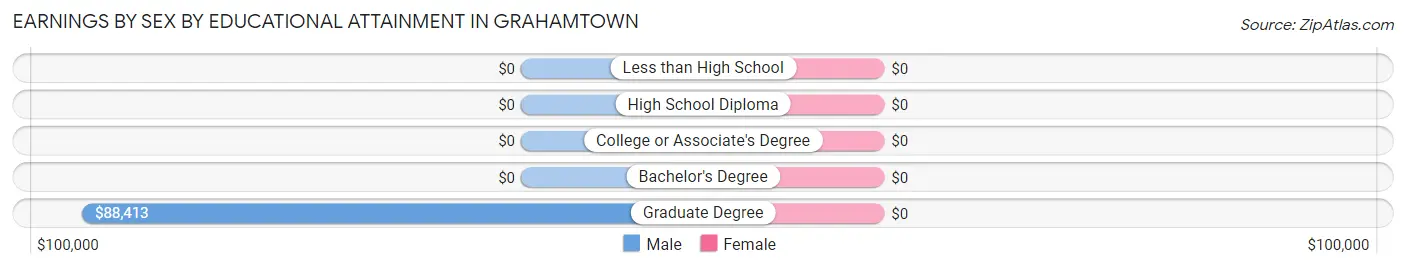
| Educational Attainment | Male Income | Female Income |
| Less than High School | - | - |
| High School Diploma | - | - |
| College or Associate's Degree | - | - |
| Bachelor's Degree | - | - |
| Graduate Degree | $88,413 | $0 |
| Total | $115,104 | $0 |
Family Income in Grahamtown
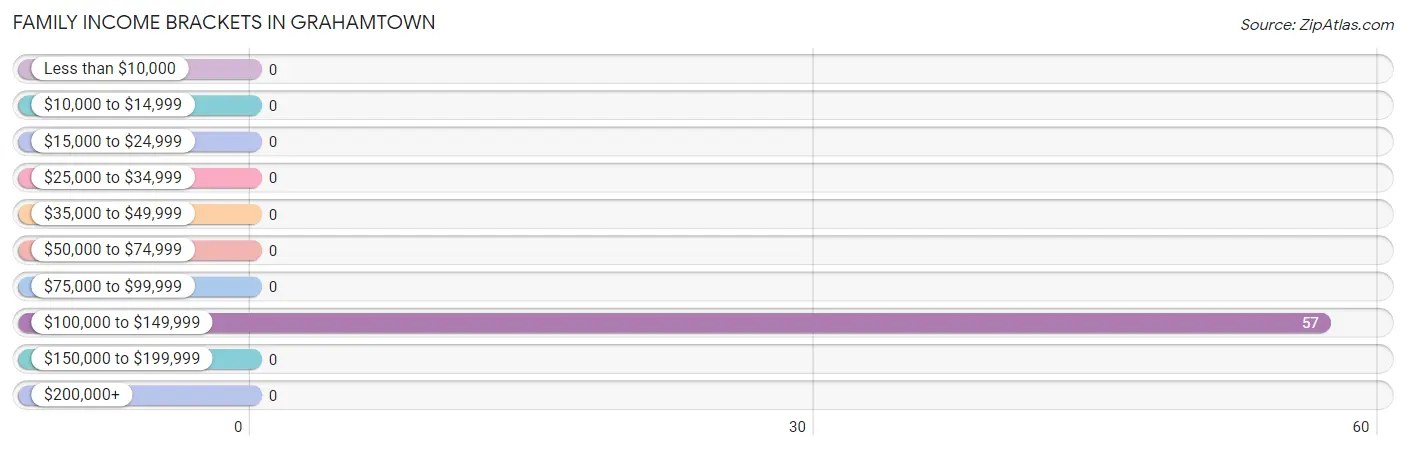
Family Income Brackets in Grahamtown
According to the Grahamtown family income data, there are 57 families falling into the $100,000 to $149,999 income range, which is the most common income bracket and makes up 100.0% of all families.
| Income Bracket | # Families | % Families |
| Less than $10,000 | 0 | 0.0% |
| $10,000 to $14,999 | 0 | 0.0% |
| $15,000 to $24,999 | 0 | 0.0% |
| $25,000 to $34,999 | 0 | 0.0% |
| $35,000 to $49,999 | 0 | 0.0% |
| $50,000 to $74,999 | 0 | 0.0% |
| $75,000 to $99,999 | 0 | 0.0% |
| $100,000 to $149,999 | 57 | 100.0% |
| $150,000 to $199,999 | 0 | 0.0% |
| $200,000+ | 0 | 0.0% |
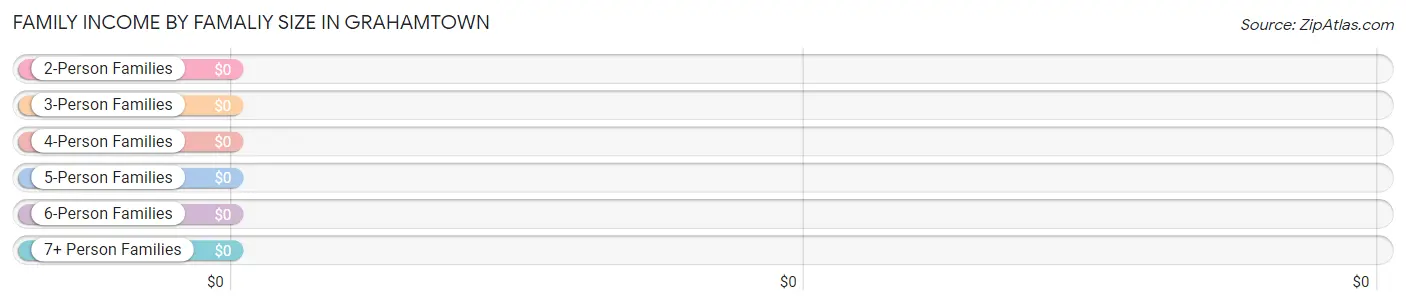
Family Income by Famaliy Size in Grahamtown
| Income Bracket | # Families | Median Income |
| 2-Person Families | 0 (0.0%) | $0 |
| 3-Person Families | 26 (45.6%) | $0 |
| 4-Person Families | 0 (0.0%) | $0 |
| 5-Person Families | 0 (0.0%) | $0 |
| 6-Person Families | 31 (54.4%) | $0 |
| 7+ Person Families | 0 (0.0%) | $0 |
| Total | 57 (100.0%) | $0 |
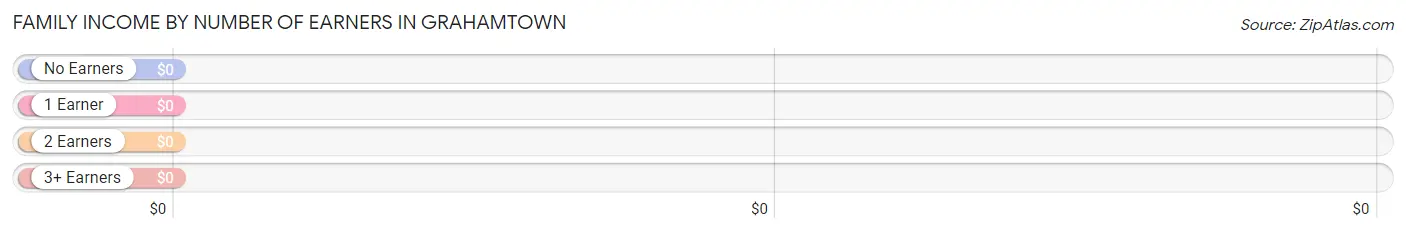
Family Income by Number of Earners in Grahamtown
| Number of Earners | # Families | Median Income |
| No Earners | 0 (0.0%) | $0 |
| 1 Earner | 0 (0.0%) | $0 |
| 2 Earners | 57 (100.0%) | $0 |
| 3+ Earners | 0 (0.0%) | $0 |
| Total | 57 (100.0%) | $0 |
Household Income in Grahamtown
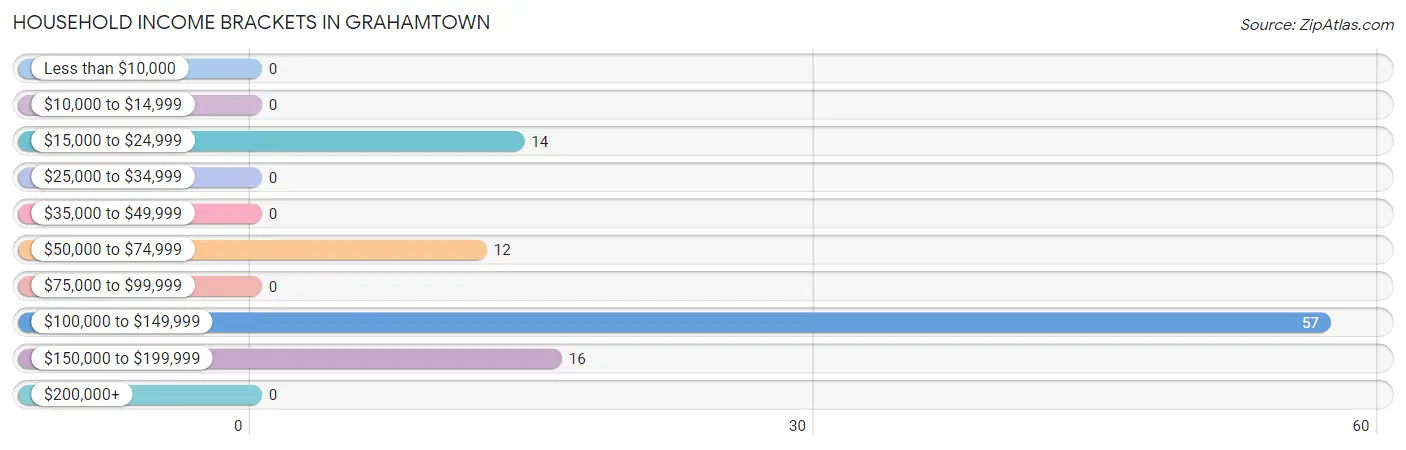
Household Income Brackets in Grahamtown
With 57 households falling in the category, the $100,000 to $149,999 income range is the most frequent in Grahamtown, accounting for 57.6% of all households.
| Income Bracket | # Households | % Households |
| Less than $10,000 | 0 | 0.0% |
| $10,000 to $14,999 | 0 | 0.0% |
| $15,000 to $24,999 | 14 | 14.1% |
| $25,000 to $34,999 | 0 | 0.0% |
| $35,000 to $49,999 | 0 | 0.0% |
| $50,000 to $74,999 | 12 | 12.1% |
| $75,000 to $99,999 | 0 | 0.0% |
| $100,000 to $149,999 | 57 | 57.6% |
| $150,000 to $199,999 | 16 | 16.2% |
| $200,000+ | 0 | 0.0% |
Household Income by Householder Age in Grahamtown
| Income Bracket | # Households | Median Income |
| 15 to 24 Years | 0 (0.0%) | $0 |
| 25 to 44 Years | 43 (43.4%) | $0 |
| 45 to 64 Years | 26 (26.3%) | $0 |
| 65+ Years | 30 (30.3%) | $0 |
| Total | 99 (100.0%) | $129,760 |
Poverty in Grahamtown
Income Below Poverty by Sex and Age in Grahamtown
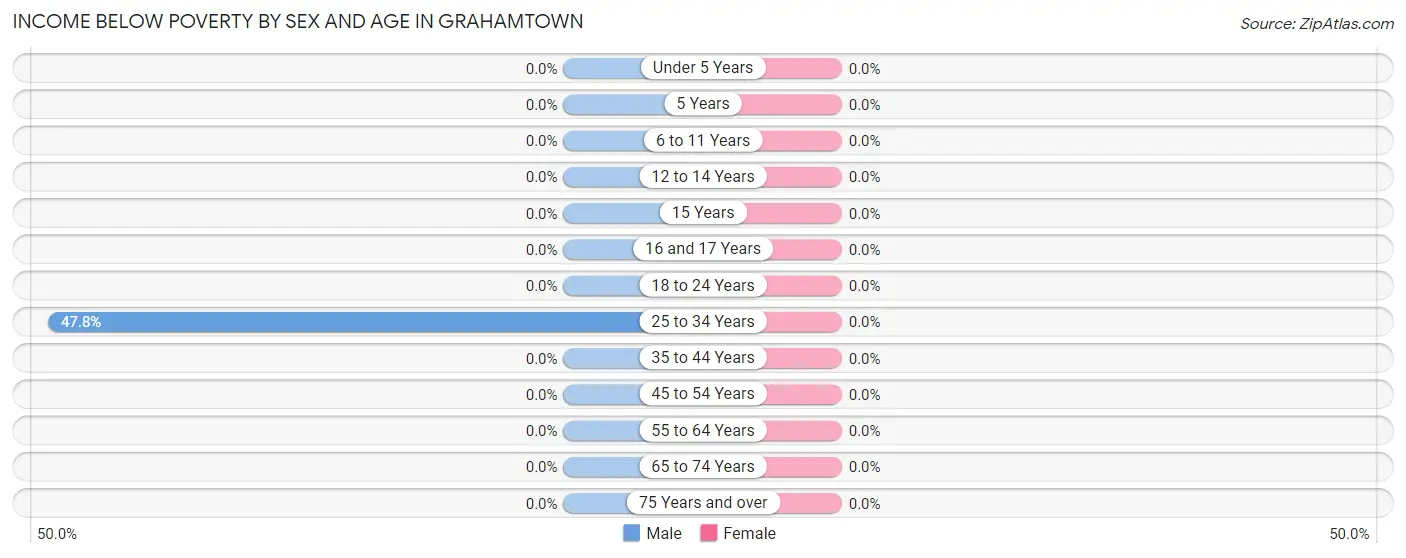
| Age Bracket | Male | Female |
| Under 5 Years | 0 (0.0%) | 0 (0.0%) |
| 5 Years | 0 (0.0%) | 0 (0.0%) |
| 6 to 11 Years | 0 (0.0%) | 0 (0.0%) |
| 12 to 14 Years | 0 (0.0%) | 0 (0.0%) |
| 15 Years | 0 (0.0%) | 0 (0.0%) |
| 16 and 17 Years | 0 (0.0%) | 0 (0.0%) |
| 18 to 24 Years | 0 (0.0%) | 0 (0.0%) |
| 25 to 34 Years | 11 (47.8%) | 0 (0.0%) |
| 35 to 44 Years | 0 (0.0%) | 0 (0.0%) |
| 45 to 54 Years | 0 (0.0%) | 0 (0.0%) |
| 55 to 64 Years | 0 (0.0%) | 0 (0.0%) |
| 65 to 74 Years | 0 (0.0%) | 0 (0.0%) |
| 75 Years and over | 0 (0.0%) | 0 (0.0%) |
| Total | 11 (5.9%) | 0 (0.0%) |
Income Above Poverty by Sex and Age in Grahamtown
According to the poverty statistics in Grahamtown, males aged 6 to 11 years and females aged 5 years are the age groups that are most secure financially, with 100.0% of males and 100.0% of females in these age groups living above the poverty line.
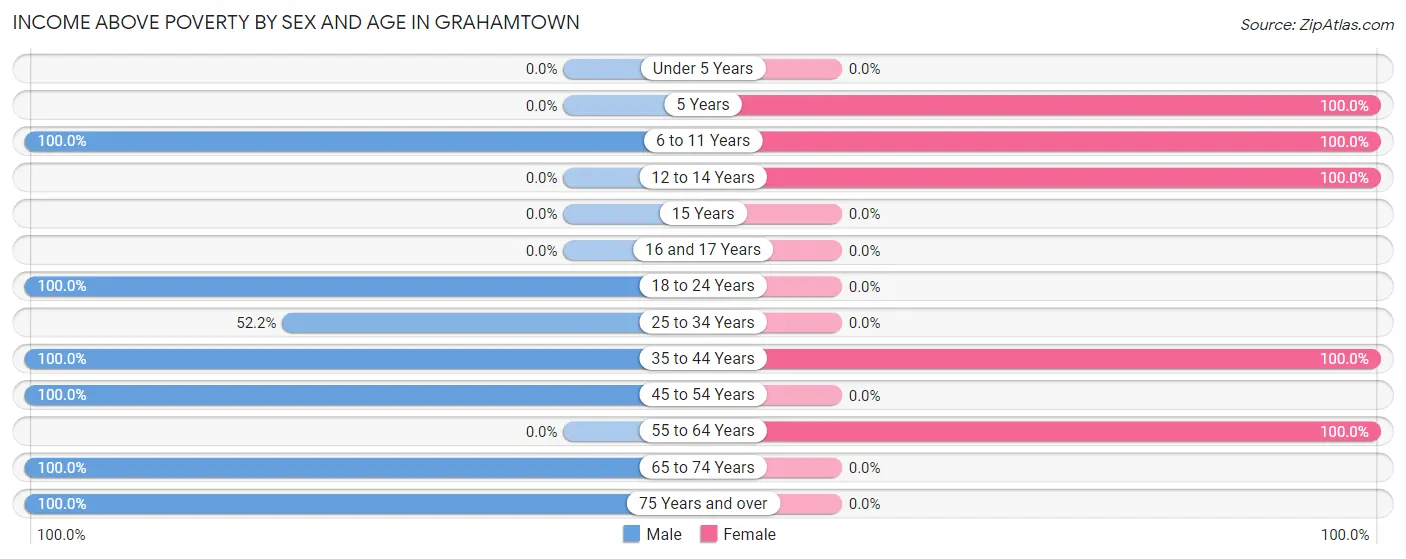
| Age Bracket | Male | Female |
| Under 5 Years | 0 (0.0%) | 0 (0.0%) |
| 5 Years | 0 (0.0%) | 29 (100.0%) |
| 6 to 11 Years | 41 (100.0%) | 29 (100.0%) |
| 12 to 14 Years | 0 (0.0%) | 29 (100.0%) |
| 15 Years | 0 (0.0%) | 0 (0.0%) |
| 16 and 17 Years | 0 (0.0%) | 0 (0.0%) |
| 18 to 24 Years | 32 (100.0%) | 0 (0.0%) |
| 25 to 34 Years | 12 (52.2%) | 0 (0.0%) |
| 35 to 44 Years | 36 (100.0%) | 31 (100.0%) |
| 45 to 54 Years | 26 (100.0%) | 0 (0.0%) |
| 55 to 64 Years | 0 (0.0%) | 19 (100.0%) |
| 65 to 74 Years | 16 (100.0%) | 0 (0.0%) |
| 75 Years and over | 14 (100.0%) | 0 (0.0%) |
| Total | 177 (94.2%) | 137 (100.0%) |
Income Below Poverty Among Married-Couple Families in Grahamtown
| Children | Above Poverty | Below Poverty |
| No Children | 26 (100.0%) | 0 (0.0%) |
| 1 or 2 Children | 0 (0.0%) | 0 (0.0%) |
| 3 or 4 Children | 31 (100.0%) | 0 (0.0%) |
| 5 or more Children | 0 (0.0%) | 0 (0.0%) |
| Total | 57 (100.0%) | 0 (0.0%) |
Income Below Poverty Among Single-Parent Households in Grahamtown
| Children | Single Father | Single Mother |
| No Children | 0 (0.0%) | 0 (0.0%) |
| 1 or 2 Children | 0 (0.0%) | 0 (0.0%) |
| 3 or 4 Children | 0 (0.0%) | 0 (0.0%) |
| 5 or more Children | 0 (0.0%) | 0 (0.0%) |
| Total | 0 (0.0%) | 0 (0.0%) |
Income Below Poverty Among Married-Couple vs Single-Parent Households in Grahamtown
| Children | Married-Couple Families | Single-Parent Households |
| No Children | 0 (0.0%) | 0 (0.0%) |
| 1 or 2 Children | 0 (0.0%) | 0 (0.0%) |
| 3 or 4 Children | 0 (0.0%) | 0 (0.0%) |
| 5 or more Children | 0 (0.0%) | 0 (0.0%) |
| Total | 0 (0.0%) | 0 (0.0%) |
Race in Grahamtown
The most populous races in Grahamtown are , and White / Caucasian (325 | 100.0%).
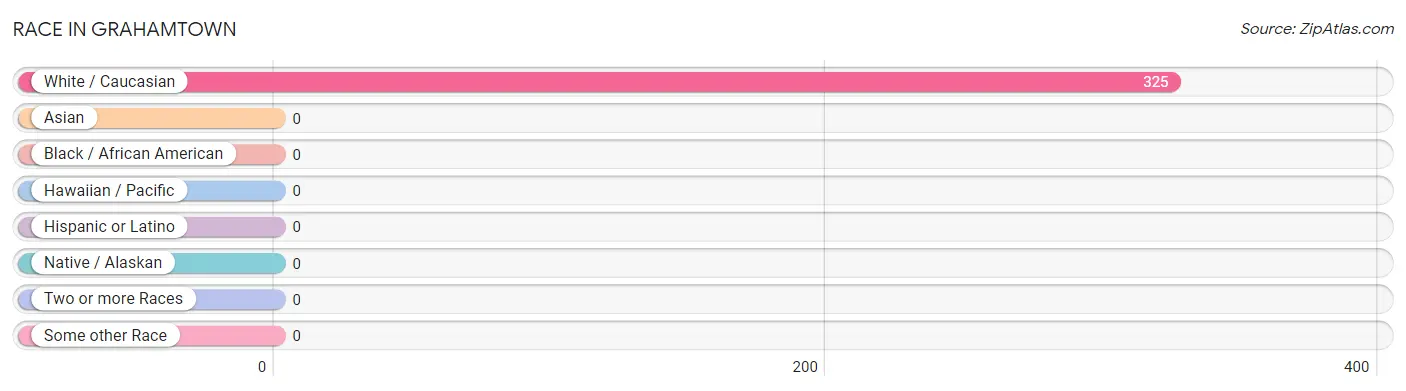
| Race | # Population | % Population |
| Asian | 0 | 0.0% |
| Black / African American | 0 | 0.0% |
| Hawaiian / Pacific | 0 | 0.0% |
| Hispanic or Latino | 0 | 0.0% |
| Native / Alaskan | 0 | 0.0% |
| White / Caucasian | 325 | 100.0% |
| Two or more Races | 0 | 0.0% |
| Some other Race | 0 | 0.0% |
| Total | 325 | 100.0% |
Ancestry in Grahamtown
The most populous ancestries reported in Grahamtown are German (93 | 28.6%), British (51 | 15.7%), Welsh (26 | 8.0%), Irish (16 | 4.9%), and Polish (14 | 4.3%), together accounting for 61.5% of all Grahamtown residents.
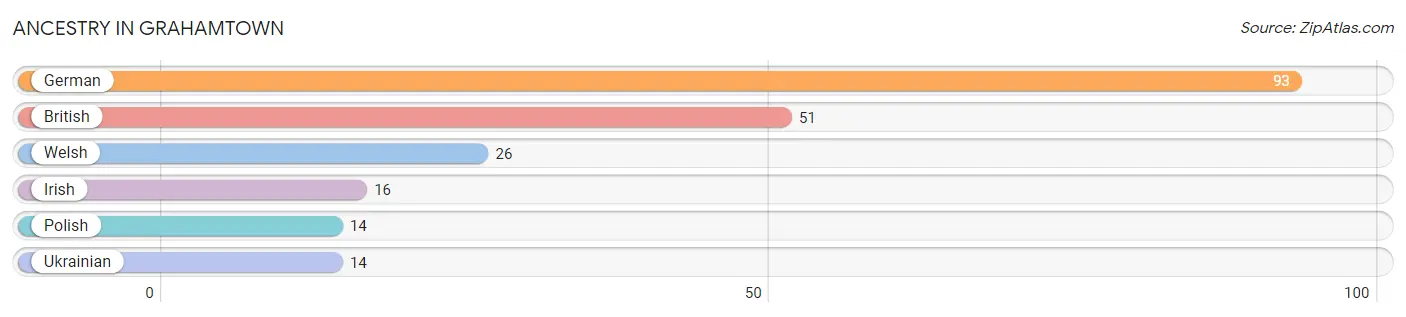
| Ancestry | # Population | % Population |
| British | 51 | 15.7% |
| German | 93 | 28.6% |
| Irish | 16 | 4.9% |
| Polish | 14 | 4.3% |
| Ukrainian | 14 | 4.3% |
| Welsh | 26 | 8.0% | View All 6 Rows |
Immigrants in Grahamtown

| Immigration Origin | # Population | % Population | View All 0 Rows |
Sex and Age in Grahamtown
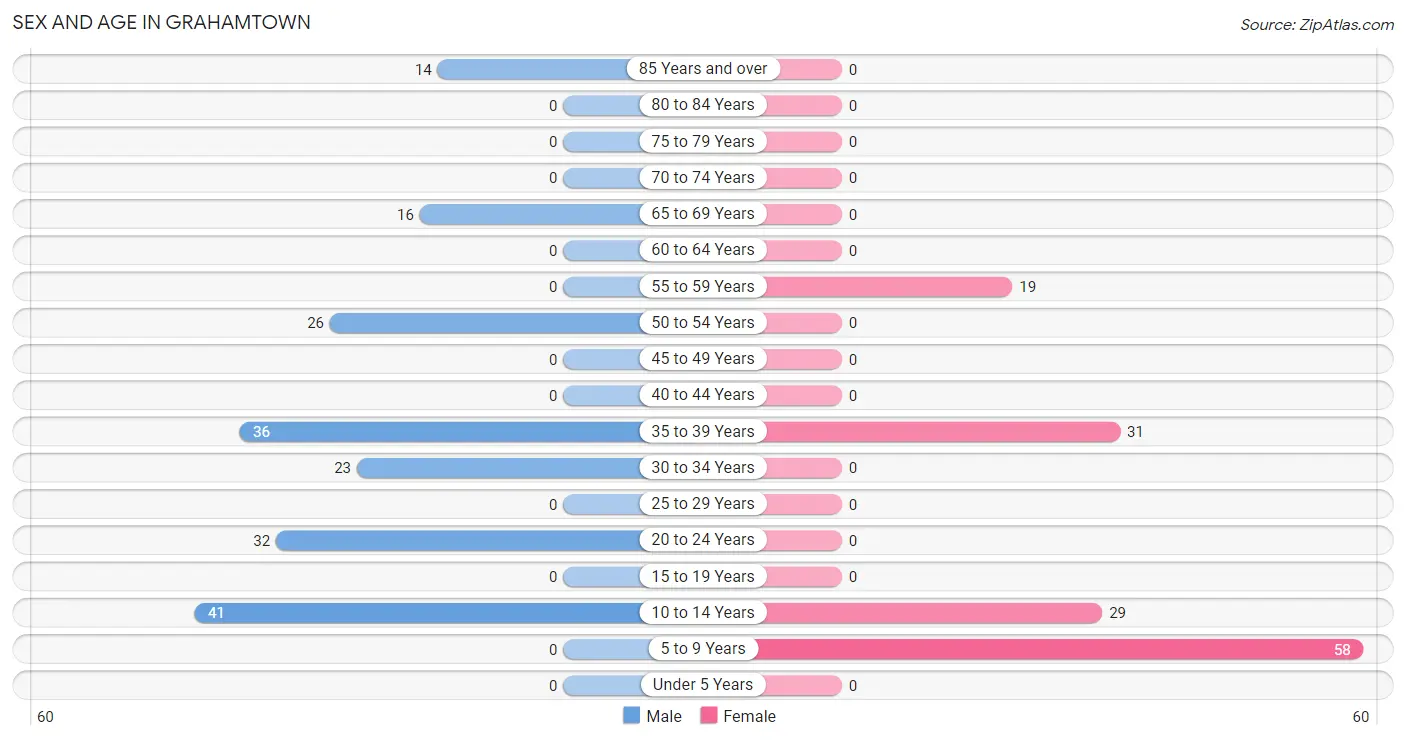
Sex and Age in Grahamtown
The most populous age groups in Grahamtown are 10 to 14 Years (41 | 21.8%) for men and 5 to 9 Years (58 | 42.3%) for women.
| Age Bracket | Male | Female |
| Under 5 Years | 0 (0.0%) | 0 (0.0%) |
| 5 to 9 Years | 0 (0.0%) | 58 (42.3%) |
| 10 to 14 Years | 41 (21.8%) | 29 (21.2%) |
| 15 to 19 Years | 0 (0.0%) | 0 (0.0%) |
| 20 to 24 Years | 32 (17.0%) | 0 (0.0%) |
| 25 to 29 Years | 0 (0.0%) | 0 (0.0%) |
| 30 to 34 Years | 23 (12.2%) | 0 (0.0%) |
| 35 to 39 Years | 36 (19.2%) | 31 (22.6%) |
| 40 to 44 Years | 0 (0.0%) | 0 (0.0%) |
| 45 to 49 Years | 0 (0.0%) | 0 (0.0%) |
| 50 to 54 Years | 26 (13.8%) | 0 (0.0%) |
| 55 to 59 Years | 0 (0.0%) | 19 (13.9%) |
| 60 to 64 Years | 0 (0.0%) | 0 (0.0%) |
| 65 to 69 Years | 16 (8.5%) | 0 (0.0%) |
| 70 to 74 Years | 0 (0.0%) | 0 (0.0%) |
| 75 to 79 Years | 0 (0.0%) | 0 (0.0%) |
| 80 to 84 Years | 0 (0.0%) | 0 (0.0%) |
| 85 Years and over | 14 (7.4%) | 0 (0.0%) |
| Total | 188 (100.0%) | 137 (100.0%) |
Families and Households in Grahamtown
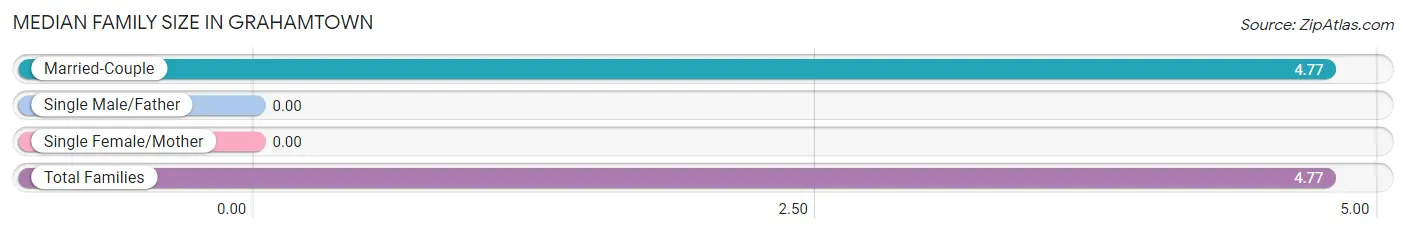
Median Family Size in Grahamtown
| Family Type | # Families | Family Size |
| Married-Couple | 57 (100.0%) | 4.77 |
| Single Male/Father | 0 (0.0%) | - |
| Single Female/Mother | 0 (0.0%) | - |
| Total Families | 57 (100.0%) | 4.77 |
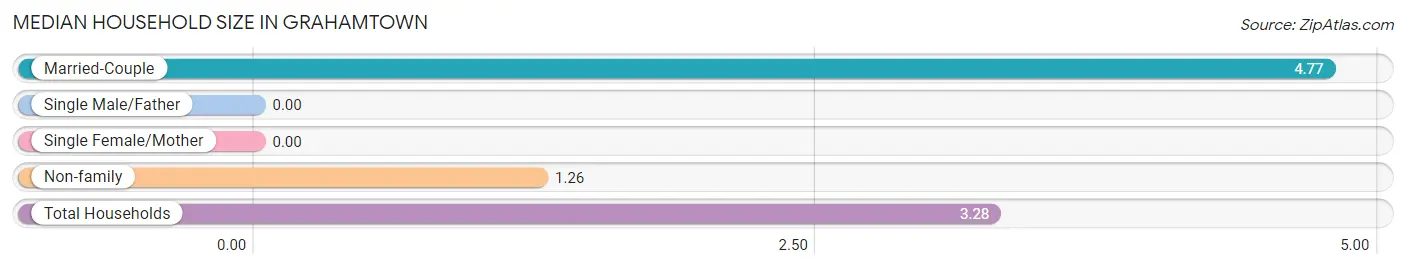
Median Household Size in Grahamtown
| Household Type | # Households | Household Size |
| Married-Couple | 57 (57.6%) | 4.77 |
| Single Male/Father | 0 (0.0%) | - |
| Single Female/Mother | 0 (0.0%) | - |
| Non-family | 42 (42.4%) | 1.26 |
| Total Households | 99 (100.0%) | 3.28 |
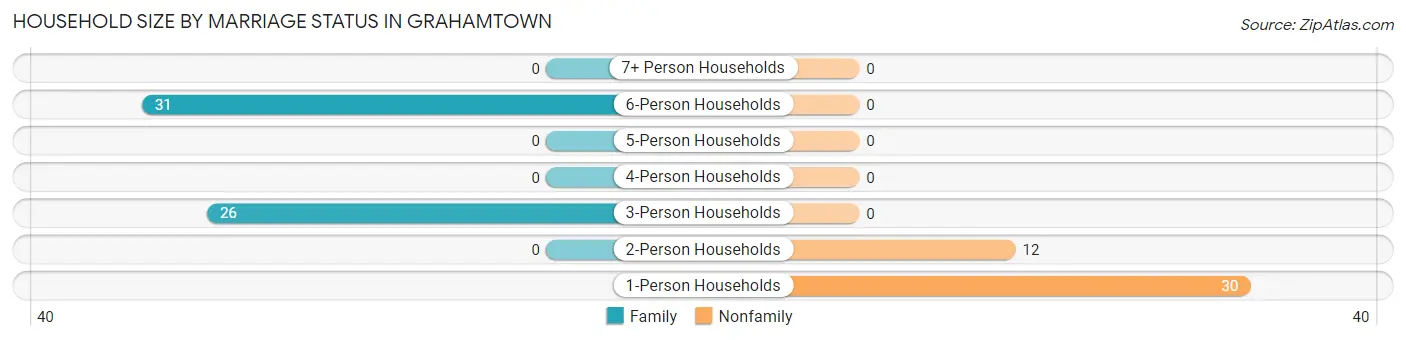
Household Size by Marriage Status in Grahamtown
Out of a total of 99 households in Grahamtown, 57 (57.6%) are family households, while 42 (42.4%) are nonfamily households. The most numerous type of family households are 6-person households, comprising 31, and the most common type of nonfamily households are 1-person households, comprising 30.
| Household Size | Family Households | Nonfamily Households |
| 1-Person Households | - | 30 (30.3%) |
| 2-Person Households | 0 (0.0%) | 12 (12.1%) |
| 3-Person Households | 26 (26.3%) | 0 (0.0%) |
| 4-Person Households | 0 (0.0%) | 0 (0.0%) |
| 5-Person Households | 0 (0.0%) | 0 (0.0%) |
| 6-Person Households | 31 (31.3%) | 0 (0.0%) |
| 7+ Person Households | 0 (0.0%) | 0 (0.0%) |
| Total | 57 (57.6%) | 42 (42.4%) |
Female Fertility in Grahamtown
Fertility by Age in Grahamtown
| Age Bracket | Women with Births | Births / 1,000 Women |
| 15 to 19 years | 0 (0.0%) | 0.0 |
| 20 to 34 years | 0 (0.0%) | 0.0 |
| 35 to 50 years | 0 (0.0%) | 0.0 |
| Total | 0 (0.0%) | 0.0 |
Fertility by Age by Marriage Status in Grahamtown
| Age Bracket | Married | Unmarried |
| 15 to 19 years | 0 (0.0%) | 0 (0.0%) |
| 20 to 34 years | 0 (0.0%) | 0 (0.0%) |
| 35 to 50 years | 0 (0.0%) | 0 (0.0%) |
| Total | 0 (0.0%) | 0 (0.0%) |
Fertility by Education in Grahamtown
| Educational Attainment | Women with Births | Births / 1,000 Women |
| Less than High School | 0 (0.0%) | 0.0 |
| High School Diploma | 0 (0.0%) | 0.0 |
| College or Associate's Degree | 0 (0.0%) | 0.0 |
| Bachelor's Degree | 0 (0.0%) | 0.0 |
| Graduate Degree | 0 (0.0%) | 0.0 |
| Total | 0 (0.0%) | 0.0 |
Fertility by Education by Marriage Status in Grahamtown
| Educational Attainment | Married | Unmarried |
| Less than High School | 0 (0.0%) | 0 (0.0%) |
| High School Diploma | 0 (0.0%) | 0 (0.0%) |
| College or Associate's Degree | 0 (0.0%) | 0 (0.0%) |
| Bachelor's Degree | 0 (0.0%) | 0 (0.0%) |
| Graduate Degree | 0 (0.0%) | 0 (0.0%) |
| Total | 0 (0.0%) | 0 (0.0%) |
Employment Characteristics in Grahamtown
Employment by Class of Employer in Grahamtown
Among the 121 employed individuals in Grahamtown, state government employees (78 | 64.5%), and private company employees (43 | 35.5%) make up the most common classes of employment.
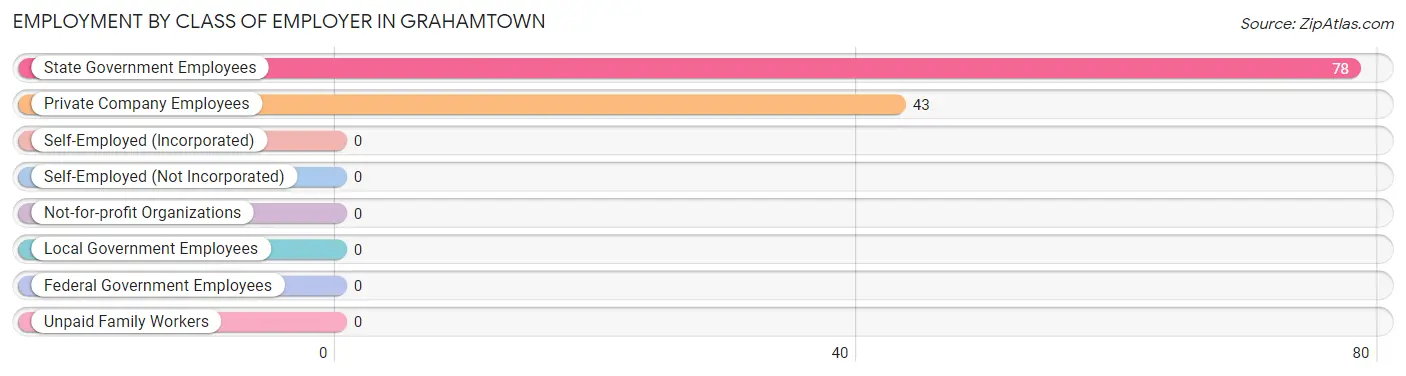
| Employer Class | # Employees | % Employees |
| Private Company Employees | 43 | 35.5% |
| Self-Employed (Incorporated) | 0 | 0.0% |
| Self-Employed (Not Incorporated) | 0 | 0.0% |
| Not-for-profit Organizations | 0 | 0.0% |
| Local Government Employees | 0 | 0.0% |
| State Government Employees | 78 | 64.5% |
| Federal Government Employees | 0 | 0.0% |
| Unpaid Family Workers | 0 | 0.0% |
| Total | 121 | 100.0% |
Employment Status by Age in Grahamtown
According to the labor force statistics for Grahamtown, out of the total population over 16 years of age (197), 71.1% or 140 individuals are in the labor force, with 13.6% or 19 of them unemployed. The age group with the highest labor force participation rate is 35 to 44 years, with 100.0% or 67 individuals in the labor force. Within the labor force, the 55 to 59 years age range has the highest percentage of unemployed individuals, with 100.0% or 19 of them being unemployed.
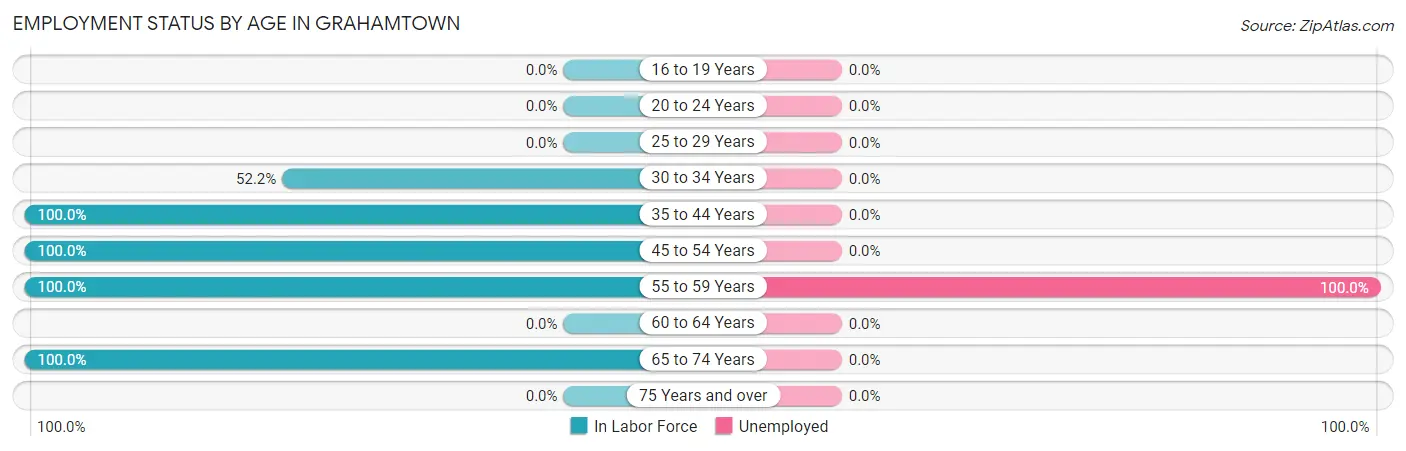
| Age Bracket | In Labor Force | Unemployed |
| 16 to 19 Years | 0 (0.0%) | 0 (0.0%) |
| 20 to 24 Years | 0 (0.0%) | 0 (0.0%) |
| 25 to 29 Years | 0 (0.0%) | 0 (0.0%) |
| 30 to 34 Years | 12 (52.2%) | 0 (0.0%) |
| 35 to 44 Years | 67 (100.0%) | 0 (0.0%) |
| 45 to 54 Years | 26 (100.0%) | 0 (0.0%) |
| 55 to 59 Years | 19 (100.0%) | 19 (100.0%) |
| 60 to 64 Years | 0 (0.0%) | 0 (0.0%) |
| 65 to 74 Years | 16 (100.0%) | 0 (0.0%) |
| 75 Years and over | 0 (0.0%) | 0 (0.0%) |
| Total | 140 (71.1%) | 19 (13.6%) |
Employment Status by Educational Attainment in Grahamtown
According to labor force statistics for Grahamtown, 91.9% of individuals (124) out of the total population between 25 and 64 years of age (135) are in the labor force, with 15.3% or 19 of them being unemployed. The group with the highest labor force participation rate are those with the educational attainment of high school diploma, with 100.0% or 67 individuals in the labor force. Within the labor force, individuals with bachelor's degree or higher education have the highest percentage of unemployment, with 33.3% or 19 of them being unemployed.
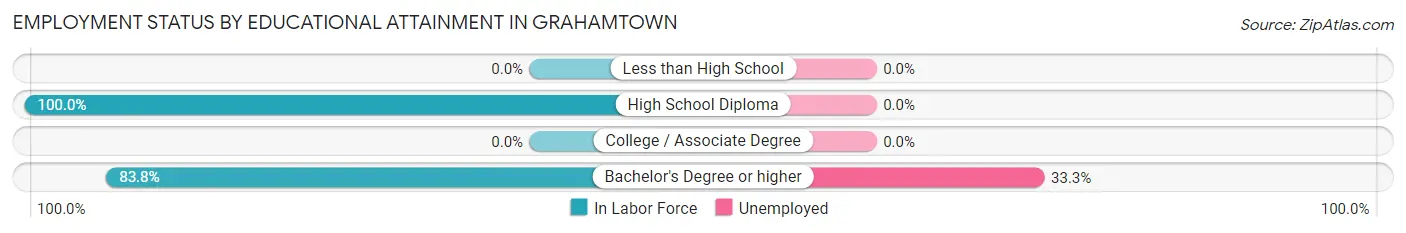
| Educational Attainment | In Labor Force | Unemployed |
| Less than High School | 0 (0.0%) | 0 (0.0%) |
| High School Diploma | 67 (100.0%) | 0 (0.0%) |
| College / Associate Degree | 0 (0.0%) | 0 (0.0%) |
| Bachelor's Degree or higher | 57 (83.8%) | 23 (33.3%) |
| Total | 124 (91.9%) | 21 (15.3%) |
Employment Occupations by Sex in Grahamtown
Management, Business, Science and Arts Occupations
The most common Management, Business, Science and Arts occupations in Grahamtown are Computers, Engineering & Science (26 | 21.5%), Life, Physical & Social Science (26 | 21.5%), Community & Social Service (16 | 13.2%), and Education Instruction & Library (16 | 13.2%).
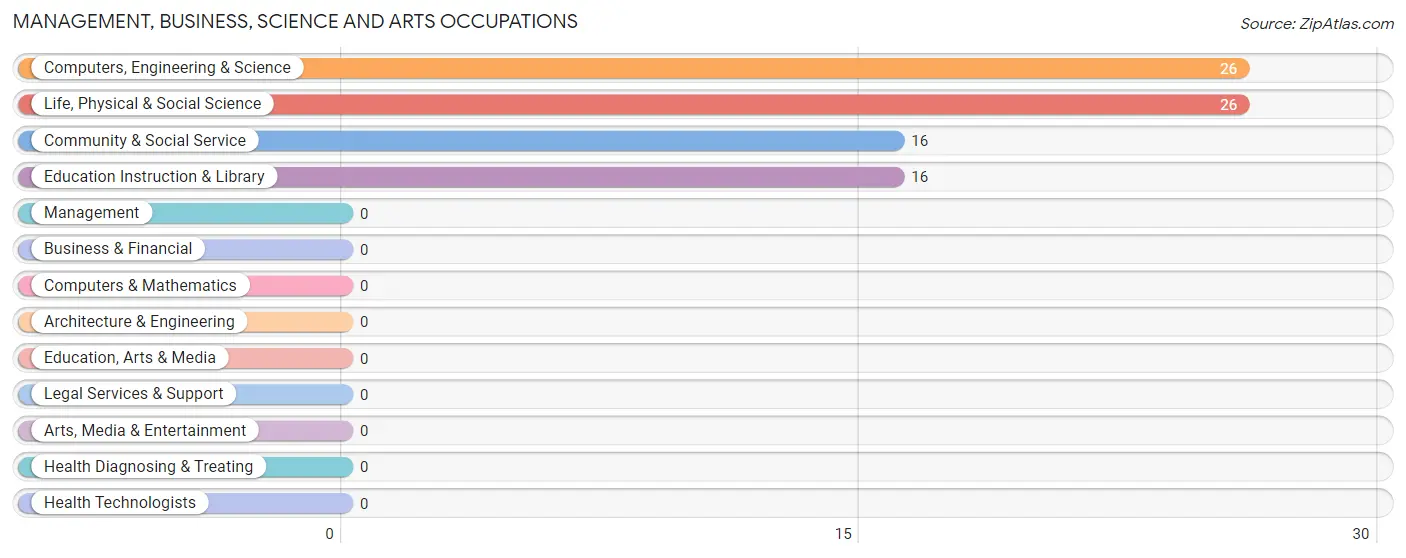
Management, Business, Science and Arts Occupations by Sex
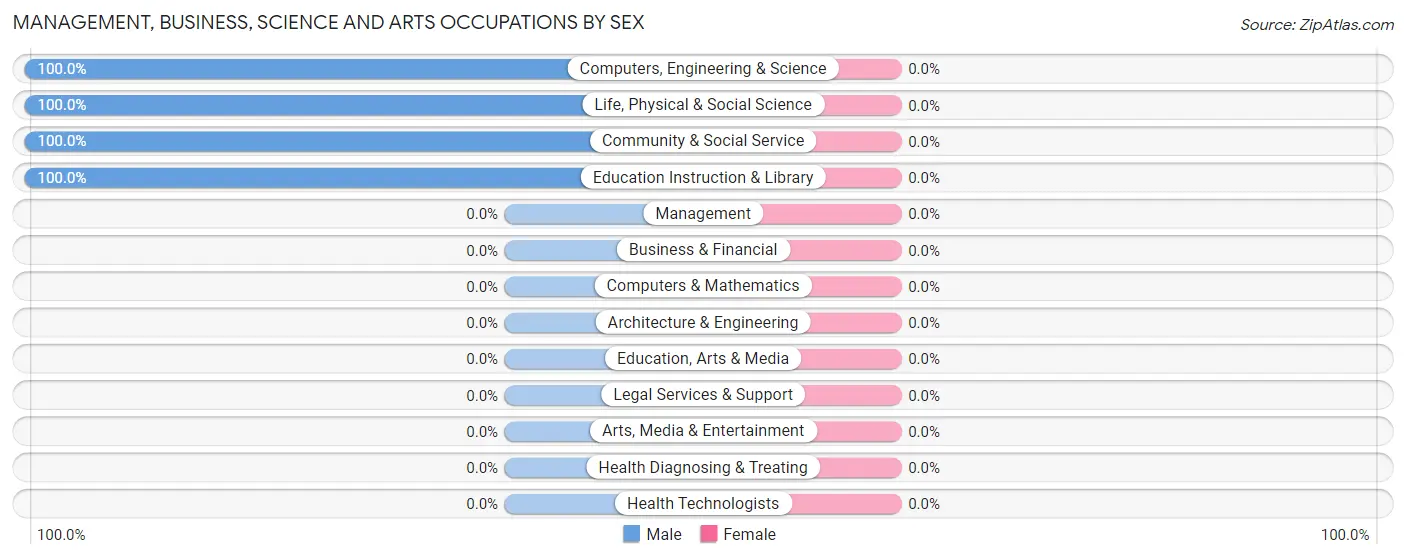
| Occupation | Male | Female |
| Management | 0 (0.0%) | 0 (0.0%) |
| Business & Financial | 0 (0.0%) | 0 (0.0%) |
| Computers, Engineering & Science | 26 (100.0%) | 0 (0.0%) |
| Computers & Mathematics | 0 (0.0%) | 0 (0.0%) |
| Architecture & Engineering | 0 (0.0%) | 0 (0.0%) |
| Life, Physical & Social Science | 26 (100.0%) | 0 (0.0%) |
| Community & Social Service | 16 (100.0%) | 0 (0.0%) |
| Education, Arts & Media | 0 (0.0%) | 0 (0.0%) |
| Legal Services & Support | 0 (0.0%) | 0 (0.0%) |
| Education Instruction & Library | 16 (100.0%) | 0 (0.0%) |
| Arts, Media & Entertainment | 0 (0.0%) | 0 (0.0%) |
| Health Diagnosing & Treating | 0 (0.0%) | 0 (0.0%) |
| Health Technologists | 0 (0.0%) | 0 (0.0%) |
| Total (Category) | 42 (100.0%) | 0 (0.0%) |
| Total (Overall) | 90 (74.4%) | 31 (25.6%) |
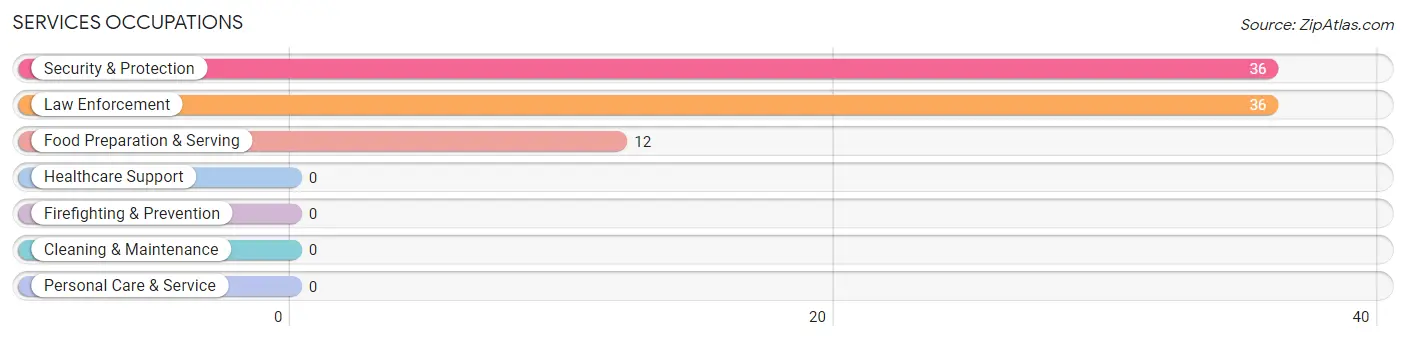
Services Occupations
The most common Services occupations in Grahamtown are Security & Protection (36 | 29.7%), Law Enforcement (36 | 29.7%), and Food Preparation & Serving (12 | 9.9%).
Services Occupations by Sex
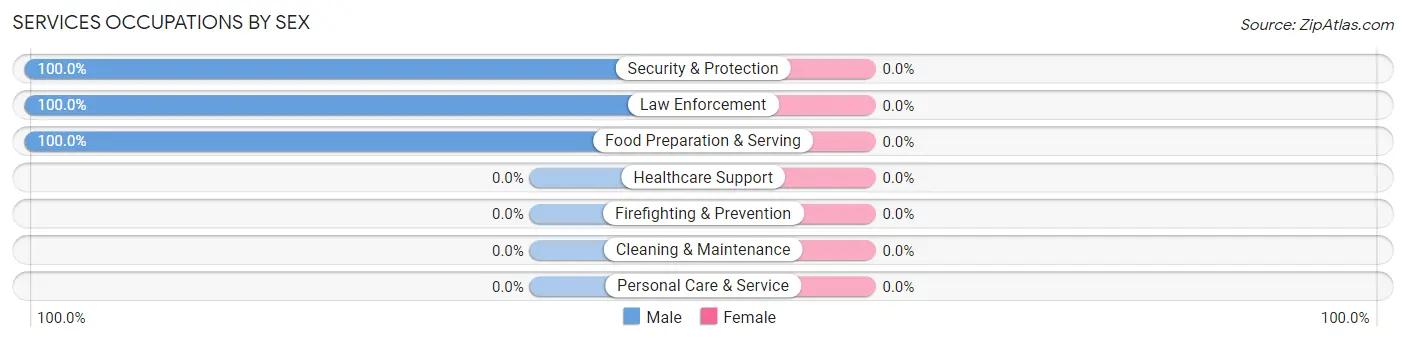
| Occupation | Male | Female |
| Healthcare Support | 0 (0.0%) | 0 (0.0%) |
| Security & Protection | 36 (100.0%) | 0 (0.0%) |
| Firefighting & Prevention | 0 (0.0%) | 0 (0.0%) |
| Law Enforcement | 36 (100.0%) | 0 (0.0%) |
| Food Preparation & Serving | 12 (100.0%) | 0 (0.0%) |
| Cleaning & Maintenance | 0 (0.0%) | 0 (0.0%) |
| Personal Care & Service | 0 (0.0%) | 0 (0.0%) |
| Total (Category) | 48 (100.0%) | 0 (0.0%) |
| Total (Overall) | 90 (74.4%) | 31 (25.6%) |
Sales and Office Occupations
The most common Sales and Office occupations in Grahamtown are , and Sales & Related (31 | 25.6%).
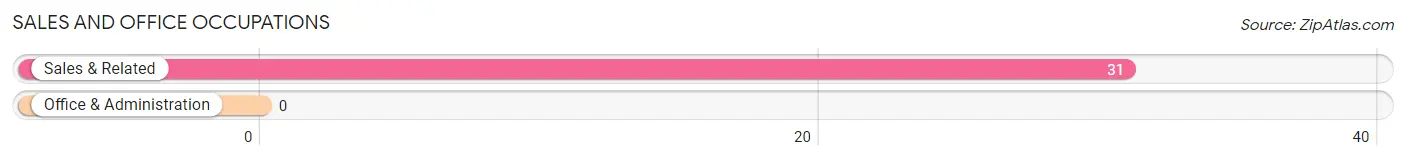
Sales and Office Occupations by Sex
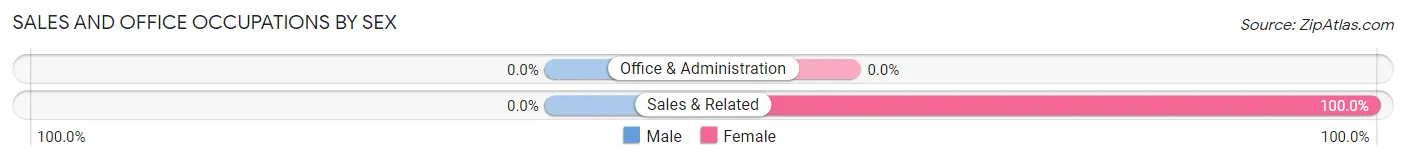
| Occupation | Male | Female |
| Sales & Related | 0 (0.0%) | 31 (100.0%) |
| Office & Administration | 0 (0.0%) | 0 (0.0%) |
| Total (Category) | 0 (0.0%) | 31 (100.0%) |
| Total (Overall) | 90 (74.4%) | 31 (25.6%) |
Natural Resources, Construction and Maintenance Occupations
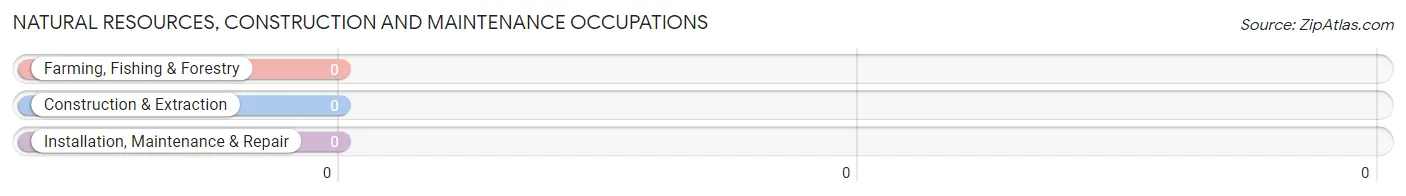
Natural Resources, Construction and Maintenance Occupations by Sex
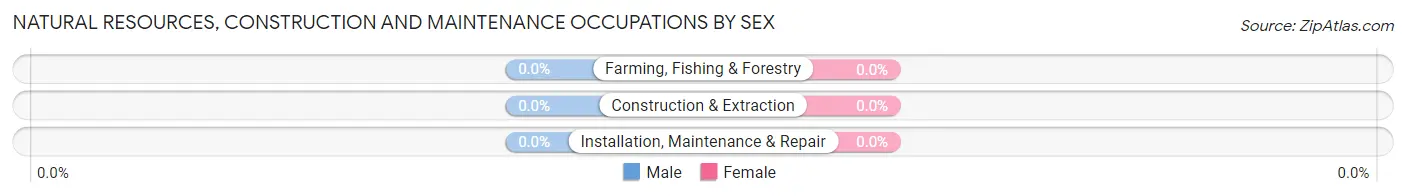
| Occupation | Male | Female |
| Farming, Fishing & Forestry | 0 (0.0%) | 0 (0.0%) |
| Construction & Extraction | 0 (0.0%) | 0 (0.0%) |
| Installation, Maintenance & Repair | 0 (0.0%) | 0 (0.0%) |
| Total (Category) | 0 (0.0%) | 0 (0.0%) |
| Total (Overall) | 90 (74.4%) | 31 (25.6%) |
Production, Transportation and Moving Occupations
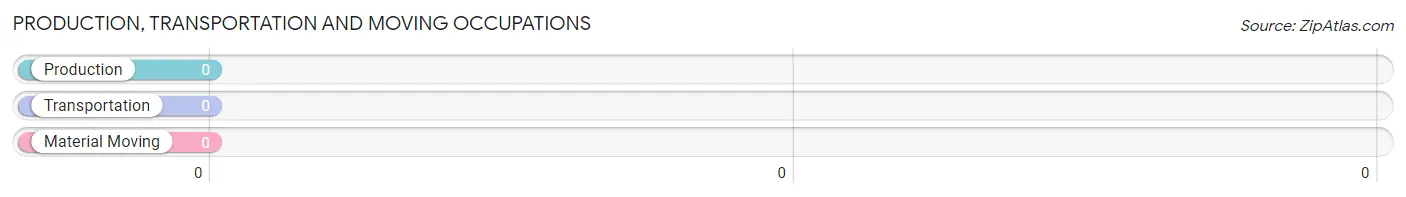
Production, Transportation and Moving Occupations by Sex
| Occupation | Male | Female |
| Production | 0 (0.0%) | 0 (0.0%) |
| Transportation | 0 (0.0%) | 0 (0.0%) |
| Material Moving | 0 (0.0%) | 0 (0.0%) |
| Total (Category) | 0 (0.0%) | 0 (0.0%) |
| Total (Overall) | 90 (74.4%) | 31 (25.6%) |
Employment Industries by Sex in Grahamtown
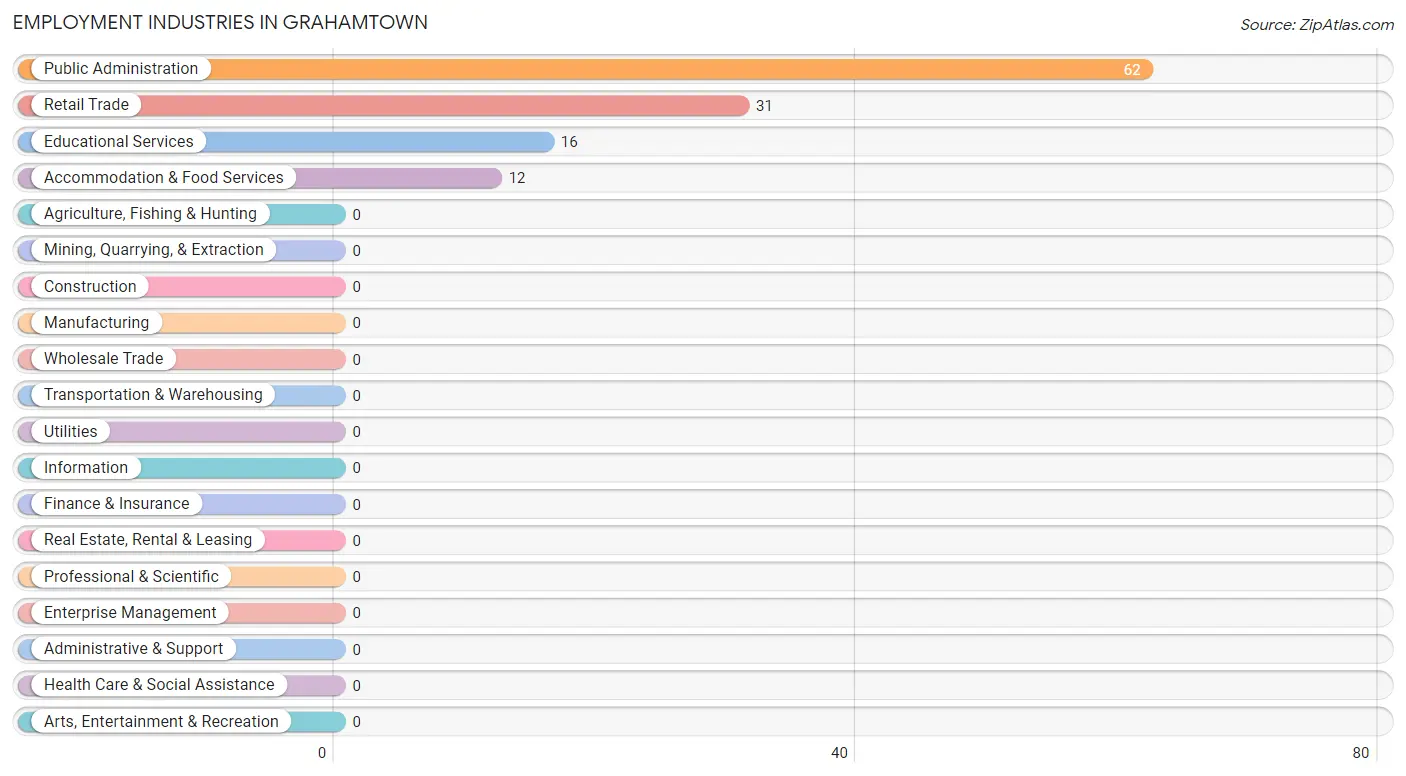
Employment Industries in Grahamtown
The major employment industries in Grahamtown include Public Administration (62 | 51.2%), Retail Trade (31 | 25.6%), Educational Services (16 | 13.2%), and Accommodation & Food Services (12 | 9.9%).
Employment Industries by Sex in Grahamtown
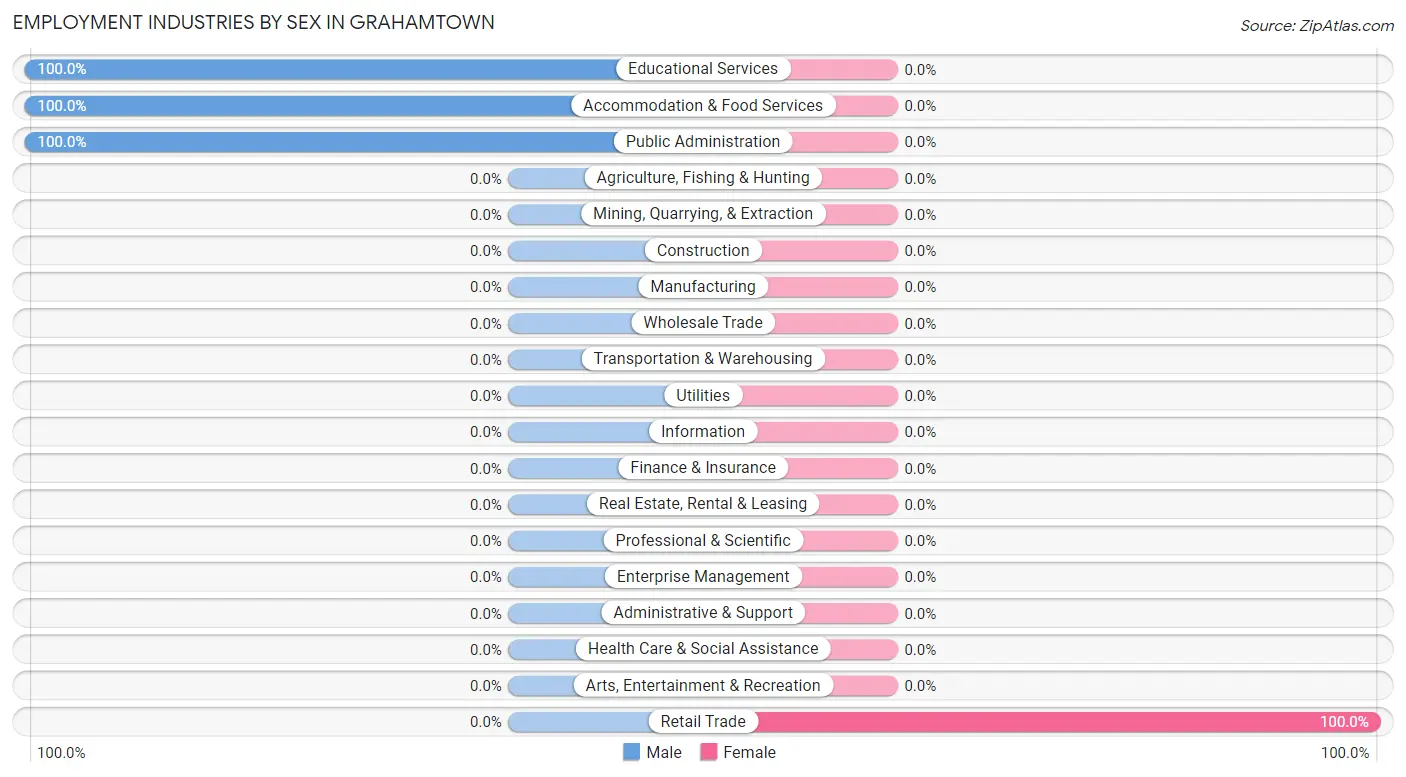
| Industry | Male | Female |
| Agriculture, Fishing & Hunting | 0 (0.0%) | 0 (0.0%) |
| Mining, Quarrying, & Extraction | 0 (0.0%) | 0 (0.0%) |
| Construction | 0 (0.0%) | 0 (0.0%) |
| Manufacturing | 0 (0.0%) | 0 (0.0%) |
| Wholesale Trade | 0 (0.0%) | 0 (0.0%) |
| Retail Trade | 0 (0.0%) | 31 (100.0%) |
| Transportation & Warehousing | 0 (0.0%) | 0 (0.0%) |
| Utilities | 0 (0.0%) | 0 (0.0%) |
| Information | 0 (0.0%) | 0 (0.0%) |
| Finance & Insurance | 0 (0.0%) | 0 (0.0%) |
| Real Estate, Rental & Leasing | 0 (0.0%) | 0 (0.0%) |
| Professional & Scientific | 0 (0.0%) | 0 (0.0%) |
| Enterprise Management | 0 (0.0%) | 0 (0.0%) |
| Administrative & Support | 0 (0.0%) | 0 (0.0%) |
| Educational Services | 16 (100.0%) | 0 (0.0%) |
| Health Care & Social Assistance | 0 (0.0%) | 0 (0.0%) |
| Arts, Entertainment & Recreation | 0 (0.0%) | 0 (0.0%) |
| Accommodation & Food Services | 12 (100.0%) | 0 (0.0%) |
| Public Administration | 62 (100.0%) | 0 (0.0%) |
| Total | 90 (74.4%) | 31 (25.6%) |
Education in Grahamtown
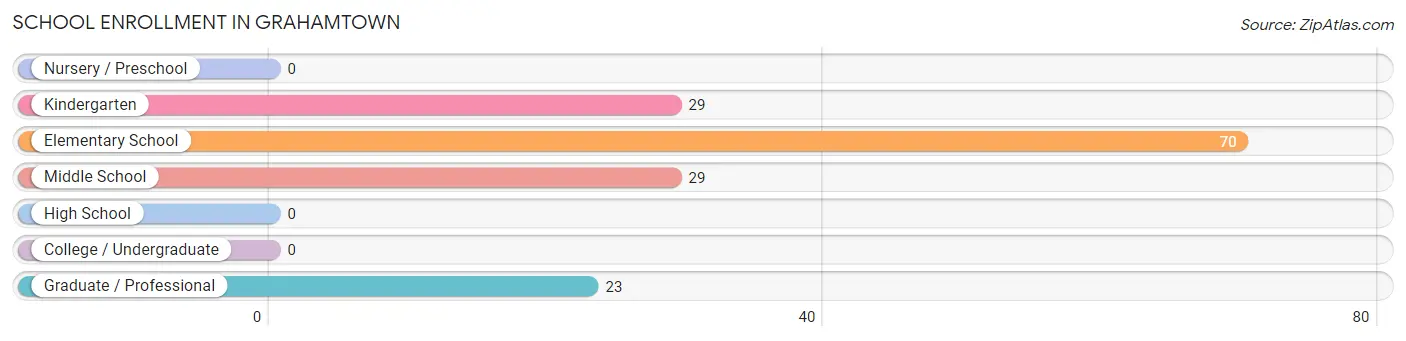
School Enrollment in Grahamtown
The most common levels of schooling among the 151 students in Grahamtown are elementary school (70 | 46.4%), kindergarten (29 | 19.2%), and middle school (29 | 19.2%).
| School Level | # Students | % Students |
| Nursery / Preschool | 0 | 0.0% |
| Kindergarten | 29 | 19.2% |
| Elementary School | 70 | 46.4% |
| Middle School | 29 | 19.2% |
| High School | 0 | 0.0% |
| College / Undergraduate | 0 | 0.0% |
| Graduate / Professional | 23 | 15.2% |
| Total | 151 | 100.0% |
School Enrollment by Age by Funding Source in Grahamtown
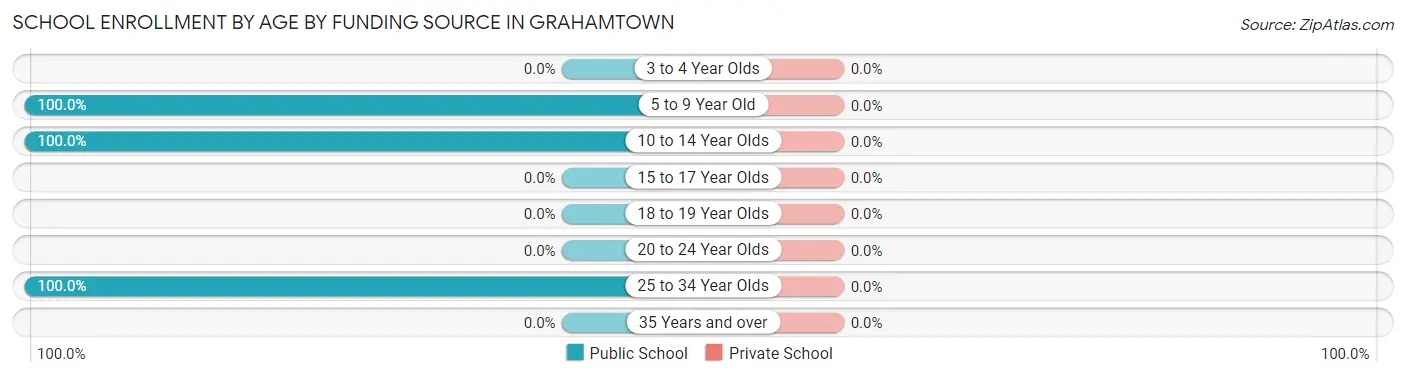
| Age Bracket | Public School | Private School |
| 3 to 4 Year Olds | 0 (0.0%) | 0 (0.0%) |
| 5 to 9 Year Old | 58 (100.0%) | 0 (0.0%) |
| 10 to 14 Year Olds | 70 (100.0%) | 0 (0.0%) |
| 15 to 17 Year Olds | 0 (0.0%) | 0 (0.0%) |
| 18 to 19 Year Olds | 0 (0.0%) | 0 (0.0%) |
| 20 to 24 Year Olds | 0 (0.0%) | 0 (0.0%) |
| 25 to 34 Year Olds | 23 (100.0%) | 0 (0.0%) |
| 35 Years and over | 0 (0.0%) | 0 (0.0%) |
| Total | 151 (100.0%) | 0 (0.0%) |
Educational Attainment by Field of Study in Grahamtown
Bio, nature & agricultural (26 | 26.0%), education (19 | 19.0%), physical & health sciences (16 | 16.0%), science & technology (16 | 16.0%), and business (12 | 12.0%) are the most common fields of study among 100 individuals in Grahamtown who have obtained a bachelor's degree or higher.
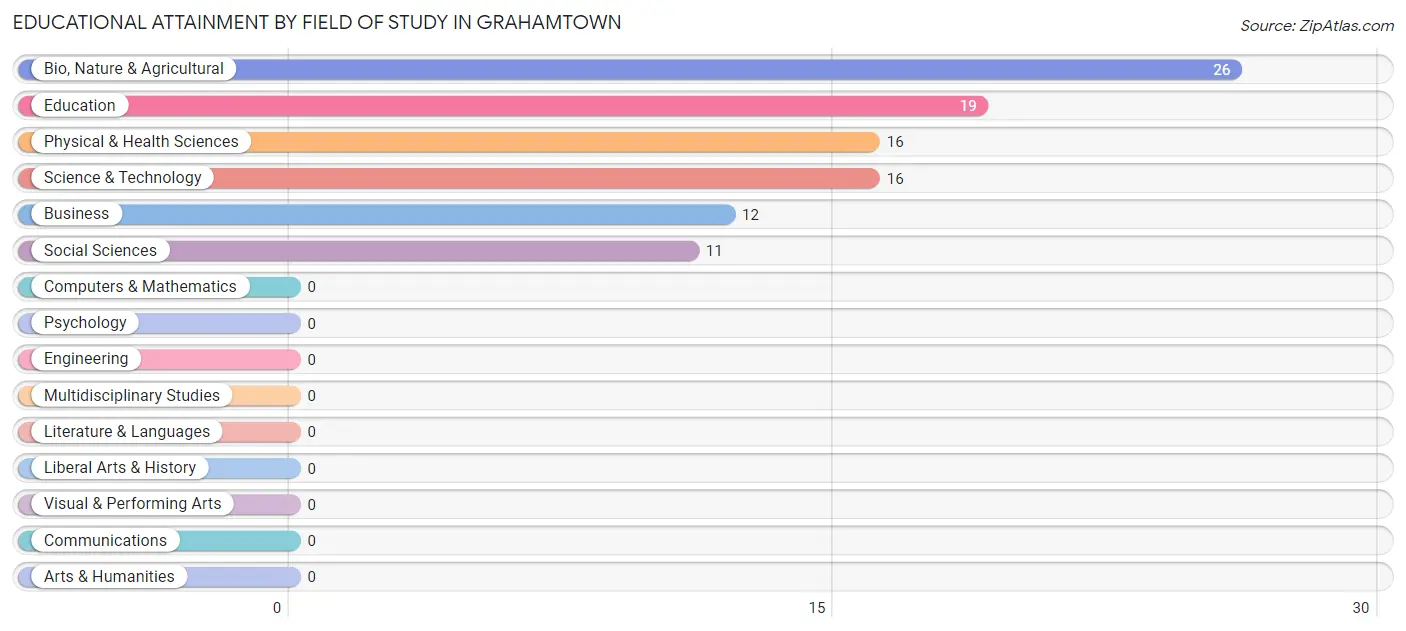
| Field of Study | # Graduates | % Graduates |
| Computers & Mathematics | 0 | 0.0% |
| Bio, Nature & Agricultural | 26 | 26.0% |
| Physical & Health Sciences | 16 | 16.0% |
| Psychology | 0 | 0.0% |
| Social Sciences | 11 | 11.0% |
| Engineering | 0 | 0.0% |
| Multidisciplinary Studies | 0 | 0.0% |
| Science & Technology | 16 | 16.0% |
| Business | 12 | 12.0% |
| Education | 19 | 19.0% |
| Literature & Languages | 0 | 0.0% |
| Liberal Arts & History | 0 | 0.0% |
| Visual & Performing Arts | 0 | 0.0% |
| Communications | 0 | 0.0% |
| Arts & Humanities | 0 | 0.0% |
| Total | 100 | 100.0% |
Transportation & Commute in Grahamtown
Vehicle Availability by Sex in Grahamtown
The most prevalent vehicle ownership categories in Grahamtown are males with 2 vehicles (38, accounting for 42.2%) and females with 2 vehicles (0, making up 122.6%).
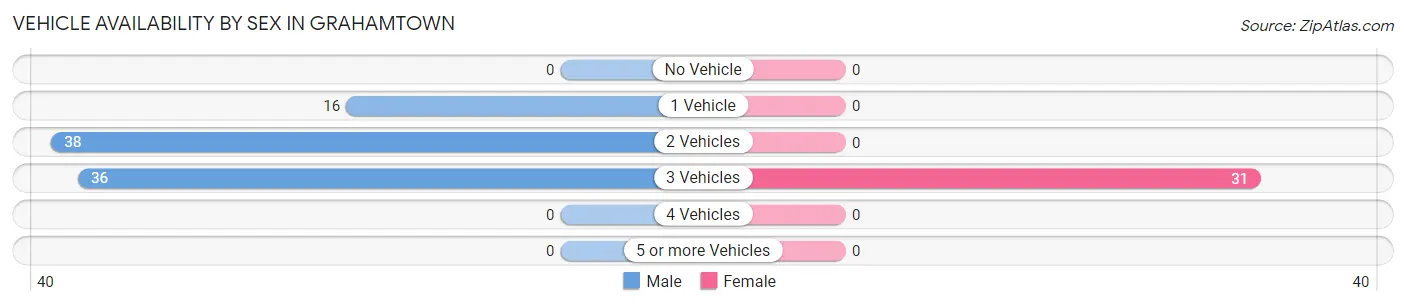
| Vehicles Available | Male | Female |
| No Vehicle | 0 (0.0%) | 0 (0.0%) |
| 1 Vehicle | 16 (17.8%) | 0 (0.0%) |
| 2 Vehicles | 38 (42.2%) | 0 (0.0%) |
| 3 Vehicles | 36 (40.0%) | 31 (100.0%) |
| 4 Vehicles | 0 (0.0%) | 0 (0.0%) |
| 5 or more Vehicles | 0 (0.0%) | 0 (0.0%) |
| Total | 90 (100.0%) | 31 (100.0%) |
Commute Time in Grahamtown
The most frequently occuring commute durations in Grahamtown are 5 to 9 minutes (42 commuters, 34.7%), 15 to 19 minutes (36 commuters, 29.7%), and less than 5 minutes (31 commuters, 25.6%).
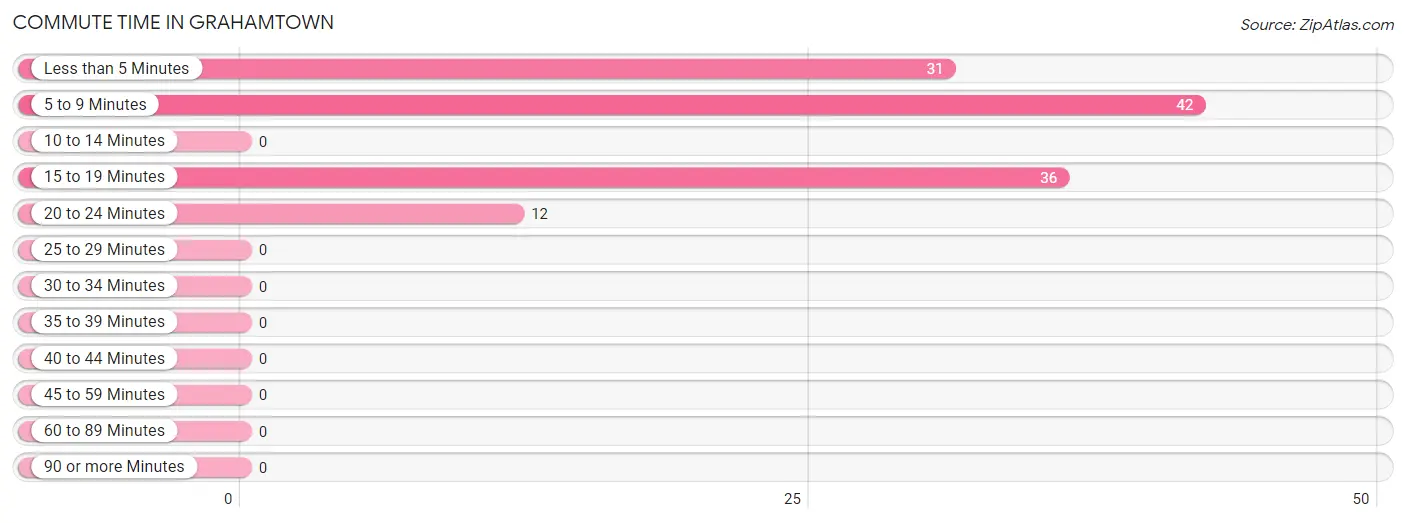
| Commute Time | # Commuters | % Commuters |
| Less than 5 Minutes | 31 | 25.6% |
| 5 to 9 Minutes | 42 | 34.7% |
| 10 to 14 Minutes | 0 | 0.0% |
| 15 to 19 Minutes | 36 | 29.7% |
| 20 to 24 Minutes | 12 | 9.9% |
| 25 to 29 Minutes | 0 | 0.0% |
| 30 to 34 Minutes | 0 | 0.0% |
| 35 to 39 Minutes | 0 | 0.0% |
| 40 to 44 Minutes | 0 | 0.0% |
| 45 to 59 Minutes | 0 | 0.0% |
| 60 to 89 Minutes | 0 | 0.0% |
| 90 or more Minutes | 0 | 0.0% |
Commute Time by Sex in Grahamtown
The most common commute times in Grahamtown are 5 to 9 minutes (42 commuters, 46.7%) for males and less than 5 minutes (31 commuters, 100.0%) for females.
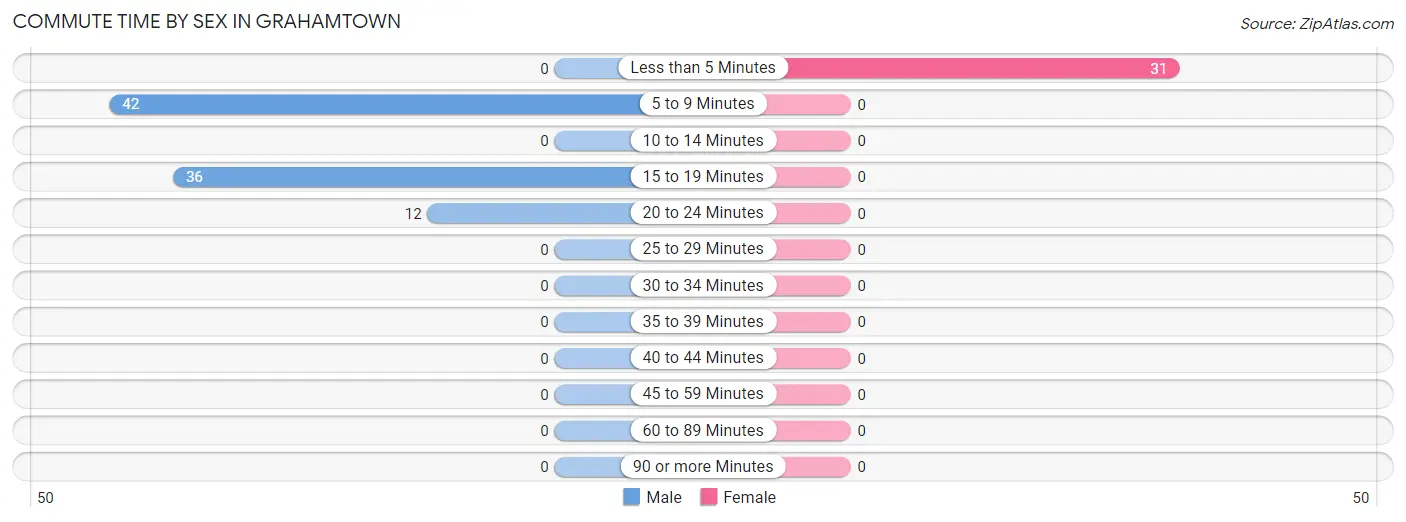
| Commute Time | Male | Female |
| Less than 5 Minutes | 0 (0.0%) | 31 (100.0%) |
| 5 to 9 Minutes | 42 (46.7%) | 0 (0.0%) |
| 10 to 14 Minutes | 0 (0.0%) | 0 (0.0%) |
| 15 to 19 Minutes | 36 (40.0%) | 0 (0.0%) |
| 20 to 24 Minutes | 12 (13.3%) | 0 (0.0%) |
| 25 to 29 Minutes | 0 (0.0%) | 0 (0.0%) |
| 30 to 34 Minutes | 0 (0.0%) | 0 (0.0%) |
| 35 to 39 Minutes | 0 (0.0%) | 0 (0.0%) |
| 40 to 44 Minutes | 0 (0.0%) | 0 (0.0%) |
| 45 to 59 Minutes | 0 (0.0%) | 0 (0.0%) |
| 60 to 89 Minutes | 0 (0.0%) | 0 (0.0%) |
| 90 or more Minutes | 0 (0.0%) | 0 (0.0%) |
Time of Departure to Work by Sex in Grahamtown
The most frequent times of departure to work in Grahamtown are 12:00 PM to 3:59 PM (48, 53.3%) for males and 9:00 AM to 9:59 AM (31, 100.0%) for females.
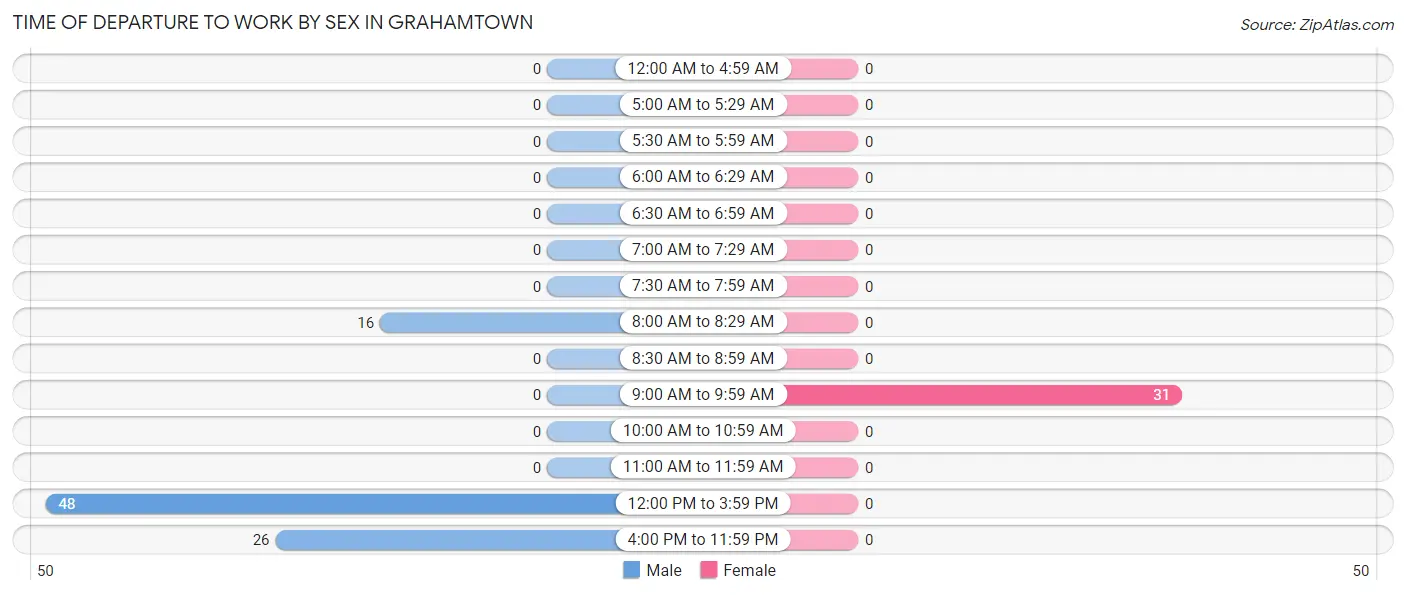
| Time of Departure | Male | Female |
| 12:00 AM to 4:59 AM | 0 (0.0%) | 0 (0.0%) |
| 5:00 AM to 5:29 AM | 0 (0.0%) | 0 (0.0%) |
| 5:30 AM to 5:59 AM | 0 (0.0%) | 0 (0.0%) |
| 6:00 AM to 6:29 AM | 0 (0.0%) | 0 (0.0%) |
| 6:30 AM to 6:59 AM | 0 (0.0%) | 0 (0.0%) |
| 7:00 AM to 7:29 AM | 0 (0.0%) | 0 (0.0%) |
| 7:30 AM to 7:59 AM | 0 (0.0%) | 0 (0.0%) |
| 8:00 AM to 8:29 AM | 16 (17.8%) | 0 (0.0%) |
| 8:30 AM to 8:59 AM | 0 (0.0%) | 0 (0.0%) |
| 9:00 AM to 9:59 AM | 0 (0.0%) | 31 (100.0%) |
| 10:00 AM to 10:59 AM | 0 (0.0%) | 0 (0.0%) |
| 11:00 AM to 11:59 AM | 0 (0.0%) | 0 (0.0%) |
| 12:00 PM to 3:59 PM | 48 (53.3%) | 0 (0.0%) |
| 4:00 PM to 11:59 PM | 26 (28.9%) | 0 (0.0%) |
| Total | 90 (100.0%) | 31 (100.0%) |
Housing Occupancy in Grahamtown
Occupancy by Ownership in Grahamtown
Of the total 99 dwellings in Grahamtown, owner-occupied units account for 99 (100.0%), while renter-occupied units make up 0 (0.0%).
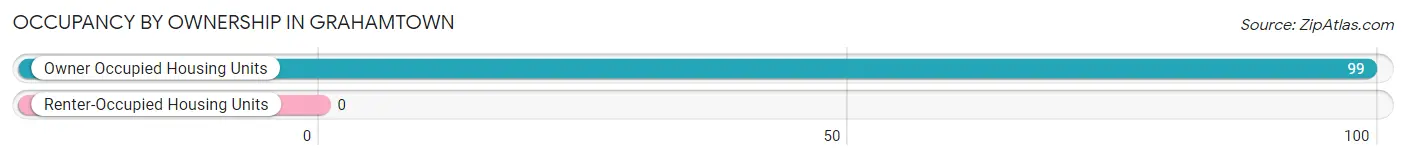
| Occupancy | # Housing Units | % Housing Units |
| Owner Occupied Housing Units | 99 | 100.0% |
| Renter-Occupied Housing Units | 0 | 0.0% |
| Total Occupied Housing Units | 99 | 100.0% |
Occupancy by Household Size in Grahamtown
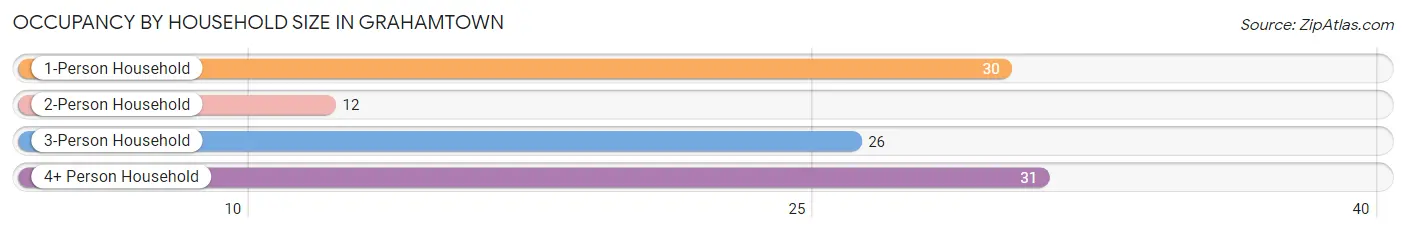
| Household Size | # Housing Units | % Housing Units |
| 1-Person Household | 30 | 30.3% |
| 2-Person Household | 12 | 12.1% |
| 3-Person Household | 26 | 26.3% |
| 4+ Person Household | 31 | 31.3% |
| Total Housing Units | 99 | 100.0% |
Occupancy by Ownership by Household Size in Grahamtown
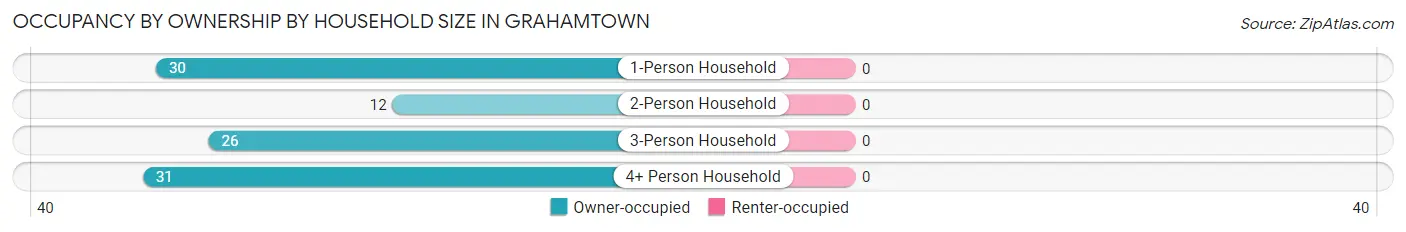
| Household Size | Owner-occupied | Renter-occupied |
| 1-Person Household | 30 (100.0%) | 0 (0.0%) |
| 2-Person Household | 12 (100.0%) | 0 (0.0%) |
| 3-Person Household | 26 (100.0%) | 0 (0.0%) |
| 4+ Person Household | 31 (100.0%) | 0 (0.0%) |
| Total Housing Units | 99 (100.0%) | 0 (0.0%) |
Occupancy by Educational Attainment in Grahamtown
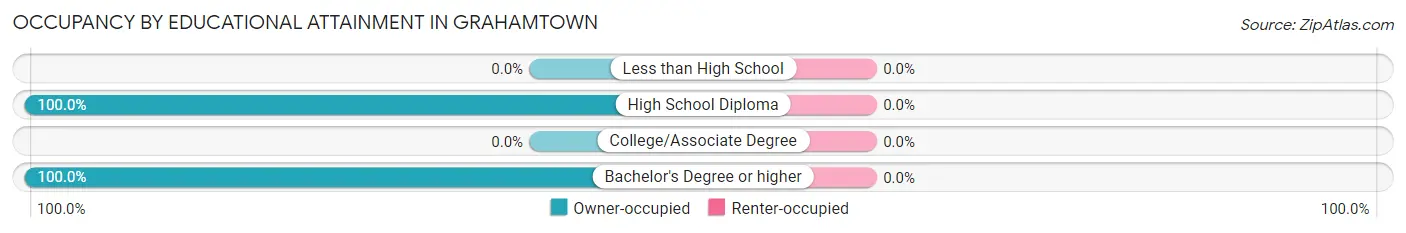
| Household Size | Owner-occupied | Renter-occupied |
| Less than High School | 0 (0.0%) | 0 (0.0%) |
| High School Diploma | 45 (100.0%) | 0 (0.0%) |
| College/Associate Degree | 0 (0.0%) | 0 (0.0%) |
| Bachelor's Degree or higher | 54 (100.0%) | 0 (0.0%) |
Occupancy by Age of Householder in Grahamtown
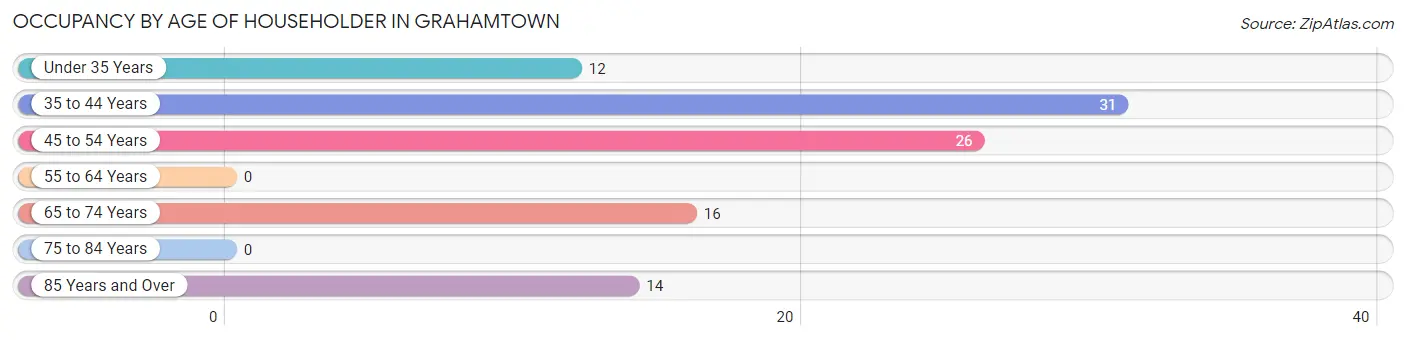
| Age Bracket | # Households | % Households |
| Under 35 Years | 12 | 12.1% |
| 35 to 44 Years | 31 | 31.3% |
| 45 to 54 Years | 26 | 26.3% |
| 55 to 64 Years | 0 | 0.0% |
| 65 to 74 Years | 16 | 16.2% |
| 75 to 84 Years | 0 | 0.0% |
| 85 Years and Over | 14 | 14.1% |
| Total | 99 | 100.0% |
Housing Finances in Grahamtown
Median Income by Occupancy in Grahamtown
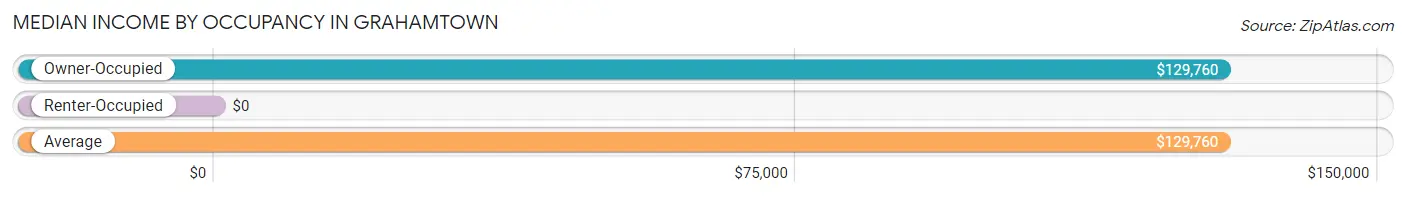
| Occupancy Type | # Households | Median Income |
| Owner-Occupied | 99 (100.0%) | $129,760 |
| Renter-Occupied | 0 (0.0%) | $0 |
| Average | 99 (100.0%) | $129,760 |
Occupancy by Householder Income Bracket in Grahamtown
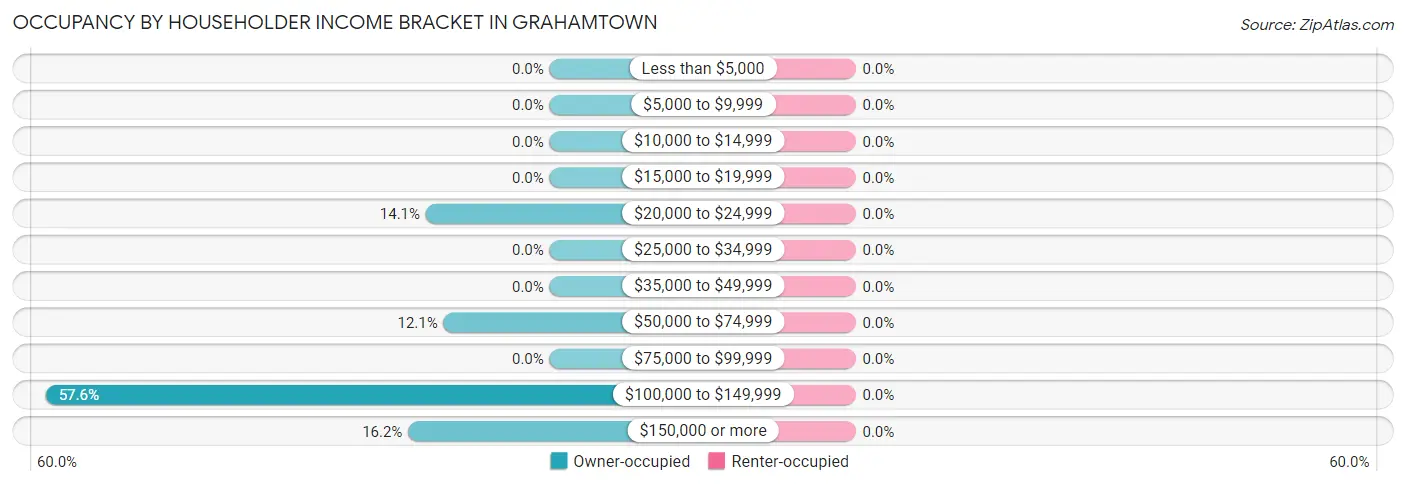
| Income Bracket | Owner-occupied | Renter-occupied |
| Less than $5,000 | 0 (0.0%) | 0 (0.0%) |
| $5,000 to $9,999 | 0 (0.0%) | 0 (0.0%) |
| $10,000 to $14,999 | 0 (0.0%) | 0 (0.0%) |
| $15,000 to $19,999 | 0 (0.0%) | 0 (0.0%) |
| $20,000 to $24,999 | 14 (14.1%) | 0 (0.0%) |
| $25,000 to $34,999 | 0 (0.0%) | 0 (0.0%) |
| $35,000 to $49,999 | 0 (0.0%) | 0 (0.0%) |
| $50,000 to $74,999 | 12 (12.1%) | 0 (0.0%) |
| $75,000 to $99,999 | 0 (0.0%) | 0 (0.0%) |
| $100,000 to $149,999 | 57 (57.6%) | 0 (0.0%) |
| $150,000 or more | 16 (16.2%) | 0 (0.0%) |
| Total | 99 (100.0%) | 0 (0.0%) |
Monthly Housing Cost Tiers in Grahamtown
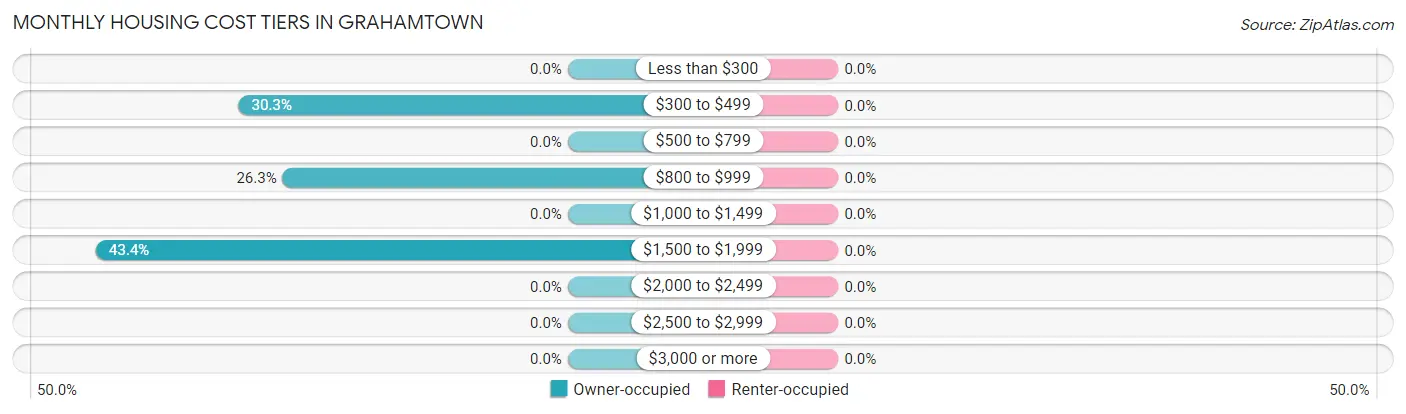
| Monthly Cost | Owner-occupied | Renter-occupied |
| Less than $300 | 0 (0.0%) | 0 (0.0%) |
| $300 to $499 | 30 (30.3%) | 0 (0.0%) |
| $500 to $799 | 0 (0.0%) | 0 (0.0%) |
| $800 to $999 | 26 (26.3%) | 0 (0.0%) |
| $1,000 to $1,499 | 0 (0.0%) | 0 (0.0%) |
| $1,500 to $1,999 | 43 (43.4%) | 0 (0.0%) |
| $2,000 to $2,499 | 0 (0.0%) | 0 (0.0%) |
| $2,500 to $2,999 | 0 (0.0%) | 0 (0.0%) |
| $3,000 or more | 0 (0.0%) | 0 (0.0%) |
| Total | 99 (100.0%) | 0 (0.0%) |
Physical Housing Characteristics in Grahamtown
Housing Structures in Grahamtown
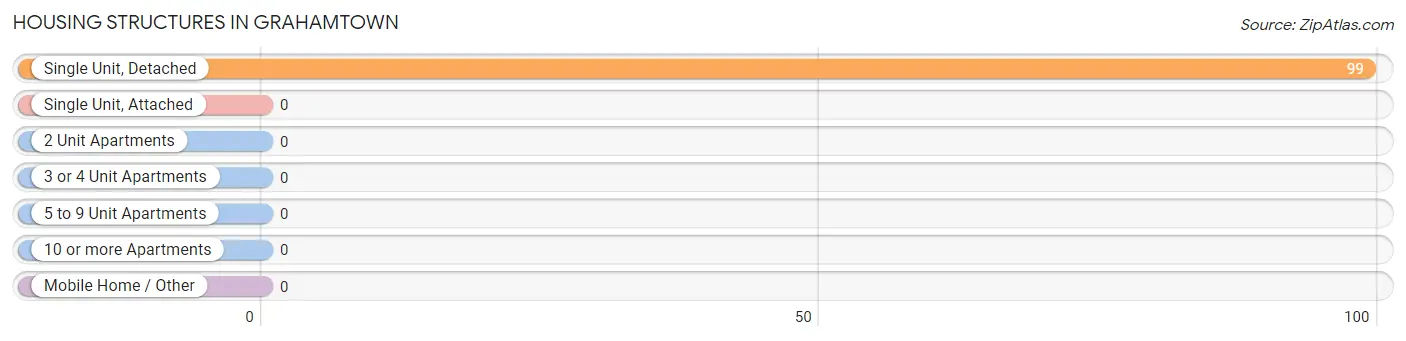
| Structure Type | # Housing Units | % Housing Units |
| Single Unit, Detached | 99 | 100.0% |
| Single Unit, Attached | 0 | 0.0% |
| 2 Unit Apartments | 0 | 0.0% |
| 3 or 4 Unit Apartments | 0 | 0.0% |
| 5 to 9 Unit Apartments | 0 | 0.0% |
| 10 or more Apartments | 0 | 0.0% |
| Mobile Home / Other | 0 | 0.0% |
| Total | 99 | 100.0% |
Housing Structures by Occupancy in Grahamtown
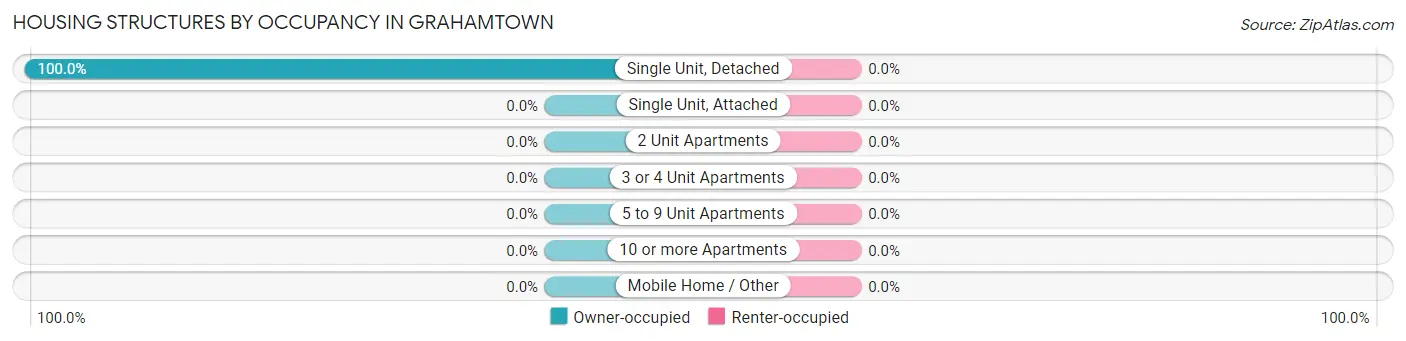
| Structure Type | Owner-occupied | Renter-occupied |
| Single Unit, Detached | 99 (100.0%) | 0 (0.0%) |
| Single Unit, Attached | 0 (0.0%) | 0 (0.0%) |
| 2 Unit Apartments | 0 (0.0%) | 0 (0.0%) |
| 3 or 4 Unit Apartments | 0 (0.0%) | 0 (0.0%) |
| 5 to 9 Unit Apartments | 0 (0.0%) | 0 (0.0%) |
| 10 or more Apartments | 0 (0.0%) | 0 (0.0%) |
| Mobile Home / Other | 0 (0.0%) | 0 (0.0%) |
| Total | 99 (100.0%) | 0 (0.0%) |
Housing Structures by Number of Rooms in Grahamtown
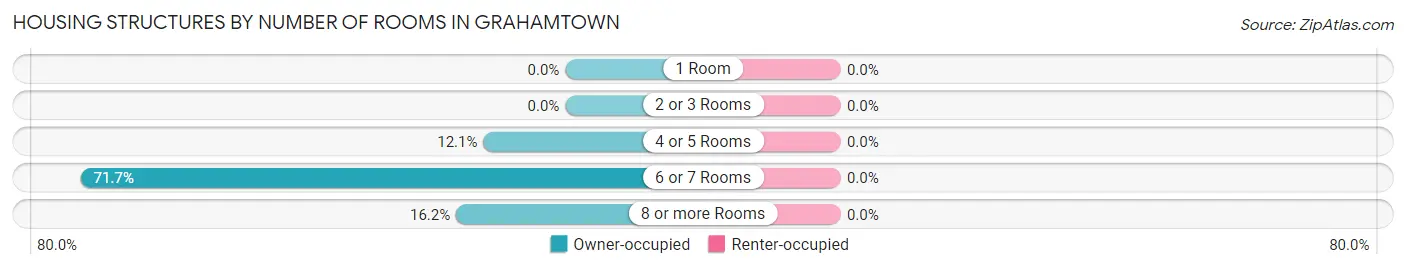
| Number of Rooms | Owner-occupied | Renter-occupied |
| 1 Room | 0 (0.0%) | 0 (0.0%) |
| 2 or 3 Rooms | 0 (0.0%) | 0 (0.0%) |
| 4 or 5 Rooms | 12 (12.1%) | 0 (0.0%) |
| 6 or 7 Rooms | 71 (71.7%) | 0 (0.0%) |
| 8 or more Rooms | 16 (16.2%) | 0 (0.0%) |
| Total | 99 (100.0%) | 0 (0.0%) |
Housing Structure by Heating Type in Grahamtown
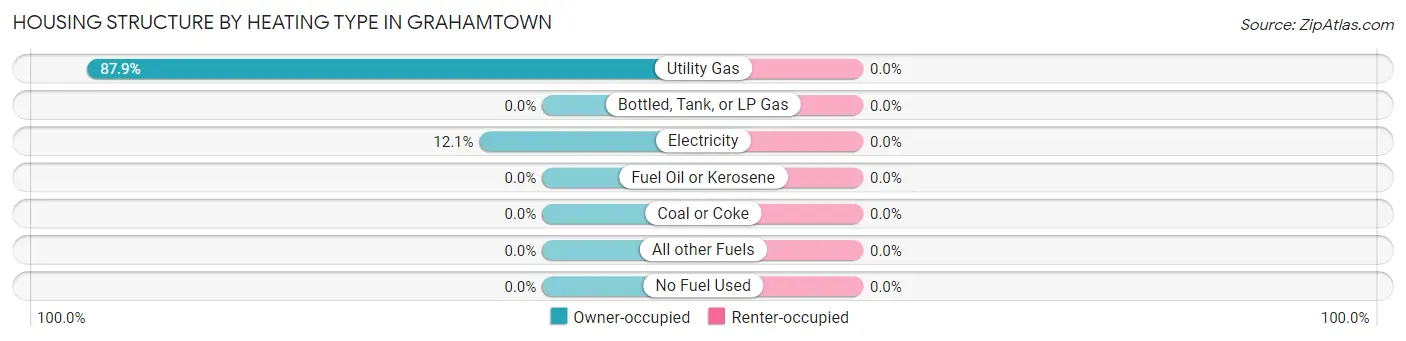
| Heating Type | Owner-occupied | Renter-occupied |
| Utility Gas | 87 (87.9%) | 0 (0.0%) |
| Bottled, Tank, or LP Gas | 0 (0.0%) | 0 (0.0%) |
| Electricity | 12 (12.1%) | 0 (0.0%) |
| Fuel Oil or Kerosene | 0 (0.0%) | 0 (0.0%) |
| Coal or Coke | 0 (0.0%) | 0 (0.0%) |
| All other Fuels | 0 (0.0%) | 0 (0.0%) |
| No Fuel Used | 0 (0.0%) | 0 (0.0%) |
| Total | 99 (100.0%) | 0 (0.0%) |
Household Vehicle Usage in Grahamtown
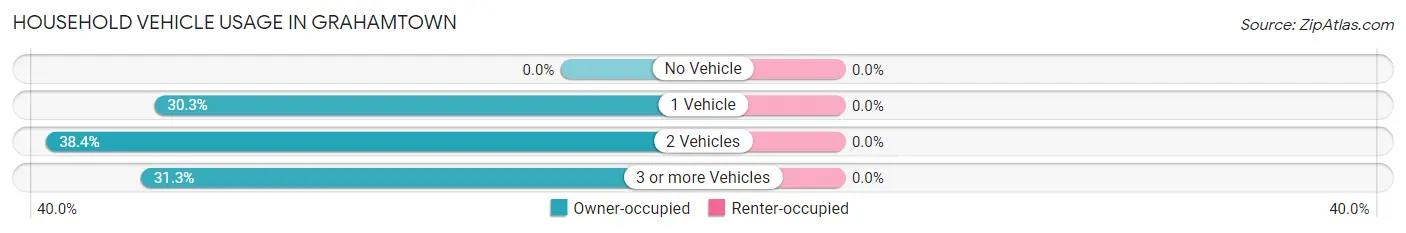
| Vehicles per Household | Owner-occupied | Renter-occupied |
| No Vehicle | 0 (0.0%) | 0 (0.0%) |
| 1 Vehicle | 30 (30.3%) | 0 (0.0%) |
| 2 Vehicles | 38 (38.4%) | 0 (0.0%) |
| 3 or more Vehicles | 31 (31.3%) | 0 (0.0%) |
| Total | 99 (100.0%) | 0 (0.0%) |
Real Estate & Mortgages in Grahamtown
Real Estate and Mortgage Overview in Grahamtown
| Characteristic | Without Mortgage | With Mortgage |
| Housing Units | 30 | 69 |
| Median Property Value | - | - |
| Median Household Income | - | - |
| Monthly Housing Costs | - | - |
| Real Estate Taxes | - | - |
Property Value by Mortgage Status in Grahamtown
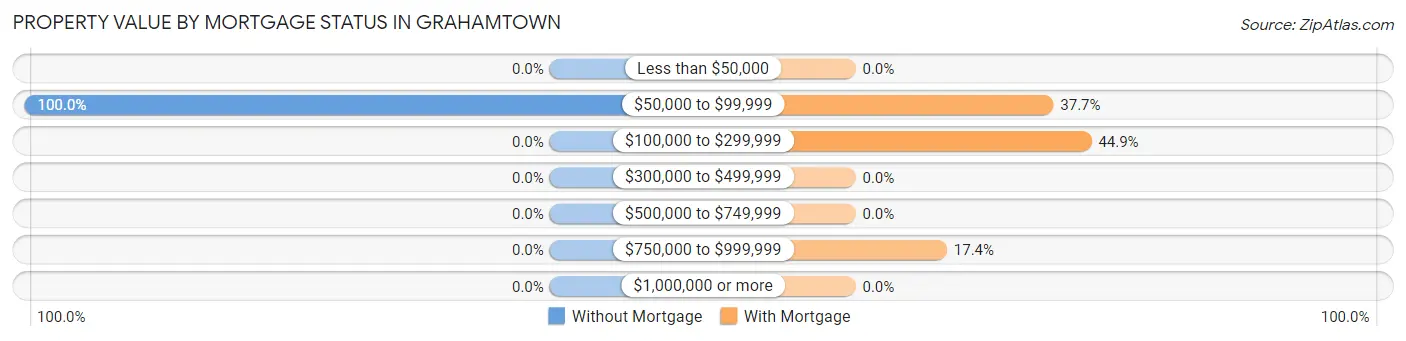
| Property Value | Without Mortgage | With Mortgage |
| Less than $50,000 | 0 (0.0%) | 0 (0.0%) |
| $50,000 to $99,999 | 30 (100.0%) | 26 (37.7%) |
| $100,000 to $299,999 | 0 (0.0%) | 31 (44.9%) |
| $300,000 to $499,999 | 0 (0.0%) | 0 (0.0%) |
| $500,000 to $749,999 | 0 (0.0%) | 0 (0.0%) |
| $750,000 to $999,999 | 0 (0.0%) | 12 (17.4%) |
| $1,000,000 or more | 0 (0.0%) | 0 (0.0%) |
| Total | 30 (100.0%) | 69 (100.0%) |
Household Income by Mortgage Status in Grahamtown
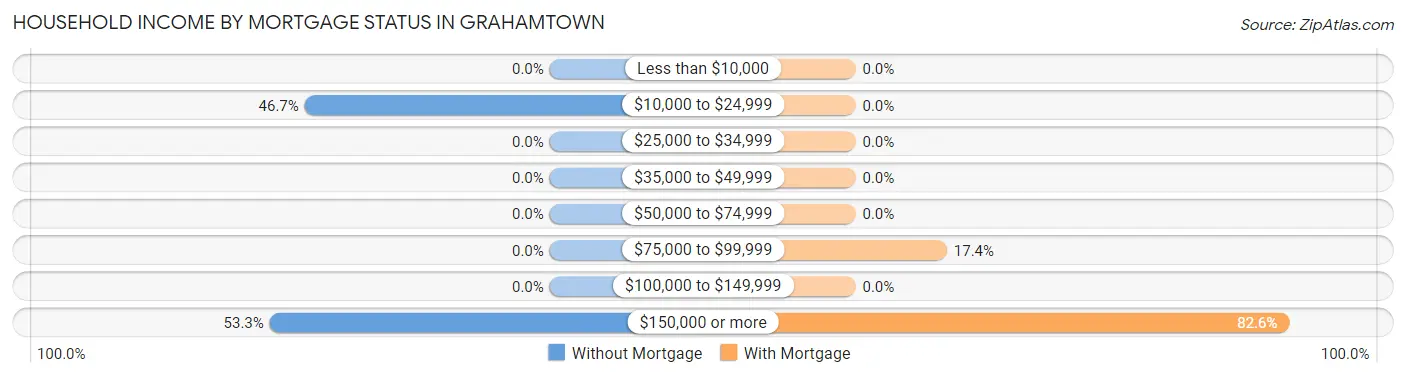
| Household Income | Without Mortgage | With Mortgage |
| Less than $10,000 | 0 (0.0%) | 0 (0.0%) |
| $10,000 to $24,999 | 14 (46.7%) | 0 (0.0%) |
| $25,000 to $34,999 | 0 (0.0%) | 0 (0.0%) |
| $35,000 to $49,999 | 0 (0.0%) | 0 (0.0%) |
| $50,000 to $74,999 | 0 (0.0%) | 0 (0.0%) |
| $75,000 to $99,999 | 0 (0.0%) | 12 (17.4%) |
| $100,000 to $149,999 | 0 (0.0%) | 0 (0.0%) |
| $150,000 or more | 16 (53.3%) | 57 (82.6%) |
| Total | 30 (100.0%) | 69 (100.0%) |
Property Value to Household Income Ratio in Grahamtown
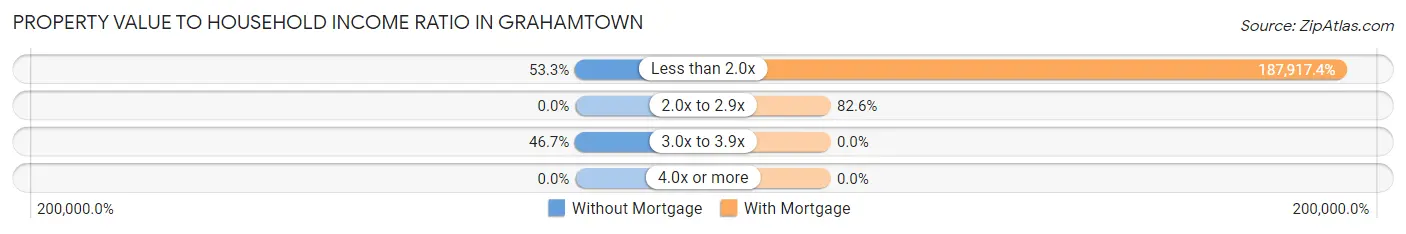
| Value-to-Income Ratio | Without Mortgage | With Mortgage |
| Less than 2.0x | 16 (53.3%) | 129,663 (187,917.4%) |
| 2.0x to 2.9x | 0 (0.0%) | 57 (82.6%) |
| 3.0x to 3.9x | 14 (46.7%) | 0 (0.0%) |
| 4.0x or more | 0 (0.0%) | 0 (0.0%) |
| Total | 30 (100.0%) | 69 (100.0%) |
Real Estate Taxes by Mortgage Status in Grahamtown
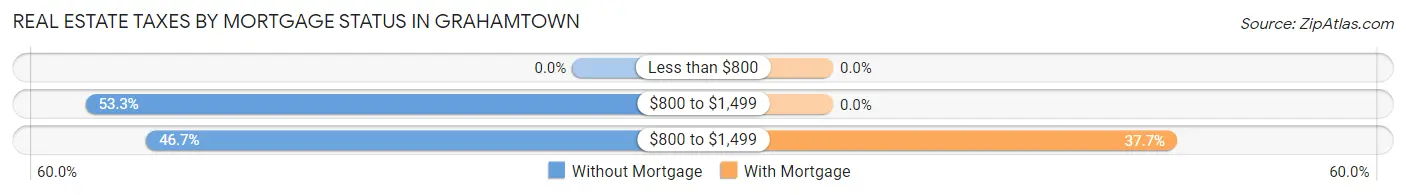
| Property Taxes | Without Mortgage | With Mortgage |
| Less than $800 | 0 (0.0%) | 0 (0.0%) |
| $800 to $1,499 | 16 (53.3%) | 0 (0.0%) |
| $800 to $1,499 | 14 (46.7%) | 26 (37.7%) |
| Total | 30 (100.0%) | 69 (100.0%) |
Health & Disability in Grahamtown
Health Insurance Coverage by Age in Grahamtown
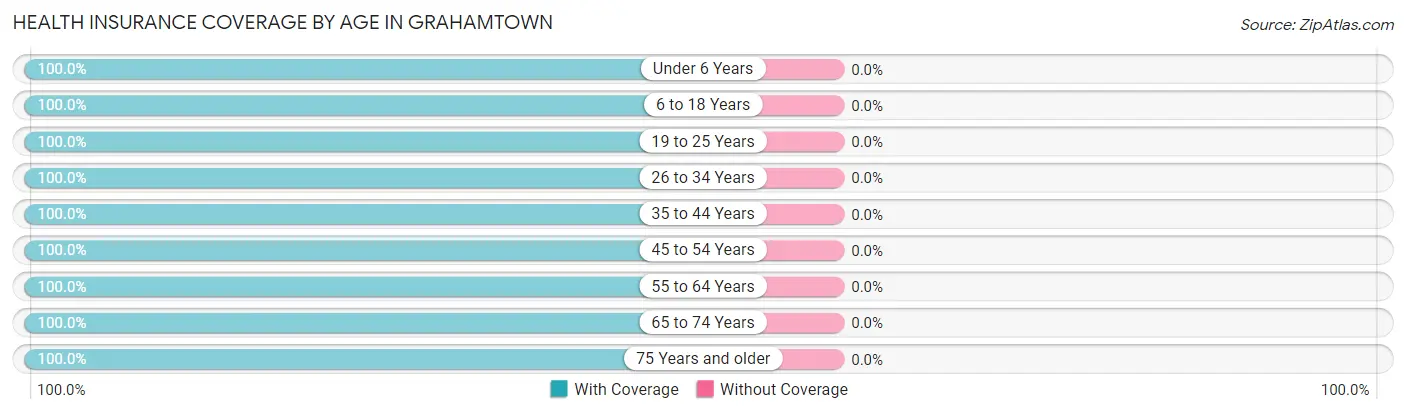
| Age Bracket | With Coverage | Without Coverage |
| Under 6 Years | 29 (100.0%) | 0 (0.0%) |
| 6 to 18 Years | 99 (100.0%) | 0 (0.0%) |
| 19 to 25 Years | 32 (100.0%) | 0 (0.0%) |
| 26 to 34 Years | 23 (100.0%) | 0 (0.0%) |
| 35 to 44 Years | 67 (100.0%) | 0 (0.0%) |
| 45 to 54 Years | 26 (100.0%) | 0 (0.0%) |
| 55 to 64 Years | 19 (100.0%) | 0 (0.0%) |
| 65 to 74 Years | 16 (100.0%) | 0 (0.0%) |
| 75 Years and older | 14 (100.0%) | 0 (0.0%) |
| Total | 325 (100.0%) | 0 (0.0%) |
Health Insurance Coverage by Citizenship Status in Grahamtown
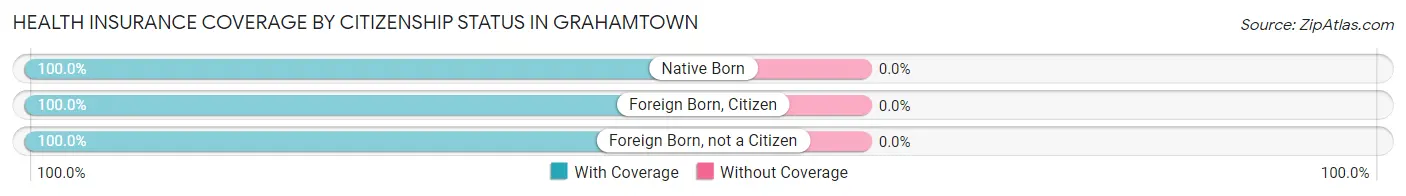
| Citizenship Status | With Coverage | Without Coverage |
| Native Born | 29 (100.0%) | 0 (0.0%) |
| Foreign Born, Citizen | 99 (100.0%) | 0 (0.0%) |
| Foreign Born, not a Citizen | 32 (100.0%) | 0 (0.0%) |
Health Insurance Coverage by Household Income in Grahamtown
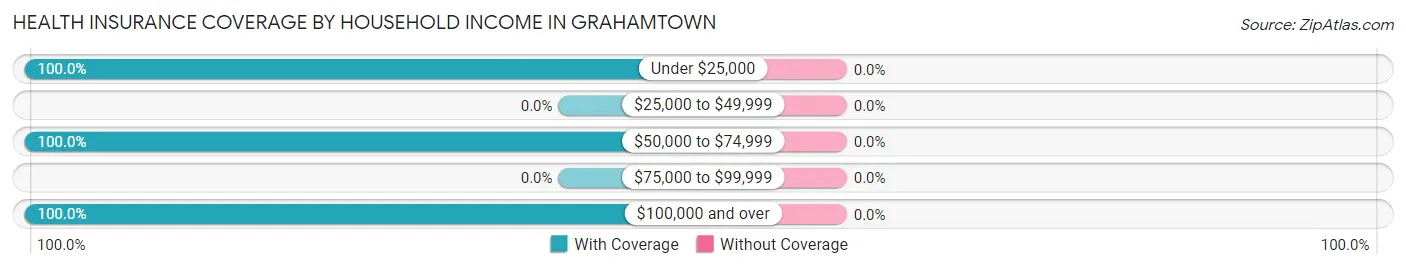
| Household Income | With Coverage | Without Coverage |
| Under $25,000 | 14 (100.0%) | 0 (0.0%) |
| $25,000 to $49,999 | 0 (0.0%) | 0 (0.0%) |
| $50,000 to $74,999 | 23 (100.0%) | 0 (0.0%) |
| $75,000 to $99,999 | 0 (0.0%) | 0 (0.0%) |
| $100,000 and over | 288 (100.0%) | 0 (0.0%) |
Public vs Private Health Insurance Coverage by Age in Grahamtown
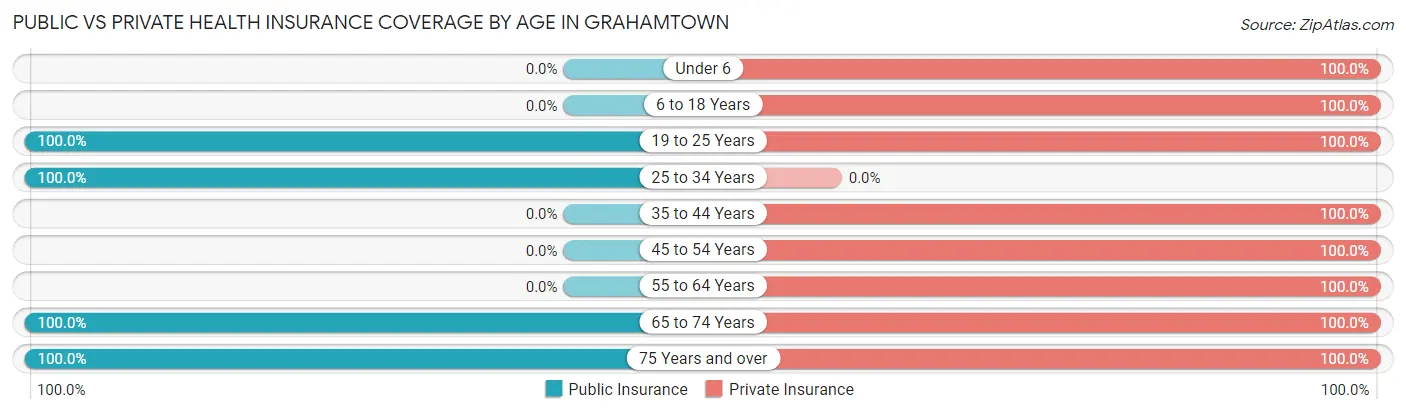
| Age Bracket | Public Insurance | Private Insurance |
| Under 6 | 0 (0.0%) | 29 (100.0%) |
| 6 to 18 Years | 0 (0.0%) | 99 (100.0%) |
| 19 to 25 Years | 32 (100.0%) | 32 (100.0%) |
| 25 to 34 Years | 23 (100.0%) | 0 (0.0%) |
| 35 to 44 Years | 0 (0.0%) | 67 (100.0%) |
| 45 to 54 Years | 0 (0.0%) | 26 (100.0%) |
| 55 to 64 Years | 0 (0.0%) | 19 (100.0%) |
| 65 to 74 Years | 16 (100.0%) | 16 (100.0%) |
| 75 Years and over | 14 (100.0%) | 14 (100.0%) |
| Total | 85 (26.2%) | 302 (92.9%) |
Disability Status by Sex by Age in Grahamtown
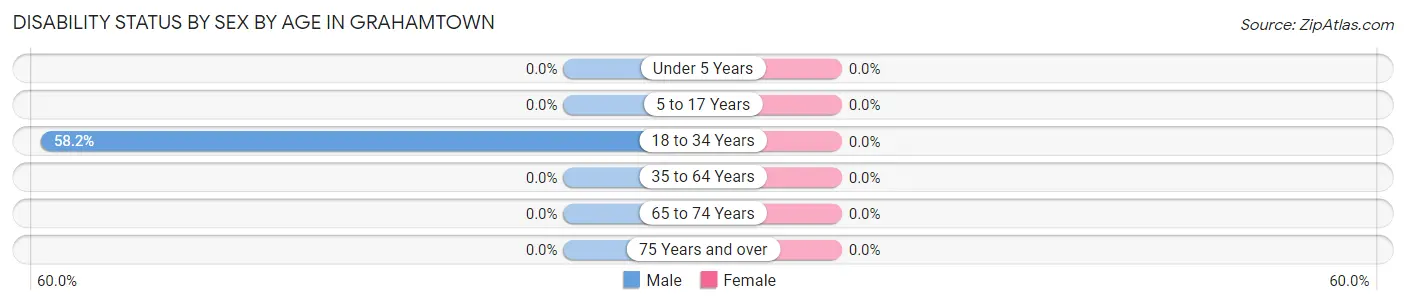
| Age Bracket | Male | Female |
| Under 5 Years | 0 (0.0%) | 0 (0.0%) |
| 5 to 17 Years | 0 (0.0%) | 0 (0.0%) |
| 18 to 34 Years | 32 (58.2%) | 0 (0.0%) |
| 35 to 64 Years | 0 (0.0%) | 0 (0.0%) |
| 65 to 74 Years | 0 (0.0%) | 0 (0.0%) |
| 75 Years and over | 0 (0.0%) | 0 (0.0%) |
Disability Class by Sex by Age in Grahamtown
Disability Class: Hearing Difficulty
| Age Bracket | Male | Female |
| Under 5 Years | 0 (0.0%) | 0 (0.0%) |
| 5 to 17 Years | 0 (0.0%) | 0 (0.0%) |
| 18 to 34 Years | 0 (0.0%) | 0 (0.0%) |
| 35 to 64 Years | 0 (0.0%) | 0 (0.0%) |
| 65 to 74 Years | 0 (0.0%) | 0 (0.0%) |
| 75 Years and over | 0 (0.0%) | 0 (0.0%) |
Disability Class: Vision Difficulty
| Age Bracket | Male | Female |
| Under 5 Years | 0 (0.0%) | 0 (0.0%) |
| 5 to 17 Years | 0 (0.0%) | 0 (0.0%) |
| 18 to 34 Years | 0 (0.0%) | 0 (0.0%) |
| 35 to 64 Years | 0 (0.0%) | 0 (0.0%) |
| 65 to 74 Years | 0 (0.0%) | 0 (0.0%) |
| 75 Years and over | 0 (0.0%) | 0 (0.0%) |
Disability Class: Cognitive Difficulty
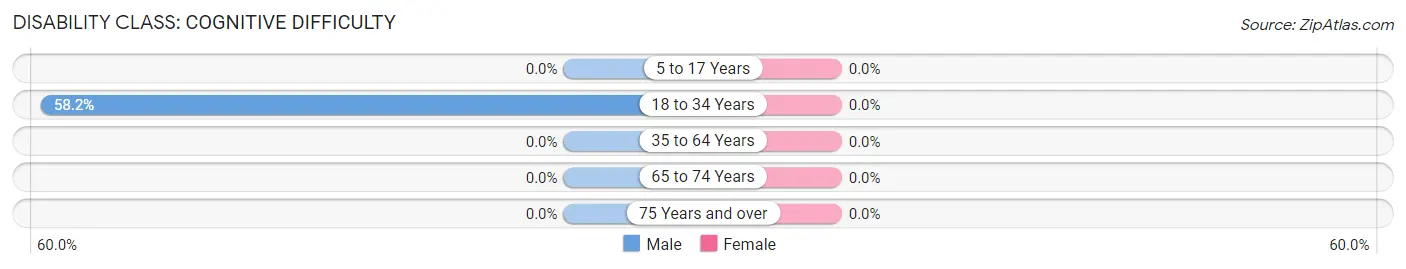
| Age Bracket | Male | Female |
| 5 to 17 Years | 0 (0.0%) | 0 (0.0%) |
| 18 to 34 Years | 32 (58.2%) | 0 (0.0%) |
| 35 to 64 Years | 0 (0.0%) | 0 (0.0%) |
| 65 to 74 Years | 0 (0.0%) | 0 (0.0%) |
| 75 Years and over | 0 (0.0%) | 0 (0.0%) |
Disability Class: Ambulatory Difficulty
| Age Bracket | Male | Female |
| 5 to 17 Years | 0 (0.0%) | 0 (0.0%) |
| 18 to 34 Years | 0 (0.0%) | 0 (0.0%) |
| 35 to 64 Years | 0 (0.0%) | 0 (0.0%) |
| 65 to 74 Years | 0 (0.0%) | 0 (0.0%) |
| 75 Years and over | 0 (0.0%) | 0 (0.0%) |
Disability Class: Self-Care Difficulty
| Age Bracket | Male | Female |
| 5 to 17 Years | 0 (0.0%) | 0 (0.0%) |
| 18 to 34 Years | 0 (0.0%) | 0 (0.0%) |
| 35 to 64 Years | 0 (0.0%) | 0 (0.0%) |
| 65 to 74 Years | 0 (0.0%) | 0 (0.0%) |
| 75 Years and over | 0 (0.0%) | 0 (0.0%) |
Technology Access in Grahamtown
Computing Device Access in Grahamtown
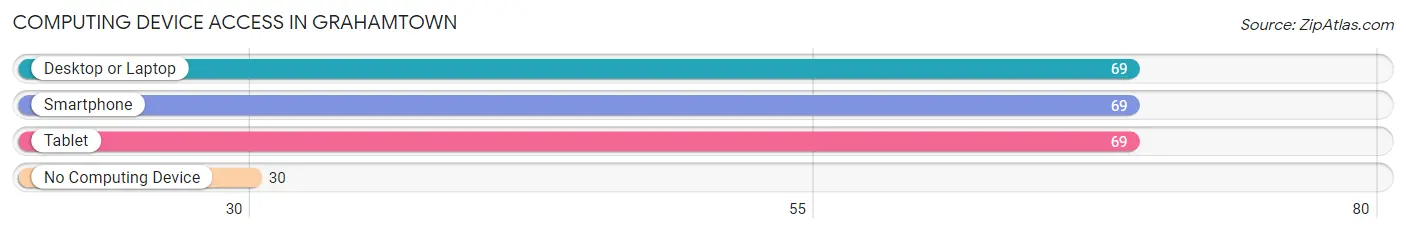
| Device Type | # Households | % Households |
| Desktop or Laptop | 69 | 69.7% |
| Smartphone | 69 | 69.7% |
| Tablet | 69 | 69.7% |
| No Computing Device | 30 | 30.3% |
| Total | 99 | 100.0% |
Internet Access in Grahamtown
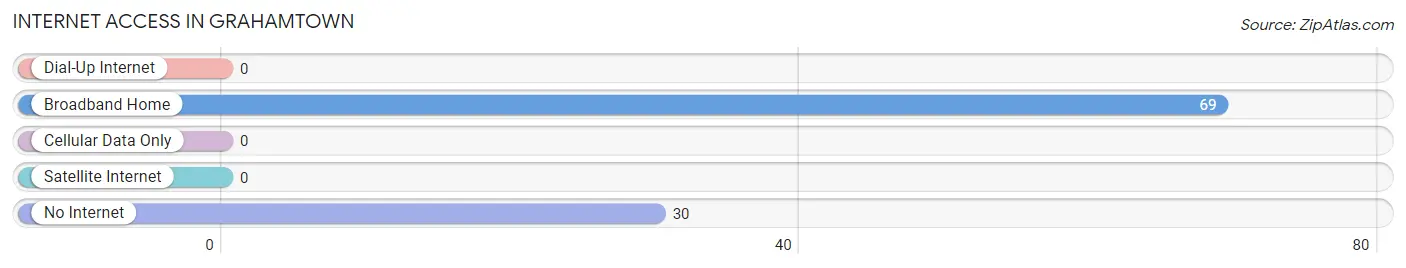
| Internet Type | # Households | % Households |
| Dial-Up Internet | 0 | 0.0% |
| Broadband Home | 69 | 69.7% |
| Cellular Data Only | 0 | 0.0% |
| Satellite Internet | 0 | 0.0% |
| No Internet | 30 | 30.3% |
| Total | 99 | 100.0% |
Grahamtown Summary
History
Grahamtown is a small town located in Maryland, United States. It is situated in the northern part of the state, near the border with Pennsylvania. The town was founded in 1790 by William Graham, a Revolutionary War veteran. Grahamtown was originally a farming community, but it has since grown to become a small town with a population of around 1,000 people.
The town has a rich history, which dates back to the early 19th century. During this time, the town was a major stop on the Underground Railroad, which was a network of secret routes and safe houses used by African-American slaves to escape to freedom in the northern United States and Canada. The town was also home to a number of prominent abolitionists, including William Lloyd Garrison and Frederick Douglass.
Geography
Grahamtown is located in northern Maryland, near the border with Pennsylvania. The town is situated in a rural area, surrounded by rolling hills and farmland. The town is located in the Appalachian Mountains, and the terrain is mostly hilly and wooded. The town is located near the Susquehanna River, which is a major tributary of the Chesapeake Bay.
The climate in Grahamtown is humid subtropical, with hot, humid summers and cold, wet winters. The average temperature in the summer is around 80 degrees Fahrenheit, and the average temperature in the winter is around 40 degrees Fahrenheit.
Economy
The economy of Grahamtown is largely based on agriculture. The town is home to several farms, which produce a variety of crops, including corn, soybeans, wheat, and hay. The town also has a number of small businesses, including restaurants, stores, and other services.
The town is also home to a number of manufacturing companies, which produce a variety of products, including furniture, clothing, and electronics. The town is also home to a number of technology companies, which provide software and other services to businesses and individuals.
Demographics
As of the 2010 census, the population of Grahamtown was 1,000 people. The town is predominantly white, with a small African-American population. The median household income in the town is around $50,000, and the median age is around 40 years old. The town has a low unemployment rate, and the majority of the population is employed in the agricultural and manufacturing industries.
Common Questions
What is Per Capita Income in Grahamtown?
Per Capita income in Grahamtown is $36,622.
What is the Median Household income in Grahamtown?
Median Household Income in Grahamtown is $129,760.
What is Inequality or Gini Index in Grahamtown?
Inequality or Gini Index in Grahamtown is 0.22.
What is the Total Population of Grahamtown?
Total Population of Grahamtown is 325.
What is the Total Male Population of Grahamtown?
Total Male Population of Grahamtown is 188.
What is the Total Female Population of Grahamtown?
Total Female Population of Grahamtown is 137.
What is the Ratio of Males per 100 Females in Grahamtown?
There are 137.23 Males per 100 Females in Grahamtown.
What is the Ratio of Females per 100 Males in Grahamtown?
There are 72.87 Females per 100 Males in Grahamtown.
What is the Median Population Age in Grahamtown?
Median Population Age in Grahamtown is 30.1 Years.
What is the Average Family Size in Grahamtown
Average Family Size in Grahamtown is 4.8 People.
What is the Average Household Size in Grahamtown
Average Household Size in Grahamtown is 3.3 People.
How Large is the Labor Force in Grahamtown?
There are 140 People in the Labor Forcein in Grahamtown.
What is the Percentage of People in the Labor Force in Grahamtown?
71.1% of People are in the Labor Force in Grahamtown.
What is the Unemployment Rate in Grahamtown?
Unemployment Rate in Grahamtown is 13.6%.