Fort Meade, MD Map & Demographics
Fort Meade Map
Fort Meade Overview
$35,407
PER CAPITA INCOME
$88,438
AVG FAMILY INCOME
$94,110
AVG HOUSEHOLD INCOME
22.3%
WAGE / INCOME GAP [ % ]
77.7¢/ $1
WAGE / INCOME GAP [ $ ]
0.37
INEQUALITY / GINI INDEX
10,011
TOTAL POPULATION
5,180
MALE POPULATION
4,831
FEMALE POPULATION
107.22
MALES / 100 FEMALES
93.26
FEMALES / 100 MALES
27.2
MEDIAN AGE
3.6
AVG FAMILY SIZE
3.2
AVG HOUSEHOLD SIZE
5,039
LABOR FORCE [ PEOPLE ]
72.8%
PERCENT IN LABOR FORCE
4.6%
UNEMPLOYMENT RATE
Fort Meade Area Codes
Income in Fort Meade
Income Overview in Fort Meade
Per Capita Income in Fort Meade is $35,407, while median incomes of families and households are $88,438 and $94,110 respectively.
| Characteristic | Number | Measure |
| Per Capita Income | 10,011 | $35,407 |
| Median Family Income | 2,338 | $88,438 |
| Mean Family Income | 2,338 | $114,270 |
| Median Household Income | 2,938 | $94,110 |
| Mean Household Income | 2,938 | $113,528 |
| Income Deficit | 2,338 | $0 |
| Wage / Income Gap (%) | 10,011 | 22.30% |
| Wage / Income Gap ($) | 10,011 | 77.70¢ per $1 |
| Gini / Inequality Index | 10,011 | 0.37 |
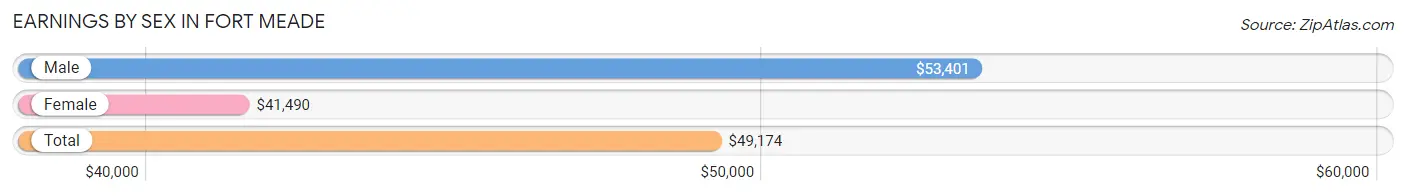
Earnings by Sex in Fort Meade
Average Earnings in Fort Meade are $49,174, $53,401 for men and $41,490 for women, a difference of 22.3%.
| Sex | Number | Average Earnings |
| Male | 3,186 (61.1%) | $53,401 |
| Female | 2,028 (38.9%) | $41,490 |
| Total | 5,214 (100.0%) | $49,174 |
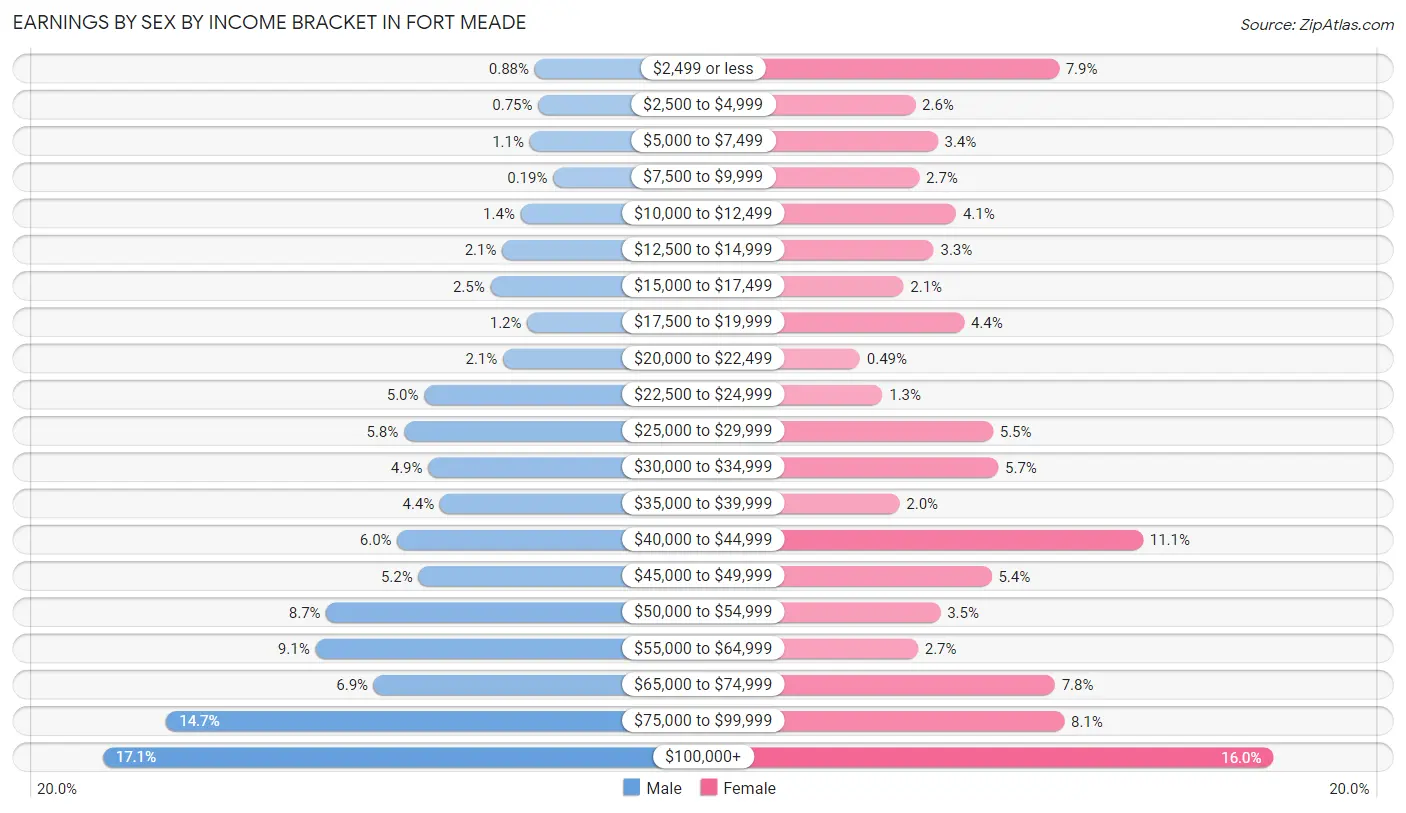
Earnings by Sex by Income Bracket in Fort Meade
The most common earnings brackets in Fort Meade are $100,000+ for men (544 | 17.1%) and $100,000+ for women (324 | 16.0%).
| Income | Male | Female |
| $2,499 or less | 28 (0.9%) | 161 (7.9%) |
| $2,500 to $4,999 | 24 (0.7%) | 52 (2.6%) |
| $5,000 to $7,499 | 34 (1.1%) | 69 (3.4%) |
| $7,500 to $9,999 | 6 (0.2%) | 55 (2.7%) |
| $10,000 to $12,499 | 45 (1.4%) | 83 (4.1%) |
| $12,500 to $14,999 | 67 (2.1%) | 66 (3.3%) |
| $15,000 to $17,499 | 81 (2.5%) | 43 (2.1%) |
| $17,500 to $19,999 | 37 (1.2%) | 89 (4.4%) |
| $20,000 to $22,499 | 66 (2.1%) | 10 (0.5%) |
| $22,500 to $24,999 | 160 (5.0%) | 27 (1.3%) |
| $25,000 to $29,999 | 184 (5.8%) | 111 (5.5%) |
| $30,000 to $34,999 | 155 (4.9%) | 115 (5.7%) |
| $35,000 to $39,999 | 141 (4.4%) | 40 (2.0%) |
| $40,000 to $44,999 | 192 (6.0%) | 225 (11.1%) |
| $45,000 to $49,999 | 167 (5.2%) | 110 (5.4%) |
| $50,000 to $54,999 | 277 (8.7%) | 71 (3.5%) |
| $55,000 to $64,999 | 290 (9.1%) | 54 (2.7%) |
| $65,000 to $74,999 | 220 (6.9%) | 158 (7.8%) |
| $75,000 to $99,999 | 468 (14.7%) | 165 (8.1%) |
| $100,000+ | 544 (17.1%) | 324 (16.0%) |
| Total | 3,186 (100.0%) | 2,028 (100.0%) |
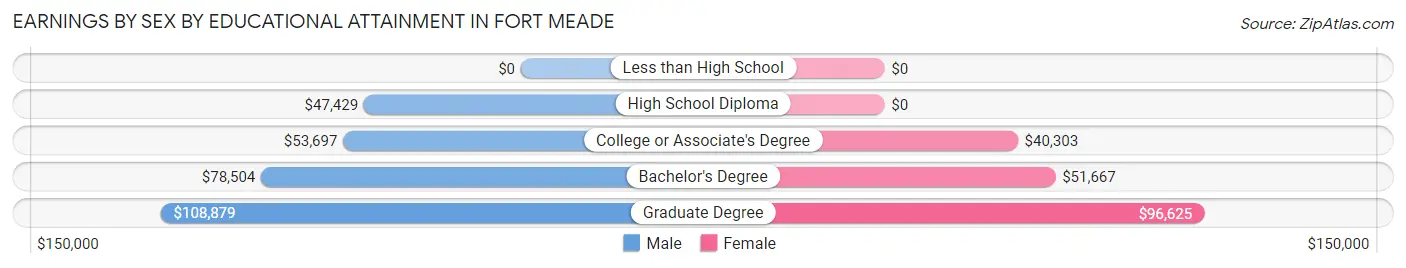
Earnings by Sex by Educational Attainment in Fort Meade
Average earnings in Fort Meade are $64,037 for men and $45,662 for women, a difference of 28.7%. Men with an educational attainment of graduate degree enjoy the highest average annual earnings of $108,879, while those with high school diploma education earn the least with $47,429. Women with an educational attainment of graduate degree earn the most with the average annual earnings of $96,625, while those with college or associate's degree education have the smallest earnings of $40,303.
| Educational Attainment | Male Income | Female Income |
| Less than High School | - | - |
| High School Diploma | $47,429 | $0 |
| College or Associate's Degree | $53,697 | $40,303 |
| Bachelor's Degree | $78,504 | $51,667 |
| Graduate Degree | $108,879 | $96,625 |
| Total | $64,037 | $45,662 |
Family Income in Fort Meade
Family Income Brackets in Fort Meade
According to the Fort Meade family income data, there are 554 families falling into the $50,000 to $74,999 income range, which is the most common income bracket and makes up 23.7% of all families. Conversely, the $15,000 to $24,999 income bracket is the least frequent group with only 7 families (0.3%) belonging to this category.
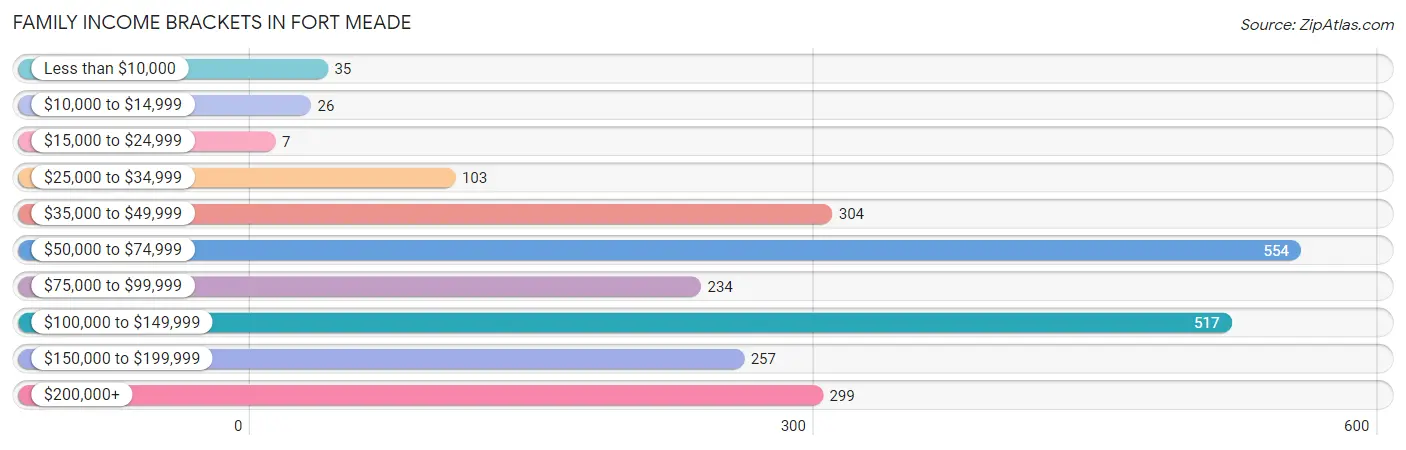
| Income Bracket | # Families | % Families |
| Less than $10,000 | 35 | 1.5% |
| $10,000 to $14,999 | 26 | 1.1% |
| $15,000 to $24,999 | 7 | 0.3% |
| $25,000 to $34,999 | 103 | 4.4% |
| $35,000 to $49,999 | 304 | 13.0% |
| $50,000 to $74,999 | 554 | 23.7% |
| $75,000 to $99,999 | 234 | 10.0% |
| $100,000 to $149,999 | 517 | 22.1% |
| $150,000 to $199,999 | 257 | 11.0% |
| $200,000+ | 299 | 12.8% |
Family Income by Famaliy Size in Fort Meade
3-person families (772 | 33.0%) account for the highest median family income in Fort Meade with $101,971 per family, while 2-person families (624 | 26.7%) have the highest median income of $36,875 per family member.
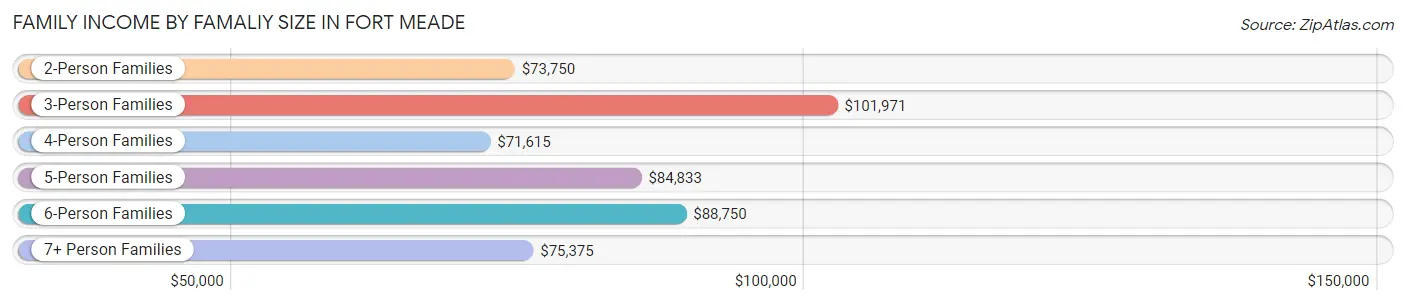
| Income Bracket | # Families | Median Income |
| 2-Person Families | 624 (26.7%) | $73,750 |
| 3-Person Families | 772 (33.0%) | $101,971 |
| 4-Person Families | 411 (17.6%) | $71,615 |
| 5-Person Families | 318 (13.6%) | $84,833 |
| 6-Person Families | 174 (7.4%) | $88,750 |
| 7+ Person Families | 39 (1.7%) | $75,375 |
| Total | 2,338 (100.0%) | $88,438 |
Family Income by Number of Earners in Fort Meade
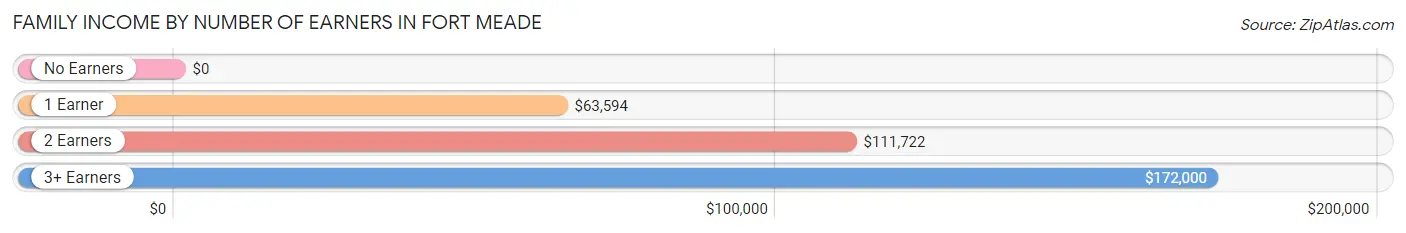
| Number of Earners | # Families | Median Income |
| No Earners | 36 (1.5%) | $0 |
| 1 Earner | 1,028 (44.0%) | $63,594 |
| 2 Earners | 1,166 (49.9%) | $111,722 |
| 3+ Earners | 108 (4.6%) | $172,000 |
| Total | 2,338 (100.0%) | $88,438 |
Household Income in Fort Meade
Household Income Brackets in Fort Meade
With 687 households falling in the category, the $100,000 to $149,999 income range is the most frequent in Fort Meade, accounting for 23.4% of all households. In contrast, only 15 households (0.5%) fall into the $15,000 to $24,999 income bracket, making it the least populous group.
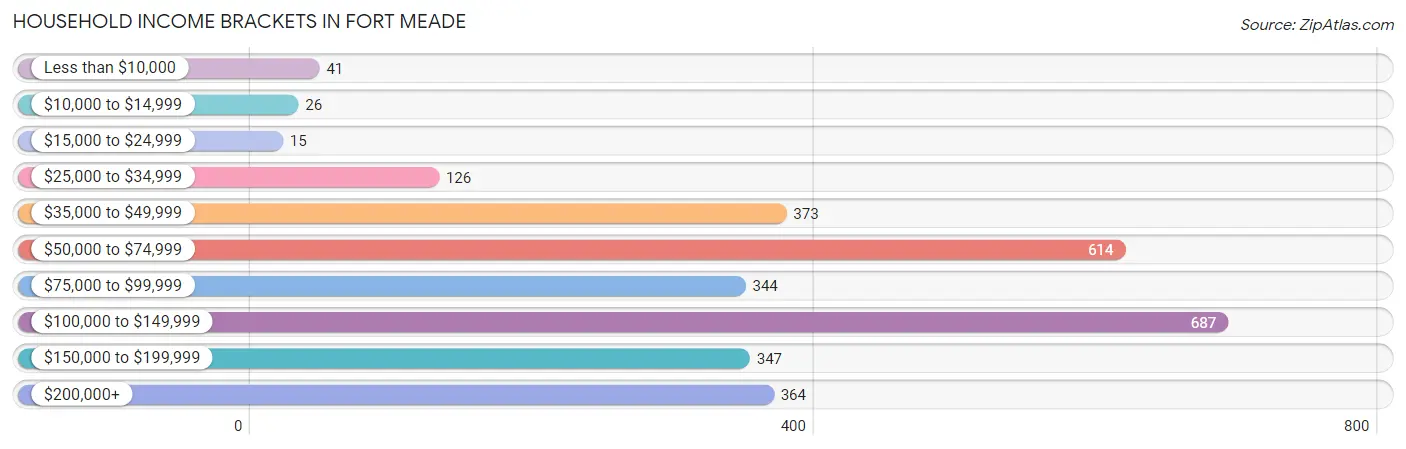
| Income Bracket | # Households | % Households |
| Less than $10,000 | 41 | 1.4% |
| $10,000 to $14,999 | 26 | 0.9% |
| $15,000 to $24,999 | 15 | 0.5% |
| $25,000 to $34,999 | 126 | 4.3% |
| $35,000 to $49,999 | 373 | 12.7% |
| $50,000 to $74,999 | 614 | 20.9% |
| $75,000 to $99,999 | 344 | 11.7% |
| $100,000 to $149,999 | 687 | 23.4% |
| $150,000 to $199,999 | 347 | 11.8% |
| $200,000+ | 364 | 12.4% |
Household Income by Householder Age in Fort Meade
The median household income in Fort Meade is $94,110, with the highest median household income of $136,202 found in the 45 to 64 years age bracket for the primary householder. A total of 667 households (22.7%) fall into this category. Meanwhile, the 65+ years age bracket for the primary householder has the lowest median household income of $0, with 92 households (3.1%) in this group.
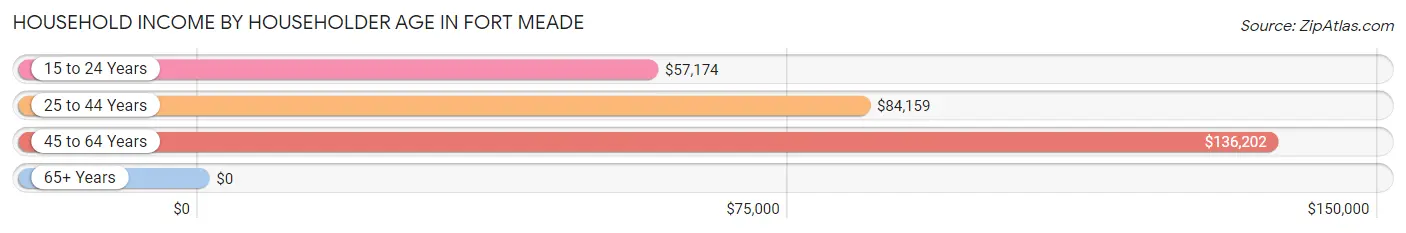
| Income Bracket | # Households | Median Income |
| 15 to 24 Years | 290 (9.9%) | $57,174 |
| 25 to 44 Years | 1,889 (64.3%) | $84,159 |
| 45 to 64 Years | 667 (22.7%) | $136,202 |
| 65+ Years | 92 (3.1%) | $0 |
| Total | 2,938 (100.0%) | $94,110 |
Poverty in Fort Meade
Income Below Poverty by Sex and Age in Fort Meade
With 6.0% poverty level for males and 5.9% for females among the residents of Fort Meade, 55 to 64 year old males and 15 year old females are the most vulnerable to poverty, with 44 males (25.7%) and 17 females (38.6%) in their respective age groups living below the poverty level.
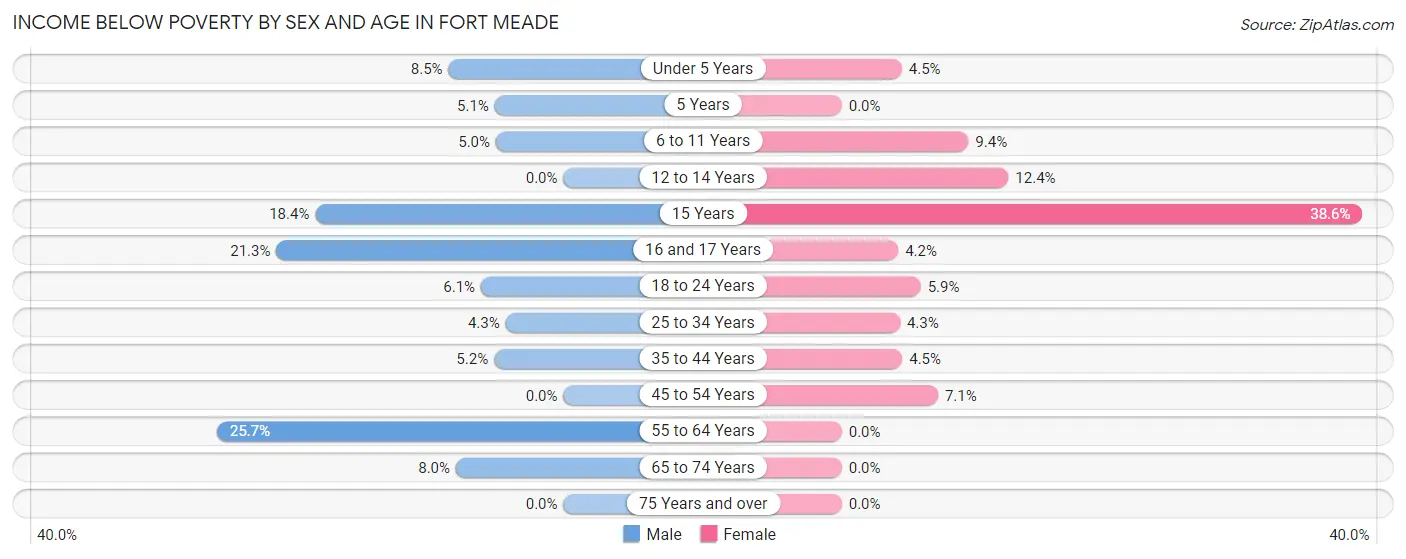
| Age Bracket | Male | Female |
| Under 5 Years | 57 (8.5%) | 22 (4.5%) |
| 5 Years | 8 (5.1%) | 0 (0.0%) |
| 6 to 11 Years | 23 (5.0%) | 58 (9.4%) |
| 12 to 14 Years | 0 (0.0%) | 35 (12.4%) |
| 15 Years | 7 (18.4%) | 17 (38.6%) |
| 16 and 17 Years | 13 (21.3%) | 7 (4.2%) |
| 18 to 24 Years | 33 (6.1%) | 26 (5.9%) |
| 25 to 34 Years | 48 (4.3%) | 48 (4.3%) |
| 35 to 44 Years | 39 (5.1%) | 27 (4.5%) |
| 45 to 54 Years | 0 (0.0%) | 36 (7.1%) |
| 55 to 64 Years | 44 (25.7%) | 0 (0.0%) |
| 65 to 74 Years | 13 (8.0%) | 0 (0.0%) |
| 75 Years and over | 0 (0.0%) | 0 (0.0%) |
| Total | 285 (6.0%) | 276 (5.9%) |
Income Above Poverty by Sex and Age in Fort Meade
According to the poverty statistics in Fort Meade, males aged 12 to 14 years and females aged 5 years are the age groups that are most secure financially, with 100.0% of males and 100.0% of females in these age groups living above the poverty line.
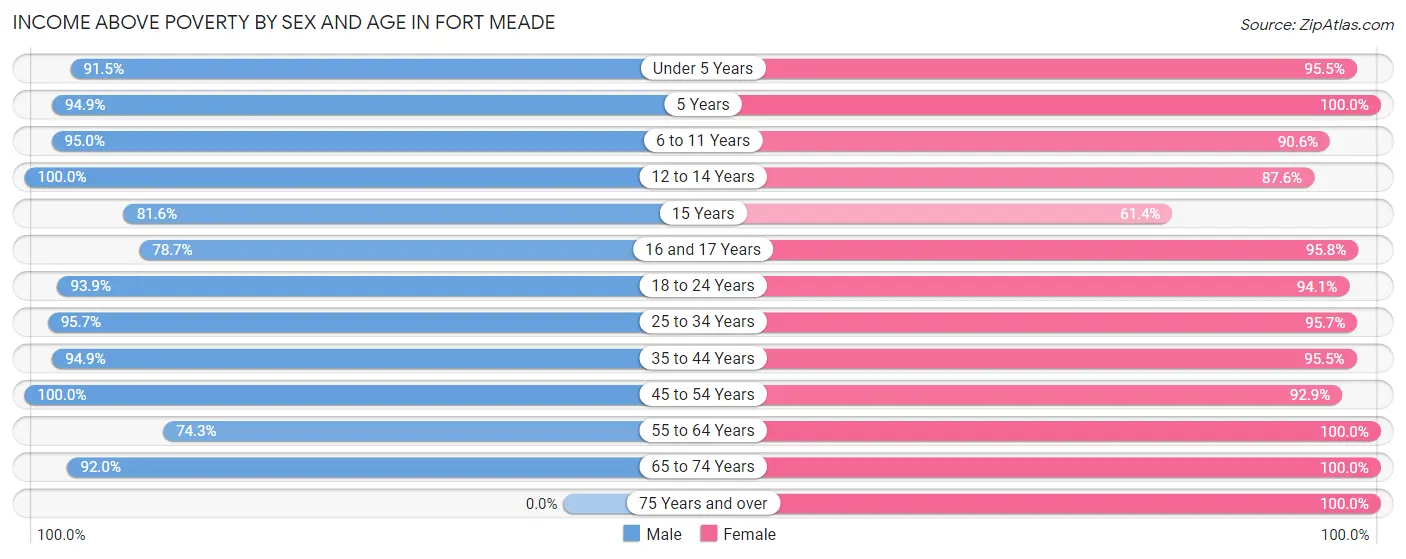
| Age Bracket | Male | Female |
| Under 5 Years | 611 (91.5%) | 471 (95.5%) |
| 5 Years | 149 (94.9%) | 124 (100.0%) |
| 6 to 11 Years | 436 (95.0%) | 559 (90.6%) |
| 12 to 14 Years | 197 (100.0%) | 248 (87.6%) |
| 15 Years | 31 (81.6%) | 27 (61.4%) |
| 16 and 17 Years | 48 (78.7%) | 160 (95.8%) |
| 18 to 24 Years | 506 (93.9%) | 418 (94.1%) |
| 25 to 34 Years | 1,070 (95.7%) | 1,064 (95.7%) |
| 35 to 44 Years | 718 (94.9%) | 575 (95.5%) |
| 45 to 54 Years | 435 (100.0%) | 468 (92.9%) |
| 55 to 64 Years | 127 (74.3%) | 188 (100.0%) |
| 65 to 74 Years | 150 (92.0%) | 94 (100.0%) |
| 75 Years and over | 0 (0.0%) | 37 (100.0%) |
| Total | 4,478 (94.0%) | 4,433 (94.1%) |
Income Below Poverty Among Married-Couple Families in Fort Meade
The poverty statistics for married-couple families in Fort Meade show that 2.3% or 47 of the total 2,031 families live below the poverty line. Families with 5 or more children have the highest poverty rate of 52.2%, comprising of 12 families. On the other hand, families with no children have the lowest poverty rate of 0.0%, which includes 0 families.
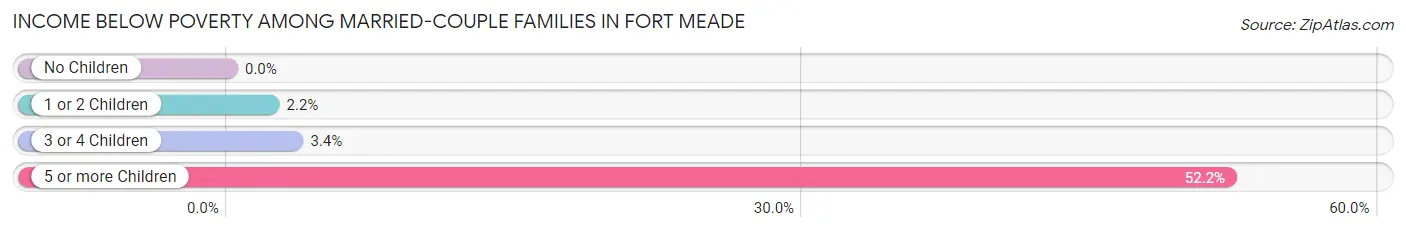
| Children | Above Poverty | Below Poverty |
| No Children | 631 (100.0%) | 0 (0.0%) |
| 1 or 2 Children | 947 (97.8%) | 21 (2.2%) |
| 3 or 4 Children | 395 (96.6%) | 14 (3.4%) |
| 5 or more Children | 11 (47.8%) | 12 (52.2%) |
| Total | 1,984 (97.7%) | 47 (2.3%) |
Income Below Poverty Among Single-Parent Households in Fort Meade
According to the poverty data in Fort Meade, 14.9% or 7 single-father households and 12.3% or 32 single-mother households are living below the poverty line. Among single-father households, those with 3 or 4 children have the highest poverty rate, with 7 households (100.0%) experiencing poverty. Likewise, among single-mother households, those with 3 or 4 children have the highest poverty rate, with 8 households (17.4%) falling below the poverty line.
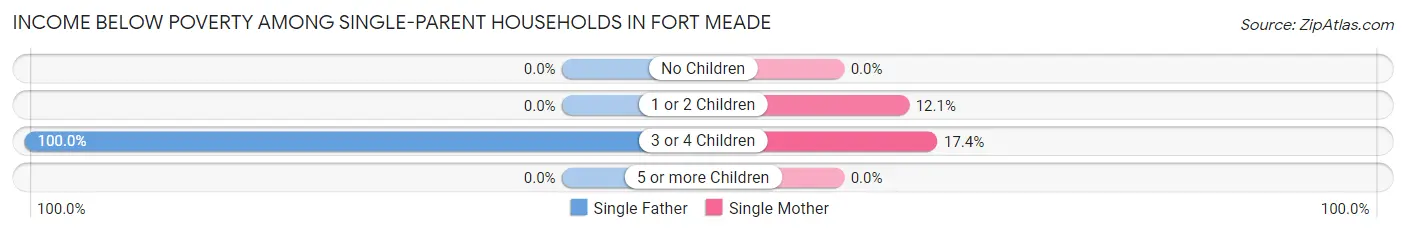
| Children | Single Father | Single Mother |
| No Children | 0 (0.0%) | 0 (0.0%) |
| 1 or 2 Children | 0 (0.0%) | 24 (12.1%) |
| 3 or 4 Children | 7 (100.0%) | 8 (17.4%) |
| 5 or more Children | 0 (0.0%) | 0 (0.0%) |
| Total | 7 (14.9%) | 32 (12.3%) |
Income Below Poverty Among Married-Couple vs Single-Parent Households in Fort Meade
The poverty data for Fort Meade shows that 47 of the married-couple family households (2.3%) and 39 of the single-parent households (12.7%) are living below the poverty level. Within the married-couple family households, those with 5 or more children have the highest poverty rate, with 12 households (52.2%) falling below the poverty line. Among the single-parent households, those with 3 or 4 children have the highest poverty rate, with 15 household (28.3%) living below poverty.
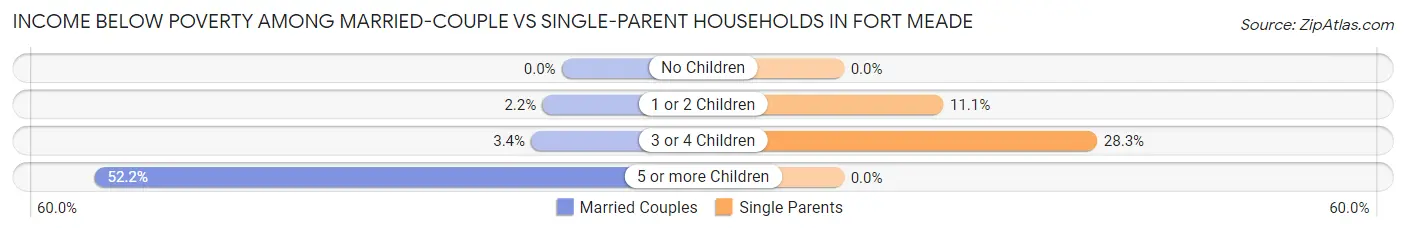
| Children | Married-Couple Families | Single-Parent Households |
| No Children | 0 (0.0%) | 0 (0.0%) |
| 1 or 2 Children | 21 (2.2%) | 24 (11.1%) |
| 3 or 4 Children | 14 (3.4%) | 15 (28.3%) |
| 5 or more Children | 12 (52.2%) | 0 (0.0%) |
| Total | 47 (2.3%) | 39 (12.7%) |
Race in Fort Meade
The most populous races in Fort Meade are White / Caucasian (4,830 | 48.2%), Black / African American (2,488 | 24.8%), and Hispanic or Latino (1,520 | 15.2%).
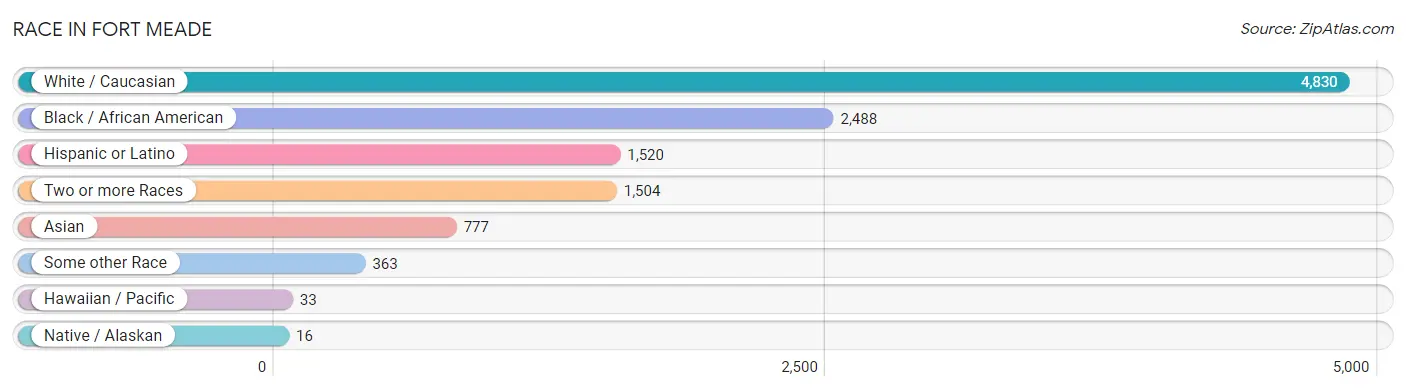
| Race | # Population | % Population |
| Asian | 777 | 7.8% |
| Black / African American | 2,488 | 24.8% |
| Hawaiian / Pacific | 33 | 0.3% |
| Hispanic or Latino | 1,520 | 15.2% |
| Native / Alaskan | 16 | 0.2% |
| White / Caucasian | 4,830 | 48.2% |
| Two or more Races | 1,504 | 15.0% |
| Some other Race | 363 | 3.6% |
| Total | 10,011 | 100.0% |
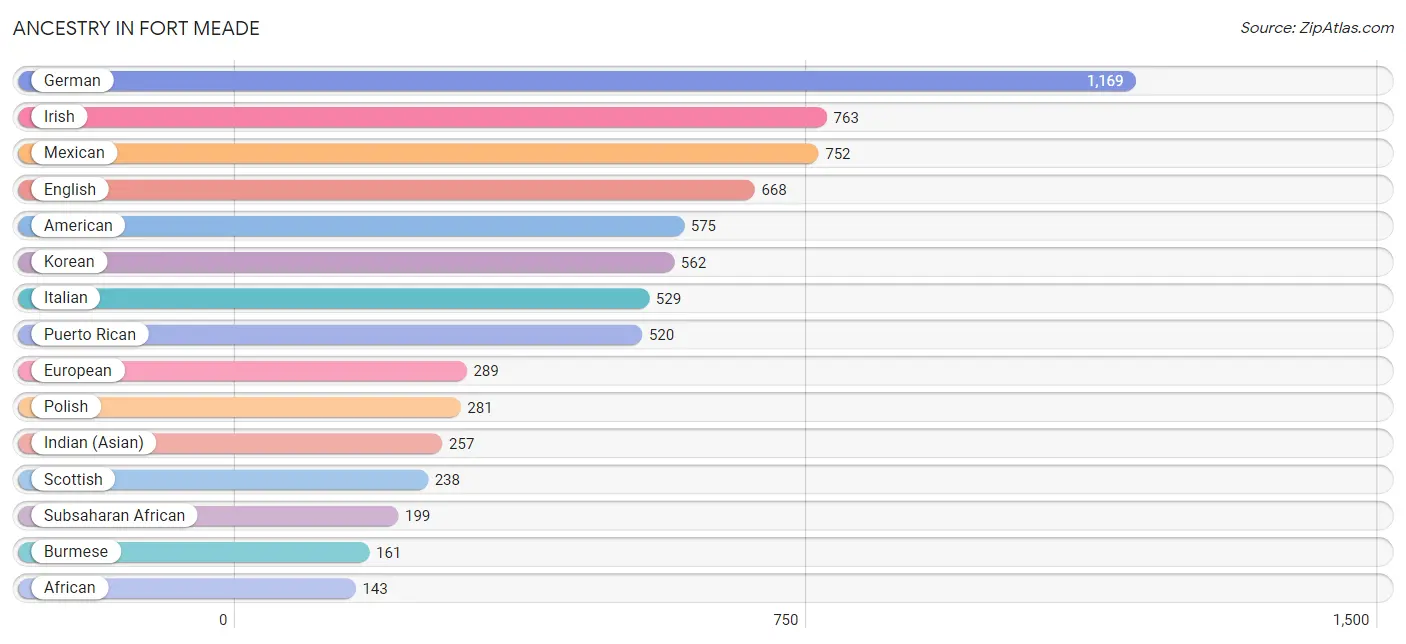
Ancestry in Fort Meade
The most populous ancestries reported in Fort Meade are German (1,169 | 11.7%), Irish (763 | 7.6%), Mexican (752 | 7.5%), English (668 | 6.7%), and American (575 | 5.7%), together accounting for 39.2% of all Fort Meade residents.
| Ancestry | # Population | % Population |
| African | 143 | 1.4% |
| Albanian | 59 | 0.6% |
| American | 575 | 5.7% |
| Apache | 10 | 0.1% |
| Arab | 30 | 0.3% |
| Armenian | 14 | 0.1% |
| Austrian | 25 | 0.3% |
| Belgian | 22 | 0.2% |
| Bhutanese | 33 | 0.3% |
| Brazilian | 36 | 0.4% |
| British | 61 | 0.6% |
| British West Indian | 6 | 0.1% |
| Burmese | 161 | 1.6% |
| Canadian | 9 | 0.1% |
| Central American | 137 | 1.4% |
| Central American Indian | 28 | 0.3% |
| Cherokee | 24 | 0.2% |
| Choctaw | 2 | 0.0% |
| Colombian | 27 | 0.3% |
| Costa Rican | 13 | 0.1% |
| Crow | 3 | 0.0% |
| Cuban | 14 | 0.1% |
| Czechoslovakian | 25 | 0.3% |
| Danish | 20 | 0.2% |
| Dutch | 28 | 0.3% |
| Egyptian | 6 | 0.1% |
| English | 668 | 6.7% |
| European | 289 | 2.9% |
| French | 143 | 1.4% |
| French Canadian | 24 | 0.2% |
| German | 1,169 | 11.7% |
| German Russian | 7 | 0.1% |
| Ghanaian | 48 | 0.5% |
| Greek | 18 | 0.2% |
| Guamanian / Chamorro | 29 | 0.3% |
| Guatemalan | 22 | 0.2% |
| Guyanese | 6 | 0.1% |
| Haitian | 5 | 0.1% |
| Honduran | 4 | 0.0% |
| Hungarian | 24 | 0.2% |
| Indian (Asian) | 257 | 2.6% |
| Iranian | 12 | 0.1% |
| Irish | 763 | 7.6% |
| Italian | 529 | 5.3% |
| Jamaican | 34 | 0.3% |
| Jordanian | 8 | 0.1% |
| Korean | 562 | 5.6% |
| Lithuanian | 14 | 0.1% |
| Macedonian | 5 | 0.1% |
| Mexican | 752 | 7.5% |
| Moroccan | 5 | 0.1% |
| Native Hawaiian | 65 | 0.6% |
| Nicaraguan | 4 | 0.0% |
| Northern European | 10 | 0.1% |
| Norwegian | 35 | 0.4% |
| Pakistani | 36 | 0.4% |
| Panamanian | 80 | 0.8% |
| Polish | 281 | 2.8% |
| Portuguese | 95 | 0.9% |
| Puerto Rican | 520 | 5.2% |
| Puget Sound Salish | 6 | 0.1% |
| Russian | 13 | 0.1% |
| Salvadoran | 14 | 0.1% |
| Scandinavian | 93 | 0.9% |
| Scotch-Irish | 68 | 0.7% |
| Scottish | 238 | 2.4% |
| Slavic | 50 | 0.5% |
| South American | 34 | 0.3% |
| Spaniard | 50 | 0.5% |
| Spanish | 8 | 0.1% |
| Sri Lankan | 55 | 0.5% |
| Subsaharan African | 199 | 2.0% |
| Swedish | 113 | 1.1% |
| Swiss | 13 | 0.1% |
| Thai | 84 | 0.8% |
| Ukrainian | 69 | 0.7% |
| Venezuelan | 7 | 0.1% |
| Welsh | 41 | 0.4% | View All 78 Rows |
Immigrants in Fort Meade
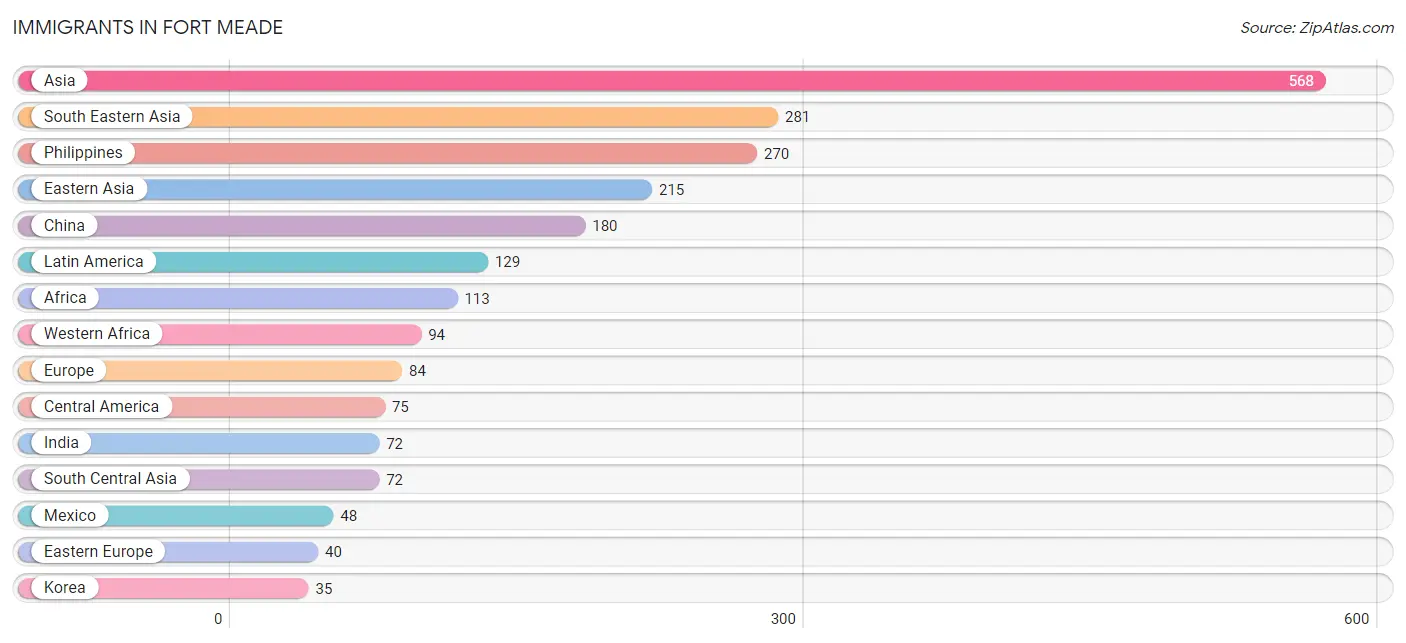
The most numerous immigrant groups reported in Fort Meade came from Asia (568 | 5.7%), South Eastern Asia (281 | 2.8%), Philippines (270 | 2.7%), Eastern Asia (215 | 2.1%), and China (180 | 1.8%), together accounting for 15.1% of all Fort Meade residents.
| Immigration Origin | # Population | % Population |
| Africa | 113 | 1.1% |
| Asia | 568 | 5.7% |
| Brazil | 25 | 0.3% |
| Cabo Verde | 4 | 0.0% |
| Canada | 4 | 0.0% |
| Caribbean | 19 | 0.2% |
| Central America | 75 | 0.7% |
| China | 180 | 1.8% |
| Colombia | 4 | 0.0% |
| Costa Rica | 13 | 0.1% |
| Cuba | 5 | 0.1% |
| Eastern Asia | 215 | 2.1% |
| Eastern Europe | 40 | 0.4% |
| Europe | 84 | 0.8% |
| Germany | 17 | 0.2% |
| Ghana | 25 | 0.3% |
| Guatemala | 10 | 0.1% |
| Guyana | 6 | 0.1% |
| India | 72 | 0.7% |
| Ireland | 14 | 0.1% |
| Jamaica | 8 | 0.1% |
| Korea | 35 | 0.4% |
| Latin America | 129 | 1.3% |
| Mexico | 48 | 0.5% |
| Morocco | 5 | 0.1% |
| Nicaragua | 4 | 0.0% |
| North Macedonia | 5 | 0.1% |
| Northern Africa | 5 | 0.1% |
| Northern Europe | 27 | 0.3% |
| Philippines | 270 | 2.7% |
| Scotland | 13 | 0.1% |
| Senegal | 15 | 0.2% |
| South America | 35 | 0.4% |
| South Central Asia | 72 | 0.7% |
| South Eastern Asia | 281 | 2.8% |
| Ukraine | 35 | 0.4% |
| Vietnam | 11 | 0.1% |
| Western Africa | 94 | 0.9% |
| Western Europe | 17 | 0.2% | View All 39 Rows |
Sex and Age in Fort Meade
Sex and Age in Fort Meade
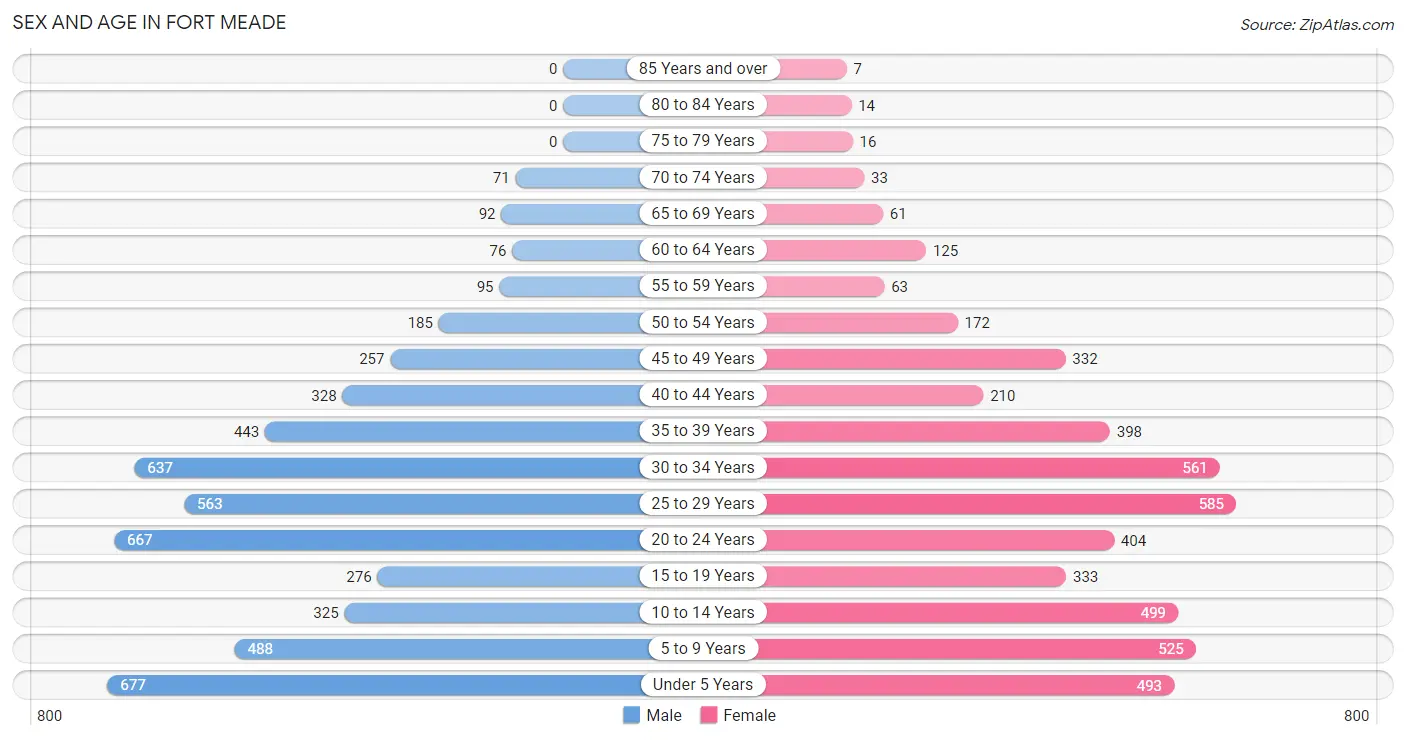
The most populous age groups in Fort Meade are Under 5 Years (677 | 13.1%) for men and 25 to 29 Years (585 | 12.1%) for women.
| Age Bracket | Male | Female |
| Under 5 Years | 677 (13.1%) | 493 (10.2%) |
| 5 to 9 Years | 488 (9.4%) | 525 (10.9%) |
| 10 to 14 Years | 325 (6.3%) | 499 (10.3%) |
| 15 to 19 Years | 276 (5.3%) | 333 (6.9%) |
| 20 to 24 Years | 667 (12.9%) | 404 (8.4%) |
| 25 to 29 Years | 563 (10.9%) | 585 (12.1%) |
| 30 to 34 Years | 637 (12.3%) | 561 (11.6%) |
| 35 to 39 Years | 443 (8.6%) | 398 (8.2%) |
| 40 to 44 Years | 328 (6.3%) | 210 (4.3%) |
| 45 to 49 Years | 257 (5.0%) | 332 (6.9%) |
| 50 to 54 Years | 185 (3.6%) | 172 (3.6%) |
| 55 to 59 Years | 95 (1.8%) | 63 (1.3%) |
| 60 to 64 Years | 76 (1.5%) | 125 (2.6%) |
| 65 to 69 Years | 92 (1.8%) | 61 (1.3%) |
| 70 to 74 Years | 71 (1.4%) | 33 (0.7%) |
| 75 to 79 Years | 0 (0.0%) | 16 (0.3%) |
| 80 to 84 Years | 0 (0.0%) | 14 (0.3%) |
| 85 Years and over | 0 (0.0%) | 7 (0.1%) |
| Total | 5,180 (100.0%) | 4,831 (100.0%) |
Families and Households in Fort Meade
Median Family Size in Fort Meade
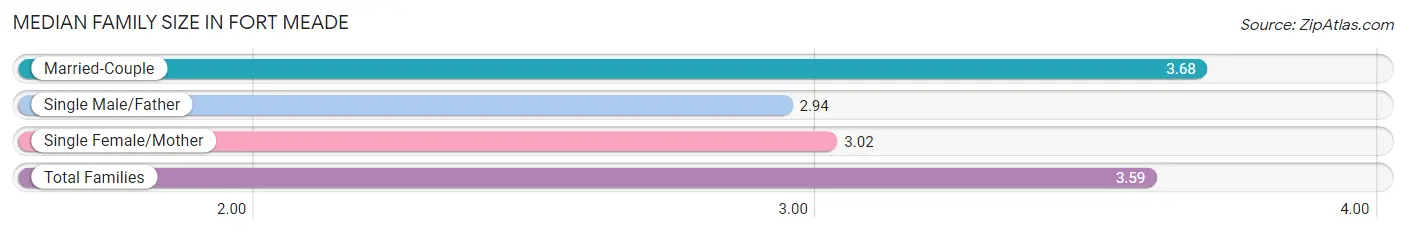
The median family size in Fort Meade is 3.59 persons per family, with married-couple families (2,031 | 86.9%) accounting for the largest median family size of 3.68 persons per family. On the other hand, single male/father families (47 | 2.0%) represent the smallest median family size with 2.94 persons per family.
| Family Type | # Families | Family Size |
| Married-Couple | 2,031 (86.9%) | 3.68 |
| Single Male/Father | 47 (2.0%) | 2.94 |
| Single Female/Mother | 260 (11.1%) | 3.02 |
| Total Families | 2,338 (100.0%) | 3.59 |
Median Household Size in Fort Meade
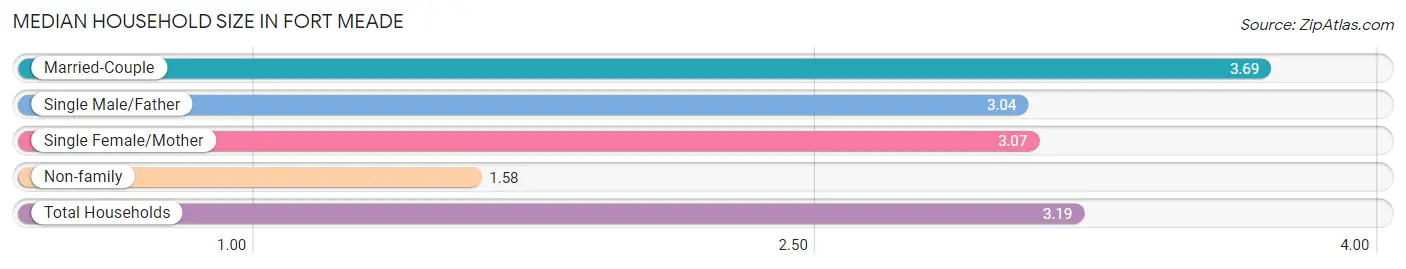
The median household size in Fort Meade is 3.19 persons per household, with married-couple households (2,031 | 69.1%) accounting for the largest median household size of 3.69 persons per household. non-family households (600 | 20.4%) represent the smallest median household size with 1.58 persons per household.
| Household Type | # Households | Household Size |
| Married-Couple | 2,031 (69.1%) | 3.69 |
| Single Male/Father | 47 (1.6%) | 3.04 |
| Single Female/Mother | 260 (8.8%) | 3.07 |
| Non-family | 600 (20.4%) | 1.58 |
| Total Households | 2,938 (100.0%) | 3.19 |
Household Size by Marriage Status in Fort Meade
Out of a total of 2,938 households in Fort Meade, 2,338 (79.6%) are family households, while 600 (20.4%) are nonfamily households. The most numerous type of family households are 3-person households, comprising 749, and the most common type of nonfamily households are 1-person households, comprising 300.
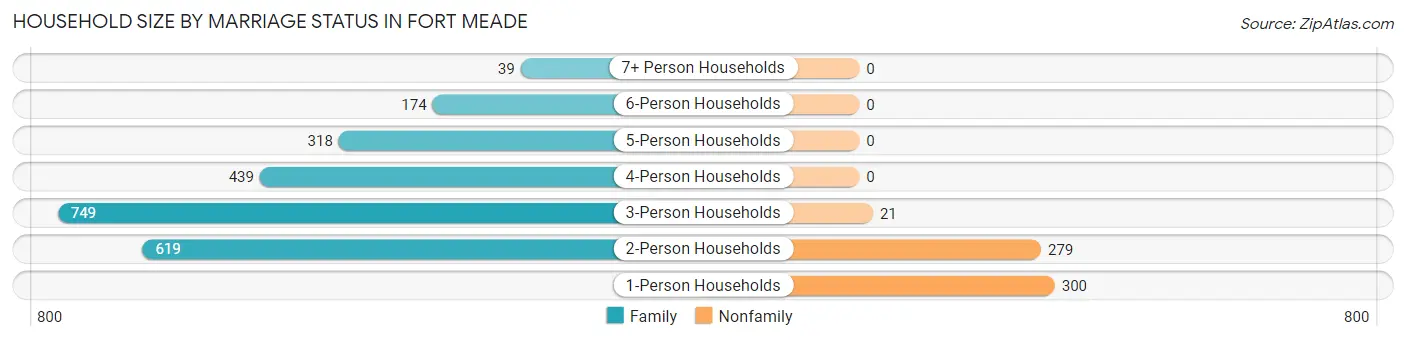
| Household Size | Family Households | Nonfamily Households |
| 1-Person Households | - | 300 (10.2%) |
| 2-Person Households | 619 (21.1%) | 279 (9.5%) |
| 3-Person Households | 749 (25.5%) | 21 (0.7%) |
| 4-Person Households | 439 (14.9%) | 0 (0.0%) |
| 5-Person Households | 318 (10.8%) | 0 (0.0%) |
| 6-Person Households | 174 (5.9%) | 0 (0.0%) |
| 7+ Person Households | 39 (1.3%) | 0 (0.0%) |
| Total | 2,338 (79.6%) | 600 (20.4%) |
Female Fertility in Fort Meade
Fertility by Age in Fort Meade
Average fertility rate in Fort Meade is 87.0 births per 1,000 women. Women in the age bracket of 20 to 34 years have the highest fertility rate with 132.0 births per 1,000 women. Women in the age bracket of 20 to 34 years acount for 82.0% of all women with births.
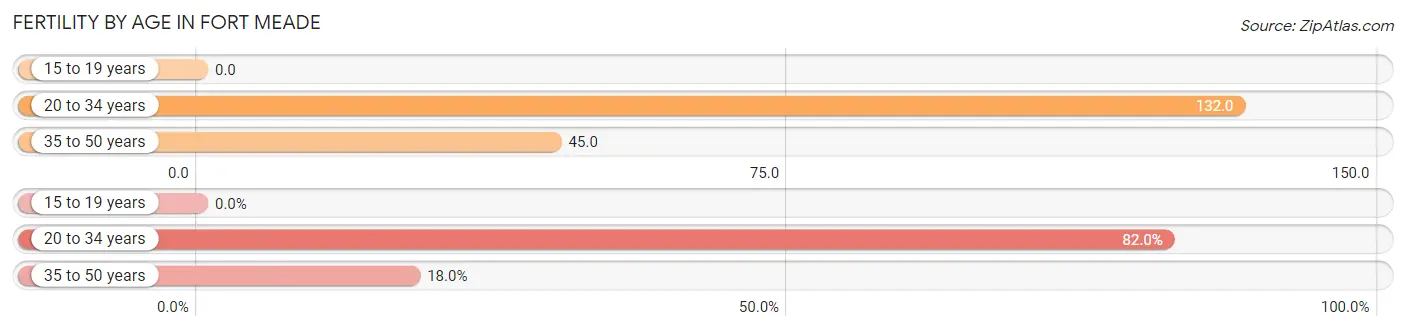
| Age Bracket | Women with Births | Births / 1,000 Women |
| 15 to 19 years | 0 (0.0%) | 0.0 |
| 20 to 34 years | 205 (82.0%) | 132.0 |
| 35 to 50 years | 45 (18.0%) | 45.0 |
| Total | 250 (100.0%) | 87.0 |
Fertility by Age by Marriage Status in Fort Meade
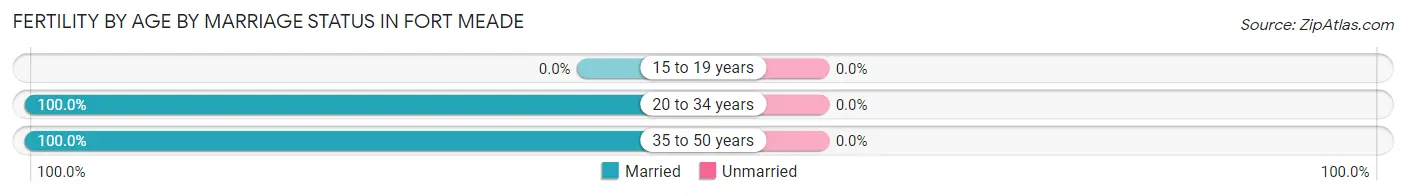
| Age Bracket | Married | Unmarried |
| 15 to 19 years | 0 (0.0%) | 0 (0.0%) |
| 20 to 34 years | 205 (100.0%) | 0 (0.0%) |
| 35 to 50 years | 45 (100.0%) | 0 (0.0%) |
| Total | 250 (100.0%) | 0 (0.0%) |
Fertility by Education in Fort Meade
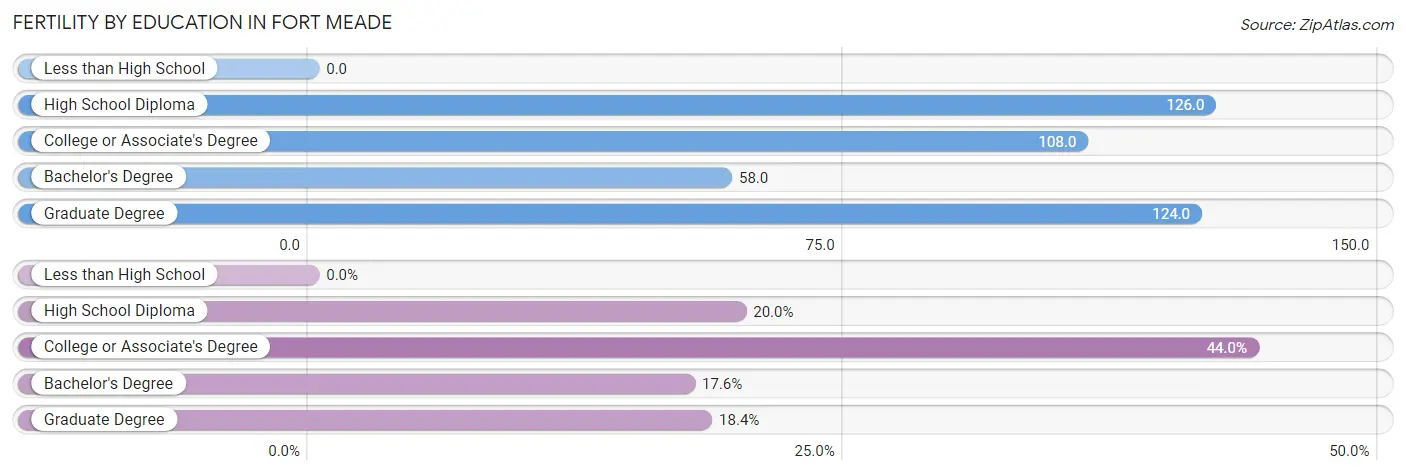
| Educational Attainment | Women with Births | Births / 1,000 Women |
| Less than High School | 0 (0.0%) | 0.0 |
| High School Diploma | 50 (20.0%) | 126.0 |
| College or Associate's Degree | 110 (44.0%) | 108.0 |
| Bachelor's Degree | 44 (17.6%) | 58.0 |
| Graduate Degree | 46 (18.4%) | 124.0 |
| Total | 250 (100.0%) | 87.0 |
Fertility by Education by Marriage Status in Fort Meade
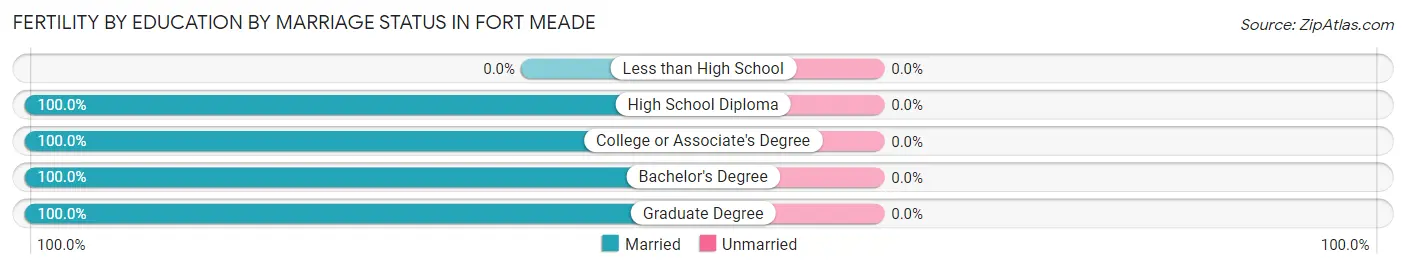
| Educational Attainment | Married | Unmarried |
| Less than High School | 0 (0.0%) | 0 (0.0%) |
| High School Diploma | 50 (100.0%) | 0 (0.0%) |
| College or Associate's Degree | 110 (100.0%) | 0 (0.0%) |
| Bachelor's Degree | 44 (100.0%) | 0 (0.0%) |
| Graduate Degree | 46 (100.0%) | 0 (0.0%) |
| Total | 250 (100.0%) | 0 (0.0%) |
Employment Characteristics in Fort Meade
Employment by Class of Employer in Fort Meade
Among the 4,879 employed individuals in Fort Meade, federal government employees (3,542 | 72.6%), private company employees (1,090 | 22.3%), and self-employed (not incorporated) (104 | 2.1%) make up the most common classes of employment.
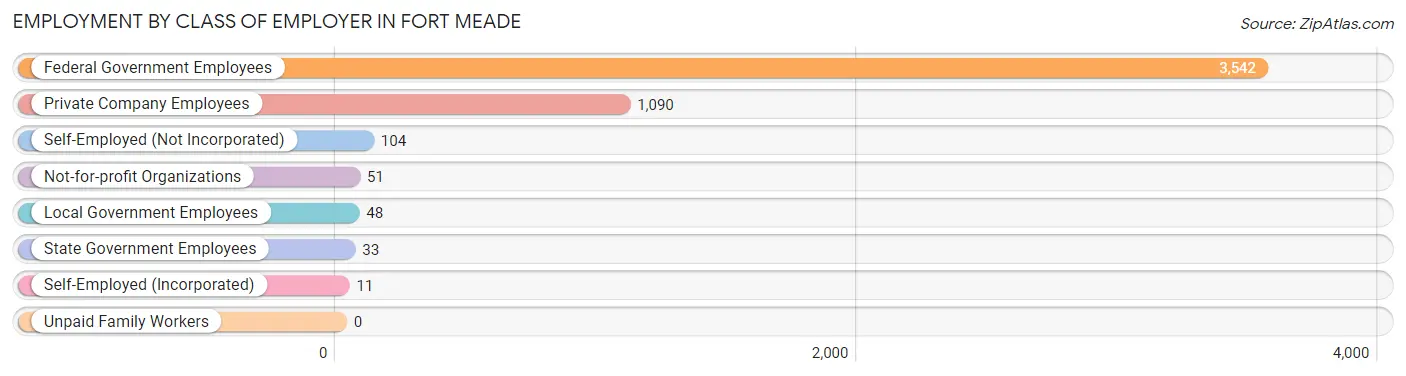
| Employer Class | # Employees | % Employees |
| Private Company Employees | 1,090 | 22.3% |
| Self-Employed (Incorporated) | 11 | 0.2% |
| Self-Employed (Not Incorporated) | 104 | 2.1% |
| Not-for-profit Organizations | 51 | 1.1% |
| Local Government Employees | 48 | 1.0% |
| State Government Employees | 33 | 0.7% |
| Federal Government Employees | 3,542 | 72.6% |
| Unpaid Family Workers | 0 | 0.0% |
| Total | 4,879 | 100.0% |
Employment Status by Age in Fort Meade
According to the labor force statistics for Fort Meade, out of the total population over 16 years of age (6,922), 72.8% or 5,039 individuals are in the labor force, with 4.6% or 232 of them unemployed. The age group with the highest labor force participation rate is 55 to 59 years, with 86.1% or 136 individuals in the labor force. Within the labor force, the 16 to 19 years age range has the highest percentage of unemployed individuals, with 12.1% or 29 of them being unemployed.
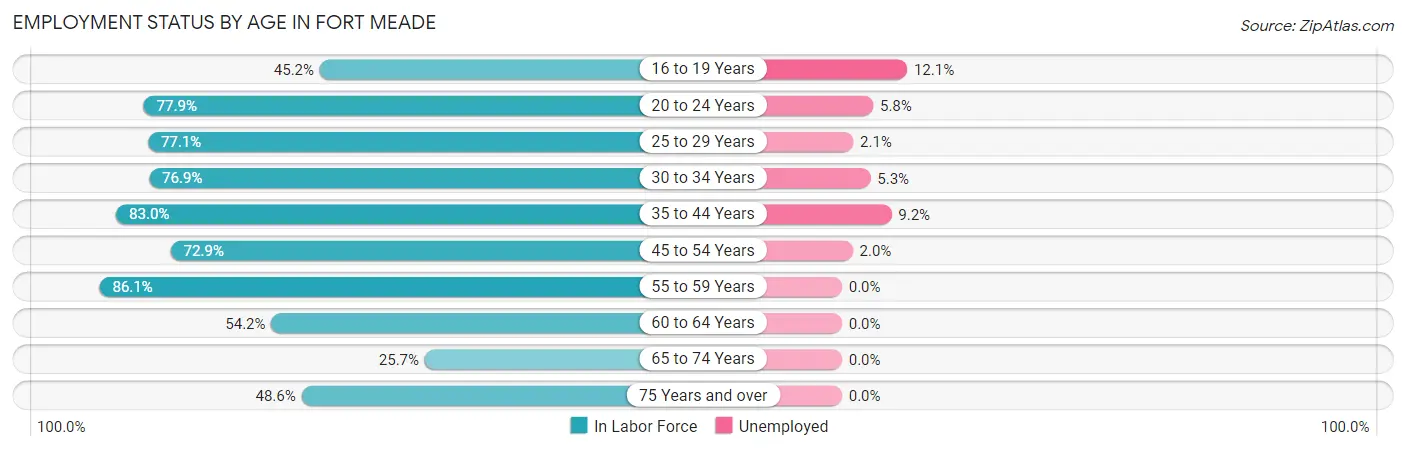
| Age Bracket | In Labor Force | Unemployed |
| 16 to 19 Years | 238 (45.2%) | 29 (12.1%) |
| 20 to 24 Years | 834 (77.9%) | 48 (5.8%) |
| 25 to 29 Years | 885 (77.1%) | 19 (2.1%) |
| 30 to 34 Years | 921 (76.9%) | 49 (5.3%) |
| 35 to 44 Years | 1,145 (83.0%) | 105 (9.2%) |
| 45 to 54 Years | 690 (72.9%) | 14 (2.0%) |
| 55 to 59 Years | 136 (86.1%) | 0 (0.0%) |
| 60 to 64 Years | 109 (54.2%) | 0 (0.0%) |
| 65 to 74 Years | 66 (25.7%) | 0 (0.0%) |
| 75 Years and over | 18 (48.6%) | 0 (0.0%) |
| Total | 5,039 (72.8%) | 232 (4.6%) |
Employment Status by Educational Attainment in Fort Meade
According to labor force statistics for Fort Meade, 77.3% of individuals (3,888) out of the total population between 25 and 64 years of age (5,030) are in the labor force, with 4.3% or 167 of them being unemployed. The group with the highest labor force participation rate are those with the educational attainment of college / associate degree, with 84.7% or 1,830 individuals in the labor force. Within the labor force, individuals with high school diploma education have the highest percentage of unemployment, with 10.3% or 26 of them being unemployed.
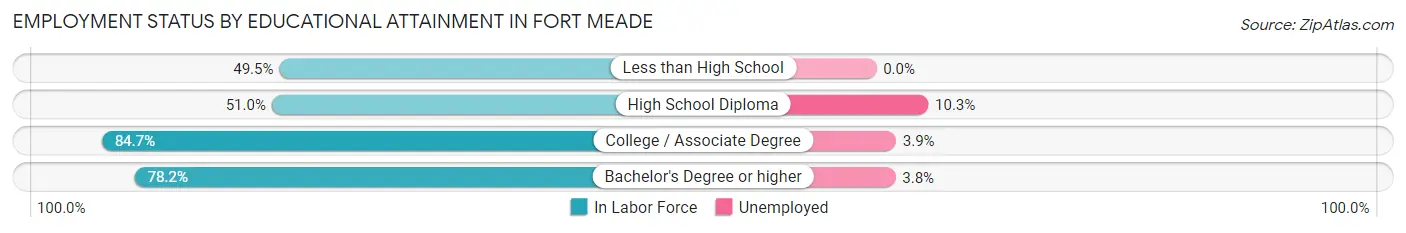
| Educational Attainment | In Labor Force | Unemployed |
| Less than High School | 90 (49.5%) | 0 (0.0%) |
| High School Diploma | 254 (51.0%) | 51 (10.3%) |
| College / Associate Degree | 1,830 (84.7%) | 84 (3.9%) |
| Bachelor's Degree or higher | 1,712 (78.2%) | 83 (3.8%) |
| Total | 3,888 (77.3%) | 216 (4.3%) |
Employment Occupations by Sex in Fort Meade
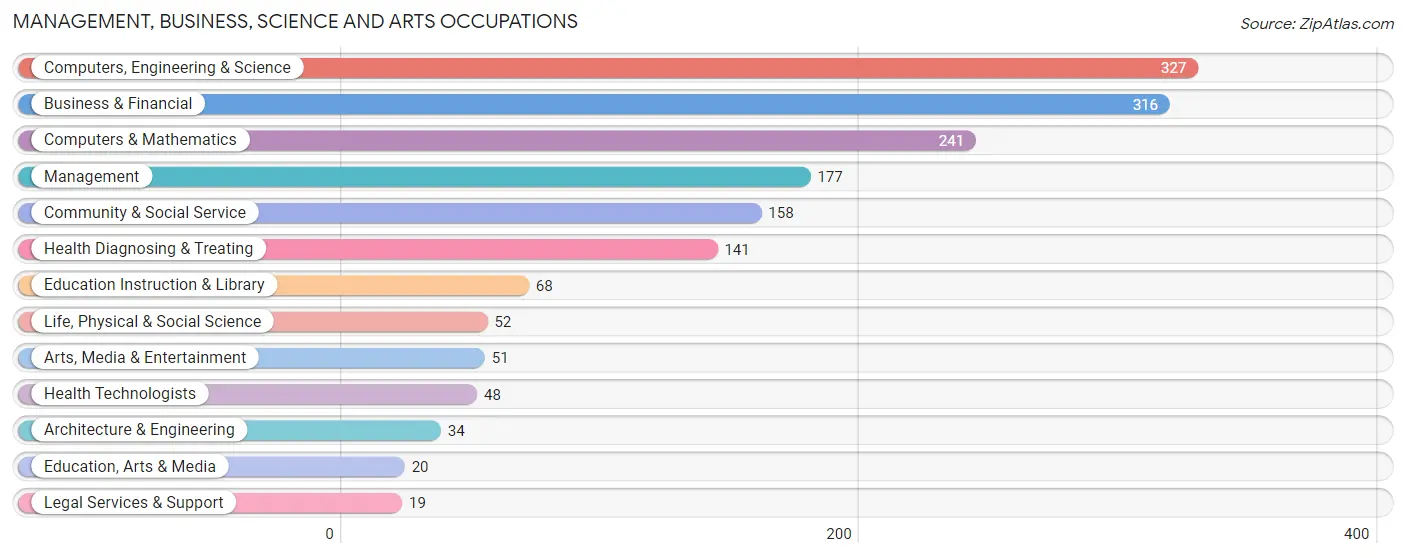
Management, Business, Science and Arts Occupations
The most common Management, Business, Science and Arts occupations in Fort Meade are Computers, Engineering & Science (327 | 13.7%), Business & Financial (316 | 13.3%), Computers & Mathematics (241 | 10.1%), Management (177 | 7.4%), and Community & Social Service (158 | 6.6%).
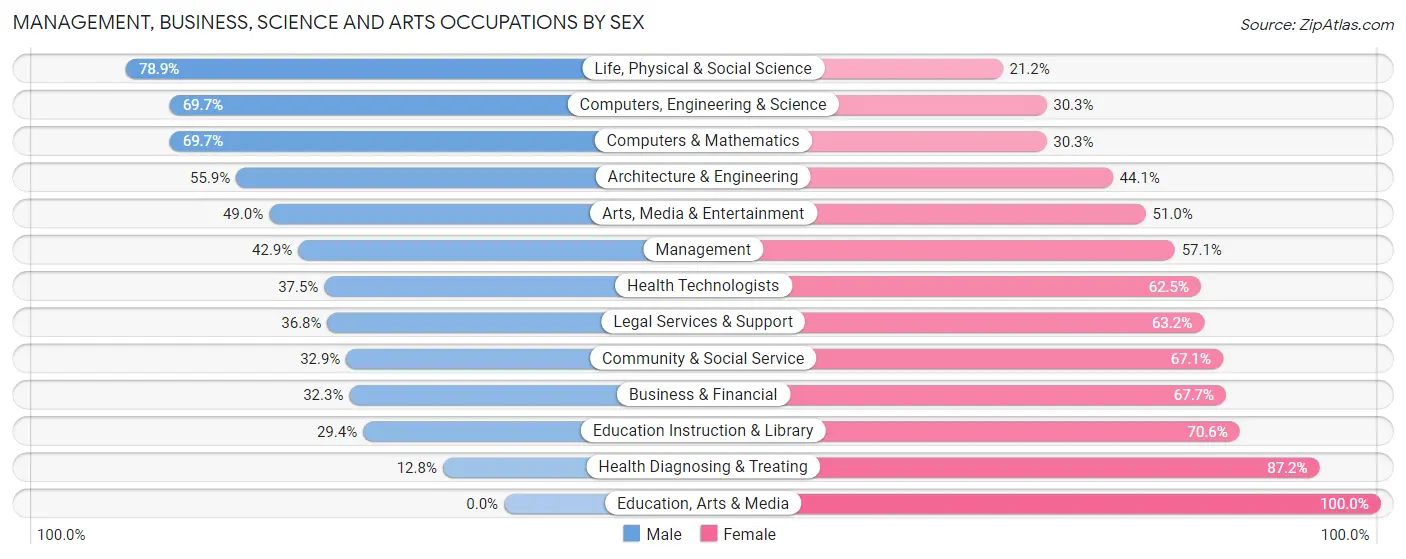
Management, Business, Science and Arts Occupations by Sex
Within the Management, Business, Science and Arts occupations in Fort Meade, the most male-oriented occupations are Life, Physical & Social Science (78.8%), Computers, Engineering & Science (69.7%), and Computers & Mathematics (69.7%), while the most female-oriented occupations are Education, Arts & Media (100.0%), Health Diagnosing & Treating (87.2%), and Education Instruction & Library (70.6%).
| Occupation | Male | Female |
| Management | 76 (42.9%) | 101 (57.1%) |
| Business & Financial | 102 (32.3%) | 214 (67.7%) |
| Computers, Engineering & Science | 228 (69.7%) | 99 (30.3%) |
| Computers & Mathematics | 168 (69.7%) | 73 (30.3%) |
| Architecture & Engineering | 19 (55.9%) | 15 (44.1%) |
| Life, Physical & Social Science | 41 (78.8%) | 11 (21.1%) |
| Community & Social Service | 52 (32.9%) | 106 (67.1%) |
| Education, Arts & Media | 0 (0.0%) | 20 (100.0%) |
| Legal Services & Support | 7 (36.8%) | 12 (63.2%) |
| Education Instruction & Library | 20 (29.4%) | 48 (70.6%) |
| Arts, Media & Entertainment | 25 (49.0%) | 26 (51.0%) |
| Health Diagnosing & Treating | 18 (12.8%) | 123 (87.2%) |
| Health Technologists | 18 (37.5%) | 30 (62.5%) |
| Total (Category) | 476 (42.5%) | 643 (57.5%) |
| Total (Overall) | 1,037 (43.5%) | 1,347 (56.5%) |
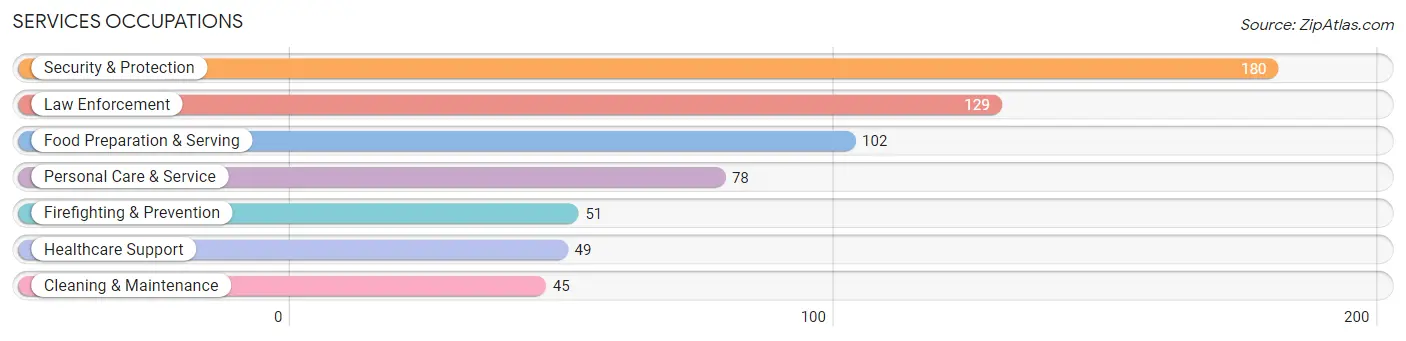
Services Occupations
The most common Services occupations in Fort Meade are Security & Protection (180 | 7.5%), Law Enforcement (129 | 5.4%), Food Preparation & Serving (102 | 4.3%), Personal Care & Service (78 | 3.3%), and Firefighting & Prevention (51 | 2.1%).
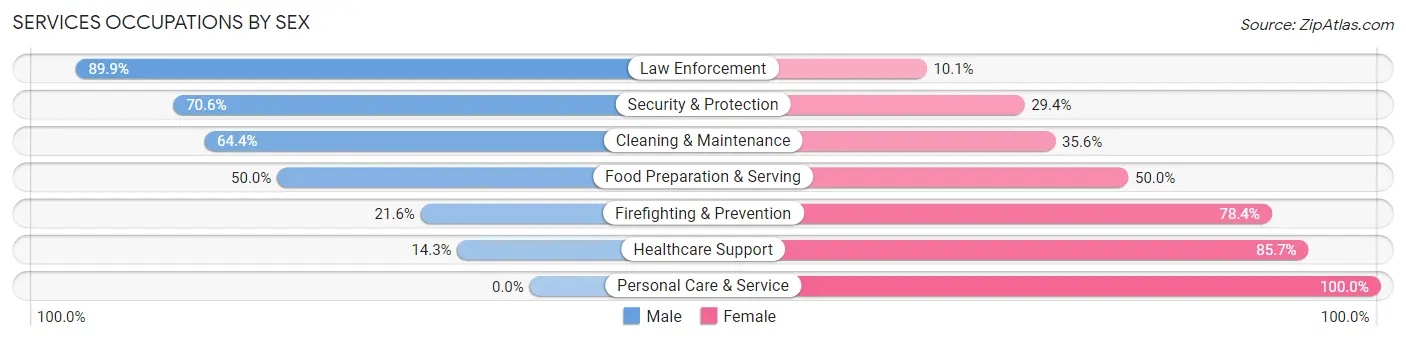
Services Occupations by Sex
Within the Services occupations in Fort Meade, the most male-oriented occupations are Law Enforcement (89.9%), Security & Protection (70.6%), and Cleaning & Maintenance (64.4%), while the most female-oriented occupations are Personal Care & Service (100.0%), Healthcare Support (85.7%), and Firefighting & Prevention (78.4%).
| Occupation | Male | Female |
| Healthcare Support | 7 (14.3%) | 42 (85.7%) |
| Security & Protection | 127 (70.6%) | 53 (29.4%) |
| Firefighting & Prevention | 11 (21.6%) | 40 (78.4%) |
| Law Enforcement | 116 (89.9%) | 13 (10.1%) |
| Food Preparation & Serving | 51 (50.0%) | 51 (50.0%) |
| Cleaning & Maintenance | 29 (64.4%) | 16 (35.6%) |
| Personal Care & Service | 0 (0.0%) | 78 (100.0%) |
| Total (Category) | 214 (47.1%) | 240 (52.9%) |
| Total (Overall) | 1,037 (43.5%) | 1,347 (56.5%) |
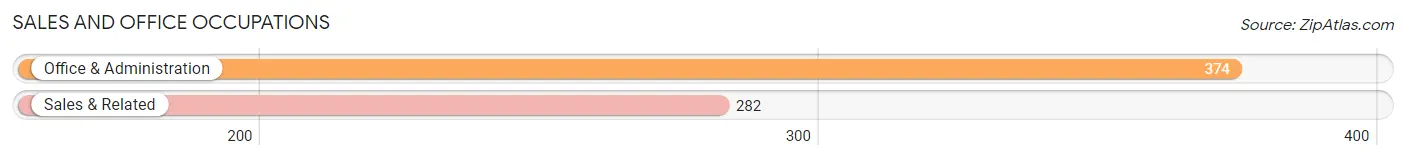
Sales and Office Occupations
The most common Sales and Office occupations in Fort Meade are Office & Administration (374 | 15.7%), and Sales & Related (282 | 11.8%).
Sales and Office Occupations by Sex
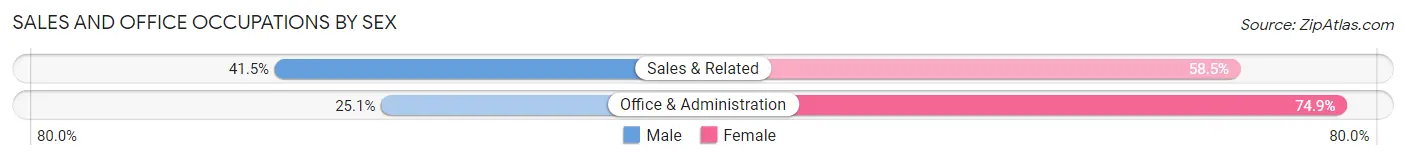
| Occupation | Male | Female |
| Sales & Related | 117 (41.5%) | 165 (58.5%) |
| Office & Administration | 94 (25.1%) | 280 (74.9%) |
| Total (Category) | 211 (32.2%) | 445 (67.8%) |
| Total (Overall) | 1,037 (43.5%) | 1,347 (56.5%) |
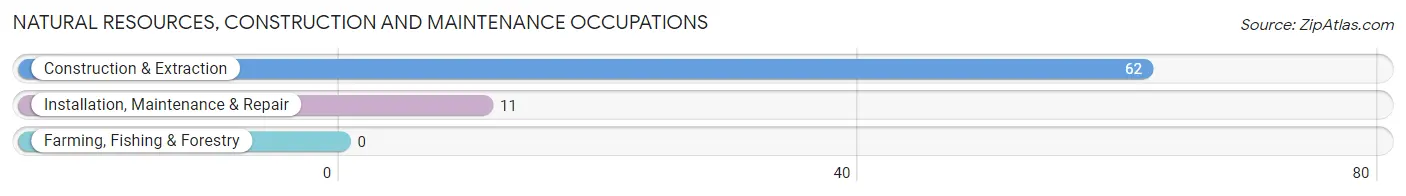
Natural Resources, Construction and Maintenance Occupations
The most common Natural Resources, Construction and Maintenance occupations in Fort Meade are Construction & Extraction (62 | 2.6%), and Installation, Maintenance & Repair (11 | 0.5%).
Natural Resources, Construction and Maintenance Occupations by Sex
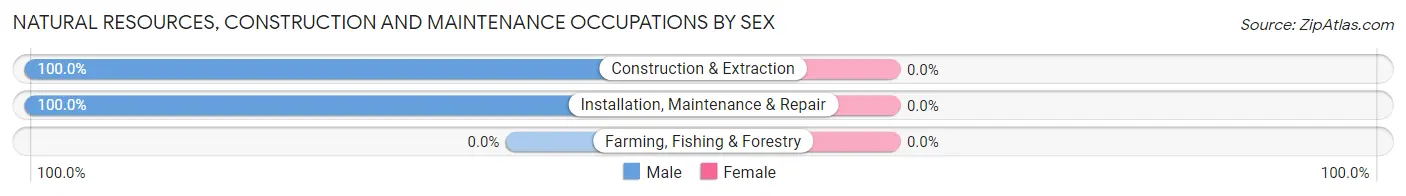
| Occupation | Male | Female |
| Farming, Fishing & Forestry | 0 (0.0%) | 0 (0.0%) |
| Construction & Extraction | 62 (100.0%) | 0 (0.0%) |
| Installation, Maintenance & Repair | 11 (100.0%) | 0 (0.0%) |
| Total (Category) | 73 (100.0%) | 0 (0.0%) |
| Total (Overall) | 1,037 (43.5%) | 1,347 (56.5%) |
Production, Transportation and Moving Occupations
The most common Production, Transportation and Moving occupations in Fort Meade are Production (48 | 2.0%), Material Moving (24 | 1.0%), and Transportation (10 | 0.4%).
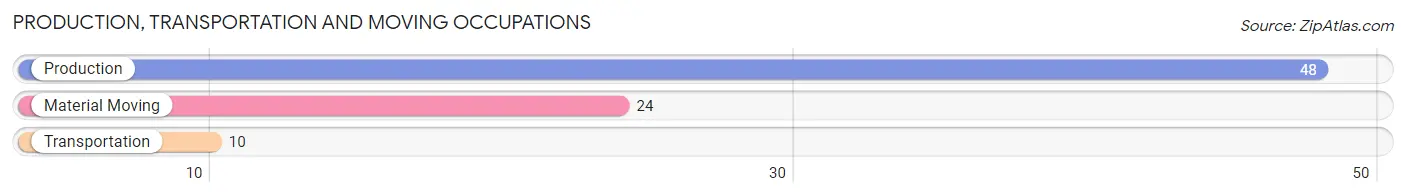
Production, Transportation and Moving Occupations by Sex
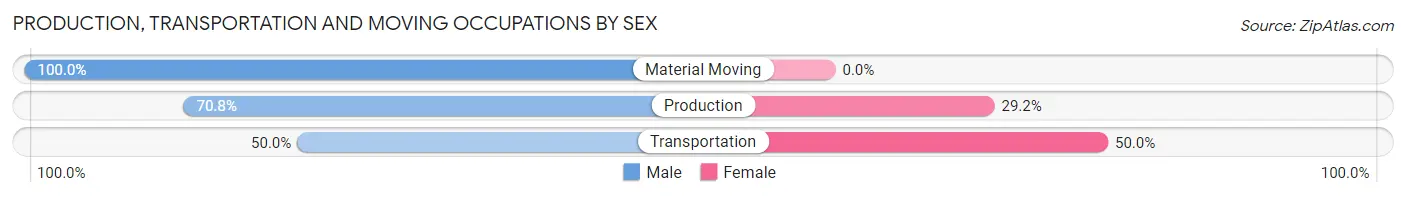
| Occupation | Male | Female |
| Production | 34 (70.8%) | 14 (29.2%) |
| Transportation | 5 (50.0%) | 5 (50.0%) |
| Material Moving | 24 (100.0%) | 0 (0.0%) |
| Total (Category) | 63 (76.8%) | 19 (23.2%) |
| Total (Overall) | 1,037 (43.5%) | 1,347 (56.5%) |
Employment Industries by Sex in Fort Meade
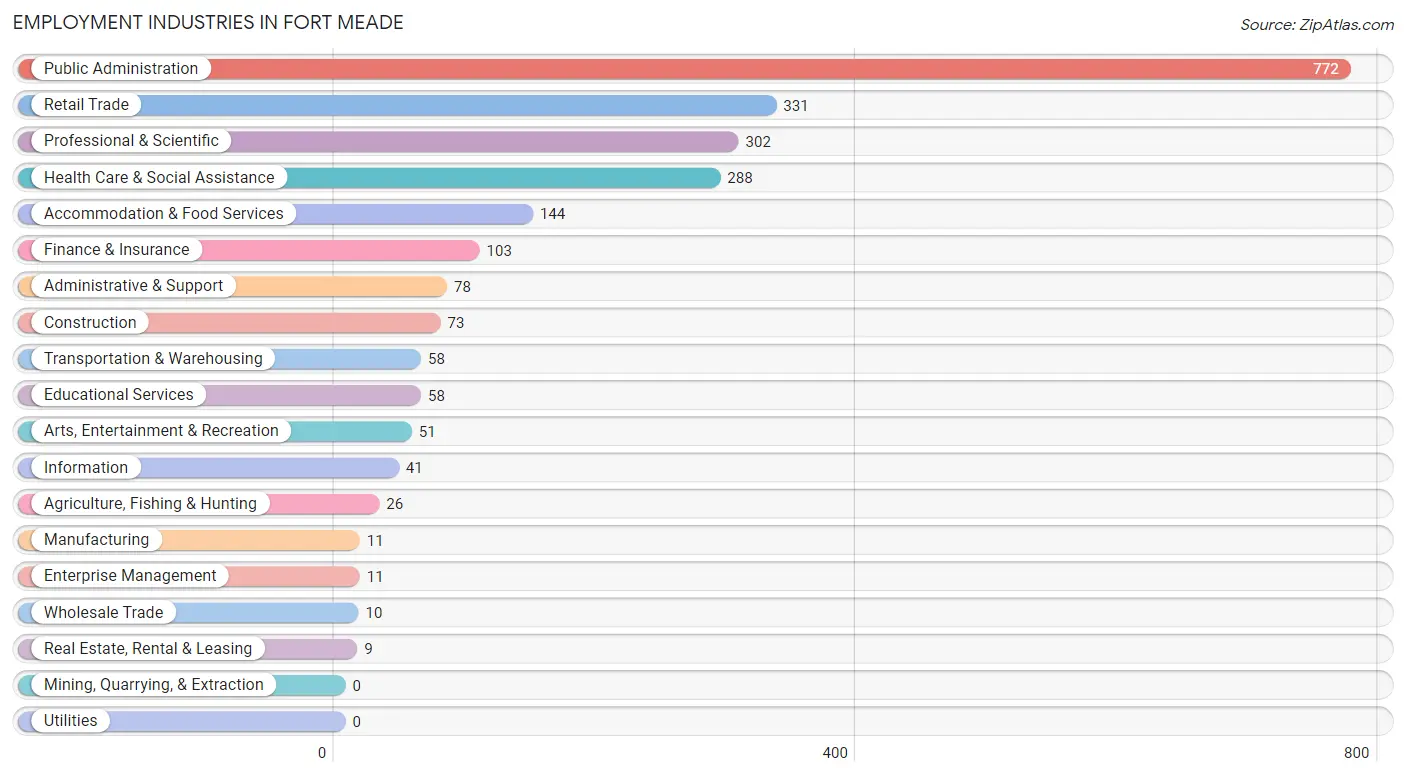
Employment Industries in Fort Meade
The major employment industries in Fort Meade include Public Administration (772 | 32.4%), Retail Trade (331 | 13.9%), Professional & Scientific (302 | 12.7%), Health Care & Social Assistance (288 | 12.1%), and Accommodation & Food Services (144 | 6.0%).
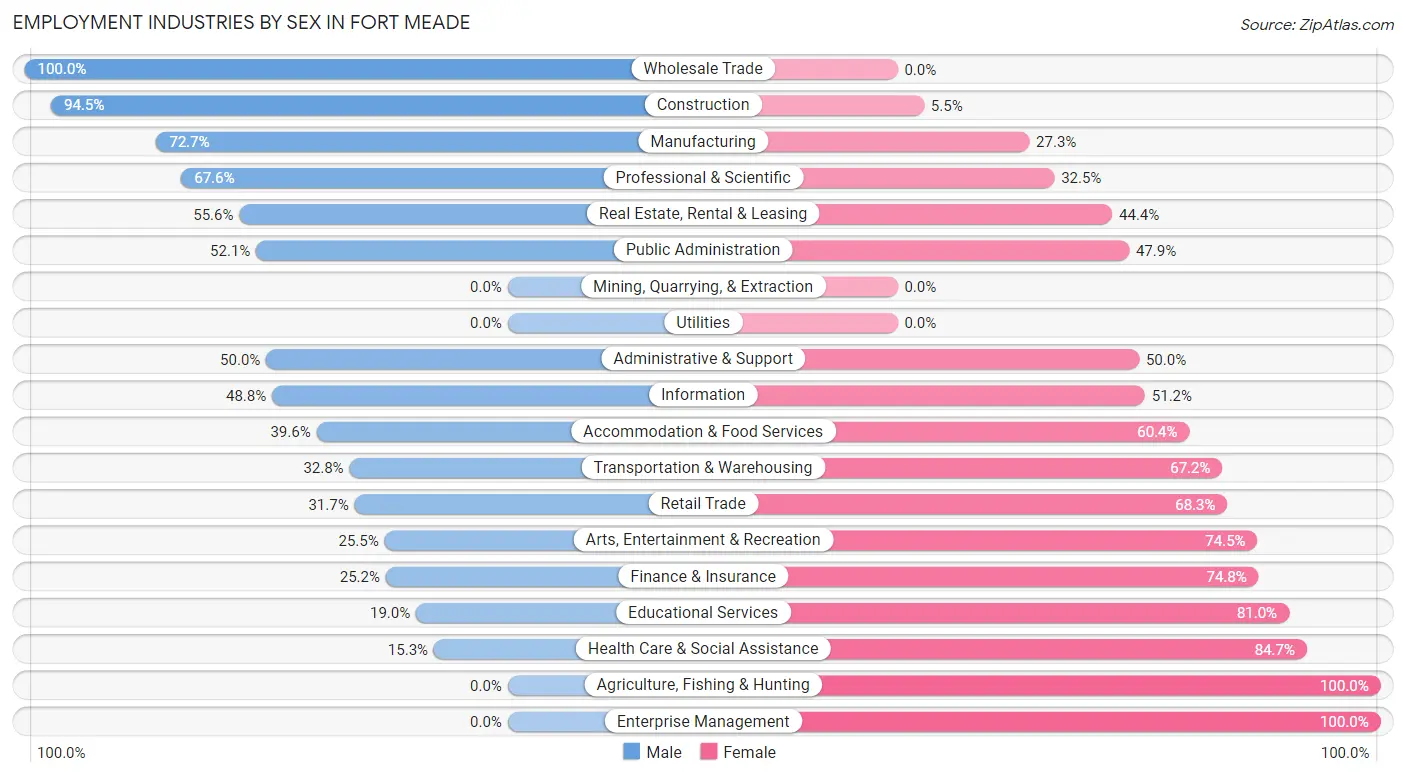
Employment Industries by Sex in Fort Meade
The Fort Meade industries that see more men than women are Wholesale Trade (100.0%), Construction (94.5%), and Manufacturing (72.7%), whereas the industries that tend to have a higher number of women are Agriculture, Fishing & Hunting (100.0%), Enterprise Management (100.0%), and Health Care & Social Assistance (84.7%).
| Industry | Male | Female |
| Agriculture, Fishing & Hunting | 0 (0.0%) | 26 (100.0%) |
| Mining, Quarrying, & Extraction | 0 (0.0%) | 0 (0.0%) |
| Construction | 69 (94.5%) | 4 (5.5%) |
| Manufacturing | 8 (72.7%) | 3 (27.3%) |
| Wholesale Trade | 10 (100.0%) | 0 (0.0%) |
| Retail Trade | 105 (31.7%) | 226 (68.3%) |
| Transportation & Warehousing | 19 (32.8%) | 39 (67.2%) |
| Utilities | 0 (0.0%) | 0 (0.0%) |
| Information | 20 (48.8%) | 21 (51.2%) |
| Finance & Insurance | 26 (25.2%) | 77 (74.8%) |
| Real Estate, Rental & Leasing | 5 (55.6%) | 4 (44.4%) |
| Professional & Scientific | 204 (67.5%) | 98 (32.5%) |
| Enterprise Management | 0 (0.0%) | 11 (100.0%) |
| Administrative & Support | 39 (50.0%) | 39 (50.0%) |
| Educational Services | 11 (19.0%) | 47 (81.0%) |
| Health Care & Social Assistance | 44 (15.3%) | 244 (84.7%) |
| Arts, Entertainment & Recreation | 13 (25.5%) | 38 (74.5%) |
| Accommodation & Food Services | 57 (39.6%) | 87 (60.4%) |
| Public Administration | 402 (52.1%) | 370 (47.9%) |
| Total | 1,037 (43.5%) | 1,347 (56.5%) |
Education in Fort Meade
School Enrollment in Fort Meade
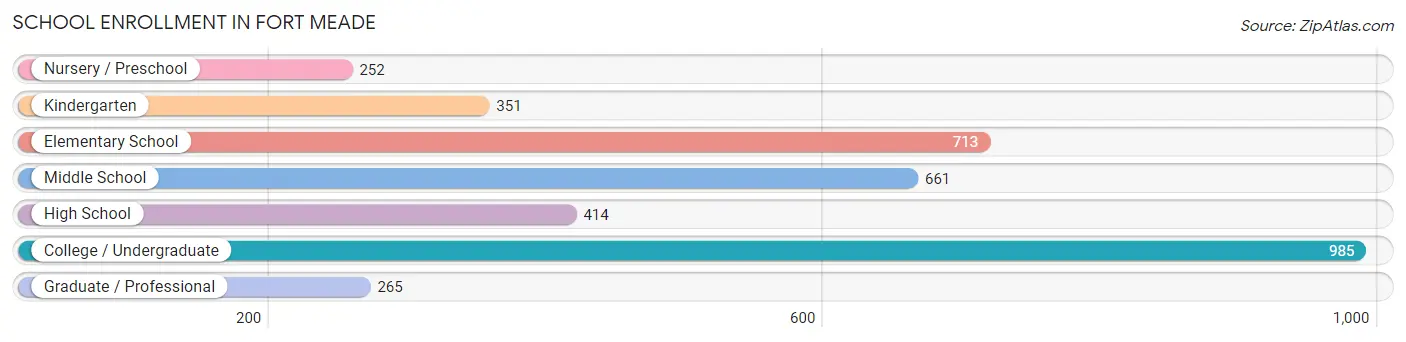
The most common levels of schooling among the 3,641 students in Fort Meade are college / undergraduate (985 | 27.1%), elementary school (713 | 19.6%), and middle school (661 | 18.1%).
| School Level | # Students | % Students |
| Nursery / Preschool | 252 | 6.9% |
| Kindergarten | 351 | 9.6% |
| Elementary School | 713 | 19.6% |
| Middle School | 661 | 18.1% |
| High School | 414 | 11.4% |
| College / Undergraduate | 985 | 27.1% |
| Graduate / Professional | 265 | 7.3% |
| Total | 3,641 | 100.0% |
School Enrollment by Age by Funding Source in Fort Meade
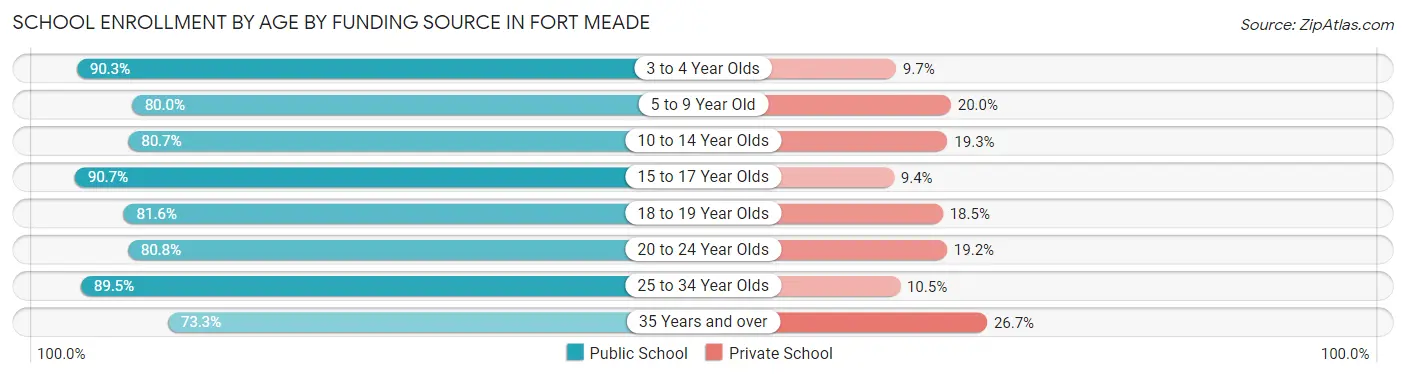
Out of a total of 3,641 students who are enrolled in schools in Fort Meade, 626 (17.2%) attend a private institution, while the remaining 3,015 (82.8%) are enrolled in public schools. The age group of 35 years and over has the highest likelihood of being enrolled in private schools, with 63 (26.7% in the age bracket) enrolled. Conversely, the age group of 15 to 17 year olds has the lowest likelihood of being enrolled in a private school, with 281 (90.6% in the age bracket) attending a public institution.
| Age Bracket | Public School | Private School |
| 3 to 4 Year Olds | 167 (90.3%) | 18 (9.7%) |
| 5 to 9 Year Old | 786 (80.0%) | 196 (20.0%) |
| 10 to 14 Year Olds | 660 (80.7%) | 158 (19.3%) |
| 15 to 17 Year Olds | 281 (90.6%) | 29 (9.3%) |
| 18 to 19 Year Olds | 84 (81.6%) | 19 (18.4%) |
| 20 to 24 Year Olds | 336 (80.8%) | 80 (19.2%) |
| 25 to 34 Year Olds | 529 (89.5%) | 62 (10.5%) |
| 35 Years and over | 173 (73.3%) | 63 (26.7%) |
| Total | 3,015 (82.8%) | 626 (17.2%) |
Educational Attainment by Field of Study in Fort Meade
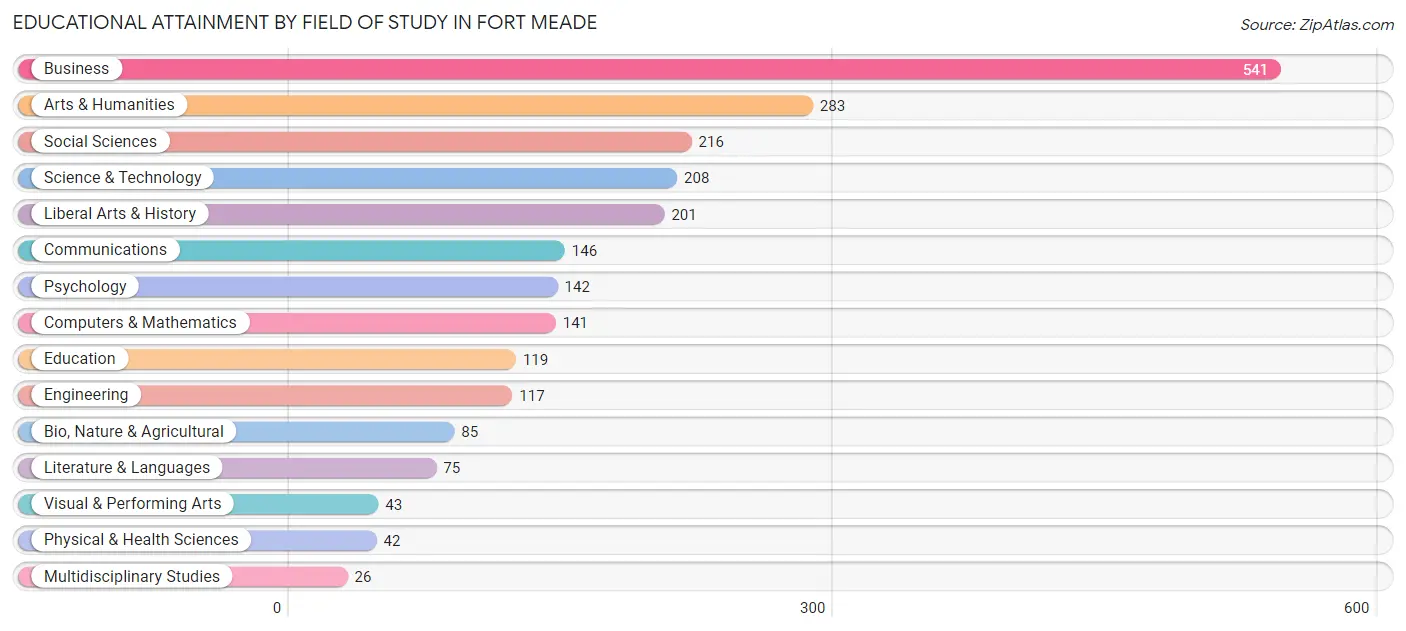
Business (541 | 22.7%), arts & humanities (283 | 11.9%), social sciences (216 | 9.1%), science & technology (208 | 8.7%), and liberal arts & history (201 | 8.4%) are the most common fields of study among 2,385 individuals in Fort Meade who have obtained a bachelor's degree or higher.
| Field of Study | # Graduates | % Graduates |
| Computers & Mathematics | 141 | 5.9% |
| Bio, Nature & Agricultural | 85 | 3.6% |
| Physical & Health Sciences | 42 | 1.8% |
| Psychology | 142 | 5.9% |
| Social Sciences | 216 | 9.1% |
| Engineering | 117 | 4.9% |
| Multidisciplinary Studies | 26 | 1.1% |
| Science & Technology | 208 | 8.7% |
| Business | 541 | 22.7% |
| Education | 119 | 5.0% |
| Literature & Languages | 75 | 3.1% |
| Liberal Arts & History | 201 | 8.4% |
| Visual & Performing Arts | 43 | 1.8% |
| Communications | 146 | 6.1% |
| Arts & Humanities | 283 | 11.9% |
| Total | 2,385 | 100.0% |
Transportation & Commute in Fort Meade
Vehicle Availability by Sex in Fort Meade
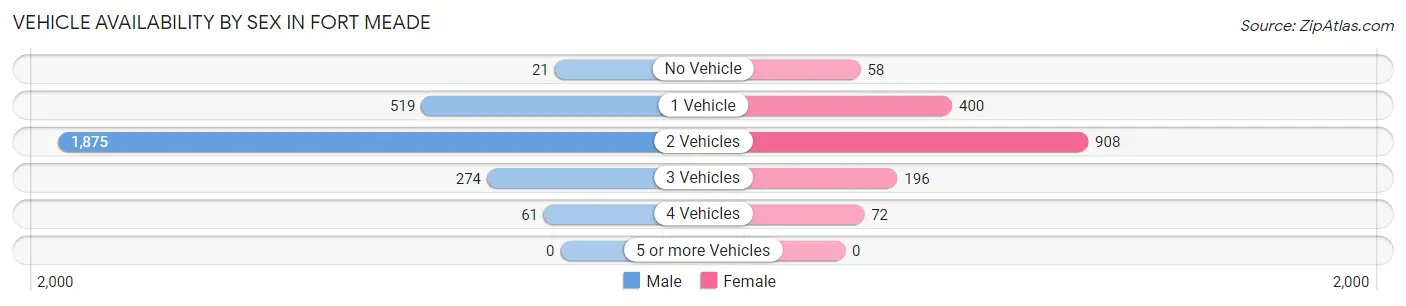
The most prevalent vehicle ownership categories in Fort Meade are males with 2 vehicles (1,875, accounting for 68.2%) and females with 2 vehicles (908, making up 114.7%).
| Vehicles Available | Male | Female |
| No Vehicle | 21 (0.8%) | 58 (3.5%) |
| 1 Vehicle | 519 (18.9%) | 400 (24.5%) |
| 2 Vehicles | 1,875 (68.2%) | 908 (55.6%) |
| 3 Vehicles | 274 (10.0%) | 196 (12.0%) |
| 4 Vehicles | 61 (2.2%) | 72 (4.4%) |
| 5 or more Vehicles | 0 (0.0%) | 0 (0.0%) |
| Total | 2,750 (100.0%) | 1,634 (100.0%) |
Commute Time in Fort Meade
The most frequently occuring commute durations in Fort Meade are 5 to 9 minutes (1,021 commuters, 22.6%), 15 to 19 minutes (911 commuters, 20.1%), and 10 to 14 minutes (901 commuters, 19.9%).
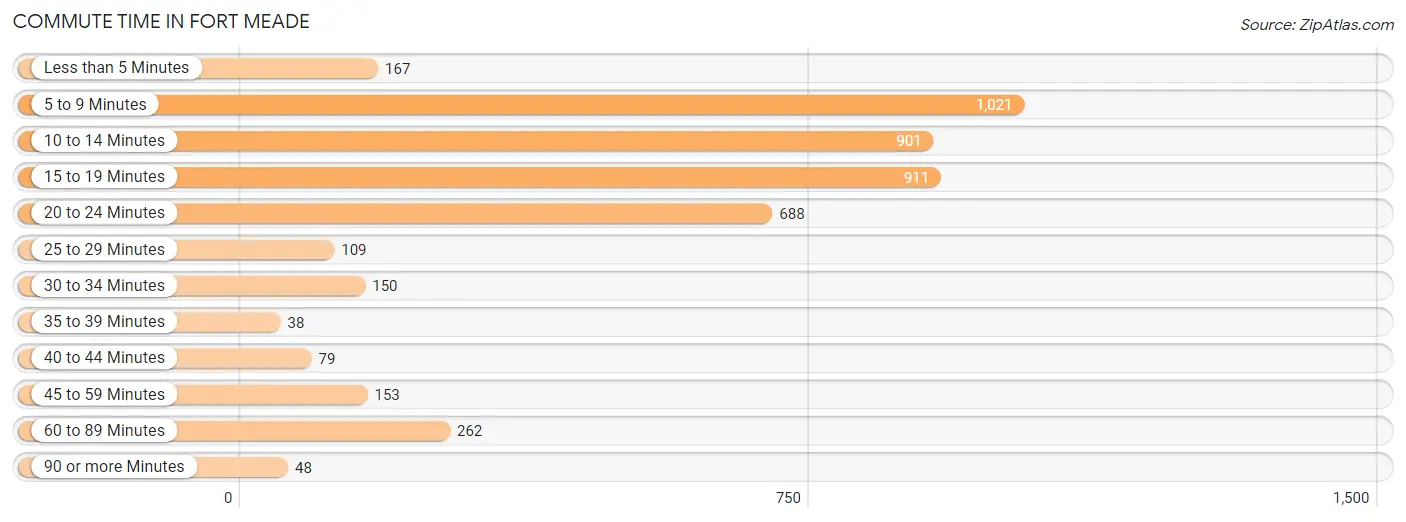
| Commute Time | # Commuters | % Commuters |
| Less than 5 Minutes | 167 | 3.7% |
| 5 to 9 Minutes | 1,021 | 22.6% |
| 10 to 14 Minutes | 901 | 19.9% |
| 15 to 19 Minutes | 911 | 20.1% |
| 20 to 24 Minutes | 688 | 15.2% |
| 25 to 29 Minutes | 109 | 2.4% |
| 30 to 34 Minutes | 150 | 3.3% |
| 35 to 39 Minutes | 38 | 0.8% |
| 40 to 44 Minutes | 79 | 1.8% |
| 45 to 59 Minutes | 153 | 3.4% |
| 60 to 89 Minutes | 262 | 5.8% |
| 90 or more Minutes | 48 | 1.1% |
Commute Time by Sex in Fort Meade
The most common commute times in Fort Meade are 5 to 9 minutes (736 commuters, 24.4%) for males and 20 to 24 minutes (322 commuters, 21.2%) for females.
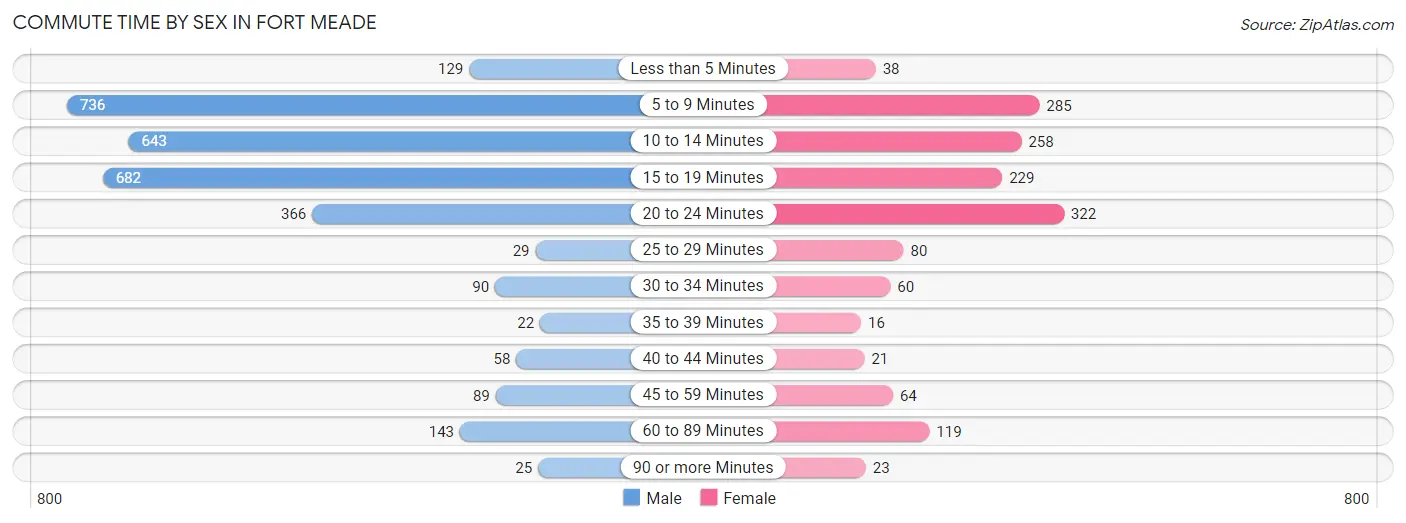
| Commute Time | Male | Female |
| Less than 5 Minutes | 129 (4.3%) | 38 (2.5%) |
| 5 to 9 Minutes | 736 (24.4%) | 285 (18.8%) |
| 10 to 14 Minutes | 643 (21.3%) | 258 (17.0%) |
| 15 to 19 Minutes | 682 (22.6%) | 229 (15.1%) |
| 20 to 24 Minutes | 366 (12.1%) | 322 (21.2%) |
| 25 to 29 Minutes | 29 (1.0%) | 80 (5.3%) |
| 30 to 34 Minutes | 90 (3.0%) | 60 (4.0%) |
| 35 to 39 Minutes | 22 (0.7%) | 16 (1.1%) |
| 40 to 44 Minutes | 58 (1.9%) | 21 (1.4%) |
| 45 to 59 Minutes | 89 (2.9%) | 64 (4.2%) |
| 60 to 89 Minutes | 143 (4.8%) | 119 (7.9%) |
| 90 or more Minutes | 25 (0.8%) | 23 (1.5%) |
Time of Departure to Work by Sex in Fort Meade
The most frequent times of departure to work in Fort Meade are 7:30 AM to 7:59 AM (507, 16.8%) for males and 6:30 AM to 6:59 AM (225, 14.8%) for females.
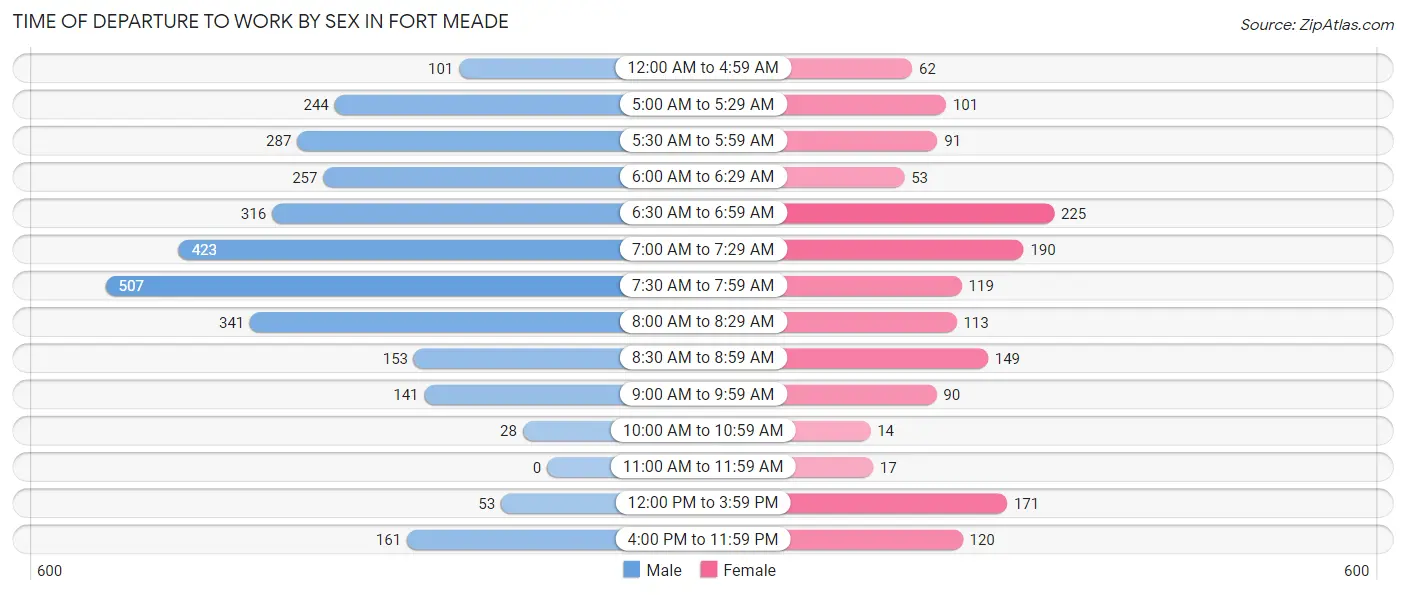
| Time of Departure | Male | Female |
| 12:00 AM to 4:59 AM | 101 (3.4%) | 62 (4.1%) |
| 5:00 AM to 5:29 AM | 244 (8.1%) | 101 (6.7%) |
| 5:30 AM to 5:59 AM | 287 (9.5%) | 91 (6.0%) |
| 6:00 AM to 6:29 AM | 257 (8.5%) | 53 (3.5%) |
| 6:30 AM to 6:59 AM | 316 (10.5%) | 225 (14.8%) |
| 7:00 AM to 7:29 AM | 423 (14.0%) | 190 (12.5%) |
| 7:30 AM to 7:59 AM | 507 (16.8%) | 119 (7.9%) |
| 8:00 AM to 8:29 AM | 341 (11.3%) | 113 (7.5%) |
| 8:30 AM to 8:59 AM | 153 (5.1%) | 149 (9.8%) |
| 9:00 AM to 9:59 AM | 141 (4.7%) | 90 (5.9%) |
| 10:00 AM to 10:59 AM | 28 (0.9%) | 14 (0.9%) |
| 11:00 AM to 11:59 AM | 0 (0.0%) | 17 (1.1%) |
| 12:00 PM to 3:59 PM | 53 (1.8%) | 171 (11.3%) |
| 4:00 PM to 11:59 PM | 161 (5.3%) | 120 (7.9%) |
| Total | 3,012 (100.0%) | 1,515 (100.0%) |
Housing Occupancy in Fort Meade
Occupancy by Ownership in Fort Meade
Of the total 2,938 dwellings in Fort Meade, owner-occupied units account for 7 (0.2%), while renter-occupied units make up 2,931 (99.8%).
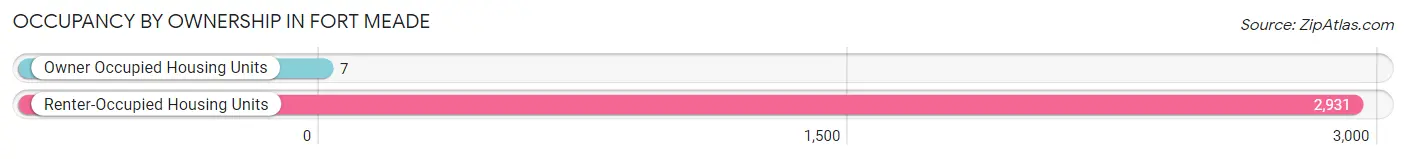
| Occupancy | # Housing Units | % Housing Units |
| Owner Occupied Housing Units | 7 | 0.2% |
| Renter-Occupied Housing Units | 2,931 | 99.8% |
| Total Occupied Housing Units | 2,938 | 100.0% |
Occupancy by Household Size in Fort Meade
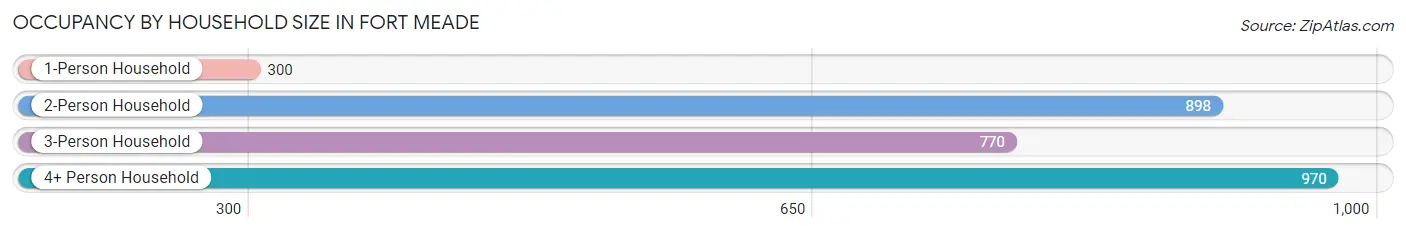
| Household Size | # Housing Units | % Housing Units |
| 1-Person Household | 300 | 10.2% |
| 2-Person Household | 898 | 30.6% |
| 3-Person Household | 770 | 26.2% |
| 4+ Person Household | 970 | 33.0% |
| Total Housing Units | 2,938 | 100.0% |
Occupancy by Ownership by Household Size in Fort Meade
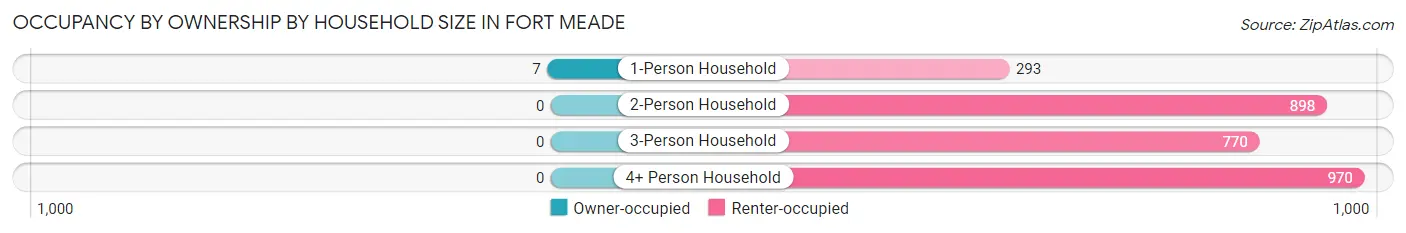
| Household Size | Owner-occupied | Renter-occupied |
| 1-Person Household | 7 (2.3%) | 293 (97.7%) |
| 2-Person Household | 0 (0.0%) | 898 (100.0%) |
| 3-Person Household | 0 (0.0%) | 770 (100.0%) |
| 4+ Person Household | 0 (0.0%) | 970 (100.0%) |
| Total Housing Units | 7 (0.2%) | 2,931 (99.8%) |
Occupancy by Educational Attainment in Fort Meade
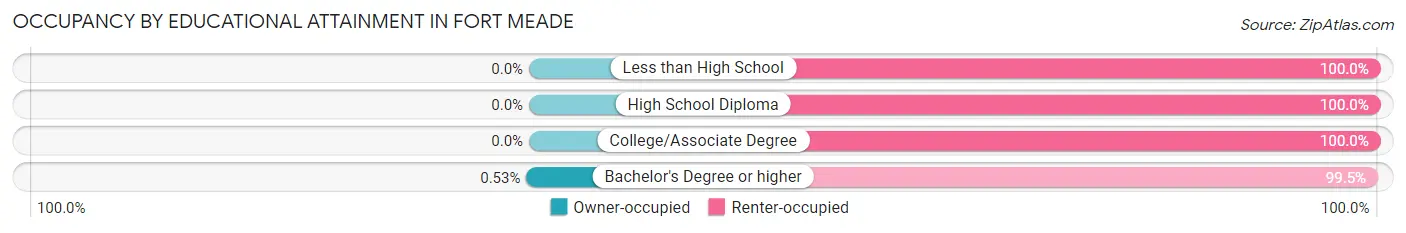
| Household Size | Owner-occupied | Renter-occupied |
| Less than High School | 0 (0.0%) | 65 (100.0%) |
| High School Diploma | 0 (0.0%) | 213 (100.0%) |
| College/Associate Degree | 0 (0.0%) | 1,334 (100.0%) |
| Bachelor's Degree or higher | 7 (0.5%) | 1,319 (99.5%) |
Occupancy by Age of Householder in Fort Meade
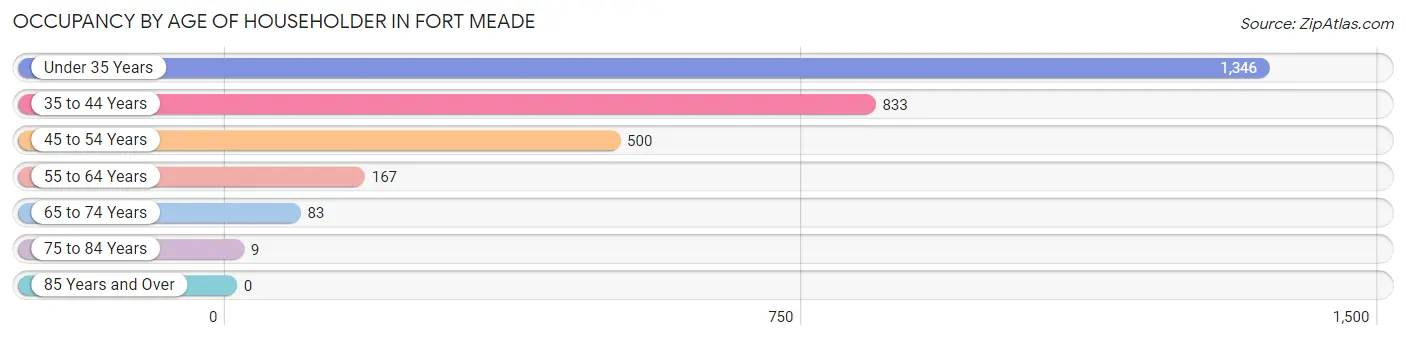
| Age Bracket | # Households | % Households |
| Under 35 Years | 1,346 | 45.8% |
| 35 to 44 Years | 833 | 28.3% |
| 45 to 54 Years | 500 | 17.0% |
| 55 to 64 Years | 167 | 5.7% |
| 65 to 74 Years | 83 | 2.8% |
| 75 to 84 Years | 9 | 0.3% |
| 85 Years and Over | 0 | 0.0% |
| Total | 2,938 | 100.0% |
Housing Finances in Fort Meade
Median Income by Occupancy in Fort Meade
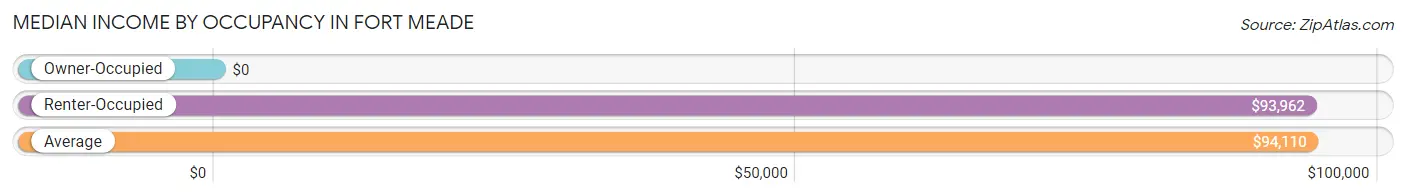
| Occupancy Type | # Households | Median Income |
| Owner-Occupied | 7 (0.2%) | $0 |
| Renter-Occupied | 2,931 (99.8%) | $93,962 |
| Average | 2,938 (100.0%) | $94,110 |
Occupancy by Householder Income Bracket in Fort Meade
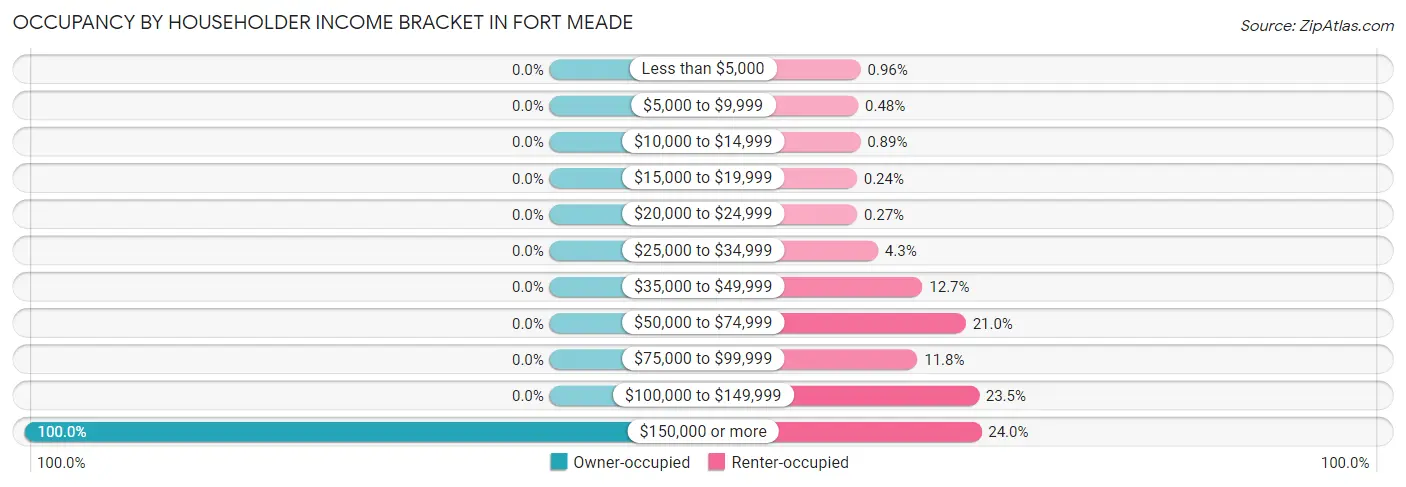
| Income Bracket | Owner-occupied | Renter-occupied |
| Less than $5,000 | 0 (0.0%) | 28 (1.0%) |
| $5,000 to $9,999 | 0 (0.0%) | 14 (0.5%) |
| $10,000 to $14,999 | 0 (0.0%) | 26 (0.9%) |
| $15,000 to $19,999 | 0 (0.0%) | 7 (0.2%) |
| $20,000 to $24,999 | 0 (0.0%) | 8 (0.3%) |
| $25,000 to $34,999 | 0 (0.0%) | 125 (4.3%) |
| $35,000 to $49,999 | 0 (0.0%) | 373 (12.7%) |
| $50,000 to $74,999 | 0 (0.0%) | 615 (21.0%) |
| $75,000 to $99,999 | 0 (0.0%) | 345 (11.8%) |
| $100,000 to $149,999 | 0 (0.0%) | 688 (23.5%) |
| $150,000 or more | 7 (100.0%) | 702 (23.9%) |
| Total | 7 (100.0%) | 2,931 (100.0%) |
Monthly Housing Cost Tiers in Fort Meade
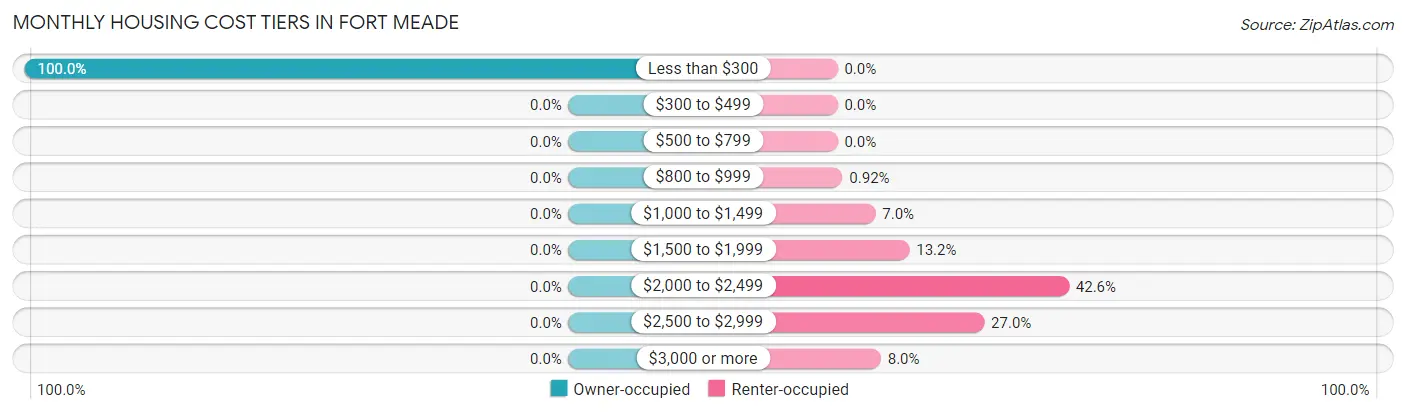
| Monthly Cost | Owner-occupied | Renter-occupied |
| Less than $300 | 7 (100.0%) | 0 (0.0%) |
| $300 to $499 | 0 (0.0%) | 0 (0.0%) |
| $500 to $799 | 0 (0.0%) | 0 (0.0%) |
| $800 to $999 | 0 (0.0%) | 27 (0.9%) |
| $1,000 to $1,499 | 0 (0.0%) | 205 (7.0%) |
| $1,500 to $1,999 | 0 (0.0%) | 388 (13.2%) |
| $2,000 to $2,499 | 0 (0.0%) | 1,249 (42.6%) |
| $2,500 to $2,999 | 0 (0.0%) | 792 (27.0%) |
| $3,000 or more | 0 (0.0%) | 234 (8.0%) |
| Total | 7 (100.0%) | 2,931 (100.0%) |
Physical Housing Characteristics in Fort Meade
Housing Structures in Fort Meade
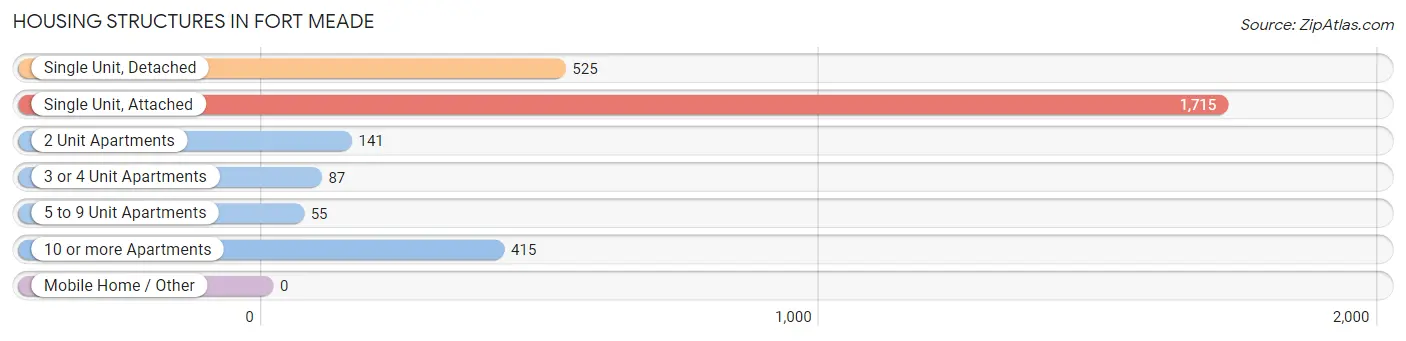
| Structure Type | # Housing Units | % Housing Units |
| Single Unit, Detached | 525 | 17.9% |
| Single Unit, Attached | 1,715 | 58.4% |
| 2 Unit Apartments | 141 | 4.8% |
| 3 or 4 Unit Apartments | 87 | 3.0% |
| 5 to 9 Unit Apartments | 55 | 1.9% |
| 10 or more Apartments | 415 | 14.1% |
| Mobile Home / Other | 0 | 0.0% |
| Total | 2,938 | 100.0% |
Housing Structures by Occupancy in Fort Meade
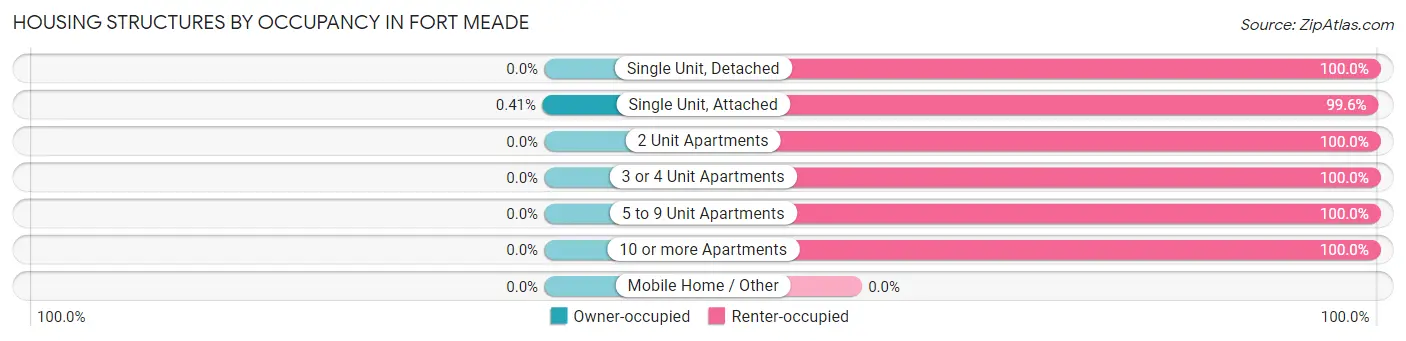
| Structure Type | Owner-occupied | Renter-occupied |
| Single Unit, Detached | 0 (0.0%) | 525 (100.0%) |
| Single Unit, Attached | 7 (0.4%) | 1,708 (99.6%) |
| 2 Unit Apartments | 0 (0.0%) | 141 (100.0%) |
| 3 or 4 Unit Apartments | 0 (0.0%) | 87 (100.0%) |
| 5 to 9 Unit Apartments | 0 (0.0%) | 55 (100.0%) |
| 10 or more Apartments | 0 (0.0%) | 415 (100.0%) |
| Mobile Home / Other | 0 (0.0%) | 0 (0.0%) |
| Total | 7 (0.2%) | 2,931 (99.8%) |
Housing Structures by Number of Rooms in Fort Meade
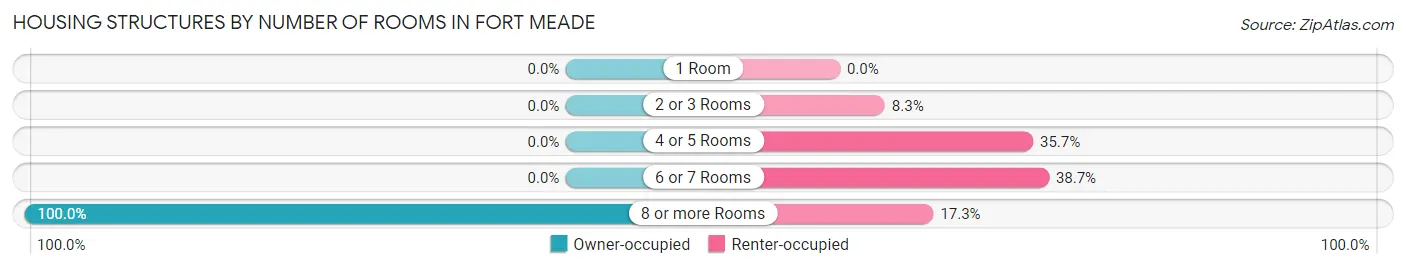
| Number of Rooms | Owner-occupied | Renter-occupied |
| 1 Room | 0 (0.0%) | 0 (0.0%) |
| 2 or 3 Rooms | 0 (0.0%) | 244 (8.3%) |
| 4 or 5 Rooms | 0 (0.0%) | 1,047 (35.7%) |
| 6 or 7 Rooms | 0 (0.0%) | 1,133 (38.7%) |
| 8 or more Rooms | 7 (100.0%) | 507 (17.3%) |
| Total | 7 (100.0%) | 2,931 (100.0%) |
Housing Structure by Heating Type in Fort Meade
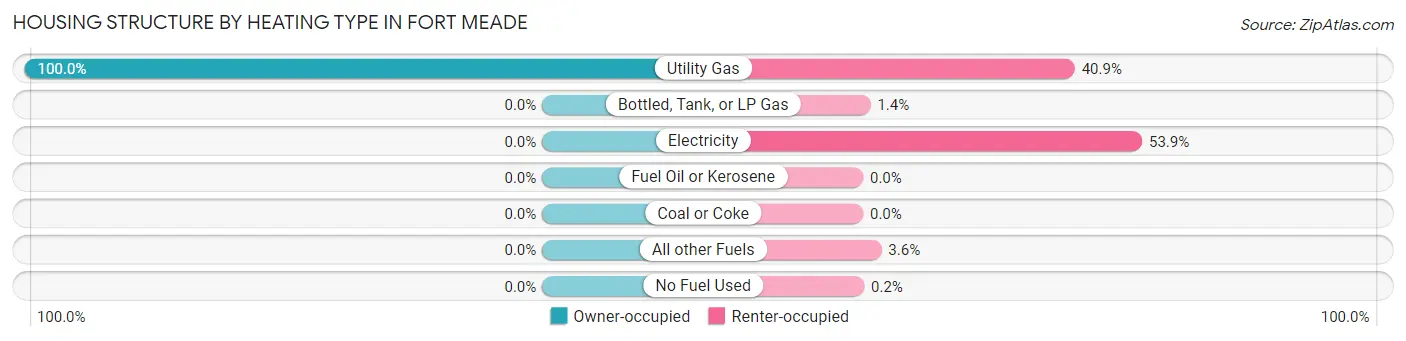
| Heating Type | Owner-occupied | Renter-occupied |
| Utility Gas | 7 (100.0%) | 1,199 (40.9%) |
| Bottled, Tank, or LP Gas | 0 (0.0%) | 42 (1.4%) |
| Electricity | 0 (0.0%) | 1,580 (53.9%) |
| Fuel Oil or Kerosene | 0 (0.0%) | 0 (0.0%) |
| Coal or Coke | 0 (0.0%) | 0 (0.0%) |
| All other Fuels | 0 (0.0%) | 104 (3.5%) |
| No Fuel Used | 0 (0.0%) | 6 (0.2%) |
| Total | 7 (100.0%) | 2,931 (100.0%) |
Household Vehicle Usage in Fort Meade
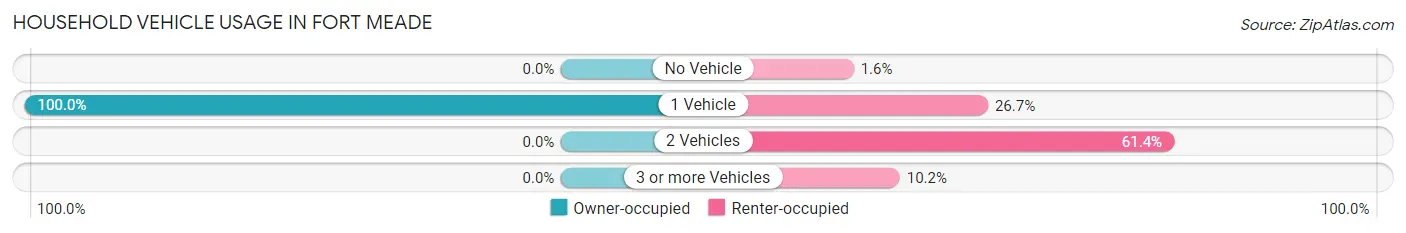
| Vehicles per Household | Owner-occupied | Renter-occupied |
| No Vehicle | 0 (0.0%) | 48 (1.6%) |
| 1 Vehicle | 7 (100.0%) | 783 (26.7%) |
| 2 Vehicles | 0 (0.0%) | 1,800 (61.4%) |
| 3 or more Vehicles | 0 (0.0%) | 300 (10.2%) |
| Total | 7 (100.0%) | 2,931 (100.0%) |
Real Estate & Mortgages in Fort Meade
Real Estate and Mortgage Overview in Fort Meade
| Characteristic | Without Mortgage | With Mortgage |
| Housing Units | 7 | 0 |
| Median Property Value | - | - |
| Median Household Income | - | - |
| Monthly Housing Costs | - | - |
| Real Estate Taxes | - | - |
Property Value by Mortgage Status in Fort Meade
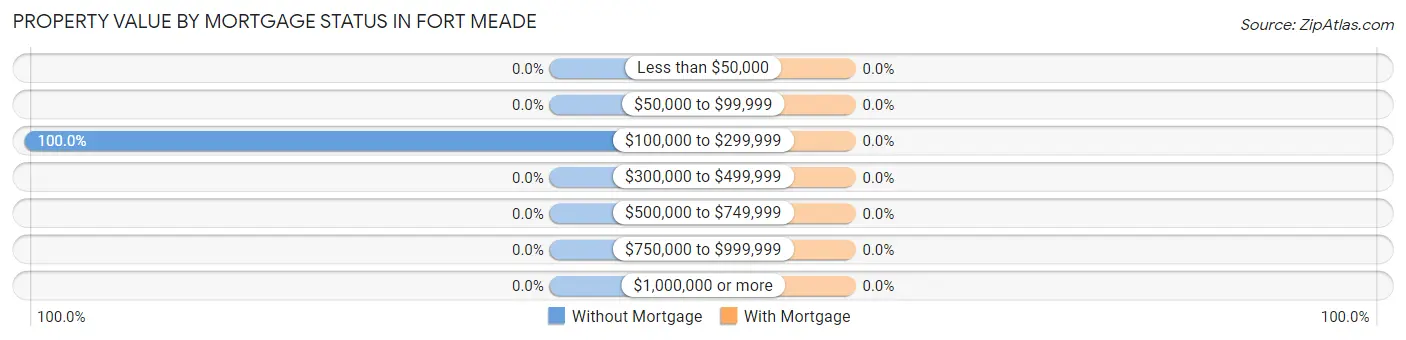
| Property Value | Without Mortgage | With Mortgage |
| Less than $50,000 | 0 (0.0%) | 0 (0.0%) |
| $50,000 to $99,999 | 0 (0.0%) | 0 (0.0%) |
| $100,000 to $299,999 | 7 (100.0%) | 0 (0.0%) |
| $300,000 to $499,999 | 0 (0.0%) | 0 (0.0%) |
| $500,000 to $749,999 | 0 (0.0%) | 0 (0.0%) |
| $750,000 to $999,999 | 0 (0.0%) | 0 (0.0%) |
| $1,000,000 or more | 0 (0.0%) | 0 (0.0%) |
| Total | 7 (100.0%) | 0 (0.0%) |
Household Income by Mortgage Status in Fort Meade
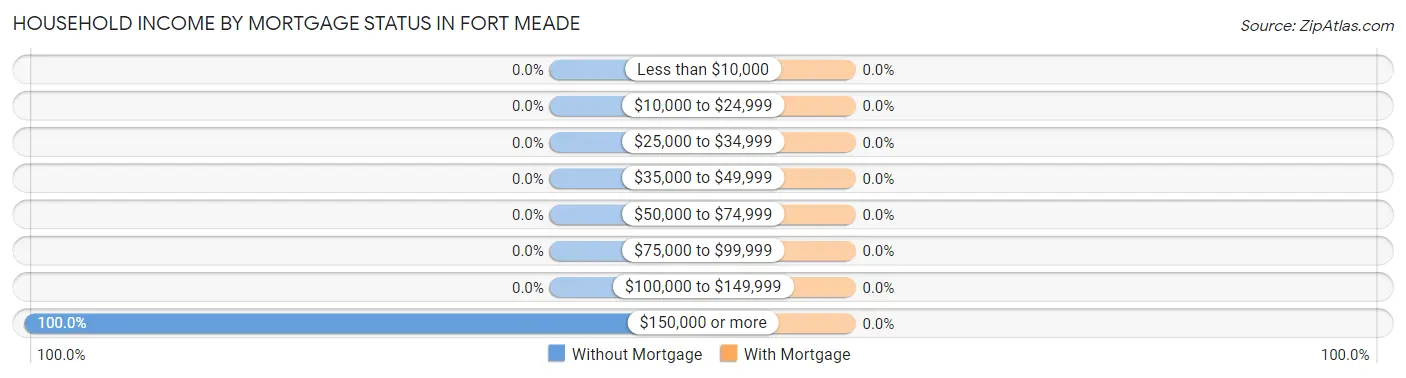
| Household Income | Without Mortgage | With Mortgage |
| Less than $10,000 | 0 (0.0%) | 0 (0.0%) |
| $10,000 to $24,999 | 0 (0.0%) | 0 (0.0%) |
| $25,000 to $34,999 | 0 (0.0%) | 0 (0.0%) |
| $35,000 to $49,999 | 0 (0.0%) | 0 (0.0%) |
| $50,000 to $74,999 | 0 (0.0%) | 0 (0.0%) |
| $75,000 to $99,999 | 0 (0.0%) | 0 (0.0%) |
| $100,000 to $149,999 | 0 (0.0%) | 0 (0.0%) |
| $150,000 or more | 7 (100.0%) | 0 (0.0%) |
| Total | 7 (100.0%) | 0 (0.0%) |
Property Value to Household Income Ratio in Fort Meade
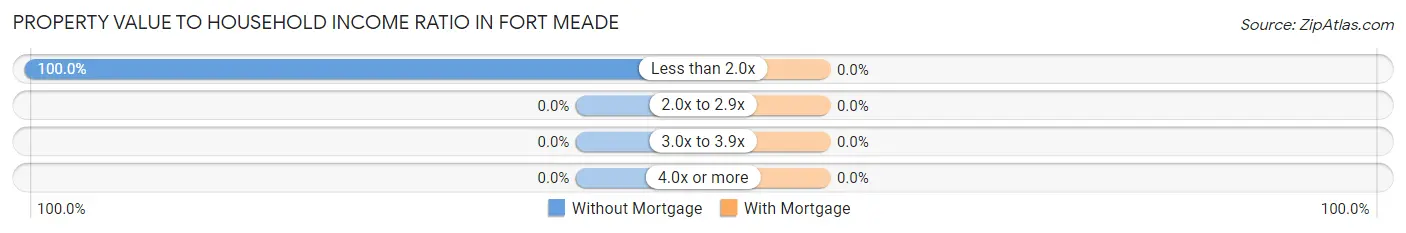
| Value-to-Income Ratio | Without Mortgage | With Mortgage |
| Less than 2.0x | 7 (100.0%) | 0 (0.0%) |
| 2.0x to 2.9x | 0 (0.0%) | 0 (0.0%) |
| 3.0x to 3.9x | 0 (0.0%) | 0 (0.0%) |
| 4.0x or more | 0 (0.0%) | 0 (0.0%) |
| Total | 7 (100.0%) | 0 (0.0%) |
Real Estate Taxes by Mortgage Status in Fort Meade
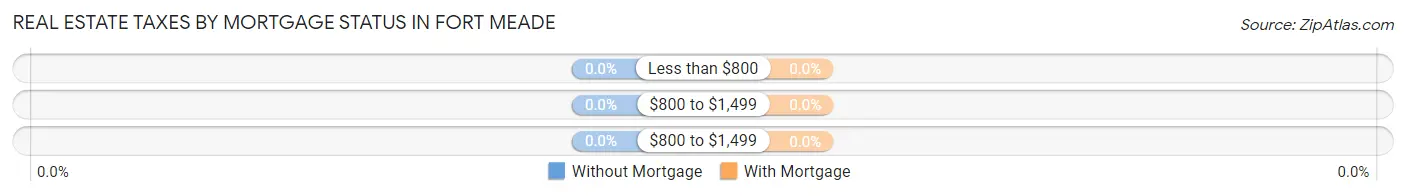
| Property Taxes | Without Mortgage | With Mortgage |
| Less than $800 | 0 (0.0%) | 0 (0.0%) |
| $800 to $1,499 | 0 (0.0%) | 0 (0.0%) |
| $800 to $1,499 | 0 (0.0%) | 0 (0.0%) |
| Total | 7 (100.0%) | 0 (0.0%) |
Health & Disability in Fort Meade
Health Insurance Coverage by Age in Fort Meade
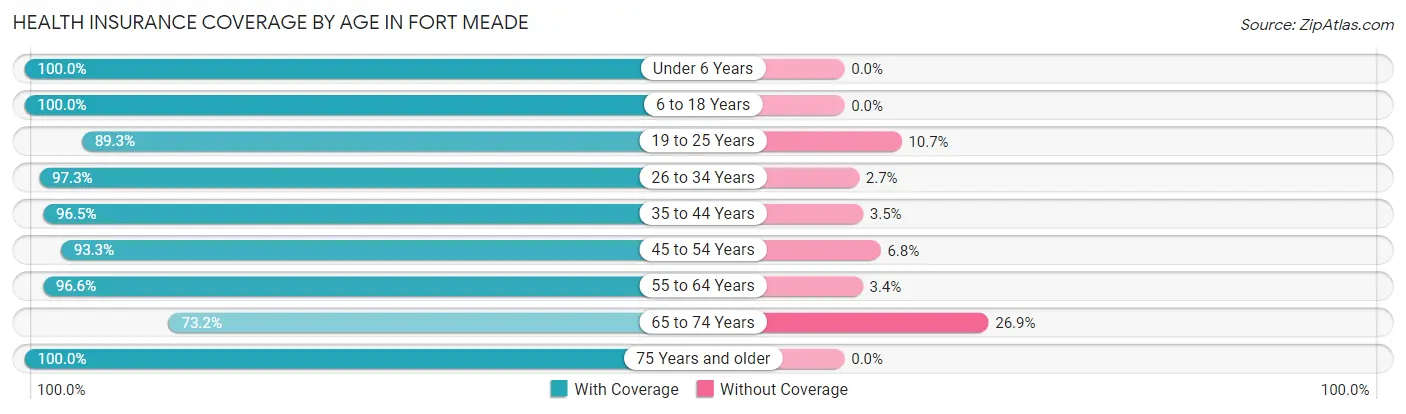
| Age Bracket | With Coverage | Without Coverage |
| Under 6 Years | 1,451 (100.0%) | 0 (0.0%) |
| 6 to 18 Years | 1,940 (100.0%) | 0 (0.0%) |
| 19 to 25 Years | 511 (89.3%) | 61 (10.7%) |
| 26 to 34 Years | 1,251 (97.3%) | 35 (2.7%) |
| 35 to 44 Years | 670 (96.5%) | 24 (3.5%) |
| 45 to 54 Years | 746 (93.2%) | 54 (6.8%) |
| 55 to 64 Years | 341 (96.6%) | 12 (3.4%) |
| 65 to 74 Years | 188 (73.2%) | 69 (26.9%) |
| 75 Years and older | 37 (100.0%) | 0 (0.0%) |
| Total | 7,135 (96.6%) | 255 (3.5%) |
Health Insurance Coverage by Citizenship Status in Fort Meade
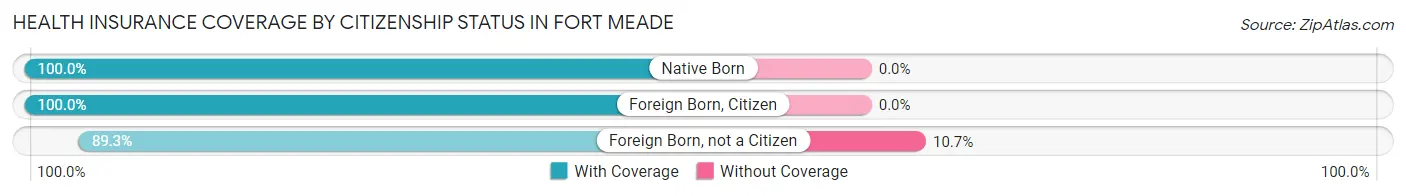
| Citizenship Status | With Coverage | Without Coverage |
| Native Born | 1,451 (100.0%) | 0 (0.0%) |
| Foreign Born, Citizen | 1,940 (100.0%) | 0 (0.0%) |
| Foreign Born, not a Citizen | 511 (89.3%) | 61 (10.7%) |
Health Insurance Coverage by Household Income in Fort Meade
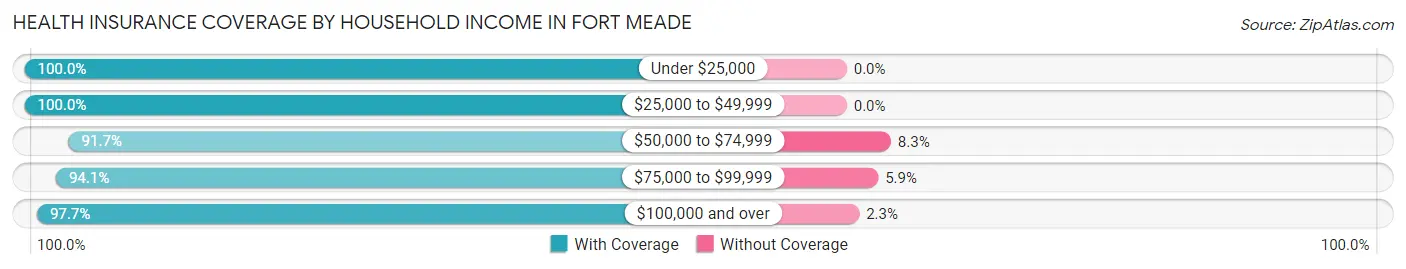
| Household Income | With Coverage | Without Coverage |
| Under $25,000 | 273 (100.0%) | 0 (0.0%) |
| $25,000 to $49,999 | 1,153 (100.0%) | 0 (0.0%) |
| $50,000 to $74,999 | 1,311 (91.7%) | 118 (8.3%) |
| $75,000 to $99,999 | 895 (94.1%) | 56 (5.9%) |
| $100,000 and over | 3,402 (97.7%) | 81 (2.3%) |
Public vs Private Health Insurance Coverage by Age in Fort Meade
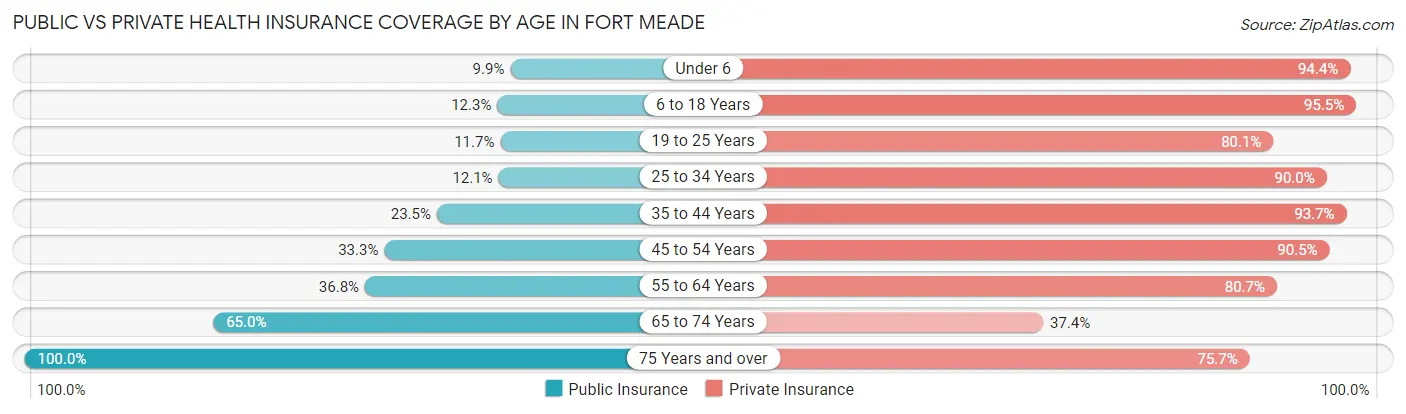
| Age Bracket | Public Insurance | Private Insurance |
| Under 6 | 143 (9.9%) | 1,369 (94.4%) |
| 6 to 18 Years | 238 (12.3%) | 1,852 (95.5%) |
| 19 to 25 Years | 67 (11.7%) | 458 (80.1%) |
| 25 to 34 Years | 155 (12.0%) | 1,157 (90.0%) |
| 35 to 44 Years | 163 (23.5%) | 650 (93.7%) |
| 45 to 54 Years | 266 (33.3%) | 724 (90.5%) |
| 55 to 64 Years | 130 (36.8%) | 285 (80.7%) |
| 65 to 74 Years | 167 (65.0%) | 96 (37.3%) |
| 75 Years and over | 37 (100.0%) | 28 (75.7%) |
| Total | 1,366 (18.5%) | 6,619 (89.6%) |
Disability Status by Sex by Age in Fort Meade
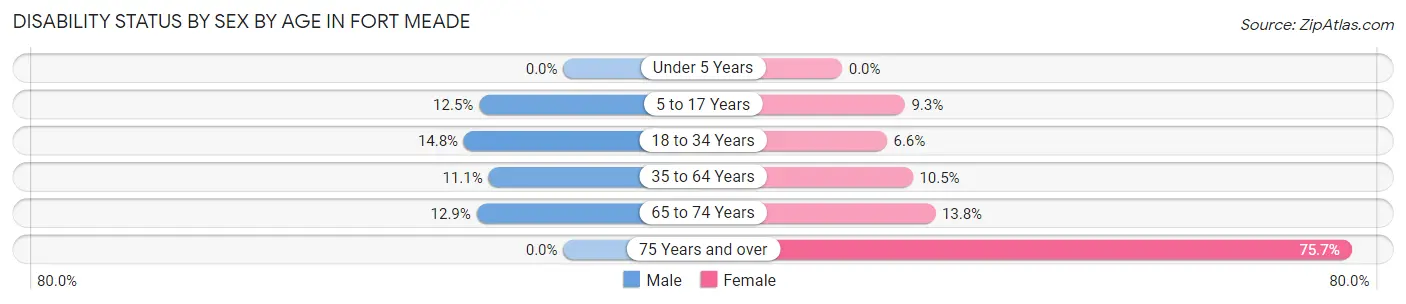
| Age Bracket | Male | Female |
| Under 5 Years | 0 (0.0%) | 0 (0.0%) |
| 5 to 17 Years | 114 (12.5%) | 115 (9.3%) |
| 18 to 34 Years | 85 (14.8%) | 90 (6.6%) |
| 35 to 64 Years | 75 (11.1%) | 123 (10.5%) |
| 65 to 74 Years | 21 (12.9%) | 13 (13.8%) |
| 75 Years and over | 0 (0.0%) | 28 (75.7%) |
Disability Class by Sex by Age in Fort Meade
Disability Class: Hearing Difficulty
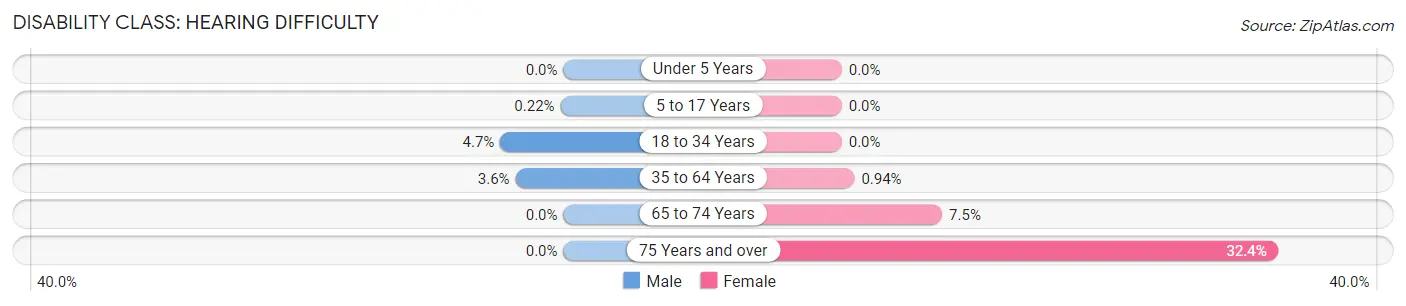
| Age Bracket | Male | Female |
| Under 5 Years | 0 (0.0%) | 0 (0.0%) |
| 5 to 17 Years | 2 (0.2%) | 0 (0.0%) |
| 18 to 34 Years | 27 (4.7%) | 0 (0.0%) |
| 35 to 64 Years | 24 (3.6%) | 11 (0.9%) |
| 65 to 74 Years | 0 (0.0%) | 7 (7.4%) |
| 75 Years and over | 0 (0.0%) | 12 (32.4%) |
Disability Class: Vision Difficulty
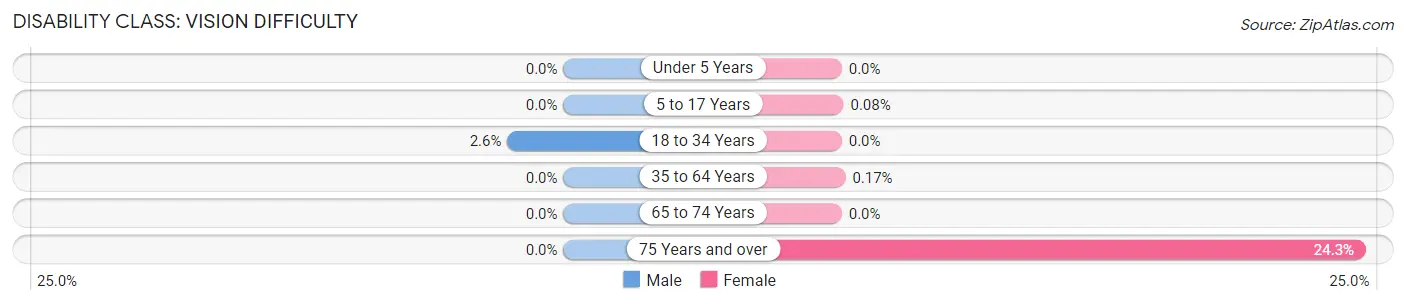
| Age Bracket | Male | Female |
| Under 5 Years | 0 (0.0%) | 0 (0.0%) |
| 5 to 17 Years | 0 (0.0%) | 1 (0.1%) |
| 18 to 34 Years | 15 (2.6%) | 0 (0.0%) |
| 35 to 64 Years | 0 (0.0%) | 2 (0.2%) |
| 65 to 74 Years | 0 (0.0%) | 0 (0.0%) |
| 75 Years and over | 0 (0.0%) | 9 (24.3%) |
Disability Class: Cognitive Difficulty
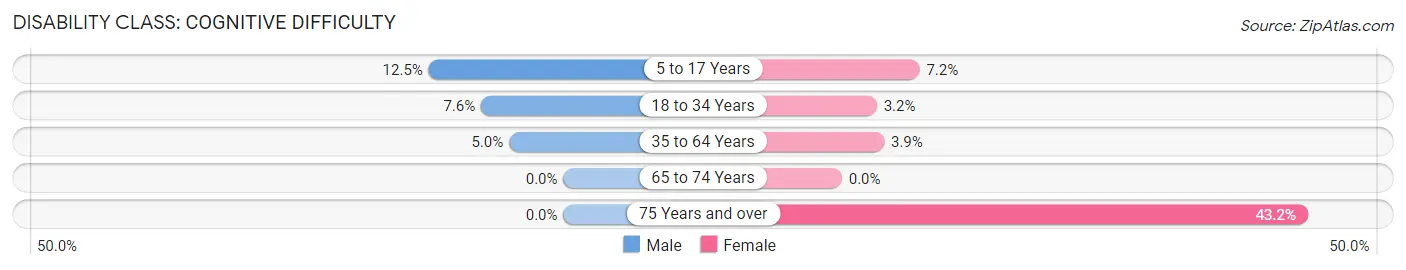
| Age Bracket | Male | Female |
| 5 to 17 Years | 114 (12.5%) | 89 (7.2%) |
| 18 to 34 Years | 44 (7.6%) | 44 (3.2%) |
| 35 to 64 Years | 34 (5.0%) | 46 (3.9%) |
| 65 to 74 Years | 0 (0.0%) | 0 (0.0%) |
| 75 Years and over | 0 (0.0%) | 16 (43.2%) |
Disability Class: Ambulatory Difficulty
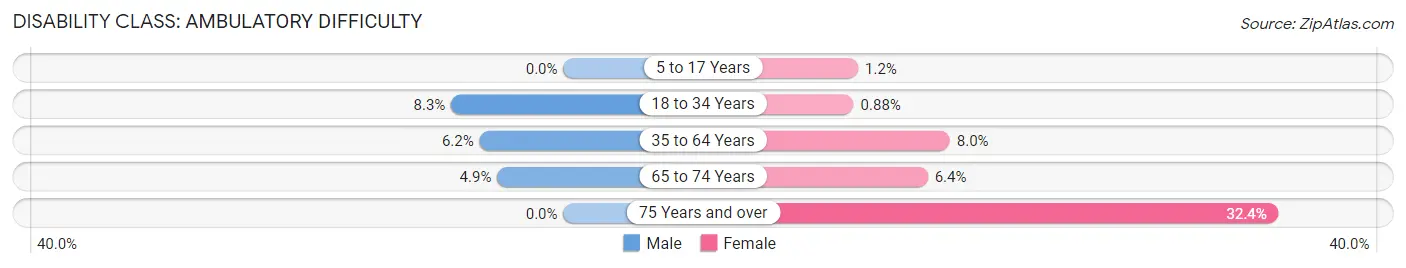
| Age Bracket | Male | Female |
| 5 to 17 Years | 0 (0.0%) | 15 (1.2%) |
| 18 to 34 Years | 48 (8.3%) | 12 (0.9%) |
| 35 to 64 Years | 42 (6.2%) | 94 (8.0%) |
| 65 to 74 Years | 8 (4.9%) | 6 (6.4%) |
| 75 Years and over | 0 (0.0%) | 12 (32.4%) |
Disability Class: Self-Care Difficulty
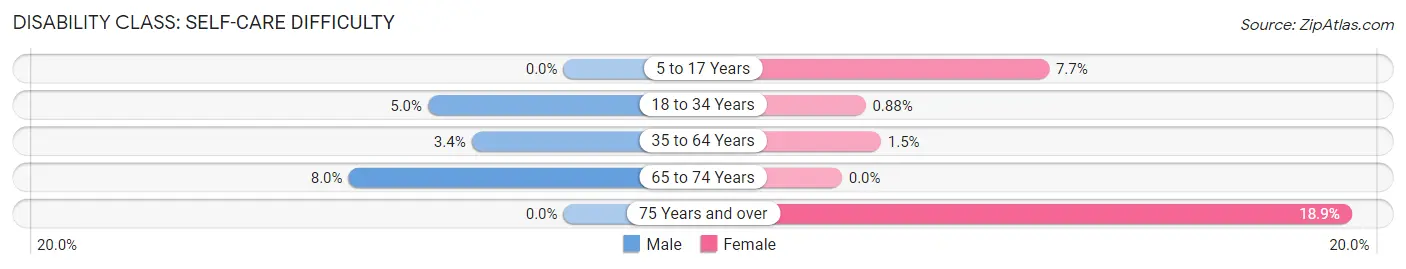
| Age Bracket | Male | Female |
| 5 to 17 Years | 0 (0.0%) | 95 (7.7%) |
| 18 to 34 Years | 29 (5.0%) | 12 (0.9%) |
| 35 to 64 Years | 23 (3.4%) | 17 (1.5%) |
| 65 to 74 Years | 13 (8.0%) | 0 (0.0%) |
| 75 Years and over | 0 (0.0%) | 7 (18.9%) |
Technology Access in Fort Meade
Computing Device Access in Fort Meade
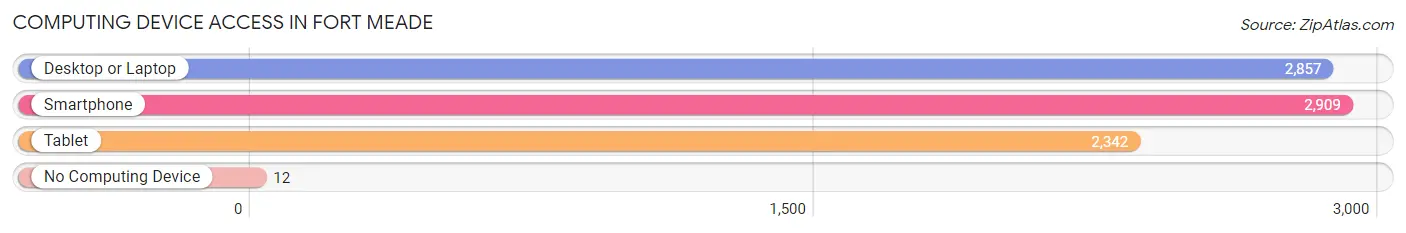
| Device Type | # Households | % Households |
| Desktop or Laptop | 2,857 | 97.2% |
| Smartphone | 2,909 | 99.0% |
| Tablet | 2,342 | 79.7% |
| No Computing Device | 12 | 0.4% |
| Total | 2,938 | 100.0% |
Internet Access in Fort Meade
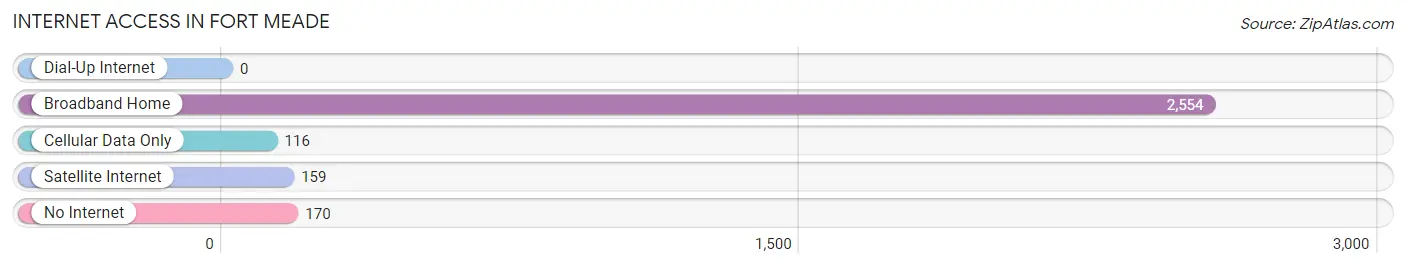
| Internet Type | # Households | % Households |
| Dial-Up Internet | 0 | 0.0% |
| Broadband Home | 2,554 | 86.9% |
| Cellular Data Only | 116 | 4.0% |
| Satellite Internet | 159 | 5.4% |
| No Internet | 170 | 5.8% |
| Total | 2,938 | 100.0% |
Fort Meade Summary
Fort Meade is a census-designated place (CDP) located in Anne Arundel County, Maryland, United States. It is located near the city of Baltimore and is home to the National Security Agency (NSA), the Defense Information Systems Agency (DISA), and the United States Cyber Command (USCYBERCOM). The population of Fort Meade was 9,327 at the 2010 census.
History
Fort Meade was originally established in 1917 as Camp Meade, a training camp for the United States Army. It was named after General George G. Meade, who commanded the Union Army at the Battle of Gettysburg during the American Civil War. The camp was used to train troops for World War I and was later expanded to include a hospital and other facilities.
In the 1930s, the camp was renamed Fort Meade and became a permanent military installation. During World War II, the fort was used as a training center for the Army Air Corps and as a prisoner of war camp. After the war, the fort was used as a base for the Army Security Agency, which later became the National Security Agency.
In the 1950s, the fort was expanded to include the Defense Information Systems Agency (DISA) and the United States Cyber Command (USCYBERCOM). Today, Fort Meade is home to more than 50 federal agencies and organizations, including the NSA, DISA, and USCYBERCOM.
Geography
Fort Meade is located in Anne Arundel County, Maryland, at 39°6'25" North, 76°44'17" West (39.106944, -76.738333). It is situated on the Patuxent River, approximately 25 miles (40 km) south of Baltimore and 40 miles (64 km) northeast of Washington, D.C.
The CDP has a total area of 8.2 square miles (21.2 km2), of which 8.1 square miles (21.0 km2) is land and 0.1 square miles (0.2 km2) is water.
Economy
Fort Meade is home to a number of federal agencies and organizations, including the National Security Agency (NSA), the Defense Information Systems Agency (DISA), and the United States Cyber Command (USCYBERCOM). These organizations provide a significant economic boost to the local economy.
In addition, Fort Meade is home to a number of private businesses, including hotels, restaurants, and retail stores. The fort also hosts a number of events throughout the year, including the annual Maryland Renaissance Festival and the Fort Meade Air Show.
Demographics
As of the 2010 census, there were 9,327 people, 2,945 households, and 2,541 families residing in the CDP. The population density was 1,145.3 people per square mile (443.2/km2). There were 3,095 housing units at an average density of 382.3 per square mile (147.6/km2).
The racial makeup of the CDP was 63.2% White, 22.3% African American, 0.5% Native American, 5.7% Asian, 0.1% Pacific Islander, 4.2% from other races, and 4.0% from two or more races. Hispanic or Latino of any race were 11.2% of the population.
There were 2,945 households, out of which 43.2% had children under the age of 18 living with them, 63.2% were married couples living together, 10.2% had a female householder with no husband present, and 22.2% were non-families. 17.2% of all households were made up of individuals, and 4.2% had someone living alone who was 65 years of age or older. The average household size was 3.14 and the average family size was 3.54.
In the CDP, the population was spread out, with 30.2% under the age of 18, 11.2% from 18 to 24, 36.2% from 25 to 44, 16.2% from 45 to 64, and 6.2% who were 65 years of age or older. The median age was 30 years. For every 100 females, there were 103.2 males. For every 100 females age 18 and over, there were 102.2 males.
The median income for a household in the CDP was $63,917, and the median income for a family was $68,958. Males had a median income of $41,919 versus $31,919 for females. The per capita income for the CDP was $23,945. About 4.2% of families and 5.2% of the population were below the poverty line, including 6.2% of those under age 18 and none of those age 65 or over.
Common Questions
What is Per Capita Income in Fort Meade?
Per Capita income in Fort Meade is $35,407.
What is the Median Family Income in Fort Meade?
Median Family Income in Fort Meade is $88,438.
What is the Median Household income in Fort Meade?
Median Household Income in Fort Meade is $94,110.
What is Income or Wage Gap in Fort Meade?
Income or Wage Gap in Fort Meade is 22.3%.
Women in Fort Meade earn 77.7 cents for every dollar earned by a man.
What is Inequality or Gini Index in Fort Meade?
Inequality or Gini Index in Fort Meade is 0.37.
What is the Total Population of Fort Meade?
Total Population of Fort Meade is 10,011.
What is the Total Male Population of Fort Meade?
Total Male Population of Fort Meade is 5,180.
What is the Total Female Population of Fort Meade?
Total Female Population of Fort Meade is 4,831.
What is the Ratio of Males per 100 Females in Fort Meade?
There are 107.22 Males per 100 Females in Fort Meade.
What is the Ratio of Females per 100 Males in Fort Meade?
There are 93.26 Females per 100 Males in Fort Meade.
What is the Median Population Age in Fort Meade?
Median Population Age in Fort Meade is 27.2 Years.
What is the Average Family Size in Fort Meade
Average Family Size in Fort Meade is 3.6 People.
What is the Average Household Size in Fort Meade
Average Household Size in Fort Meade is 3.2 People.
How Large is the Labor Force in Fort Meade?
There are 5,039 People in the Labor Forcein in Fort Meade.
What is the Percentage of People in the Labor Force in Fort Meade?
72.8% of People are in the Labor Force in Fort Meade.
What is the Unemployment Rate in Fort Meade?
Unemployment Rate in Fort Meade is 4.6%.