Queensland, MD Map & Demographics
Queensland Map
Queensland Overview
$64,188
PER CAPITA INCOME
$163,523
AVG FAMILY INCOME
$169,773
AVG HOUSEHOLD INCOME
26.4%
WAGE / INCOME GAP [ % ]
73.6¢/ $1
WAGE / INCOME GAP [ $ ]
0.30
INEQUALITY / GINI INDEX
2,034
TOTAL POPULATION
835
MALE POPULATION
1,199
FEMALE POPULATION
69.64
MALES / 100 FEMALES
143.59
FEMALES / 100 MALES
46.8
MEDIAN AGE
3.1
AVG FAMILY SIZE
3.1
AVG HOUSEHOLD SIZE
1,162
LABOR FORCE [ PEOPLE ]
65.3%
PERCENT IN LABOR FORCE
2.0%
UNEMPLOYMENT RATE
Income in Queensland
Income Overview in Queensland
Per Capita Income in Queensland is $64,188, while median incomes of families and households are $163,523 and $169,773 respectively.
| Characteristic | Number | Measure |
| Per Capita Income | 2,034 | $64,188 |
| Median Family Income | 607 | $163,523 |
| Mean Family Income | 607 | $189,185 |
| Median Household Income | 660 | $169,773 |
| Mean Household Income | 660 | $194,150 |
| Income Deficit | 607 | $0 |
| Wage / Income Gap (%) | 2,034 | 26.43% |
| Wage / Income Gap ($) | 2,034 | 73.57¢ per $1 |
| Gini / Inequality Index | 2,034 | 0.30 |
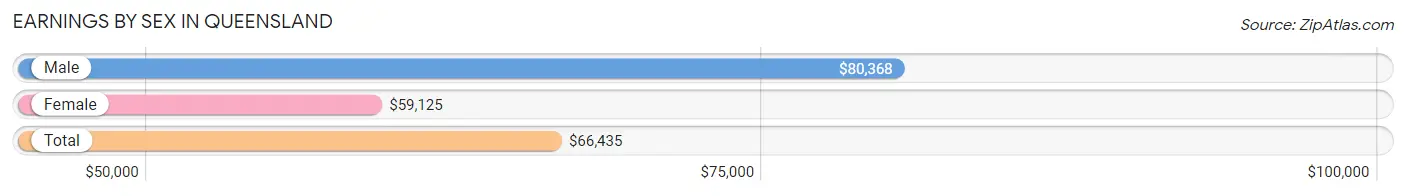
Earnings by Sex in Queensland
Average Earnings in Queensland are $66,435, $80,368 for men and $59,125 for women, a difference of 26.4%.
| Sex | Number | Average Earnings |
| Male | 577 (47.3%) | $80,368 |
| Female | 642 (52.7%) | $59,125 |
| Total | 1,219 (100.0%) | $66,435 |
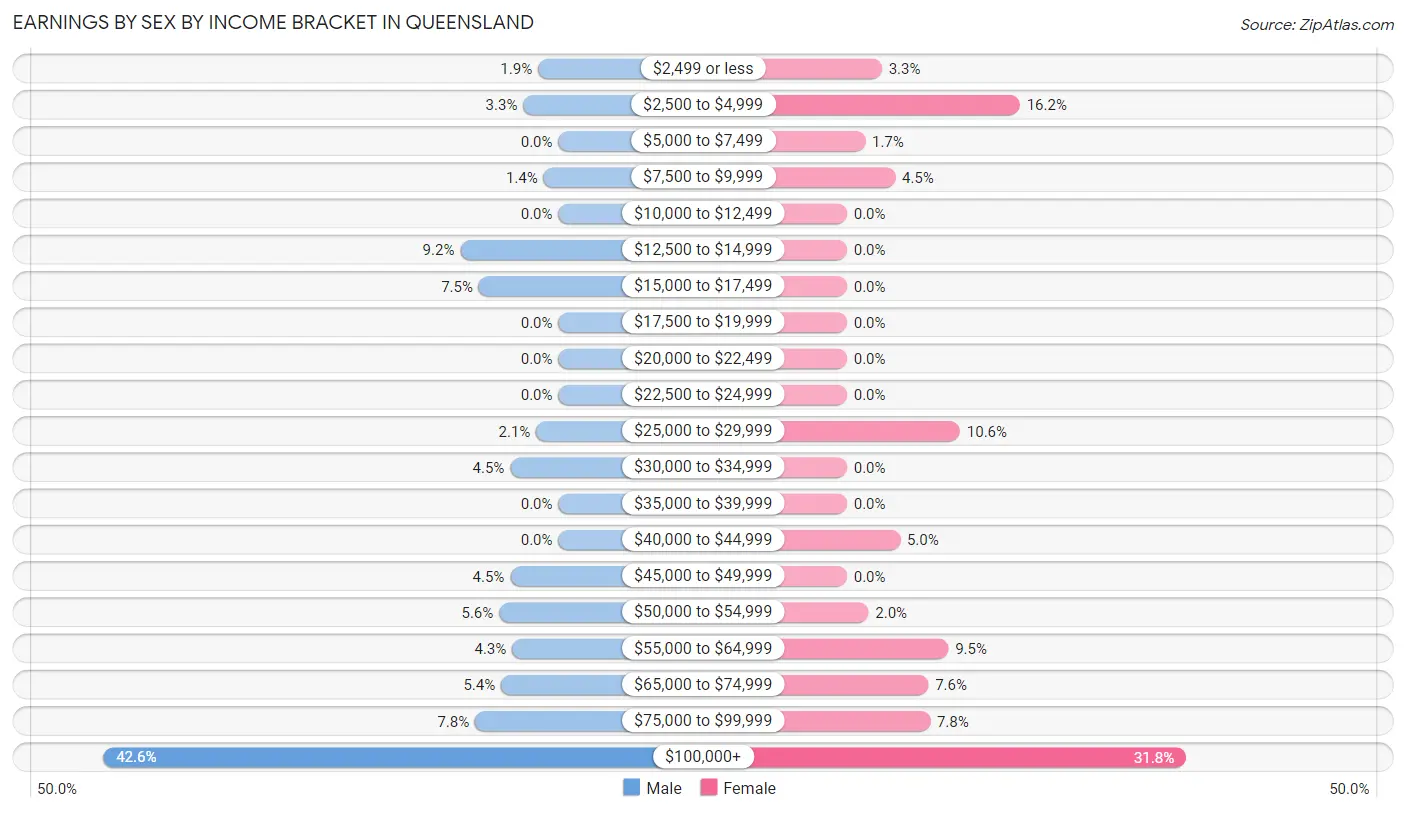
Earnings by Sex by Income Bracket in Queensland
The most common earnings brackets in Queensland are $100,000+ for men (246 | 42.6%) and $100,000+ for women (204 | 31.8%).
| Income | Male | Female |
| $2,499 or less | 11 (1.9%) | 21 (3.3%) |
| $2,500 to $4,999 | 19 (3.3%) | 104 (16.2%) |
| $5,000 to $7,499 | 0 (0.0%) | 11 (1.7%) |
| $7,500 to $9,999 | 8 (1.4%) | 29 (4.5%) |
| $10,000 to $12,499 | 0 (0.0%) | 0 (0.0%) |
| $12,500 to $14,999 | 53 (9.2%) | 0 (0.0%) |
| $15,000 to $17,499 | 43 (7.4%) | 0 (0.0%) |
| $17,500 to $19,999 | 0 (0.0%) | 0 (0.0%) |
| $20,000 to $22,499 | 0 (0.0%) | 0 (0.0%) |
| $22,500 to $24,999 | 0 (0.0%) | 0 (0.0%) |
| $25,000 to $29,999 | 12 (2.1%) | 68 (10.6%) |
| $30,000 to $34,999 | 26 (4.5%) | 0 (0.0%) |
| $35,000 to $39,999 | 0 (0.0%) | 0 (0.0%) |
| $40,000 to $44,999 | 0 (0.0%) | 32 (5.0%) |
| $45,000 to $49,999 | 26 (4.5%) | 0 (0.0%) |
| $50,000 to $54,999 | 32 (5.6%) | 13 (2.0%) |
| $55,000 to $64,999 | 25 (4.3%) | 61 (9.5%) |
| $65,000 to $74,999 | 31 (5.4%) | 49 (7.6%) |
| $75,000 to $99,999 | 45 (7.8%) | 50 (7.8%) |
| $100,000+ | 246 (42.6%) | 204 (31.8%) |
| Total | 577 (100.0%) | 642 (100.0%) |
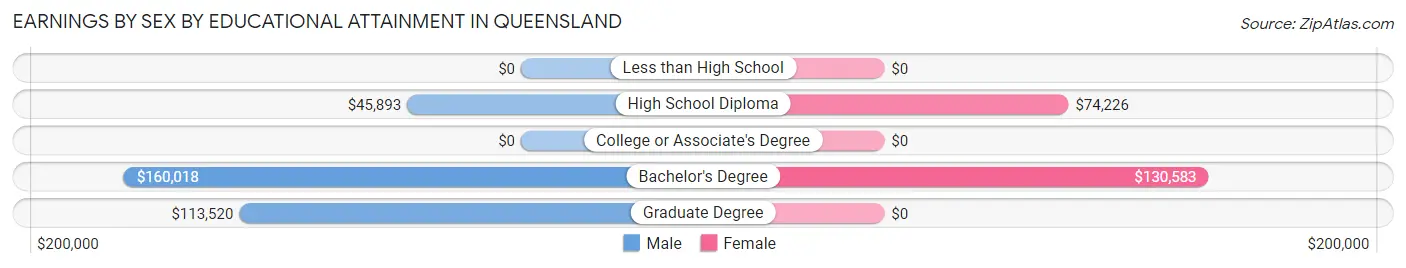
Earnings by Sex by Educational Attainment in Queensland
Average earnings in Queensland are $82,778 for men and $73,110 for women, a difference of 11.7%. Men with an educational attainment of bachelor's degree enjoy the highest average annual earnings of $160,018, while those with high school diploma education earn the least with $45,893. Women with an educational attainment of bachelor's degree earn the most with the average annual earnings of $130,583, while those with high school diploma education have the smallest earnings of $74,226.
| Educational Attainment | Male Income | Female Income |
| Less than High School | - | - |
| High School Diploma | $45,893 | $74,226 |
| College or Associate's Degree | - | - |
| Bachelor's Degree | $160,018 | $130,583 |
| Graduate Degree | $113,520 | $0 |
| Total | $82,778 | $73,110 |
Family Income in Queensland
Family Income Brackets in Queensland
According to the Queensland family income data, there are 249 families falling into the $200,000+ income range, which is the most common income bracket and makes up 41.0% of all families.
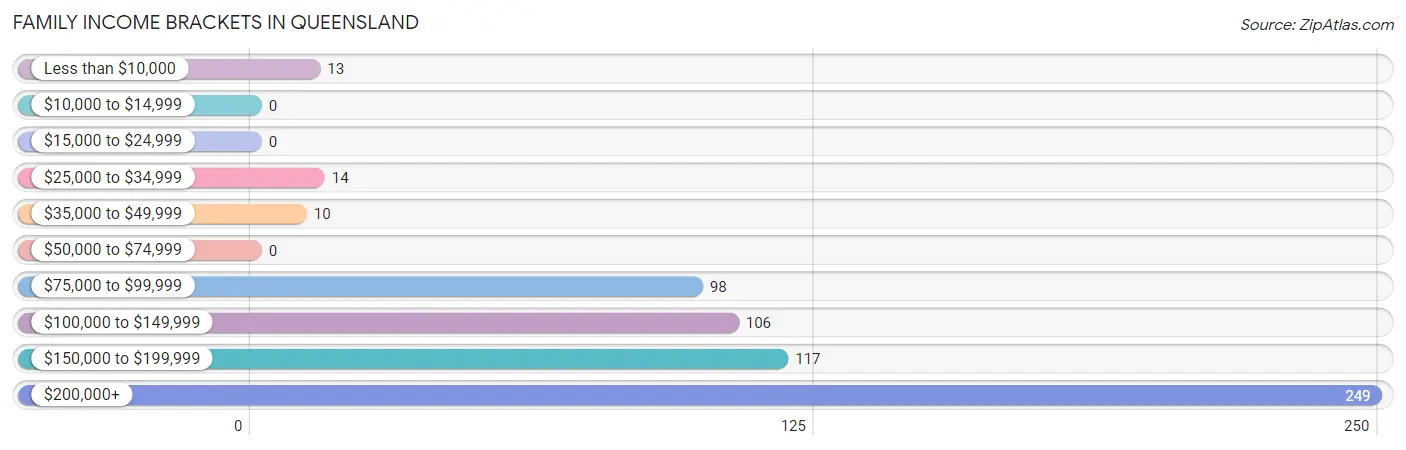
| Income Bracket | # Families | % Families |
| Less than $10,000 | 13 | 2.1% |
| $10,000 to $14,999 | 0 | 0.0% |
| $15,000 to $24,999 | 0 | 0.0% |
| $25,000 to $34,999 | 14 | 2.3% |
| $35,000 to $49,999 | 10 | 1.6% |
| $50,000 to $74,999 | 0 | 0.0% |
| $75,000 to $99,999 | 98 | 16.1% |
| $100,000 to $149,999 | 106 | 17.5% |
| $150,000 to $199,999 | 117 | 19.3% |
| $200,000+ | 249 | 41.0% |
Family Income by Famaliy Size in Queensland
4-person families (67 | 11.0%) account for the highest median family income in Queensland with $250,001 per family, while 2-person families (321 | 52.9%) have the highest median income of $101,340 per family member.
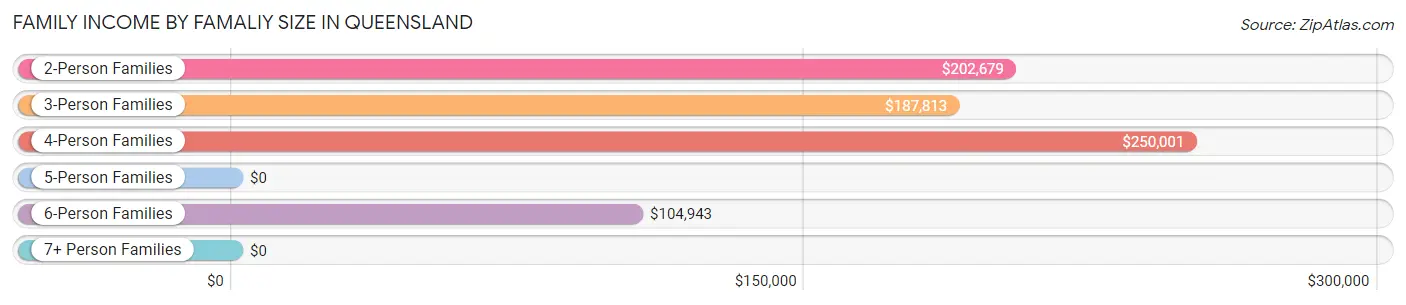
| Income Bracket | # Families | Median Income |
| 2-Person Families | 321 (52.9%) | $202,679 |
| 3-Person Families | 136 (22.4%) | $187,813 |
| 4-Person Families | 67 (11.0%) | $250,001 |
| 5-Person Families | 40 (6.6%) | $0 |
| 6-Person Families | 43 (7.1%) | $104,943 |
| 7+ Person Families | 0 (0.0%) | $0 |
| Total | 607 (100.0%) | $163,523 |
Family Income by Number of Earners in Queensland
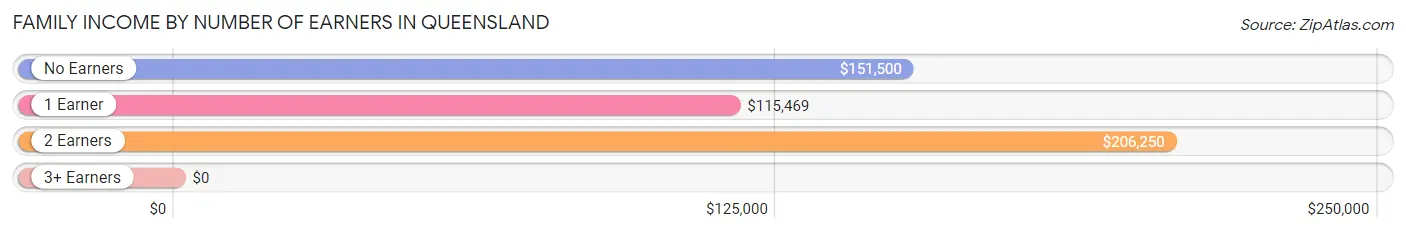
| Number of Earners | # Families | Median Income |
| No Earners | 68 (11.2%) | $151,500 |
| 1 Earner | 113 (18.6%) | $115,469 |
| 2 Earners | 354 (58.3%) | $206,250 |
| 3+ Earners | 72 (11.9%) | $0 |
| Total | 607 (100.0%) | $163,523 |
Household Income in Queensland
Household Income Brackets in Queensland
With 283 households falling in the category, the $200,000+ income range is the most frequent in Queensland, accounting for 42.9% of all households.
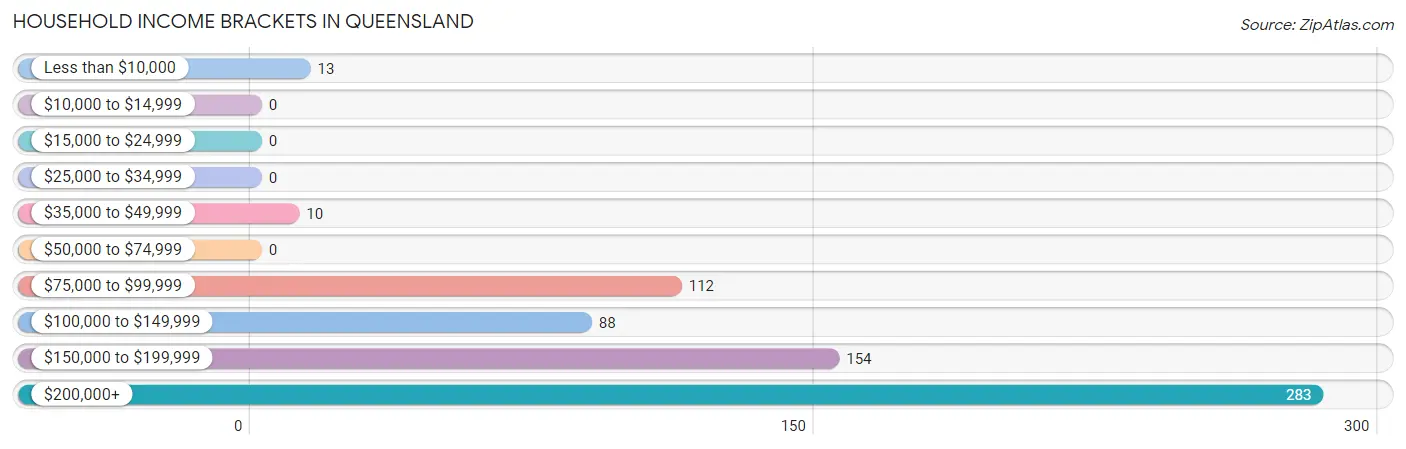
| Income Bracket | # Households | % Households |
| Less than $10,000 | 13 | 2.0% |
| $10,000 to $14,999 | 0 | 0.0% |
| $15,000 to $24,999 | 0 | 0.0% |
| $25,000 to $34,999 | 0 | 0.0% |
| $35,000 to $49,999 | 10 | 1.5% |
| $50,000 to $74,999 | 0 | 0.0% |
| $75,000 to $99,999 | 112 | 17.0% |
| $100,000 to $149,999 | 88 | 13.3% |
| $150,000 to $199,999 | 154 | 23.3% |
| $200,000+ | 283 | 42.9% |
Household Income by Householder Age in Queensland
The median household income in Queensland is $169,773, with the highest median household income of $207,696 found in the 45 to 64 years age bracket for the primary householder. A total of 395 households (59.9%) fall into this category. Meanwhile, the 15 to 24 years age bracket for the primary householder has the lowest median household income of $0, with 19 households (2.9%) in this group.
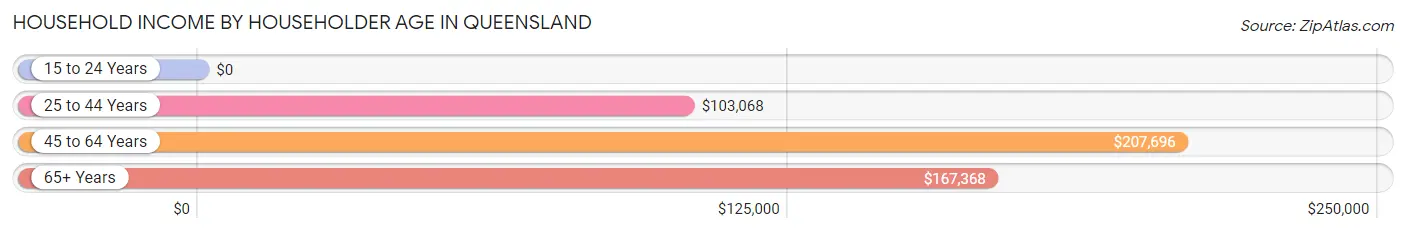
| Income Bracket | # Households | Median Income |
| 15 to 24 Years | 19 (2.9%) | $0 |
| 25 to 44 Years | 160 (24.2%) | $103,068 |
| 45 to 64 Years | 395 (59.9%) | $207,696 |
| 65+ Years | 86 (13.0%) | $167,368 |
| Total | 660 (100.0%) | $169,773 |
Poverty in Queensland
Income Below Poverty by Sex and Age in Queensland
With 6.2% poverty level for males and 7.1% for females among the residents of Queensland, 35 to 44 year old males and 65 to 74 year old females are the most vulnerable to poverty, with 20 males (19.4%) and 35 females (35.7%) in their respective age groups living below the poverty level.
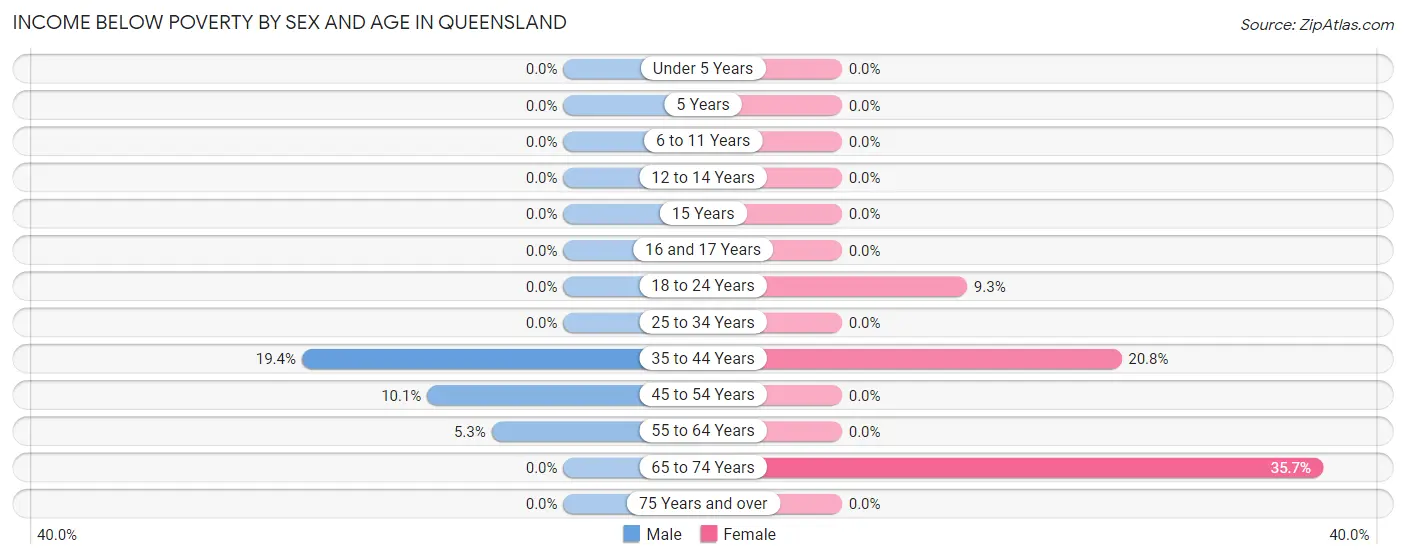
| Age Bracket | Male | Female |
| Under 5 Years | 0 (0.0%) | 0 (0.0%) |
| 5 Years | 0 (0.0%) | 0 (0.0%) |
| 6 to 11 Years | 0 (0.0%) | 0 (0.0%) |
| 12 to 14 Years | 0 (0.0%) | 0 (0.0%) |
| 15 Years | 0 (0.0%) | 0 (0.0%) |
| 16 and 17 Years | 0 (0.0%) | 0 (0.0%) |
| 18 to 24 Years | 0 (0.0%) | 17 (9.3%) |
| 25 to 34 Years | 0 (0.0%) | 0 (0.0%) |
| 35 to 44 Years | 20 (19.4%) | 33 (20.7%) |
| 45 to 54 Years | 19 (10.1%) | 0 (0.0%) |
| 55 to 64 Years | 13 (5.3%) | 0 (0.0%) |
| 65 to 74 Years | 0 (0.0%) | 35 (35.7%) |
| 75 Years and over | 0 (0.0%) | 0 (0.0%) |
| Total | 52 (6.2%) | 85 (7.1%) |
Income Above Poverty by Sex and Age in Queensland
According to the poverty statistics in Queensland, males aged under 5 years and females aged under 5 years are the age groups that are most secure financially, with 100.0% of males and 100.0% of females in these age groups living above the poverty line.
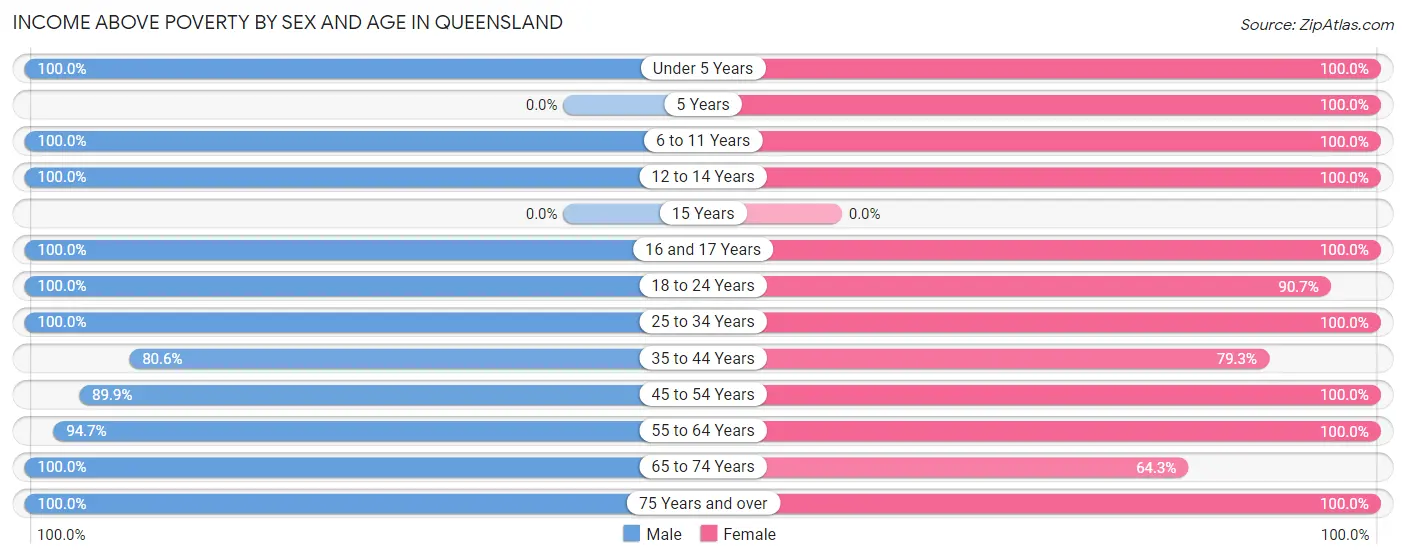
| Age Bracket | Male | Female |
| Under 5 Years | 19 (100.0%) | 46 (100.0%) |
| 5 Years | 0 (0.0%) | 11 (100.0%) |
| 6 to 11 Years | 37 (100.0%) | 36 (100.0%) |
| 12 to 14 Years | 45 (100.0%) | 60 (100.0%) |
| 15 Years | 0 (0.0%) | 0 (0.0%) |
| 16 and 17 Years | 7 (100.0%) | 48 (100.0%) |
| 18 to 24 Years | 40 (100.0%) | 166 (90.7%) |
| 25 to 34 Years | 61 (100.0%) | 83 (100.0%) |
| 35 to 44 Years | 83 (80.6%) | 126 (79.2%) |
| 45 to 54 Years | 169 (89.9%) | 194 (100.0%) |
| 55 to 64 Years | 231 (94.7%) | 257 (100.0%) |
| 65 to 74 Years | 82 (100.0%) | 63 (64.3%) |
| 75 Years and over | 7 (100.0%) | 21 (100.0%) |
| Total | 781 (93.8%) | 1,111 (92.9%) |
Income Below Poverty Among Married-Couple Families in Queensland
The poverty statistics for married-couple families in Queensland show that 3.0% or 13 of the total 430 families live below the poverty line. Families with no children have the highest poverty rate of 3.9%, comprising of 13 families. On the other hand, families with 1 or 2 children have the lowest poverty rate of 0.0%, which includes 0 families.
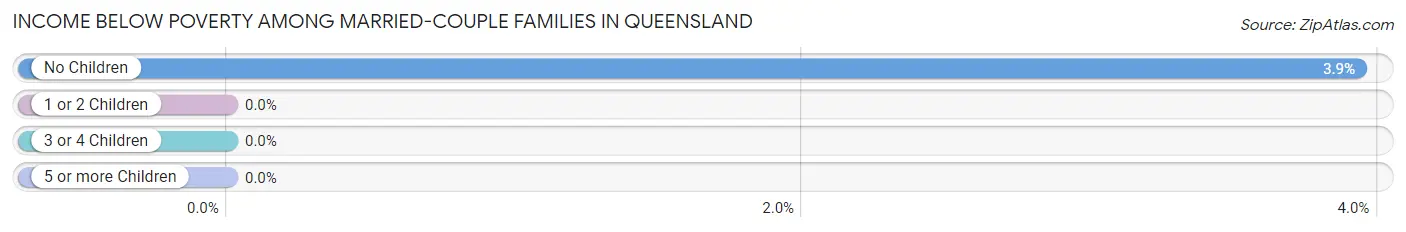
| Children | Above Poverty | Below Poverty |
| No Children | 318 (96.1%) | 13 (3.9%) |
| 1 or 2 Children | 77 (100.0%) | 0 (0.0%) |
| 3 or 4 Children | 22 (100.0%) | 0 (0.0%) |
| 5 or more Children | 0 (0.0%) | 0 (0.0%) |
| Total | 417 (97.0%) | 13 (3.0%) |
Income Below Poverty Among Single-Parent Households in Queensland
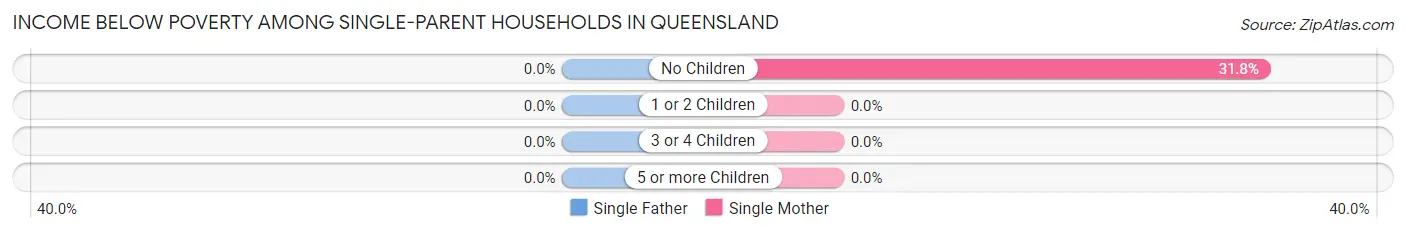
| Children | Single Father | Single Mother |
| No Children | 0 (0.0%) | 14 (31.8%) |
| 1 or 2 Children | 0 (0.0%) | 0 (0.0%) |
| 3 or 4 Children | 0 (0.0%) | 0 (0.0%) |
| 5 or more Children | 0 (0.0%) | 0 (0.0%) |
| Total | 0 (0.0%) | 14 (14.4%) |
Income Below Poverty Among Married-Couple vs Single-Parent Households in Queensland
The poverty data for Queensland shows that 13 of the married-couple family households (3.0%) and 14 of the single-parent households (7.9%) are living below the poverty level. Within the married-couple family households, those with no children have the highest poverty rate, with 13 households (3.9%) falling below the poverty line. Among the single-parent households, those with no children have the highest poverty rate, with 14 household (18.4%) living below poverty.
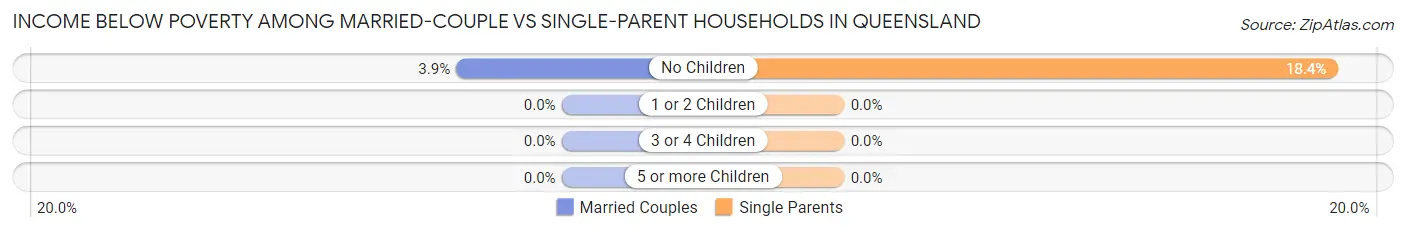
| Children | Married-Couple Families | Single-Parent Households |
| No Children | 13 (3.9%) | 14 (18.4%) |
| 1 or 2 Children | 0 (0.0%) | 0 (0.0%) |
| 3 or 4 Children | 0 (0.0%) | 0 (0.0%) |
| 5 or more Children | 0 (0.0%) | 0 (0.0%) |
| Total | 13 (3.0%) | 14 (7.9%) |
Race in Queensland
The most populous races in Queensland are Black / African American (1,622 | 79.7%), Two or more Races (190 | 9.3%), and Hispanic or Latino (180 | 8.8%).
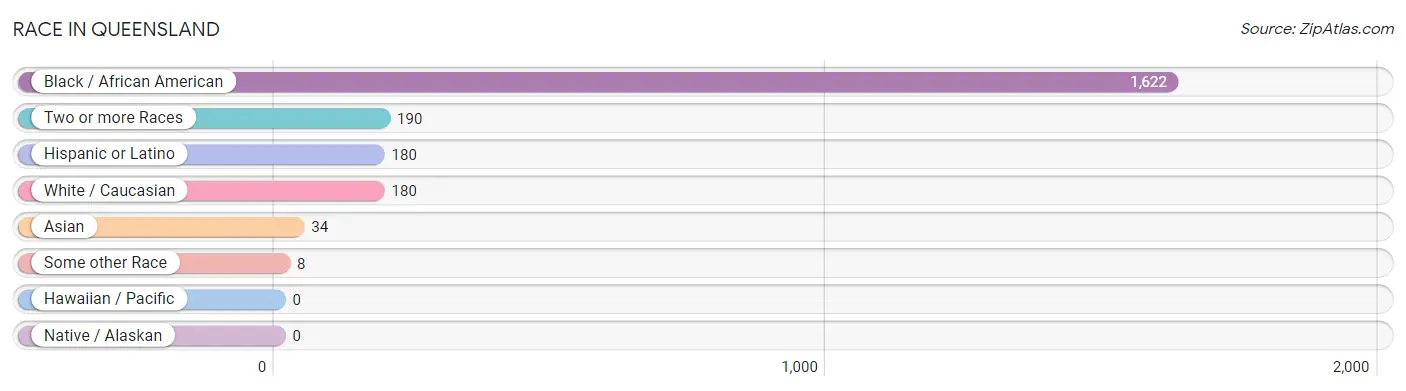
| Race | # Population | % Population |
| Asian | 34 | 1.7% |
| Black / African American | 1,622 | 79.7% |
| Hawaiian / Pacific | 0 | 0.0% |
| Hispanic or Latino | 180 | 8.8% |
| Native / Alaskan | 0 | 0.0% |
| White / Caucasian | 180 | 8.8% |
| Two or more Races | 190 | 9.3% |
| Some other Race | 8 | 0.4% |
| Total | 2,034 | 100.0% |
Ancestry in Queensland
The most populous ancestries reported in Queensland are Subsaharan African (324 | 15.9%), Ghanaian (127 | 6.2%), Mexican (122 | 6.0%), English (87 | 4.3%), and African (68 | 3.3%), together accounting for 35.8% of all Queensland residents.
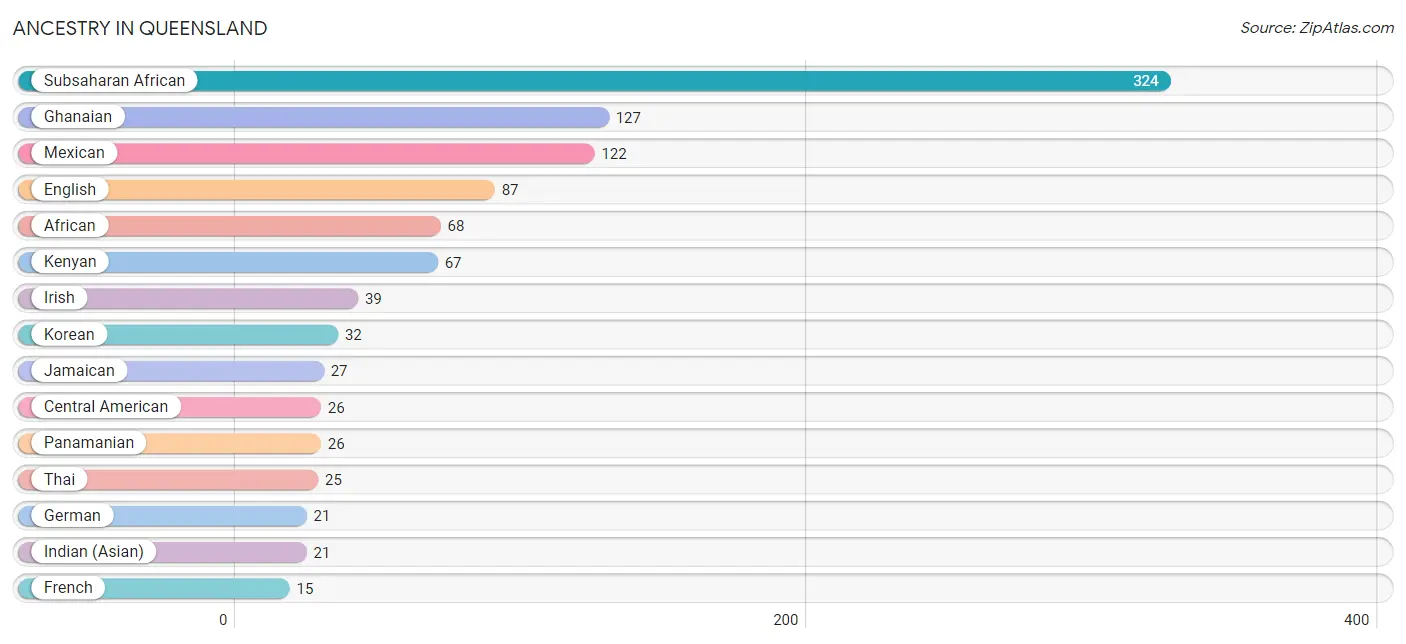
| Ancestry | # Population | % Population |
| African | 68 | 3.3% |
| Central American | 26 | 1.3% |
| Ecuadorian | 8 | 0.4% |
| English | 87 | 4.3% |
| French | 15 | 0.7% |
| German | 21 | 1.0% |
| Ghanaian | 127 | 6.2% |
| Indian (Asian) | 21 | 1.0% |
| Irish | 39 | 1.9% |
| Italian | 11 | 0.5% |
| Jamaican | 27 | 1.3% |
| Kenyan | 67 | 3.3% |
| Korean | 32 | 1.6% |
| Mexican | 122 | 6.0% |
| Nigerian | 11 | 0.5% |
| Norwegian | 15 | 0.7% |
| Panamanian | 26 | 1.3% |
| Puerto Rican | 9 | 0.4% |
| South American | 8 | 0.4% |
| Subsaharan African | 324 | 15.9% |
| Thai | 25 | 1.2% | View All 21 Rows |
Immigrants in Queensland
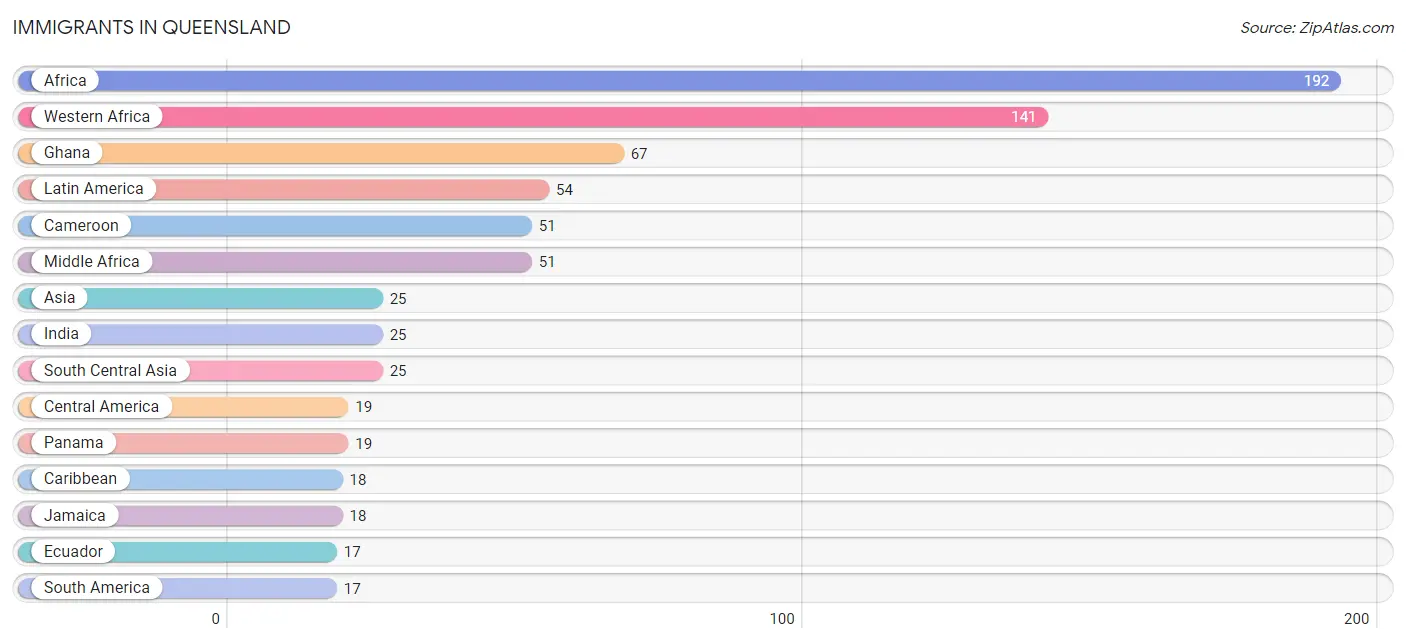
The most numerous immigrant groups reported in Queensland came from Africa (192 | 9.4%), Western Africa (141 | 6.9%), Ghana (67 | 3.3%), Latin America (54 | 2.6%), and Cameroon (51 | 2.5%), together accounting for 24.8% of all Queensland residents.
| Immigration Origin | # Population | % Population |
| Africa | 192 | 9.4% |
| Asia | 25 | 1.2% |
| Cameroon | 51 | 2.5% |
| Caribbean | 18 | 0.9% |
| Central America | 19 | 0.9% |
| Ecuador | 17 | 0.8% |
| Ghana | 67 | 3.3% |
| India | 25 | 1.2% |
| Jamaica | 18 | 0.9% |
| Latin America | 54 | 2.6% |
| Middle Africa | 51 | 2.5% |
| Nigeria | 11 | 0.5% |
| Panama | 19 | 0.9% |
| South America | 17 | 0.8% |
| South Central Asia | 25 | 1.2% |
| Western Africa | 141 | 6.9% | View All 16 Rows |
Sex and Age in Queensland
Sex and Age in Queensland
The most populous age groups in Queensland are 60 to 64 Years (184 | 22.0%) for men and 20 to 24 Years (140 | 11.7%) for women.
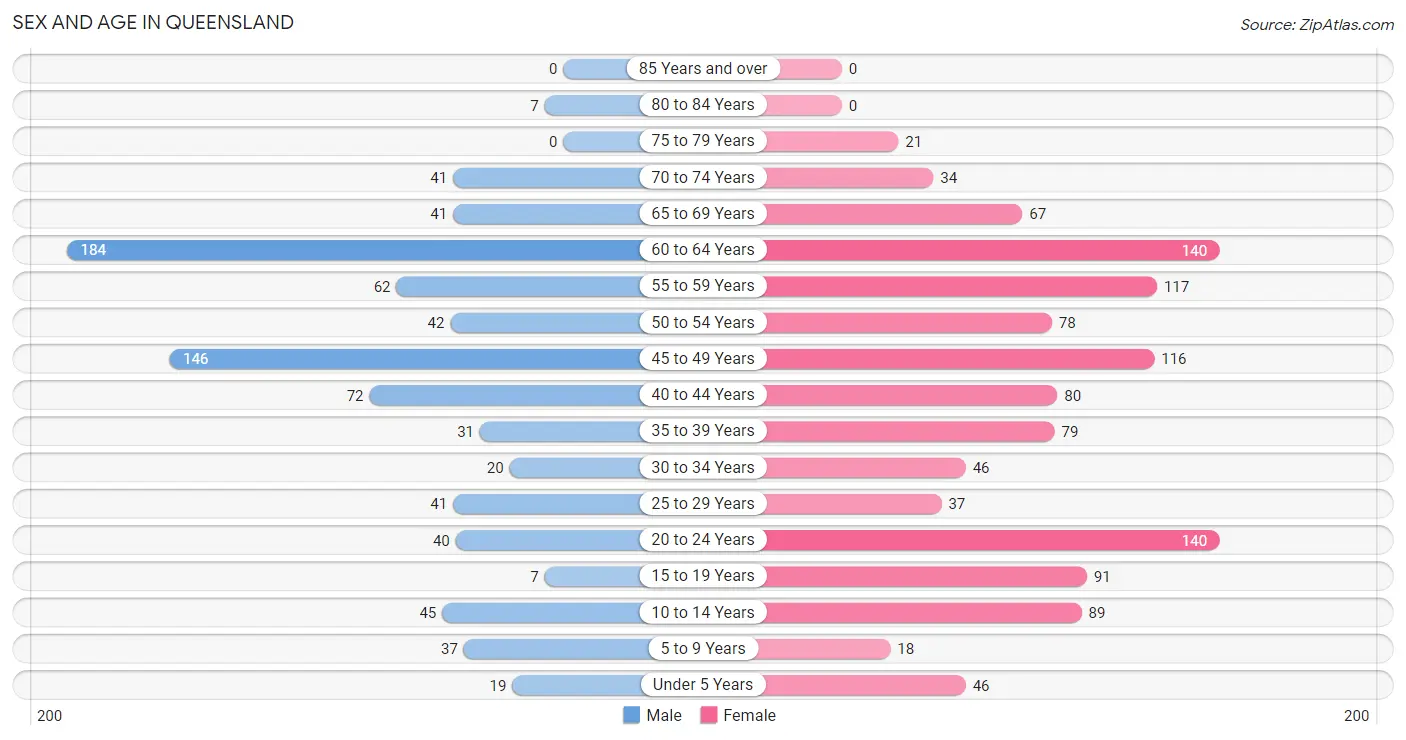
| Age Bracket | Male | Female |
| Under 5 Years | 19 (2.3%) | 46 (3.8%) |
| 5 to 9 Years | 37 (4.4%) | 18 (1.5%) |
| 10 to 14 Years | 45 (5.4%) | 89 (7.4%) |
| 15 to 19 Years | 7 (0.8%) | 91 (7.6%) |
| 20 to 24 Years | 40 (4.8%) | 140 (11.7%) |
| 25 to 29 Years | 41 (4.9%) | 37 (3.1%) |
| 30 to 34 Years | 20 (2.4%) | 46 (3.8%) |
| 35 to 39 Years | 31 (3.7%) | 79 (6.6%) |
| 40 to 44 Years | 72 (8.6%) | 80 (6.7%) |
| 45 to 49 Years | 146 (17.5%) | 116 (9.7%) |
| 50 to 54 Years | 42 (5.0%) | 78 (6.5%) |
| 55 to 59 Years | 62 (7.4%) | 117 (9.8%) |
| 60 to 64 Years | 184 (22.0%) | 140 (11.7%) |
| 65 to 69 Years | 41 (4.9%) | 67 (5.6%) |
| 70 to 74 Years | 41 (4.9%) | 34 (2.8%) |
| 75 to 79 Years | 0 (0.0%) | 21 (1.8%) |
| 80 to 84 Years | 7 (0.8%) | 0 (0.0%) |
| 85 Years and over | 0 (0.0%) | 0 (0.0%) |
| Total | 835 (100.0%) | 1,199 (100.0%) |
Families and Households in Queensland
Median Family Size in Queensland
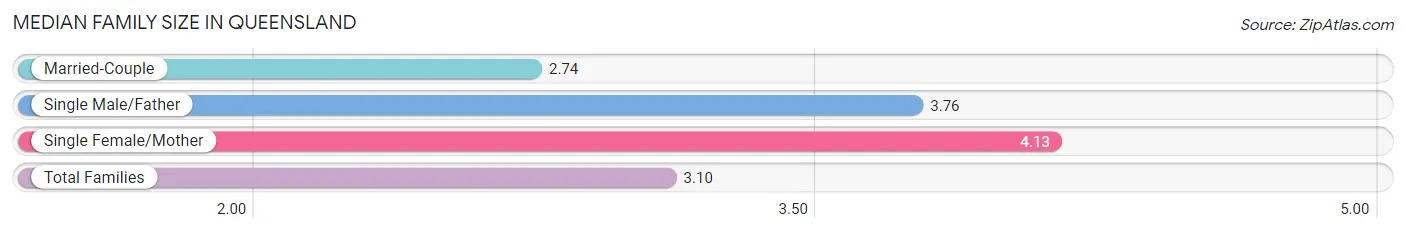
The median family size in Queensland is 3.10 persons per family, with single female/mother families (97 | 16.0%) accounting for the largest median family size of 4.13 persons per family. On the other hand, married-couple families (430 | 70.8%) represent the smallest median family size with 2.74 persons per family.
| Family Type | # Families | Family Size |
| Married-Couple | 430 (70.8%) | 2.74 |
| Single Male/Father | 80 (13.2%) | 3.76 |
| Single Female/Mother | 97 (16.0%) | 4.13 |
| Total Families | 607 (100.0%) | 3.10 |
Median Household Size in Queensland
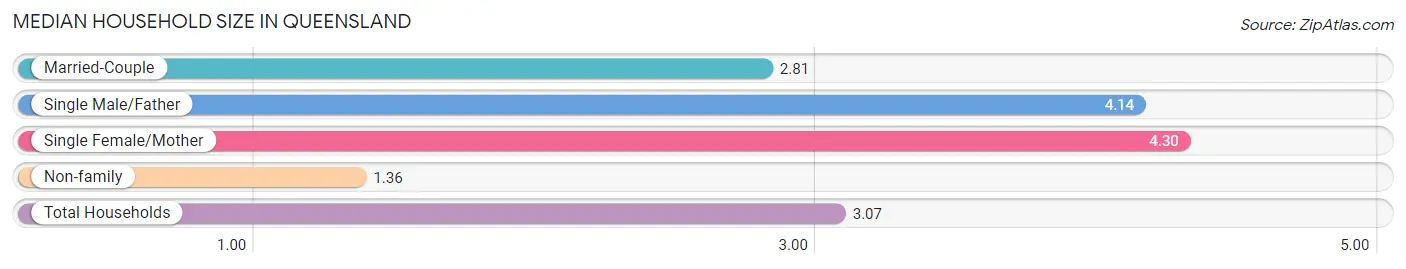
The median household size in Queensland is 3.07 persons per household, with single female/mother households (97 | 14.7%) accounting for the largest median household size of 4.3 persons per household. non-family households (53 | 8.0%) represent the smallest median household size with 1.36 persons per household.
| Household Type | # Households | Household Size |
| Married-Couple | 430 (65.1%) | 2.81 |
| Single Male/Father | 80 (12.1%) | 4.14 |
| Single Female/Mother | 97 (14.7%) | 4.30 |
| Non-family | 53 (8.0%) | 1.36 |
| Total Households | 660 (100.0%) | 3.07 |
Household Size by Marriage Status in Queensland
Out of a total of 660 households in Queensland, 607 (92.0%) are family households, while 53 (8.0%) are nonfamily households. The most numerous type of family households are 2-person households, comprising 321, and the most common type of nonfamily households are 1-person households, comprising 38.
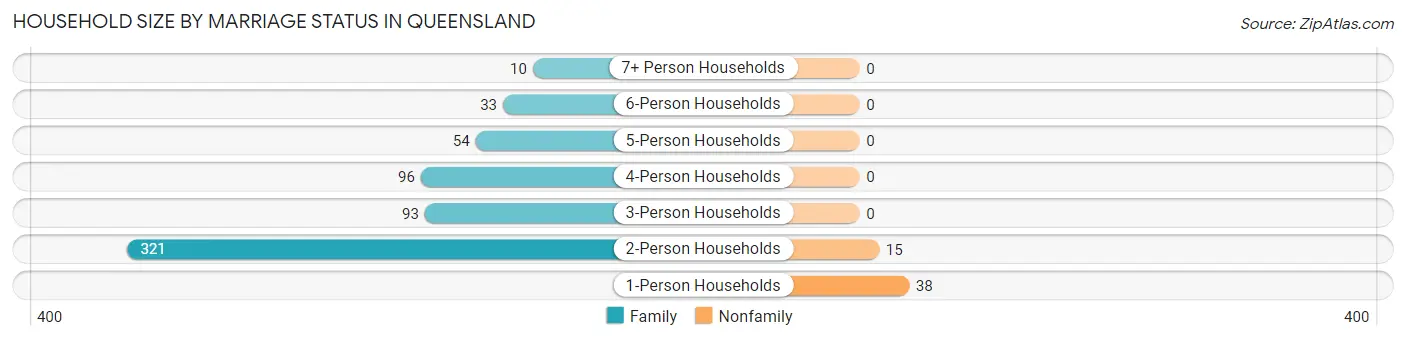
| Household Size | Family Households | Nonfamily Households |
| 1-Person Households | - | 38 (5.8%) |
| 2-Person Households | 321 (48.6%) | 15 (2.3%) |
| 3-Person Households | 93 (14.1%) | 0 (0.0%) |
| 4-Person Households | 96 (14.5%) | 0 (0.0%) |
| 5-Person Households | 54 (8.2%) | 0 (0.0%) |
| 6-Person Households | 33 (5.0%) | 0 (0.0%) |
| 7+ Person Households | 10 (1.5%) | 0 (0.0%) |
| Total | 607 (92.0%) | 53 (8.0%) |
Female Fertility in Queensland
Fertility by Age in Queensland
Average fertility rate in Queensland is 14.0 births per 1,000 women. Women in the age bracket of 35 to 50 years have the highest fertility rate with 29.0 births per 1,000 women. Women in the age bracket of 35 to 50 years acount for 100.0% of all women with births.
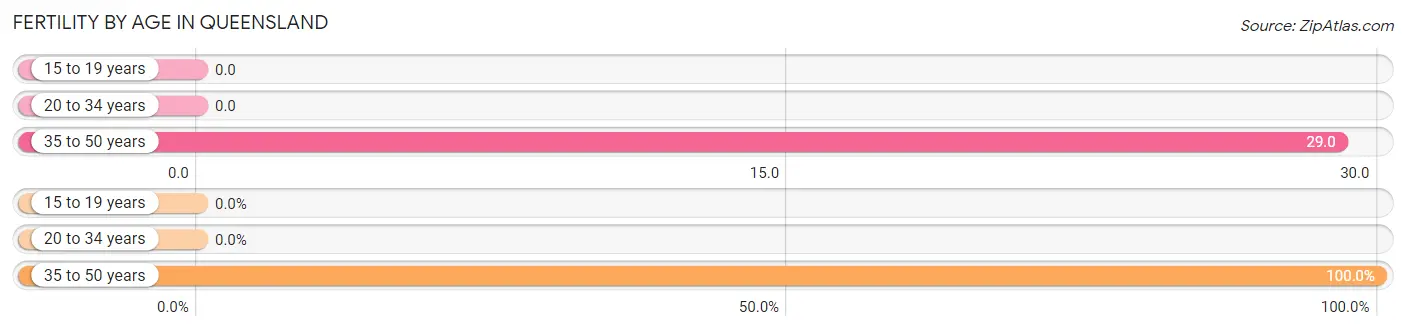
| Age Bracket | Women with Births | Births / 1,000 Women |
| 15 to 19 years | 0 (0.0%) | 0.0 |
| 20 to 34 years | 0 (0.0%) | 0.0 |
| 35 to 50 years | 9 (100.0%) | 29.0 |
| Total | 9 (100.0%) | 14.0 |
Fertility by Age by Marriage Status in Queensland
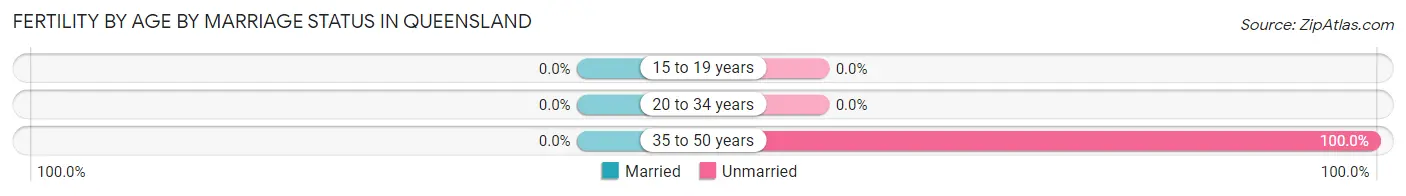
| Age Bracket | Married | Unmarried |
| 15 to 19 years | 0 (0.0%) | 0 (0.0%) |
| 20 to 34 years | 0 (0.0%) | 0 (0.0%) |
| 35 to 50 years | 0 (0.0%) | 9 (100.0%) |
| Total | 0 (0.0%) | 9 (100.0%) |
Fertility by Education in Queensland
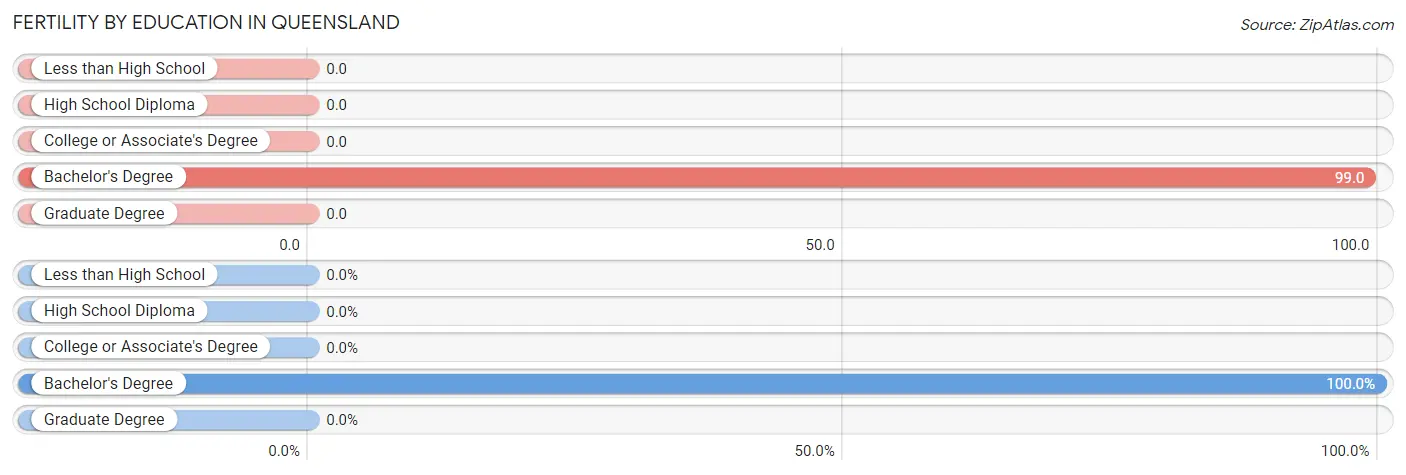
| Educational Attainment | Women with Births | Births / 1,000 Women |
| Less than High School | 0 (0.0%) | 0.0 |
| High School Diploma | 0 (0.0%) | 0.0 |
| College or Associate's Degree | 0 (0.0%) | 0.0 |
| Bachelor's Degree | 9 (100.0%) | 99.0 |
| Graduate Degree | 0 (0.0%) | 0.0 |
| Total | 9 (100.0%) | 14.0 |
Fertility by Education by Marriage Status in Queensland
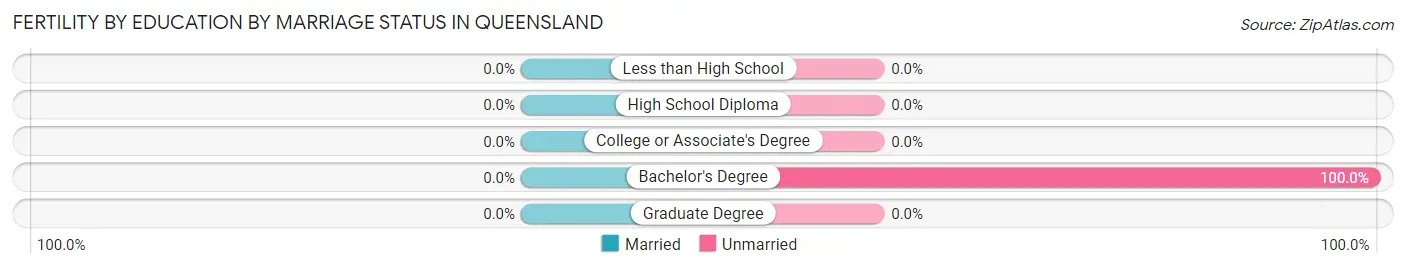
| Educational Attainment | Married | Unmarried |
| Less than High School | 0 (0.0%) | 0 (0.0%) |
| High School Diploma | 0 (0.0%) | 0 (0.0%) |
| College or Associate's Degree | 0 (0.0%) | 0 (0.0%) |
| Bachelor's Degree | 0 (0.0%) | 9 (100.0%) |
| Graduate Degree | 0 (0.0%) | 0 (0.0%) |
| Total | 0 (0.0%) | 9 (100.0%) |
Employment Characteristics in Queensland
Employment by Class of Employer in Queensland
Among the 1,079 employed individuals in Queensland, private company employees (442 | 41.0%), federal government employees (261 | 24.2%), and state government employees (111 | 10.3%) make up the most common classes of employment.
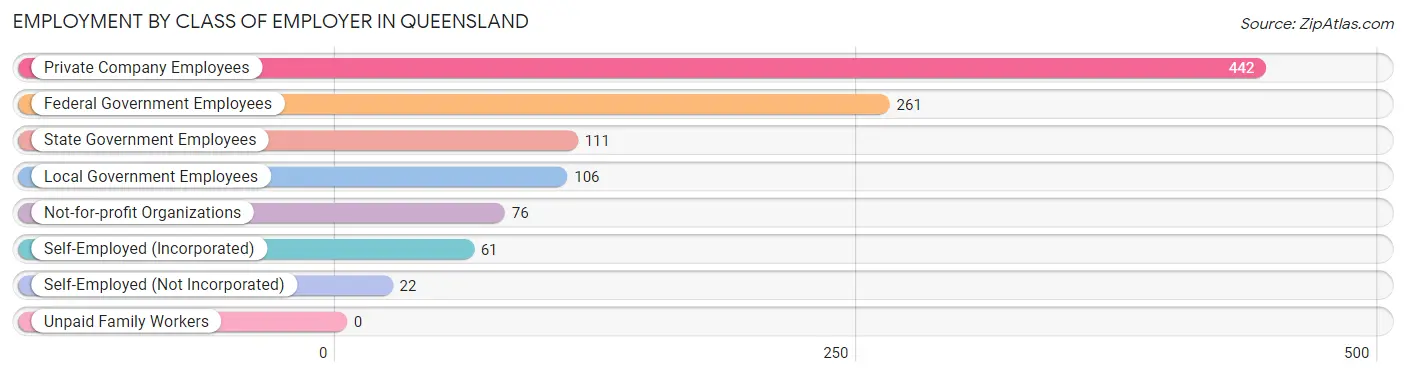
| Employer Class | # Employees | % Employees |
| Private Company Employees | 442 | 41.0% |
| Self-Employed (Incorporated) | 61 | 5.7% |
| Self-Employed (Not Incorporated) | 22 | 2.0% |
| Not-for-profit Organizations | 76 | 7.0% |
| Local Government Employees | 106 | 9.8% |
| State Government Employees | 111 | 10.3% |
| Federal Government Employees | 261 | 24.2% |
| Unpaid Family Workers | 0 | 0.0% |
| Total | 1,079 | 100.0% |
Employment Status by Age in Queensland
According to the labor force statistics for Queensland, out of the total population over 16 years of age (1,780), 65.3% or 1,162 individuals are in the labor force, with 2.0% or 23 of them unemployed. The age group with the highest labor force participation rate is 30 to 34 years, with 100.0% or 66 individuals in the labor force. Within the labor force, the 55 to 59 years age range has the highest percentage of unemployed individuals, with 8.3% or 10 of them being unemployed.
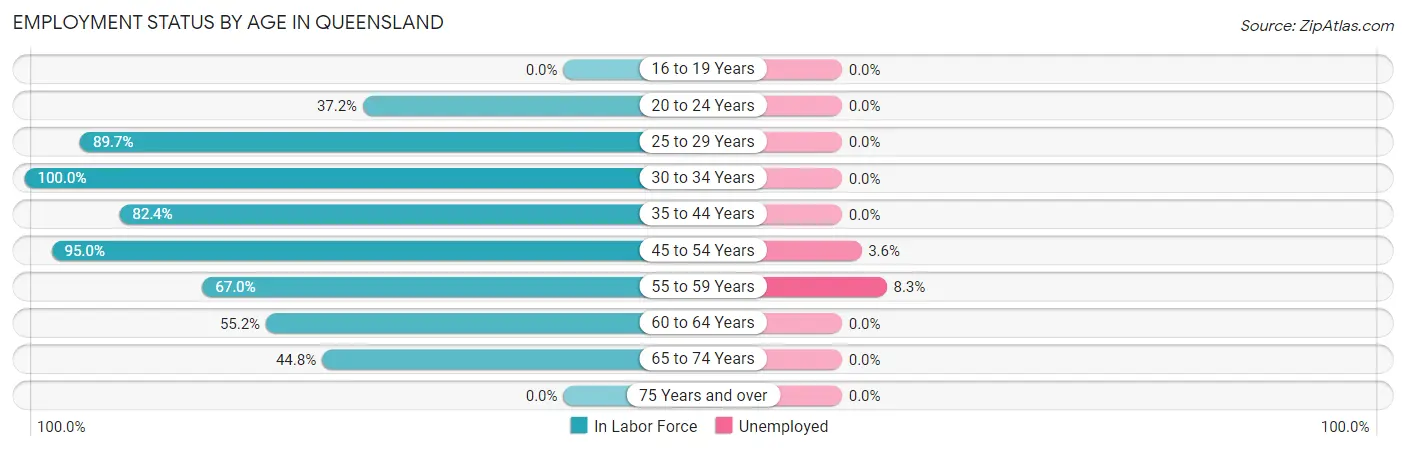
| Age Bracket | In Labor Force | Unemployed |
| 16 to 19 Years | 0 (0.0%) | 0 (0.0%) |
| 20 to 24 Years | 67 (37.2%) | 0 (0.0%) |
| 25 to 29 Years | 70 (89.7%) | 0 (0.0%) |
| 30 to 34 Years | 66 (100.0%) | 0 (0.0%) |
| 35 to 44 Years | 216 (82.4%) | 0 (0.0%) |
| 45 to 54 Years | 363 (95.0%) | 13 (3.6%) |
| 55 to 59 Years | 120 (67.0%) | 10 (8.3%) |
| 60 to 64 Years | 179 (55.2%) | 0 (0.0%) |
| 65 to 74 Years | 82 (44.8%) | 0 (0.0%) |
| 75 Years and over | 0 (0.0%) | 0 (0.0%) |
| Total | 1,162 (65.3%) | 23 (2.0%) |
Employment Status by Educational Attainment in Queensland
According to labor force statistics for Queensland, 78.5% of individuals (1,013) out of the total population between 25 and 64 years of age (1,291) are in the labor force, with 2.3% or 23 of them being unemployed. The group with the highest labor force participation rate are those with the educational attainment of high school diploma, with 94.9% or 261 individuals in the labor force. Within the labor force, individuals with high school diploma education have the highest percentage of unemployment, with 5.0% or 13 of them being unemployed.
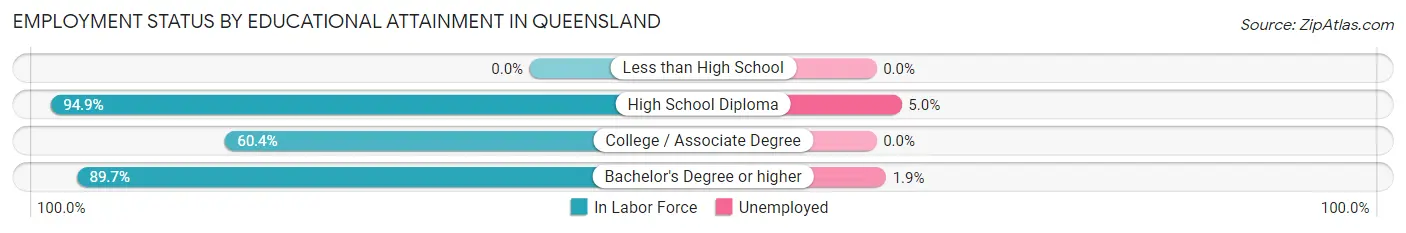
| Educational Attainment | In Labor Force | Unemployed |
| Less than High School | 0 (0.0%) | 0 (0.0%) |
| High School Diploma | 261 (94.9%) | 14 (5.0%) |
| College / Associate Degree | 223 (60.4%) | 0 (0.0%) |
| Bachelor's Degree or higher | 530 (89.7%) | 11 (1.9%) |
| Total | 1,013 (78.5%) | 30 (2.3%) |
Employment Occupations by Sex in Queensland
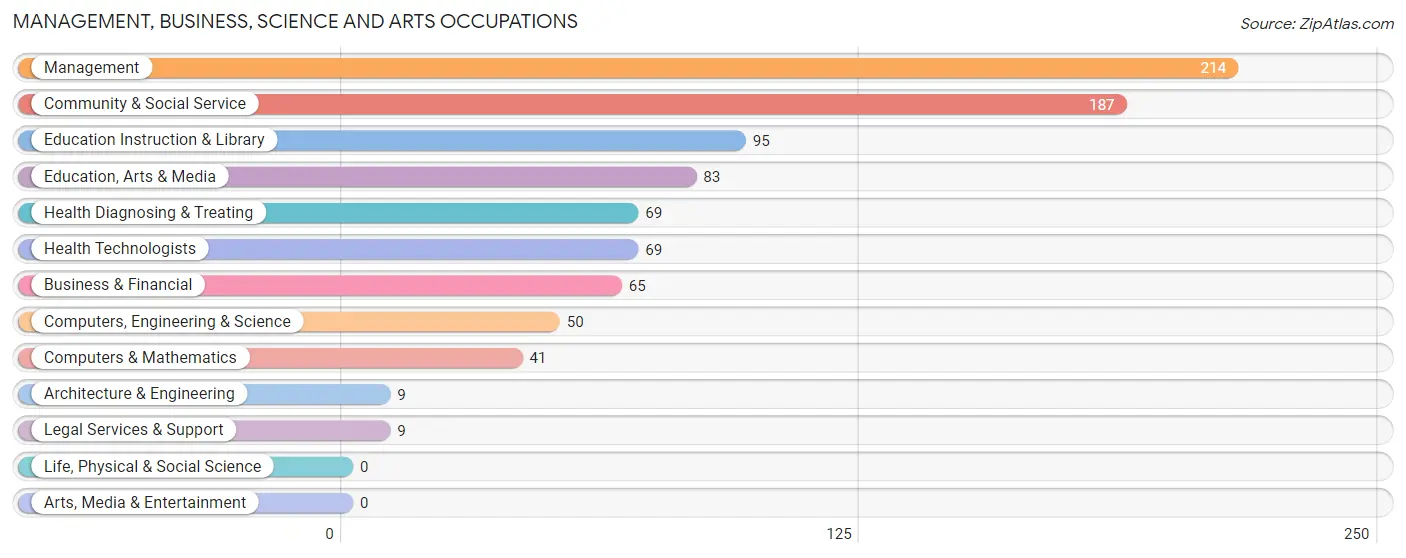
Management, Business, Science and Arts Occupations
The most common Management, Business, Science and Arts occupations in Queensland are Management (214 | 18.8%), Community & Social Service (187 | 16.4%), Education Instruction & Library (95 | 8.3%), Education, Arts & Media (83 | 7.3%), and Health Diagnosing & Treating (69 | 6.0%).
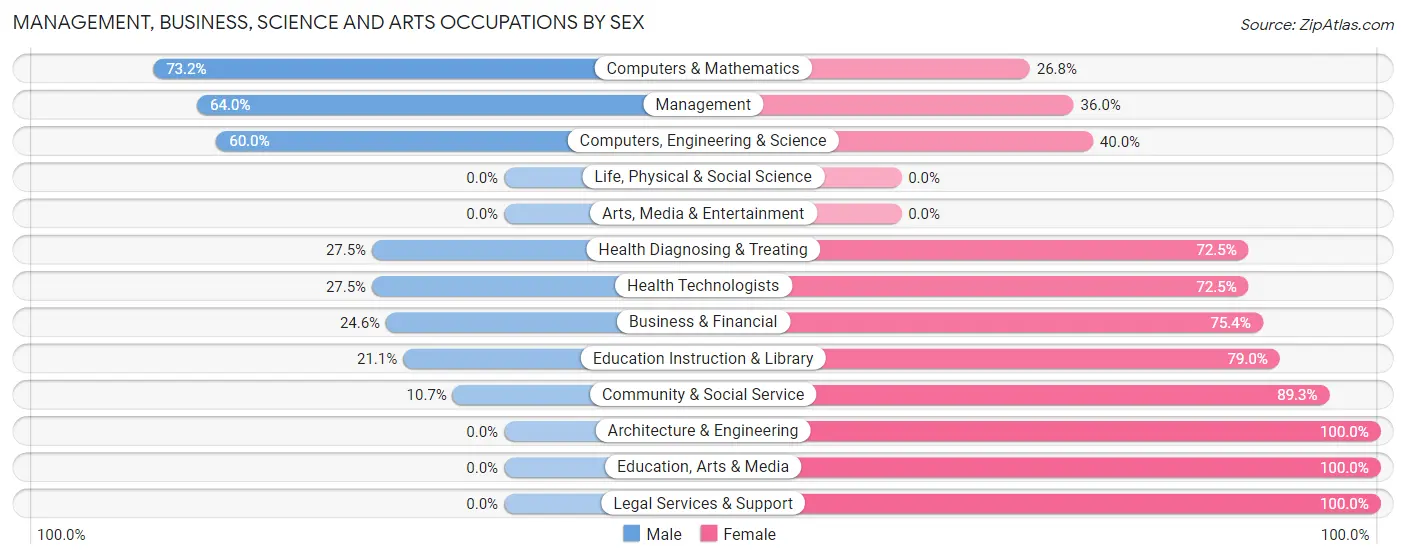
Management, Business, Science and Arts Occupations by Sex
Within the Management, Business, Science and Arts occupations in Queensland, the most male-oriented occupations are Computers & Mathematics (73.2%), Management (64.0%), and Computers, Engineering & Science (60.0%), while the most female-oriented occupations are Architecture & Engineering (100.0%), Education, Arts & Media (100.0%), and Legal Services & Support (100.0%).
| Occupation | Male | Female |
| Management | 137 (64.0%) | 77 (36.0%) |
| Business & Financial | 16 (24.6%) | 49 (75.4%) |
| Computers, Engineering & Science | 30 (60.0%) | 20 (40.0%) |
| Computers & Mathematics | 30 (73.2%) | 11 (26.8%) |
| Architecture & Engineering | 0 (0.0%) | 9 (100.0%) |
| Life, Physical & Social Science | 0 (0.0%) | 0 (0.0%) |
| Community & Social Service | 20 (10.7%) | 167 (89.3%) |
| Education, Arts & Media | 0 (0.0%) | 83 (100.0%) |
| Legal Services & Support | 0 (0.0%) | 9 (100.0%) |
| Education Instruction & Library | 20 (21.0%) | 75 (78.9%) |
| Arts, Media & Entertainment | 0 (0.0%) | 0 (0.0%) |
| Health Diagnosing & Treating | 19 (27.5%) | 50 (72.5%) |
| Health Technologists | 19 (27.5%) | 50 (72.5%) |
| Total (Category) | 222 (38.0%) | 363 (62.1%) |
| Total (Overall) | 534 (46.8%) | 606 (53.2%) |
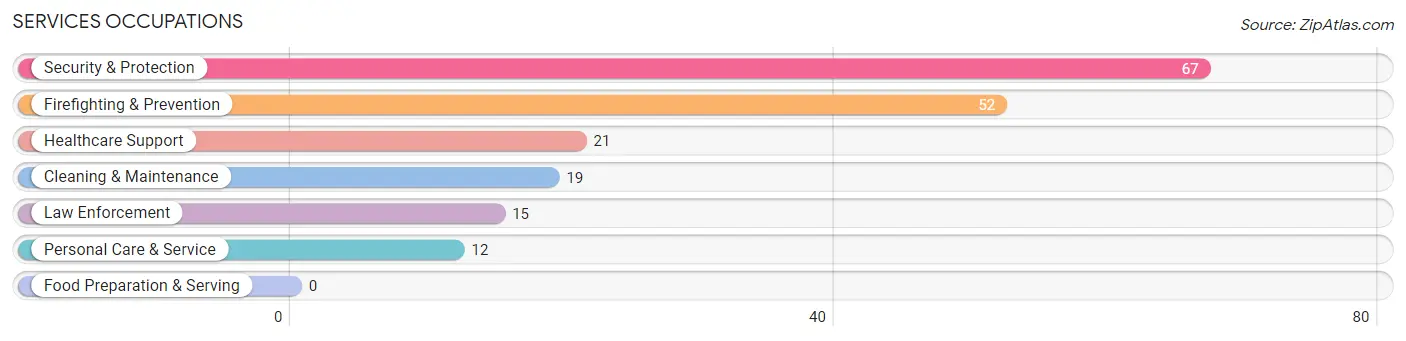
Services Occupations
The most common Services occupations in Queensland are Security & Protection (67 | 5.9%), Firefighting & Prevention (52 | 4.6%), Healthcare Support (21 | 1.8%), Cleaning & Maintenance (19 | 1.7%), and Law Enforcement (15 | 1.3%).
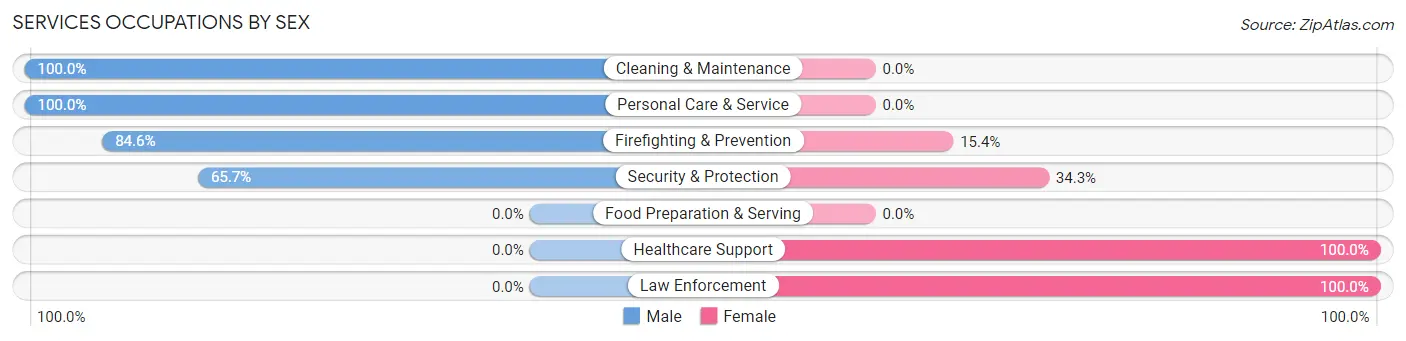
Services Occupations by Sex
Within the Services occupations in Queensland, the most male-oriented occupations are Cleaning & Maintenance (100.0%), Personal Care & Service (100.0%), and Firefighting & Prevention (84.6%), while the most female-oriented occupations are Healthcare Support (100.0%), Law Enforcement (100.0%), and Security & Protection (34.3%).
| Occupation | Male | Female |
| Healthcare Support | 0 (0.0%) | 21 (100.0%) |
| Security & Protection | 44 (65.7%) | 23 (34.3%) |
| Firefighting & Prevention | 44 (84.6%) | 8 (15.4%) |
| Law Enforcement | 0 (0.0%) | 15 (100.0%) |
| Food Preparation & Serving | 0 (0.0%) | 0 (0.0%) |
| Cleaning & Maintenance | 19 (100.0%) | 0 (0.0%) |
| Personal Care & Service | 12 (100.0%) | 0 (0.0%) |
| Total (Category) | 75 (63.0%) | 44 (37.0%) |
| Total (Overall) | 534 (46.8%) | 606 (53.2%) |
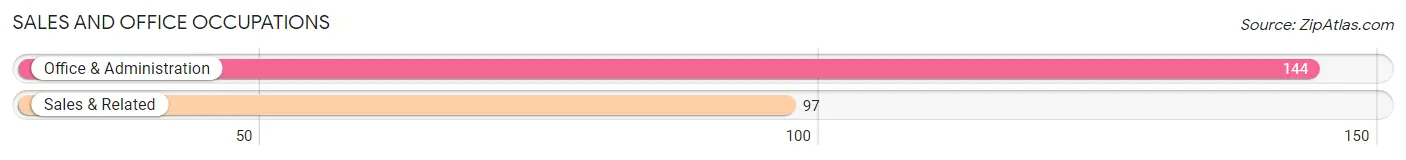
Sales and Office Occupations
The most common Sales and Office occupations in Queensland are Office & Administration (144 | 12.6%), and Sales & Related (97 | 8.5%).
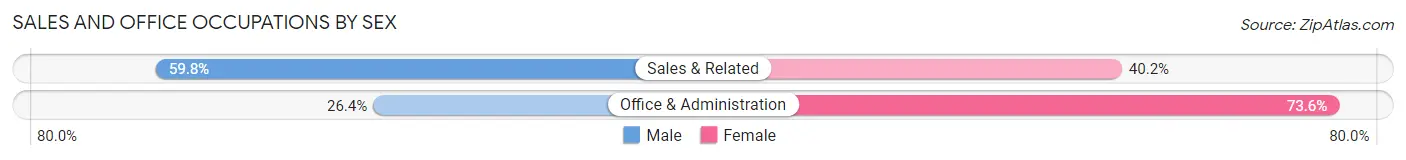
Sales and Office Occupations by Sex
| Occupation | Male | Female |
| Sales & Related | 58 (59.8%) | 39 (40.2%) |
| Office & Administration | 38 (26.4%) | 106 (73.6%) |
| Total (Category) | 96 (39.8%) | 145 (60.2%) |
| Total (Overall) | 534 (46.8%) | 606 (53.2%) |
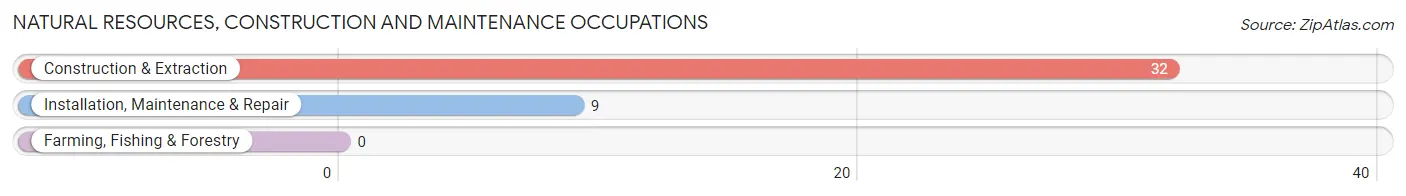
Natural Resources, Construction and Maintenance Occupations
The most common Natural Resources, Construction and Maintenance occupations in Queensland are Construction & Extraction (32 | 2.8%), and Installation, Maintenance & Repair (9 | 0.8%).
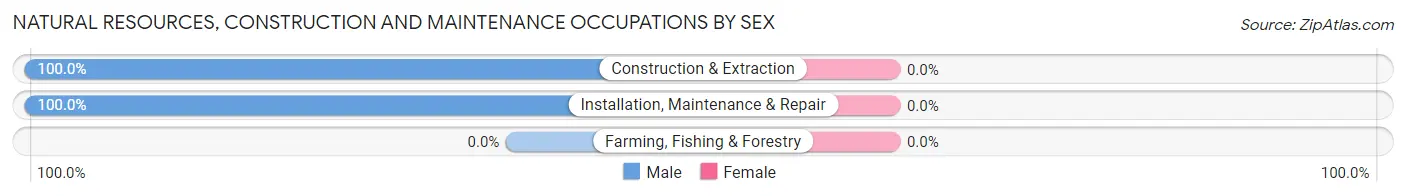
Natural Resources, Construction and Maintenance Occupations by Sex
| Occupation | Male | Female |
| Farming, Fishing & Forestry | 0 (0.0%) | 0 (0.0%) |
| Construction & Extraction | 32 (100.0%) | 0 (0.0%) |
| Installation, Maintenance & Repair | 9 (100.0%) | 0 (0.0%) |
| Total (Category) | 41 (100.0%) | 0 (0.0%) |
| Total (Overall) | 534 (46.8%) | 606 (53.2%) |
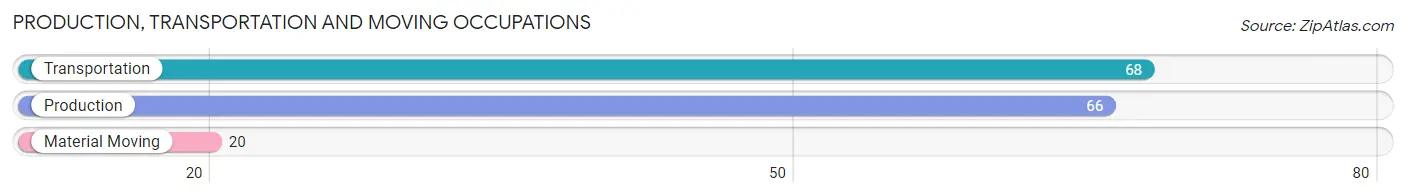
Production, Transportation and Moving Occupations
The most common Production, Transportation and Moving occupations in Queensland are Transportation (68 | 6.0%), Production (66 | 5.8%), and Material Moving (20 | 1.8%).
Production, Transportation and Moving Occupations by Sex
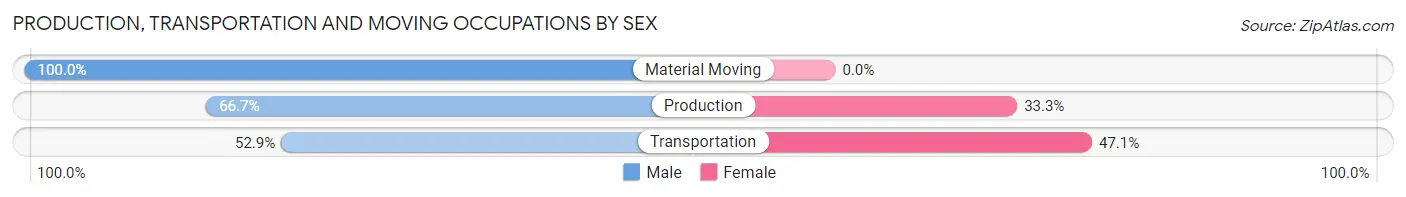
| Occupation | Male | Female |
| Production | 44 (66.7%) | 22 (33.3%) |
| Transportation | 36 (52.9%) | 32 (47.1%) |
| Material Moving | 20 (100.0%) | 0 (0.0%) |
| Total (Category) | 100 (64.9%) | 54 (35.1%) |
| Total (Overall) | 534 (46.8%) | 606 (53.2%) |
Employment Industries by Sex in Queensland
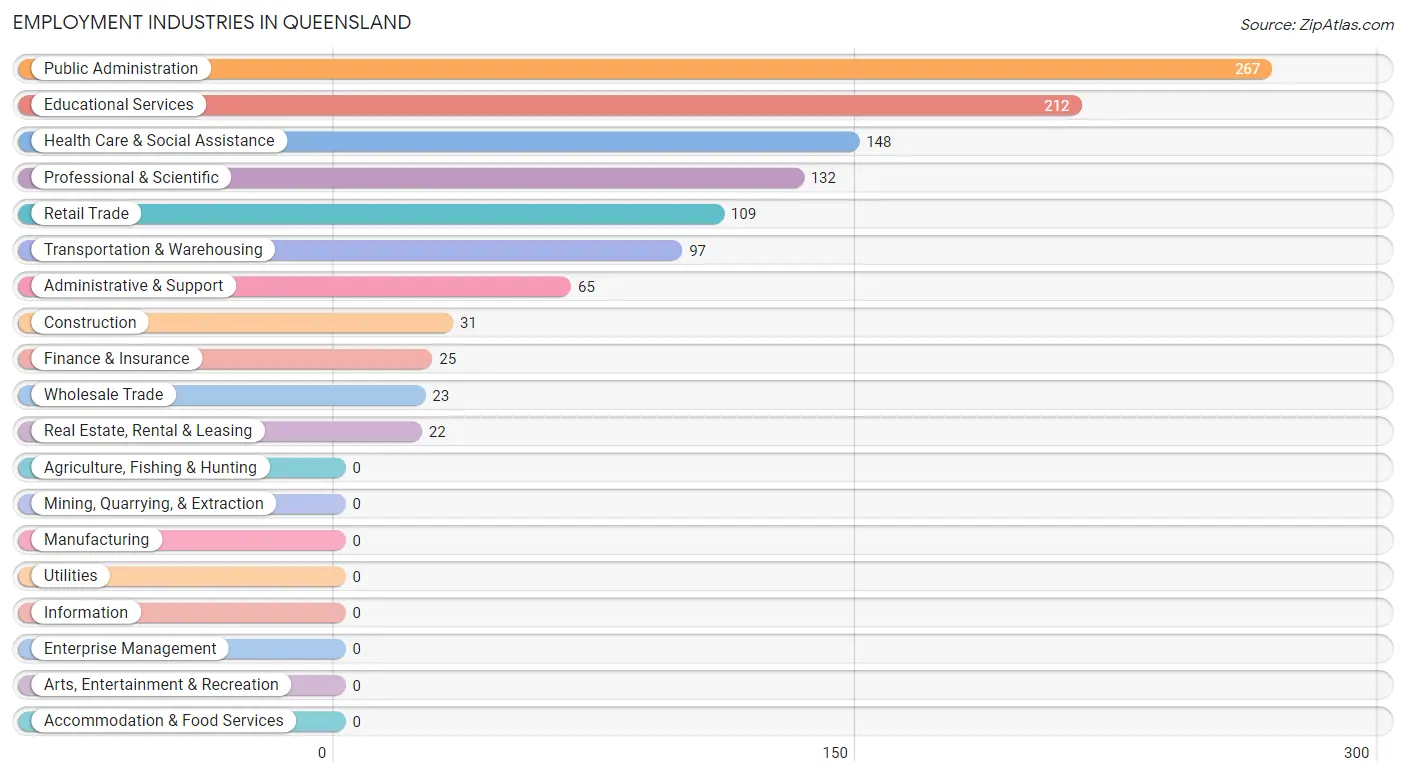
Employment Industries in Queensland
The major employment industries in Queensland include Public Administration (267 | 23.4%), Educational Services (212 | 18.6%), Health Care & Social Assistance (148 | 13.0%), Professional & Scientific (132 | 11.6%), and Retail Trade (109 | 9.6%).
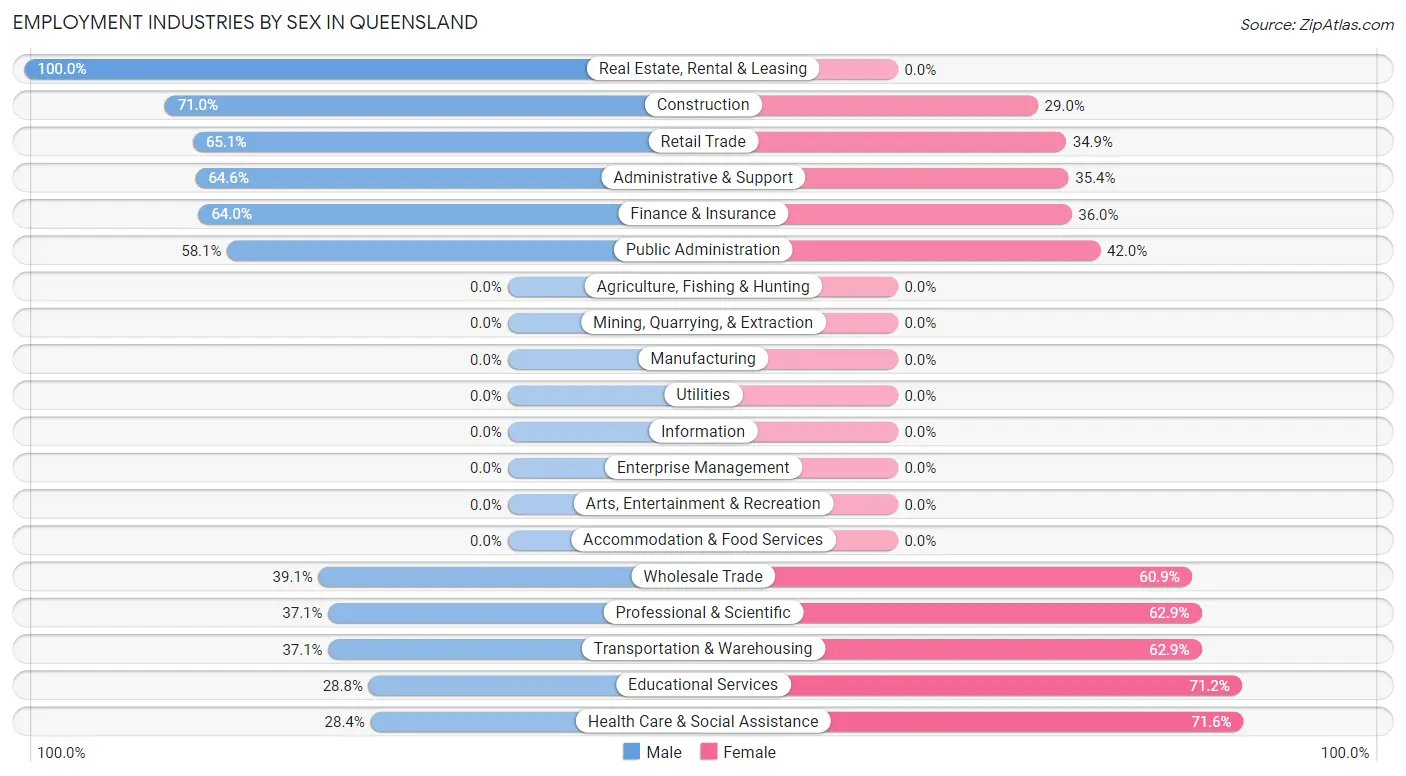
Employment Industries by Sex in Queensland
The Queensland industries that see more men than women are Real Estate, Rental & Leasing (100.0%), Construction (71.0%), and Retail Trade (65.1%), whereas the industries that tend to have a higher number of women are Health Care & Social Assistance (71.6%), Educational Services (71.2%), and Transportation & Warehousing (62.9%).
| Industry | Male | Female |
| Agriculture, Fishing & Hunting | 0 (0.0%) | 0 (0.0%) |
| Mining, Quarrying, & Extraction | 0 (0.0%) | 0 (0.0%) |
| Construction | 22 (71.0%) | 9 (29.0%) |
| Manufacturing | 0 (0.0%) | 0 (0.0%) |
| Wholesale Trade | 9 (39.1%) | 14 (60.9%) |
| Retail Trade | 71 (65.1%) | 38 (34.9%) |
| Transportation & Warehousing | 36 (37.1%) | 61 (62.9%) |
| Utilities | 0 (0.0%) | 0 (0.0%) |
| Information | 0 (0.0%) | 0 (0.0%) |
| Finance & Insurance | 16 (64.0%) | 9 (36.0%) |
| Real Estate, Rental & Leasing | 22 (100.0%) | 0 (0.0%) |
| Professional & Scientific | 49 (37.1%) | 83 (62.9%) |
| Enterprise Management | 0 (0.0%) | 0 (0.0%) |
| Administrative & Support | 42 (64.6%) | 23 (35.4%) |
| Educational Services | 61 (28.8%) | 151 (71.2%) |
| Health Care & Social Assistance | 42 (28.4%) | 106 (71.6%) |
| Arts, Entertainment & Recreation | 0 (0.0%) | 0 (0.0%) |
| Accommodation & Food Services | 0 (0.0%) | 0 (0.0%) |
| Public Administration | 155 (58.1%) | 112 (41.9%) |
| Total | 534 (46.8%) | 606 (53.2%) |
Education in Queensland
School Enrollment in Queensland
The most common levels of schooling among the 398 students in Queensland are middle school (125 | 31.4%), college / undergraduate (110 | 27.6%), and high school (66 | 16.6%).
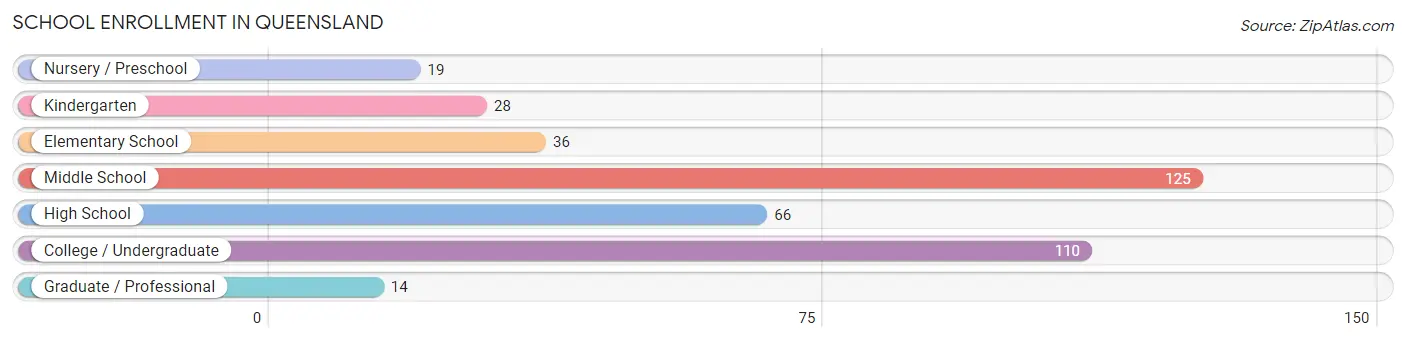
| School Level | # Students | % Students |
| Nursery / Preschool | 19 | 4.8% |
| Kindergarten | 28 | 7.0% |
| Elementary School | 36 | 9.0% |
| Middle School | 125 | 31.4% |
| High School | 66 | 16.6% |
| College / Undergraduate | 110 | 27.6% |
| Graduate / Professional | 14 | 3.5% |
| Total | 398 | 100.0% |
School Enrollment by Age by Funding Source in Queensland
Out of a total of 398 students who are enrolled in schools in Queensland, 72 (18.1%) attend a private institution, while the remaining 326 (81.9%) are enrolled in public schools. The age group of 3 to 4 year olds has the highest likelihood of being enrolled in private schools, with 11 (57.9% in the age bracket) enrolled. Conversely, the age group of 5 to 9 year old has the lowest likelihood of being enrolled in a private school, with 55 (100.0% in the age bracket) attending a public institution.
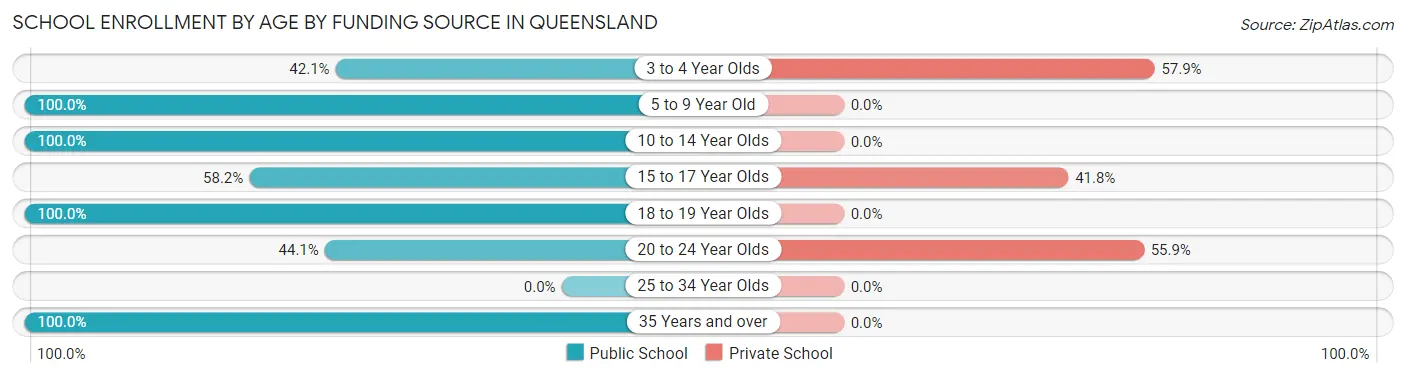
| Age Bracket | Public School | Private School |
| 3 to 4 Year Olds | 8 (42.1%) | 11 (57.9%) |
| 5 to 9 Year Old | 55 (100.0%) | 0 (0.0%) |
| 10 to 14 Year Olds | 134 (100.0%) | 0 (0.0%) |
| 15 to 17 Year Olds | 32 (58.2%) | 23 (41.8%) |
| 18 to 19 Year Olds | 11 (100.0%) | 0 (0.0%) |
| 20 to 24 Year Olds | 30 (44.1%) | 38 (55.9%) |
| 25 to 34 Year Olds | 0 (0.0%) | 0 (0.0%) |
| 35 Years and over | 56 (100.0%) | 0 (0.0%) |
| Total | 326 (81.9%) | 72 (18.1%) |
Educational Attainment by Field of Study in Queensland
Business (176 | 24.1%), education (150 | 20.6%), science & technology (126 | 17.3%), computers & mathematics (57 | 7.8%), and bio, nature & agricultural (56 | 7.7%) are the most common fields of study among 729 individuals in Queensland who have obtained a bachelor's degree or higher.
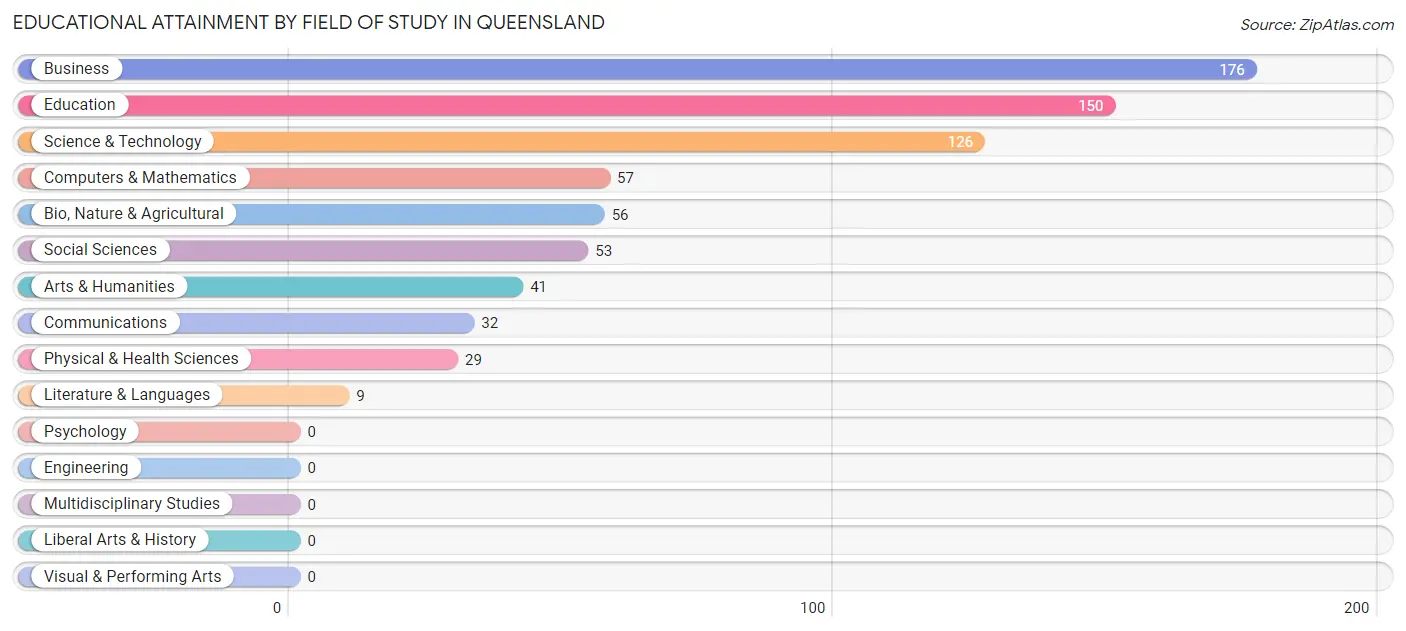
| Field of Study | # Graduates | % Graduates |
| Computers & Mathematics | 57 | 7.8% |
| Bio, Nature & Agricultural | 56 | 7.7% |
| Physical & Health Sciences | 29 | 4.0% |
| Psychology | 0 | 0.0% |
| Social Sciences | 53 | 7.3% |
| Engineering | 0 | 0.0% |
| Multidisciplinary Studies | 0 | 0.0% |
| Science & Technology | 126 | 17.3% |
| Business | 176 | 24.1% |
| Education | 150 | 20.6% |
| Literature & Languages | 9 | 1.2% |
| Liberal Arts & History | 0 | 0.0% |
| Visual & Performing Arts | 0 | 0.0% |
| Communications | 32 | 4.4% |
| Arts & Humanities | 41 | 5.6% |
| Total | 729 | 100.0% |
Transportation & Commute in Queensland
Vehicle Availability by Sex in Queensland
The most prevalent vehicle ownership categories in Queensland are males with 2 vehicles (185, accounting for 35.4%) and females with 2 vehicles (173, making up 33.3%).
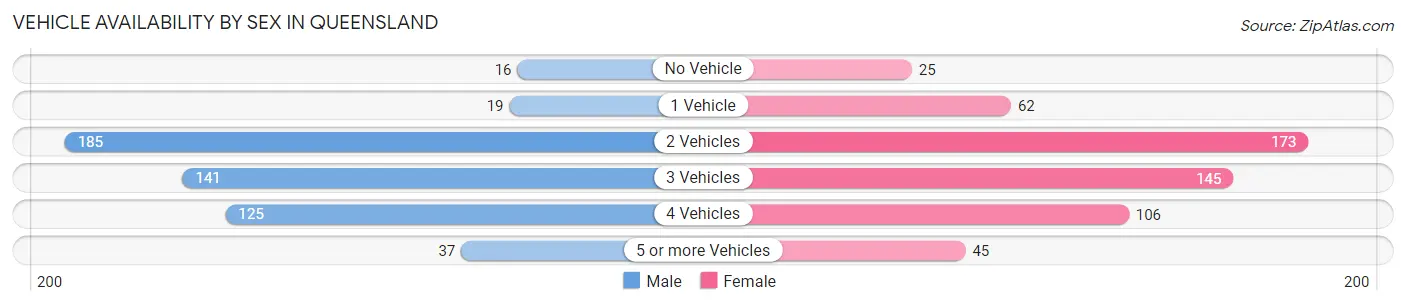
| Vehicles Available | Male | Female |
| No Vehicle | 16 (3.1%) | 25 (4.5%) |
| 1 Vehicle | 19 (3.6%) | 62 (11.2%) |
| 2 Vehicles | 185 (35.4%) | 173 (31.1%) |
| 3 Vehicles | 141 (27.0%) | 145 (26.1%) |
| 4 Vehicles | 125 (23.9%) | 106 (19.1%) |
| 5 or more Vehicles | 37 (7.1%) | 45 (8.1%) |
| Total | 523 (100.0%) | 556 (100.0%) |
Commute Time in Queensland
The most frequently occuring commute durations in Queensland are 25 to 29 minutes (126 commuters, 16.5%), 40 to 44 minutes (124 commuters, 16.3%), and 45 to 59 minutes (121 commuters, 15.9%).
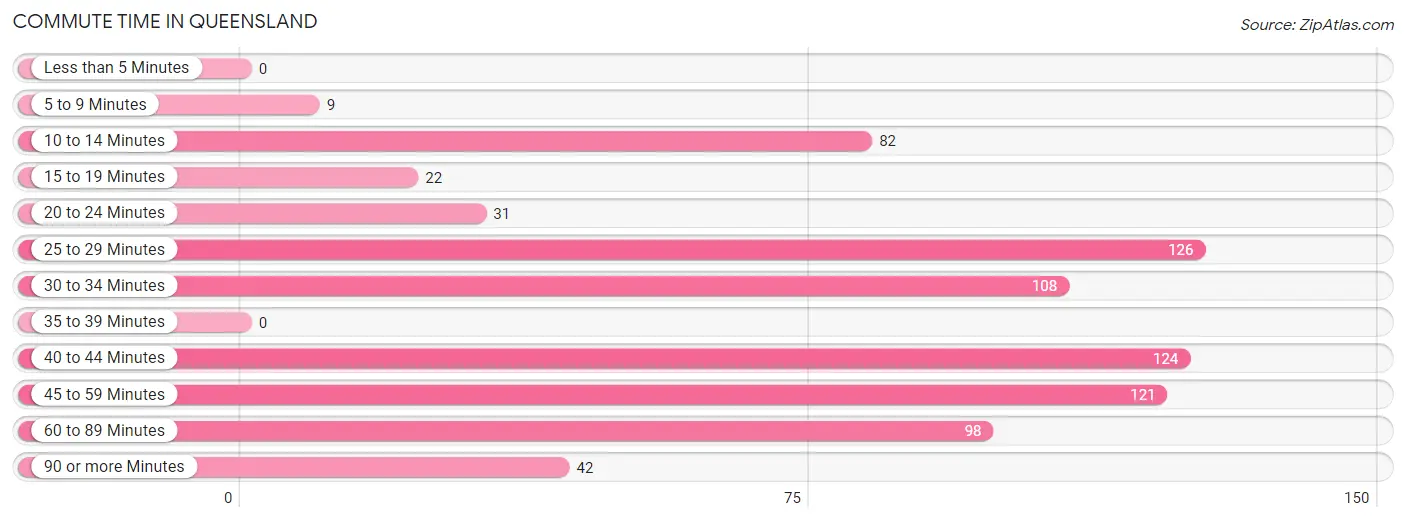
| Commute Time | # Commuters | % Commuters |
| Less than 5 Minutes | 0 | 0.0% |
| 5 to 9 Minutes | 9 | 1.2% |
| 10 to 14 Minutes | 82 | 10.7% |
| 15 to 19 Minutes | 22 | 2.9% |
| 20 to 24 Minutes | 31 | 4.1% |
| 25 to 29 Minutes | 126 | 16.5% |
| 30 to 34 Minutes | 108 | 14.1% |
| 35 to 39 Minutes | 0 | 0.0% |
| 40 to 44 Minutes | 124 | 16.3% |
| 45 to 59 Minutes | 121 | 15.9% |
| 60 to 89 Minutes | 98 | 12.8% |
| 90 or more Minutes | 42 | 5.5% |
Commute Time by Sex in Queensland
The most common commute times in Queensland are 40 to 44 minutes (89 commuters, 25.0%) for males and 25 to 29 minutes (100 commuters, 24.6%) for females.
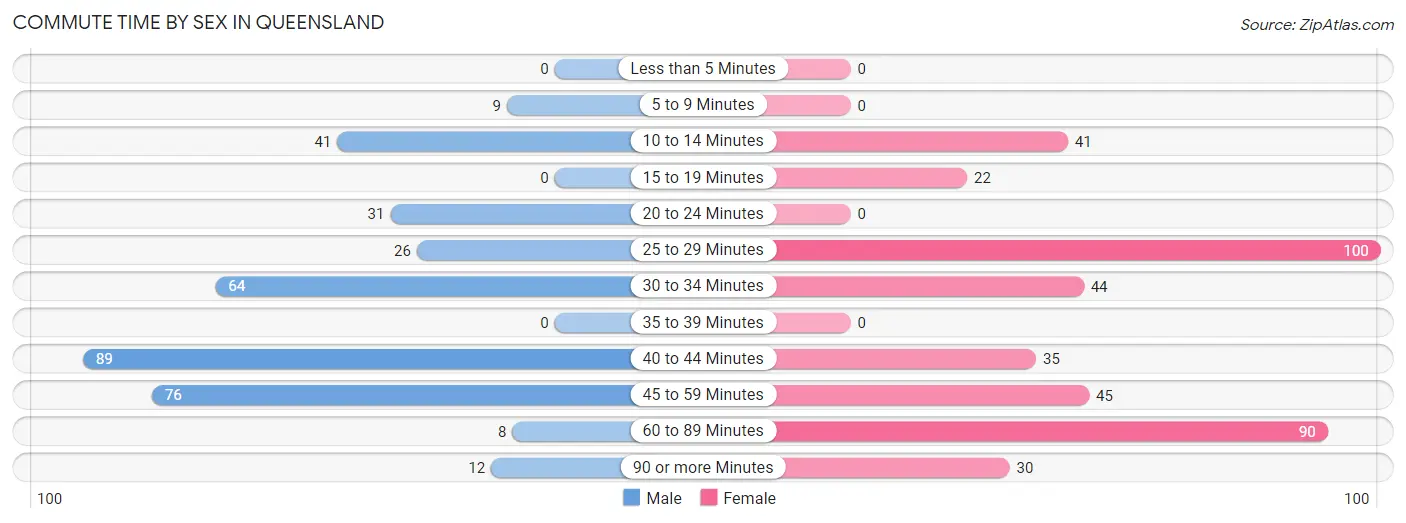
| Commute Time | Male | Female |
| Less than 5 Minutes | 0 (0.0%) | 0 (0.0%) |
| 5 to 9 Minutes | 9 (2.5%) | 0 (0.0%) |
| 10 to 14 Minutes | 41 (11.5%) | 41 (10.1%) |
| 15 to 19 Minutes | 0 (0.0%) | 22 (5.4%) |
| 20 to 24 Minutes | 31 (8.7%) | 0 (0.0%) |
| 25 to 29 Minutes | 26 (7.3%) | 100 (24.6%) |
| 30 to 34 Minutes | 64 (18.0%) | 44 (10.8%) |
| 35 to 39 Minutes | 0 (0.0%) | 0 (0.0%) |
| 40 to 44 Minutes | 89 (25.0%) | 35 (8.6%) |
| 45 to 59 Minutes | 76 (21.3%) | 45 (11.1%) |
| 60 to 89 Minutes | 8 (2.2%) | 90 (22.1%) |
| 90 or more Minutes | 12 (3.4%) | 30 (7.4%) |
Time of Departure to Work by Sex in Queensland
The most frequent times of departure to work in Queensland are 6:00 AM to 6:29 AM (97, 27.3%) for males and 7:00 AM to 7:29 AM (101, 24.8%) for females.
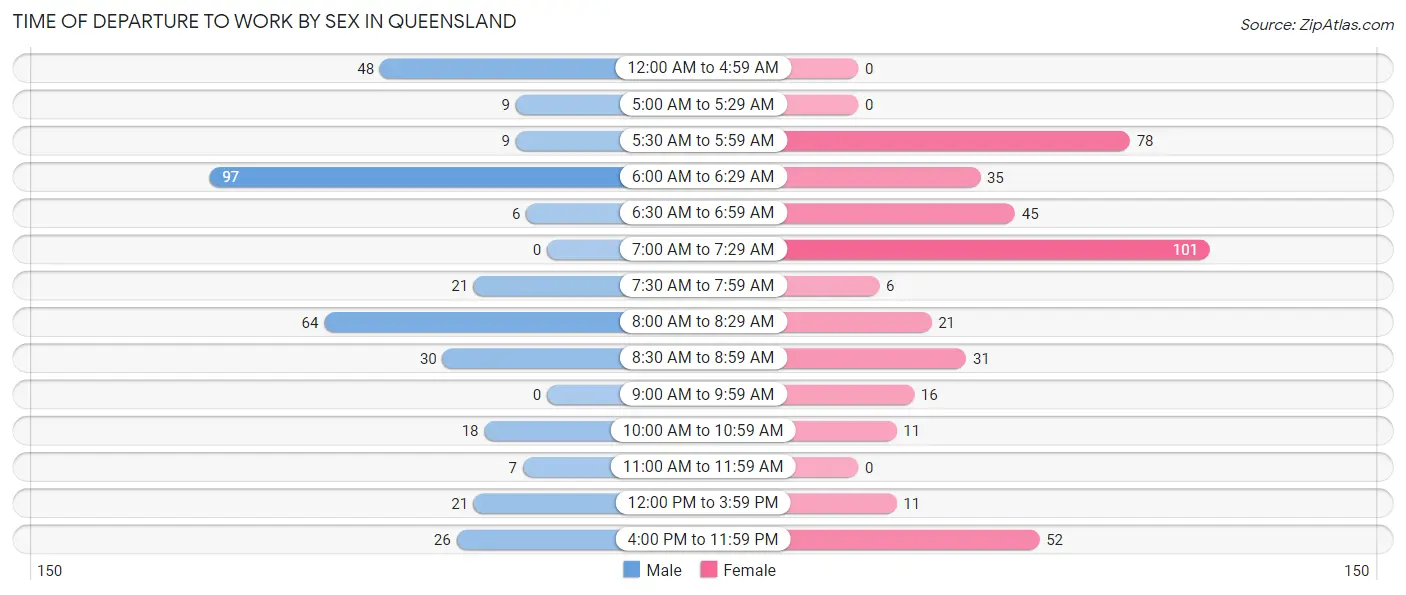
| Time of Departure | Male | Female |
| 12:00 AM to 4:59 AM | 48 (13.5%) | 0 (0.0%) |
| 5:00 AM to 5:29 AM | 9 (2.5%) | 0 (0.0%) |
| 5:30 AM to 5:59 AM | 9 (2.5%) | 78 (19.2%) |
| 6:00 AM to 6:29 AM | 97 (27.3%) | 35 (8.6%) |
| 6:30 AM to 6:59 AM | 6 (1.7%) | 45 (11.1%) |
| 7:00 AM to 7:29 AM | 0 (0.0%) | 101 (24.8%) |
| 7:30 AM to 7:59 AM | 21 (5.9%) | 6 (1.5%) |
| 8:00 AM to 8:29 AM | 64 (18.0%) | 21 (5.2%) |
| 8:30 AM to 8:59 AM | 30 (8.4%) | 31 (7.6%) |
| 9:00 AM to 9:59 AM | 0 (0.0%) | 16 (3.9%) |
| 10:00 AM to 10:59 AM | 18 (5.1%) | 11 (2.7%) |
| 11:00 AM to 11:59 AM | 7 (2.0%) | 0 (0.0%) |
| 12:00 PM to 3:59 PM | 21 (5.9%) | 11 (2.7%) |
| 4:00 PM to 11:59 PM | 26 (7.3%) | 52 (12.8%) |
| Total | 356 (100.0%) | 407 (100.0%) |
Housing Occupancy in Queensland
Occupancy by Ownership in Queensland
Of the total 660 dwellings in Queensland, owner-occupied units account for 652 (98.8%), while renter-occupied units make up 8 (1.2%).
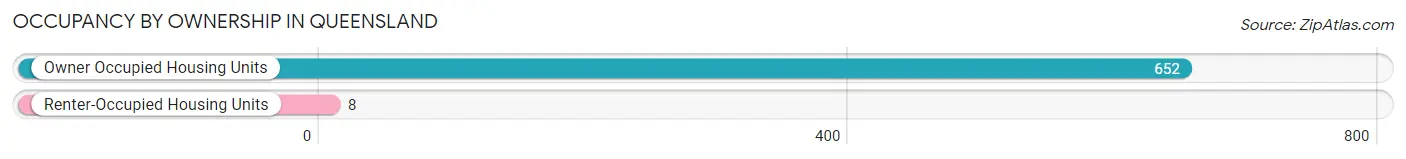
| Occupancy | # Housing Units | % Housing Units |
| Owner Occupied Housing Units | 652 | 98.8% |
| Renter-Occupied Housing Units | 8 | 1.2% |
| Total Occupied Housing Units | 660 | 100.0% |
Occupancy by Household Size in Queensland
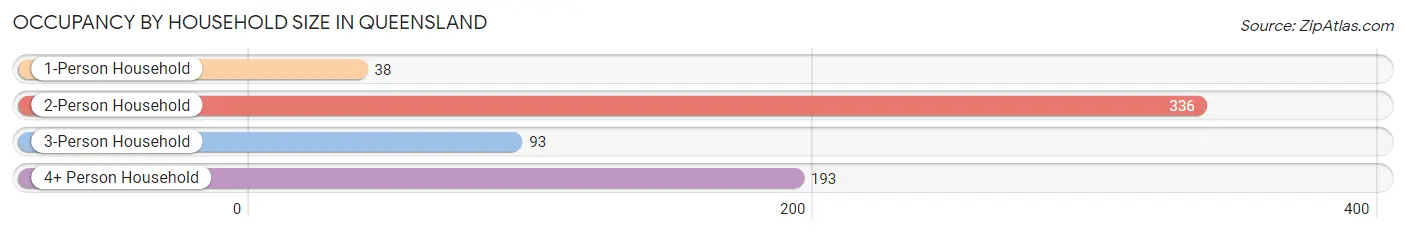
| Household Size | # Housing Units | % Housing Units |
| 1-Person Household | 38 | 5.8% |
| 2-Person Household | 336 | 50.9% |
| 3-Person Household | 93 | 14.1% |
| 4+ Person Household | 193 | 29.2% |
| Total Housing Units | 660 | 100.0% |
Occupancy by Ownership by Household Size in Queensland
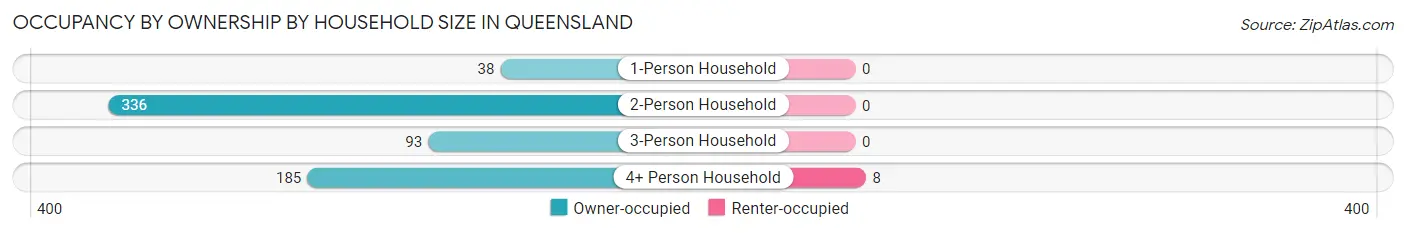
| Household Size | Owner-occupied | Renter-occupied |
| 1-Person Household | 38 (100.0%) | 0 (0.0%) |
| 2-Person Household | 336 (100.0%) | 0 (0.0%) |
| 3-Person Household | 93 (100.0%) | 0 (0.0%) |
| 4+ Person Household | 185 (95.9%) | 8 (4.2%) |
| Total Housing Units | 652 (98.8%) | 8 (1.2%) |
Occupancy by Educational Attainment in Queensland
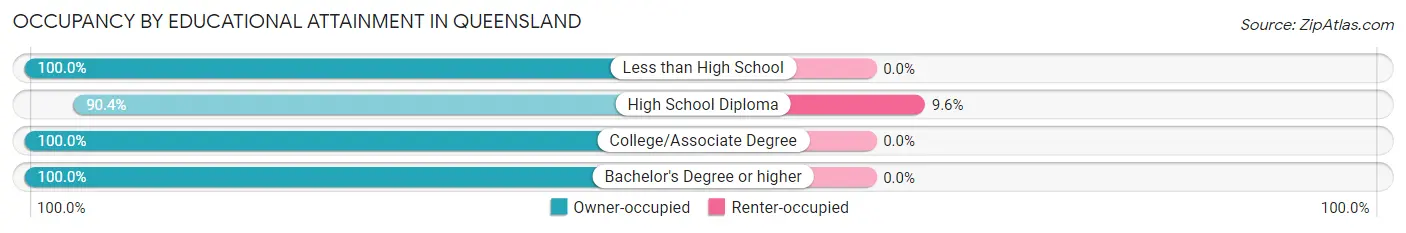
| Household Size | Owner-occupied | Renter-occupied |
| Less than High School | 23 (100.0%) | 0 (0.0%) |
| High School Diploma | 75 (90.4%) | 8 (9.6%) |
| College/Associate Degree | 201 (100.0%) | 0 (0.0%) |
| Bachelor's Degree or higher | 353 (100.0%) | 0 (0.0%) |
Occupancy by Age of Householder in Queensland
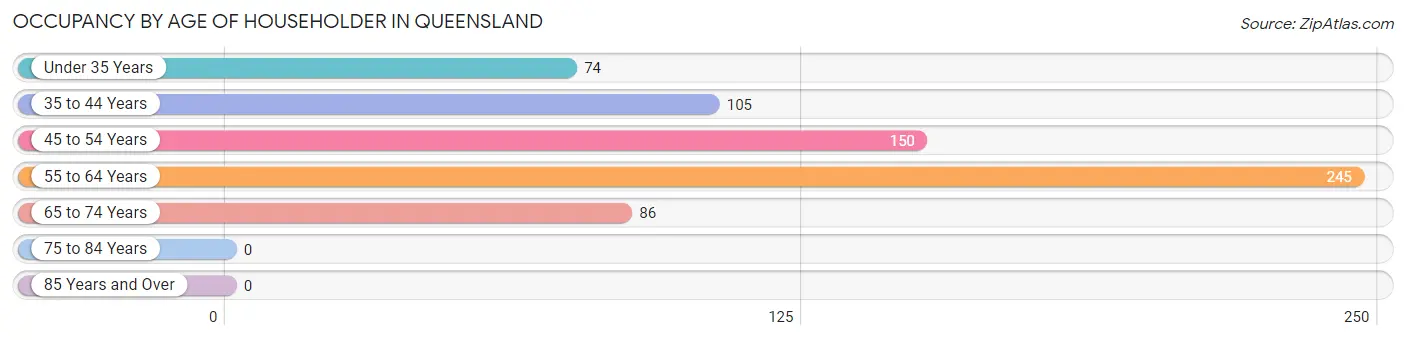
| Age Bracket | # Households | % Households |
| Under 35 Years | 74 | 11.2% |
| 35 to 44 Years | 105 | 15.9% |
| 45 to 54 Years | 150 | 22.7% |
| 55 to 64 Years | 245 | 37.1% |
| 65 to 74 Years | 86 | 13.0% |
| 75 to 84 Years | 0 | 0.0% |
| 85 Years and Over | 0 | 0.0% |
| Total | 660 | 100.0% |
Housing Finances in Queensland
Median Income by Occupancy in Queensland
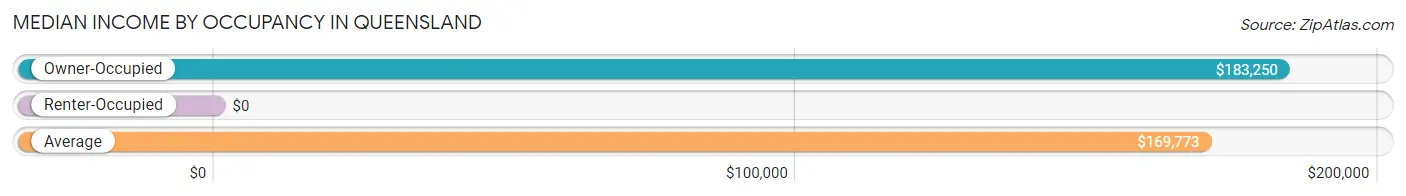
| Occupancy Type | # Households | Median Income |
| Owner-Occupied | 652 (98.8%) | $183,250 |
| Renter-Occupied | 8 (1.2%) | $0 |
| Average | 660 (100.0%) | $169,773 |
Occupancy by Householder Income Bracket in Queensland
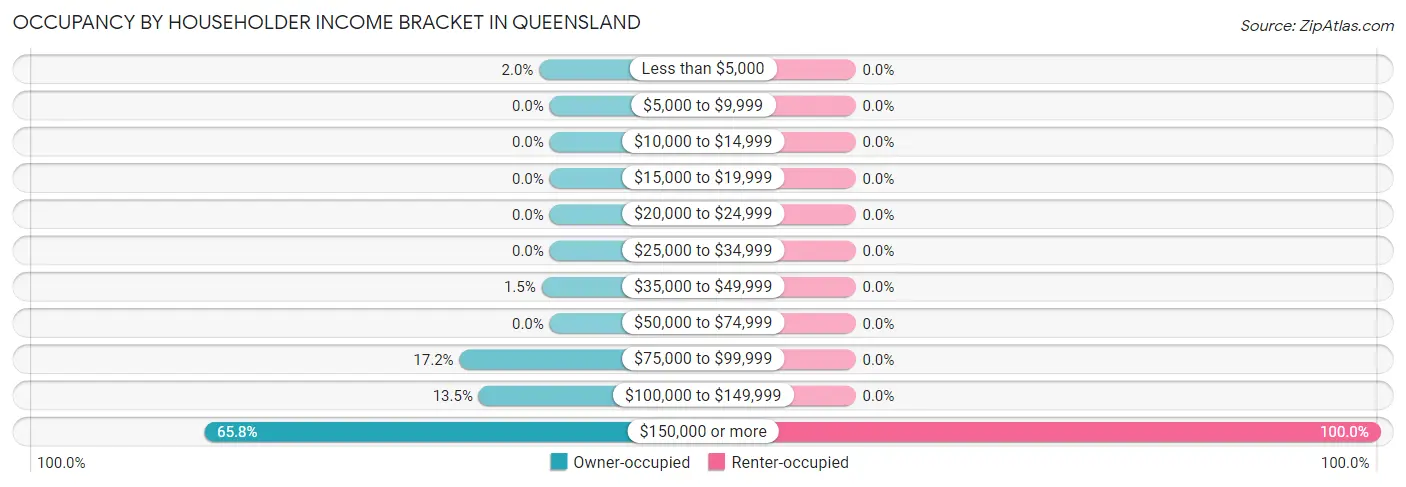
| Income Bracket | Owner-occupied | Renter-occupied |
| Less than $5,000 | 13 (2.0%) | 0 (0.0%) |
| $5,000 to $9,999 | 0 (0.0%) | 0 (0.0%) |
| $10,000 to $14,999 | 0 (0.0%) | 0 (0.0%) |
| $15,000 to $19,999 | 0 (0.0%) | 0 (0.0%) |
| $20,000 to $24,999 | 0 (0.0%) | 0 (0.0%) |
| $25,000 to $34,999 | 0 (0.0%) | 0 (0.0%) |
| $35,000 to $49,999 | 10 (1.5%) | 0 (0.0%) |
| $50,000 to $74,999 | 0 (0.0%) | 0 (0.0%) |
| $75,000 to $99,999 | 112 (17.2%) | 0 (0.0%) |
| $100,000 to $149,999 | 88 (13.5%) | 0 (0.0%) |
| $150,000 or more | 429 (65.8%) | 8 (100.0%) |
| Total | 652 (100.0%) | 8 (100.0%) |
Monthly Housing Cost Tiers in Queensland
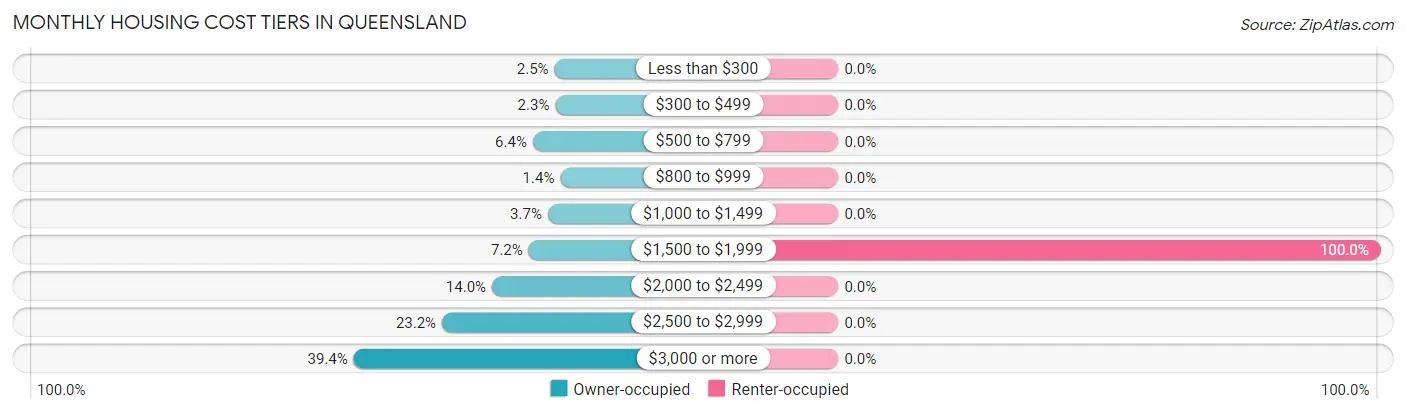
| Monthly Cost | Owner-occupied | Renter-occupied |
| Less than $300 | 16 (2.5%) | 0 (0.0%) |
| $300 to $499 | 15 (2.3%) | 0 (0.0%) |
| $500 to $799 | 42 (6.4%) | 0 (0.0%) |
| $800 to $999 | 9 (1.4%) | 0 (0.0%) |
| $1,000 to $1,499 | 24 (3.7%) | 0 (0.0%) |
| $1,500 to $1,999 | 47 (7.2%) | 8 (100.0%) |
| $2,000 to $2,499 | 91 (14.0%) | 0 (0.0%) |
| $2,500 to $2,999 | 151 (23.2%) | 0 (0.0%) |
| $3,000 or more | 257 (39.4%) | 0 (0.0%) |
| Total | 652 (100.0%) | 8 (100.0%) |
Physical Housing Characteristics in Queensland
Housing Structures in Queensland
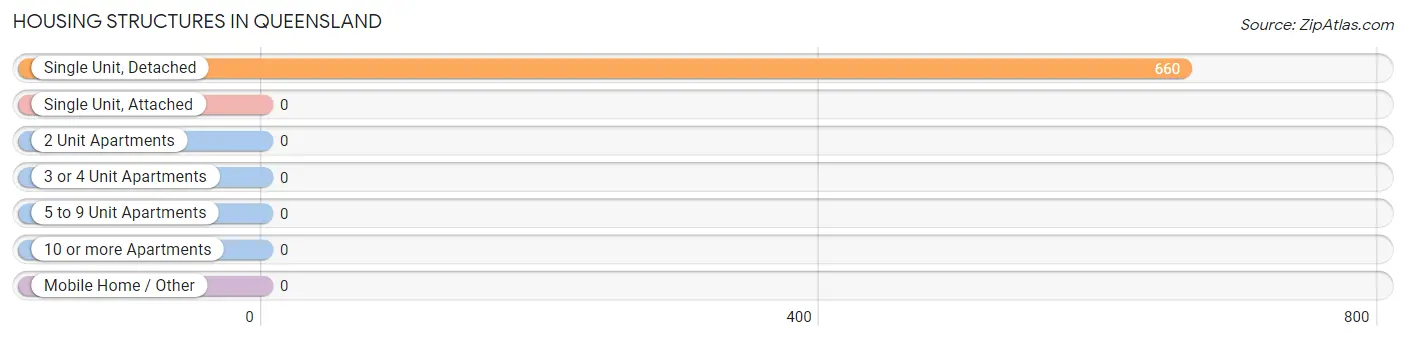
| Structure Type | # Housing Units | % Housing Units |
| Single Unit, Detached | 660 | 100.0% |
| Single Unit, Attached | 0 | 0.0% |
| 2 Unit Apartments | 0 | 0.0% |
| 3 or 4 Unit Apartments | 0 | 0.0% |
| 5 to 9 Unit Apartments | 0 | 0.0% |
| 10 or more Apartments | 0 | 0.0% |
| Mobile Home / Other | 0 | 0.0% |
| Total | 660 | 100.0% |
Housing Structures by Occupancy in Queensland
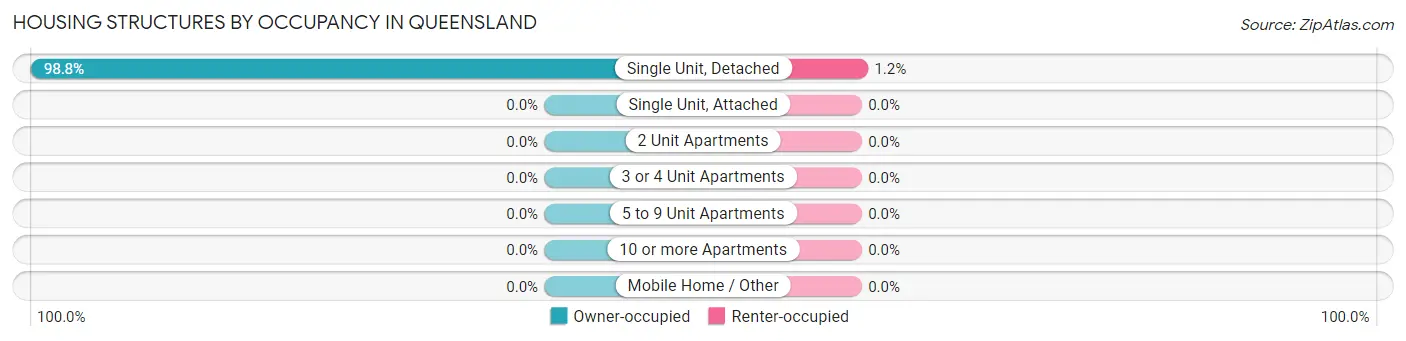
| Structure Type | Owner-occupied | Renter-occupied |
| Single Unit, Detached | 652 (98.8%) | 8 (1.2%) |
| Single Unit, Attached | 0 (0.0%) | 0 (0.0%) |
| 2 Unit Apartments | 0 (0.0%) | 0 (0.0%) |
| 3 or 4 Unit Apartments | 0 (0.0%) | 0 (0.0%) |
| 5 to 9 Unit Apartments | 0 (0.0%) | 0 (0.0%) |
| 10 or more Apartments | 0 (0.0%) | 0 (0.0%) |
| Mobile Home / Other | 0 (0.0%) | 0 (0.0%) |
| Total | 652 (98.8%) | 8 (1.2%) |
Housing Structures by Number of Rooms in Queensland
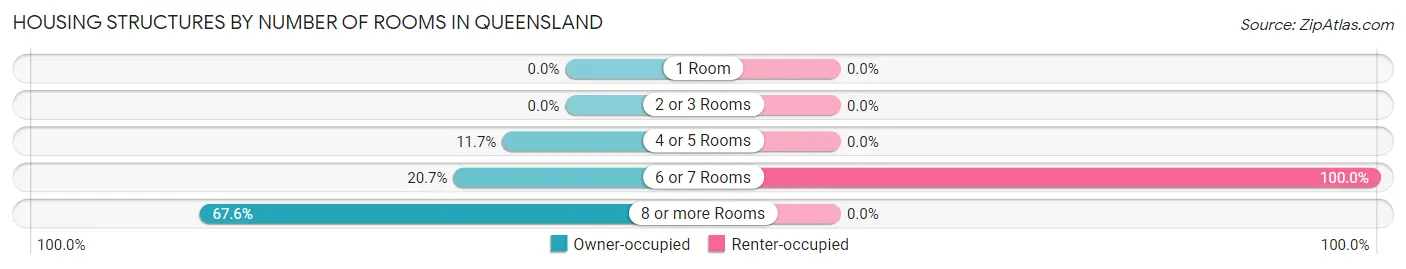
| Number of Rooms | Owner-occupied | Renter-occupied |
| 1 Room | 0 (0.0%) | 0 (0.0%) |
| 2 or 3 Rooms | 0 (0.0%) | 0 (0.0%) |
| 4 or 5 Rooms | 76 (11.7%) | 0 (0.0%) |
| 6 or 7 Rooms | 135 (20.7%) | 8 (100.0%) |
| 8 or more Rooms | 441 (67.6%) | 0 (0.0%) |
| Total | 652 (100.0%) | 8 (100.0%) |
Housing Structure by Heating Type in Queensland
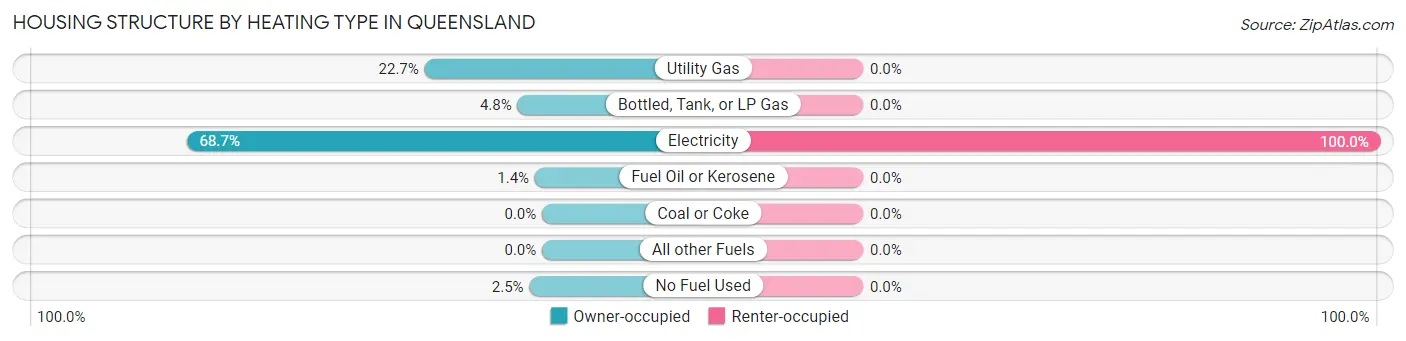
| Heating Type | Owner-occupied | Renter-occupied |
| Utility Gas | 148 (22.7%) | 0 (0.0%) |
| Bottled, Tank, or LP Gas | 31 (4.8%) | 0 (0.0%) |
| Electricity | 448 (68.7%) | 8 (100.0%) |
| Fuel Oil or Kerosene | 9 (1.4%) | 0 (0.0%) |
| Coal or Coke | 0 (0.0%) | 0 (0.0%) |
| All other Fuels | 0 (0.0%) | 0 (0.0%) |
| No Fuel Used | 16 (2.5%) | 0 (0.0%) |
| Total | 652 (100.0%) | 8 (100.0%) |
Household Vehicle Usage in Queensland
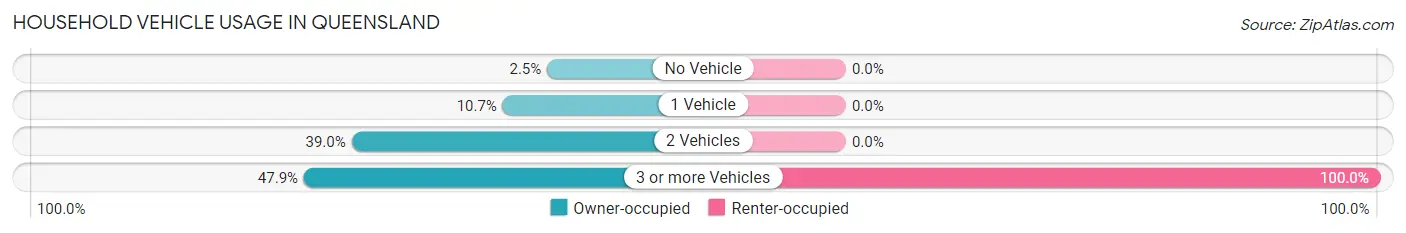
| Vehicles per Household | Owner-occupied | Renter-occupied |
| No Vehicle | 16 (2.5%) | 0 (0.0%) |
| 1 Vehicle | 70 (10.7%) | 0 (0.0%) |
| 2 Vehicles | 254 (39.0%) | 0 (0.0%) |
| 3 or more Vehicles | 312 (47.8%) | 8 (100.0%) |
| Total | 652 (100.0%) | 8 (100.0%) |
Real Estate & Mortgages in Queensland
Real Estate and Mortgage Overview in Queensland
| Characteristic | Without Mortgage | With Mortgage |
| Housing Units | 89 | 563 |
| Median Property Value | $314,000 | $495,600 |
| Median Household Income | - | - |
| Monthly Housing Costs | $636 | $257 |
| Real Estate Taxes | $3,672 | $74 |
Property Value by Mortgage Status in Queensland
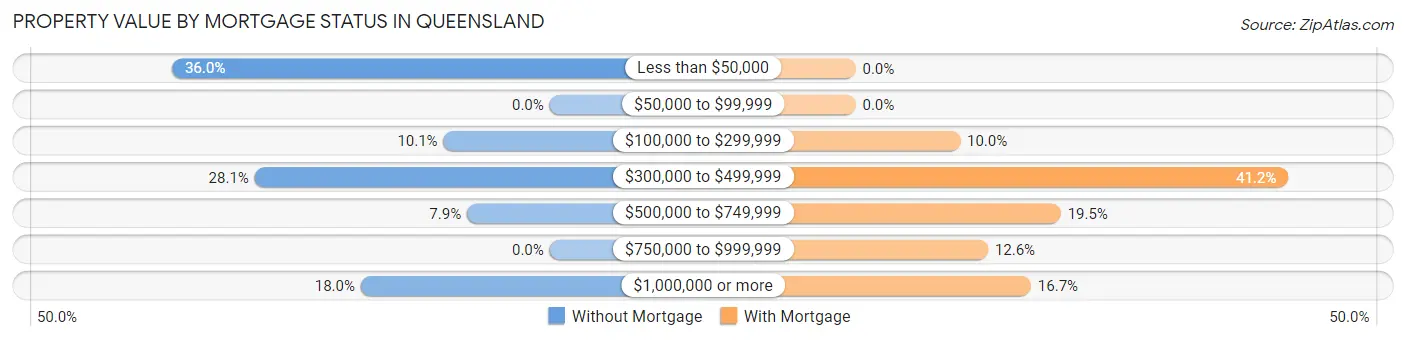
| Property Value | Without Mortgage | With Mortgage |
| Less than $50,000 | 32 (36.0%) | 0 (0.0%) |
| $50,000 to $99,999 | 0 (0.0%) | 0 (0.0%) |
| $100,000 to $299,999 | 9 (10.1%) | 56 (10.0%) |
| $300,000 to $499,999 | 25 (28.1%) | 232 (41.2%) |
| $500,000 to $749,999 | 7 (7.9%) | 110 (19.5%) |
| $750,000 to $999,999 | 0 (0.0%) | 71 (12.6%) |
| $1,000,000 or more | 16 (18.0%) | 94 (16.7%) |
| Total | 89 (100.0%) | 563 (100.0%) |
Household Income by Mortgage Status in Queensland
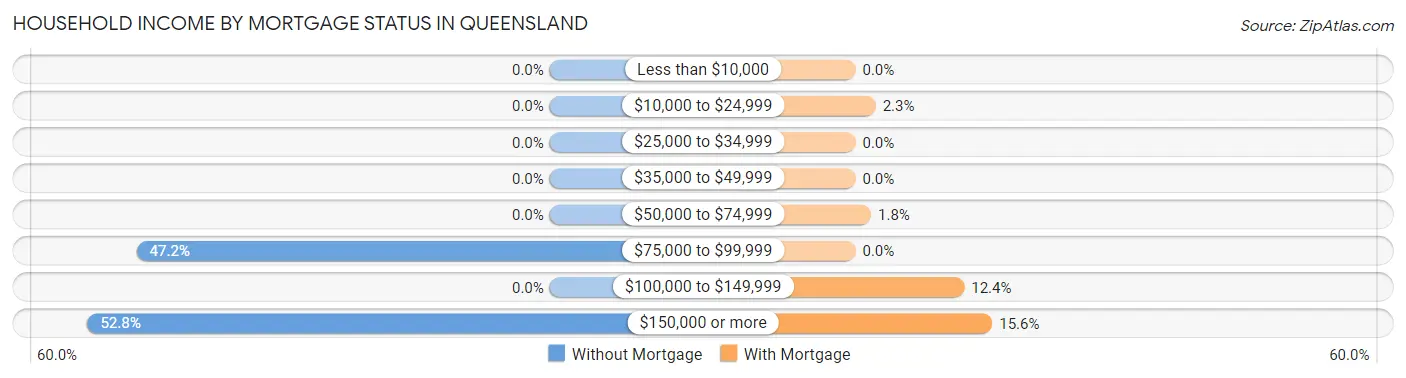
| Household Income | Without Mortgage | With Mortgage |
| Less than $10,000 | 0 (0.0%) | 0 (0.0%) |
| $10,000 to $24,999 | 0 (0.0%) | 13 (2.3%) |
| $25,000 to $34,999 | 0 (0.0%) | 0 (0.0%) |
| $35,000 to $49,999 | 0 (0.0%) | 0 (0.0%) |
| $50,000 to $74,999 | 0 (0.0%) | 10 (1.8%) |
| $75,000 to $99,999 | 42 (47.2%) | 0 (0.0%) |
| $100,000 to $149,999 | 0 (0.0%) | 70 (12.4%) |
| $150,000 or more | 47 (52.8%) | 88 (15.6%) |
| Total | 89 (100.0%) | 563 (100.0%) |
Property Value to Household Income Ratio in Queensland
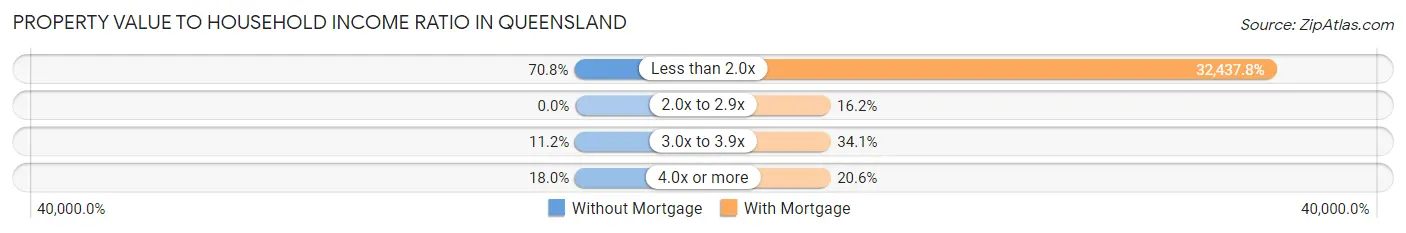
| Value-to-Income Ratio | Without Mortgage | With Mortgage |
| Less than 2.0x | 63 (70.8%) | 182,625 (32,437.8%) |
| 2.0x to 2.9x | 0 (0.0%) | 91 (16.2%) |
| 3.0x to 3.9x | 10 (11.2%) | 192 (34.1%) |
| 4.0x or more | 16 (18.0%) | 116 (20.6%) |
| Total | 89 (100.0%) | 563 (100.0%) |
Real Estate Taxes by Mortgage Status in Queensland
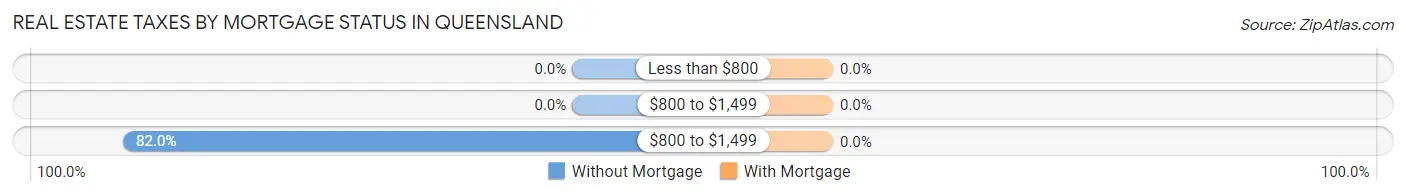
| Property Taxes | Without Mortgage | With Mortgage |
| Less than $800 | 0 (0.0%) | 0 (0.0%) |
| $800 to $1,499 | 0 (0.0%) | 0 (0.0%) |
| $800 to $1,499 | 73 (82.0%) | 0 (0.0%) |
| Total | 89 (100.0%) | 563 (100.0%) |
Health & Disability in Queensland
Health Insurance Coverage by Age in Queensland
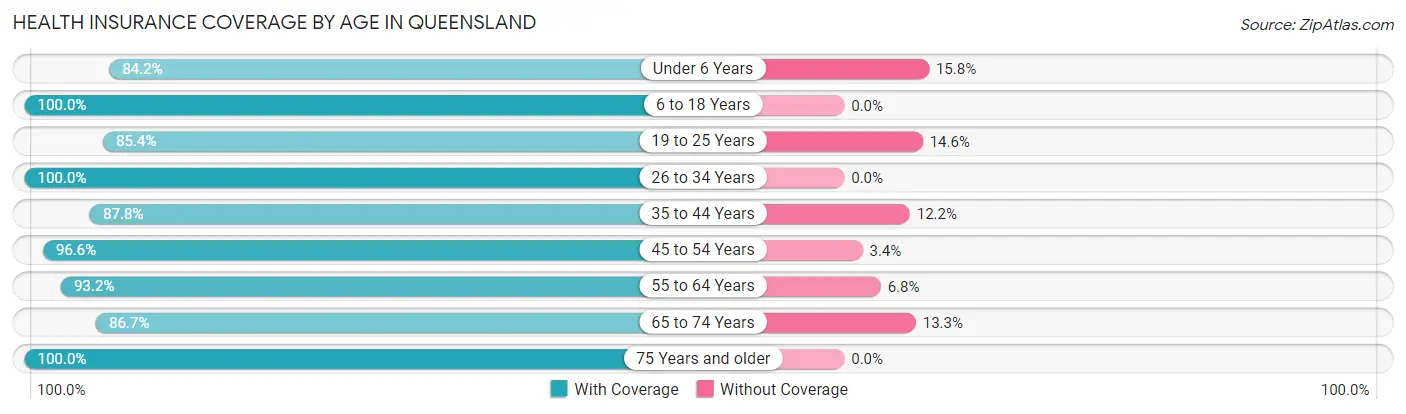
| Age Bracket | With Coverage | Without Coverage |
| Under 6 Years | 64 (84.2%) | 12 (15.8%) |
| 6 to 18 Years | 244 (100.0%) | 0 (0.0%) |
| 19 to 25 Years | 181 (85.4%) | 31 (14.6%) |
| 26 to 34 Years | 144 (100.0%) | 0 (0.0%) |
| 35 to 44 Years | 230 (87.8%) | 32 (12.2%) |
| 45 to 54 Years | 369 (96.6%) | 13 (3.4%) |
| 55 to 64 Years | 467 (93.2%) | 34 (6.8%) |
| 65 to 74 Years | 156 (86.7%) | 24 (13.3%) |
| 75 Years and older | 28 (100.0%) | 0 (0.0%) |
| Total | 1,883 (92.8%) | 146 (7.2%) |
Health Insurance Coverage by Citizenship Status in Queensland
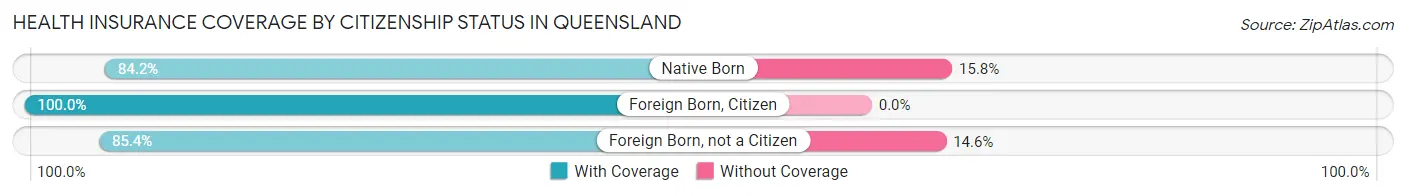
| Citizenship Status | With Coverage | Without Coverage |
| Native Born | 64 (84.2%) | 12 (15.8%) |
| Foreign Born, Citizen | 244 (100.0%) | 0 (0.0%) |
| Foreign Born, not a Citizen | 181 (85.4%) | 31 (14.6%) |
Health Insurance Coverage by Household Income in Queensland
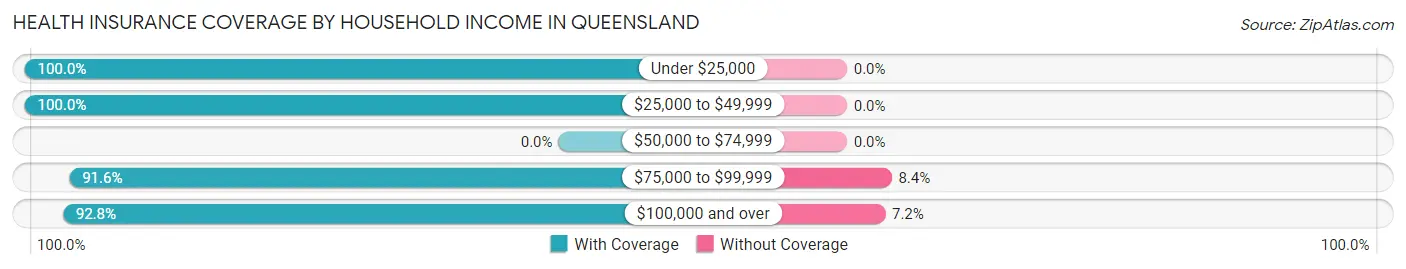
| Household Income | With Coverage | Without Coverage |
| Under $25,000 | 38 (100.0%) | 0 (0.0%) |
| $25,000 to $49,999 | 20 (100.0%) | 0 (0.0%) |
| $50,000 to $74,999 | 0 (0.0%) | 0 (0.0%) |
| $75,000 to $99,999 | 372 (91.6%) | 34 (8.4%) |
| $100,000 and over | 1,453 (92.8%) | 112 (7.2%) |
Public vs Private Health Insurance Coverage by Age in Queensland
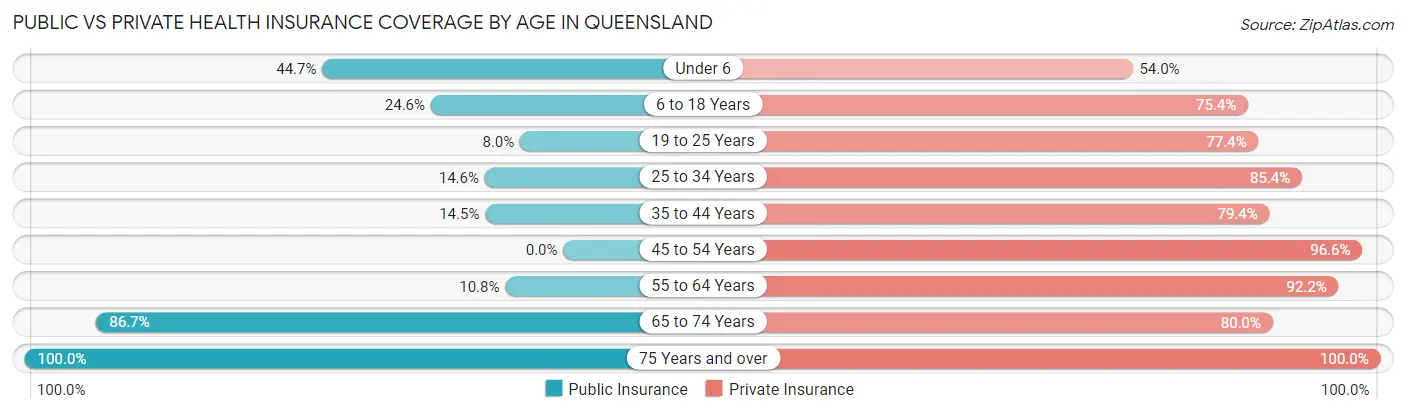
| Age Bracket | Public Insurance | Private Insurance |
| Under 6 | 34 (44.7%) | 41 (53.9%) |
| 6 to 18 Years | 60 (24.6%) | 184 (75.4%) |
| 19 to 25 Years | 17 (8.0%) | 164 (77.4%) |
| 25 to 34 Years | 21 (14.6%) | 123 (85.4%) |
| 35 to 44 Years | 38 (14.5%) | 208 (79.4%) |
| 45 to 54 Years | 0 (0.0%) | 369 (96.6%) |
| 55 to 64 Years | 54 (10.8%) | 462 (92.2%) |
| 65 to 74 Years | 156 (86.7%) | 144 (80.0%) |
| 75 Years and over | 28 (100.0%) | 28 (100.0%) |
| Total | 408 (20.1%) | 1,723 (84.9%) |
Disability Status by Sex by Age in Queensland
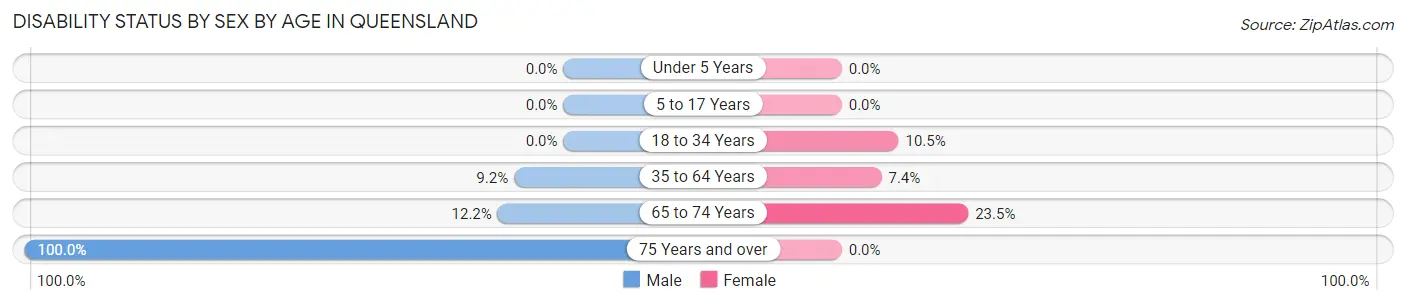
| Age Bracket | Male | Female |
| Under 5 Years | 0 (0.0%) | 0 (0.0%) |
| 5 to 17 Years | 0 (0.0%) | 0 (0.0%) |
| 18 to 34 Years | 0 (0.0%) | 28 (10.5%) |
| 35 to 64 Years | 49 (9.2%) | 45 (7.4%) |
| 65 to 74 Years | 10 (12.2%) | 23 (23.5%) |
| 75 Years and over | 7 (100.0%) | 0 (0.0%) |
Disability Class by Sex by Age in Queensland
Disability Class: Hearing Difficulty
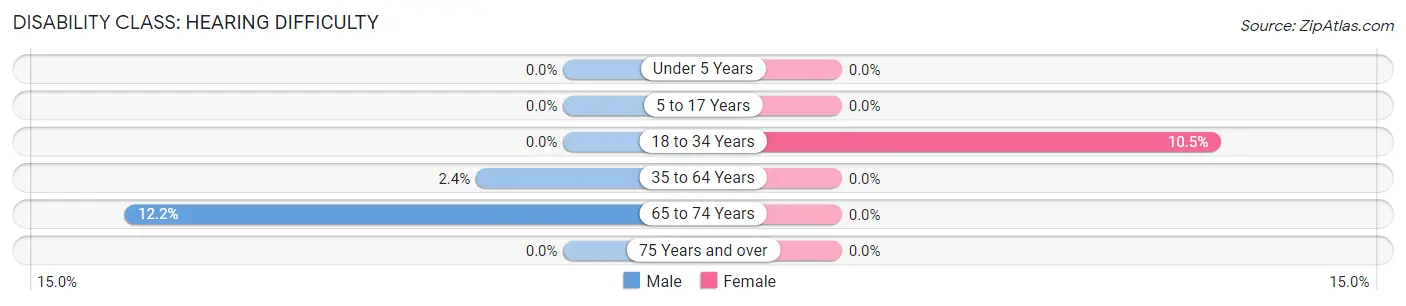
| Age Bracket | Male | Female |
| Under 5 Years | 0 (0.0%) | 0 (0.0%) |
| 5 to 17 Years | 0 (0.0%) | 0 (0.0%) |
| 18 to 34 Years | 0 (0.0%) | 28 (10.5%) |
| 35 to 64 Years | 13 (2.4%) | 0 (0.0%) |
| 65 to 74 Years | 10 (12.2%) | 0 (0.0%) |
| 75 Years and over | 0 (0.0%) | 0 (0.0%) |
Disability Class: Vision Difficulty
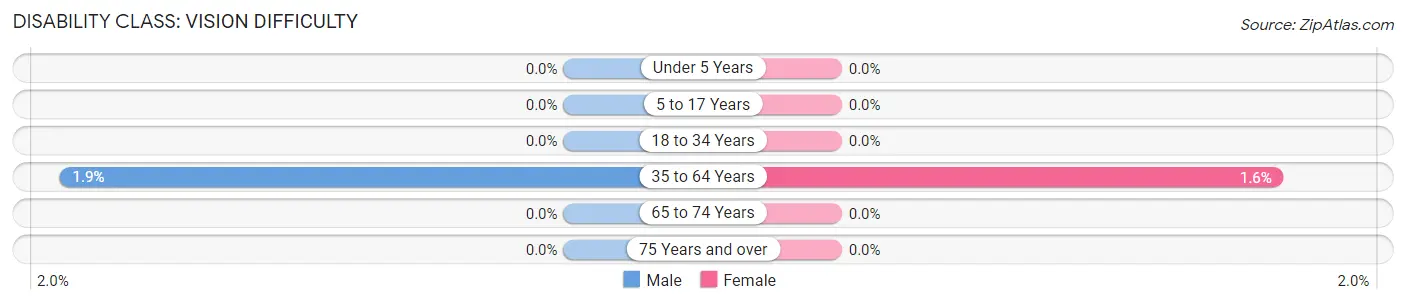
| Age Bracket | Male | Female |
| Under 5 Years | 0 (0.0%) | 0 (0.0%) |
| 5 to 17 Years | 0 (0.0%) | 0 (0.0%) |
| 18 to 34 Years | 0 (0.0%) | 0 (0.0%) |
| 35 to 64 Years | 10 (1.9%) | 10 (1.6%) |
| 65 to 74 Years | 0 (0.0%) | 0 (0.0%) |
| 75 Years and over | 0 (0.0%) | 0 (0.0%) |
Disability Class: Cognitive Difficulty
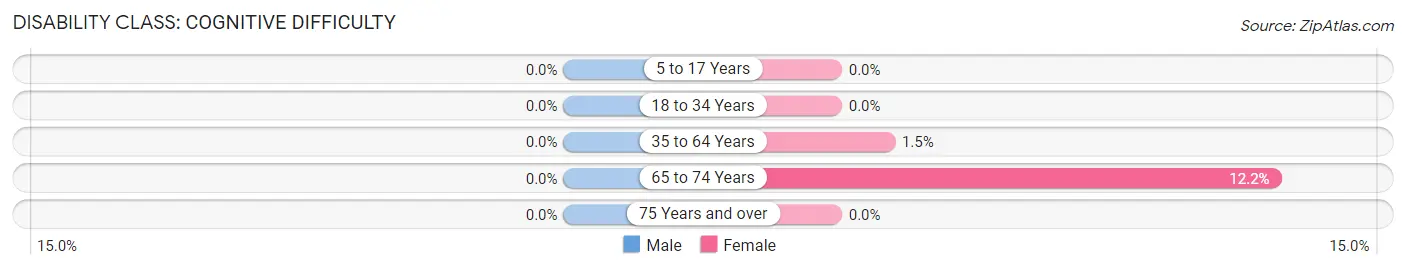
| Age Bracket | Male | Female |
| 5 to 17 Years | 0 (0.0%) | 0 (0.0%) |
| 18 to 34 Years | 0 (0.0%) | 0 (0.0%) |
| 35 to 64 Years | 0 (0.0%) | 9 (1.5%) |
| 65 to 74 Years | 0 (0.0%) | 12 (12.2%) |
| 75 Years and over | 0 (0.0%) | 0 (0.0%) |
Disability Class: Ambulatory Difficulty
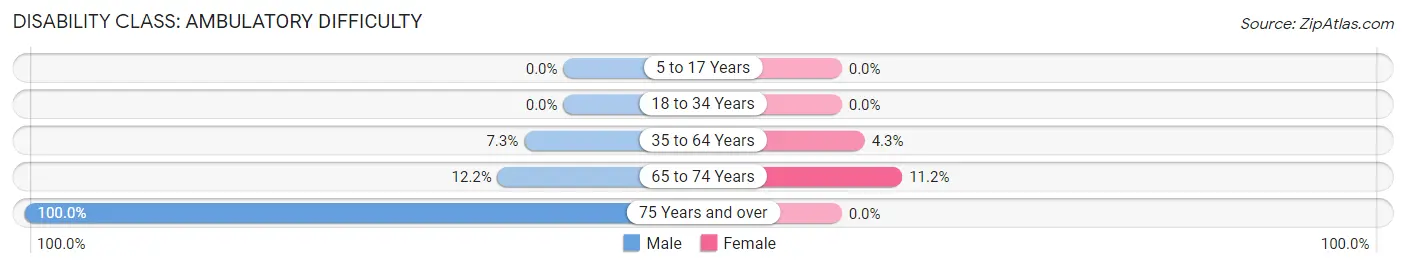
| Age Bracket | Male | Female |
| 5 to 17 Years | 0 (0.0%) | 0 (0.0%) |
| 18 to 34 Years | 0 (0.0%) | 0 (0.0%) |
| 35 to 64 Years | 39 (7.3%) | 26 (4.3%) |
| 65 to 74 Years | 10 (12.2%) | 11 (11.2%) |
| 75 Years and over | 7 (100.0%) | 0 (0.0%) |
Disability Class: Self-Care Difficulty
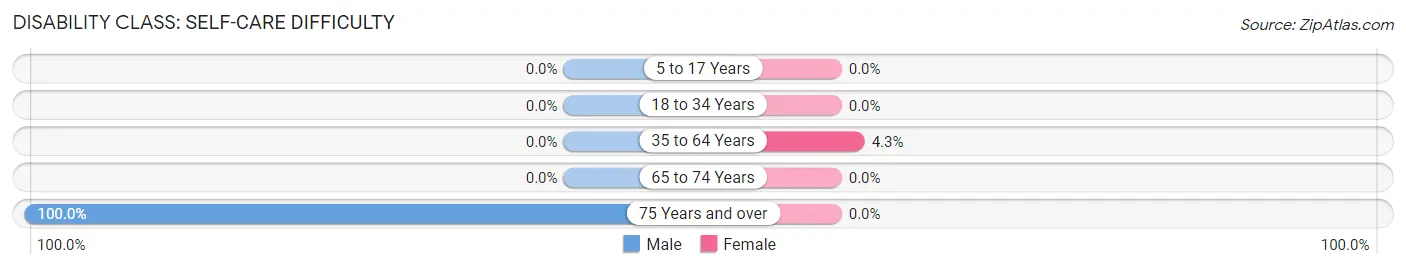
| Age Bracket | Male | Female |
| 5 to 17 Years | 0 (0.0%) | 0 (0.0%) |
| 18 to 34 Years | 0 (0.0%) | 0 (0.0%) |
| 35 to 64 Years | 0 (0.0%) | 26 (4.3%) |
| 65 to 74 Years | 0 (0.0%) | 0 (0.0%) |
| 75 Years and over | 7 (100.0%) | 0 (0.0%) |
Technology Access in Queensland
Computing Device Access in Queensland
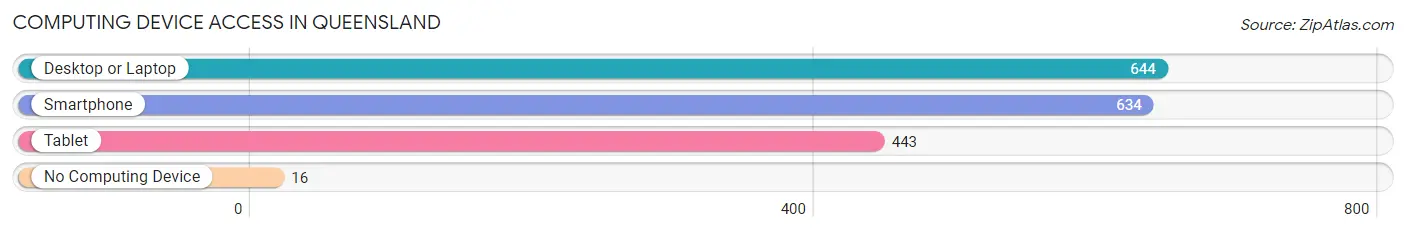
| Device Type | # Households | % Households |
| Desktop or Laptop | 644 | 97.6% |
| Smartphone | 634 | 96.1% |
| Tablet | 443 | 67.1% |
| No Computing Device | 16 | 2.4% |
| Total | 660 | 100.0% |
Internet Access in Queensland
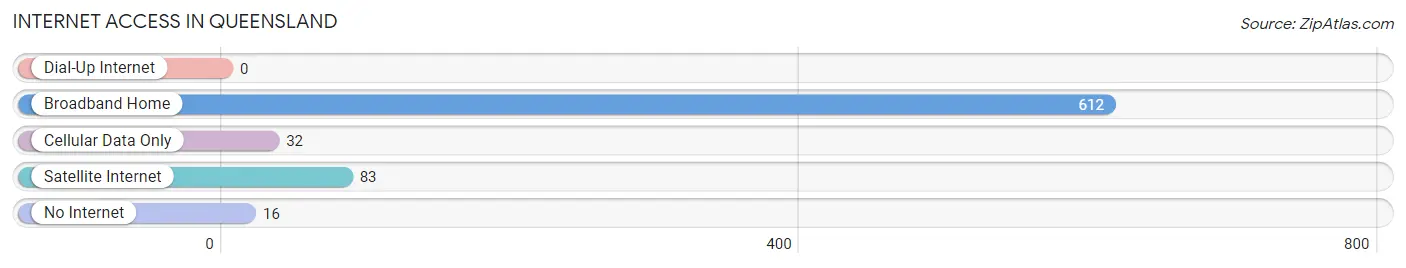
| Internet Type | # Households | % Households |
| Dial-Up Internet | 0 | 0.0% |
| Broadband Home | 612 | 92.7% |
| Cellular Data Only | 32 | 4.9% |
| Satellite Internet | 83 | 12.6% |
| No Internet | 16 | 2.4% |
| Total | 660 | 100.0% |
Queensland Summary
Queensland is a small town located in the state of Maryland, United States. It is situated in the northern part of the state, in the county of Prince George’s. The town is located on the Patuxent River, and is part of the Washington Metropolitan Area.
History
The area that is now known as Queensland was first settled in the late 1700s by a group of English settlers. The town was originally known as “The Town of Queen’s Land”, and was named after Queen Anne of England. The town was officially incorporated in 1867, and was named after the Queen’s Land.
The town was originally a farming community, and the main crops grown were tobacco, corn, and wheat. The town also had a few small businesses, such as a general store, a blacksmith, and a post office.
In the late 1800s, the town began to grow and develop. The railroad was built through the town, and the town became a popular stop for travelers. The town also became a popular destination for summer vacationers, and many of the town’s buildings were built during this time.
Geography
Queensland is located in the northern part of the state of Maryland, in the county of Prince George’s. The town is situated on the Patuxent River, and is part of the Washington Metropolitan Area. The town is located about 25 miles south of Washington, D.C.
The town is located in a rural area, and is surrounded by farmland and forests. The town is also located near several parks, including Patuxent River State Park and Patuxent Wildlife Research Center.
Economy
The economy of Queensland is largely based on agriculture and tourism. The town is home to several farms, and the main crops grown are tobacco, corn, and wheat. The town also has several small businesses, such as a general store, a blacksmith, and a post office.
The town is also a popular destination for tourists, and there are several attractions in the area, such as the Patuxent River State Park and Patuxent Wildlife Research Center. The town also has several restaurants and shops, as well as a few bed and breakfasts.
Demographics
As of the 2010 census, the population of Queensland was 1,845. The town has a population density of 1,845 people per square mile. The median age of the population is 44.7 years, and the median household income is $60,938.
The town is predominantly white, with a population that is 94.3% white. The town also has a small African American population, which makes up 4.2% of the population. The town also has a small Hispanic population, which makes up 1.5% of the population.
Conclusion
Queensland is a small town located in the state of Maryland, United States. It is situated in the northern part of the state, in the county of Prince George’s. The town is located on the Patuxent River, and is part of the Washington Metropolitan Area. The town has a long history, and was originally a farming community. The town is now largely based on agriculture and tourism, and is a popular destination for tourists. The town has a population of 1,845, and is predominantly white.
Common Questions
What is Per Capita Income in Queensland?
Per Capita income in Queensland is $64,188.
What is the Median Family Income in Queensland?
Median Family Income in Queensland is $163,523.
What is the Median Household income in Queensland?
Median Household Income in Queensland is $169,773.
What is Income or Wage Gap in Queensland?
Income or Wage Gap in Queensland is 26.4%.
Women in Queensland earn 73.6 cents for every dollar earned by a man.
What is Inequality or Gini Index in Queensland?
Inequality or Gini Index in Queensland is 0.30.
What is the Total Population of Queensland?
Total Population of Queensland is 2,034.
What is the Total Male Population of Queensland?
Total Male Population of Queensland is 835.
What is the Total Female Population of Queensland?
Total Female Population of Queensland is 1,199.
What is the Ratio of Males per 100 Females in Queensland?
There are 69.64 Males per 100 Females in Queensland.
What is the Ratio of Females per 100 Males in Queensland?
There are 143.59 Females per 100 Males in Queensland.
What is the Median Population Age in Queensland?
Median Population Age in Queensland is 46.8 Years.
What is the Average Family Size in Queensland
Average Family Size in Queensland is 3.1 People.
What is the Average Household Size in Queensland
Average Household Size in Queensland is 3.1 People.
How Large is the Labor Force in Queensland?
There are 1,162 People in the Labor Forcein in Queensland.
What is the Percentage of People in the Labor Force in Queensland?
65.3% of People are in the Labor Force in Queensland.
What is the Unemployment Rate in Queensland?
Unemployment Rate in Queensland is 2.0%.