Cities with the Highest Percentage of Vietnamese Population in Maryland

RELATED REPORTS & OPTIONS

Vietnamese
Population
Families and Households
Female Fertility
Female Fertility (Unmarried)
Race (Community Size)
Race (Percentage)
Ancestry (Community Size)
AfghanAfricanAlaska NativeAlaskan AthabascanAlbanianAleutAlsatianAmericanApacheArabArapahoArgentineanArmenianAssyrian / Chaldean / SyriacAustralianAustrianBahamianBangladeshiBarbadianBasqueBelgianBelizeanBermudanBhutaneseBlackfeetBolivianBrazilianBritishBritish West IndianBulgarianBurmeseCajunCambodianCanadianCape VerdeanCarpatho RusynCelticCentral AmericanCentral American IndianCherokeeCheyenneChickasawChileanChineseChippewaChoctawColombianColvilleComancheCosta RicanCreeCreekCroatianCrowCubanCypriotCzechCzechoslovakianDanishDelawareDominicanDutchDutch West IndianEastern EuropeanEcuadorianEgyptianEnglishEstonianEthiopianEuropeanFijianFilipinoFinnishFrenchFrench American IndianFrench CanadianGermanGerman RussianGhanaianGreekGuamanian / ChamorroGuatemalanGuyaneseHaitianHmongHonduranHopiHoumaHungarianIcelanderIndian (Asian)IndonesianInupiatIranianIraqiIrishIroquoisIsraeliItalianJamaicanJapaneseJordanianKenyanKiowaKoreanLaotianLatvianLebaneseLiberianLithuanianLumbeeLuxembourgerMacedonianMalaysianMalteseMarshalleseMenomineeMexicanMexican American IndianMongolianMoroccanNative HawaiianNavajoNepaleseNew ZealanderNicaraguanNigerianNorthern EuropeanNorwegianOkinawanOsageOttawaPaiutePakistaniPalestinianPanamanianParaguayanPennsylvania GermanPeruvianPimaPolishPortuguesePotawatomiPuebloPuerto RicanPuget Sound SalishRomanianRussianSalvadoranSamoanScandinavianScotch-IrishScottishSeminoleSenegaleseSerbianShoshoneSierra LeoneanSiouxSlavicSlovakSloveneSomaliSouth AfricanSouth AmericanSouth American IndianSoviet UnionSpaniardSpanishSpanish AmericanSpanish American IndianSri LankanSubsaharan AfricanSudaneseSwedishSwissSyrianTaiwaneseThaiTlingit-HaidaTohono O'OdhamTonganTrinidadian and TobagonianTsimshianTurkishU.S. Virgin IslanderUgandanUkrainianUruguayanUteVenezuelanVietnameseWelshWest IndianYakamaYaquiYugoslavianYumanYup'ikZimbabwean
Ancestry (Percentage)
AfghanAfricanAlaska NativeAlaskan AthabascanAlbanianAleutAlsatianAmericanApacheArabArapahoArgentineanArmenianAssyrian / Chaldean / SyriacAustralianAustrianBahamianBangladeshiBarbadianBasqueBelgianBelizeanBermudanBhutaneseBlackfeetBolivianBrazilianBritishBritish West IndianBulgarianBurmeseCajunCambodianCanadianCape VerdeanCarpatho RusynCelticCentral AmericanCentral American IndianCherokeeCheyenneChickasawChileanChineseChippewaChoctawColombianColvilleComancheCosta RicanCreeCreekCroatianCrowCubanCypriotCzechCzechoslovakianDanishDelawareDominicanDutchDutch West IndianEastern EuropeanEcuadorianEgyptianEnglishEstonianEthiopianEuropeanFijianFilipinoFinnishFrenchFrench American IndianFrench CanadianGermanGerman RussianGhanaianGreekGuamanian / ChamorroGuatemalanGuyaneseHaitianHmongHonduranHopiHoumaHungarianIcelanderIndian (Asian)IndonesianInupiatIranianIraqiIrishIroquoisIsraeliItalianJamaicanJapaneseJordanianKenyanKiowaKoreanLaotianLatvianLebaneseLiberianLithuanianLumbeeLuxembourgerMacedonianMalaysianMalteseMarshalleseMenomineeMexicanMexican American IndianMongolianMoroccanNative HawaiianNavajoNepaleseNew ZealanderNicaraguanNigerianNorthern EuropeanNorwegianOkinawanOsageOttawaPaiutePakistaniPalestinianPanamanianParaguayanPennsylvania GermanPeruvianPimaPolishPortuguesePotawatomiPuebloPuerto RicanPuget Sound SalishRomanianRussianSalvadoranSamoanScandinavianScotch-IrishScottishSeminoleSenegaleseSerbianShoshoneSierra LeoneanSiouxSlavicSlovakSloveneSomaliSouth AfricanSouth AmericanSouth American IndianSoviet UnionSpaniardSpanishSpanish AmericanSpanish American IndianSri LankanSubsaharan AfricanSudaneseSwedishSwissSyrianTaiwaneseThaiTlingit-HaidaTohono O'OdhamTonganTrinidadian and TobagonianTsimshianTurkishU.S. Virgin IslanderUgandanUkrainianUruguayanUteVenezuelanVietnameseWelshWest IndianYakamaYaquiYugoslavianYumanYup'ikZimbabwean
Immigrant Origin (Total)
AfghanistanAfricaAlbaniaArgentinaArmeniaAsiaAustraliaAustriaAzoresBahamasBangladeshBarbadosBelarusBelgiumBelizeBoliviaBosnia and HerzegovinaBrazilBulgariaBurma / MyanmarCabo VerdeCambodiaCameroonCanadaCaribbeanCentral AmericaChileChinaColombiaCongoCosta RicaCroatiaCubaCzechoslovakiaDenmarkDominicaDominican RepublicEastern AfricaEastern AsiaEastern EuropeEcuadorEgyptEl SalvadorEnglandEritreaEthiopiaEuropeFijiFranceGermanyGhanaGreeceGrenadaGuatemalaGuyanaHaitiHondurasHong KongHungaryIndiaIndonesiaIranIraqIrelandIsraelItalyJamaicaJapanJordanKazakhstanKenyaKoreaKuwaitLaosLatin AmericaLatviaLebanonLiberiaLithuaniaMalaysiaMexicoMicronesiaMiddle AfricaMoldovaMoroccoNepalNetherlandsNicaraguaNigeriaNorth MacedoniaNorthern AfricaNorthern EuropeNorwayOceaniaPakistanPanamaPeruPhilippinesPolandPortugalRomaniaRussiaSaudi ArabiaScotlandSenegalSerbiaSierra LeoneSingaporeSomaliaSouth AfricaSouth AmericaSouth Central AsiaSouth Eastern AsiaSouthern EuropeSpainSri LankaSt. Vincent and the GrenadinesSudanSwedenSwitzerlandSyriaTaiwanThailandTrinidad and TobagoTurkeyUgandaUkraineUruguayUzbekistanVenezuelaVietnamWest IndiesWestern AfricaWestern AsiaWestern EuropeYemenZaireZimbabwe
Immigrant Origin (Percentage)
AfghanistanAfricaAlbaniaArgentinaArmeniaAsiaAustraliaAustriaAzoresBahamasBangladeshBarbadosBelarusBelgiumBelizeBoliviaBosnia and HerzegovinaBrazilBulgariaBurma / MyanmarCabo VerdeCambodiaCameroonCanadaCaribbeanCentral AmericaChileChinaColombiaCongoCosta RicaCroatiaCubaCzechoslovakiaDenmarkDominicaDominican RepublicEastern AfricaEastern AsiaEastern EuropeEcuadorEgyptEl SalvadorEnglandEritreaEthiopiaEuropeFijiFranceGermanyGhanaGreeceGrenadaGuatemalaGuyanaHaitiHondurasHong KongHungaryIndiaIndonesiaIranIraqIrelandIsraelItalyJamaicaJapanJordanKazakhstanKenyaKoreaKuwaitLaosLatin AmericaLatviaLebanonLiberiaLithuaniaMalaysiaMexicoMicronesiaMiddle AfricaMoldovaMoroccoNepalNetherlandsNicaraguaNigeriaNorth MacedoniaNorthern AfricaNorthern EuropeNorwayOceaniaPakistanPanamaPeruPhilippinesPolandPortugalRomaniaRussiaSaudi ArabiaScotlandSenegalSerbiaSierra LeoneSingaporeSomaliaSouth AfricaSouth AmericaSouth Central AsiaSouth Eastern AsiaSouthern EuropeSpainSri LankaSt. Vincent and the GrenadinesSudanSwedenSwitzerlandSyriaTaiwanThailandTrinidad and TobagoTurkeyUgandaUkraineUruguayUzbekistanVenezuelaVietnamWest IndiesWestern AfricaWestern AsiaWestern EuropeYemenZaireZimbabwe
Income
Income (Families)
Income (Households)
Poverty
Poverty (Families)
Unemployment
Employment Occupations
Employment Industries
Employer Class
Commute Time
Commute Means
School Enrollment
Education by Degree Field
Occupancy
Finances
Physical Characteristics
Maryland
Compare Cities
Comparison Subject

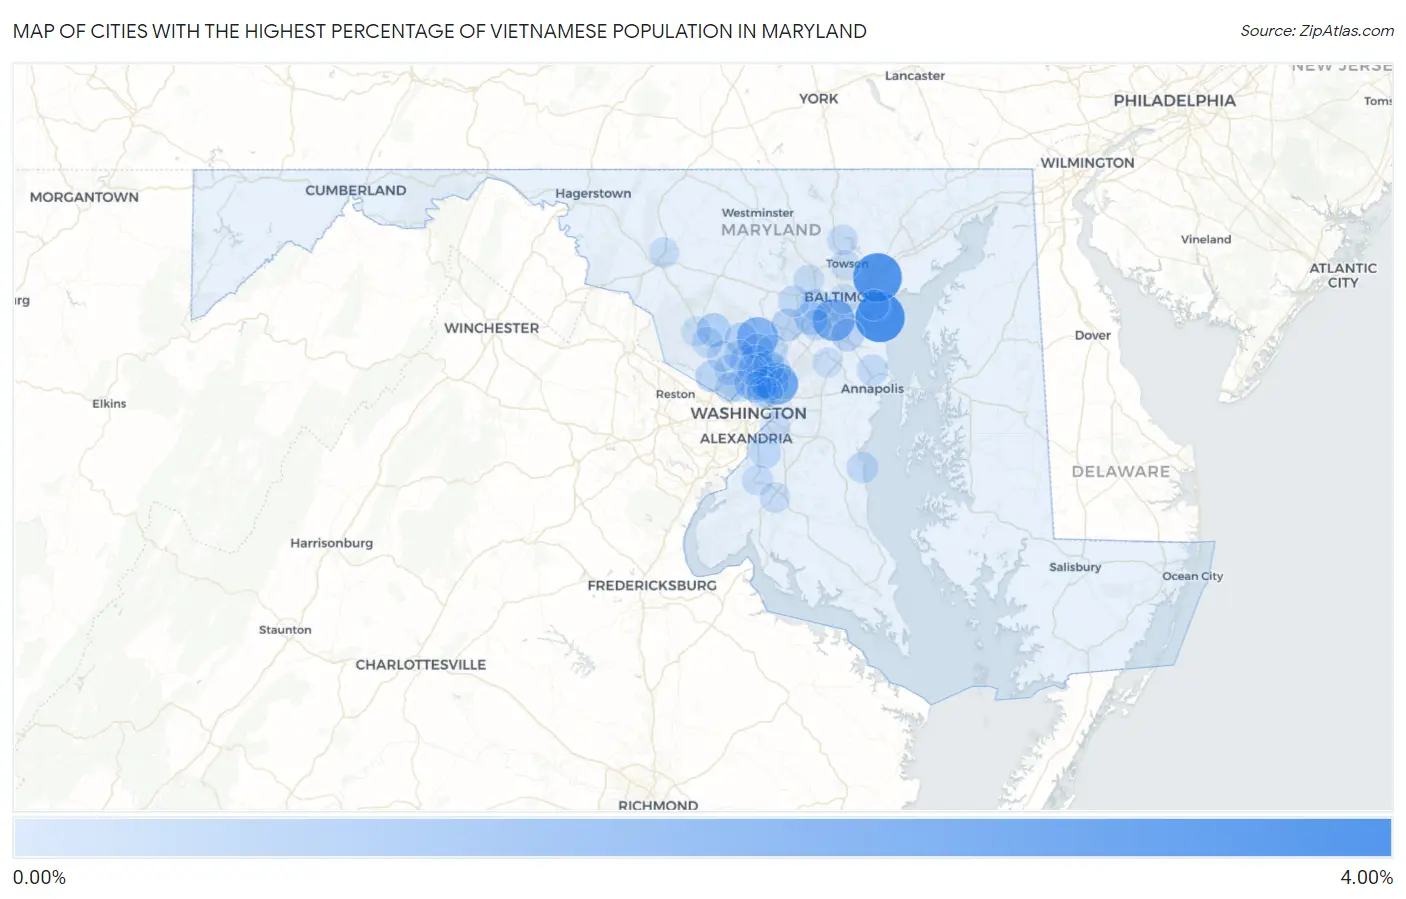
Map of Cities with the Highest Percentage of Vietnamese Population in Maryland

0.00%
4.00%
Cities with the Highest Percentage of Vietnamese Population in Maryland Map

Cities with the Highest Percentage of Vietnamese Population in Maryland

City Vietnamese vs State vs National
1.Edgemere3.38%0.098%(+3.28)#10.071%(+3.31)#19
2.Rossville3.24%0.098%(+3.14)#20.071%(+3.17)#20
3.Linthicum2.04%0.098%(+1.94)#30.071%(+1.97)#42
4.Berwyn Heights1.93%0.098%(+1.83)#40.071%(+1.86)#44
5.Ashton Sandy Spring1.83%0.098%(+1.73)#50.071%(+1.76)#52
6.Silver Spring0.93%0.098%(+0.832)#60.071%(+0.859)#113
7.College Park0.87%0.098%(+0.768)#70.071%(+0.795)#125
8.Montgomery Village0.62%0.098%(+0.527)#80.071%(+0.553)#174
9.Ilchester0.50%0.098%(+0.404)#90.071%(+0.431)#205
10.Glenmont0.46%0.098%(+0.365)#100.071%(+0.392)#227
11.Glen Burnie0.46%0.098%(+0.363)#110.071%(+0.390)#230
12.Columbia0.45%0.098%(+0.355)#120.071%(+0.382)#232
13.Olney0.44%0.098%(+0.347)#130.071%(+0.374)#237
14.Cloverly0.40%0.098%(+0.304)#140.071%(+0.330)#259
15.Colesville0.39%0.098%(+0.289)#150.071%(+0.316)#268
16.Adelphi0.32%0.098%(+0.227)#160.071%(+0.254)#296
17.Beltsville0.32%0.098%(+0.222)#170.071%(+0.249)#300
18.Woodlawn Cdp Baltimore County0.31%0.098%(+0.215)#180.071%(+0.241)#302
19.Potomac0.31%0.098%(+0.207)#190.071%(+0.234)#312
20.White Oak0.30%0.098%(+0.199)#200.071%(+0.226)#319
21.Friendly0.29%0.098%(+0.193)#210.071%(+0.220)#327
22.Catonsville0.28%0.098%(+0.178)#220.071%(+0.205)#341
23.Chevy Chase Section Five0.25%0.098%(+0.153)#230.071%(+0.180)#360
24.Calverton0.24%0.098%(+0.142)#240.071%(+0.169)#380
25.Ellicott City0.24%0.098%(+0.137)#250.071%(+0.164)#383
26.Langley Park0.23%0.098%(+0.136)#260.071%(+0.163)#385
27.Chillum0.23%0.098%(+0.136)#270.071%(+0.163)#386
28.Burtonsville0.23%0.098%(+0.135)#280.071%(+0.162)#387
29.North Beach0.23%0.098%(+0.129)#290.071%(+0.156)#395
30.Arnold0.22%0.098%(+0.120)#300.071%(+0.146)#411
31.Greenbelt0.20%0.098%(+0.101)#310.071%(+0.128)#438
32.Takoma Park0.19%0.098%(+0.096)#320.071%(+0.123)#444
33.North Bethesda0.19%0.098%(+0.093)#330.071%(+0.120)#452
34.Rockville0.18%0.098%(+0.087)#340.071%(+0.114)#458
35.Gaithersburg0.18%0.098%(+0.080)#350.071%(+0.107)#470
36.Dundalk0.17%0.098%(+0.068)#360.071%(+0.095)#484
37.Accokeek0.16%0.098%(+0.059)#370.071%(+0.086)#505
38.Elkridge0.14%0.098%(+0.041)#380.071%(+0.068)#529
39.Milford Mill0.11%0.098%(+0.016)#390.071%(+0.043)#577
40.Frederick0.11%0.098%(+0.013)#400.071%(+0.040)#584
41.Cockeysville0.11%0.098%(+0.010)#410.071%(+0.036)#588
42.Suitland0.085%0.098%(-0.013)#420.071%(+0.014)#641
43.Bethesda0.084%0.098%(-0.014)#430.071%(+0.013)#643
44.Waldorf0.075%0.098%(-0.023)#440.071%(+0.004)#674
45.Odenton0.047%0.098%(-0.051)#450.071%(-0.024)#777
46.Towson0.045%0.098%(-0.053)#460.071%(-0.026)#783
47.Germantown0.044%0.098%(-0.054)#470.071%(-0.027)#788
48.Hyattsville0.043%0.098%(-0.055)#480.071%(-0.028)#795
49.Kemp Mill0.035%0.098%(-0.062)#490.071%(-0.036)#830
50.Aspen Hill0.024%0.098%(-0.074)#500.071%(-0.047)#902
51.Baltimore0.020%0.098%(-0.078)#510.071%(-0.051)#923

Common Questions

What are the Top 10 Cities with the Highest Percentage of Vietnamese Population in Maryland?
Top 10 Cities with the Highest Percentage of Vietnamese Population in Maryland are:
What city has the Highest Percentage of Vietnamese Population in Maryland?
Edgemere has the Highest Percentage of Vietnamese Population in Maryland with 3.38%.
What is the Percentage of Vietnamese Population in the State of Maryland?
Percentage of Vietnamese Population in Maryland is 0.098%.
What is the Percentage of Vietnamese Population in the United States?
Percentage of Vietnamese Population in the United States is 0.071%.