Friendly, MD Map & Demographics
Friendly Map
Friendly Overview
$49,917
PER CAPITA INCOME
$153,924
AVG FAMILY INCOME
$123,750
AVG HOUSEHOLD INCOME
19.8%
WAGE / INCOME GAP [ % ]
80.2¢/ $1
WAGE / INCOME GAP [ $ ]
0.35
INEQUALITY / GINI INDEX
10,639
TOTAL POPULATION
5,417
MALE POPULATION
5,222
FEMALE POPULATION
103.73
MALES / 100 FEMALES
96.40
FEMALES / 100 MALES
47.1
MEDIAN AGE
3.5
AVG FAMILY SIZE
3.0
AVG HOUSEHOLD SIZE
5,905
LABOR FORCE [ PEOPLE ]
64.8%
PERCENT IN LABOR FORCE
6.9%
UNEMPLOYMENT RATE
Income in Friendly
Income Overview in Friendly
Per Capita Income in Friendly is $49,917, while median incomes of families and households are $153,924 and $123,750 respectively.
| Characteristic | Number | Measure |
| Per Capita Income | 10,639 | $49,917 |
| Median Family Income | 2,498 | $153,924 |
| Mean Family Income | 2,498 | $159,527 |
| Median Household Income | 3,564 | $123,750 |
| Mean Household Income | 3,564 | $141,862 |
| Income Deficit | 2,498 | $0 |
| Wage / Income Gap (%) | 10,639 | 19.82% |
| Wage / Income Gap ($) | 10,639 | 80.18¢ per $1 |
| Gini / Inequality Index | 10,639 | 0.35 |
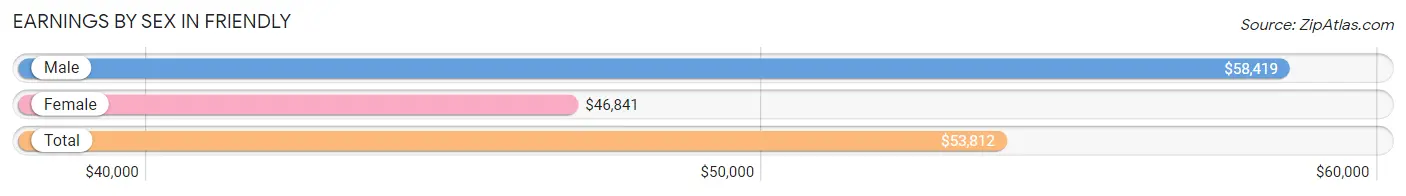
Earnings by Sex in Friendly
Average Earnings in Friendly are $53,812, $58,419 for men and $46,841 for women, a difference of 19.8%.
| Sex | Number | Average Earnings |
| Male | 2,963 (50.1%) | $58,419 |
| Female | 2,946 (49.9%) | $46,841 |
| Total | 5,909 (100.0%) | $53,812 |
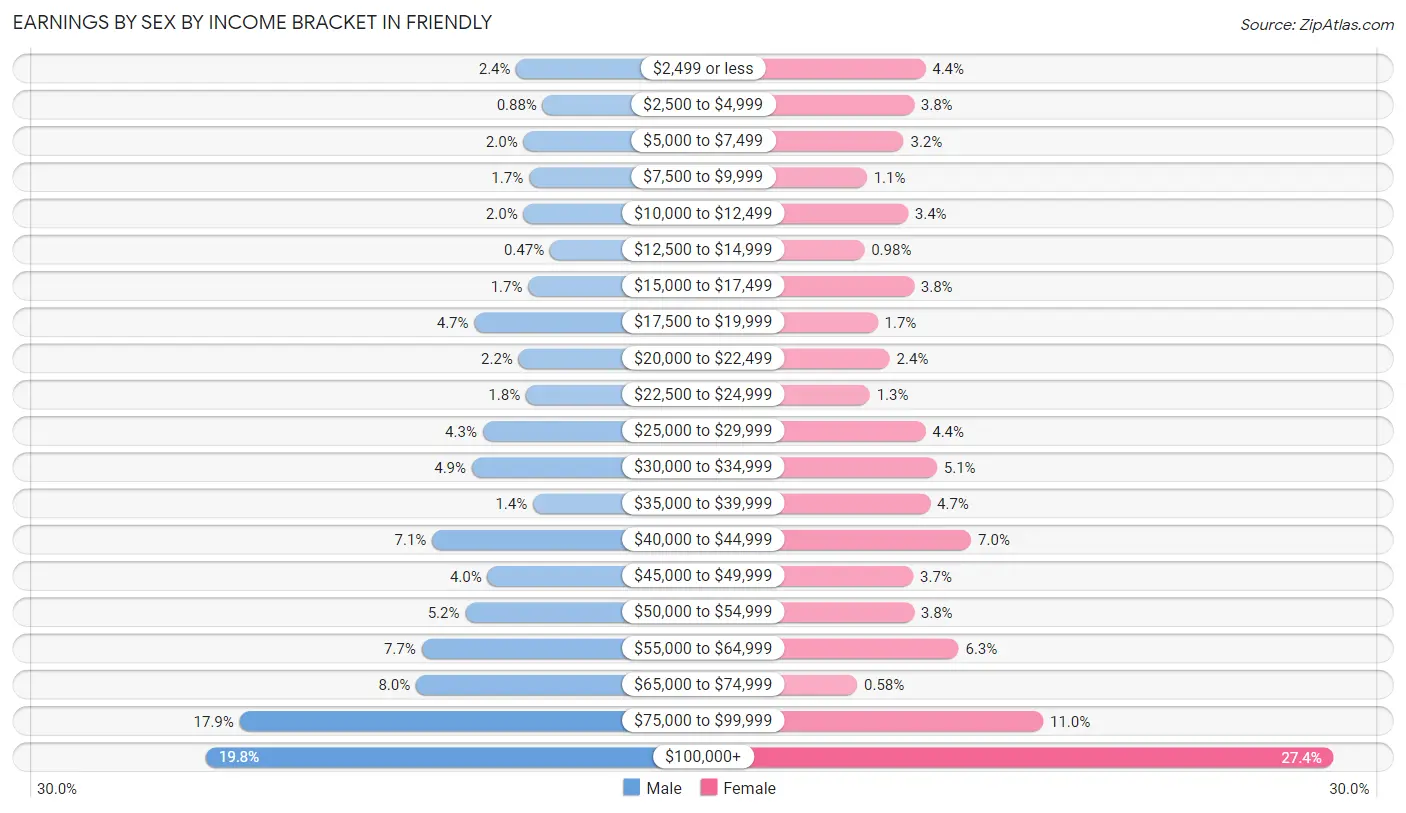
Earnings by Sex by Income Bracket in Friendly
The most common earnings brackets in Friendly are $100,000+ for men (587 | 19.8%) and $100,000+ for women (806 | 27.4%).
| Income | Male | Female |
| $2,499 or less | 70 (2.4%) | 130 (4.4%) |
| $2,500 to $4,999 | 26 (0.9%) | 111 (3.8%) |
| $5,000 to $7,499 | 58 (2.0%) | 94 (3.2%) |
| $7,500 to $9,999 | 49 (1.7%) | 33 (1.1%) |
| $10,000 to $12,499 | 58 (2.0%) | 101 (3.4%) |
| $12,500 to $14,999 | 14 (0.5%) | 29 (1.0%) |
| $15,000 to $17,499 | 50 (1.7%) | 111 (3.8%) |
| $17,500 to $19,999 | 140 (4.7%) | 51 (1.7%) |
| $20,000 to $22,499 | 66 (2.2%) | 71 (2.4%) |
| $22,500 to $24,999 | 54 (1.8%) | 38 (1.3%) |
| $25,000 to $29,999 | 126 (4.3%) | 130 (4.4%) |
| $30,000 to $34,999 | 144 (4.9%) | 149 (5.1%) |
| $35,000 to $39,999 | 42 (1.4%) | 138 (4.7%) |
| $40,000 to $44,999 | 210 (7.1%) | 206 (7.0%) |
| $45,000 to $49,999 | 118 (4.0%) | 110 (3.7%) |
| $50,000 to $54,999 | 155 (5.2%) | 111 (3.8%) |
| $55,000 to $64,999 | 228 (7.7%) | 185 (6.3%) |
| $65,000 to $74,999 | 237 (8.0%) | 17 (0.6%) |
| $75,000 to $99,999 | 531 (17.9%) | 325 (11.0%) |
| $100,000+ | 587 (19.8%) | 806 (27.4%) |
| Total | 2,963 (100.0%) | 2,946 (100.0%) |
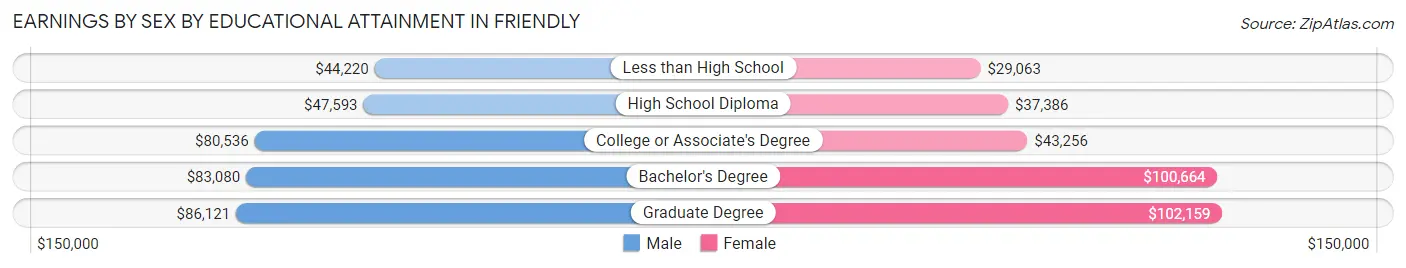
Earnings by Sex by Educational Attainment in Friendly
Average earnings in Friendly are $61,894 for men and $54,562 for women, a difference of 11.8%. Men with an educational attainment of graduate degree enjoy the highest average annual earnings of $86,121, while those with less than high school education earn the least with $44,220. Women with an educational attainment of graduate degree earn the most with the average annual earnings of $102,159, while those with less than high school education have the smallest earnings of $29,063.
| Educational Attainment | Male Income | Female Income |
| Less than High School | $44,220 | $29,063 |
| High School Diploma | $47,593 | $37,386 |
| College or Associate's Degree | $80,536 | $43,256 |
| Bachelor's Degree | $83,080 | $100,664 |
| Graduate Degree | $86,121 | $102,159 |
| Total | $61,894 | $54,562 |
Family Income in Friendly
Family Income Brackets in Friendly
According to the Friendly family income data, there are 849 families falling into the $200,000+ income range, which is the most common income bracket and makes up 34.0% of all families.
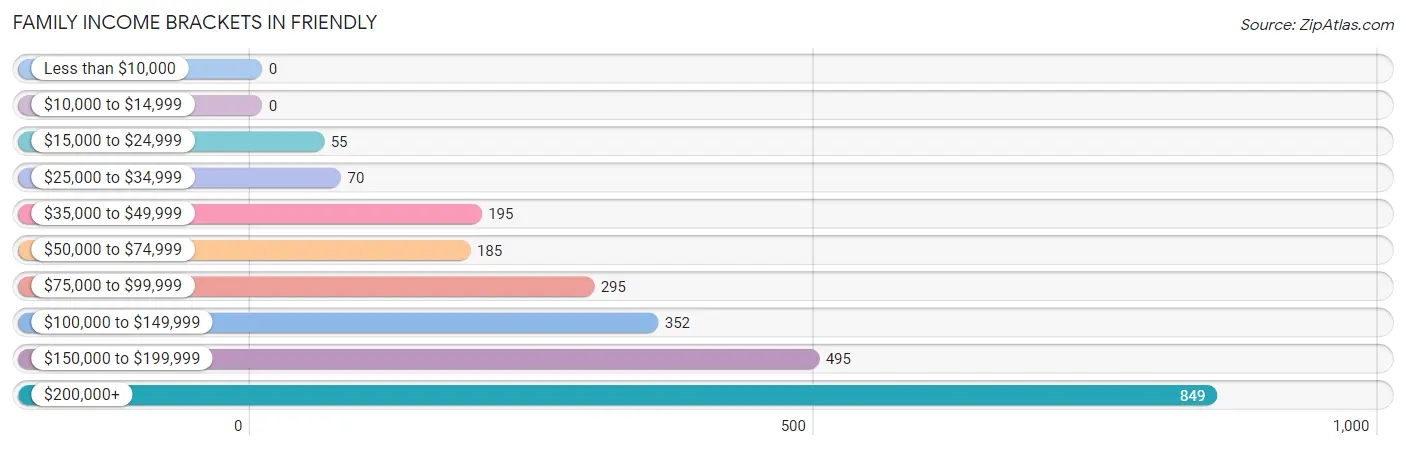
| Income Bracket | # Families | % Families |
| Less than $10,000 | 0 | 0.0% |
| $10,000 to $14,999 | 0 | 0.0% |
| $15,000 to $24,999 | 55 | 2.2% |
| $25,000 to $34,999 | 70 | 2.8% |
| $35,000 to $49,999 | 195 | 7.8% |
| $50,000 to $74,999 | 185 | 7.4% |
| $75,000 to $99,999 | 295 | 11.8% |
| $100,000 to $149,999 | 352 | 14.1% |
| $150,000 to $199,999 | 495 | 19.8% |
| $200,000+ | 849 | 34.0% |
Family Income by Famaliy Size in Friendly
6-person families (87 | 3.5%) account for the highest median family income in Friendly with $207,684 per family, while 2-person families (1,034 | 41.4%) have the highest median income of $74,623 per family member.
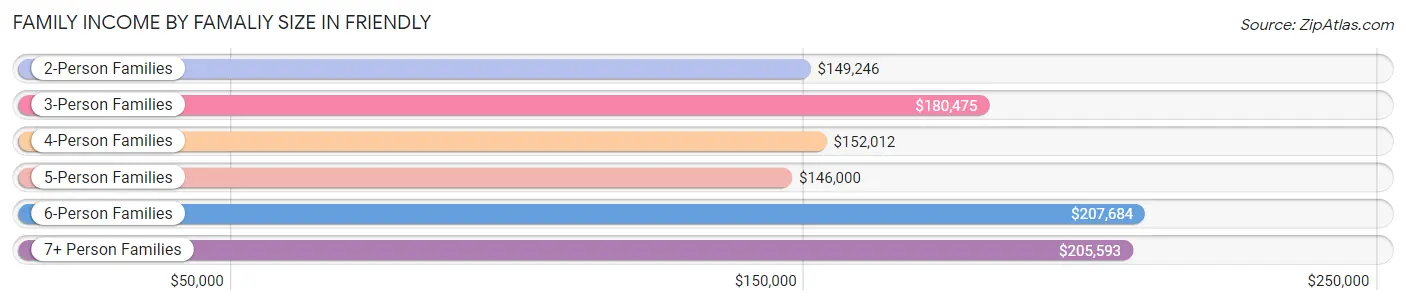
| Income Bracket | # Families | Median Income |
| 2-Person Families | 1,034 (41.4%) | $149,246 |
| 3-Person Families | 703 (28.1%) | $180,475 |
| 4-Person Families | 456 (18.2%) | $152,012 |
| 5-Person Families | 108 (4.3%) | $146,000 |
| 6-Person Families | 87 (3.5%) | $207,684 |
| 7+ Person Families | 110 (4.4%) | $205,593 |
| Total | 2,498 (100.0%) | $153,924 |
Family Income by Number of Earners in Friendly
The median family income in Friendly is $153,924, with families comprising 2 earners (1,014) having the highest median family income of $200,694, while families with no earners (255) have the lowest median family income of $94,107, accounting for 40.6% and 10.2% of families, respectively.
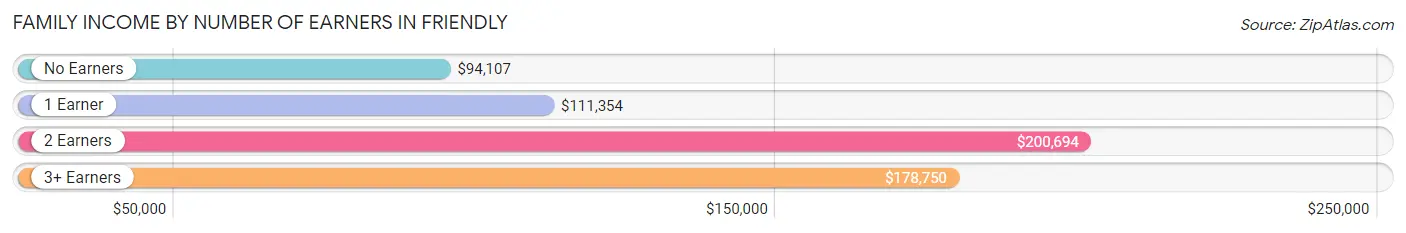
| Number of Earners | # Families | Median Income |
| No Earners | 255 (10.2%) | $94,107 |
| 1 Earner | 737 (29.5%) | $111,354 |
| 2 Earners | 1,014 (40.6%) | $200,694 |
| 3+ Earners | 492 (19.7%) | $178,750 |
| Total | 2,498 (100.0%) | $153,924 |
Household Income in Friendly
Household Income Brackets in Friendly
With 912 households falling in the category, the $200,000+ income range is the most frequent in Friendly, accounting for 25.6% of all households. In contrast, only 11 households (0.3%) fall into the $10,000 to $14,999 income bracket, making it the least populous group.
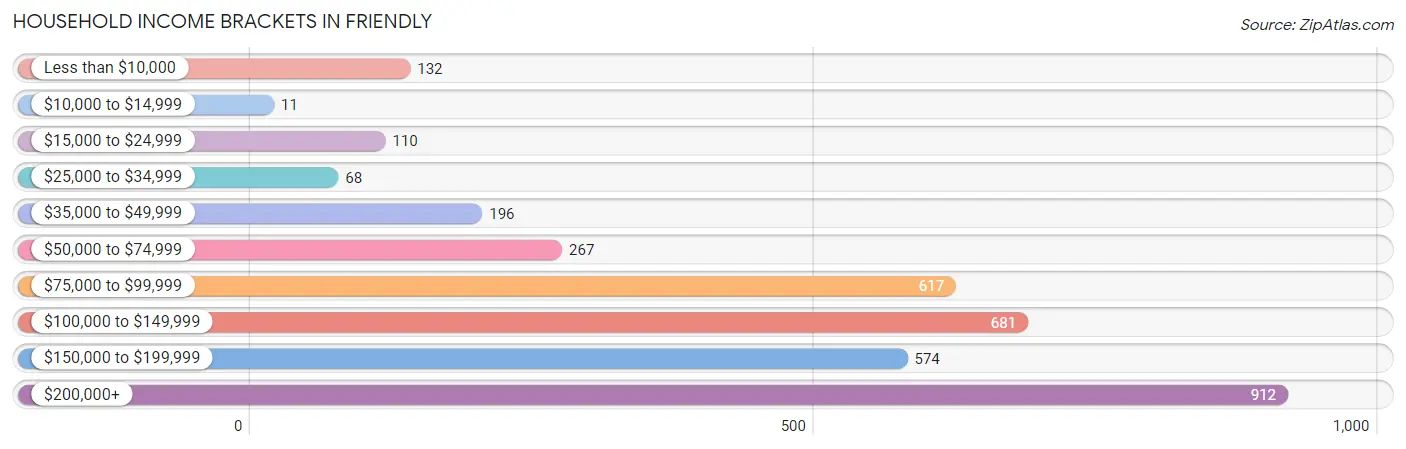
| Income Bracket | # Households | % Households |
| Less than $10,000 | 132 | 3.7% |
| $10,000 to $14,999 | 11 | 0.3% |
| $15,000 to $24,999 | 110 | 3.1% |
| $25,000 to $34,999 | 68 | 1.9% |
| $35,000 to $49,999 | 196 | 5.5% |
| $50,000 to $74,999 | 267 | 7.5% |
| $75,000 to $99,999 | 617 | 17.3% |
| $100,000 to $149,999 | 681 | 19.1% |
| $150,000 to $199,999 | 574 | 16.1% |
| $200,000+ | 912 | 25.6% |
Household Income by Householder Age in Friendly
The median household income in Friendly is $123,750, with the highest median household income of $161,438 found in the 25 to 44 years age bracket for the primary householder. A total of 645 households (18.1%) fall into this category. Meanwhile, the 15 to 24 years age bracket for the primary householder has the lowest median household income of $0, with 5 households (0.1%) in this group.
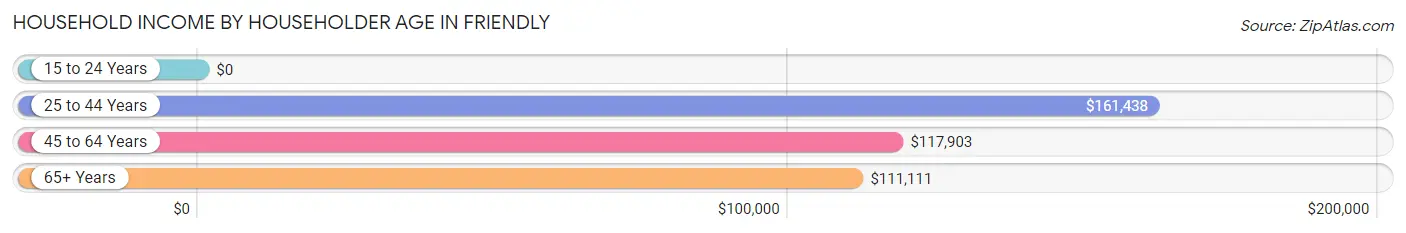
| Income Bracket | # Households | Median Income |
| 15 to 24 Years | 5 (0.1%) | $0 |
| 25 to 44 Years | 645 (18.1%) | $161,438 |
| 45 to 64 Years | 1,870 (52.5%) | $117,903 |
| 65+ Years | 1,044 (29.3%) | $111,111 |
| Total | 3,564 (100.0%) | $123,750 |
Poverty in Friendly
Income Below Poverty by Sex and Age in Friendly
With 10.3% poverty level for males and 7.3% for females among the residents of Friendly, under 5 year old males and under 5 year old females are the most vulnerable to poverty, with 84 males (38.5%) and 42 females (30.9%) in their respective age groups living below the poverty level.
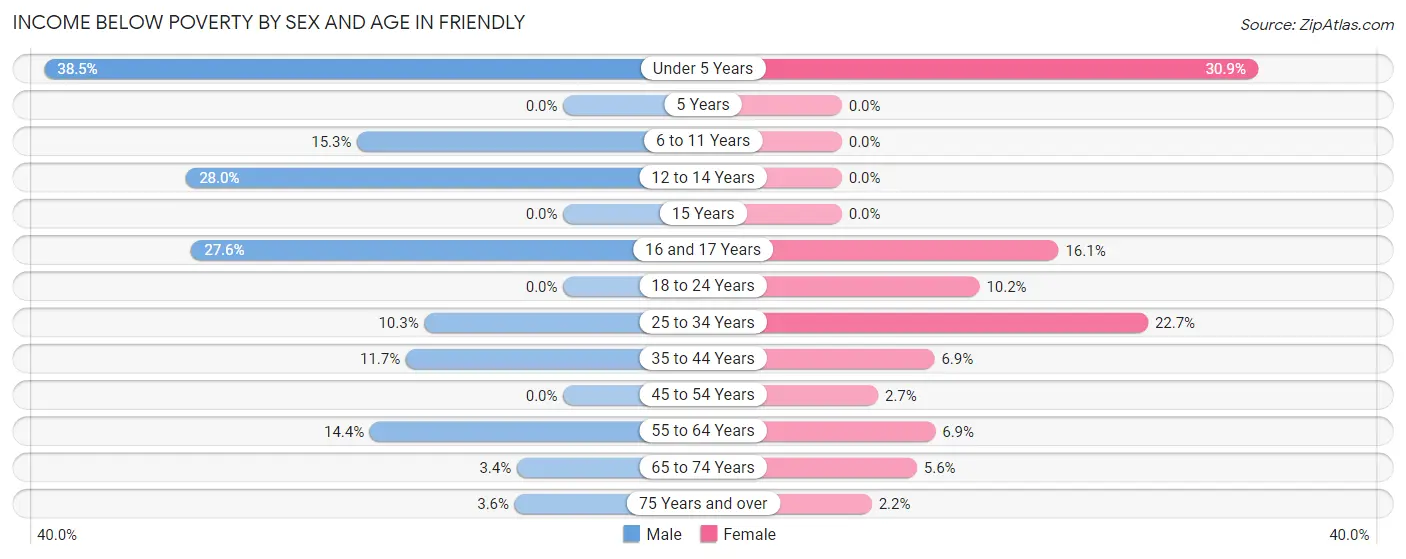
| Age Bracket | Male | Female |
| Under 5 Years | 84 (38.5%) | 42 (30.9%) |
| 5 Years | 0 (0.0%) | 0 (0.0%) |
| 6 to 11 Years | 43 (15.3%) | 0 (0.0%) |
| 12 to 14 Years | 42 (28.0%) | 0 (0.0%) |
| 15 Years | 0 (0.0%) | 0 (0.0%) |
| 16 and 17 Years | 29 (27.6%) | 42 (16.1%) |
| 18 to 24 Years | 0 (0.0%) | 38 (10.2%) |
| 25 to 34 Years | 76 (10.3%) | 75 (22.7%) |
| 35 to 44 Years | 82 (11.7%) | 44 (6.9%) |
| 45 to 54 Years | 0 (0.0%) | 26 (2.7%) |
| 55 to 64 Years | 153 (14.3%) | 62 (6.9%) |
| 65 to 74 Years | 23 (3.4%) | 41 (5.6%) |
| 75 Years and over | 8 (3.6%) | 9 (2.2%) |
| Total | 540 (10.3%) | 379 (7.3%) |
Income Above Poverty by Sex and Age in Friendly
According to the poverty statistics in Friendly, males aged 5 years and females aged 5 years are the age groups that are most secure financially, with 100.0% of males and 100.0% of females in these age groups living above the poverty line.
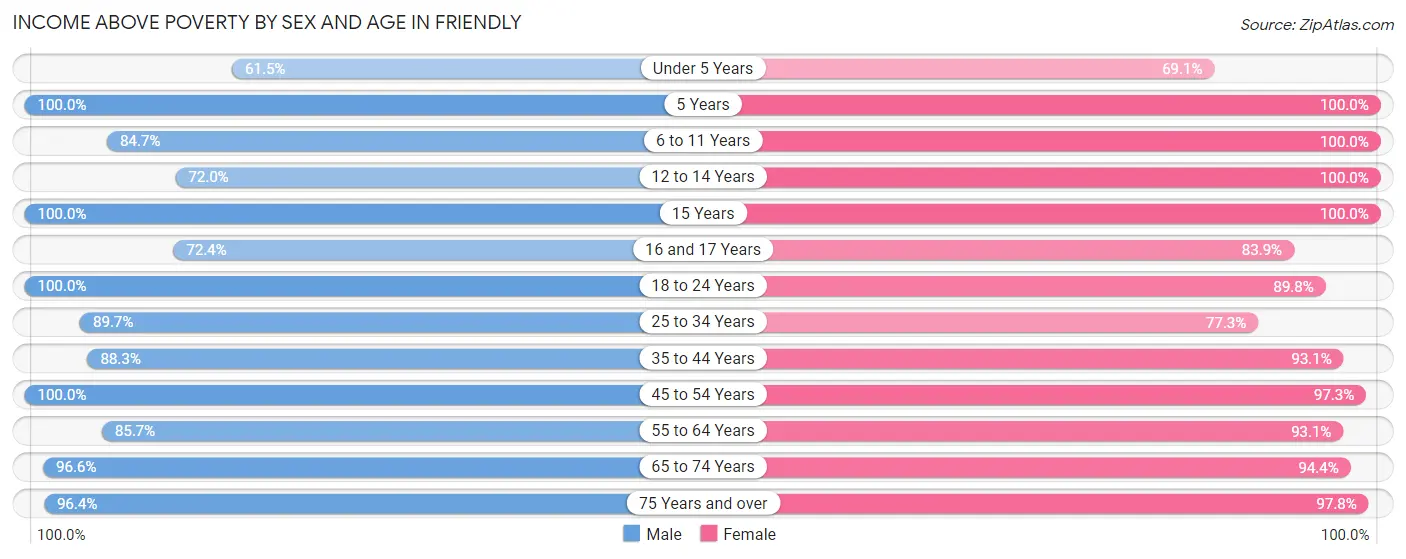
| Age Bracket | Male | Female |
| Under 5 Years | 134 (61.5%) | 94 (69.1%) |
| 5 Years | 12 (100.0%) | 28 (100.0%) |
| 6 to 11 Years | 238 (84.7%) | 182 (100.0%) |
| 12 to 14 Years | 108 (72.0%) | 212 (100.0%) |
| 15 Years | 99 (100.0%) | 12 (100.0%) |
| 16 and 17 Years | 76 (72.4%) | 219 (83.9%) |
| 18 to 24 Years | 333 (100.0%) | 334 (89.8%) |
| 25 to 34 Years | 661 (89.7%) | 255 (77.3%) |
| 35 to 44 Years | 620 (88.3%) | 596 (93.1%) |
| 45 to 54 Years | 660 (100.0%) | 940 (97.3%) |
| 55 to 64 Years | 913 (85.7%) | 832 (93.1%) |
| 65 to 74 Years | 645 (96.6%) | 695 (94.4%) |
| 75 Years and over | 214 (96.4%) | 396 (97.8%) |
| Total | 4,713 (89.7%) | 4,795 (92.7%) |
Income Below Poverty Among Married-Couple Families in Friendly
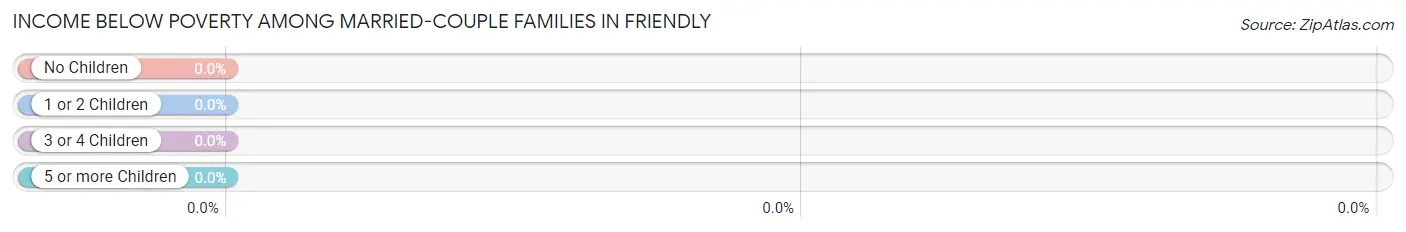
| Children | Above Poverty | Below Poverty |
| No Children | 1,174 (100.0%) | 0 (0.0%) |
| 1 or 2 Children | 448 (100.0%) | 0 (0.0%) |
| 3 or 4 Children | 65 (100.0%) | 0 (0.0%) |
| 5 or more Children | 10 (100.0%) | 0 (0.0%) |
| Total | 1,697 (100.0%) | 0 (0.0%) |
Income Below Poverty Among Single-Parent Households in Friendly
According to the poverty data in Friendly, 12.6% or 32 single-father households and 7.5% or 41 single-mother households are living below the poverty line. Among single-father households, those with 1 or 2 children have the highest poverty rate, with 32 households (33.7%) experiencing poverty. Likewise, among single-mother households, those with 5 or more children have the highest poverty rate, with 41 households (100.0%) falling below the poverty line.
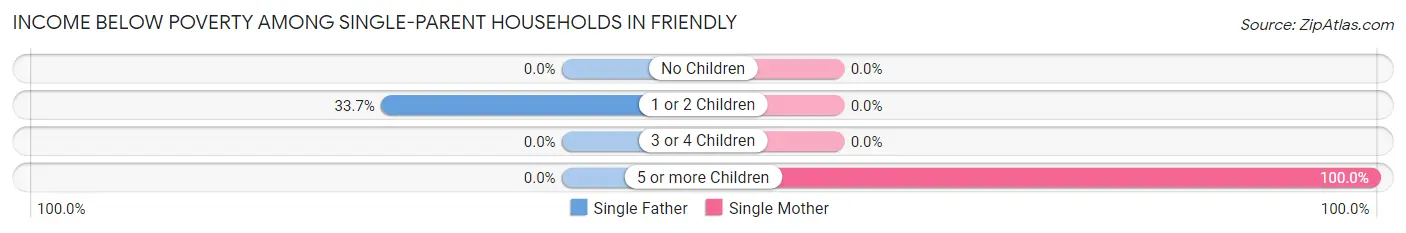
| Children | Single Father | Single Mother |
| No Children | 0 (0.0%) | 0 (0.0%) |
| 1 or 2 Children | 32 (33.7%) | 0 (0.0%) |
| 3 or 4 Children | 0 (0.0%) | 0 (0.0%) |
| 5 or more Children | 0 (0.0%) | 41 (100.0%) |
| Total | 32 (12.6%) | 41 (7.5%) |
Income Below Poverty Among Married-Couple vs Single-Parent Households in Friendly
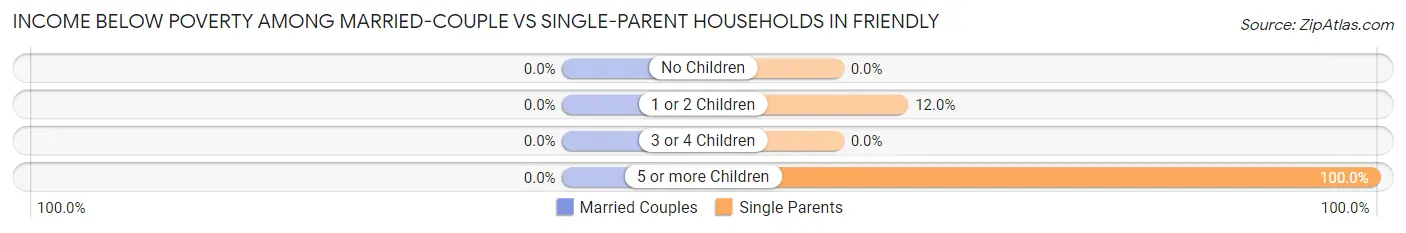
| Children | Married-Couple Families | Single-Parent Households |
| No Children | 0 (0.0%) | 0 (0.0%) |
| 1 or 2 Children | 0 (0.0%) | 32 (12.0%) |
| 3 or 4 Children | 0 (0.0%) | 0 (0.0%) |
| 5 or more Children | 0 (0.0%) | 41 (100.0%) |
| Total | 0 (0.0%) | 73 (9.1%) |
Race in Friendly
The most populous races in Friendly are Black / African American (6,184 | 58.1%), Hispanic or Latino (2,136 | 20.1%), and Some other Race (1,745 | 16.4%).
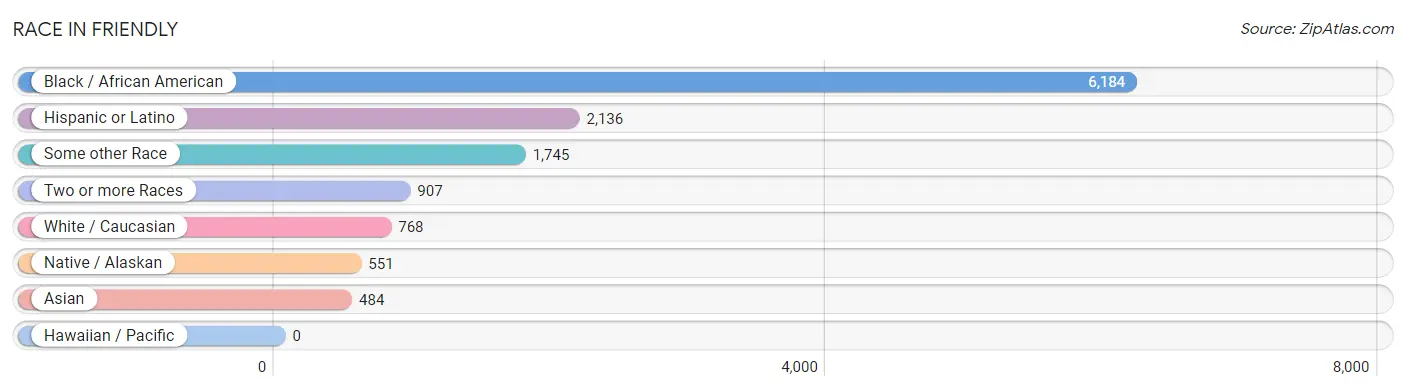
| Race | # Population | % Population |
| Asian | 484 | 4.5% |
| Black / African American | 6,184 | 58.1% |
| Hawaiian / Pacific | 0 | 0.0% |
| Hispanic or Latino | 2,136 | 20.1% |
| Native / Alaskan | 551 | 5.2% |
| White / Caucasian | 768 | 7.2% |
| Two or more Races | 907 | 8.5% |
| Some other Race | 1,745 | 16.4% |
| Total | 10,639 | 100.0% |
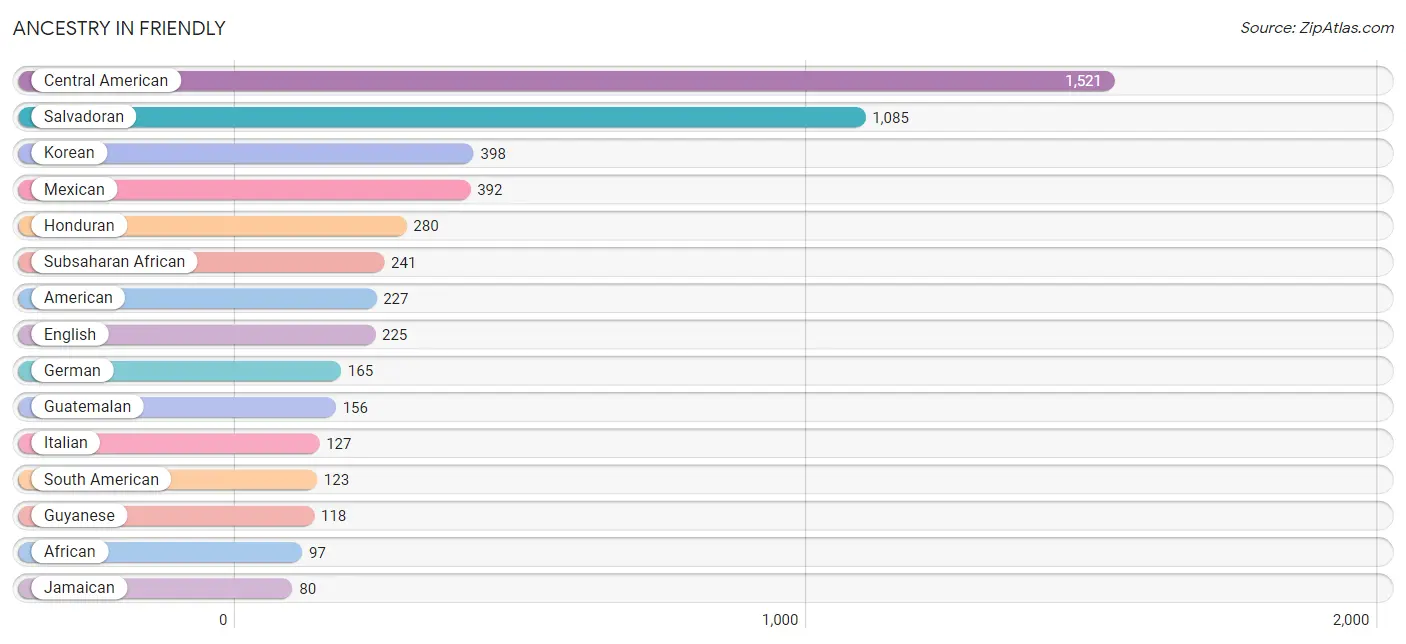
Ancestry in Friendly
The most populous ancestries reported in Friendly are Central American (1,521 | 14.3%), Salvadoran (1,085 | 10.2%), Korean (398 | 3.7%), Mexican (392 | 3.7%), and Honduran (280 | 2.6%), together accounting for 34.5% of all Friendly residents.
| Ancestry | # Population | % Population |
| African | 97 | 0.9% |
| American | 227 | 2.1% |
| Arab | 73 | 0.7% |
| Bermudan | 6 | 0.1% |
| Bhutanese | 54 | 0.5% |
| Bolivian | 64 | 0.6% |
| Brazilian | 7 | 0.1% |
| British | 41 | 0.4% |
| Central American | 1,521 | 14.3% |
| Cherokee | 48 | 0.4% |
| Dominican | 30 | 0.3% |
| Egyptian | 57 | 0.5% |
| English | 225 | 2.1% |
| Ethiopian | 21 | 0.2% |
| French | 49 | 0.5% |
| French Canadian | 22 | 0.2% |
| German | 165 | 1.5% |
| Ghanaian | 6 | 0.1% |
| Greek | 39 | 0.4% |
| Guatemalan | 156 | 1.5% |
| Guyanese | 118 | 1.1% |
| Honduran | 280 | 2.6% |
| Indian (Asian) | 74 | 0.7% |
| Irish | 73 | 0.7% |
| Italian | 127 | 1.2% |
| Jamaican | 80 | 0.7% |
| Korean | 398 | 3.7% |
| Lithuanian | 6 | 0.1% |
| Mexican | 392 | 3.7% |
| Moroccan | 16 | 0.2% |
| Native Hawaiian | 25 | 0.2% |
| Norwegian | 35 | 0.3% |
| Peruvian | 59 | 0.5% |
| Polish | 9 | 0.1% |
| Puerto Rican | 50 | 0.5% |
| Russian | 6 | 0.1% |
| Salvadoran | 1,085 | 10.2% |
| Scandinavian | 27 | 0.3% |
| Scottish | 27 | 0.3% |
| South American | 123 | 1.2% |
| Subsaharan African | 241 | 2.3% |
| Swedish | 53 | 0.5% |
| Trinidadian and Tobagonian | 11 | 0.1% |
| Ukrainian | 3 | 0.0% |
| Vietnamese | 31 | 0.3% |
| Welsh | 37 | 0.4% | View All 46 Rows |
Immigrants in Friendly
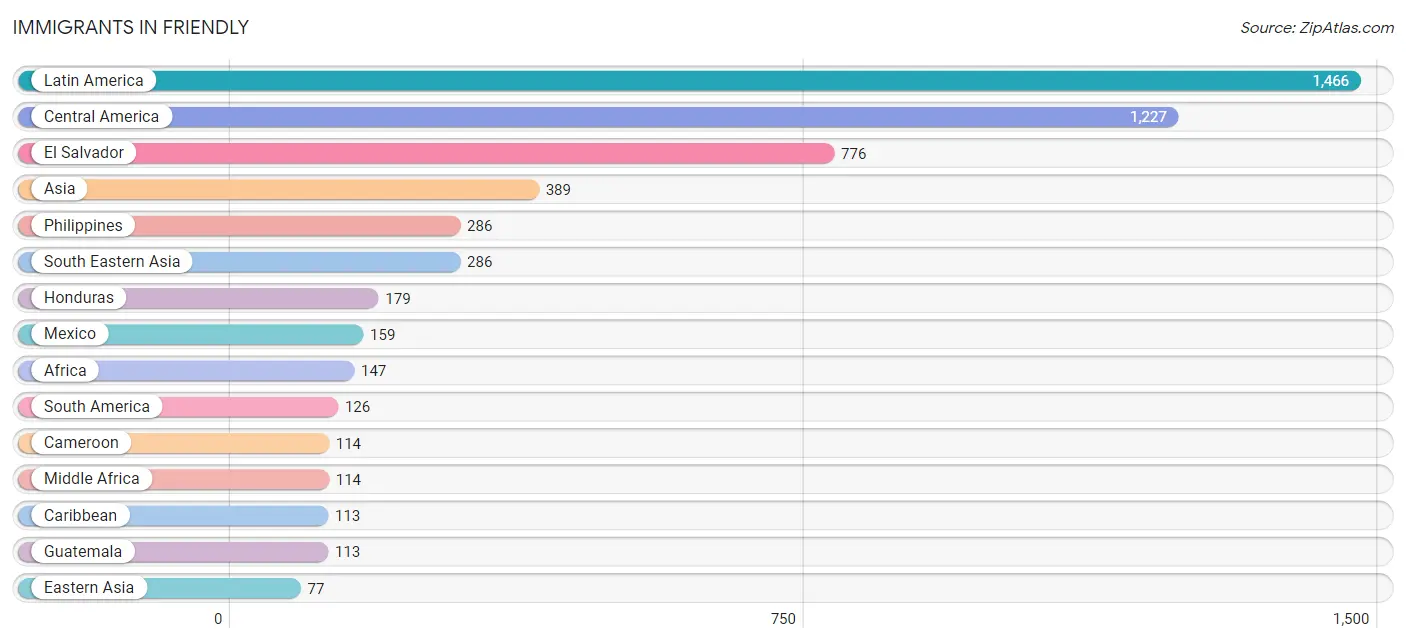
The most numerous immigrant groups reported in Friendly came from Latin America (1,466 | 13.8%), Central America (1,227 | 11.5%), El Salvador (776 | 7.3%), Asia (389 | 3.7%), and Philippines (286 | 2.7%), together accounting for 39.0% of all Friendly residents.
| Immigration Origin | # Population | % Population |
| Africa | 147 | 1.4% |
| Asia | 389 | 3.7% |
| Bangladesh | 26 | 0.2% |
| Brazil | 7 | 0.1% |
| Cameroon | 114 | 1.1% |
| Caribbean | 113 | 1.1% |
| Central America | 1,227 | 11.5% |
| China | 70 | 0.7% |
| Dominican Republic | 76 | 0.7% |
| Eastern Africa | 14 | 0.1% |
| Eastern Asia | 77 | 0.7% |
| Eastern Europe | 15 | 0.1% |
| Egypt | 19 | 0.2% |
| El Salvador | 776 | 7.3% |
| Ethiopia | 10 | 0.1% |
| Europe | 55 | 0.5% |
| Guatemala | 113 | 1.1% |
| Guyana | 71 | 0.7% |
| Honduras | 179 | 1.7% |
| Hong Kong | 19 | 0.2% |
| Ireland | 22 | 0.2% |
| Jamaica | 31 | 0.3% |
| Japan | 7 | 0.1% |
| Latin America | 1,466 | 13.8% |
| Mexico | 159 | 1.5% |
| Middle Africa | 114 | 1.1% |
| Northern Africa | 19 | 0.2% |
| Northern Europe | 40 | 0.4% |
| Peru | 48 | 0.4% |
| Philippines | 286 | 2.7% |
| Russia | 6 | 0.1% |
| South America | 126 | 1.2% |
| South Central Asia | 26 | 0.2% |
| South Eastern Asia | 286 | 2.7% |
| Trinidad and Tobago | 6 | 0.1% | View All 35 Rows |
Sex and Age in Friendly
Sex and Age in Friendly
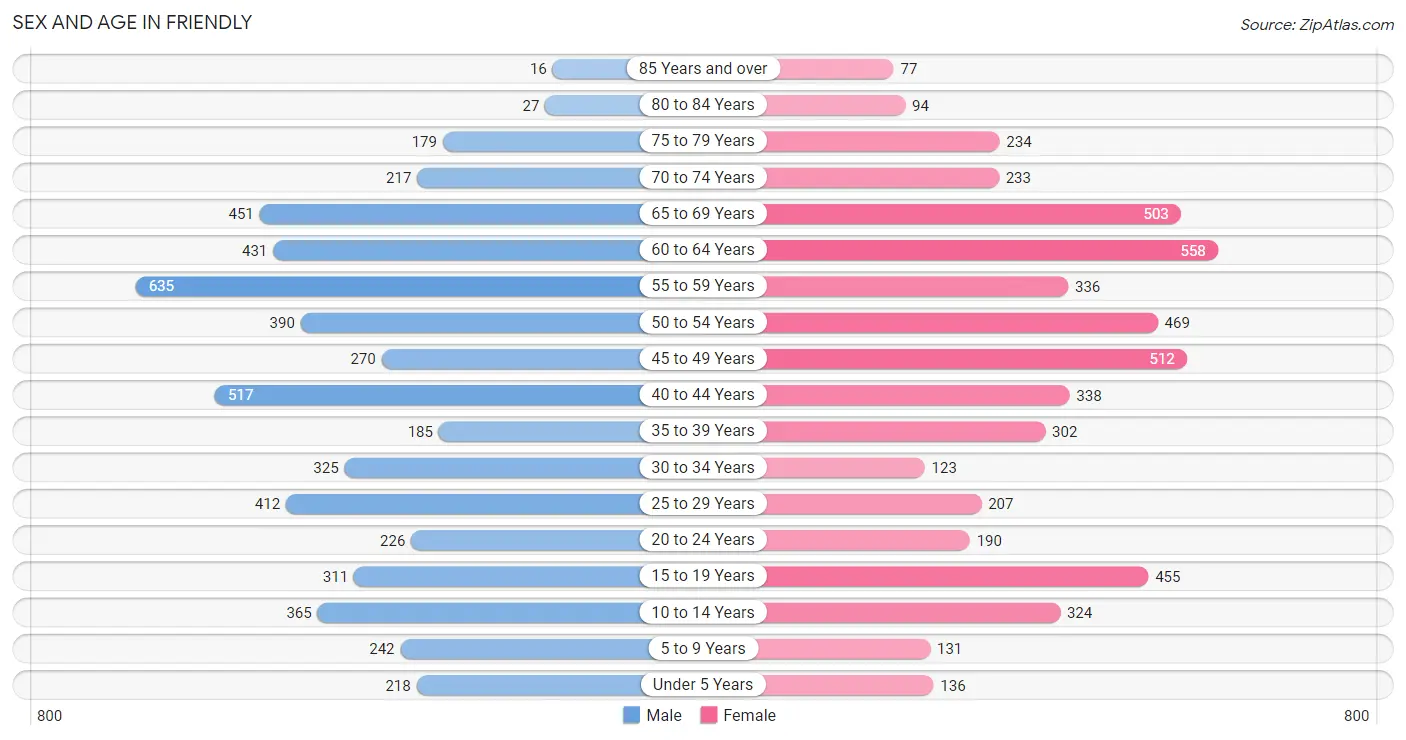
The most populous age groups in Friendly are 55 to 59 Years (635 | 11.7%) for men and 60 to 64 Years (558 | 10.7%) for women.
| Age Bracket | Male | Female |
| Under 5 Years | 218 (4.0%) | 136 (2.6%) |
| 5 to 9 Years | 242 (4.5%) | 131 (2.5%) |
| 10 to 14 Years | 365 (6.7%) | 324 (6.2%) |
| 15 to 19 Years | 311 (5.7%) | 455 (8.7%) |
| 20 to 24 Years | 226 (4.2%) | 190 (3.6%) |
| 25 to 29 Years | 412 (7.6%) | 207 (4.0%) |
| 30 to 34 Years | 325 (6.0%) | 123 (2.4%) |
| 35 to 39 Years | 185 (3.4%) | 302 (5.8%) |
| 40 to 44 Years | 517 (9.5%) | 338 (6.5%) |
| 45 to 49 Years | 270 (5.0%) | 512 (9.8%) |
| 50 to 54 Years | 390 (7.2%) | 469 (9.0%) |
| 55 to 59 Years | 635 (11.7%) | 336 (6.4%) |
| 60 to 64 Years | 431 (8.0%) | 558 (10.7%) |
| 65 to 69 Years | 451 (8.3%) | 503 (9.6%) |
| 70 to 74 Years | 217 (4.0%) | 233 (4.5%) |
| 75 to 79 Years | 179 (3.3%) | 234 (4.5%) |
| 80 to 84 Years | 27 (0.5%) | 94 (1.8%) |
| 85 Years and over | 16 (0.3%) | 77 (1.5%) |
| Total | 5,417 (100.0%) | 5,222 (100.0%) |
Families and Households in Friendly
Median Family Size in Friendly
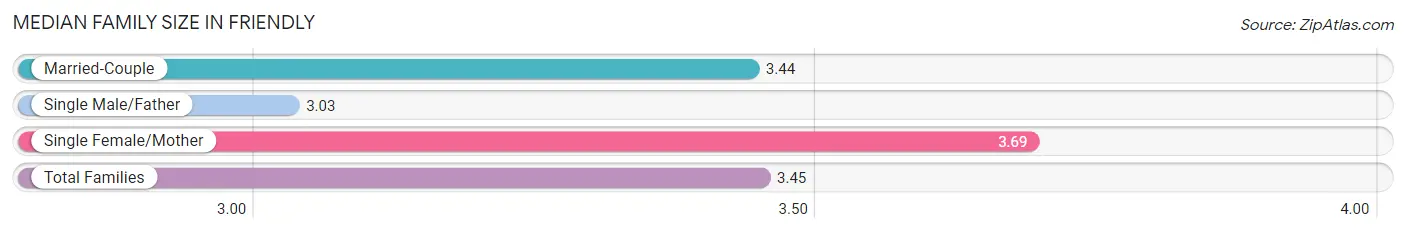
The median family size in Friendly is 3.45 persons per family, with single female/mother families (547 | 21.9%) accounting for the largest median family size of 3.69 persons per family. On the other hand, single male/father families (254 | 10.2%) represent the smallest median family size with 3.03 persons per family.
| Family Type | # Families | Family Size |
| Married-Couple | 1,697 (67.9%) | 3.44 |
| Single Male/Father | 254 (10.2%) | 3.03 |
| Single Female/Mother | 547 (21.9%) | 3.69 |
| Total Families | 2,498 (100.0%) | 3.45 |
Median Household Size in Friendly
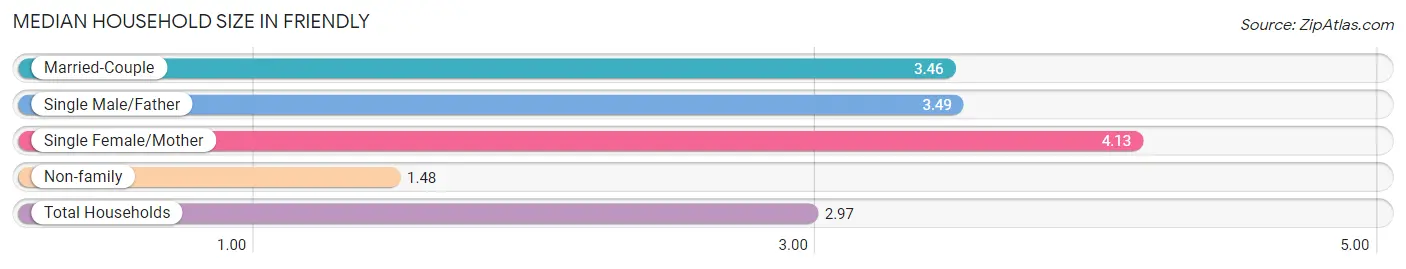
The median household size in Friendly is 2.97 persons per household, with single female/mother households (547 | 15.3%) accounting for the largest median household size of 4.13 persons per household. non-family households (1,066 | 29.9%) represent the smallest median household size with 1.48 persons per household.
| Household Type | # Households | Household Size |
| Married-Couple | 1,697 (47.6%) | 3.46 |
| Single Male/Father | 254 (7.1%) | 3.49 |
| Single Female/Mother | 547 (15.3%) | 4.13 |
| Non-family | 1,066 (29.9%) | 1.48 |
| Total Households | 3,564 (100.0%) | 2.97 |
Household Size by Marriage Status in Friendly
Out of a total of 3,564 households in Friendly, 2,498 (70.1%) are family households, while 1,066 (29.9%) are nonfamily households. The most numerous type of family households are 2-person households, comprising 1,022, and the most common type of nonfamily households are 1-person households, comprising 856.
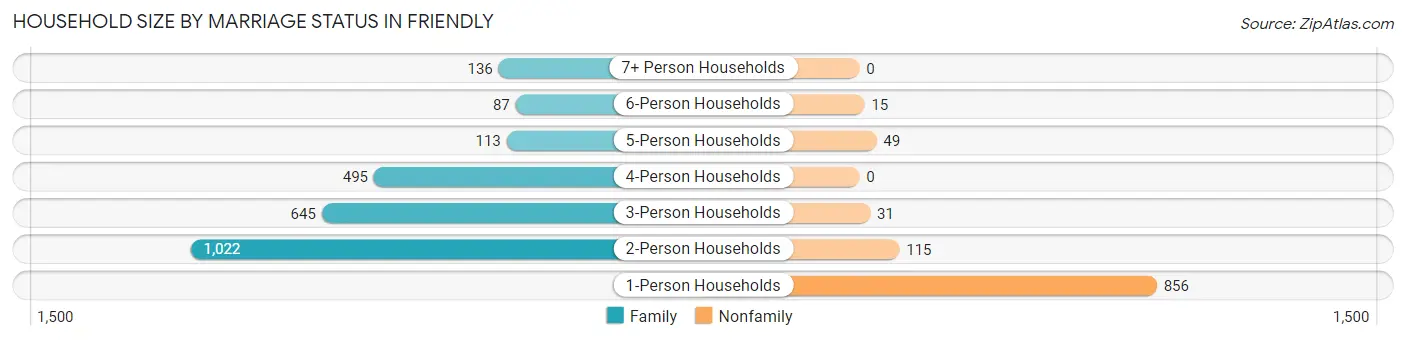
| Household Size | Family Households | Nonfamily Households |
| 1-Person Households | - | 856 (24.0%) |
| 2-Person Households | 1,022 (28.7%) | 115 (3.2%) |
| 3-Person Households | 645 (18.1%) | 31 (0.9%) |
| 4-Person Households | 495 (13.9%) | 0 (0.0%) |
| 5-Person Households | 113 (3.2%) | 49 (1.4%) |
| 6-Person Households | 87 (2.4%) | 15 (0.4%) |
| 7+ Person Households | 136 (3.8%) | 0 (0.0%) |
| Total | 2,498 (70.1%) | 1,066 (29.9%) |
Female Fertility in Friendly
Fertility by Age in Friendly
Average fertility rate in Friendly is 48.0 births per 1,000 women. Women in the age bracket of 20 to 34 years have the highest fertility rate with 165.0 births per 1,000 women. Women in the age bracket of 20 to 34 years acount for 81.1% of all women with births.
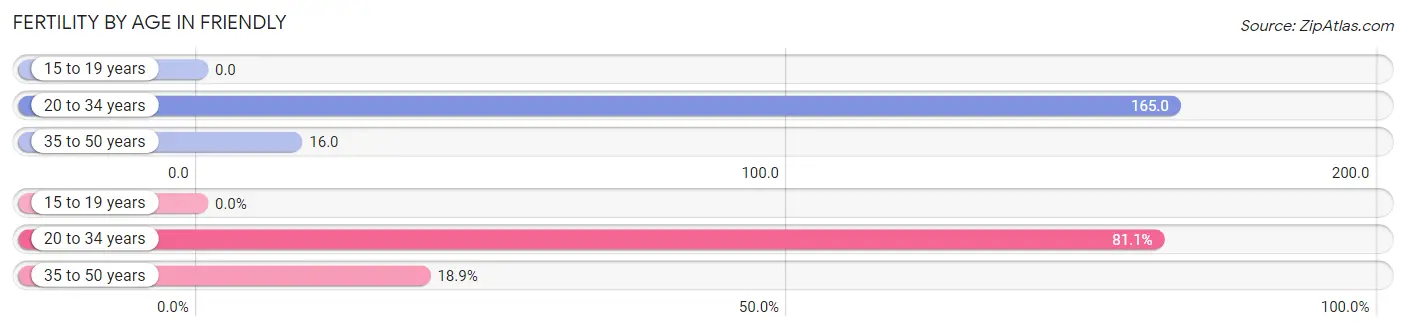
| Age Bracket | Women with Births | Births / 1,000 Women |
| 15 to 19 years | 0 (0.0%) | 0.0 |
| 20 to 34 years | 86 (81.1%) | 165.0 |
| 35 to 50 years | 20 (18.9%) | 16.0 |
| Total | 106 (100.0%) | 48.0 |
Fertility by Age by Marriage Status in Friendly
34.9% of women with births (106) in Friendly are married. The highest percentage of unmarried women with births falls into 35 to 50 years age bracket with 100.0% of them unmarried at the time of birth, while the lowest percentage of unmarried women with births belong to 20 to 34 years age bracket with 57.0% of them unmarried.
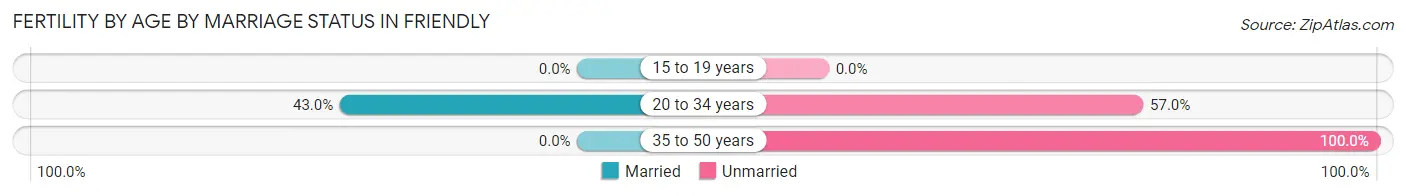
| Age Bracket | Married | Unmarried |
| 15 to 19 years | 0 (0.0%) | 0 (0.0%) |
| 20 to 34 years | 37 (43.0%) | 49 (57.0%) |
| 35 to 50 years | 0 (0.0%) | 20 (100.0%) |
| Total | 37 (34.9%) | 69 (65.1%) |
Fertility by Education in Friendly
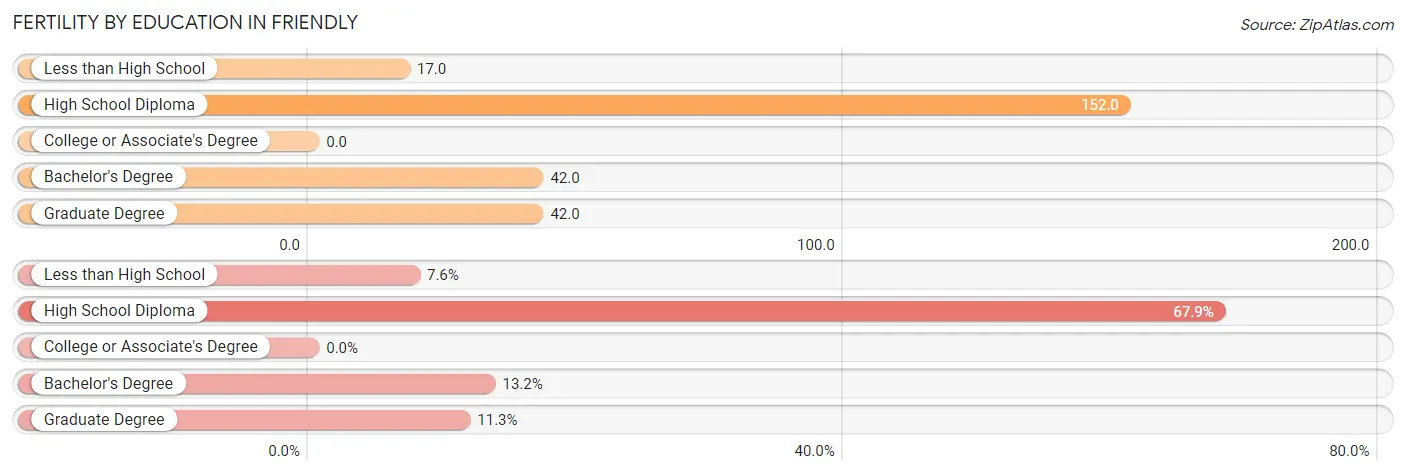
| Educational Attainment | Women with Births | Births / 1,000 Women |
| Less than High School | 8 (7.5%) | 17.0 |
| High School Diploma | 72 (67.9%) | 152.0 |
| College or Associate's Degree | 0 (0.0%) | 0.0 |
| Bachelor's Degree | 14 (13.2%) | 42.0 |
| Graduate Degree | 12 (11.3%) | 42.0 |
| Total | 106 (100.0%) | 48.0 |
Fertility by Education by Marriage Status in Friendly
65.1% of women with births in Friendly are unmarried. Women with the educational attainment of high school diploma are most likely to be married with 51.4% of them married at childbirth, while women with the educational attainment of less than high school are least likely to be married with 100.0% of them unmarried at childbirth.
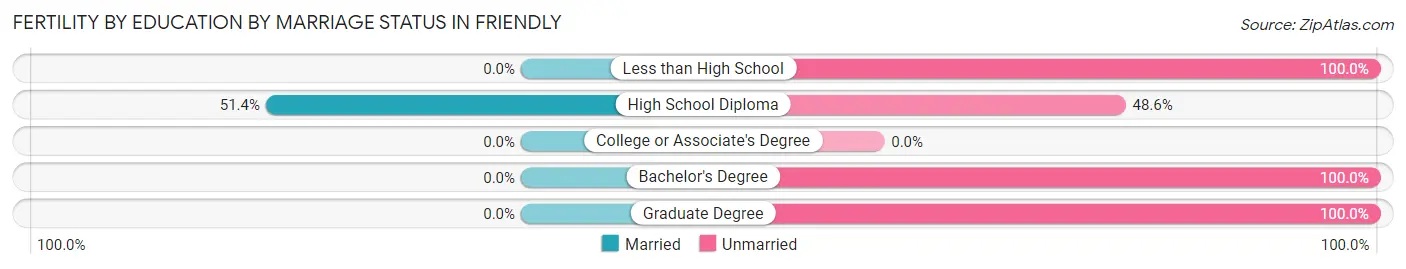
| Educational Attainment | Married | Unmarried |
| Less than High School | 0 (0.0%) | 8 (100.0%) |
| High School Diploma | 37 (51.4%) | 35 (48.6%) |
| College or Associate's Degree | 0 (0.0%) | 0 (0.0%) |
| Bachelor's Degree | 0 (0.0%) | 14 (100.0%) |
| Graduate Degree | 0 (0.0%) | 12 (100.0%) |
| Total | 37 (34.9%) | 69 (65.1%) |
Employment Characteristics in Friendly
Employment by Class of Employer in Friendly
Among the 5,353 employed individuals in Friendly, private company employees (2,990 | 55.9%), federal government employees (929 | 17.3%), and local government employees (601 | 11.2%) make up the most common classes of employment.
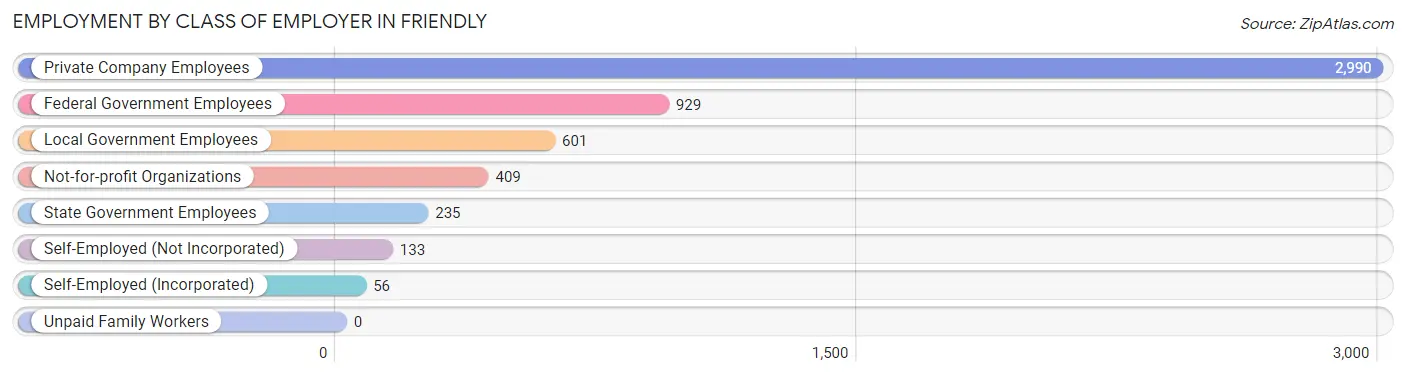
| Employer Class | # Employees | % Employees |
| Private Company Employees | 2,990 | 55.9% |
| Self-Employed (Incorporated) | 56 | 1.1% |
| Self-Employed (Not Incorporated) | 133 | 2.5% |
| Not-for-profit Organizations | 409 | 7.6% |
| Local Government Employees | 601 | 11.2% |
| State Government Employees | 235 | 4.4% |
| Federal Government Employees | 929 | 17.3% |
| Unpaid Family Workers | 0 | 0.0% |
| Total | 5,353 | 100.0% |
Employment Status by Age in Friendly
According to the labor force statistics for Friendly, out of the total population over 16 years of age (9,112), 64.8% or 5,905 individuals are in the labor force, with 6.9% or 407 of them unemployed. The age group with the highest labor force participation rate is 45 to 54 years, with 91.0% or 1,493 individuals in the labor force. Within the labor force, the 20 to 24 years age range has the highest percentage of unemployed individuals, with 15.1% or 52 of them being unemployed.
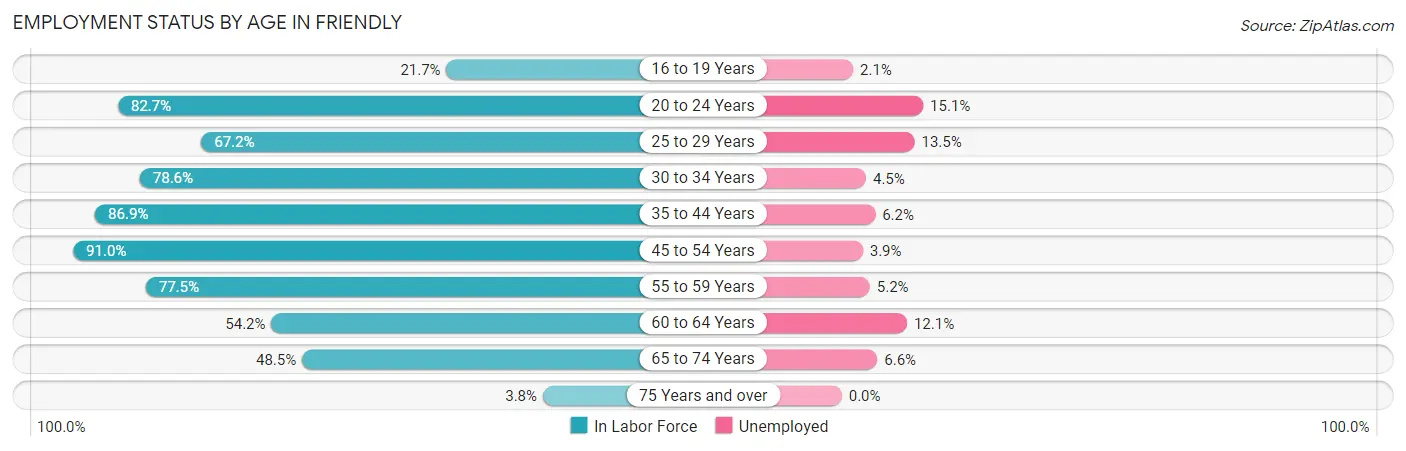
| Age Bracket | In Labor Force | Unemployed |
| 16 to 19 Years | 142 (21.7%) | 3 (2.1%) |
| 20 to 24 Years | 344 (82.7%) | 52 (15.1%) |
| 25 to 29 Years | 416 (67.2%) | 56 (13.5%) |
| 30 to 34 Years | 352 (78.6%) | 16 (4.5%) |
| 35 to 44 Years | 1,166 (86.9%) | 72 (6.2%) |
| 45 to 54 Years | 1,493 (91.0%) | 58 (3.9%) |
| 55 to 59 Years | 753 (77.5%) | 39 (5.2%) |
| 60 to 64 Years | 536 (54.2%) | 65 (12.1%) |
| 65 to 74 Years | 681 (48.5%) | 45 (6.6%) |
| 75 Years and over | 24 (3.8%) | 0 (0.0%) |
| Total | 5,905 (64.8%) | 407 (6.9%) |
Employment Status by Educational Attainment in Friendly
According to labor force statistics for Friendly, 78.5% of individuals (4,718) out of the total population between 25 and 64 years of age (6,010) are in the labor force, with 6.5% or 307 of them being unemployed. The group with the highest labor force participation rate are those with the educational attainment of bachelor's degree or higher, with 92.4% or 1,489 individuals in the labor force. Within the labor force, individuals with high school diploma education have the highest percentage of unemployment, with 15.3% or 182 of them being unemployed.
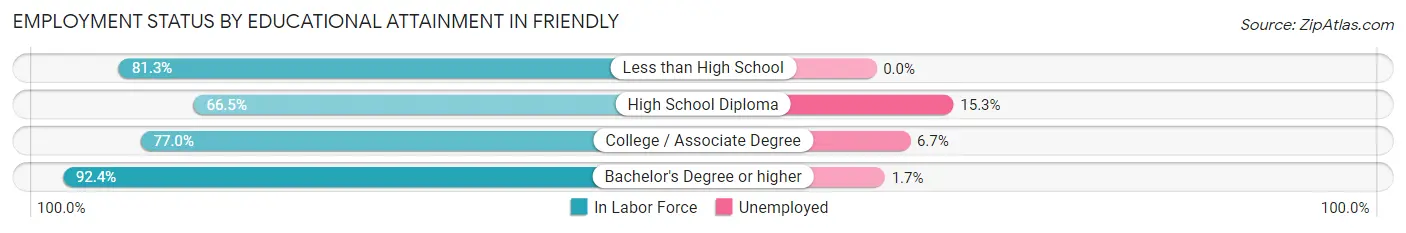
| Educational Attainment | In Labor Force | Unemployed |
| Less than High School | 565 (81.3%) | 0 (0.0%) |
| High School Diploma | 1,192 (66.5%) | 274 (15.3%) |
| College / Associate Degree | 1,472 (77.0%) | 128 (6.7%) |
| Bachelor's Degree or higher | 1,489 (92.4%) | 27 (1.7%) |
| Total | 4,718 (78.5%) | 391 (6.5%) |
Employment Occupations by Sex in Friendly
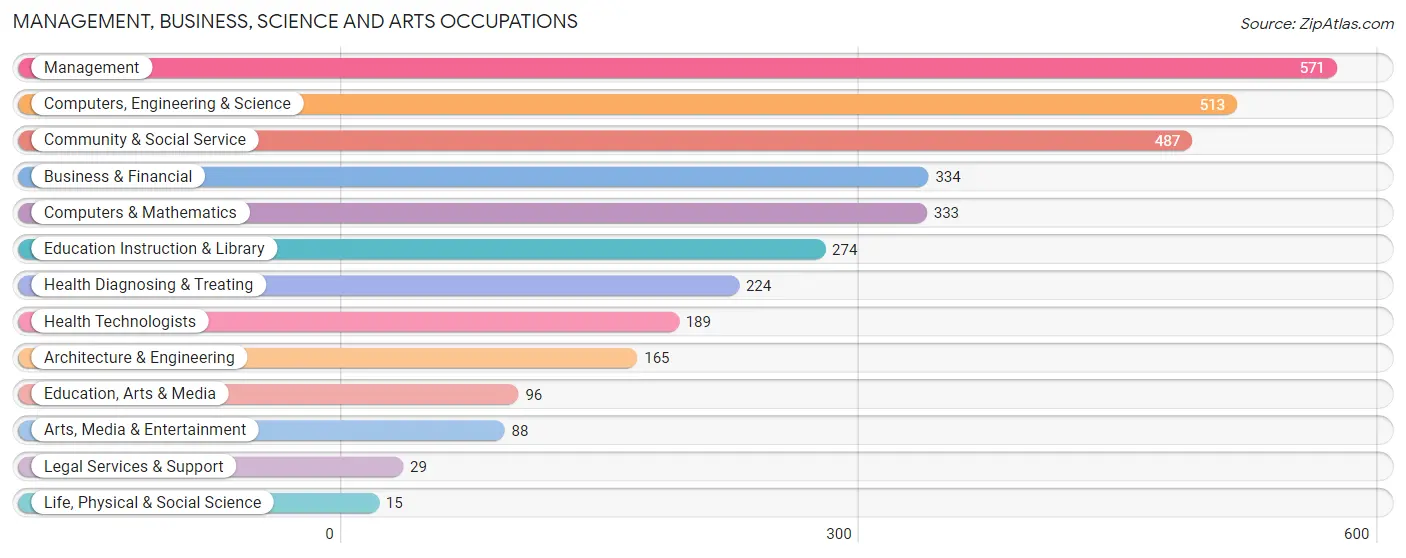
Management, Business, Science and Arts Occupations
The most common Management, Business, Science and Arts occupations in Friendly are Management (571 | 10.4%), Computers, Engineering & Science (513 | 9.4%), Community & Social Service (487 | 8.9%), Business & Financial (334 | 6.1%), and Computers & Mathematics (333 | 6.1%).
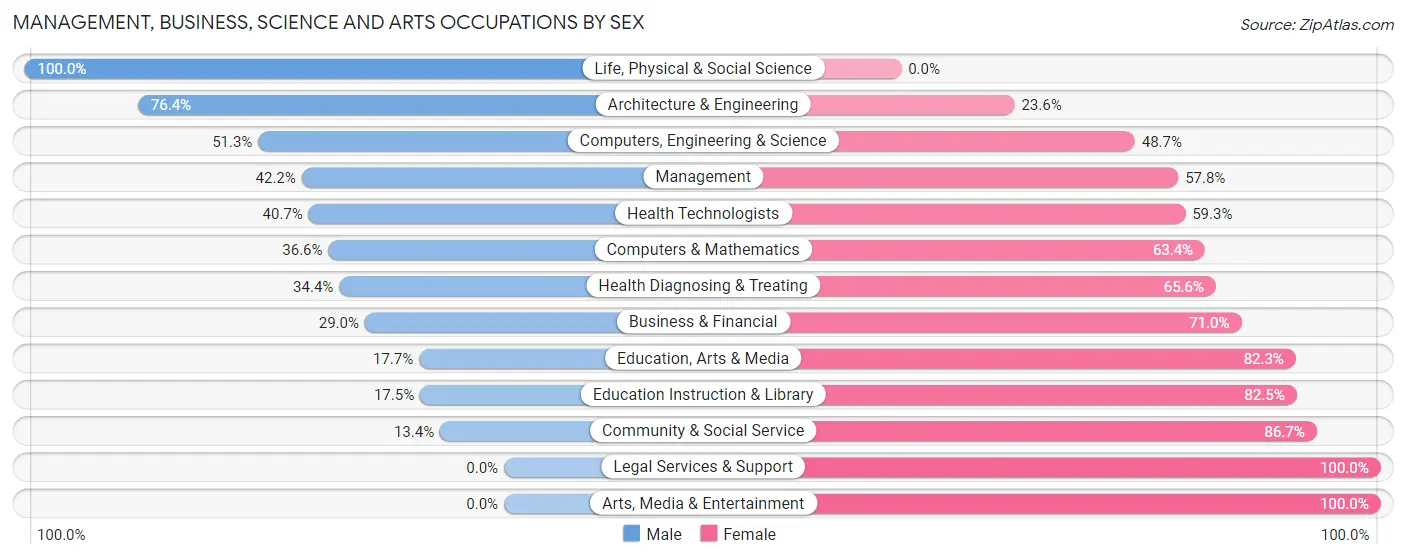
Management, Business, Science and Arts Occupations by Sex
Within the Management, Business, Science and Arts occupations in Friendly, the most male-oriented occupations are Life, Physical & Social Science (100.0%), Architecture & Engineering (76.4%), and Computers, Engineering & Science (51.3%), while the most female-oriented occupations are Legal Services & Support (100.0%), Arts, Media & Entertainment (100.0%), and Community & Social Service (86.7%).
| Occupation | Male | Female |
| Management | 241 (42.2%) | 330 (57.8%) |
| Business & Financial | 97 (29.0%) | 237 (71.0%) |
| Computers, Engineering & Science | 263 (51.3%) | 250 (48.7%) |
| Computers & Mathematics | 122 (36.6%) | 211 (63.4%) |
| Architecture & Engineering | 126 (76.4%) | 39 (23.6%) |
| Life, Physical & Social Science | 15 (100.0%) | 0 (0.0%) |
| Community & Social Service | 65 (13.4%) | 422 (86.7%) |
| Education, Arts & Media | 17 (17.7%) | 79 (82.3%) |
| Legal Services & Support | 0 (0.0%) | 29 (100.0%) |
| Education Instruction & Library | 48 (17.5%) | 226 (82.5%) |
| Arts, Media & Entertainment | 0 (0.0%) | 88 (100.0%) |
| Health Diagnosing & Treating | 77 (34.4%) | 147 (65.6%) |
| Health Technologists | 77 (40.7%) | 112 (59.3%) |
| Total (Category) | 743 (34.9%) | 1,386 (65.1%) |
| Total (Overall) | 2,729 (49.8%) | 2,754 (50.2%) |
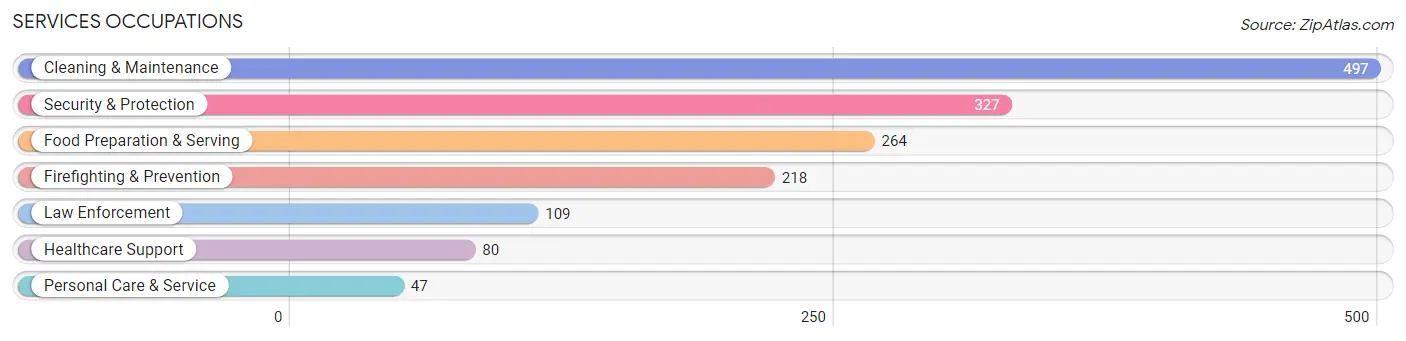
Services Occupations
The most common Services occupations in Friendly are Cleaning & Maintenance (497 | 9.1%), Security & Protection (327 | 6.0%), Food Preparation & Serving (264 | 4.8%), Firefighting & Prevention (218 | 4.0%), and Law Enforcement (109 | 2.0%).
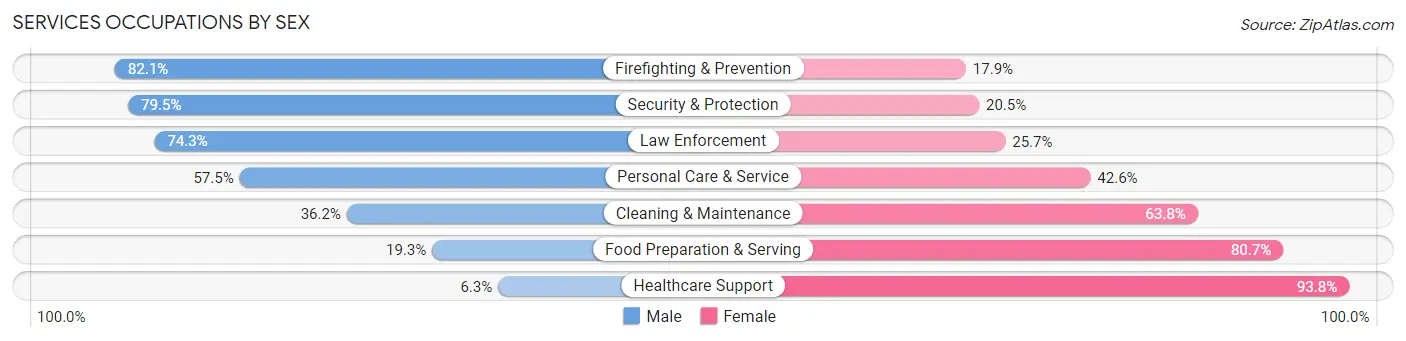
Services Occupations by Sex
Within the Services occupations in Friendly, the most male-oriented occupations are Firefighting & Prevention (82.1%), Security & Protection (79.5%), and Law Enforcement (74.3%), while the most female-oriented occupations are Healthcare Support (93.8%), Food Preparation & Serving (80.7%), and Cleaning & Maintenance (63.8%).
| Occupation | Male | Female |
| Healthcare Support | 5 (6.2%) | 75 (93.8%) |
| Security & Protection | 260 (79.5%) | 67 (20.5%) |
| Firefighting & Prevention | 179 (82.1%) | 39 (17.9%) |
| Law Enforcement | 81 (74.3%) | 28 (25.7%) |
| Food Preparation & Serving | 51 (19.3%) | 213 (80.7%) |
| Cleaning & Maintenance | 180 (36.2%) | 317 (63.8%) |
| Personal Care & Service | 27 (57.5%) | 20 (42.5%) |
| Total (Category) | 523 (43.0%) | 692 (57.0%) |
| Total (Overall) | 2,729 (49.8%) | 2,754 (50.2%) |
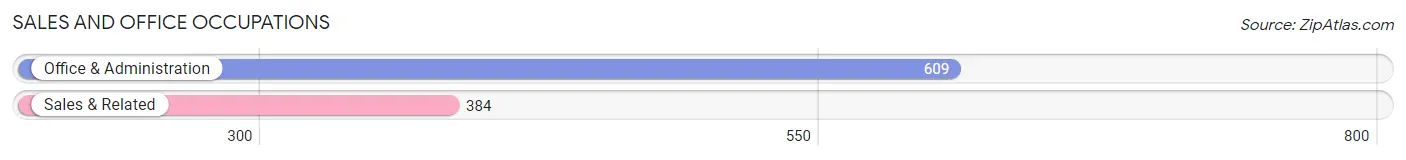
Sales and Office Occupations
The most common Sales and Office occupations in Friendly are Office & Administration (609 | 11.1%), and Sales & Related (384 | 7.0%).
Sales and Office Occupations by Sex
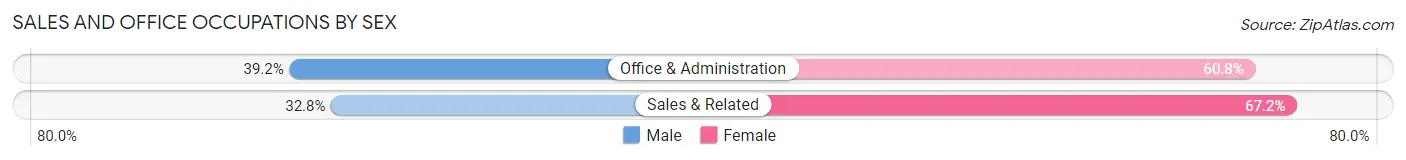
| Occupation | Male | Female |
| Sales & Related | 126 (32.8%) | 258 (67.2%) |
| Office & Administration | 239 (39.2%) | 370 (60.8%) |
| Total (Category) | 365 (36.8%) | 628 (63.2%) |
| Total (Overall) | 2,729 (49.8%) | 2,754 (50.2%) |
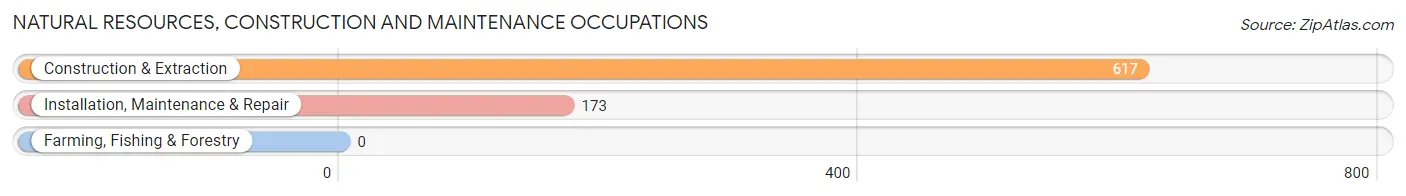
Natural Resources, Construction and Maintenance Occupations
The most common Natural Resources, Construction and Maintenance occupations in Friendly are Construction & Extraction (617 | 11.3%), and Installation, Maintenance & Repair (173 | 3.2%).
Natural Resources, Construction and Maintenance Occupations by Sex
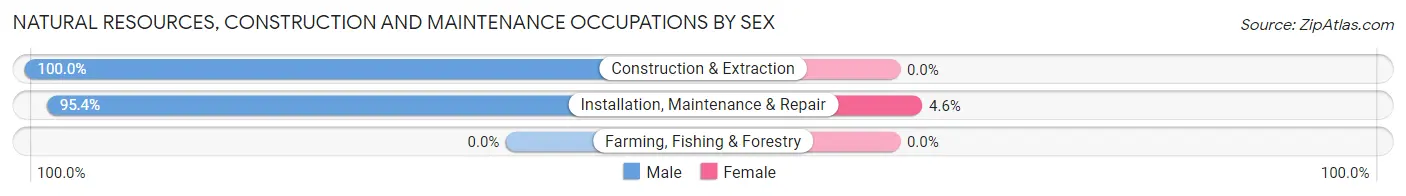
| Occupation | Male | Female |
| Farming, Fishing & Forestry | 0 (0.0%) | 0 (0.0%) |
| Construction & Extraction | 617 (100.0%) | 0 (0.0%) |
| Installation, Maintenance & Repair | 165 (95.4%) | 8 (4.6%) |
| Total (Category) | 782 (99.0%) | 8 (1.0%) |
| Total (Overall) | 2,729 (49.8%) | 2,754 (50.2%) |
Production, Transportation and Moving Occupations
The most common Production, Transportation and Moving occupations in Friendly are Material Moving (149 | 2.7%), Transportation (134 | 2.4%), and Production (73 | 1.3%).
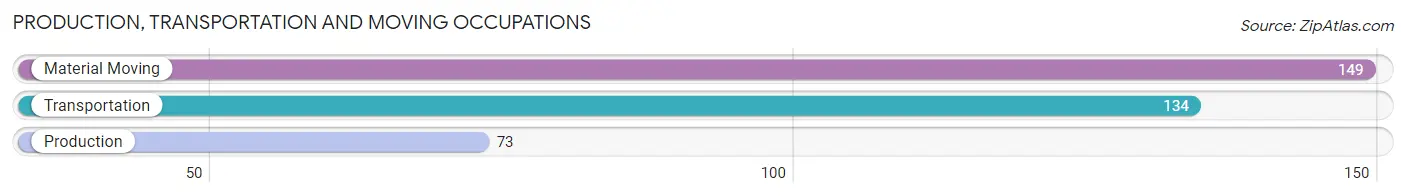
Production, Transportation and Moving Occupations by Sex

| Occupation | Male | Female |
| Production | 71 (97.3%) | 2 (2.7%) |
| Transportation | 109 (81.3%) | 25 (18.7%) |
| Material Moving | 136 (91.3%) | 13 (8.7%) |
| Total (Category) | 316 (88.8%) | 40 (11.2%) |
| Total (Overall) | 2,729 (49.8%) | 2,754 (50.2%) |
Employment Industries by Sex in Friendly
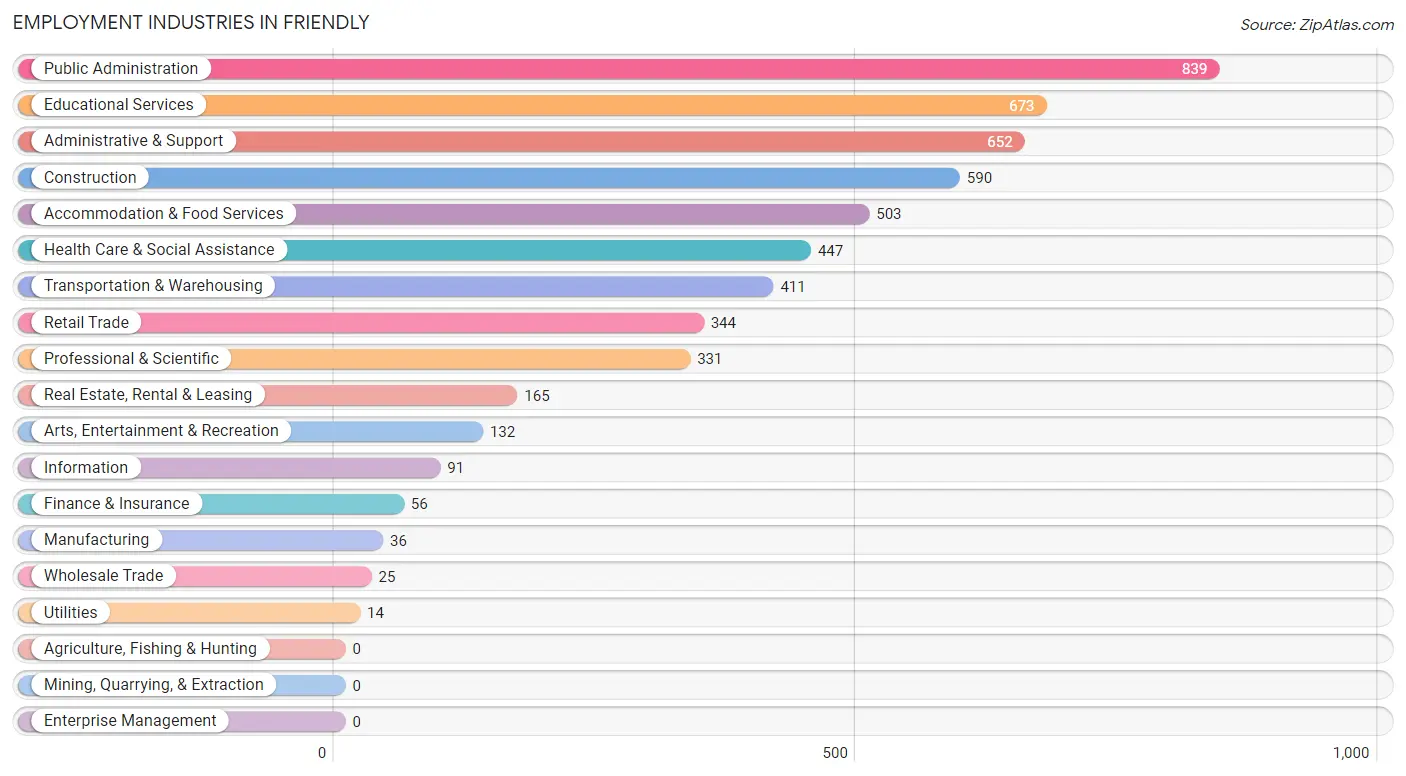
Employment Industries in Friendly
The major employment industries in Friendly include Public Administration (839 | 15.3%), Educational Services (673 | 12.3%), Administrative & Support (652 | 11.9%), Construction (590 | 10.8%), and Accommodation & Food Services (503 | 9.2%).
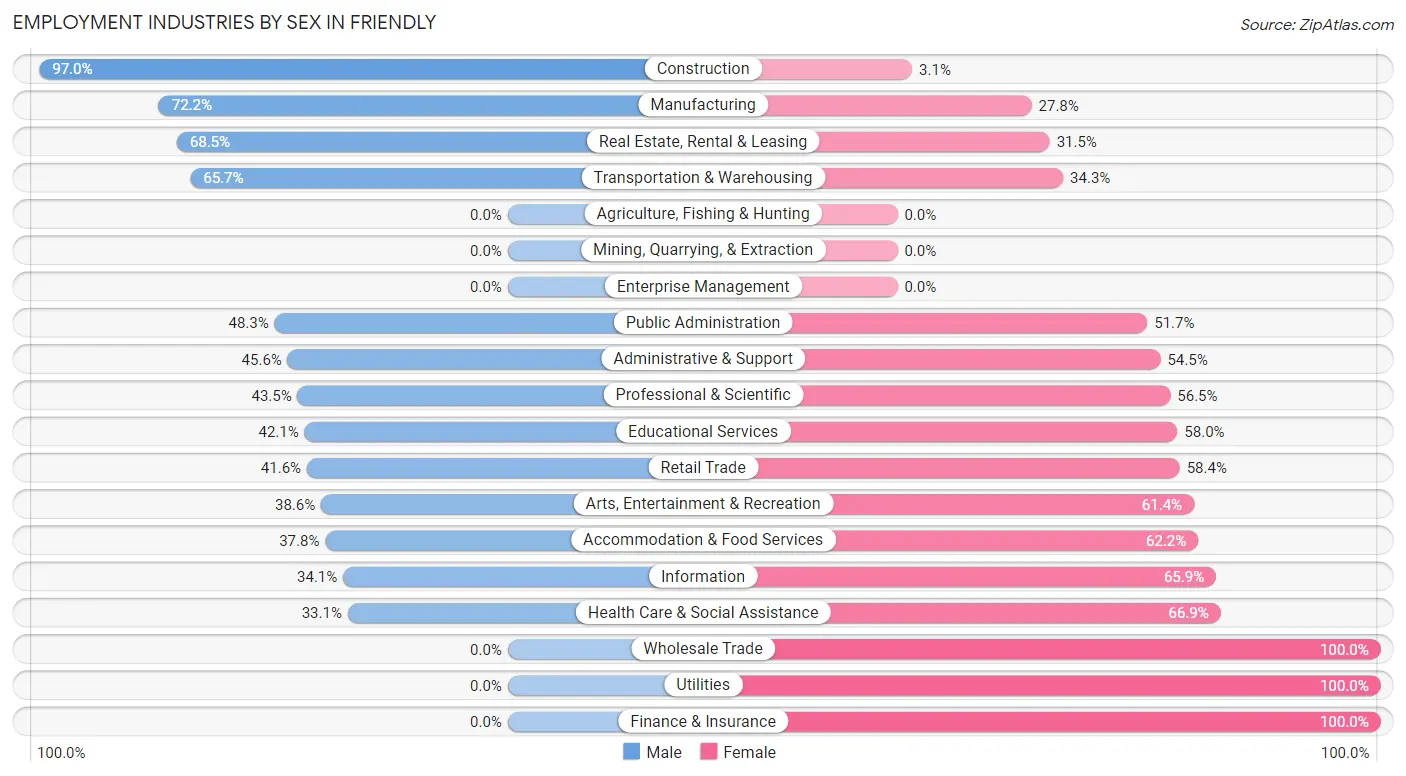
Employment Industries by Sex in Friendly
The Friendly industries that see more men than women are Construction (97.0%), Manufacturing (72.2%), and Real Estate, Rental & Leasing (68.5%), whereas the industries that tend to have a higher number of women are Wholesale Trade (100.0%), Utilities (100.0%), and Finance & Insurance (100.0%).
| Industry | Male | Female |
| Agriculture, Fishing & Hunting | 0 (0.0%) | 0 (0.0%) |
| Mining, Quarrying, & Extraction | 0 (0.0%) | 0 (0.0%) |
| Construction | 572 (97.0%) | 18 (3.0%) |
| Manufacturing | 26 (72.2%) | 10 (27.8%) |
| Wholesale Trade | 0 (0.0%) | 25 (100.0%) |
| Retail Trade | 143 (41.6%) | 201 (58.4%) |
| Transportation & Warehousing | 270 (65.7%) | 141 (34.3%) |
| Utilities | 0 (0.0%) | 14 (100.0%) |
| Information | 31 (34.1%) | 60 (65.9%) |
| Finance & Insurance | 0 (0.0%) | 56 (100.0%) |
| Real Estate, Rental & Leasing | 113 (68.5%) | 52 (31.5%) |
| Professional & Scientific | 144 (43.5%) | 187 (56.5%) |
| Enterprise Management | 0 (0.0%) | 0 (0.0%) |
| Administrative & Support | 297 (45.6%) | 355 (54.4%) |
| Educational Services | 283 (42.0%) | 390 (58.0%) |
| Health Care & Social Assistance | 148 (33.1%) | 299 (66.9%) |
| Arts, Entertainment & Recreation | 51 (38.6%) | 81 (61.4%) |
| Accommodation & Food Services | 190 (37.8%) | 313 (62.2%) |
| Public Administration | 405 (48.3%) | 434 (51.7%) |
| Total | 2,729 (49.8%) | 2,754 (50.2%) |
Education in Friendly
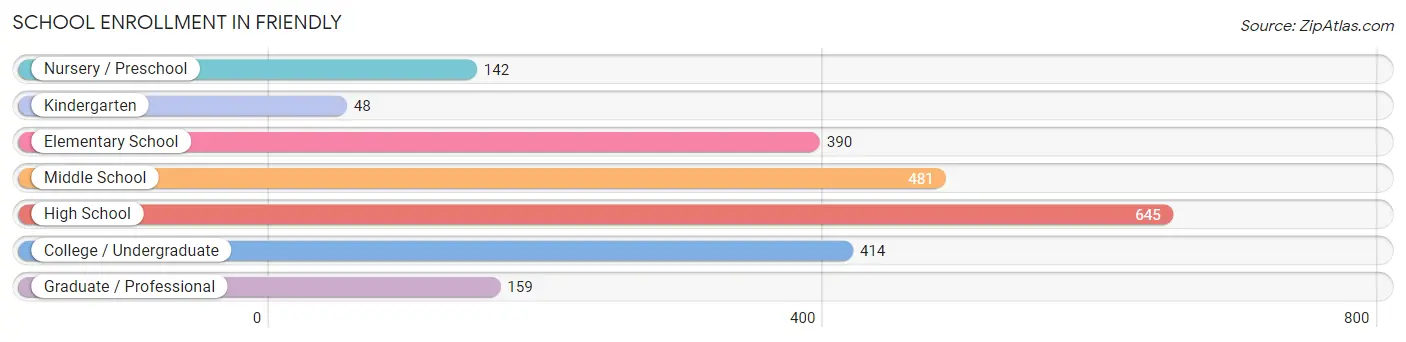
School Enrollment in Friendly
The most common levels of schooling among the 2,279 students in Friendly are high school (645 | 28.3%), middle school (481 | 21.1%), and college / undergraduate (414 | 18.2%).
| School Level | # Students | % Students |
| Nursery / Preschool | 142 | 6.2% |
| Kindergarten | 48 | 2.1% |
| Elementary School | 390 | 17.1% |
| Middle School | 481 | 21.1% |
| High School | 645 | 28.3% |
| College / Undergraduate | 414 | 18.2% |
| Graduate / Professional | 159 | 7.0% |
| Total | 2,279 | 100.0% |
School Enrollment by Age by Funding Source in Friendly
Out of a total of 2,279 students who are enrolled in schools in Friendly, 522 (22.9%) attend a private institution, while the remaining 1,757 (77.1%) are enrolled in public schools. The age group of 25 to 34 year olds has the highest likelihood of being enrolled in private schools, with 46 (59.0% in the age bracket) enrolled. Conversely, the age group of 10 to 14 year olds has the lowest likelihood of being enrolled in a private school, with 573 (92.0% in the age bracket) attending a public institution.
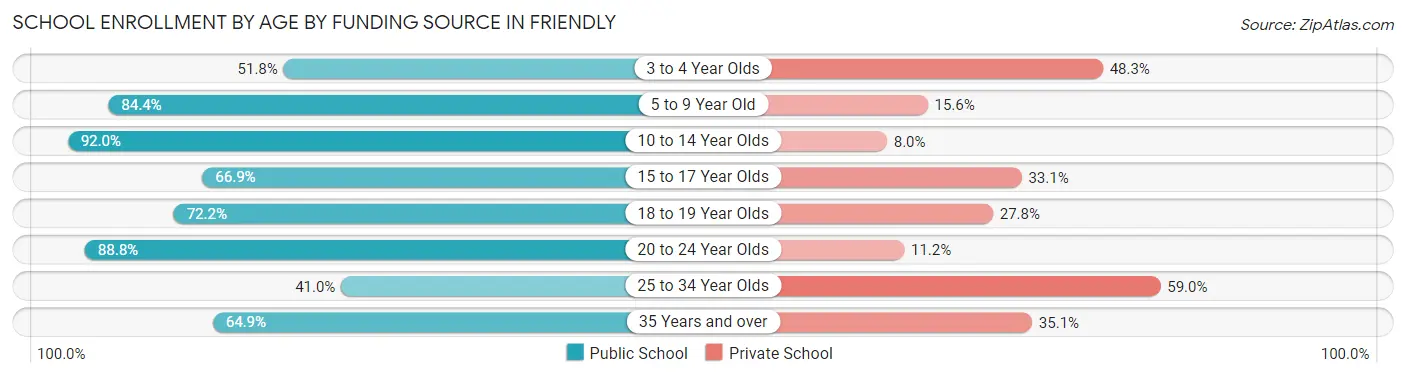
| Age Bracket | Public School | Private School |
| 3 to 4 Year Olds | 59 (51.7%) | 55 (48.2%) |
| 5 to 9 Year Old | 308 (84.4%) | 57 (15.6%) |
| 10 to 14 Year Olds | 573 (92.0%) | 50 (8.0%) |
| 15 to 17 Year Olds | 319 (66.9%) | 158 (33.1%) |
| 18 to 19 Year Olds | 195 (72.2%) | 75 (27.8%) |
| 20 to 24 Year Olds | 158 (88.8%) | 20 (11.2%) |
| 25 to 34 Year Olds | 32 (41.0%) | 46 (59.0%) |
| 35 Years and over | 113 (64.9%) | 61 (35.1%) |
| Total | 1,757 (77.1%) | 522 (22.9%) |
Educational Attainment by Field of Study in Friendly
Business (601 | 25.2%), arts & humanities (311 | 13.0%), science & technology (255 | 10.7%), psychology (218 | 9.1%), and education (207 | 8.7%) are the most common fields of study among 2,386 individuals in Friendly who have obtained a bachelor's degree or higher.
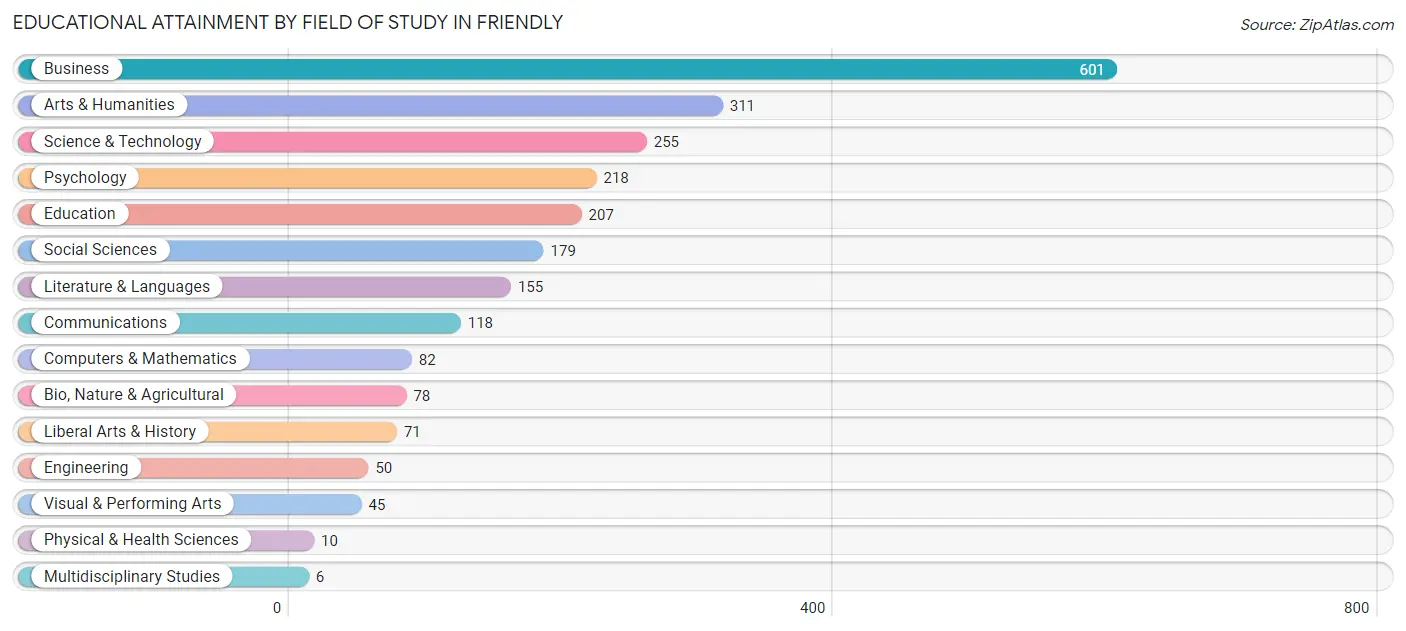
| Field of Study | # Graduates | % Graduates |
| Computers & Mathematics | 82 | 3.4% |
| Bio, Nature & Agricultural | 78 | 3.3% |
| Physical & Health Sciences | 10 | 0.4% |
| Psychology | 218 | 9.1% |
| Social Sciences | 179 | 7.5% |
| Engineering | 50 | 2.1% |
| Multidisciplinary Studies | 6 | 0.3% |
| Science & Technology | 255 | 10.7% |
| Business | 601 | 25.2% |
| Education | 207 | 8.7% |
| Literature & Languages | 155 | 6.5% |
| Liberal Arts & History | 71 | 3.0% |
| Visual & Performing Arts | 45 | 1.9% |
| Communications | 118 | 5.0% |
| Arts & Humanities | 311 | 13.0% |
| Total | 2,386 | 100.0% |
Transportation & Commute in Friendly
Vehicle Availability by Sex in Friendly
The most prevalent vehicle ownership categories in Friendly are males with 2 vehicles (853, accounting for 31.7%) and females with 2 vehicles (742, making up 32.0%).
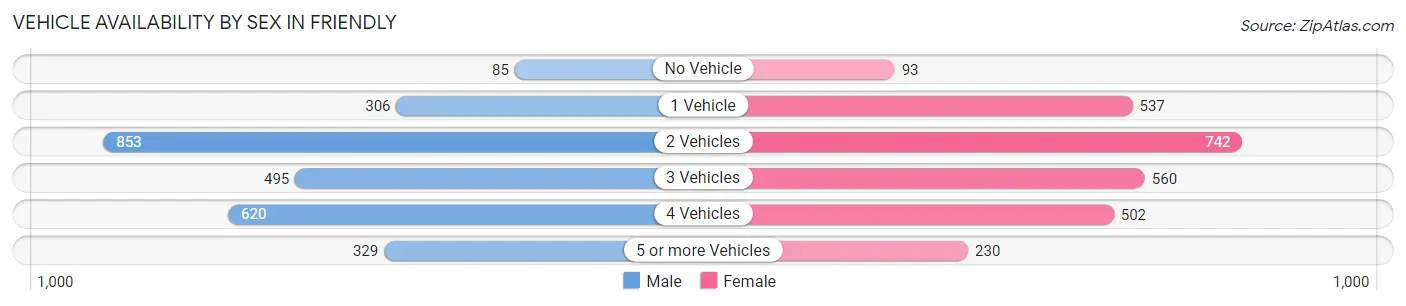
| Vehicles Available | Male | Female |
| No Vehicle | 85 (3.2%) | 93 (3.5%) |
| 1 Vehicle | 306 (11.4%) | 537 (20.2%) |
| 2 Vehicles | 853 (31.7%) | 742 (27.9%) |
| 3 Vehicles | 495 (18.4%) | 560 (21.0%) |
| 4 Vehicles | 620 (23.1%) | 502 (18.8%) |
| 5 or more Vehicles | 329 (12.2%) | 230 (8.6%) |
| Total | 2,688 (100.0%) | 2,664 (100.0%) |
Commute Time in Friendly
The most frequently occuring commute durations in Friendly are 45 to 59 minutes (773 commuters, 18.1%), 60 to 89 minutes (680 commuters, 15.9%), and 30 to 34 minutes (634 commuters, 14.8%).
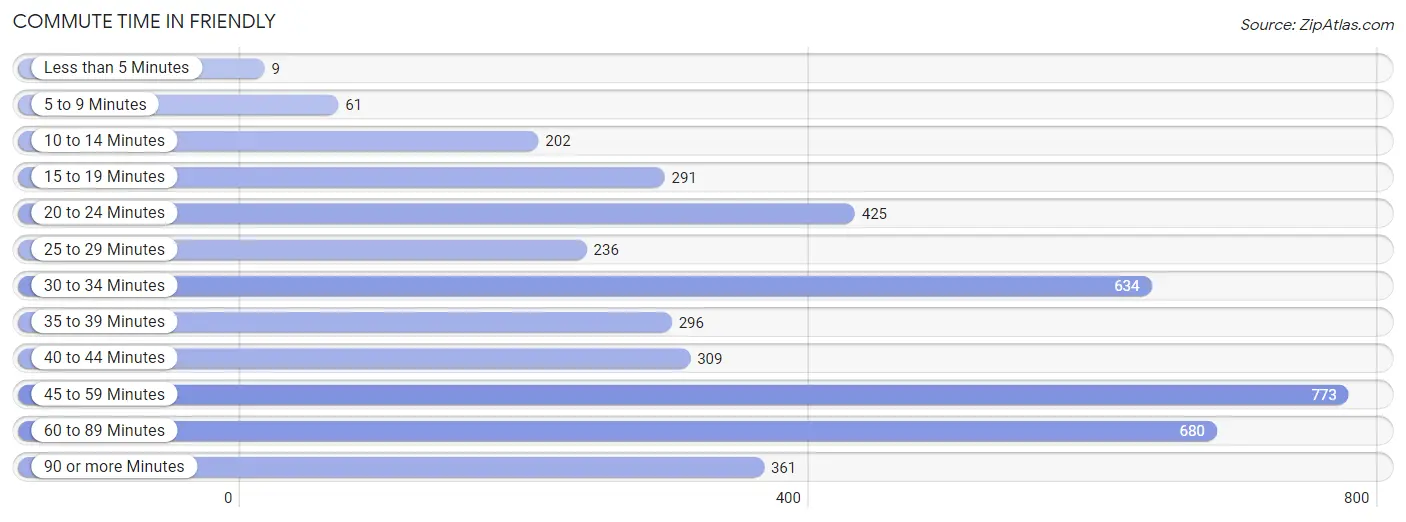
| Commute Time | # Commuters | % Commuters |
| Less than 5 Minutes | 9 | 0.2% |
| 5 to 9 Minutes | 61 | 1.4% |
| 10 to 14 Minutes | 202 | 4.7% |
| 15 to 19 Minutes | 291 | 6.8% |
| 20 to 24 Minutes | 425 | 9.9% |
| 25 to 29 Minutes | 236 | 5.5% |
| 30 to 34 Minutes | 634 | 14.8% |
| 35 to 39 Minutes | 296 | 6.9% |
| 40 to 44 Minutes | 309 | 7.2% |
| 45 to 59 Minutes | 773 | 18.1% |
| 60 to 89 Minutes | 680 | 15.9% |
| 90 or more Minutes | 361 | 8.4% |
Commute Time by Sex in Friendly
The most common commute times in Friendly are 45 to 59 minutes (404 commuters, 17.4%) for males and 45 to 59 minutes (369 commuters, 18.9%) for females.
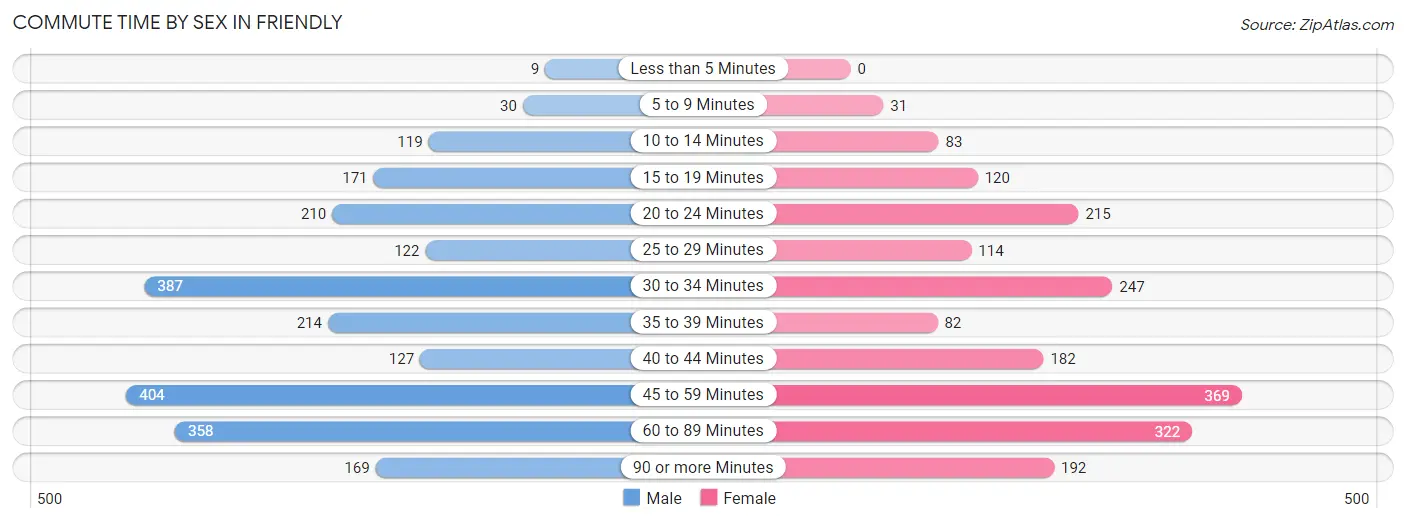
| Commute Time | Male | Female |
| Less than 5 Minutes | 9 (0.4%) | 0 (0.0%) |
| 5 to 9 Minutes | 30 (1.3%) | 31 (1.6%) |
| 10 to 14 Minutes | 119 (5.1%) | 83 (4.2%) |
| 15 to 19 Minutes | 171 (7.4%) | 120 (6.1%) |
| 20 to 24 Minutes | 210 (9.0%) | 215 (11.0%) |
| 25 to 29 Minutes | 122 (5.3%) | 114 (5.8%) |
| 30 to 34 Minutes | 387 (16.7%) | 247 (12.6%) |
| 35 to 39 Minutes | 214 (9.2%) | 82 (4.2%) |
| 40 to 44 Minutes | 127 (5.5%) | 182 (9.3%) |
| 45 to 59 Minutes | 404 (17.4%) | 369 (18.9%) |
| 60 to 89 Minutes | 358 (15.4%) | 322 (16.5%) |
| 90 or more Minutes | 169 (7.3%) | 192 (9.8%) |
Time of Departure to Work by Sex in Friendly
The most frequent times of departure to work in Friendly are 5:00 AM to 5:29 AM (315, 13.6%) for males and 7:00 AM to 7:29 AM (472, 24.1%) for females.
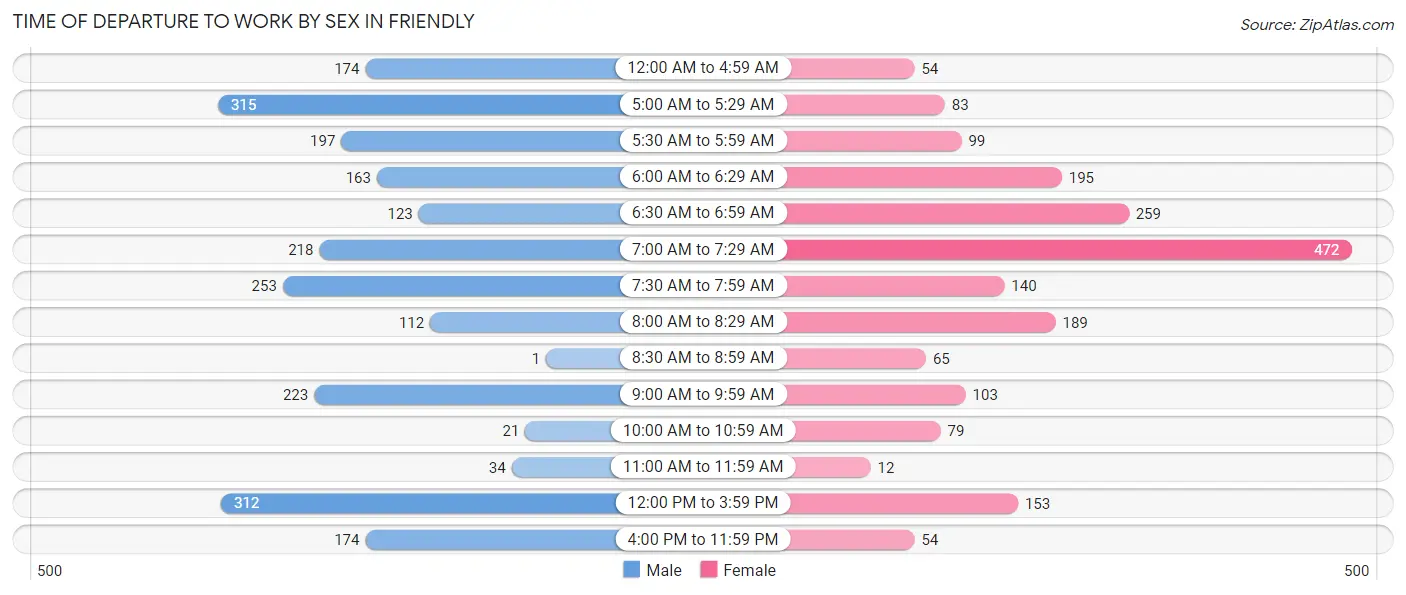
| Time of Departure | Male | Female |
| 12:00 AM to 4:59 AM | 174 (7.5%) | 54 (2.8%) |
| 5:00 AM to 5:29 AM | 315 (13.6%) | 83 (4.2%) |
| 5:30 AM to 5:59 AM | 197 (8.5%) | 99 (5.1%) |
| 6:00 AM to 6:29 AM | 163 (7.0%) | 195 (10.0%) |
| 6:30 AM to 6:59 AM | 123 (5.3%) | 259 (13.2%) |
| 7:00 AM to 7:29 AM | 218 (9.4%) | 472 (24.1%) |
| 7:30 AM to 7:59 AM | 253 (10.9%) | 140 (7.1%) |
| 8:00 AM to 8:29 AM | 112 (4.8%) | 189 (9.7%) |
| 8:30 AM to 8:59 AM | 1 (0.0%) | 65 (3.3%) |
| 9:00 AM to 9:59 AM | 223 (9.6%) | 103 (5.3%) |
| 10:00 AM to 10:59 AM | 21 (0.9%) | 79 (4.0%) |
| 11:00 AM to 11:59 AM | 34 (1.5%) | 12 (0.6%) |
| 12:00 PM to 3:59 PM | 312 (13.5%) | 153 (7.8%) |
| 4:00 PM to 11:59 PM | 174 (7.5%) | 54 (2.8%) |
| Total | 2,320 (100.0%) | 1,957 (100.0%) |
Housing Occupancy in Friendly
Occupancy by Ownership in Friendly
Of the total 3,564 dwellings in Friendly, owner-occupied units account for 3,252 (91.2%), while renter-occupied units make up 312 (8.7%).
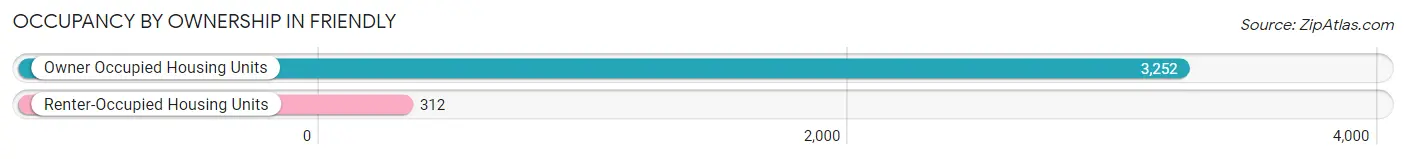
| Occupancy | # Housing Units | % Housing Units |
| Owner Occupied Housing Units | 3,252 | 91.2% |
| Renter-Occupied Housing Units | 312 | 8.7% |
| Total Occupied Housing Units | 3,564 | 100.0% |
Occupancy by Household Size in Friendly
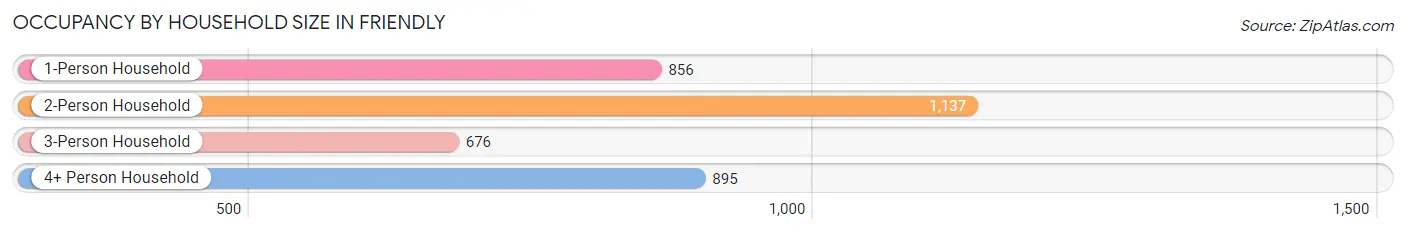
| Household Size | # Housing Units | % Housing Units |
| 1-Person Household | 856 | 24.0% |
| 2-Person Household | 1,137 | 31.9% |
| 3-Person Household | 676 | 19.0% |
| 4+ Person Household | 895 | 25.1% |
| Total Housing Units | 3,564 | 100.0% |
Occupancy by Ownership by Household Size in Friendly
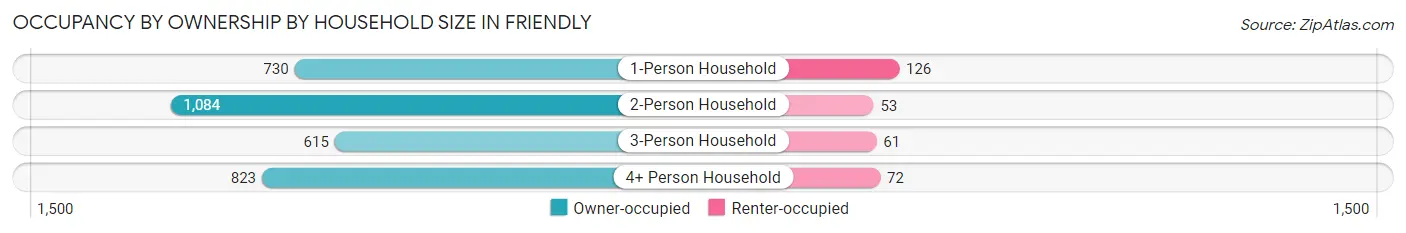
| Household Size | Owner-occupied | Renter-occupied |
| 1-Person Household | 730 (85.3%) | 126 (14.7%) |
| 2-Person Household | 1,084 (95.3%) | 53 (4.7%) |
| 3-Person Household | 615 (91.0%) | 61 (9.0%) |
| 4+ Person Household | 823 (92.0%) | 72 (8.0%) |
| Total Housing Units | 3,252 (91.2%) | 312 (8.7%) |
Occupancy by Educational Attainment in Friendly
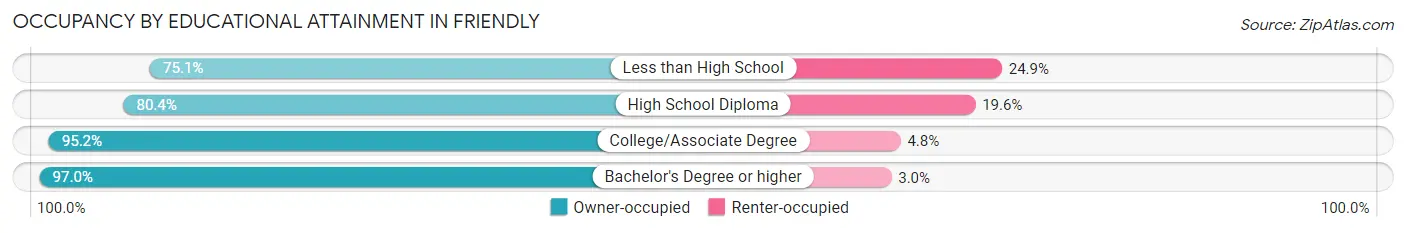
| Household Size | Owner-occupied | Renter-occupied |
| Less than High School | 193 (75.1%) | 64 (24.9%) |
| High School Diploma | 610 (80.4%) | 149 (19.6%) |
| College/Associate Degree | 1,184 (95.2%) | 60 (4.8%) |
| Bachelor's Degree or higher | 1,265 (97.0%) | 39 (3.0%) |
Occupancy by Age of Householder in Friendly
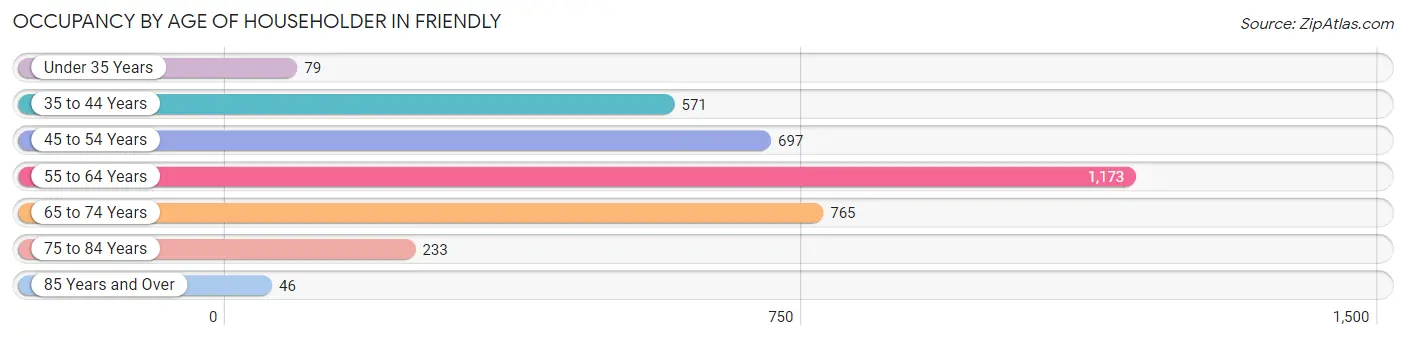
| Age Bracket | # Households | % Households |
| Under 35 Years | 79 | 2.2% |
| 35 to 44 Years | 571 | 16.0% |
| 45 to 54 Years | 697 | 19.6% |
| 55 to 64 Years | 1,173 | 32.9% |
| 65 to 74 Years | 765 | 21.5% |
| 75 to 84 Years | 233 | 6.5% |
| 85 Years and Over | 46 | 1.3% |
| Total | 3,564 | 100.0% |
Housing Finances in Friendly
Median Income by Occupancy in Friendly
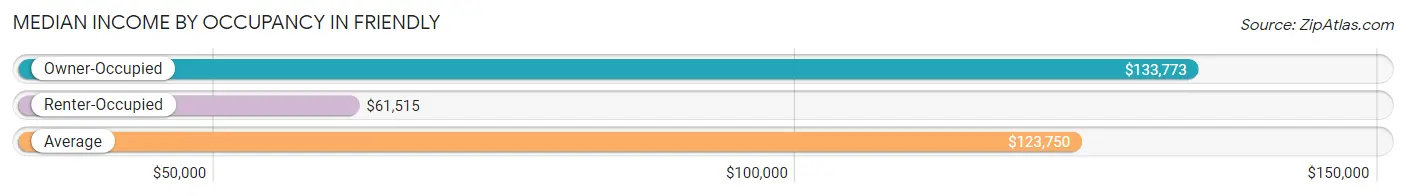
| Occupancy Type | # Households | Median Income |
| Owner-Occupied | 3,252 (91.2%) | $133,773 |
| Renter-Occupied | 312 (8.7%) | $61,515 |
| Average | 3,564 (100.0%) | $123,750 |
Occupancy by Householder Income Bracket in Friendly
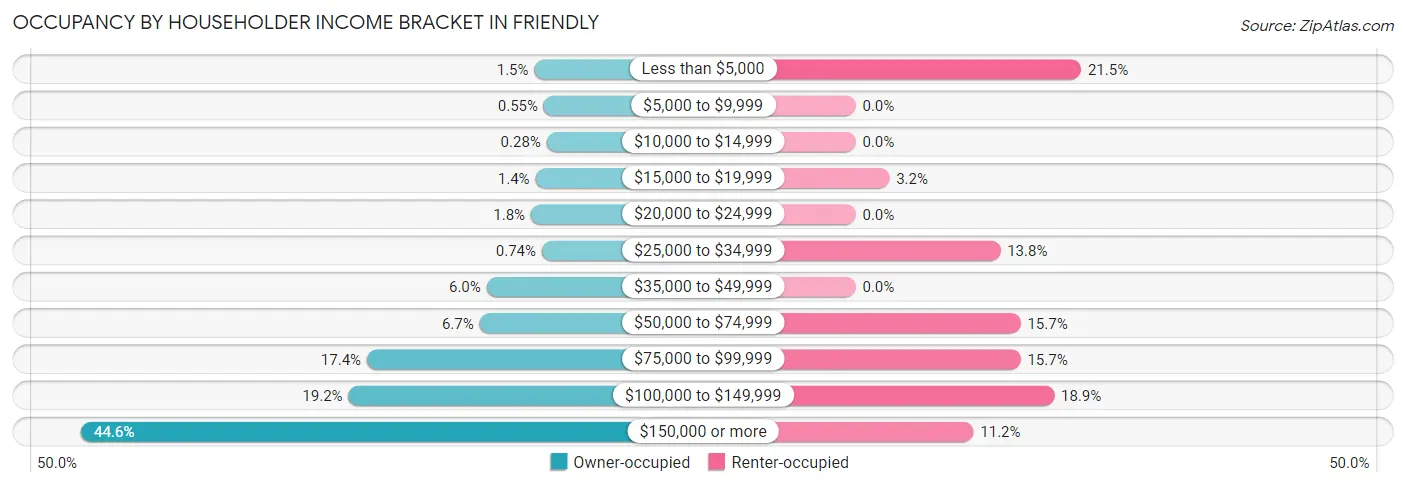
| Income Bracket | Owner-occupied | Renter-occupied |
| Less than $5,000 | 47 (1.5%) | 67 (21.5%) |
| $5,000 to $9,999 | 18 (0.5%) | 0 (0.0%) |
| $10,000 to $14,999 | 9 (0.3%) | 0 (0.0%) |
| $15,000 to $19,999 | 44 (1.3%) | 10 (3.2%) |
| $20,000 to $24,999 | 58 (1.8%) | 0 (0.0%) |
| $25,000 to $34,999 | 24 (0.7%) | 43 (13.8%) |
| $35,000 to $49,999 | 195 (6.0%) | 0 (0.0%) |
| $50,000 to $74,999 | 217 (6.7%) | 49 (15.7%) |
| $75,000 to $99,999 | 566 (17.4%) | 49 (15.7%) |
| $100,000 to $149,999 | 623 (19.2%) | 59 (18.9%) |
| $150,000 or more | 1,451 (44.6%) | 35 (11.2%) |
| Total | 3,252 (100.0%) | 312 (100.0%) |
Monthly Housing Cost Tiers in Friendly
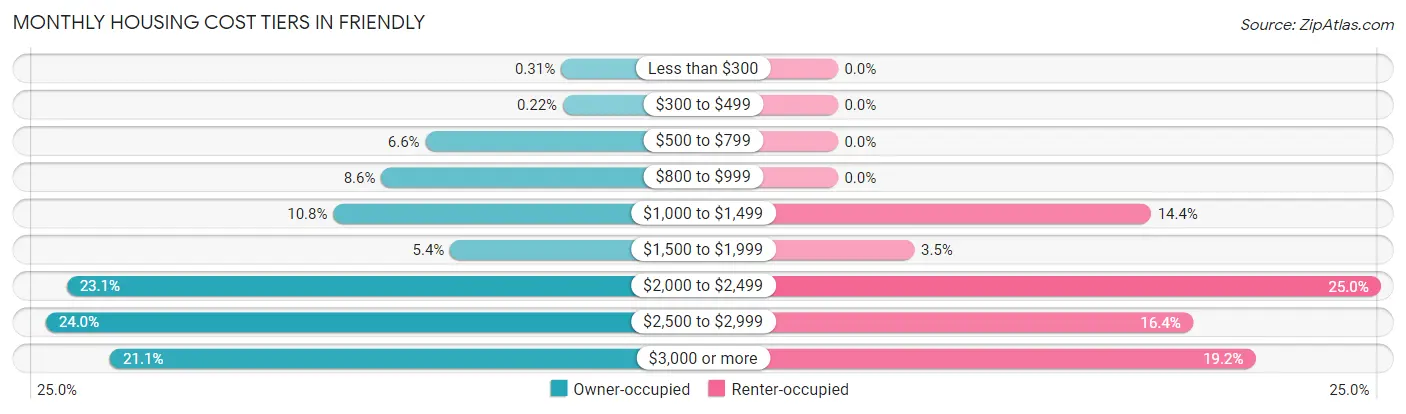
| Monthly Cost | Owner-occupied | Renter-occupied |
| Less than $300 | 10 (0.3%) | 0 (0.0%) |
| $300 to $499 | 7 (0.2%) | 0 (0.0%) |
| $500 to $799 | 213 (6.6%) | 0 (0.0%) |
| $800 to $999 | 279 (8.6%) | 0 (0.0%) |
| $1,000 to $1,499 | 351 (10.8%) | 45 (14.4%) |
| $1,500 to $1,999 | 176 (5.4%) | 11 (3.5%) |
| $2,000 to $2,499 | 750 (23.1%) | 78 (25.0%) |
| $2,500 to $2,999 | 781 (24.0%) | 51 (16.4%) |
| $3,000 or more | 685 (21.1%) | 60 (19.2%) |
| Total | 3,252 (100.0%) | 312 (100.0%) |
Physical Housing Characteristics in Friendly
Housing Structures in Friendly
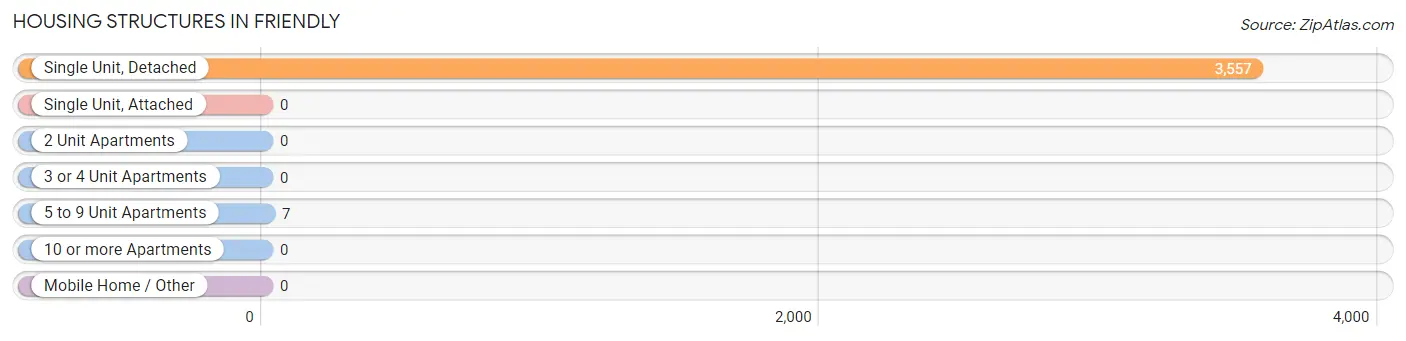
| Structure Type | # Housing Units | % Housing Units |
| Single Unit, Detached | 3,557 | 99.8% |
| Single Unit, Attached | 0 | 0.0% |
| 2 Unit Apartments | 0 | 0.0% |
| 3 or 4 Unit Apartments | 0 | 0.0% |
| 5 to 9 Unit Apartments | 7 | 0.2% |
| 10 or more Apartments | 0 | 0.0% |
| Mobile Home / Other | 0 | 0.0% |
| Total | 3,564 | 100.0% |
Housing Structures by Occupancy in Friendly
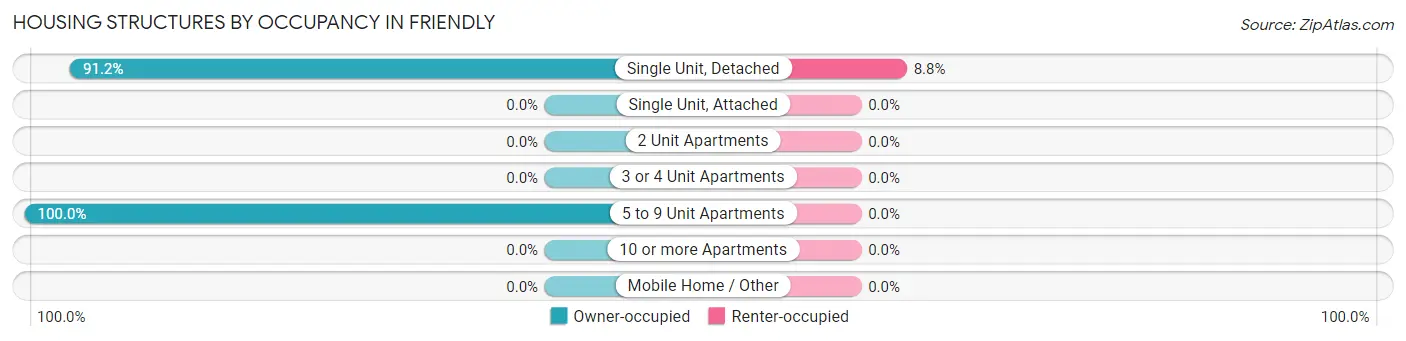
| Structure Type | Owner-occupied | Renter-occupied |
| Single Unit, Detached | 3,245 (91.2%) | 312 (8.8%) |
| Single Unit, Attached | 0 (0.0%) | 0 (0.0%) |
| 2 Unit Apartments | 0 (0.0%) | 0 (0.0%) |
| 3 or 4 Unit Apartments | 0 (0.0%) | 0 (0.0%) |
| 5 to 9 Unit Apartments | 7 (100.0%) | 0 (0.0%) |
| 10 or more Apartments | 0 (0.0%) | 0 (0.0%) |
| Mobile Home / Other | 0 (0.0%) | 0 (0.0%) |
| Total | 3,252 (91.2%) | 312 (8.7%) |
Housing Structures by Number of Rooms in Friendly
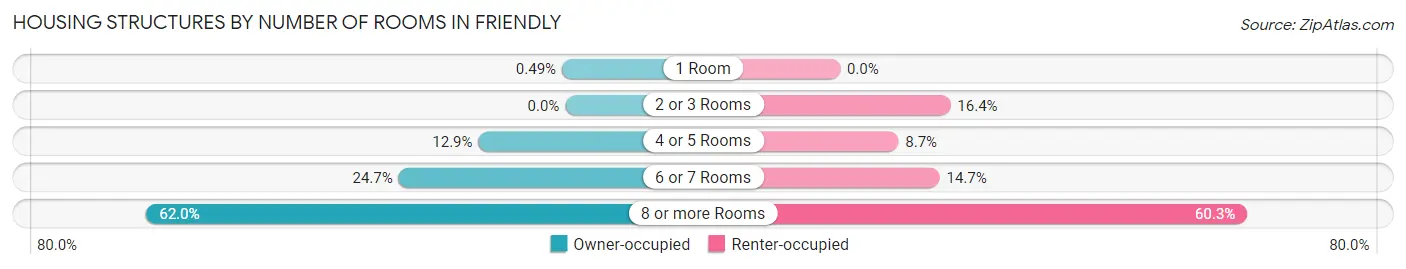
| Number of Rooms | Owner-occupied | Renter-occupied |
| 1 Room | 16 (0.5%) | 0 (0.0%) |
| 2 or 3 Rooms | 0 (0.0%) | 51 (16.4%) |
| 4 or 5 Rooms | 418 (12.9%) | 27 (8.6%) |
| 6 or 7 Rooms | 802 (24.7%) | 46 (14.7%) |
| 8 or more Rooms | 2,016 (62.0%) | 188 (60.3%) |
| Total | 3,252 (100.0%) | 312 (100.0%) |
Housing Structure by Heating Type in Friendly
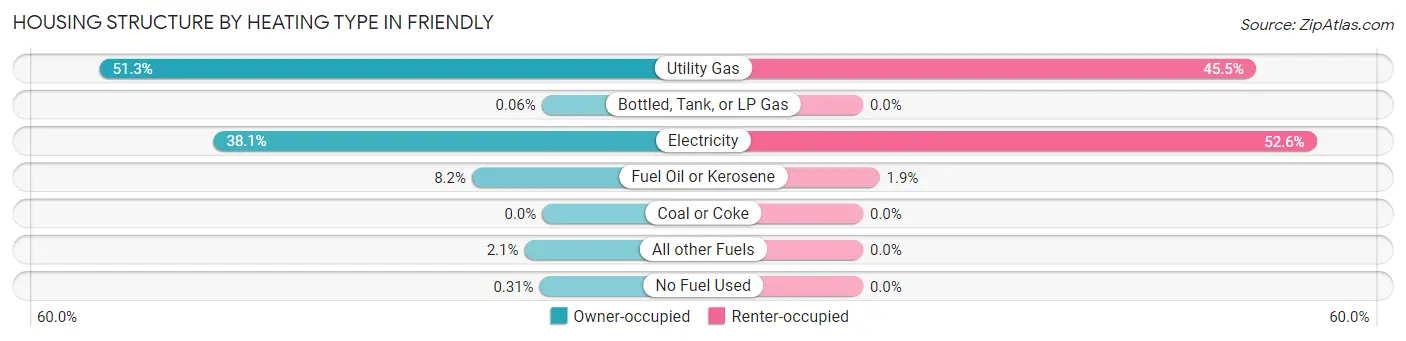
| Heating Type | Owner-occupied | Renter-occupied |
| Utility Gas | 1,669 (51.3%) | 142 (45.5%) |
| Bottled, Tank, or LP Gas | 2 (0.1%) | 0 (0.0%) |
| Electricity | 1,239 (38.1%) | 164 (52.6%) |
| Fuel Oil or Kerosene | 265 (8.2%) | 6 (1.9%) |
| Coal or Coke | 0 (0.0%) | 0 (0.0%) |
| All other Fuels | 67 (2.1%) | 0 (0.0%) |
| No Fuel Used | 10 (0.3%) | 0 (0.0%) |
| Total | 3,252 (100.0%) | 312 (100.0%) |
Household Vehicle Usage in Friendly
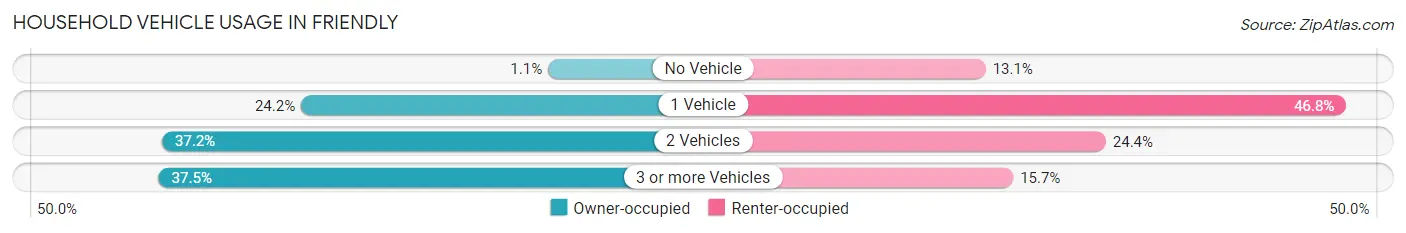
| Vehicles per Household | Owner-occupied | Renter-occupied |
| No Vehicle | 37 (1.1%) | 41 (13.1%) |
| 1 Vehicle | 787 (24.2%) | 146 (46.8%) |
| 2 Vehicles | 1,209 (37.2%) | 76 (24.4%) |
| 3 or more Vehicles | 1,219 (37.5%) | 49 (15.7%) |
| Total | 3,252 (100.0%) | 312 (100.0%) |
Real Estate & Mortgages in Friendly
Real Estate and Mortgage Overview in Friendly
| Characteristic | Without Mortgage | With Mortgage |
| Housing Units | 567 | 2,685 |
| Median Property Value | $359,900 | $394,200 |
| Median Household Income | $108,917 | $1,202 |
| Monthly Housing Costs | $837 | $685 |
| Real Estate Taxes | $4,114 | $58 |
Property Value by Mortgage Status in Friendly
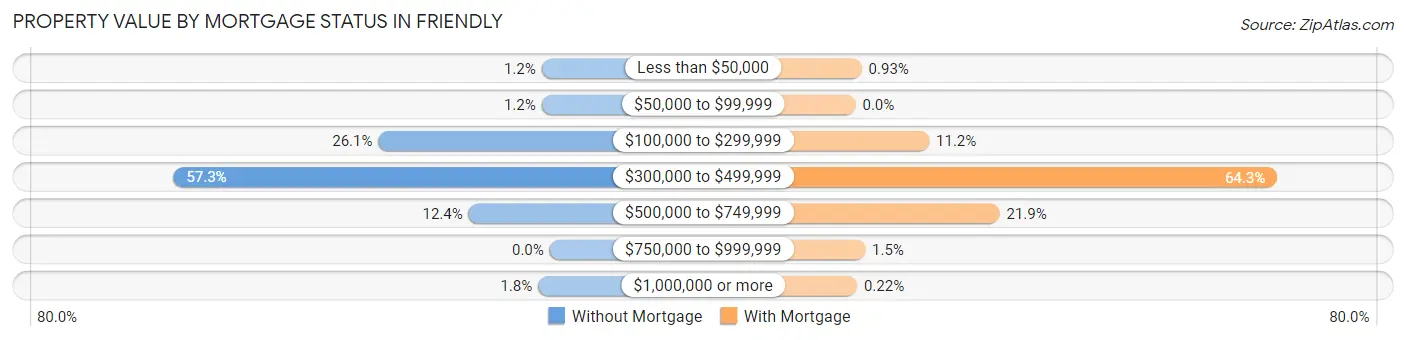
| Property Value | Without Mortgage | With Mortgage |
| Less than $50,000 | 7 (1.2%) | 25 (0.9%) |
| $50,000 to $99,999 | 7 (1.2%) | 0 (0.0%) |
| $100,000 to $299,999 | 148 (26.1%) | 301 (11.2%) |
| $300,000 to $499,999 | 325 (57.3%) | 1,725 (64.2%) |
| $500,000 to $749,999 | 70 (12.3%) | 589 (21.9%) |
| $750,000 to $999,999 | 0 (0.0%) | 39 (1.5%) |
| $1,000,000 or more | 10 (1.8%) | 6 (0.2%) |
| Total | 567 (100.0%) | 2,685 (100.0%) |
Household Income by Mortgage Status in Friendly
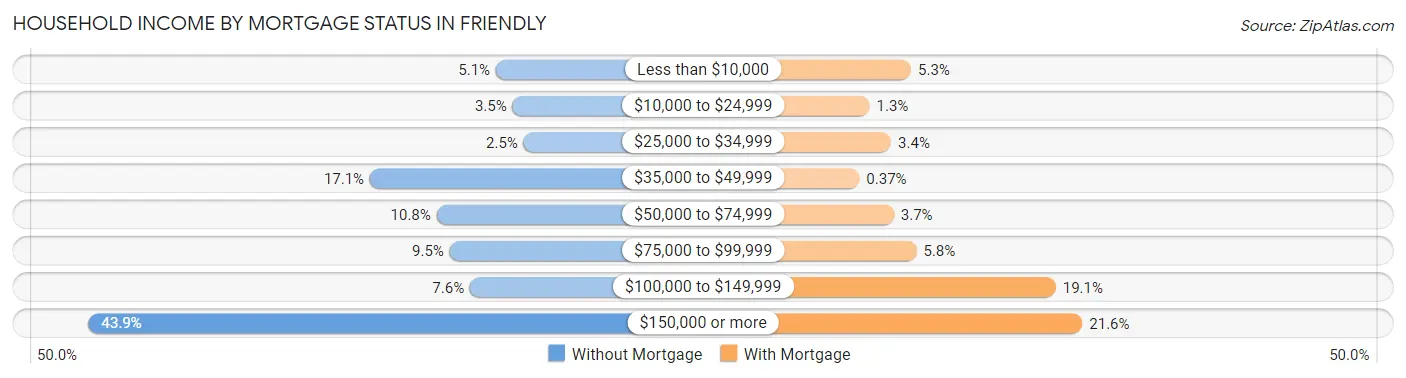
| Household Income | Without Mortgage | With Mortgage |
| Less than $10,000 | 29 (5.1%) | 142 (5.3%) |
| $10,000 to $24,999 | 20 (3.5%) | 36 (1.3%) |
| $25,000 to $34,999 | 14 (2.5%) | 91 (3.4%) |
| $35,000 to $49,999 | 97 (17.1%) | 10 (0.4%) |
| $50,000 to $74,999 | 61 (10.8%) | 98 (3.6%) |
| $75,000 to $99,999 | 54 (9.5%) | 156 (5.8%) |
| $100,000 to $149,999 | 43 (7.6%) | 512 (19.1%) |
| $150,000 or more | 249 (43.9%) | 580 (21.6%) |
| Total | 567 (100.0%) | 2,685 (100.0%) |
Property Value to Household Income Ratio in Friendly
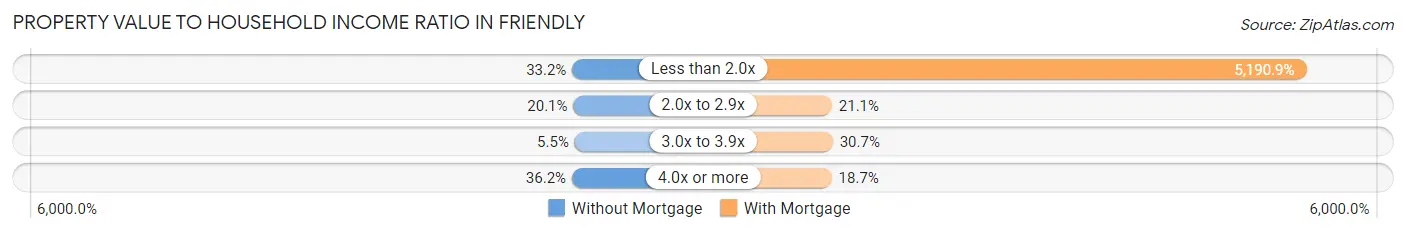
| Value-to-Income Ratio | Without Mortgage | With Mortgage |
| Less than 2.0x | 188 (33.2%) | 139,375 (5,190.9%) |
| 2.0x to 2.9x | 114 (20.1%) | 567 (21.1%) |
| 3.0x to 3.9x | 31 (5.5%) | 825 (30.7%) |
| 4.0x or more | 205 (36.2%) | 503 (18.7%) |
| Total | 567 (100.0%) | 2,685 (100.0%) |
Real Estate Taxes by Mortgage Status in Friendly
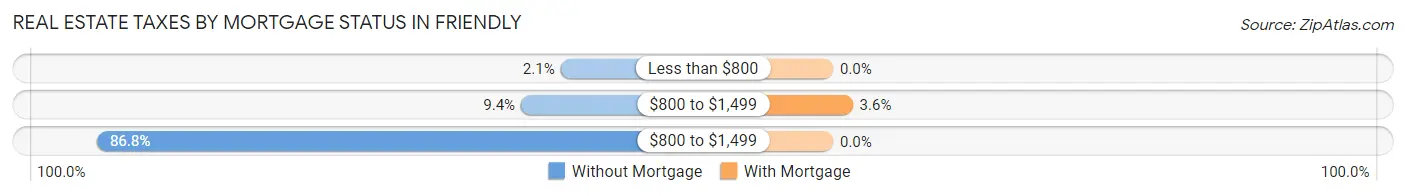
| Property Taxes | Without Mortgage | With Mortgage |
| Less than $800 | 12 (2.1%) | 0 (0.0%) |
| $800 to $1,499 | 53 (9.3%) | 96 (3.6%) |
| $800 to $1,499 | 492 (86.8%) | 0 (0.0%) |
| Total | 567 (100.0%) | 2,685 (100.0%) |
Health & Disability in Friendly
Health Insurance Coverage by Age in Friendly
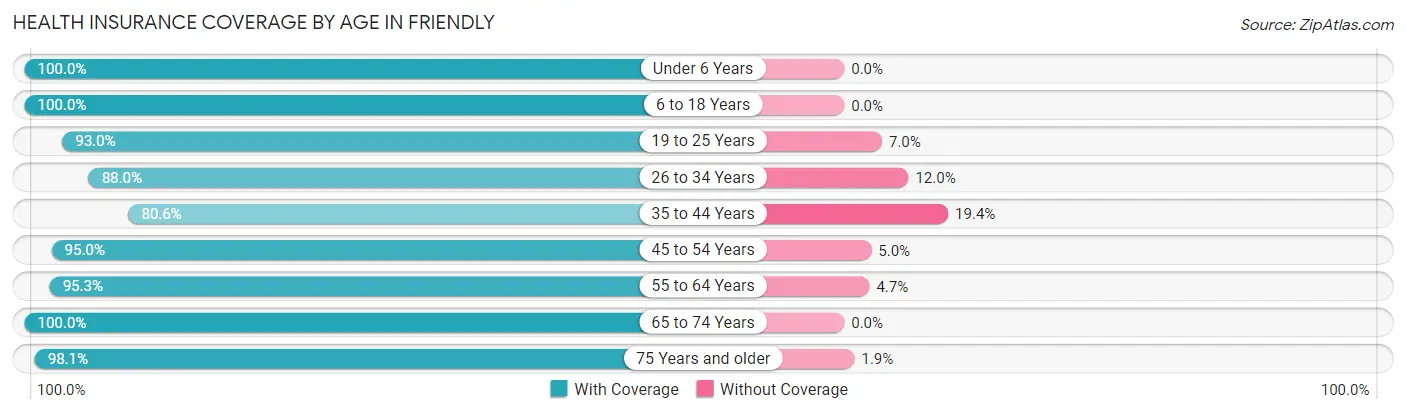
| Age Bracket | With Coverage | Without Coverage |
| Under 6 Years | 394 (100.0%) | 0 (0.0%) |
| 6 to 18 Years | 1,647 (100.0%) | 0 (0.0%) |
| 19 to 25 Years | 648 (93.0%) | 49 (7.0%) |
| 26 to 34 Years | 816 (88.0%) | 111 (12.0%) |
| 35 to 44 Years | 1,082 (80.6%) | 260 (19.4%) |
| 45 to 54 Years | 1,525 (95.0%) | 81 (5.0%) |
| 55 to 64 Years | 1,868 (95.3%) | 92 (4.7%) |
| 65 to 74 Years | 1,404 (100.0%) | 0 (0.0%) |
| 75 Years and older | 615 (98.1%) | 12 (1.9%) |
| Total | 9,999 (94.3%) | 605 (5.7%) |
Health Insurance Coverage by Citizenship Status in Friendly
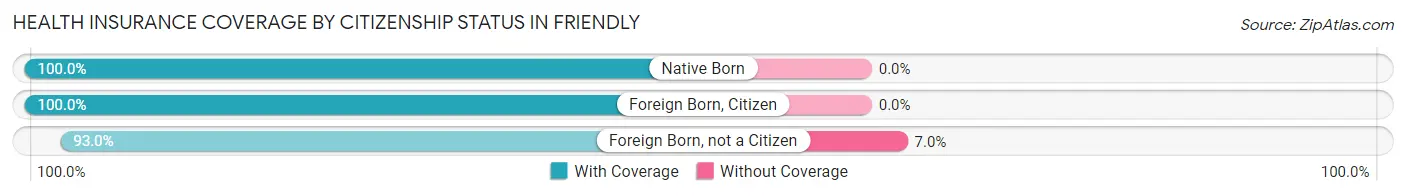
| Citizenship Status | With Coverage | Without Coverage |
| Native Born | 394 (100.0%) | 0 (0.0%) |
| Foreign Born, Citizen | 1,647 (100.0%) | 0 (0.0%) |
| Foreign Born, not a Citizen | 648 (93.0%) | 49 (7.0%) |
Health Insurance Coverage by Household Income in Friendly
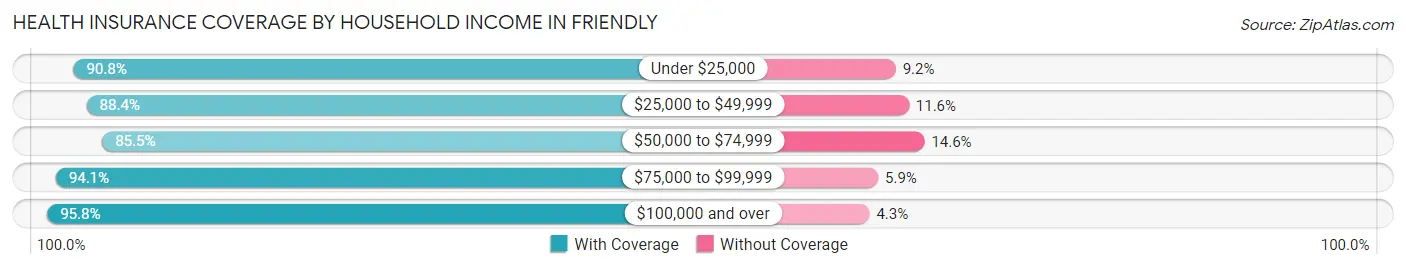
| Household Income | With Coverage | Without Coverage |
| Under $25,000 | 317 (90.8%) | 32 (9.2%) |
| $25,000 to $49,999 | 638 (88.4%) | 84 (11.6%) |
| $50,000 to $74,999 | 511 (85.5%) | 87 (14.5%) |
| $75,000 to $99,999 | 1,301 (94.1%) | 81 (5.9%) |
| $100,000 and over | 7,204 (95.8%) | 320 (4.3%) |
Public vs Private Health Insurance Coverage by Age in Friendly
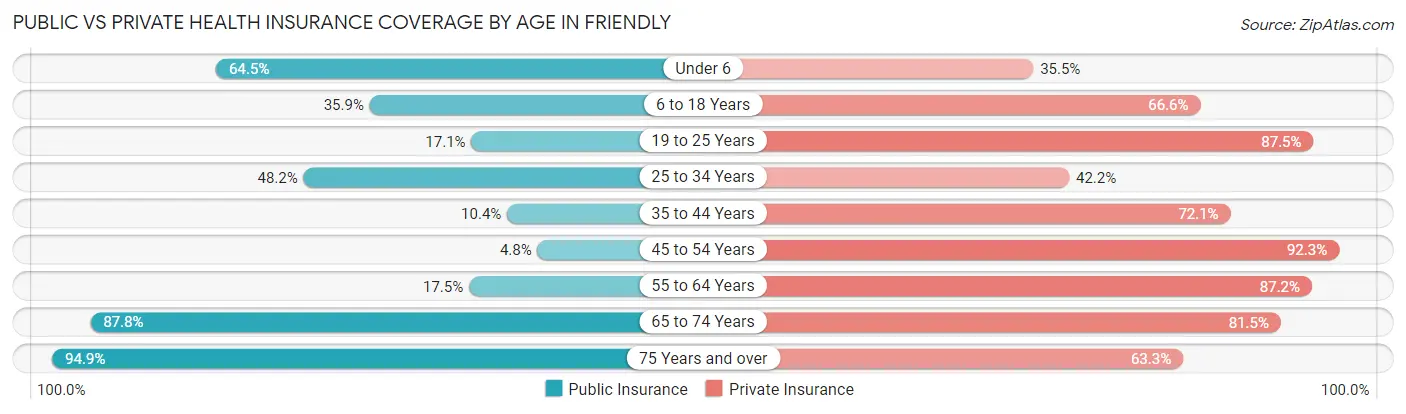
| Age Bracket | Public Insurance | Private Insurance |
| Under 6 | 254 (64.5%) | 140 (35.5%) |
| 6 to 18 Years | 592 (35.9%) | 1,096 (66.5%) |
| 19 to 25 Years | 119 (17.1%) | 610 (87.5%) |
| 25 to 34 Years | 447 (48.2%) | 391 (42.2%) |
| 35 to 44 Years | 140 (10.4%) | 968 (72.1%) |
| 45 to 54 Years | 77 (4.8%) | 1,482 (92.3%) |
| 55 to 64 Years | 343 (17.5%) | 1,710 (87.2%) |
| 65 to 74 Years | 1,233 (87.8%) | 1,144 (81.5%) |
| 75 Years and over | 595 (94.9%) | 397 (63.3%) |
| Total | 3,800 (35.8%) | 7,938 (74.9%) |
Disability Status by Sex by Age in Friendly
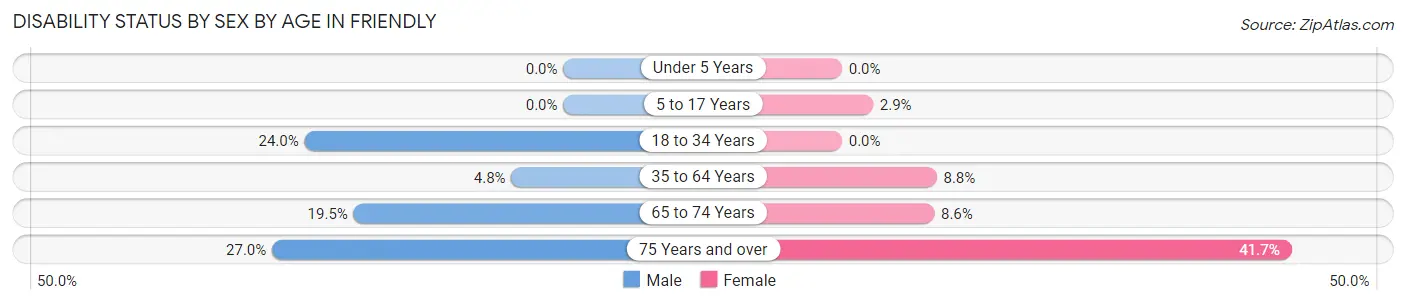
| Age Bracket | Male | Female |
| Under 5 Years | 0 (0.0%) | 0 (0.0%) |
| 5 to 17 Years | 0 (0.0%) | 21 (2.9%) |
| 18 to 34 Years | 257 (24.0%) | 0 (0.0%) |
| 35 to 64 Years | 117 (4.8%) | 218 (8.8%) |
| 65 to 74 Years | 130 (19.5%) | 63 (8.6%) |
| 75 Years and over | 60 (27.0%) | 169 (41.7%) |
Disability Class by Sex by Age in Friendly
Disability Class: Hearing Difficulty
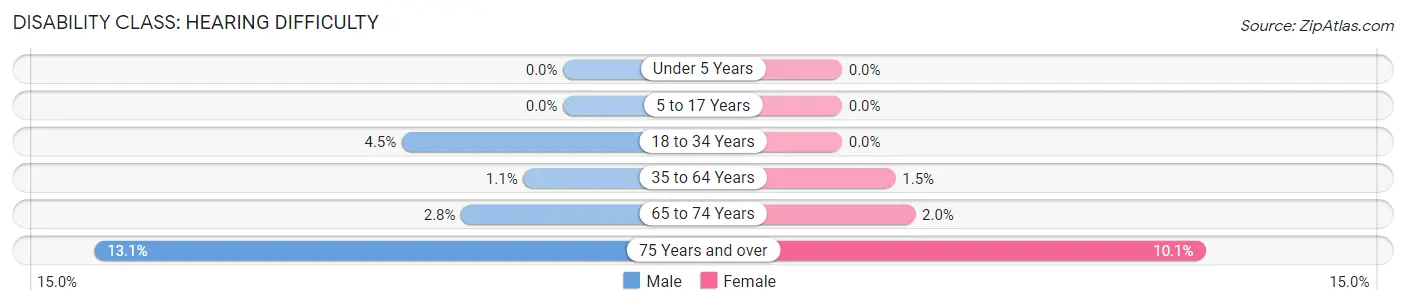
| Age Bracket | Male | Female |
| Under 5 Years | 0 (0.0%) | 0 (0.0%) |
| 5 to 17 Years | 0 (0.0%) | 0 (0.0%) |
| 18 to 34 Years | 48 (4.5%) | 0 (0.0%) |
| 35 to 64 Years | 27 (1.1%) | 37 (1.5%) |
| 65 to 74 Years | 19 (2.8%) | 15 (2.0%) |
| 75 Years and over | 29 (13.1%) | 41 (10.1%) |
Disability Class: Vision Difficulty
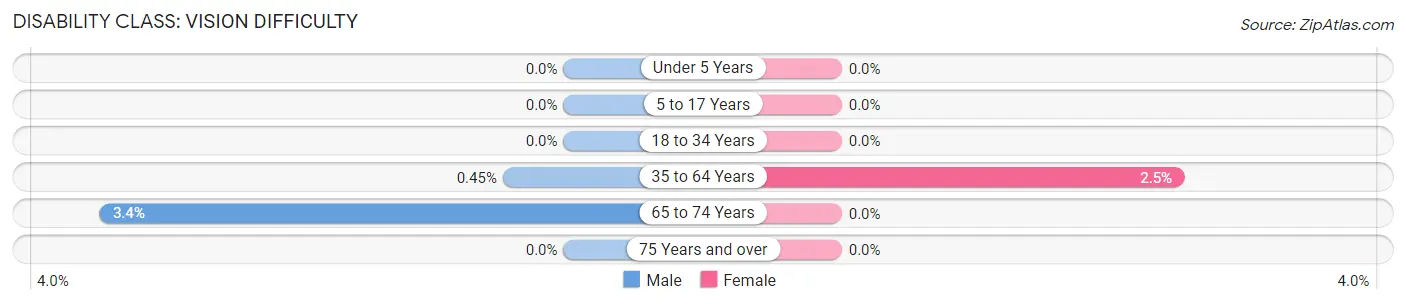
| Age Bracket | Male | Female |
| Under 5 Years | 0 (0.0%) | 0 (0.0%) |
| 5 to 17 Years | 0 (0.0%) | 0 (0.0%) |
| 18 to 34 Years | 0 (0.0%) | 0 (0.0%) |
| 35 to 64 Years | 11 (0.4%) | 63 (2.5%) |
| 65 to 74 Years | 23 (3.4%) | 0 (0.0%) |
| 75 Years and over | 0 (0.0%) | 0 (0.0%) |
Disability Class: Cognitive Difficulty
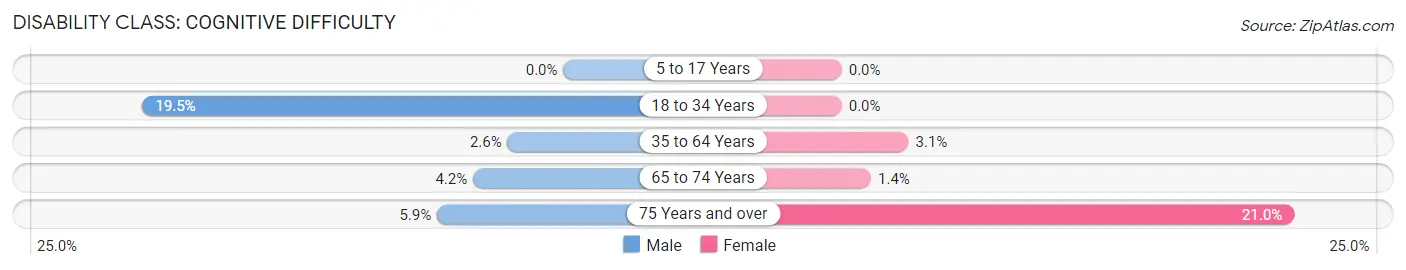
| Age Bracket | Male | Female |
| 5 to 17 Years | 0 (0.0%) | 0 (0.0%) |
| 18 to 34 Years | 209 (19.5%) | 0 (0.0%) |
| 35 to 64 Years | 63 (2.6%) | 77 (3.1%) |
| 65 to 74 Years | 28 (4.2%) | 10 (1.4%) |
| 75 Years and over | 13 (5.9%) | 85 (21.0%) |
Disability Class: Ambulatory Difficulty
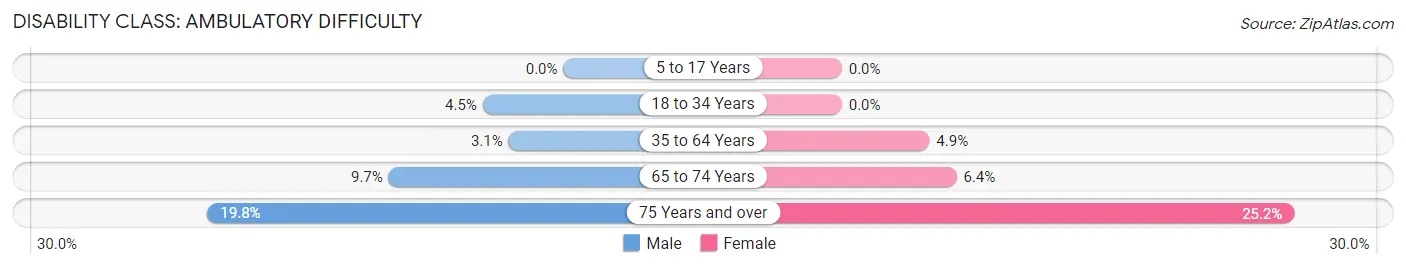
| Age Bracket | Male | Female |
| 5 to 17 Years | 0 (0.0%) | 0 (0.0%) |
| 18 to 34 Years | 48 (4.5%) | 0 (0.0%) |
| 35 to 64 Years | 74 (3.0%) | 121 (4.9%) |
| 65 to 74 Years | 65 (9.7%) | 47 (6.4%) |
| 75 Years and over | 44 (19.8%) | 102 (25.2%) |
Disability Class: Self-Care Difficulty
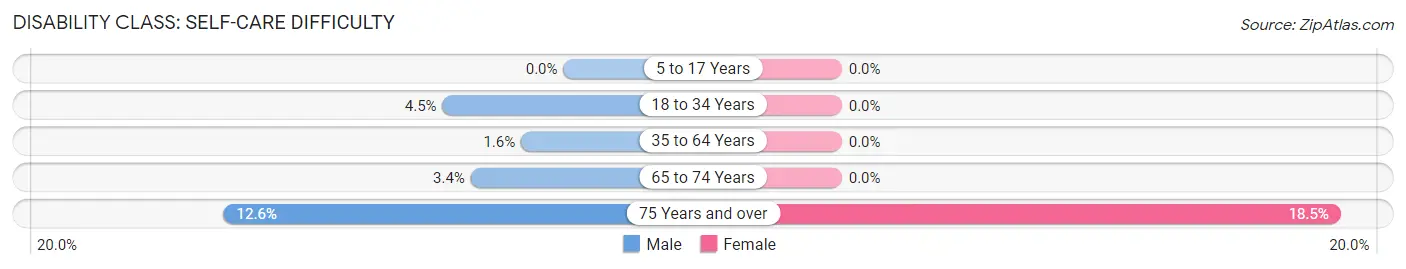
| Age Bracket | Male | Female |
| 5 to 17 Years | 0 (0.0%) | 0 (0.0%) |
| 18 to 34 Years | 48 (4.5%) | 0 (0.0%) |
| 35 to 64 Years | 38 (1.6%) | 0 (0.0%) |
| 65 to 74 Years | 23 (3.4%) | 0 (0.0%) |
| 75 Years and over | 28 (12.6%) | 75 (18.5%) |
Technology Access in Friendly
Computing Device Access in Friendly
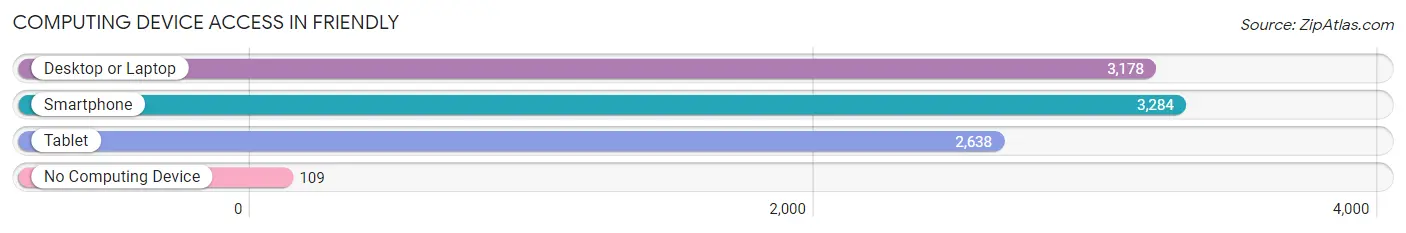
| Device Type | # Households | % Households |
| Desktop or Laptop | 3,178 | 89.2% |
| Smartphone | 3,284 | 92.1% |
| Tablet | 2,638 | 74.0% |
| No Computing Device | 109 | 3.1% |
| Total | 3,564 | 100.0% |
Internet Access in Friendly
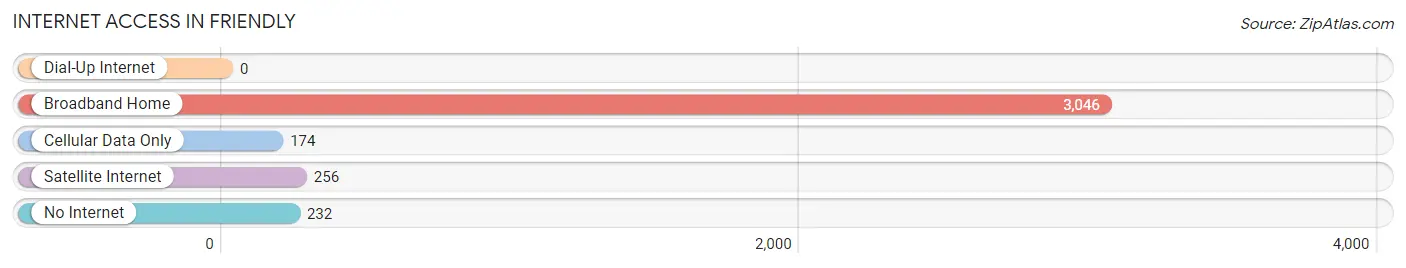
| Internet Type | # Households | % Households |
| Dial-Up Internet | 0 | 0.0% |
| Broadband Home | 3,046 | 85.5% |
| Cellular Data Only | 174 | 4.9% |
| Satellite Internet | 256 | 7.2% |
| No Internet | 232 | 6.5% |
| Total | 3,564 | 100.0% |
Friendly Summary
Maryland is a state located in the Mid-Atlantic region of the United States. It is bordered by Virginia, West Virginia, and the District of Columbia to the south and west; Pennsylvania to the north; and Delaware to the east. Maryland is the ninth smallest state in the country and the 19th most populous. It is the seventh most densely populated state in the nation.
History
The area that is now Maryland was first explored by Europeans in the early 1600s. The first permanent settlement was established in 1634 by English colonists, who named the area Maryland in honor of Queen Henrietta Maria, the wife of King Charles I of England. Maryland was one of the original 13 colonies that declared independence from Great Britain in 1776. It was the seventh state to ratify the U.S. Constitution in 1788.
During the Civil War, Maryland was a border state, meaning it was part of the Union but had many Confederate sympathizers. After the war, Maryland was the first state to ratify the Thirteenth Amendment, which abolished slavery.
Geography
Maryland is located in the Mid-Atlantic region of the United States. It is bordered by Virginia, West Virginia, and the District of Columbia to the south and west; Pennsylvania to the north; and Delaware to the east. Maryland is the ninth smallest state in the country and the 19th most populous. It is the seventh most densely populated state in the nation.
The state is divided into two distinct regions: the Eastern Shore and the Western Shore. The Eastern Shore is a flat, coastal plain that is home to the Chesapeake Bay and its many tributaries. The Western Shore is a hilly, mountainous region that is home to the Appalachian Mountains.
The state’s highest point is Hoye-Crest, located in Garrett County at an elevation of 3,360 feet. The lowest point is sea level, located along the Atlantic Ocean.
Economy
Maryland’s economy is largely driven by the federal government, which is the largest employer in the state. Other major industries include manufacturing, technology, and tourism.
The state’s largest industries are aerospace, biotechnology, and information technology. Maryland is also home to several major universities, including Johns Hopkins University, the University of Maryland, and the University of Baltimore.
Demographics
As of 2019, the population of Maryland was estimated to be 6,045,680. The state is racially and ethnically diverse, with the largest racial groups being White (60.2%), African American (30.1%), and Hispanic or Latino (8.2%).
The median household income in Maryland is $80,776, which is higher than the national median of $61,937. The poverty rate in the state is 8.7%, which is lower than the national average of 11.8%.
Conclusion
Maryland is a state located in the Mid-Atlantic region of the United States. It is bordered by Virginia, West Virginia, and the District of Columbia to the south and west; Pennsylvania to the north; and Delaware to the east. Maryland is the ninth smallest state in the country and the 19th most populous. It is the seventh most densely populated state in the nation.
The state’s economy is largely driven by the federal government, and other major industries include manufacturing, technology, and tourism. The population of Maryland is racially and ethnically diverse, with the largest racial groups being White (60.2%), African American (30.1%), and Hispanic or Latino (8.2%). The median household income in Maryland is $80,776, which is higher than the national median of $61,937. The poverty rate in the state is 8.7%, which is lower than the national average of 11.8%.
Common Questions
What is Per Capita Income in Friendly?
Per Capita income in Friendly is $49,917.
What is the Median Family Income in Friendly?
Median Family Income in Friendly is $153,924.
What is the Median Household income in Friendly?
Median Household Income in Friendly is $123,750.
What is Income or Wage Gap in Friendly?
Income or Wage Gap in Friendly is 19.8%.
Women in Friendly earn 80.2 cents for every dollar earned by a man.
What is Inequality or Gini Index in Friendly?
Inequality or Gini Index in Friendly is 0.35.
What is the Total Population of Friendly?
Total Population of Friendly is 10,639.
What is the Total Male Population of Friendly?
Total Male Population of Friendly is 5,417.
What is the Total Female Population of Friendly?
Total Female Population of Friendly is 5,222.
What is the Ratio of Males per 100 Females in Friendly?
There are 103.73 Males per 100 Females in Friendly.
What is the Ratio of Females per 100 Males in Friendly?
There are 96.40 Females per 100 Males in Friendly.
What is the Median Population Age in Friendly?
Median Population Age in Friendly is 47.1 Years.
What is the Average Family Size in Friendly
Average Family Size in Friendly is 3.5 People.
What is the Average Household Size in Friendly
Average Household Size in Friendly is 3.0 People.
How Large is the Labor Force in Friendly?
There are 5,905 People in the Labor Forcein in Friendly.
What is the Percentage of People in the Labor Force in Friendly?
64.8% of People are in the Labor Force in Friendly.
What is the Unemployment Rate in Friendly?
Unemployment Rate in Friendly is 6.9%.