Golden Beach, MD Map & Demographics
Golden Beach Map
Golden Beach Overview
$40,763
PER CAPITA INCOME
$145,191
AVG FAMILY INCOME
$118,500
AVG HOUSEHOLD INCOME
43.4%
WAGE / INCOME GAP [ % ]
56.6¢/ $1
WAGE / INCOME GAP [ $ ]
0.33
INEQUALITY / GINI INDEX
3,933
TOTAL POPULATION
2,148
MALE POPULATION
1,785
FEMALE POPULATION
120.34
MALES / 100 FEMALES
83.10
FEMALES / 100 MALES
33.0
MEDIAN AGE
3.6
AVG FAMILY SIZE
3.1
AVG HOUSEHOLD SIZE
1,985
LABOR FORCE [ PEOPLE ]
70.3%
PERCENT IN LABOR FORCE
2.1%
UNEMPLOYMENT RATE
Income in Golden Beach
Income Overview in Golden Beach
Per Capita Income in Golden Beach is $40,763, while median incomes of families and households are $145,191 and $118,500 respectively.
| Characteristic | Number | Measure |
| Per Capita Income | 3,933 | $40,763 |
| Median Family Income | 995 | $145,191 |
| Mean Family Income | 995 | $140,676 |
| Median Household Income | 1,248 | $118,500 |
| Mean Household Income | 1,248 | $124,721 |
| Income Deficit | 995 | $0 |
| Wage / Income Gap (%) | 3,933 | 43.40% |
| Wage / Income Gap ($) | 3,933 | 56.60¢ per $1 |
| Gini / Inequality Index | 3,933 | 0.33 |
Earnings by Sex in Golden Beach
Average Earnings in Golden Beach are $64,514, $83,036 for men and $47,000 for women, a difference of 43.4%.
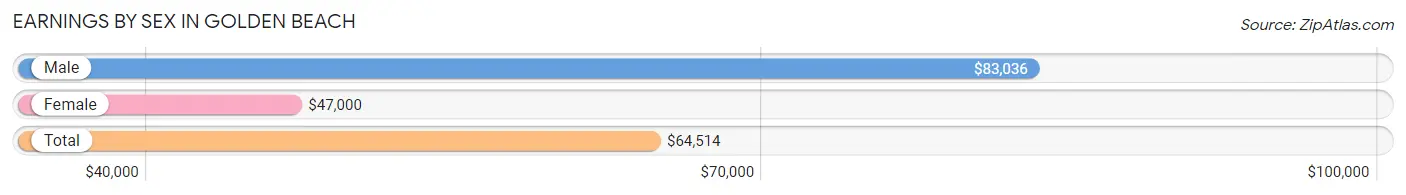
| Sex | Number | Average Earnings |
| Male | 1,098 (55.1%) | $83,036 |
| Female | 896 (44.9%) | $47,000 |
| Total | 1,994 (100.0%) | $64,514 |
Earnings by Sex by Income Bracket in Golden Beach
The most common earnings brackets in Golden Beach are $75,000 to $99,999 for men (348 | 31.7%) and $55,000 to $64,999 for women (149 | 16.6%).
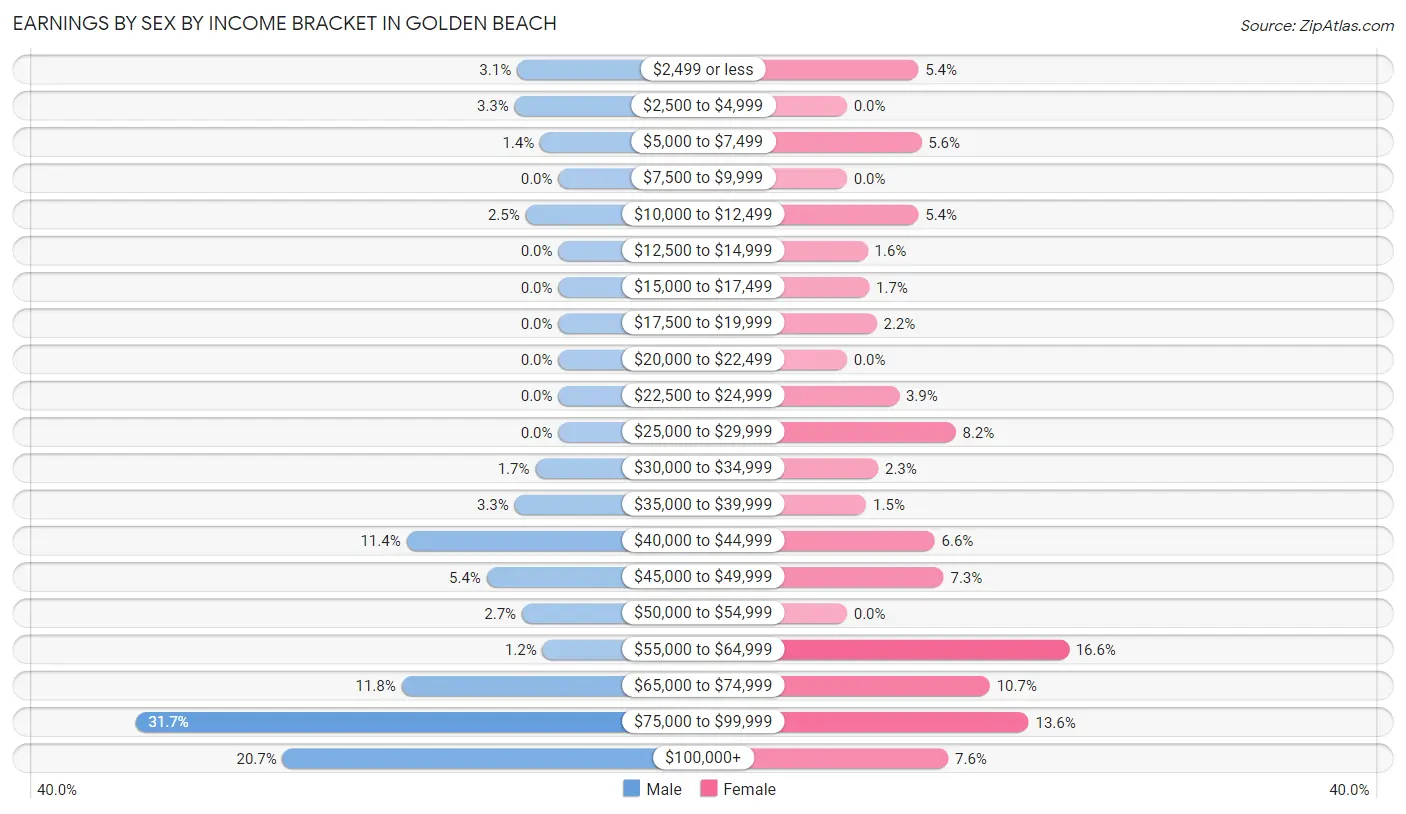
| Income | Male | Female |
| $2,499 or less | 34 (3.1%) | 48 (5.4%) |
| $2,500 to $4,999 | 36 (3.3%) | 0 (0.0%) |
| $5,000 to $7,499 | 15 (1.4%) | 50 (5.6%) |
| $7,500 to $9,999 | 0 (0.0%) | 0 (0.0%) |
| $10,000 to $12,499 | 27 (2.5%) | 48 (5.4%) |
| $12,500 to $14,999 | 0 (0.0%) | 14 (1.6%) |
| $15,000 to $17,499 | 0 (0.0%) | 15 (1.7%) |
| $17,500 to $19,999 | 0 (0.0%) | 20 (2.2%) |
| $20,000 to $22,499 | 0 (0.0%) | 0 (0.0%) |
| $22,500 to $24,999 | 0 (0.0%) | 35 (3.9%) |
| $25,000 to $29,999 | 0 (0.0%) | 73 (8.2%) |
| $30,000 to $34,999 | 19 (1.7%) | 21 (2.3%) |
| $35,000 to $39,999 | 36 (3.3%) | 13 (1.5%) |
| $40,000 to $44,999 | 125 (11.4%) | 59 (6.6%) |
| $45,000 to $49,999 | 59 (5.4%) | 65 (7.2%) |
| $50,000 to $54,999 | 30 (2.7%) | 0 (0.0%) |
| $55,000 to $64,999 | 13 (1.2%) | 149 (16.6%) |
| $65,000 to $74,999 | 129 (11.7%) | 96 (10.7%) |
| $75,000 to $99,999 | 348 (31.7%) | 122 (13.6%) |
| $100,000+ | 227 (20.7%) | 68 (7.6%) |
| Total | 1,098 (100.0%) | 896 (100.0%) |
Earnings by Sex by Educational Attainment in Golden Beach
Average earnings in Golden Beach are $86,058 for men and $58,874 for women, a difference of 31.6%. Men with an educational attainment of graduate degree enjoy the highest average annual earnings of $136,875, while those with college or associate's degree education earn the least with $69,004. Women with an educational attainment of graduate degree earn the most with the average annual earnings of $76,190, while those with high school diploma education have the smallest earnings of $43,490.
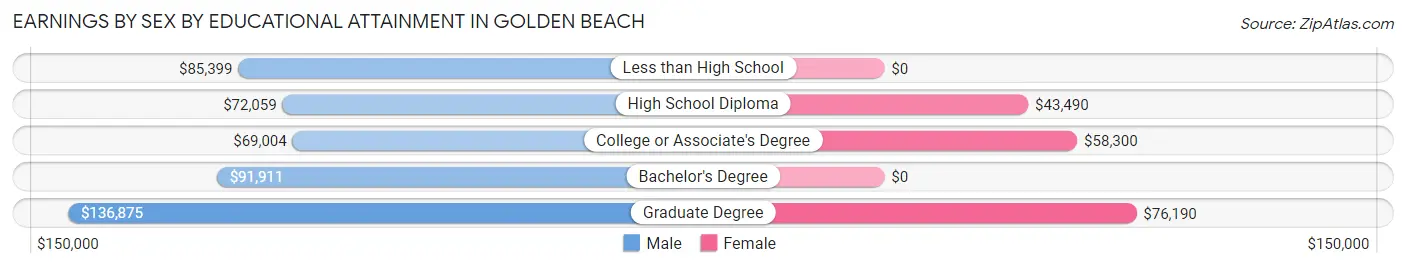
| Educational Attainment | Male Income | Female Income |
| Less than High School | $85,399 | $0 |
| High School Diploma | $72,059 | $43,490 |
| College or Associate's Degree | $69,004 | $58,300 |
| Bachelor's Degree | $91,911 | $0 |
| Graduate Degree | $136,875 | $76,190 |
| Total | $86,058 | $58,874 |
Family Income in Golden Beach
Family Income Brackets in Golden Beach
According to the Golden Beach family income data, there are 273 families falling into the $100,000 to $149,999 income range, which is the most common income bracket and makes up 27.4% of all families.
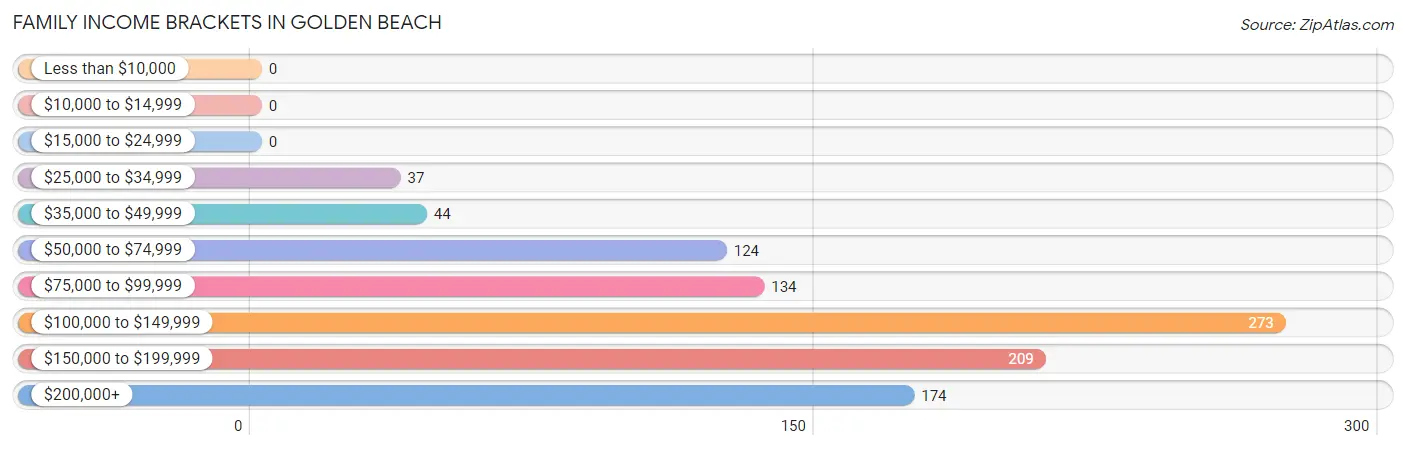
| Income Bracket | # Families | % Families |
| Less than $10,000 | 0 | 0.0% |
| $10,000 to $14,999 | 0 | 0.0% |
| $15,000 to $24,999 | 0 | 0.0% |
| $25,000 to $34,999 | 37 | 3.7% |
| $35,000 to $49,999 | 44 | 4.4% |
| $50,000 to $74,999 | 124 | 12.5% |
| $75,000 to $99,999 | 134 | 13.5% |
| $100,000 to $149,999 | 273 | 27.4% |
| $150,000 to $199,999 | 209 | 21.0% |
| $200,000+ | 174 | 17.5% |
Family Income by Famaliy Size in Golden Beach
3-person families (279 | 28.0%) account for the highest median family income in Golden Beach with $146,836 per family, while 2-person families (297 | 29.8%) have the highest median income of $50,625 per family member.
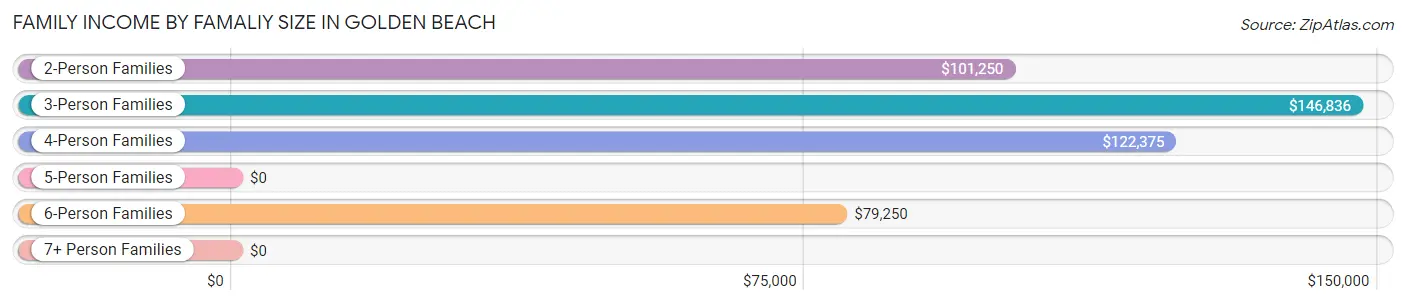
| Income Bracket | # Families | Median Income |
| 2-Person Families | 297 (29.8%) | $101,250 |
| 3-Person Families | 279 (28.0%) | $146,836 |
| 4-Person Families | 209 (21.0%) | $122,375 |
| 5-Person Families | 136 (13.7%) | $0 |
| 6-Person Families | 74 (7.4%) | $79,250 |
| 7+ Person Families | 0 (0.0%) | $0 |
| Total | 995 (100.0%) | $145,191 |
Family Income by Number of Earners in Golden Beach
The median family income in Golden Beach is $145,191, with families comprising 3+ earners (198) having the highest median family income of $198,333, while families with no earners (94) have the lowest median family income of $67,976, accounting for 19.9% and 9.5% of families, respectively.
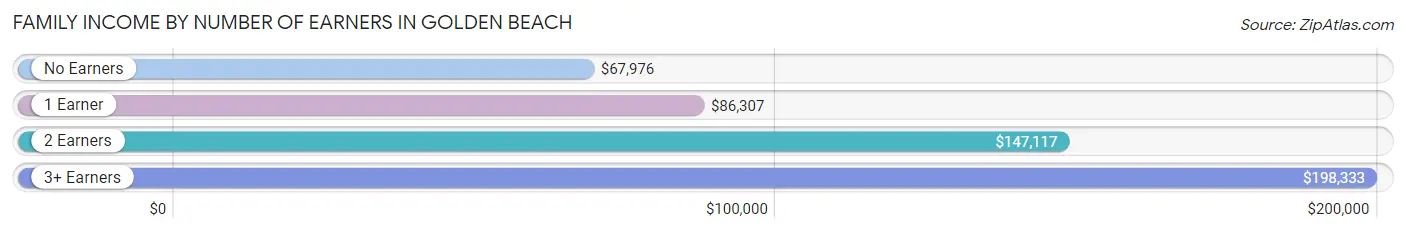
| Number of Earners | # Families | Median Income |
| No Earners | 94 (9.5%) | $67,976 |
| 1 Earner | 299 (30.0%) | $86,307 |
| 2 Earners | 404 (40.6%) | $147,117 |
| 3+ Earners | 198 (19.9%) | $198,333 |
| Total | 995 (100.0%) | $145,191 |
Household Income in Golden Beach
Household Income Brackets in Golden Beach
With 301 households falling in the category, the $100,000 to $149,999 income range is the most frequent in Golden Beach, accounting for 24.1% of all households. In contrast, only 20 households (1.6%) fall into the $15,000 to $24,999 income bracket, making it the least populous group.
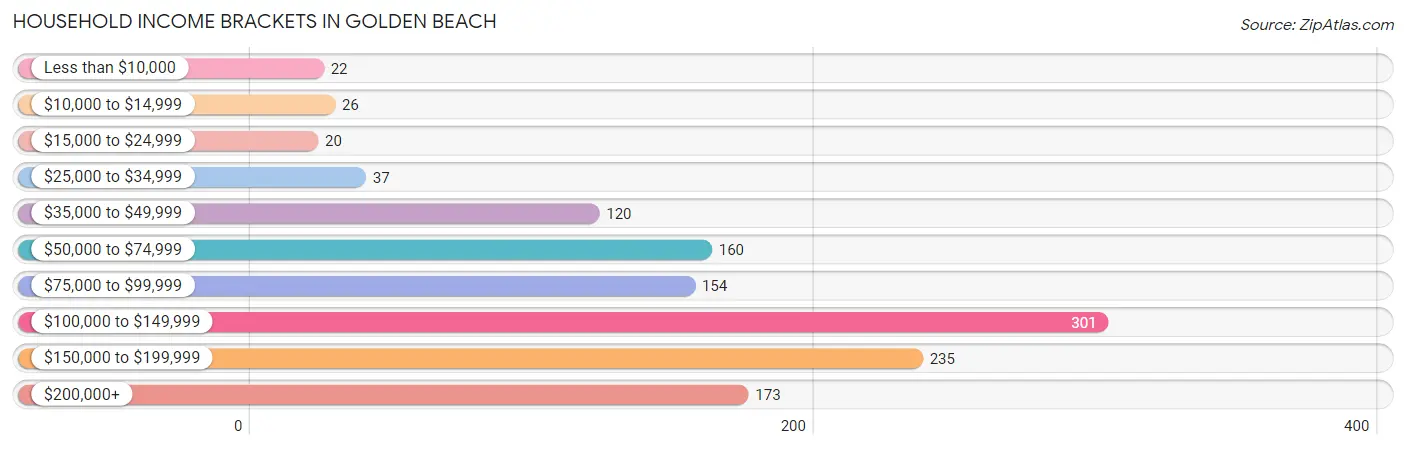
| Income Bracket | # Households | % Households |
| Less than $10,000 | 22 | 1.8% |
| $10,000 to $14,999 | 26 | 2.1% |
| $15,000 to $24,999 | 20 | 1.6% |
| $25,000 to $34,999 | 37 | 3.0% |
| $35,000 to $49,999 | 120 | 9.6% |
| $50,000 to $74,999 | 160 | 12.8% |
| $75,000 to $99,999 | 154 | 12.3% |
| $100,000 to $149,999 | 301 | 24.1% |
| $150,000 to $199,999 | 235 | 18.8% |
| $200,000+ | 173 | 13.9% |
Household Income by Householder Age in Golden Beach
The median household income in Golden Beach is $118,500, with the highest median household income of $147,813 found in the 45 to 64 years age bracket for the primary householder. A total of 365 households (29.2%) fall into this category. Meanwhile, the 15 to 24 years age bracket for the primary householder has the lowest median household income of $0, with 13 households (1.0%) in this group.
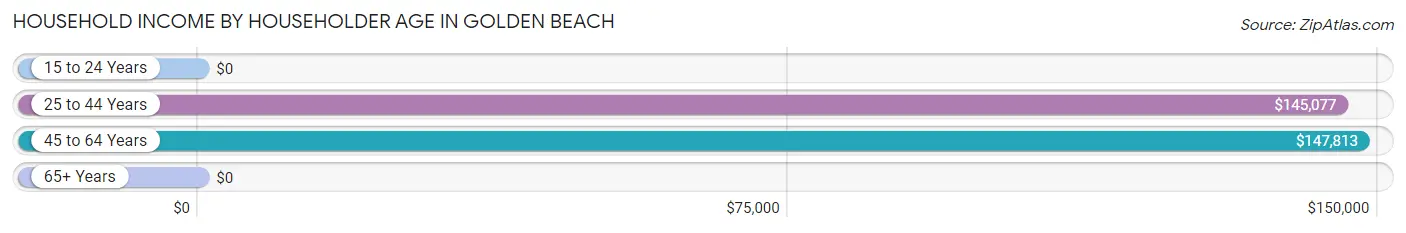
| Income Bracket | # Households | Median Income |
| 15 to 24 Years | 13 (1.0%) | $0 |
| 25 to 44 Years | 510 (40.9%) | $145,077 |
| 45 to 64 Years | 365 (29.2%) | $147,813 |
| 65+ Years | 360 (28.8%) | $0 |
| Total | 1,248 (100.0%) | $118,500 |
Poverty in Golden Beach
Income Below Poverty by Sex and Age in Golden Beach
With 4.6% poverty level for males and 0.5% for females among the residents of Golden Beach, 75 year old and over males and 25 to 34 year old females are the most vulnerable to poverty, with 23 males (19.3%) and 9 females (2.2%) in their respective age groups living below the poverty level.
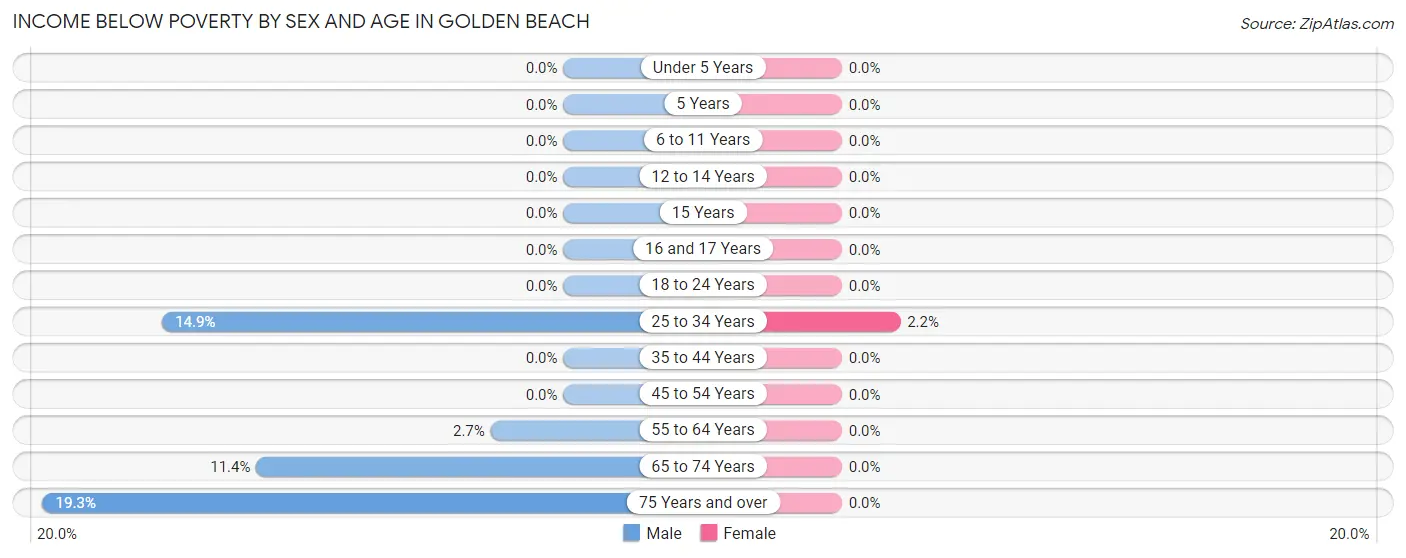
| Age Bracket | Male | Female |
| Under 5 Years | 0 (0.0%) | 0 (0.0%) |
| 5 Years | 0 (0.0%) | 0 (0.0%) |
| 6 to 11 Years | 0 (0.0%) | 0 (0.0%) |
| 12 to 14 Years | 0 (0.0%) | 0 (0.0%) |
| 15 Years | 0 (0.0%) | 0 (0.0%) |
| 16 and 17 Years | 0 (0.0%) | 0 (0.0%) |
| 18 to 24 Years | 0 (0.0%) | 0 (0.0%) |
| 25 to 34 Years | 46 (14.9%) | 9 (2.2%) |
| 35 to 44 Years | 0 (0.0%) | 0 (0.0%) |
| 45 to 54 Years | 0 (0.0%) | 0 (0.0%) |
| 55 to 64 Years | 3 (2.7%) | 0 (0.0%) |
| 65 to 74 Years | 26 (11.4%) | 0 (0.0%) |
| 75 Years and over | 23 (19.3%) | 0 (0.0%) |
| Total | 98 (4.6%) | 9 (0.5%) |
Income Above Poverty by Sex and Age in Golden Beach
According to the poverty statistics in Golden Beach, males aged under 5 years and females aged under 5 years are the age groups that are most secure financially, with 100.0% of males and 100.0% of females in these age groups living above the poverty line.
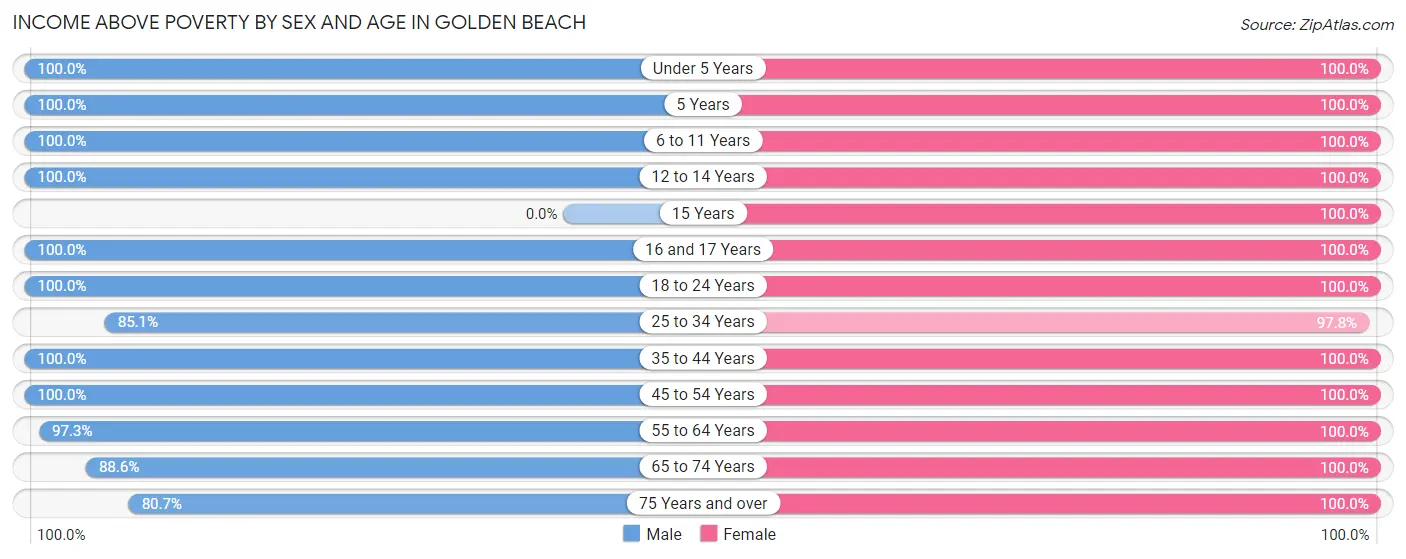
| Age Bracket | Male | Female |
| Under 5 Years | 339 (100.0%) | 101 (100.0%) |
| 5 Years | 36 (100.0%) | 67 (100.0%) |
| 6 to 11 Years | 283 (100.0%) | 192 (100.0%) |
| 12 to 14 Years | 32 (100.0%) | 41 (100.0%) |
| 15 Years | 0 (0.0%) | 19 (100.0%) |
| 16 and 17 Years | 11 (100.0%) | 73 (100.0%) |
| 18 to 24 Years | 143 (100.0%) | 82 (100.0%) |
| 25 to 34 Years | 263 (85.1%) | 405 (97.8%) |
| 35 to 44 Years | 348 (100.0%) | 257 (100.0%) |
| 45 to 54 Years | 189 (100.0%) | 172 (100.0%) |
| 55 to 64 Years | 108 (97.3%) | 188 (100.0%) |
| 65 to 74 Years | 202 (88.6%) | 125 (100.0%) |
| 75 Years and over | 96 (80.7%) | 54 (100.0%) |
| Total | 2,050 (95.4%) | 1,776 (99.5%) |
Income Below Poverty Among Married-Couple Families in Golden Beach
| Children | Above Poverty | Below Poverty |
| No Children | 228 (100.0%) | 0 (0.0%) |
| 1 or 2 Children | 433 (100.0%) | 0 (0.0%) |
| 3 or 4 Children | 134 (100.0%) | 0 (0.0%) |
| 5 or more Children | 0 (0.0%) | 0 (0.0%) |
| Total | 795 (100.0%) | 0 (0.0%) |
Income Below Poverty Among Single-Parent Households in Golden Beach
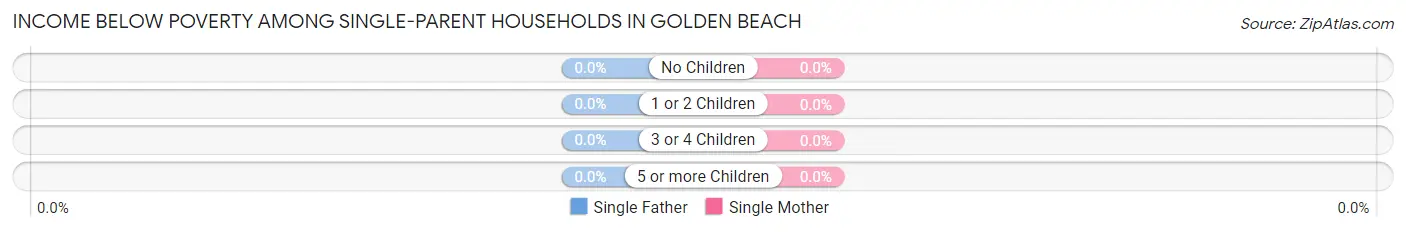
| Children | Single Father | Single Mother |
| No Children | 0 (0.0%) | 0 (0.0%) |
| 1 or 2 Children | 0 (0.0%) | 0 (0.0%) |
| 3 or 4 Children | 0 (0.0%) | 0 (0.0%) |
| 5 or more Children | 0 (0.0%) | 0 (0.0%) |
| Total | 0 (0.0%) | 0 (0.0%) |
Income Below Poverty Among Married-Couple vs Single-Parent Households in Golden Beach
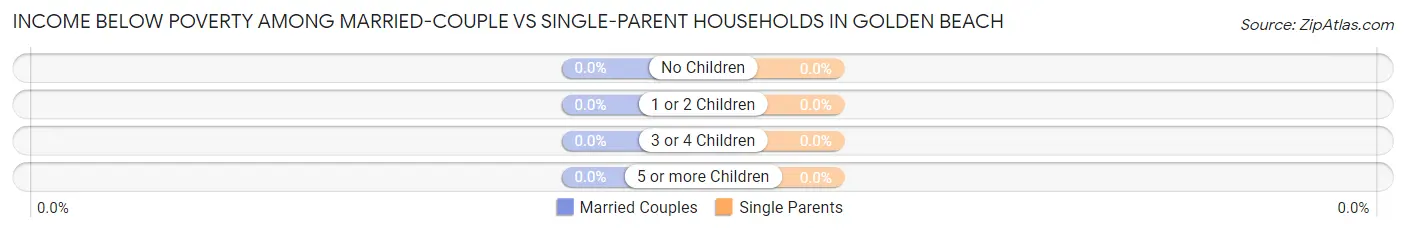
| Children | Married-Couple Families | Single-Parent Households |
| No Children | 0 (0.0%) | 0 (0.0%) |
| 1 or 2 Children | 0 (0.0%) | 0 (0.0%) |
| 3 or 4 Children | 0 (0.0%) | 0 (0.0%) |
| 5 or more Children | 0 (0.0%) | 0 (0.0%) |
| Total | 0 (0.0%) | 0 (0.0%) |
Race in Golden Beach
The most populous races in Golden Beach are White / Caucasian (3,554 | 90.4%), Black / African American (240 | 6.1%), and Hispanic or Latino (145 | 3.7%).
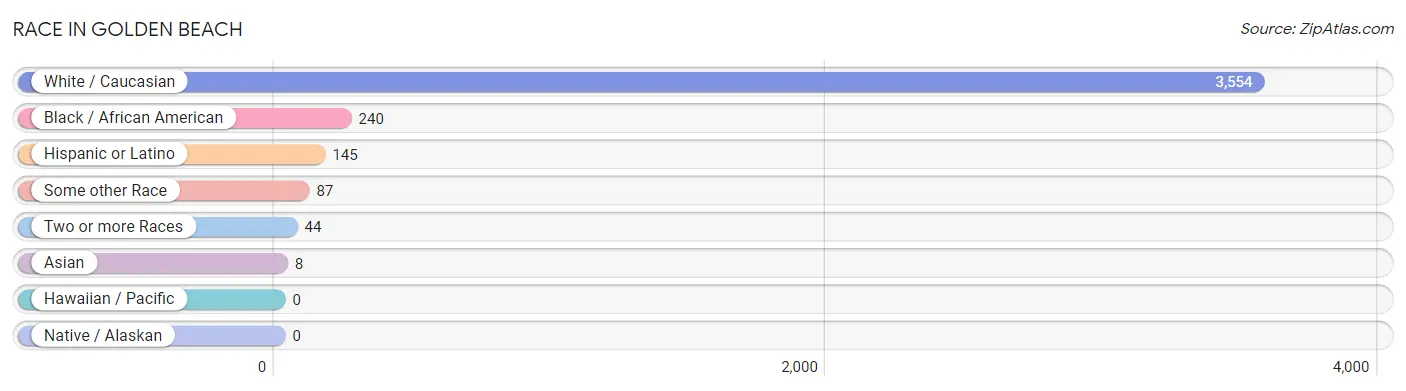
| Race | # Population | % Population |
| Asian | 8 | 0.2% |
| Black / African American | 240 | 6.1% |
| Hawaiian / Pacific | 0 | 0.0% |
| Hispanic or Latino | 145 | 3.7% |
| Native / Alaskan | 0 | 0.0% |
| White / Caucasian | 3,554 | 90.4% |
| Two or more Races | 44 | 1.1% |
| Some other Race | 87 | 2.2% |
| Total | 3,933 | 100.0% |
Ancestry in Golden Beach
The most populous ancestries reported in Golden Beach are Irish (881 | 22.4%), English (545 | 13.9%), German (321 | 8.2%), Polish (192 | 4.9%), and Russian (181 | 4.6%), together accounting for 53.9% of all Golden Beach residents.
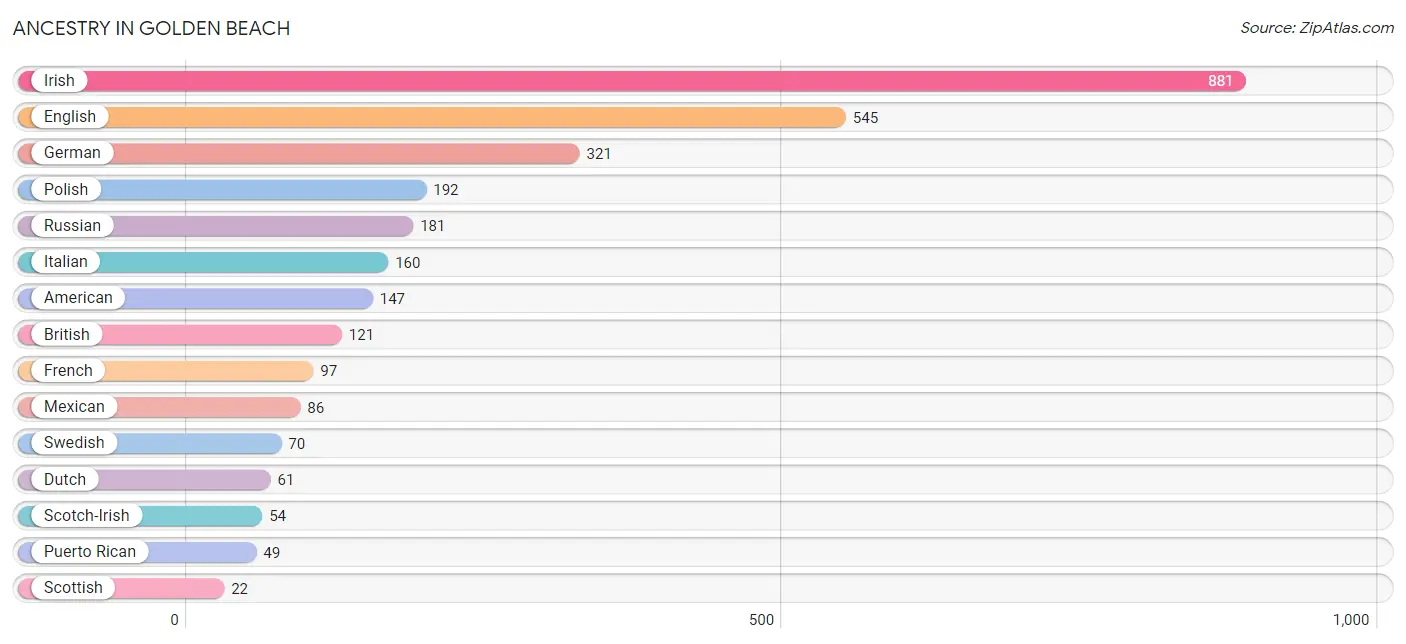
| Ancestry | # Population | % Population |
| American | 147 | 3.7% |
| Blackfeet | 8 | 0.2% |
| British | 121 | 3.1% |
| Burmese | 11 | 0.3% |
| Central American | 10 | 0.3% |
| Dutch | 61 | 1.5% |
| English | 545 | 13.9% |
| French | 97 | 2.5% |
| German | 321 | 8.2% |
| Irish | 881 | 22.4% |
| Italian | 160 | 4.1% |
| Korean | 19 | 0.5% |
| Mexican | 86 | 2.2% |
| Norwegian | 16 | 0.4% |
| Polish | 192 | 4.9% |
| Puerto Rican | 49 | 1.3% |
| Russian | 181 | 4.6% |
| Salvadoran | 10 | 0.3% |
| Scotch-Irish | 54 | 1.4% |
| Scottish | 22 | 0.6% |
| Swedish | 70 | 1.8% |
| Ukrainian | 21 | 0.5% | View All 22 Rows |
Immigrants in Golden Beach
The most numerous immigrant groups reported in Golden Beach came from Central America (7 | 0.2%), Latin America (7 | 0.2%), and Mexico (7 | 0.2%), together accounting for 0.5% of all Golden Beach residents.
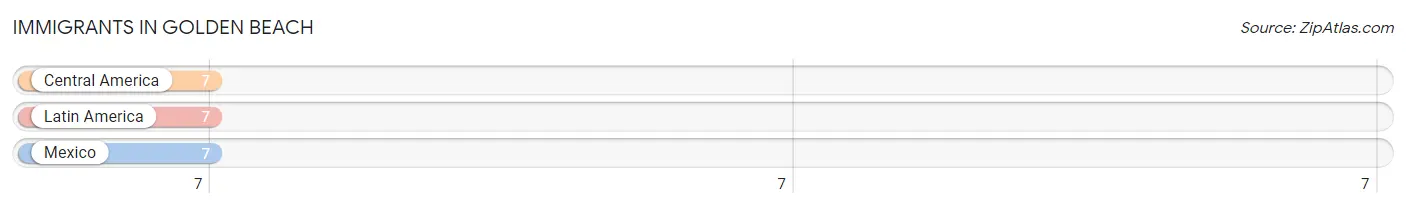
| Immigration Origin | # Population | % Population |
| Central America | 7 | 0.2% |
| Latin America | 7 | 0.2% |
| Mexico | 7 | 0.2% | View All 3 Rows |
Sex and Age in Golden Beach
Sex and Age in Golden Beach
The most populous age groups in Golden Beach are Under 5 Years (339 | 15.8%) for men and 25 to 29 Years (228 | 12.8%) for women.
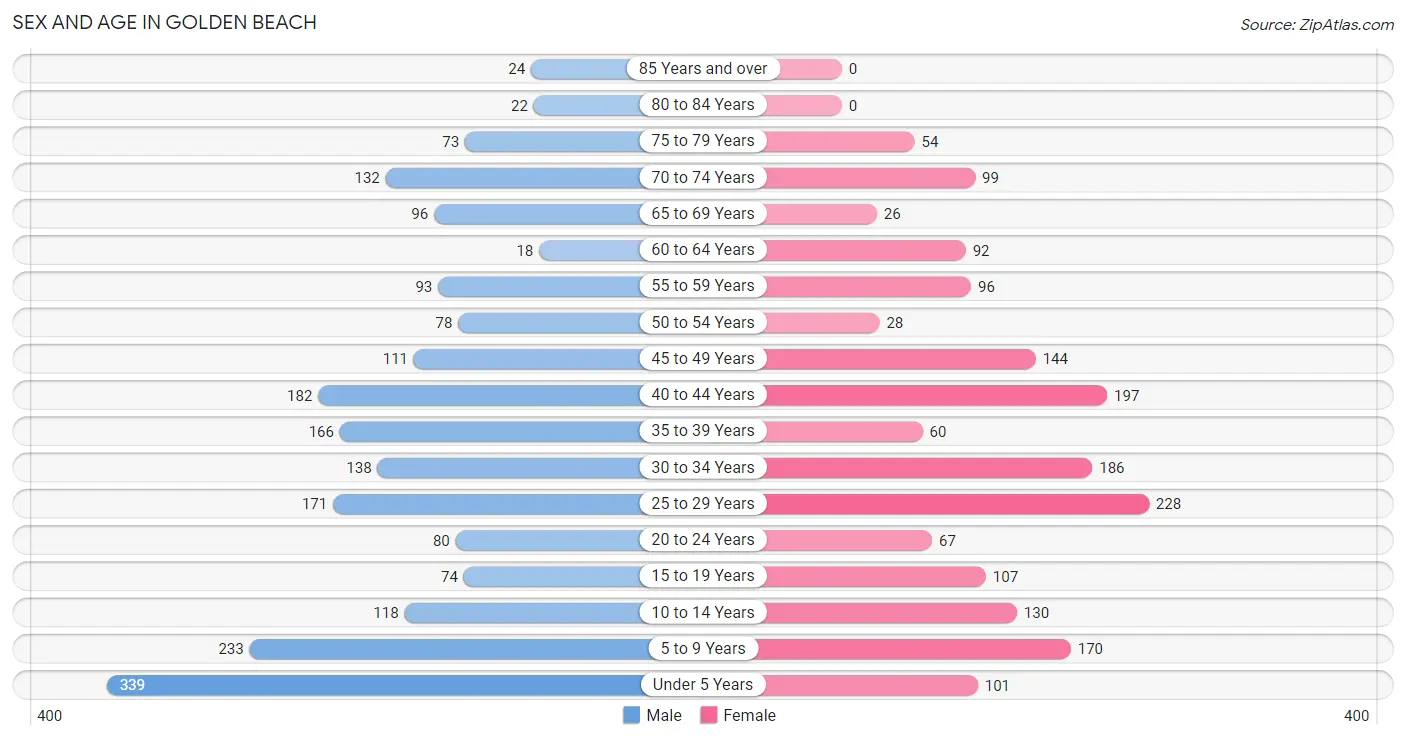
| Age Bracket | Male | Female |
| Under 5 Years | 339 (15.8%) | 101 (5.7%) |
| 5 to 9 Years | 233 (10.8%) | 170 (9.5%) |
| 10 to 14 Years | 118 (5.5%) | 130 (7.3%) |
| 15 to 19 Years | 74 (3.5%) | 107 (6.0%) |
| 20 to 24 Years | 80 (3.7%) | 67 (3.7%) |
| 25 to 29 Years | 171 (8.0%) | 228 (12.8%) |
| 30 to 34 Years | 138 (6.4%) | 186 (10.4%) |
| 35 to 39 Years | 166 (7.7%) | 60 (3.4%) |
| 40 to 44 Years | 182 (8.5%) | 197 (11.0%) |
| 45 to 49 Years | 111 (5.2%) | 144 (8.1%) |
| 50 to 54 Years | 78 (3.6%) | 28 (1.6%) |
| 55 to 59 Years | 93 (4.3%) | 96 (5.4%) |
| 60 to 64 Years | 18 (0.8%) | 92 (5.1%) |
| 65 to 69 Years | 96 (4.5%) | 26 (1.5%) |
| 70 to 74 Years | 132 (6.1%) | 99 (5.6%) |
| 75 to 79 Years | 73 (3.4%) | 54 (3.0%) |
| 80 to 84 Years | 22 (1.0%) | 0 (0.0%) |
| 85 Years and over | 24 (1.1%) | 0 (0.0%) |
| Total | 2,148 (100.0%) | 1,785 (100.0%) |
Families and Households in Golden Beach
Median Family Size in Golden Beach
The median family size in Golden Beach is 3.58 persons per family, with single female/mother families (93 | 9.3%) accounting for the largest median family size of 3.82 persons per family. On the other hand, single male/father families (107 | 10.7%) represent the smallest median family size with 2.67 persons per family.
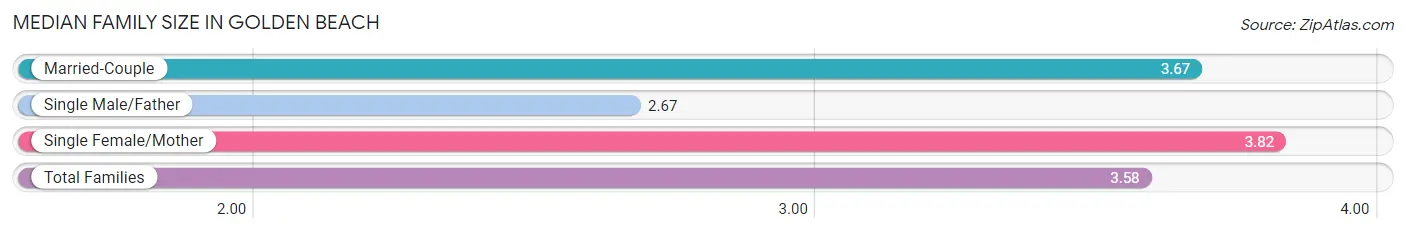
| Family Type | # Families | Family Size |
| Married-Couple | 795 (79.9%) | 3.67 |
| Single Male/Father | 107 (10.7%) | 2.67 |
| Single Female/Mother | 93 (9.3%) | 3.82 |
| Total Families | 995 (100.0%) | 3.58 |
Median Household Size in Golden Beach
The median household size in Golden Beach is 3.15 persons per household, with single female/mother households (93 | 7.4%) accounting for the largest median household size of 4.1 persons per household. non-family households (253 | 20.3%) represent the smallest median household size with 1.15 persons per household.
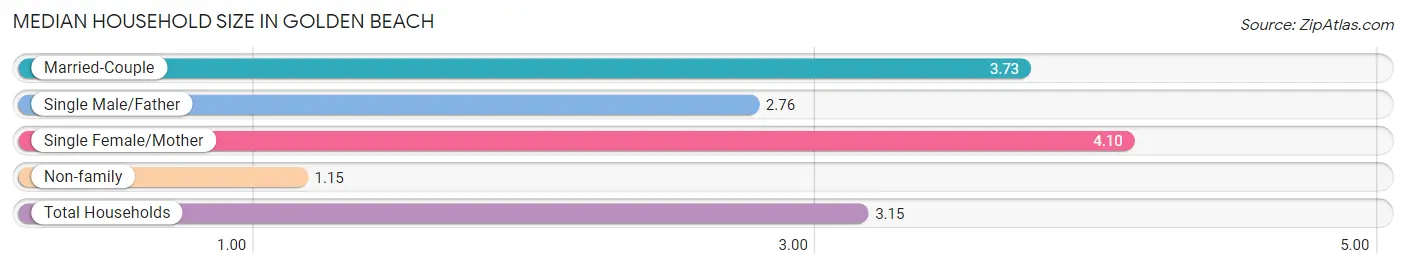
| Household Type | # Households | Household Size |
| Married-Couple | 795 (63.7%) | 3.73 |
| Single Male/Father | 107 (8.6%) | 2.76 |
| Single Female/Mother | 93 (7.4%) | 4.10 |
| Non-family | 253 (20.3%) | 1.15 |
| Total Households | 1,248 (100.0%) | 3.15 |
Household Size by Marriage Status in Golden Beach
Out of a total of 1,248 households in Golden Beach, 995 (79.7%) are family households, while 253 (20.3%) are nonfamily households. The most numerous type of family households are 3-person households, comprising 297, and the most common type of nonfamily households are 1-person households, comprising 200.
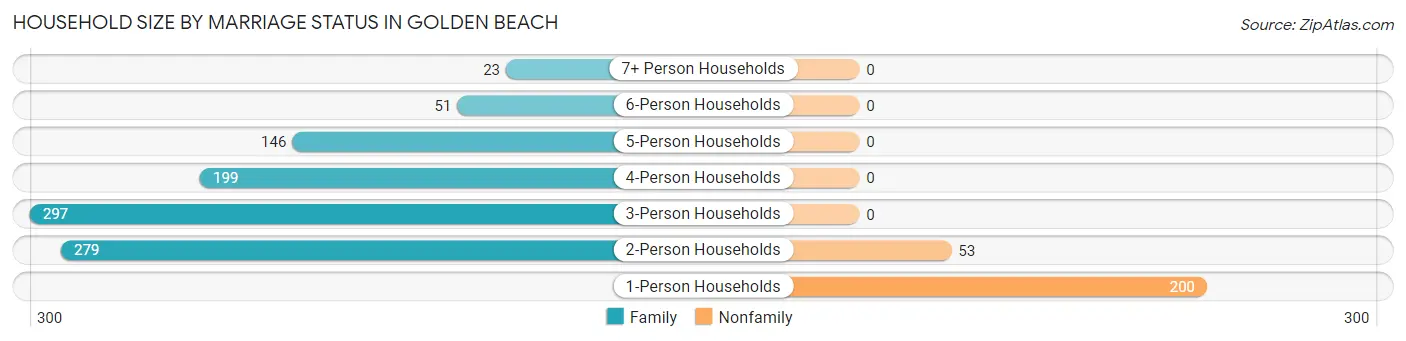
| Household Size | Family Households | Nonfamily Households |
| 1-Person Households | - | 200 (16.0%) |
| 2-Person Households | 279 (22.4%) | 53 (4.3%) |
| 3-Person Households | 297 (23.8%) | 0 (0.0%) |
| 4-Person Households | 199 (16.0%) | 0 (0.0%) |
| 5-Person Households | 146 (11.7%) | 0 (0.0%) |
| 6-Person Households | 51 (4.1%) | 0 (0.0%) |
| 7+ Person Households | 23 (1.8%) | 0 (0.0%) |
| Total | 995 (79.7%) | 253 (20.3%) |
Female Fertility in Golden Beach
Fertility by Age in Golden Beach
Average fertility rate in Golden Beach is 34.0 births per 1,000 women. Women in the age bracket of 20 to 34 years have the highest fertility rate with 71.0 births per 1,000 women. Women in the age bracket of 20 to 34 years acount for 100.0% of all women with births.
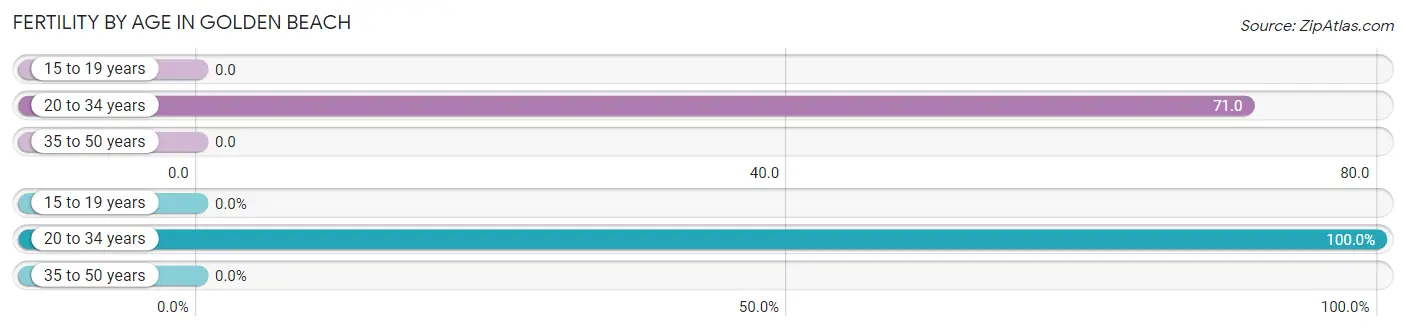
| Age Bracket | Women with Births | Births / 1,000 Women |
| 15 to 19 years | 0 (0.0%) | 0.0 |
| 20 to 34 years | 34 (100.0%) | 71.0 |
| 35 to 50 years | 0 (0.0%) | 0.0 |
| Total | 34 (100.0%) | 34.0 |
Fertility by Age by Marriage Status in Golden Beach
17.6% of women with births (34) in Golden Beach are married. The highest percentage of unmarried women with births falls into 20 to 34 years age bracket with 82.4% of them unmarried at the time of birth, while the lowest percentage of unmarried women with births belong to 20 to 34 years age bracket with 82.4% of them unmarried.
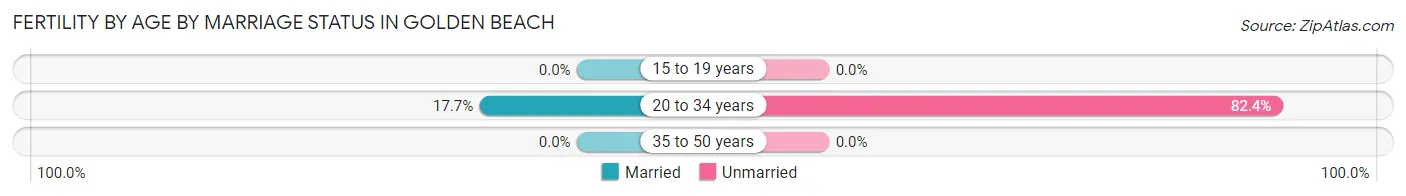
| Age Bracket | Married | Unmarried |
| 15 to 19 years | 0 (0.0%) | 0 (0.0%) |
| 20 to 34 years | 6 (17.6%) | 28 (82.4%) |
| 35 to 50 years | 0 (0.0%) | 0 (0.0%) |
| Total | 6 (17.6%) | 28 (82.4%) |
Fertility by Education in Golden Beach
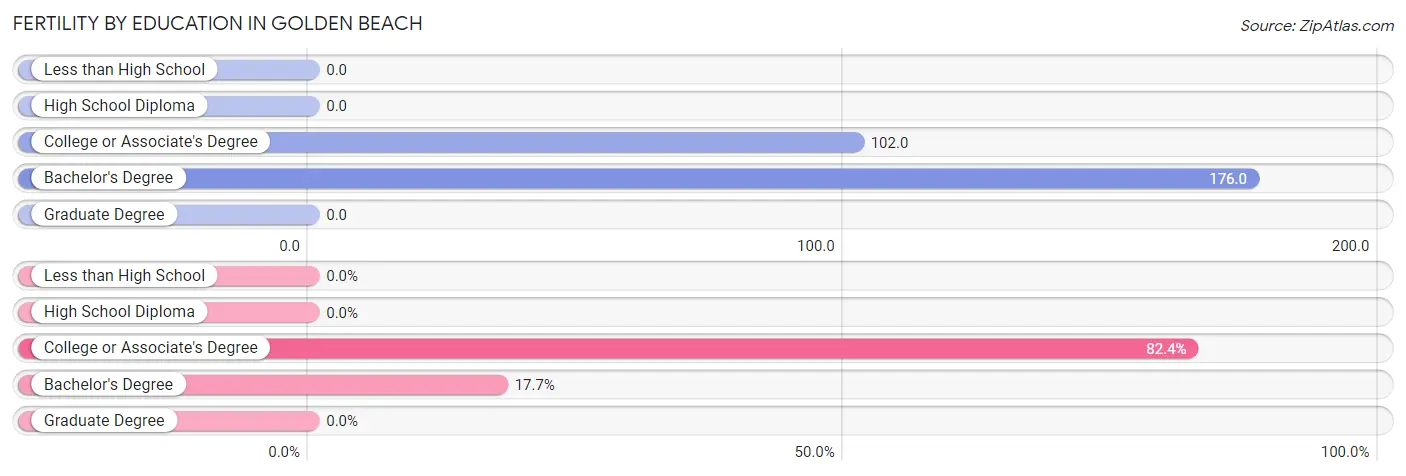
| Educational Attainment | Women with Births | Births / 1,000 Women |
| Less than High School | 0 (0.0%) | 0.0 |
| High School Diploma | 0 (0.0%) | 0.0 |
| College or Associate's Degree | 28 (82.4%) | 102.0 |
| Bachelor's Degree | 6 (17.6%) | 176.0 |
| Graduate Degree | 0 (0.0%) | 0.0 |
| Total | 34 (100.0%) | 34.0 |
Fertility by Education by Marriage Status in Golden Beach
82.4% of women with births in Golden Beach are unmarried. Women with the educational attainment of bachelor's degree are most likely to be married with 100.0% of them married at childbirth, while women with the educational attainment of college or associate's degree are least likely to be married with 100.0% of them unmarried at childbirth.
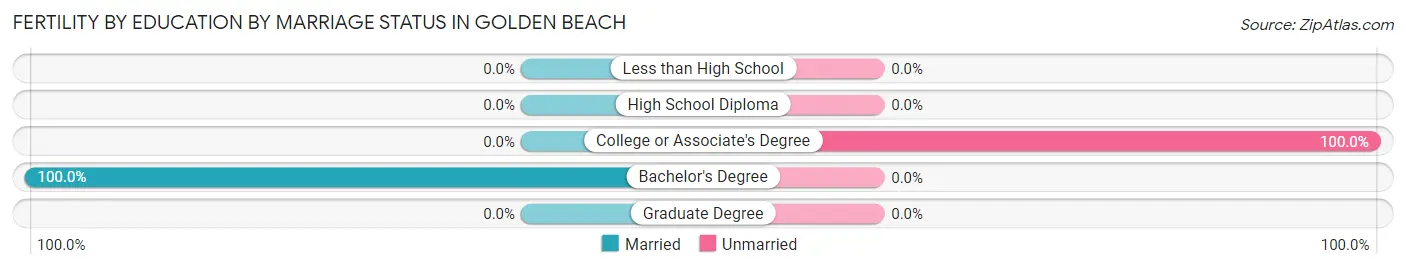
| Educational Attainment | Married | Unmarried |
| Less than High School | 0 (0.0%) | 0 (0.0%) |
| High School Diploma | 0 (0.0%) | 0 (0.0%) |
| College or Associate's Degree | 0 (0.0%) | 28 (100.0%) |
| Bachelor's Degree | 6 (100.0%) | 0 (0.0%) |
| Graduate Degree | 0 (0.0%) | 0 (0.0%) |
| Total | 6 (17.6%) | 28 (82.4%) |
Employment Characteristics in Golden Beach
Employment by Class of Employer in Golden Beach
Among the 1,944 employed individuals in Golden Beach, private company employees (1,210 | 62.2%), federal government employees (271 | 13.9%), and local government employees (181 | 9.3%) make up the most common classes of employment.
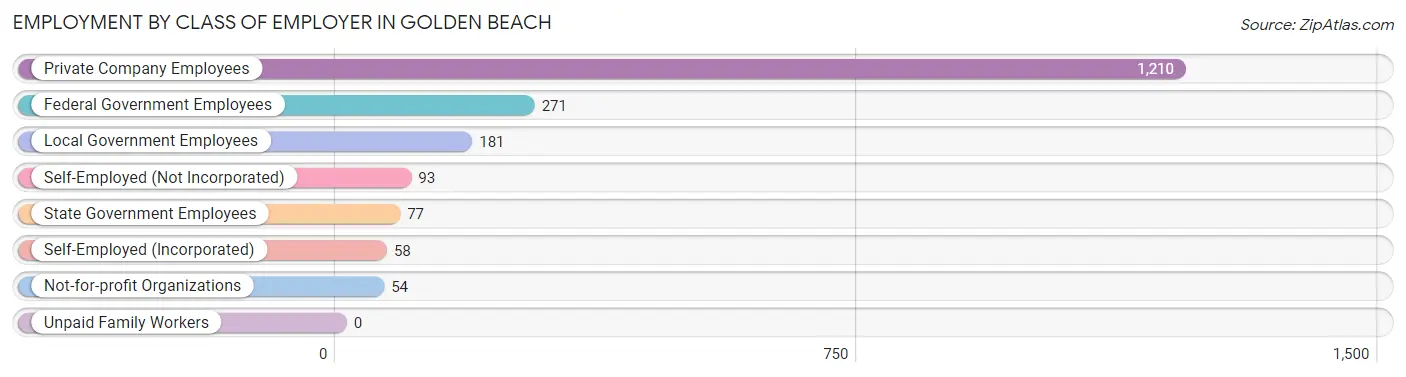
| Employer Class | # Employees | % Employees |
| Private Company Employees | 1,210 | 62.2% |
| Self-Employed (Incorporated) | 58 | 3.0% |
| Self-Employed (Not Incorporated) | 93 | 4.8% |
| Not-for-profit Organizations | 54 | 2.8% |
| Local Government Employees | 181 | 9.3% |
| State Government Employees | 77 | 4.0% |
| Federal Government Employees | 271 | 13.9% |
| Unpaid Family Workers | 0 | 0.0% |
| Total | 1,944 | 100.0% |
Employment Status by Age in Golden Beach
According to the labor force statistics for Golden Beach, out of the total population over 16 years of age (2,823), 70.3% or 1,985 individuals are in the labor force, with 2.1% or 42 of them unemployed. The age group with the highest labor force participation rate is 16 to 19 years, with 93.2% or 151 individuals in the labor force. Within the labor force, the 60 to 64 years age range has the highest percentage of unemployed individuals, with 27.3% or 18 of them being unemployed.
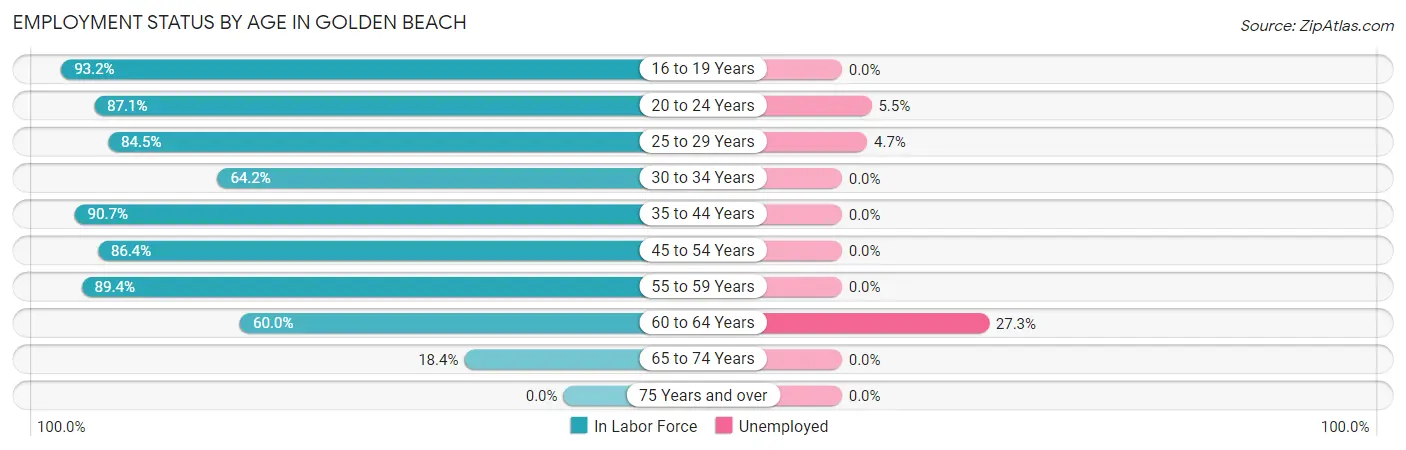
| Age Bracket | In Labor Force | Unemployed |
| 16 to 19 Years | 151 (93.2%) | 0 (0.0%) |
| 20 to 24 Years | 128 (87.1%) | 7 (5.5%) |
| 25 to 29 Years | 337 (84.5%) | 16 (4.7%) |
| 30 to 34 Years | 208 (64.2%) | 0 (0.0%) |
| 35 to 44 Years | 549 (90.7%) | 0 (0.0%) |
| 45 to 54 Years | 312 (86.4%) | 0 (0.0%) |
| 55 to 59 Years | 169 (89.4%) | 0 (0.0%) |
| 60 to 64 Years | 66 (60.0%) | 18 (27.3%) |
| 65 to 74 Years | 65 (18.4%) | 0 (0.0%) |
| 75 Years and over | 0 (0.0%) | 0 (0.0%) |
| Total | 1,985 (70.3%) | 42 (2.1%) |
Employment Status by Educational Attainment in Golden Beach
According to labor force statistics for Golden Beach, 82.5% of individuals (1,640) out of the total population between 25 and 64 years of age (1,988) are in the labor force, with 2.1% or 34 of them being unemployed. The group with the highest labor force participation rate are those with the educational attainment of less than high school, with 90.6% or 116 individuals in the labor force. Within the labor force, individuals with high school diploma education have the highest percentage of unemployment, with 5.1% or 19 of them being unemployed.
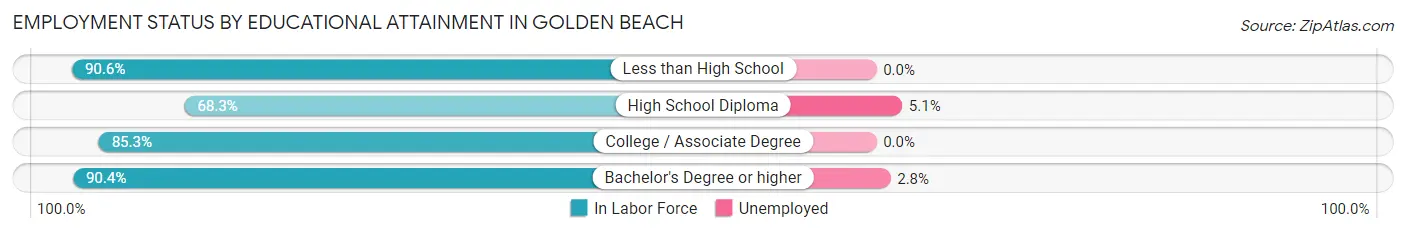
| Educational Attainment | In Labor Force | Unemployed |
| Less than High School | 116 (90.6%) | 0 (0.0%) |
| High School Diploma | 369 (68.3%) | 28 (5.1%) |
| College / Associate Degree | 620 (85.3%) | 0 (0.0%) |
| Bachelor's Degree or higher | 536 (90.4%) | 17 (2.8%) |
| Total | 1,640 (82.5%) | 42 (2.1%) |
Employment Occupations by Sex in Golden Beach
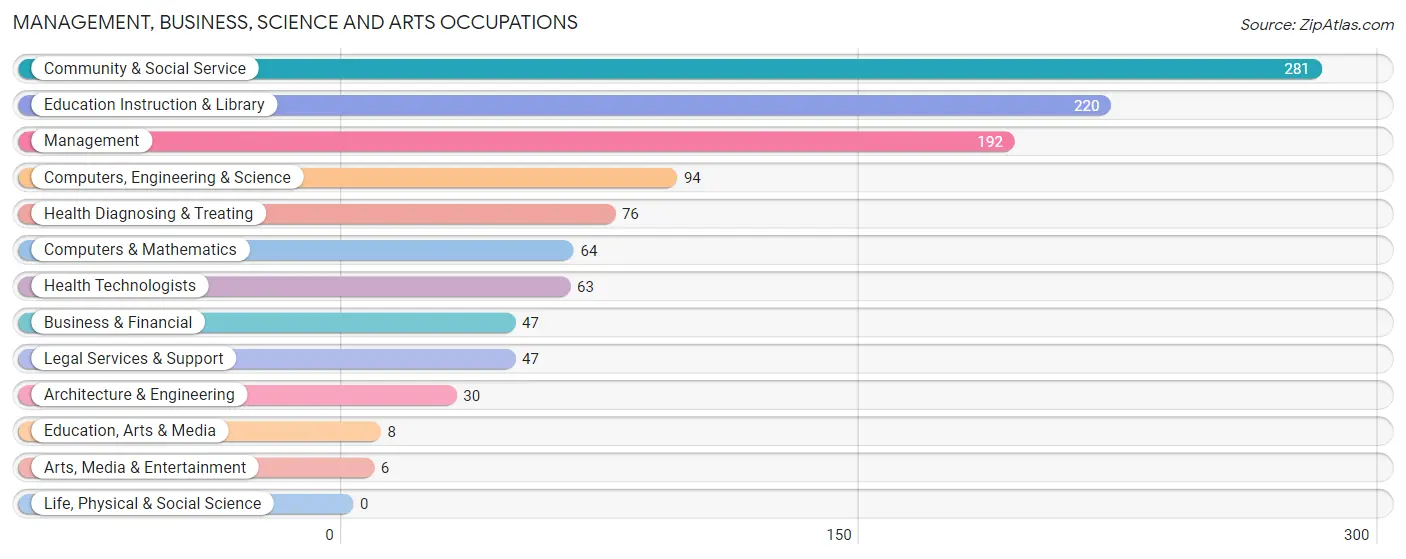
Management, Business, Science and Arts Occupations
The most common Management, Business, Science and Arts occupations in Golden Beach are Community & Social Service (281 | 14.4%), Education Instruction & Library (220 | 11.3%), Management (192 | 9.9%), Computers, Engineering & Science (94 | 4.8%), and Health Diagnosing & Treating (76 | 3.9%).
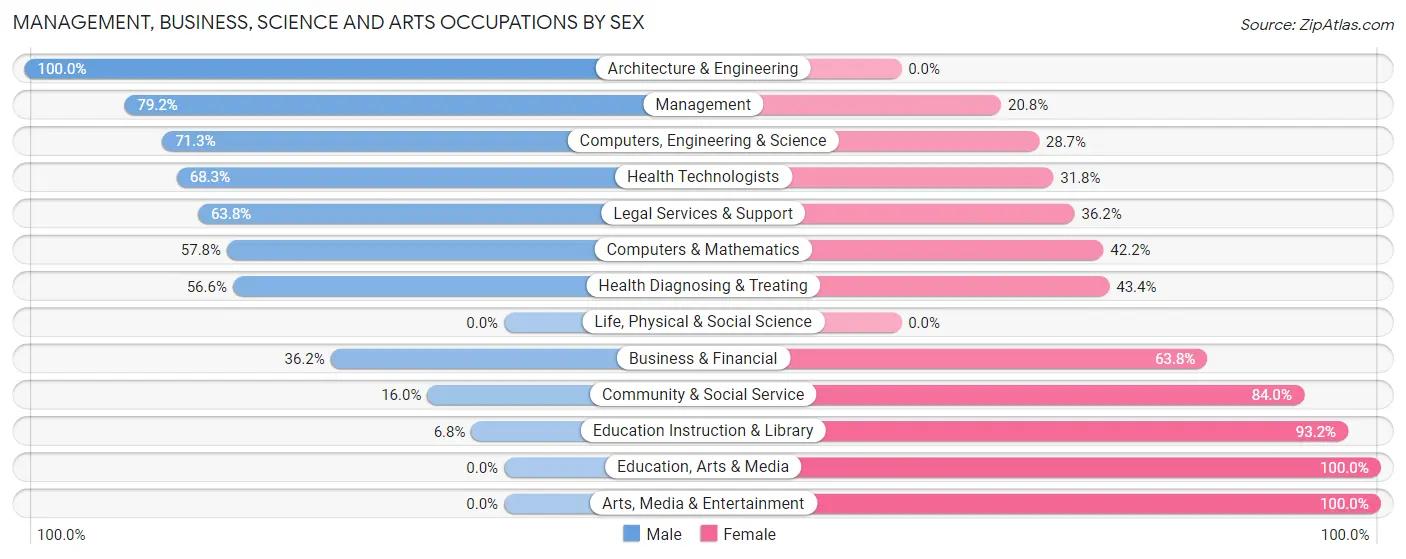
Management, Business, Science and Arts Occupations by Sex
Within the Management, Business, Science and Arts occupations in Golden Beach, the most male-oriented occupations are Architecture & Engineering (100.0%), Management (79.2%), and Computers, Engineering & Science (71.3%), while the most female-oriented occupations are Education, Arts & Media (100.0%), Arts, Media & Entertainment (100.0%), and Education Instruction & Library (93.2%).
| Occupation | Male | Female |
| Management | 152 (79.2%) | 40 (20.8%) |
| Business & Financial | 17 (36.2%) | 30 (63.8%) |
| Computers, Engineering & Science | 67 (71.3%) | 27 (28.7%) |
| Computers & Mathematics | 37 (57.8%) | 27 (42.2%) |
| Architecture & Engineering | 30 (100.0%) | 0 (0.0%) |
| Life, Physical & Social Science | 0 (0.0%) | 0 (0.0%) |
| Community & Social Service | 45 (16.0%) | 236 (84.0%) |
| Education, Arts & Media | 0 (0.0%) | 8 (100.0%) |
| Legal Services & Support | 30 (63.8%) | 17 (36.2%) |
| Education Instruction & Library | 15 (6.8%) | 205 (93.2%) |
| Arts, Media & Entertainment | 0 (0.0%) | 6 (100.0%) |
| Health Diagnosing & Treating | 43 (56.6%) | 33 (43.4%) |
| Health Technologists | 43 (68.2%) | 20 (31.8%) |
| Total (Category) | 324 (47.0%) | 366 (53.0%) |
| Total (Overall) | 1,082 (55.7%) | 862 (44.3%) |
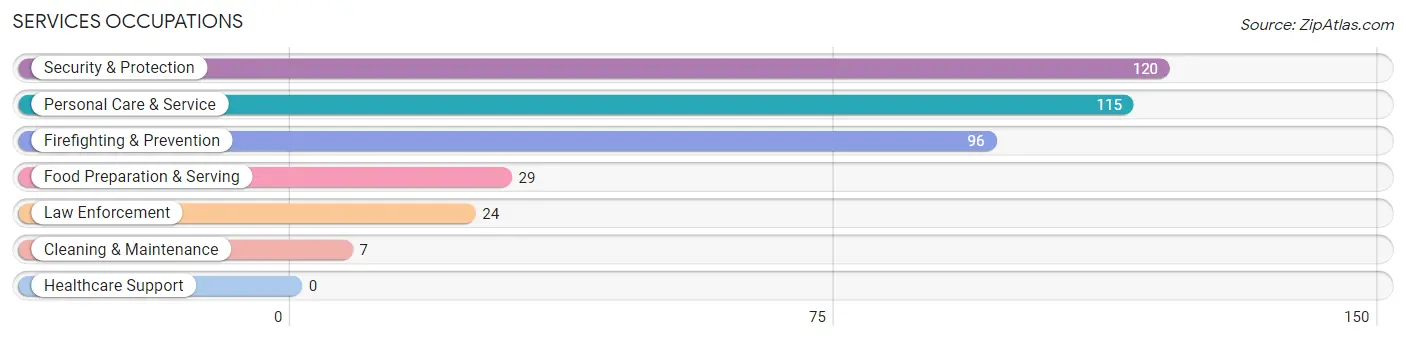
Services Occupations
The most common Services occupations in Golden Beach are Security & Protection (120 | 6.2%), Personal Care & Service (115 | 5.9%), Firefighting & Prevention (96 | 4.9%), Food Preparation & Serving (29 | 1.5%), and Law Enforcement (24 | 1.2%).
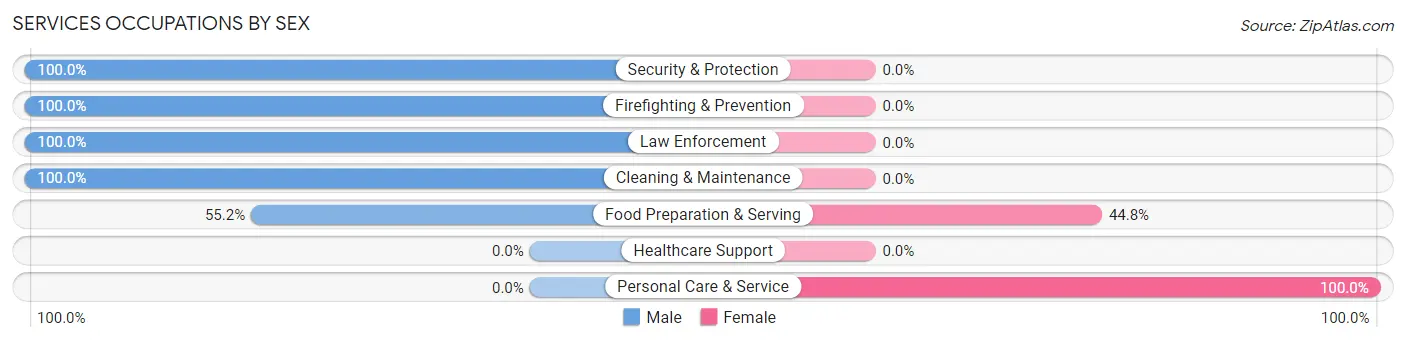
Services Occupations by Sex
Within the Services occupations in Golden Beach, the most male-oriented occupations are Security & Protection (100.0%), Firefighting & Prevention (100.0%), and Law Enforcement (100.0%), while the most female-oriented occupations are Personal Care & Service (100.0%), and Food Preparation & Serving (44.8%).
| Occupation | Male | Female |
| Healthcare Support | 0 (0.0%) | 0 (0.0%) |
| Security & Protection | 120 (100.0%) | 0 (0.0%) |
| Firefighting & Prevention | 96 (100.0%) | 0 (0.0%) |
| Law Enforcement | 24 (100.0%) | 0 (0.0%) |
| Food Preparation & Serving | 16 (55.2%) | 13 (44.8%) |
| Cleaning & Maintenance | 7 (100.0%) | 0 (0.0%) |
| Personal Care & Service | 0 (0.0%) | 115 (100.0%) |
| Total (Category) | 143 (52.8%) | 128 (47.2%) |
| Total (Overall) | 1,082 (55.7%) | 862 (44.3%) |
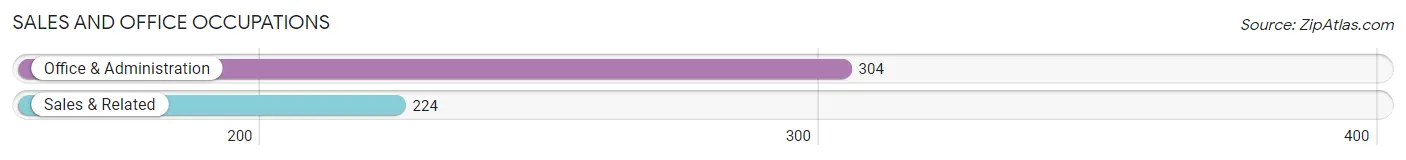
Sales and Office Occupations
The most common Sales and Office occupations in Golden Beach are Office & Administration (304 | 15.6%), and Sales & Related (224 | 11.5%).
Sales and Office Occupations by Sex
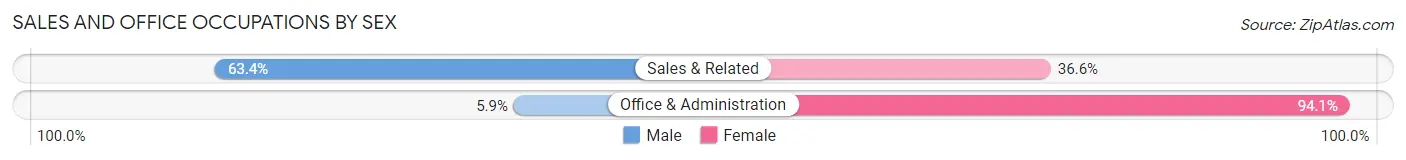
| Occupation | Male | Female |
| Sales & Related | 142 (63.4%) | 82 (36.6%) |
| Office & Administration | 18 (5.9%) | 286 (94.1%) |
| Total (Category) | 160 (30.3%) | 368 (69.7%) |
| Total (Overall) | 1,082 (55.7%) | 862 (44.3%) |
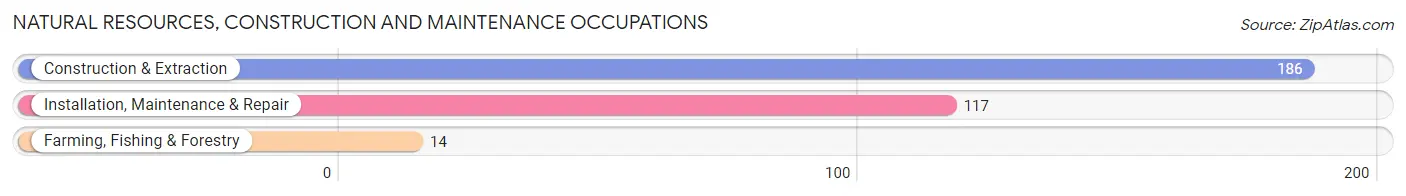
Natural Resources, Construction and Maintenance Occupations
The most common Natural Resources, Construction and Maintenance occupations in Golden Beach are Construction & Extraction (186 | 9.6%), Installation, Maintenance & Repair (117 | 6.0%), and Farming, Fishing & Forestry (14 | 0.7%).
Natural Resources, Construction and Maintenance Occupations by Sex
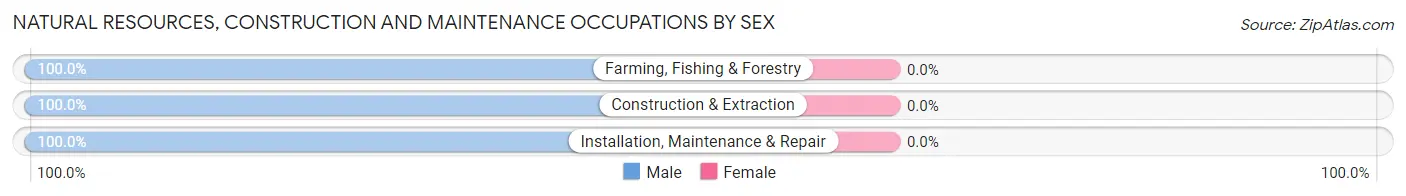
| Occupation | Male | Female |
| Farming, Fishing & Forestry | 14 (100.0%) | 0 (0.0%) |
| Construction & Extraction | 186 (100.0%) | 0 (0.0%) |
| Installation, Maintenance & Repair | 117 (100.0%) | 0 (0.0%) |
| Total (Category) | 317 (100.0%) | 0 (0.0%) |
| Total (Overall) | 1,082 (55.7%) | 862 (44.3%) |
Production, Transportation and Moving Occupations
The most common Production, Transportation and Moving occupations in Golden Beach are Material Moving (63 | 3.2%), Production (38 | 1.9%), and Transportation (37 | 1.9%).
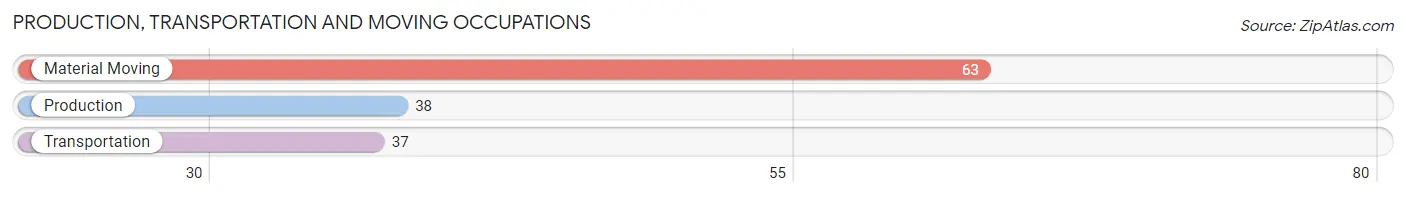
Production, Transportation and Moving Occupations by Sex
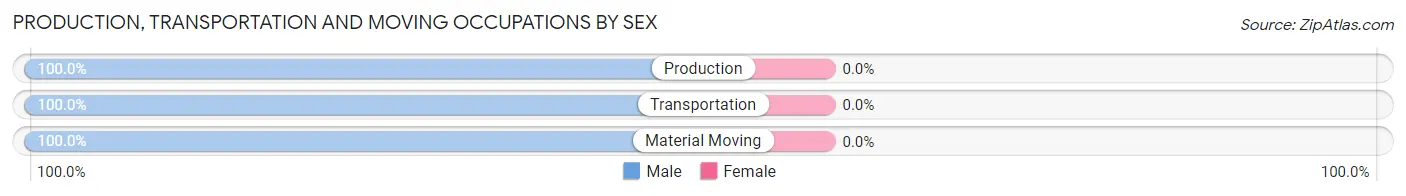
| Occupation | Male | Female |
| Production | 38 (100.0%) | 0 (0.0%) |
| Transportation | 37 (100.0%) | 0 (0.0%) |
| Material Moving | 63 (100.0%) | 0 (0.0%) |
| Total (Category) | 138 (100.0%) | 0 (0.0%) |
| Total (Overall) | 1,082 (55.7%) | 862 (44.3%) |
Employment Industries by Sex in Golden Beach
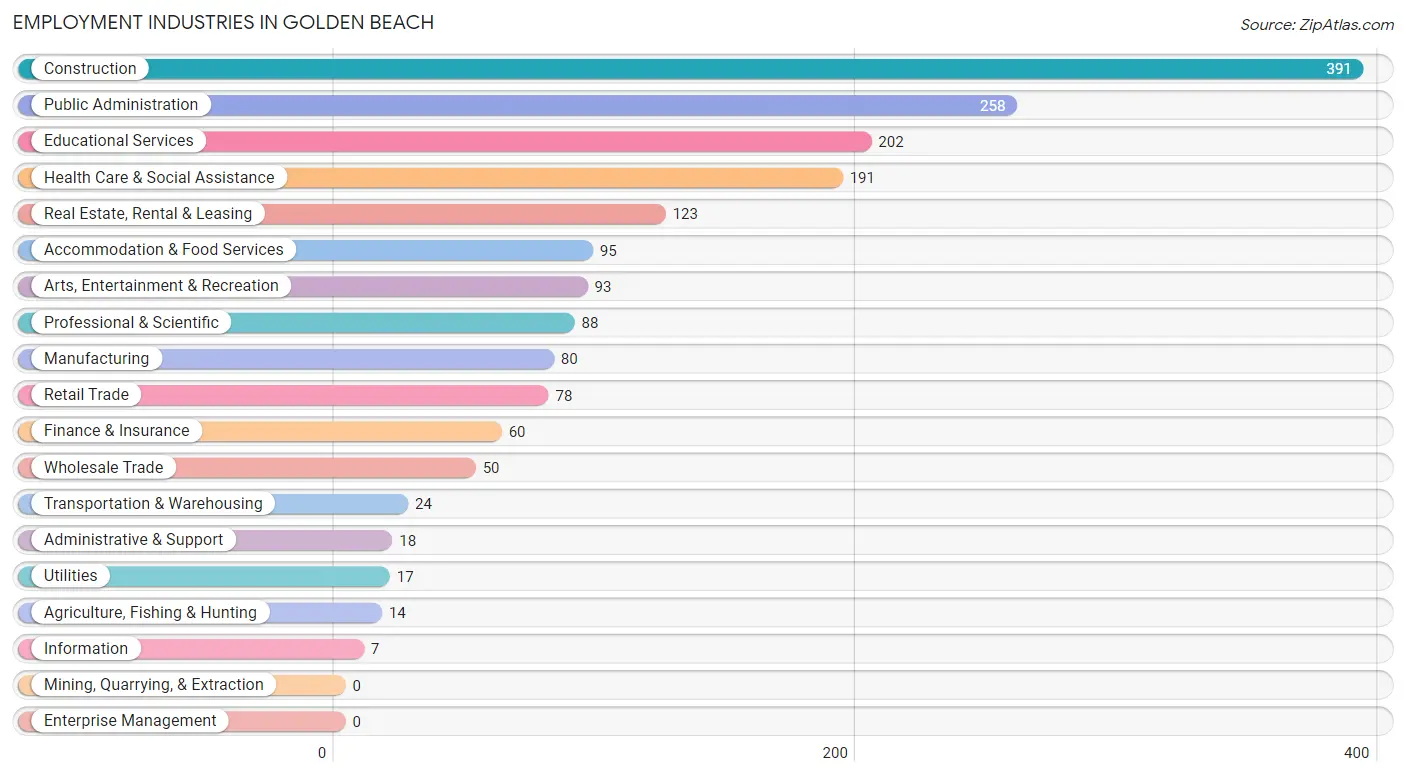
Employment Industries in Golden Beach
The major employment industries in Golden Beach include Construction (391 | 20.1%), Public Administration (258 | 13.3%), Educational Services (202 | 10.4%), Health Care & Social Assistance (191 | 9.8%), and Real Estate, Rental & Leasing (123 | 6.3%).
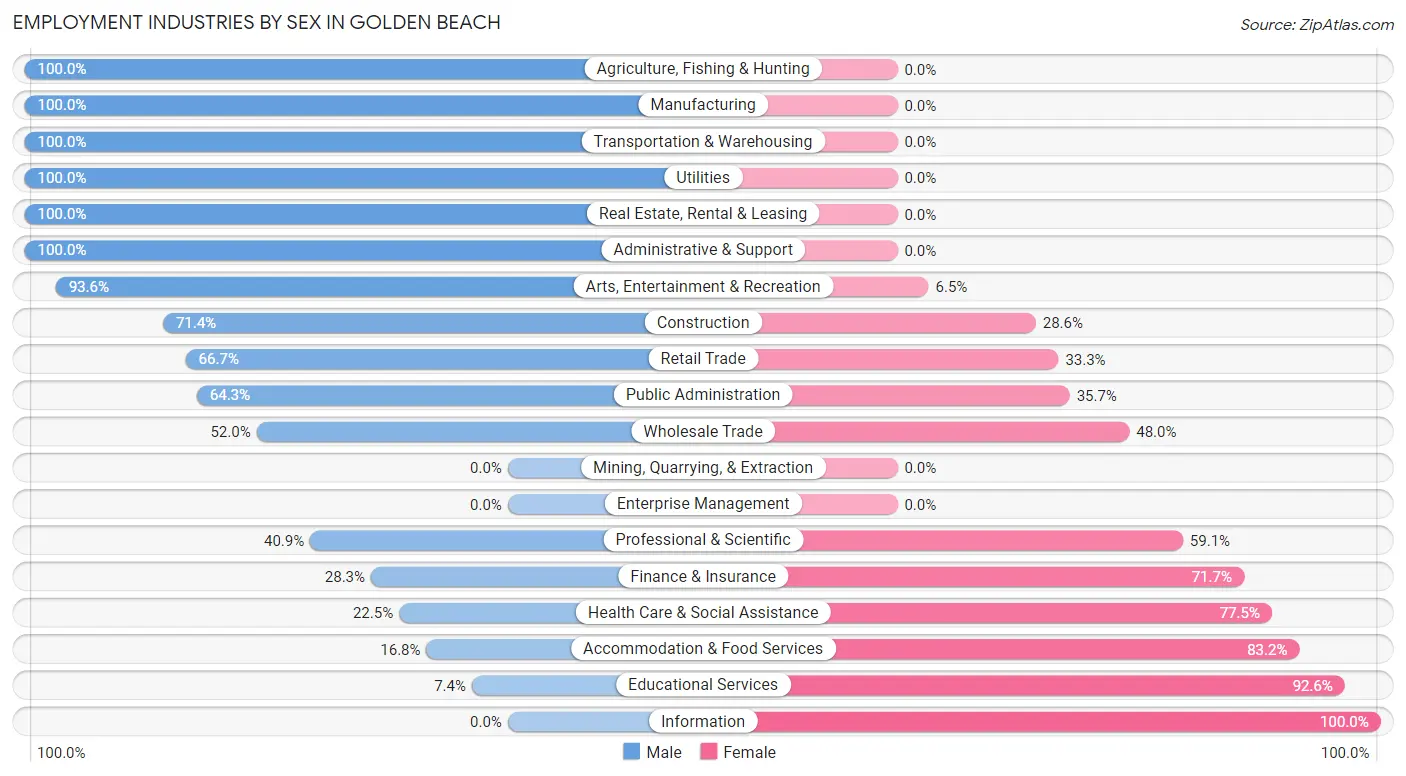
Employment Industries by Sex in Golden Beach
The Golden Beach industries that see more men than women are Agriculture, Fishing & Hunting (100.0%), Manufacturing (100.0%), and Transportation & Warehousing (100.0%), whereas the industries that tend to have a higher number of women are Information (100.0%), Educational Services (92.6%), and Accommodation & Food Services (83.2%).
| Industry | Male | Female |
| Agriculture, Fishing & Hunting | 14 (100.0%) | 0 (0.0%) |
| Mining, Quarrying, & Extraction | 0 (0.0%) | 0 (0.0%) |
| Construction | 279 (71.4%) | 112 (28.6%) |
| Manufacturing | 80 (100.0%) | 0 (0.0%) |
| Wholesale Trade | 26 (52.0%) | 24 (48.0%) |
| Retail Trade | 52 (66.7%) | 26 (33.3%) |
| Transportation & Warehousing | 24 (100.0%) | 0 (0.0%) |
| Utilities | 17 (100.0%) | 0 (0.0%) |
| Information | 0 (0.0%) | 7 (100.0%) |
| Finance & Insurance | 17 (28.3%) | 43 (71.7%) |
| Real Estate, Rental & Leasing | 123 (100.0%) | 0 (0.0%) |
| Professional & Scientific | 36 (40.9%) | 52 (59.1%) |
| Enterprise Management | 0 (0.0%) | 0 (0.0%) |
| Administrative & Support | 18 (100.0%) | 0 (0.0%) |
| Educational Services | 15 (7.4%) | 187 (92.6%) |
| Health Care & Social Assistance | 43 (22.5%) | 148 (77.5%) |
| Arts, Entertainment & Recreation | 87 (93.5%) | 6 (6.5%) |
| Accommodation & Food Services | 16 (16.8%) | 79 (83.2%) |
| Public Administration | 166 (64.3%) | 92 (35.7%) |
| Total | 1,082 (55.7%) | 862 (44.3%) |
Education in Golden Beach
School Enrollment in Golden Beach
The most common levels of schooling among the 896 students in Golden Beach are elementary school (308 | 34.4%), middle school (195 | 21.8%), and high school (135 | 15.1%).
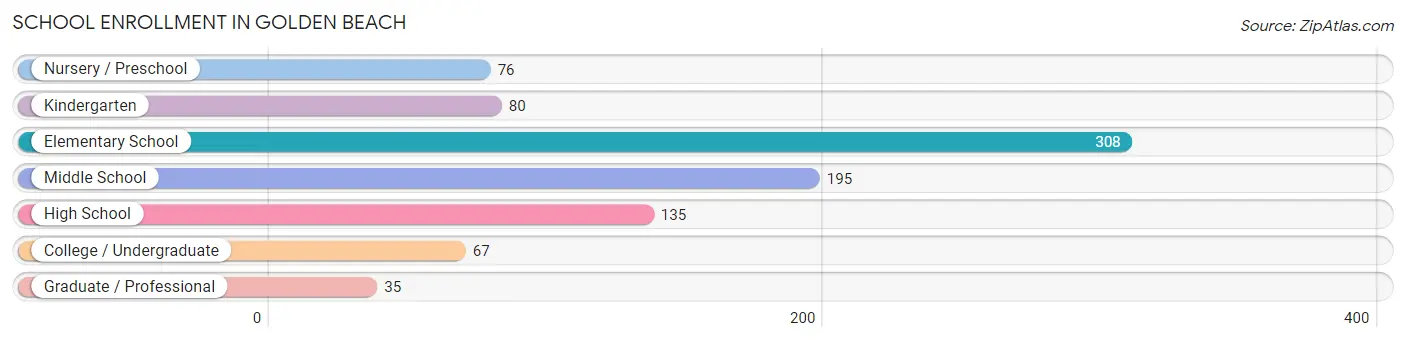
| School Level | # Students | % Students |
| Nursery / Preschool | 76 | 8.5% |
| Kindergarten | 80 | 8.9% |
| Elementary School | 308 | 34.4% |
| Middle School | 195 | 21.8% |
| High School | 135 | 15.1% |
| College / Undergraduate | 67 | 7.5% |
| Graduate / Professional | 35 | 3.9% |
| Total | 896 | 100.0% |
School Enrollment by Age by Funding Source in Golden Beach
Out of a total of 896 students who are enrolled in schools in Golden Beach, 184 (20.5%) attend a private institution, while the remaining 712 (79.5%) are enrolled in public schools. The age group of 3 to 4 year olds has the highest likelihood of being enrolled in private schools, with 40 (100.0% in the age bracket) enrolled. Conversely, the age group of 15 to 17 year olds has the lowest likelihood of being enrolled in a private school, with 103 (100.0% in the age bracket) attending a public institution.
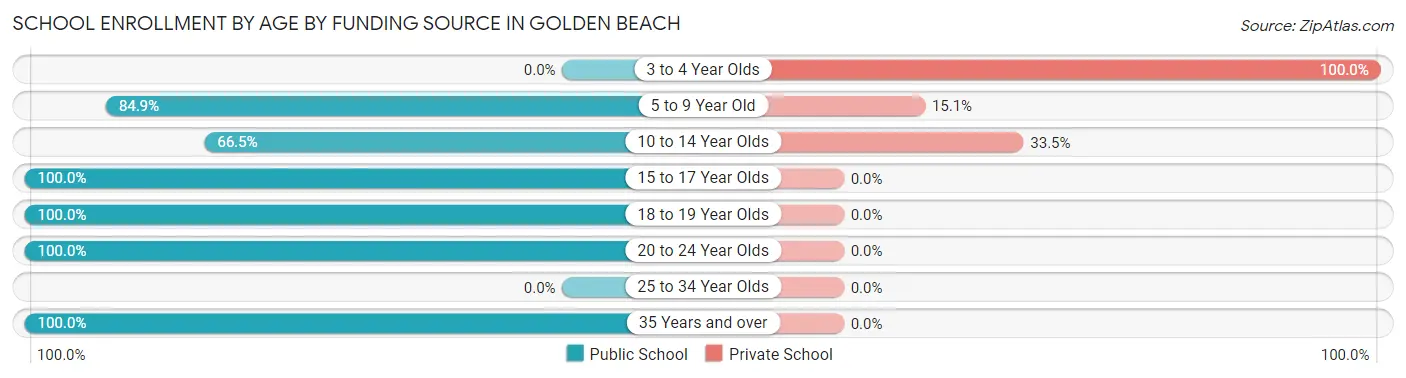
| Age Bracket | Public School | Private School |
| 3 to 4 Year Olds | 0 (0.0%) | 40 (100.0%) |
| 5 to 9 Year Old | 342 (84.9%) | 61 (15.1%) |
| 10 to 14 Year Olds | 165 (66.5%) | 83 (33.5%) |
| 15 to 17 Year Olds | 103 (100.0%) | 0 (0.0%) |
| 18 to 19 Year Olds | 27 (100.0%) | 0 (0.0%) |
| 20 to 24 Year Olds | 40 (100.0%) | 0 (0.0%) |
| 25 to 34 Year Olds | 0 (0.0%) | 0 (0.0%) |
| 35 Years and over | 35 (100.0%) | 0 (0.0%) |
| Total | 712 (79.5%) | 184 (20.5%) |
Educational Attainment by Field of Study in Golden Beach
Arts & humanities (150 | 19.7%), education (135 | 17.8%), physical & health sciences (80 | 10.5%), psychology (65 | 8.6%), and engineering (60 | 7.9%) are the most common fields of study among 760 individuals in Golden Beach who have obtained a bachelor's degree or higher.
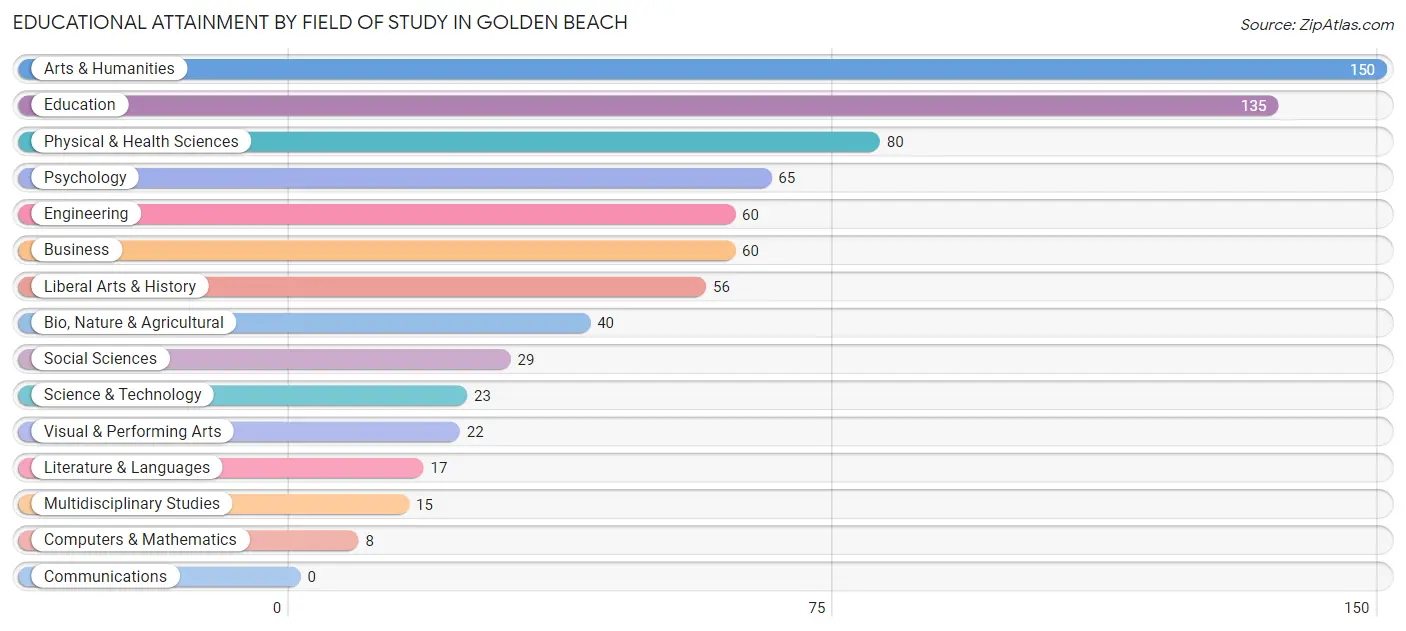
| Field of Study | # Graduates | % Graduates |
| Computers & Mathematics | 8 | 1.1% |
| Bio, Nature & Agricultural | 40 | 5.3% |
| Physical & Health Sciences | 80 | 10.5% |
| Psychology | 65 | 8.6% |
| Social Sciences | 29 | 3.8% |
| Engineering | 60 | 7.9% |
| Multidisciplinary Studies | 15 | 2.0% |
| Science & Technology | 23 | 3.0% |
| Business | 60 | 7.9% |
| Education | 135 | 17.8% |
| Literature & Languages | 17 | 2.2% |
| Liberal Arts & History | 56 | 7.4% |
| Visual & Performing Arts | 22 | 2.9% |
| Communications | 0 | 0.0% |
| Arts & Humanities | 150 | 19.7% |
| Total | 760 | 100.0% |
Transportation & Commute in Golden Beach
Vehicle Availability by Sex in Golden Beach
The most prevalent vehicle ownership categories in Golden Beach are males with 2 vehicles (495, accounting for 45.8%) and females with 2 vehicles (452, making up 57.4%).
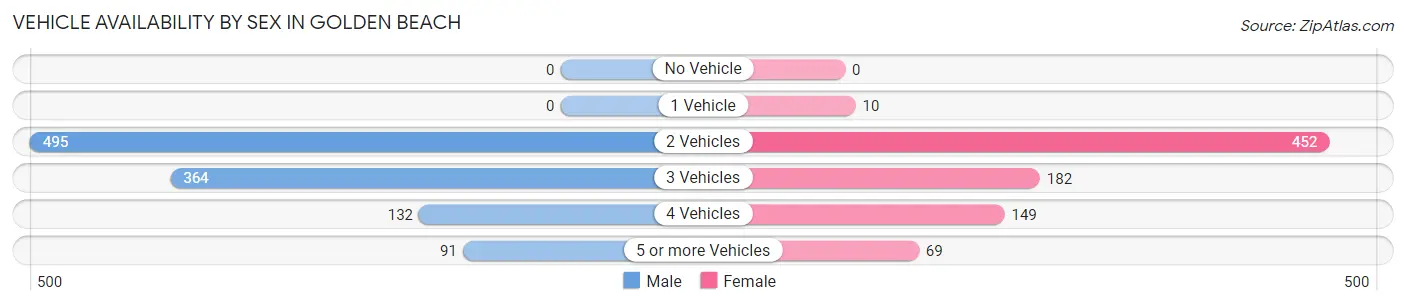
| Vehicles Available | Male | Female |
| No Vehicle | 0 (0.0%) | 0 (0.0%) |
| 1 Vehicle | 0 (0.0%) | 10 (1.2%) |
| 2 Vehicles | 495 (45.8%) | 452 (52.4%) |
| 3 Vehicles | 364 (33.6%) | 182 (21.1%) |
| 4 Vehicles | 132 (12.2%) | 149 (17.3%) |
| 5 or more Vehicles | 91 (8.4%) | 69 (8.0%) |
| Total | 1,082 (100.0%) | 862 (100.0%) |
Commute Time in Golden Beach
The most frequently occuring commute durations in Golden Beach are 60 to 89 minutes (471 commuters, 30.0%), 10 to 14 minutes (264 commuters, 16.8%), and 90 or more minutes (251 commuters, 16.0%).
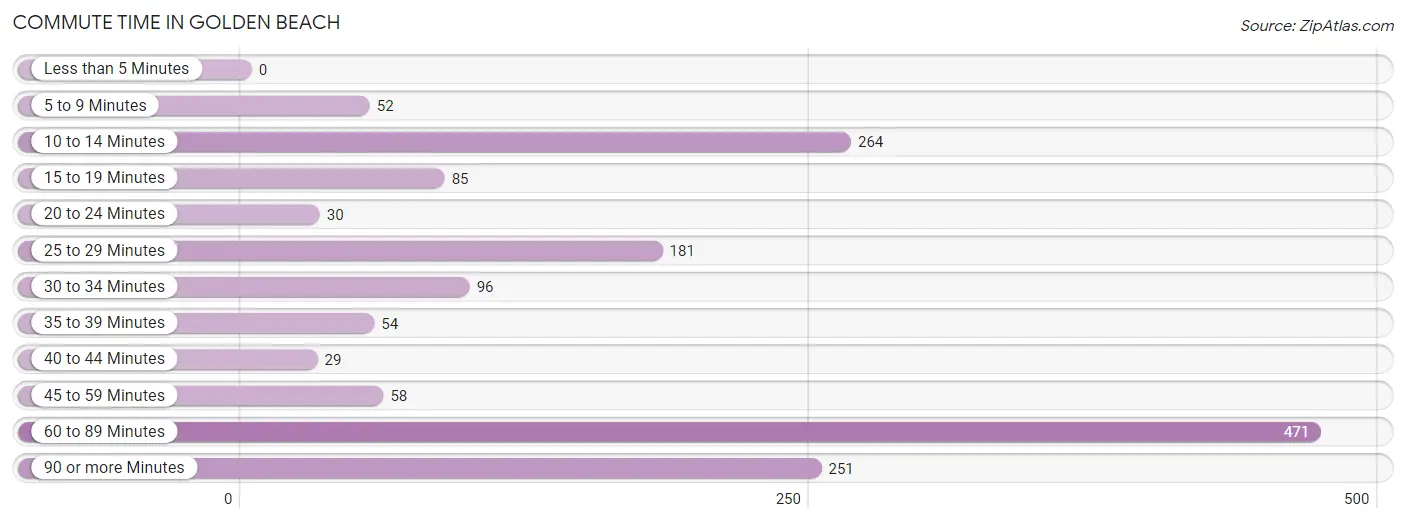
| Commute Time | # Commuters | % Commuters |
| Less than 5 Minutes | 0 | 0.0% |
| 5 to 9 Minutes | 52 | 3.3% |
| 10 to 14 Minutes | 264 | 16.8% |
| 15 to 19 Minutes | 85 | 5.4% |
| 20 to 24 Minutes | 30 | 1.9% |
| 25 to 29 Minutes | 181 | 11.5% |
| 30 to 34 Minutes | 96 | 6.1% |
| 35 to 39 Minutes | 54 | 3.4% |
| 40 to 44 Minutes | 29 | 1.8% |
| 45 to 59 Minutes | 58 | 3.7% |
| 60 to 89 Minutes | 471 | 30.0% |
| 90 or more Minutes | 251 | 16.0% |
Commute Time by Sex in Golden Beach
The most common commute times in Golden Beach are 60 to 89 minutes (430 commuters, 47.8%) for males and 10 to 14 minutes (150 commuters, 22.4%) for females.
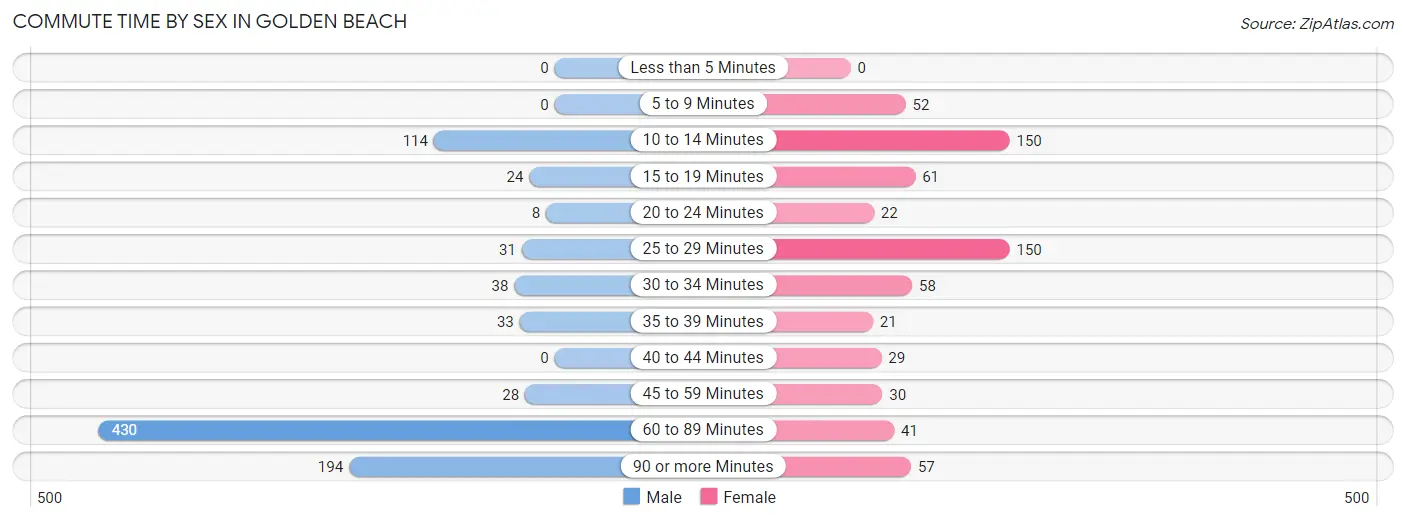
| Commute Time | Male | Female |
| Less than 5 Minutes | 0 (0.0%) | 0 (0.0%) |
| 5 to 9 Minutes | 0 (0.0%) | 52 (7.7%) |
| 10 to 14 Minutes | 114 (12.7%) | 150 (22.4%) |
| 15 to 19 Minutes | 24 (2.7%) | 61 (9.1%) |
| 20 to 24 Minutes | 8 (0.9%) | 22 (3.3%) |
| 25 to 29 Minutes | 31 (3.4%) | 150 (22.4%) |
| 30 to 34 Minutes | 38 (4.2%) | 58 (8.6%) |
| 35 to 39 Minutes | 33 (3.7%) | 21 (3.1%) |
| 40 to 44 Minutes | 0 (0.0%) | 29 (4.3%) |
| 45 to 59 Minutes | 28 (3.1%) | 30 (4.5%) |
| 60 to 89 Minutes | 430 (47.8%) | 41 (6.1%) |
| 90 or more Minutes | 194 (21.6%) | 57 (8.5%) |
Time of Departure to Work by Sex in Golden Beach
The most frequent times of departure to work in Golden Beach are 6:00 AM to 6:29 AM (227, 25.2%) for males and 7:00 AM to 7:29 AM (147, 21.9%) for females.
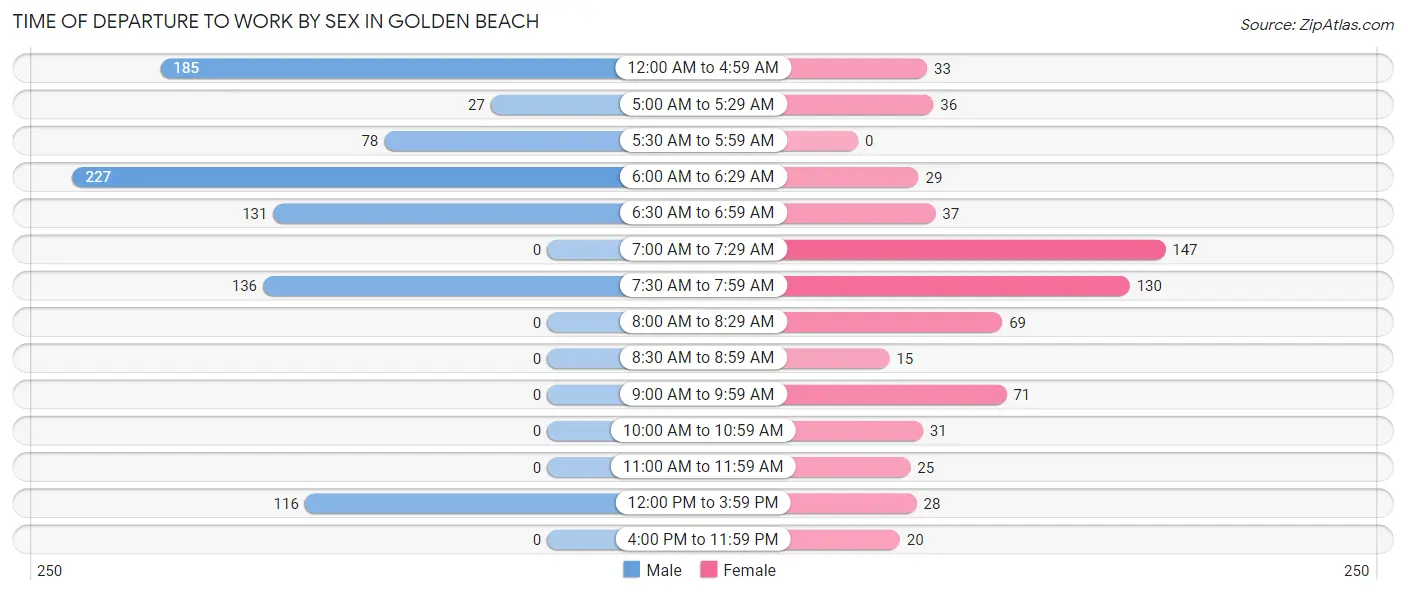
| Time of Departure | Male | Female |
| 12:00 AM to 4:59 AM | 185 (20.6%) | 33 (4.9%) |
| 5:00 AM to 5:29 AM | 27 (3.0%) | 36 (5.4%) |
| 5:30 AM to 5:59 AM | 78 (8.7%) | 0 (0.0%) |
| 6:00 AM to 6:29 AM | 227 (25.2%) | 29 (4.3%) |
| 6:30 AM to 6:59 AM | 131 (14.6%) | 37 (5.5%) |
| 7:00 AM to 7:29 AM | 0 (0.0%) | 147 (21.9%) |
| 7:30 AM to 7:59 AM | 136 (15.1%) | 130 (19.4%) |
| 8:00 AM to 8:29 AM | 0 (0.0%) | 69 (10.3%) |
| 8:30 AM to 8:59 AM | 0 (0.0%) | 15 (2.2%) |
| 9:00 AM to 9:59 AM | 0 (0.0%) | 71 (10.6%) |
| 10:00 AM to 10:59 AM | 0 (0.0%) | 31 (4.6%) |
| 11:00 AM to 11:59 AM | 0 (0.0%) | 25 (3.7%) |
| 12:00 PM to 3:59 PM | 116 (12.9%) | 28 (4.2%) |
| 4:00 PM to 11:59 PM | 0 (0.0%) | 20 (3.0%) |
| Total | 900 (100.0%) | 671 (100.0%) |
Housing Occupancy in Golden Beach
Occupancy by Ownership in Golden Beach
Of the total 1,248 dwellings in Golden Beach, owner-occupied units account for 1,224 (98.1%), while renter-occupied units make up 24 (1.9%).
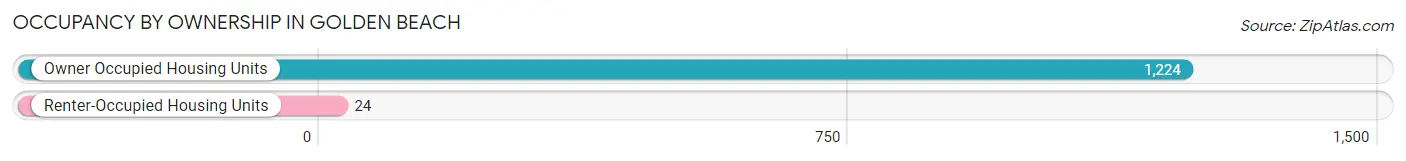
| Occupancy | # Housing Units | % Housing Units |
| Owner Occupied Housing Units | 1,224 | 98.1% |
| Renter-Occupied Housing Units | 24 | 1.9% |
| Total Occupied Housing Units | 1,248 | 100.0% |
Occupancy by Household Size in Golden Beach
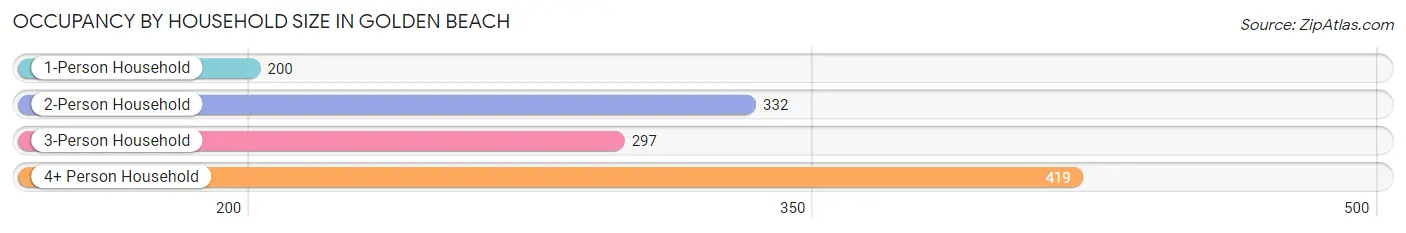
| Household Size | # Housing Units | % Housing Units |
| 1-Person Household | 200 | 16.0% |
| 2-Person Household | 332 | 26.6% |
| 3-Person Household | 297 | 23.8% |
| 4+ Person Household | 419 | 33.6% |
| Total Housing Units | 1,248 | 100.0% |
Occupancy by Ownership by Household Size in Golden Beach
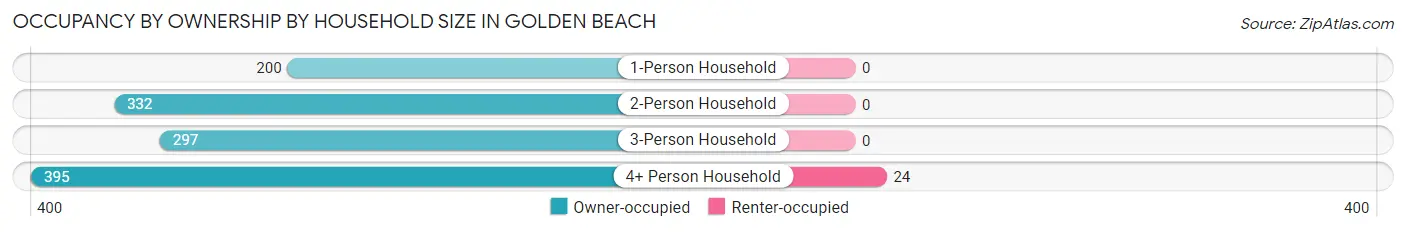
| Household Size | Owner-occupied | Renter-occupied |
| 1-Person Household | 200 (100.0%) | 0 (0.0%) |
| 2-Person Household | 332 (100.0%) | 0 (0.0%) |
| 3-Person Household | 297 (100.0%) | 0 (0.0%) |
| 4+ Person Household | 395 (94.3%) | 24 (5.7%) |
| Total Housing Units | 1,224 (98.1%) | 24 (1.9%) |
Occupancy by Educational Attainment in Golden Beach
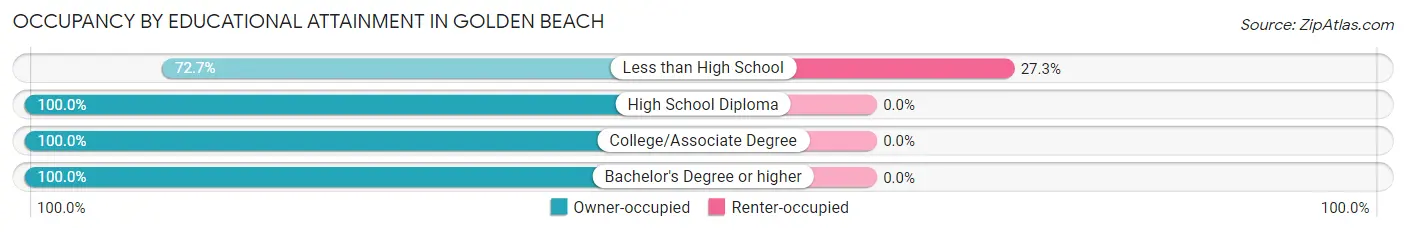
| Household Size | Owner-occupied | Renter-occupied |
| Less than High School | 64 (72.7%) | 24 (27.3%) |
| High School Diploma | 311 (100.0%) | 0 (0.0%) |
| College/Associate Degree | 489 (100.0%) | 0 (0.0%) |
| Bachelor's Degree or higher | 360 (100.0%) | 0 (0.0%) |
Occupancy by Age of Householder in Golden Beach
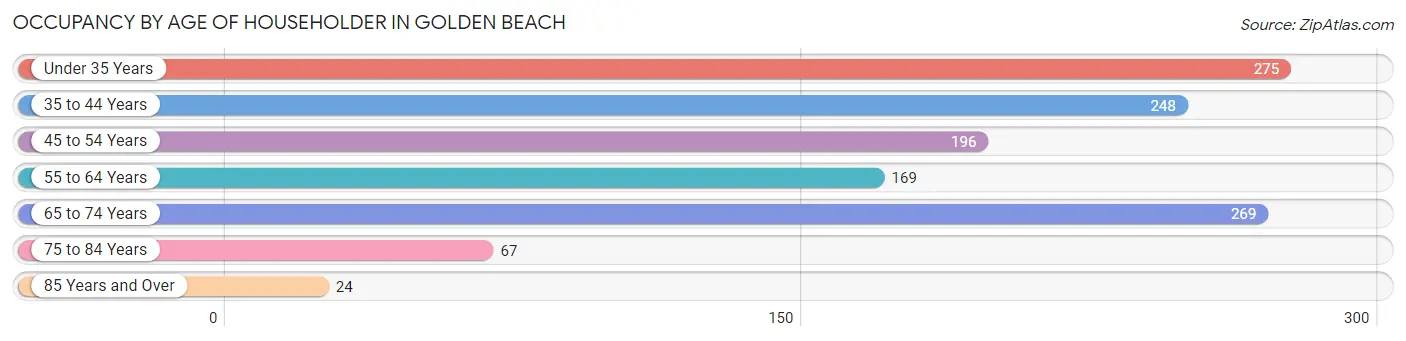
| Age Bracket | # Households | % Households |
| Under 35 Years | 275 | 22.0% |
| 35 to 44 Years | 248 | 19.9% |
| 45 to 54 Years | 196 | 15.7% |
| 55 to 64 Years | 169 | 13.5% |
| 65 to 74 Years | 269 | 21.5% |
| 75 to 84 Years | 67 | 5.4% |
| 85 Years and Over | 24 | 1.9% |
| Total | 1,248 | 100.0% |
Housing Finances in Golden Beach
Median Income by Occupancy in Golden Beach
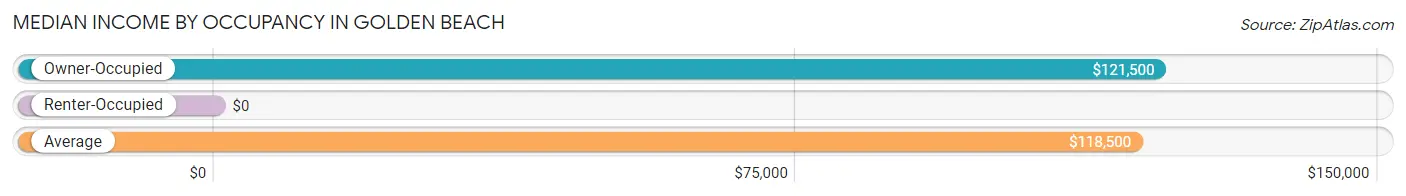
| Occupancy Type | # Households | Median Income |
| Owner-Occupied | 1,224 (98.1%) | $121,500 |
| Renter-Occupied | 24 (1.9%) | $0 |
| Average | 1,248 (100.0%) | $118,500 |
Occupancy by Householder Income Bracket in Golden Beach
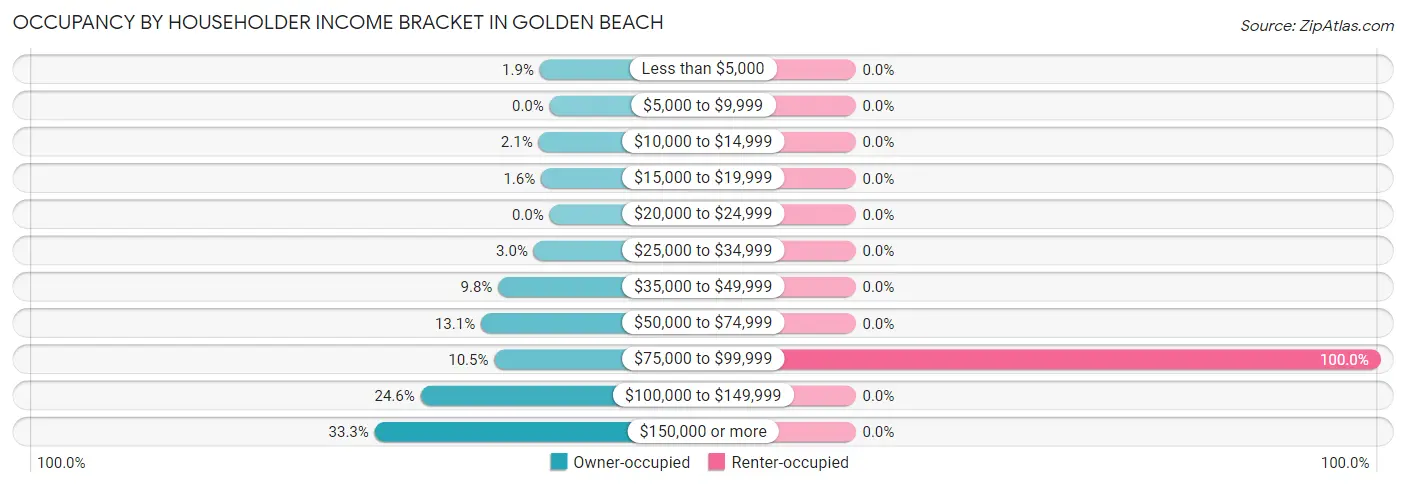
| Income Bracket | Owner-occupied | Renter-occupied |
| Less than $5,000 | 23 (1.9%) | 0 (0.0%) |
| $5,000 to $9,999 | 0 (0.0%) | 0 (0.0%) |
| $10,000 to $14,999 | 26 (2.1%) | 0 (0.0%) |
| $15,000 to $19,999 | 20 (1.6%) | 0 (0.0%) |
| $20,000 to $24,999 | 0 (0.0%) | 0 (0.0%) |
| $25,000 to $34,999 | 37 (3.0%) | 0 (0.0%) |
| $35,000 to $49,999 | 120 (9.8%) | 0 (0.0%) |
| $50,000 to $74,999 | 160 (13.1%) | 0 (0.0%) |
| $75,000 to $99,999 | 129 (10.5%) | 24 (100.0%) |
| $100,000 to $149,999 | 301 (24.6%) | 0 (0.0%) |
| $150,000 or more | 408 (33.3%) | 0 (0.0%) |
| Total | 1,224 (100.0%) | 24 (100.0%) |
Monthly Housing Cost Tiers in Golden Beach
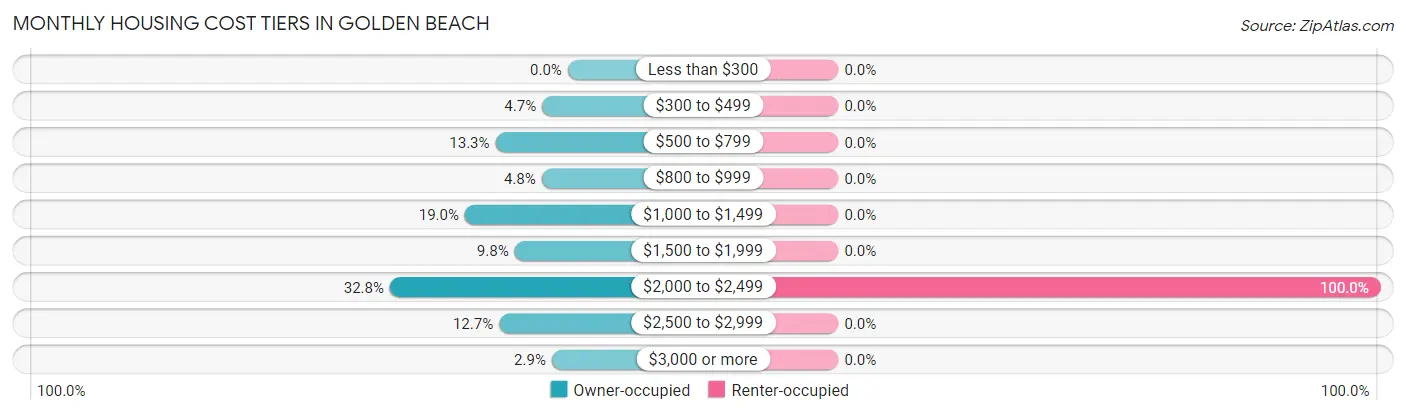
| Monthly Cost | Owner-occupied | Renter-occupied |
| Less than $300 | 0 (0.0%) | 0 (0.0%) |
| $300 to $499 | 58 (4.7%) | 0 (0.0%) |
| $500 to $799 | 163 (13.3%) | 0 (0.0%) |
| $800 to $999 | 59 (4.8%) | 0 (0.0%) |
| $1,000 to $1,499 | 232 (19.0%) | 0 (0.0%) |
| $1,500 to $1,999 | 120 (9.8%) | 0 (0.0%) |
| $2,000 to $2,499 | 401 (32.8%) | 24 (100.0%) |
| $2,500 to $2,999 | 155 (12.7%) | 0 (0.0%) |
| $3,000 or more | 36 (2.9%) | 0 (0.0%) |
| Total | 1,224 (100.0%) | 24 (100.0%) |
Physical Housing Characteristics in Golden Beach
Housing Structures in Golden Beach
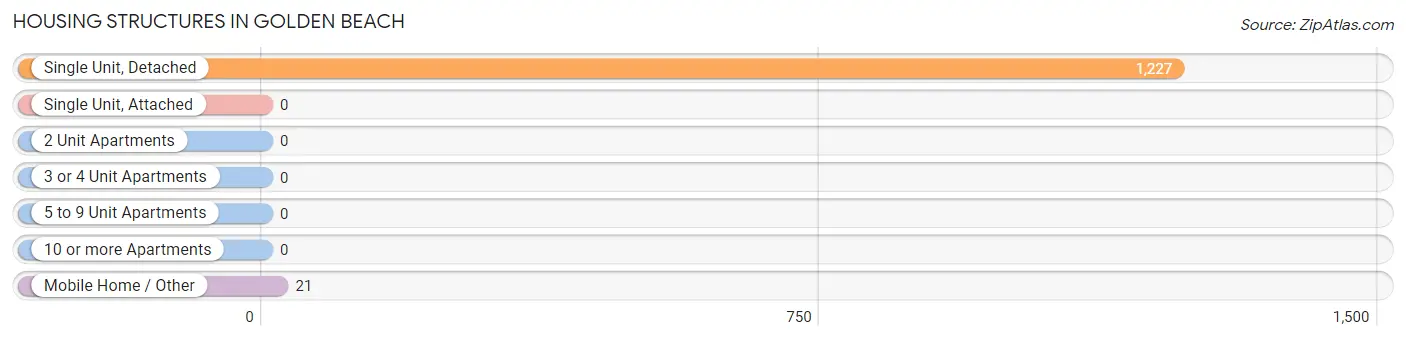
| Structure Type | # Housing Units | % Housing Units |
| Single Unit, Detached | 1,227 | 98.3% |
| Single Unit, Attached | 0 | 0.0% |
| 2 Unit Apartments | 0 | 0.0% |
| 3 or 4 Unit Apartments | 0 | 0.0% |
| 5 to 9 Unit Apartments | 0 | 0.0% |
| 10 or more Apartments | 0 | 0.0% |
| Mobile Home / Other | 21 | 1.7% |
| Total | 1,248 | 100.0% |
Housing Structures by Occupancy in Golden Beach
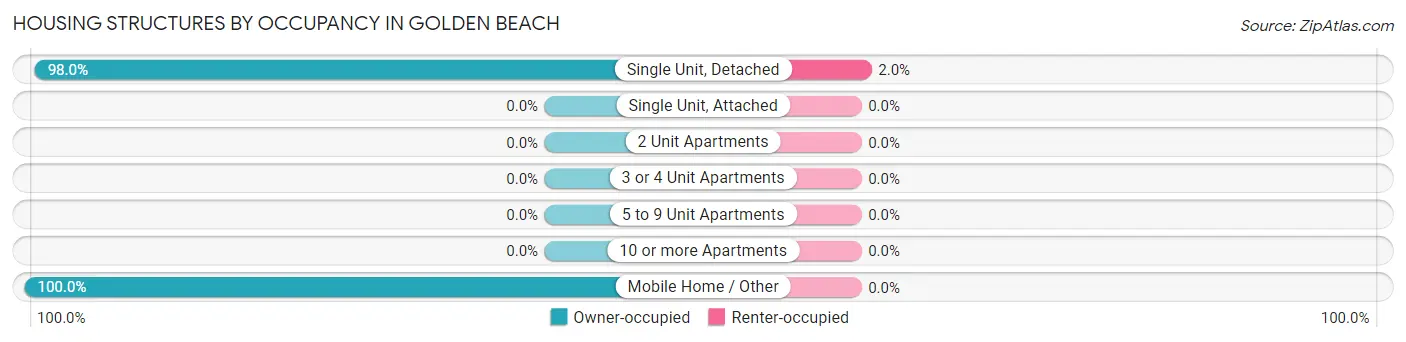
| Structure Type | Owner-occupied | Renter-occupied |
| Single Unit, Detached | 1,203 (98.0%) | 24 (2.0%) |
| Single Unit, Attached | 0 (0.0%) | 0 (0.0%) |
| 2 Unit Apartments | 0 (0.0%) | 0 (0.0%) |
| 3 or 4 Unit Apartments | 0 (0.0%) | 0 (0.0%) |
| 5 to 9 Unit Apartments | 0 (0.0%) | 0 (0.0%) |
| 10 or more Apartments | 0 (0.0%) | 0 (0.0%) |
| Mobile Home / Other | 21 (100.0%) | 0 (0.0%) |
| Total | 1,224 (98.1%) | 24 (1.9%) |
Housing Structures by Number of Rooms in Golden Beach
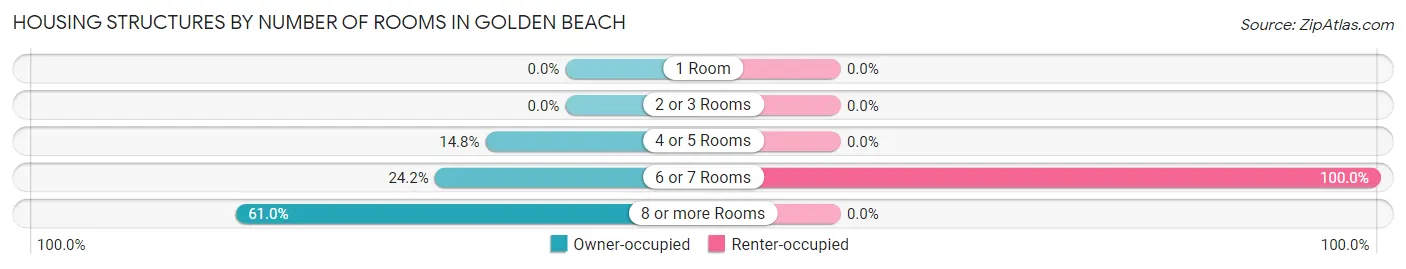
| Number of Rooms | Owner-occupied | Renter-occupied |
| 1 Room | 0 (0.0%) | 0 (0.0%) |
| 2 or 3 Rooms | 0 (0.0%) | 0 (0.0%) |
| 4 or 5 Rooms | 181 (14.8%) | 0 (0.0%) |
| 6 or 7 Rooms | 296 (24.2%) | 24 (100.0%) |
| 8 or more Rooms | 747 (61.0%) | 0 (0.0%) |
| Total | 1,224 (100.0%) | 24 (100.0%) |
Housing Structure by Heating Type in Golden Beach
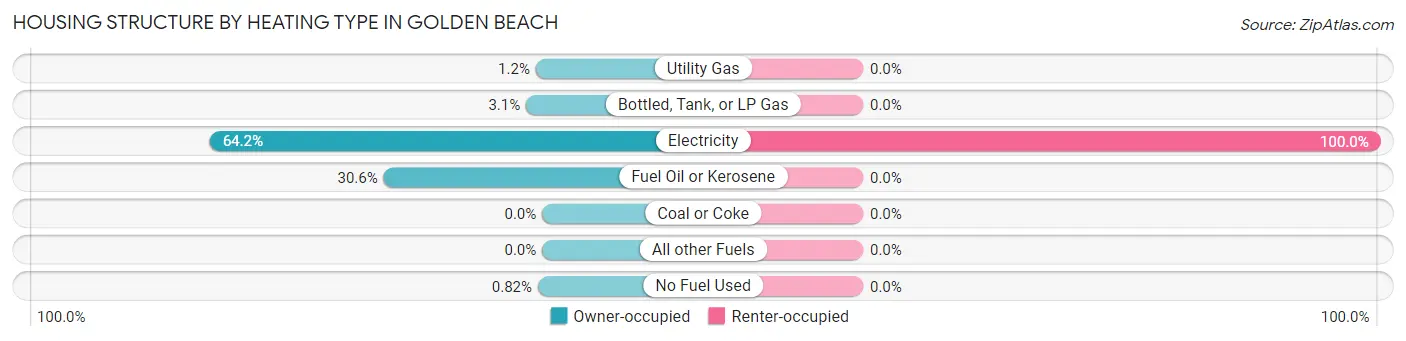
| Heating Type | Owner-occupied | Renter-occupied |
| Utility Gas | 15 (1.2%) | 0 (0.0%) |
| Bottled, Tank, or LP Gas | 38 (3.1%) | 0 (0.0%) |
| Electricity | 786 (64.2%) | 24 (100.0%) |
| Fuel Oil or Kerosene | 375 (30.6%) | 0 (0.0%) |
| Coal or Coke | 0 (0.0%) | 0 (0.0%) |
| All other Fuels | 0 (0.0%) | 0 (0.0%) |
| No Fuel Used | 10 (0.8%) | 0 (0.0%) |
| Total | 1,224 (100.0%) | 24 (100.0%) |
Household Vehicle Usage in Golden Beach
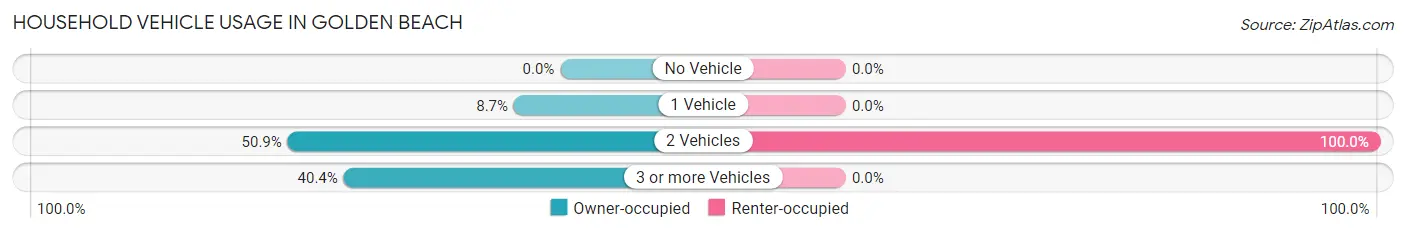
| Vehicles per Household | Owner-occupied | Renter-occupied |
| No Vehicle | 0 (0.0%) | 0 (0.0%) |
| 1 Vehicle | 106 (8.7%) | 0 (0.0%) |
| 2 Vehicles | 623 (50.9%) | 24 (100.0%) |
| 3 or more Vehicles | 495 (40.4%) | 0 (0.0%) |
| Total | 1,224 (100.0%) | 24 (100.0%) |
Real Estate & Mortgages in Golden Beach
Real Estate and Mortgage Overview in Golden Beach
| Characteristic | Without Mortgage | With Mortgage |
| Housing Units | 209 | 1,015 |
| Median Property Value | $395,500 | $342,900 |
| Median Household Income | $84,107 | $366 |
| Monthly Housing Costs | $628 | $36 |
| Real Estate Taxes | $3,061 | $10 |
Property Value by Mortgage Status in Golden Beach
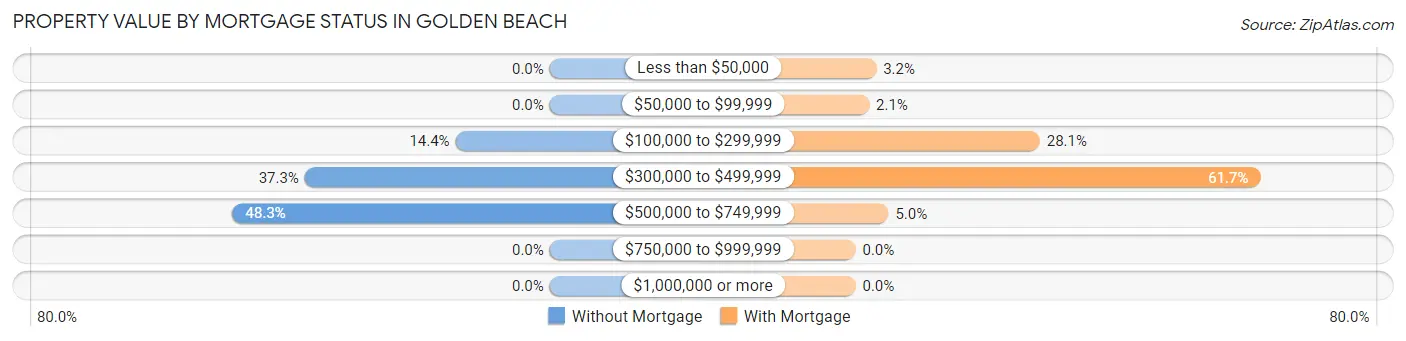
| Property Value | Without Mortgage | With Mortgage |
| Less than $50,000 | 0 (0.0%) | 32 (3.2%) |
| $50,000 to $99,999 | 0 (0.0%) | 21 (2.1%) |
| $100,000 to $299,999 | 30 (14.3%) | 285 (28.1%) |
| $300,000 to $499,999 | 78 (37.3%) | 626 (61.7%) |
| $500,000 to $749,999 | 101 (48.3%) | 51 (5.0%) |
| $750,000 to $999,999 | 0 (0.0%) | 0 (0.0%) |
| $1,000,000 or more | 0 (0.0%) | 0 (0.0%) |
| Total | 209 (100.0%) | 1,015 (100.0%) |
Household Income by Mortgage Status in Golden Beach
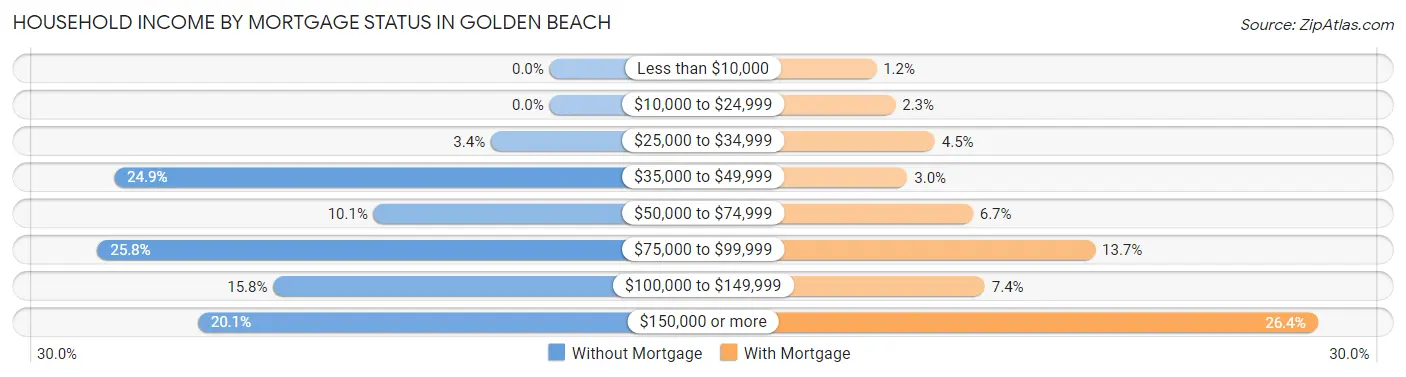
| Household Income | Without Mortgage | With Mortgage |
| Less than $10,000 | 0 (0.0%) | 12 (1.2%) |
| $10,000 to $24,999 | 0 (0.0%) | 23 (2.3%) |
| $25,000 to $34,999 | 7 (3.4%) | 46 (4.5%) |
| $35,000 to $49,999 | 52 (24.9%) | 30 (3.0%) |
| $50,000 to $74,999 | 21 (10.1%) | 68 (6.7%) |
| $75,000 to $99,999 | 54 (25.8%) | 139 (13.7%) |
| $100,000 to $149,999 | 33 (15.8%) | 75 (7.4%) |
| $150,000 or more | 42 (20.1%) | 268 (26.4%) |
| Total | 209 (100.0%) | 1,015 (100.0%) |
Property Value to Household Income Ratio in Golden Beach
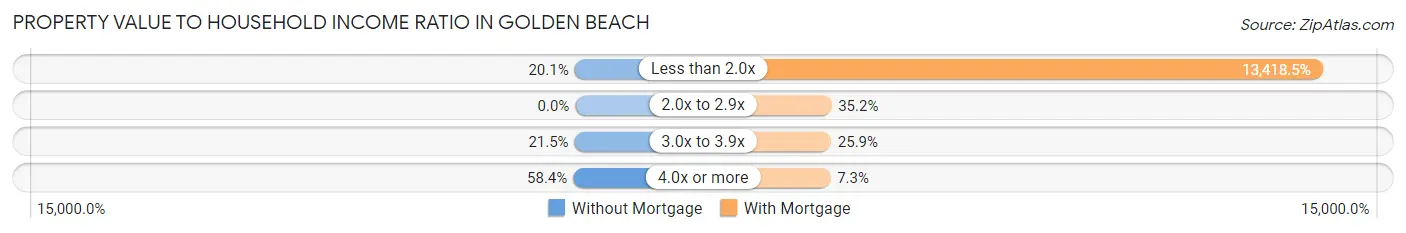
| Value-to-Income Ratio | Without Mortgage | With Mortgage |
| Less than 2.0x | 42 (20.1%) | 136,198 (13,418.5%) |
| 2.0x to 2.9x | 0 (0.0%) | 357 (35.2%) |
| 3.0x to 3.9x | 45 (21.5%) | 263 (25.9%) |
| 4.0x or more | 122 (58.4%) | 74 (7.3%) |
| Total | 209 (100.0%) | 1,015 (100.0%) |
Real Estate Taxes by Mortgage Status in Golden Beach
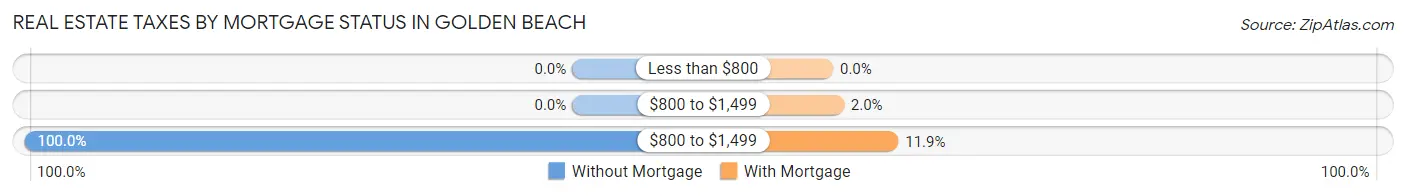
| Property Taxes | Without Mortgage | With Mortgage |
| Less than $800 | 0 (0.0%) | 0 (0.0%) |
| $800 to $1,499 | 0 (0.0%) | 20 (2.0%) |
| $800 to $1,499 | 209 (100.0%) | 121 (11.9%) |
| Total | 209 (100.0%) | 1,015 (100.0%) |
Health & Disability in Golden Beach
Health Insurance Coverage by Age in Golden Beach
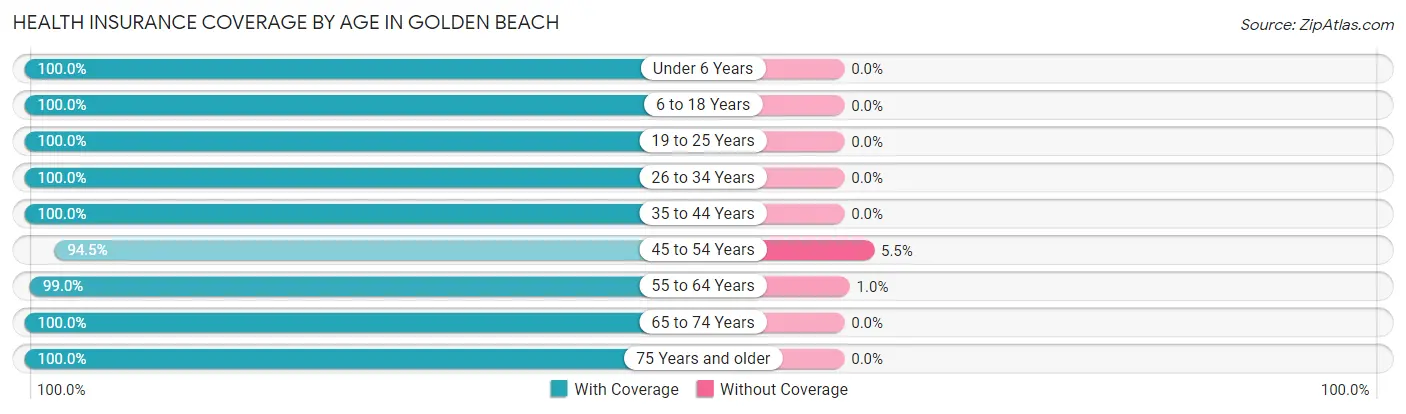
| Age Bracket | With Coverage | Without Coverage |
| Under 6 Years | 543 (100.0%) | 0 (0.0%) |
| 6 to 18 Years | 702 (100.0%) | 0 (0.0%) |
| 19 to 25 Years | 222 (100.0%) | 0 (0.0%) |
| 26 to 34 Years | 675 (100.0%) | 0 (0.0%) |
| 35 to 44 Years | 605 (100.0%) | 0 (0.0%) |
| 45 to 54 Years | 341 (94.5%) | 20 (5.5%) |
| 55 to 64 Years | 296 (99.0%) | 3 (1.0%) |
| 65 to 74 Years | 353 (100.0%) | 0 (0.0%) |
| 75 Years and older | 173 (100.0%) | 0 (0.0%) |
| Total | 3,910 (99.4%) | 23 (0.6%) |
Health Insurance Coverage by Citizenship Status in Golden Beach
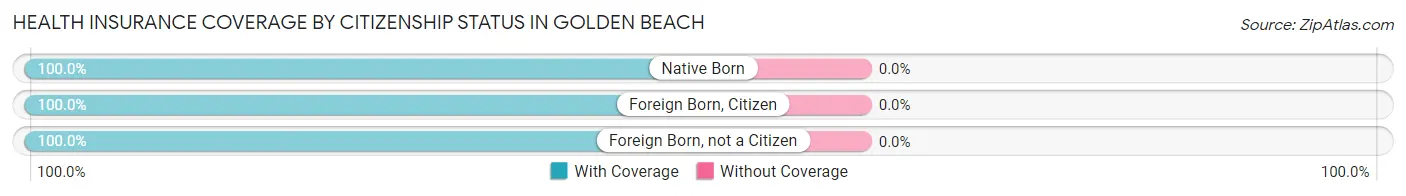
| Citizenship Status | With Coverage | Without Coverage |
| Native Born | 543 (100.0%) | 0 (0.0%) |
| Foreign Born, Citizen | 702 (100.0%) | 0 (0.0%) |
| Foreign Born, not a Citizen | 222 (100.0%) | 0 (0.0%) |
Health Insurance Coverage by Household Income in Golden Beach
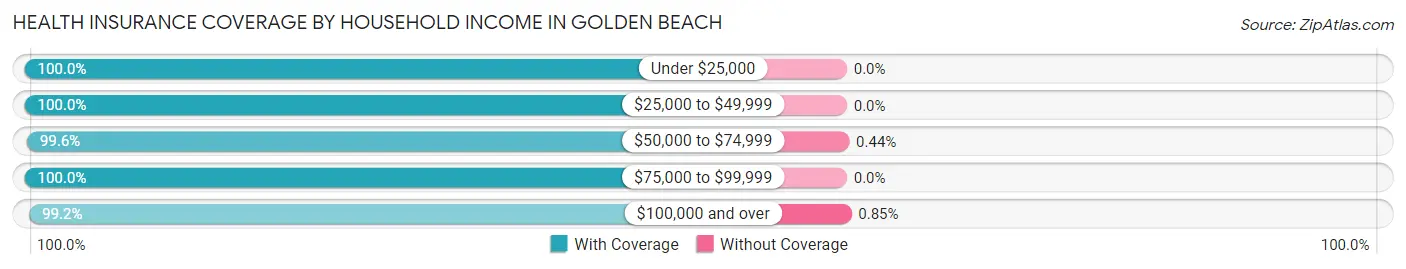
| Household Income | With Coverage | Without Coverage |
| Under $25,000 | 69 (100.0%) | 0 (0.0%) |
| $25,000 to $49,999 | 325 (100.0%) | 0 (0.0%) |
| $50,000 to $74,999 | 684 (99.6%) | 3 (0.4%) |
| $75,000 to $99,999 | 490 (100.0%) | 0 (0.0%) |
| $100,000 and over | 2,342 (99.2%) | 20 (0.9%) |
Public vs Private Health Insurance Coverage by Age in Golden Beach
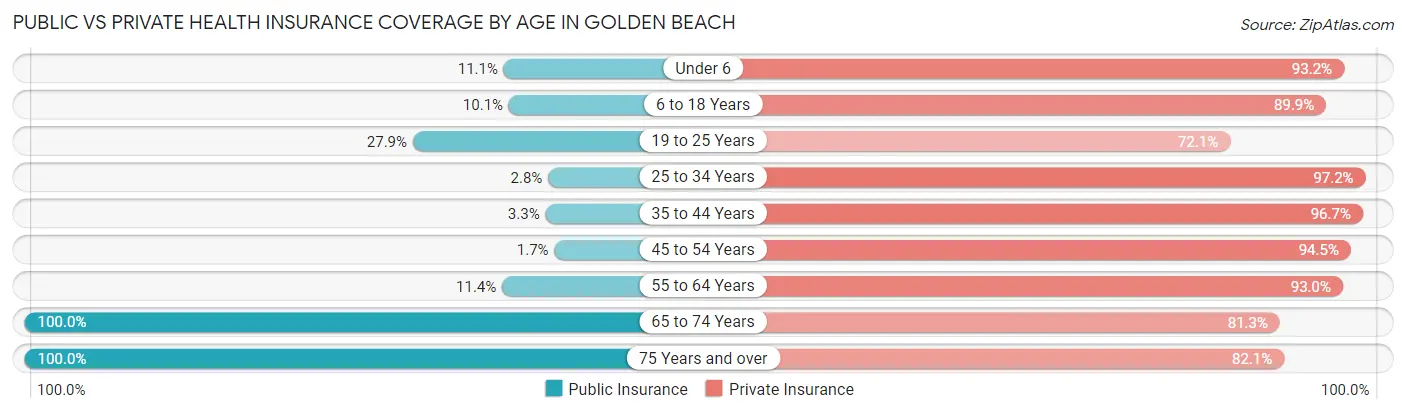
| Age Bracket | Public Insurance | Private Insurance |
| Under 6 | 60 (11.1%) | 506 (93.2%) |
| 6 to 18 Years | 71 (10.1%) | 631 (89.9%) |
| 19 to 25 Years | 62 (27.9%) | 160 (72.1%) |
| 25 to 34 Years | 19 (2.8%) | 656 (97.2%) |
| 35 to 44 Years | 20 (3.3%) | 585 (96.7%) |
| 45 to 54 Years | 6 (1.7%) | 341 (94.5%) |
| 55 to 64 Years | 34 (11.4%) | 278 (93.0%) |
| 65 to 74 Years | 353 (100.0%) | 287 (81.3%) |
| 75 Years and over | 173 (100.0%) | 142 (82.1%) |
| Total | 798 (20.3%) | 3,586 (91.2%) |
Disability Status by Sex by Age in Golden Beach
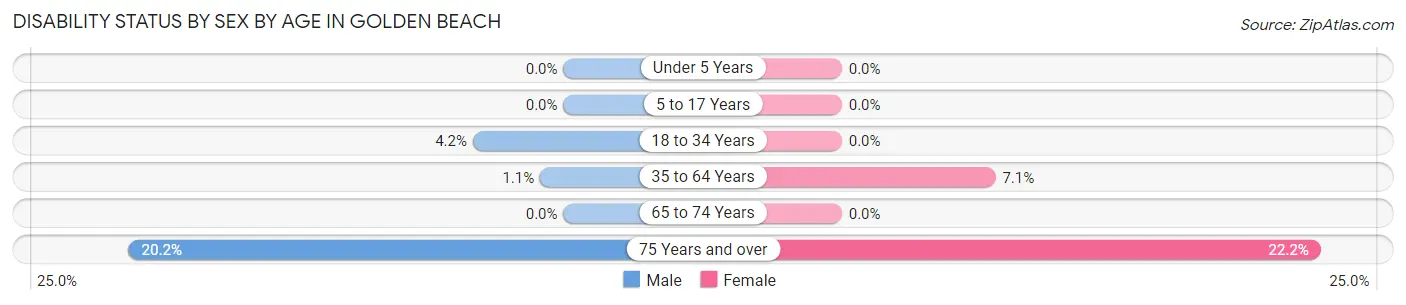
| Age Bracket | Male | Female |
| Under 5 Years | 0 (0.0%) | 0 (0.0%) |
| 5 to 17 Years | 0 (0.0%) | 0 (0.0%) |
| 18 to 34 Years | 19 (4.2%) | 0 (0.0%) |
| 35 to 64 Years | 7 (1.1%) | 44 (7.1%) |
| 65 to 74 Years | 0 (0.0%) | 0 (0.0%) |
| 75 Years and over | 24 (20.2%) | 12 (22.2%) |
Disability Class by Sex by Age in Golden Beach
Disability Class: Hearing Difficulty
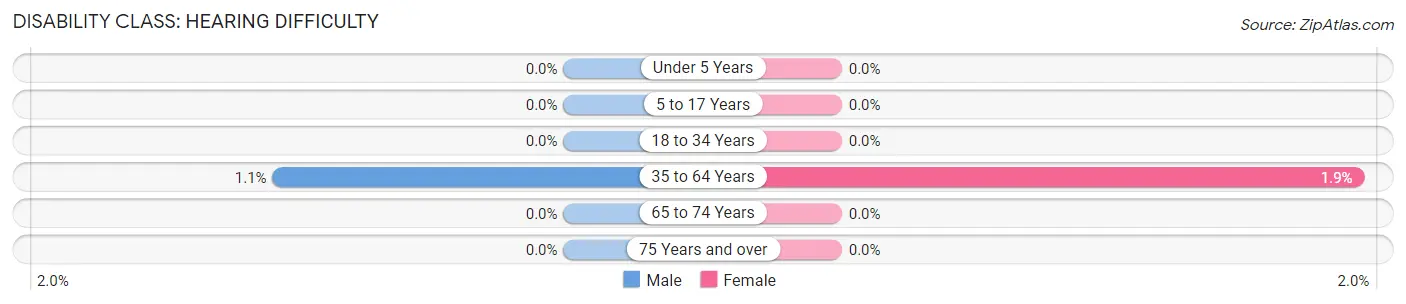
| Age Bracket | Male | Female |
| Under 5 Years | 0 (0.0%) | 0 (0.0%) |
| 5 to 17 Years | 0 (0.0%) | 0 (0.0%) |
| 18 to 34 Years | 0 (0.0%) | 0 (0.0%) |
| 35 to 64 Years | 7 (1.1%) | 12 (1.9%) |
| 65 to 74 Years | 0 (0.0%) | 0 (0.0%) |
| 75 Years and over | 0 (0.0%) | 0 (0.0%) |
Disability Class: Vision Difficulty
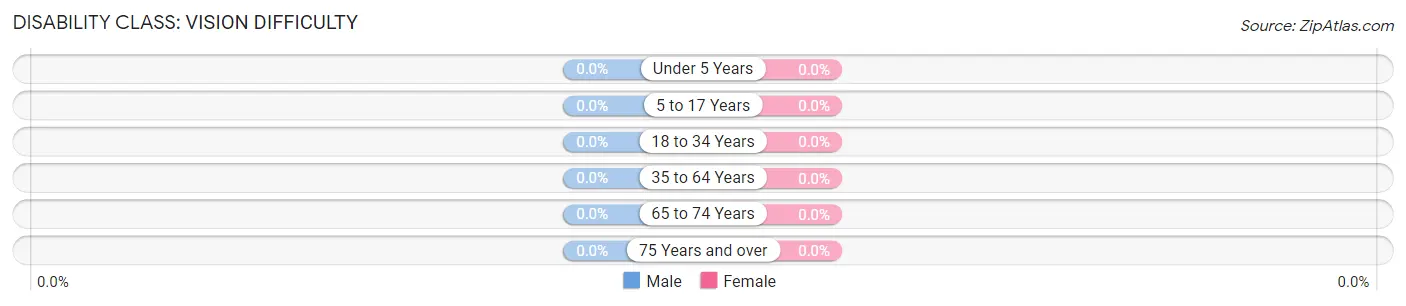
| Age Bracket | Male | Female |
| Under 5 Years | 0 (0.0%) | 0 (0.0%) |
| 5 to 17 Years | 0 (0.0%) | 0 (0.0%) |
| 18 to 34 Years | 0 (0.0%) | 0 (0.0%) |
| 35 to 64 Years | 0 (0.0%) | 0 (0.0%) |
| 65 to 74 Years | 0 (0.0%) | 0 (0.0%) |
| 75 Years and over | 0 (0.0%) | 0 (0.0%) |
Disability Class: Cognitive Difficulty
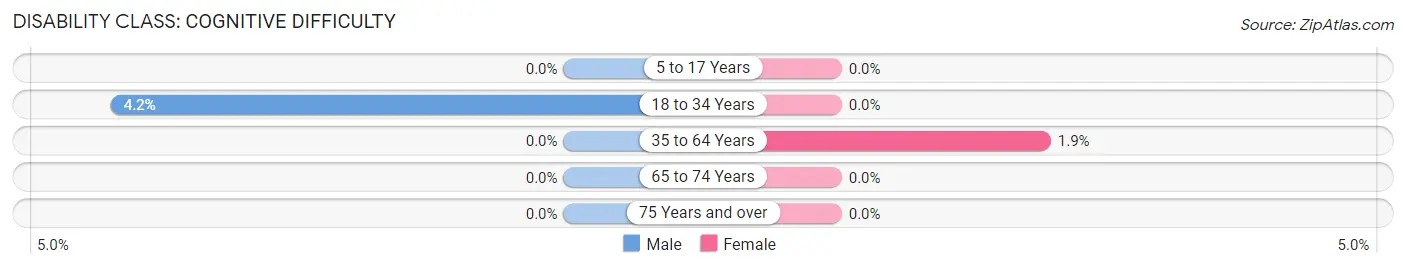
| Age Bracket | Male | Female |
| 5 to 17 Years | 0 (0.0%) | 0 (0.0%) |
| 18 to 34 Years | 19 (4.2%) | 0 (0.0%) |
| 35 to 64 Years | 0 (0.0%) | 12 (1.9%) |
| 65 to 74 Years | 0 (0.0%) | 0 (0.0%) |
| 75 Years and over | 0 (0.0%) | 0 (0.0%) |
Disability Class: Ambulatory Difficulty
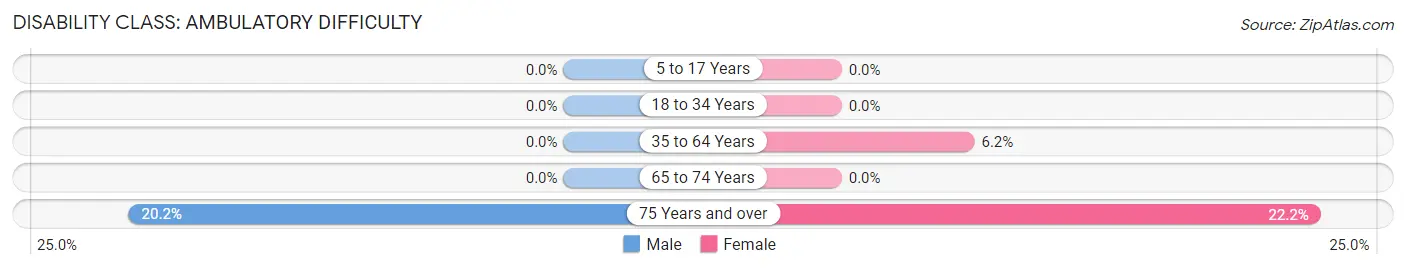
| Age Bracket | Male | Female |
| 5 to 17 Years | 0 (0.0%) | 0 (0.0%) |
| 18 to 34 Years | 0 (0.0%) | 0 (0.0%) |
| 35 to 64 Years | 0 (0.0%) | 38 (6.2%) |
| 65 to 74 Years | 0 (0.0%) | 0 (0.0%) |
| 75 Years and over | 24 (20.2%) | 12 (22.2%) |
Disability Class: Self-Care Difficulty
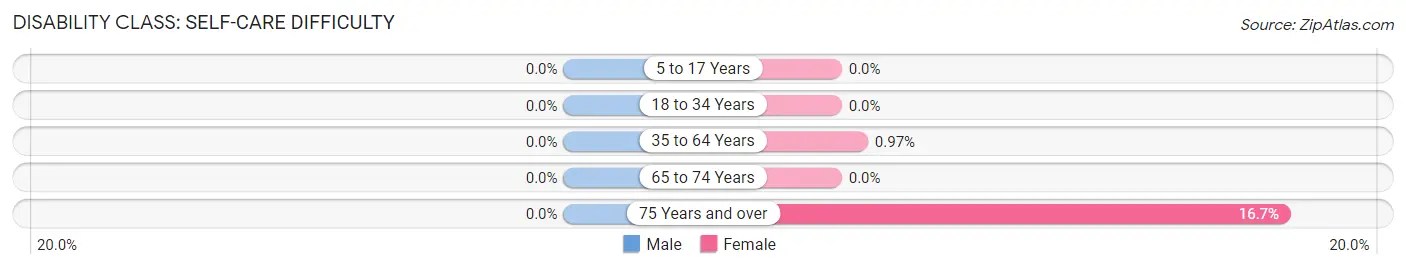
| Age Bracket | Male | Female |
| 5 to 17 Years | 0 (0.0%) | 0 (0.0%) |
| 18 to 34 Years | 0 (0.0%) | 0 (0.0%) |
| 35 to 64 Years | 0 (0.0%) | 6 (1.0%) |
| 65 to 74 Years | 0 (0.0%) | 0 (0.0%) |
| 75 Years and over | 0 (0.0%) | 9 (16.7%) |
Technology Access in Golden Beach
Computing Device Access in Golden Beach
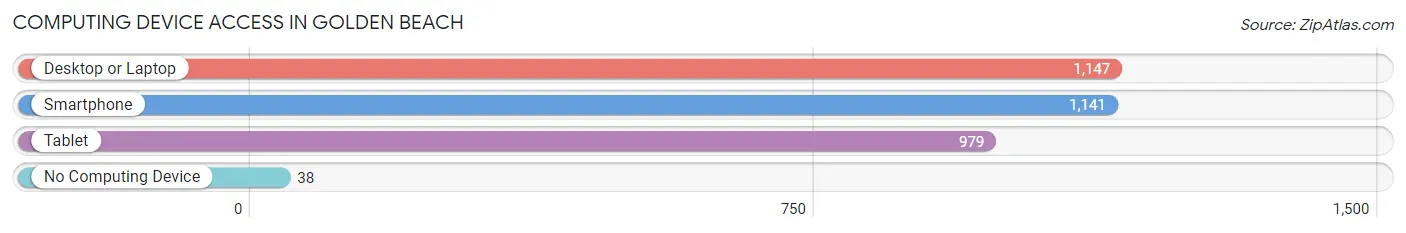
| Device Type | # Households | % Households |
| Desktop or Laptop | 1,147 | 91.9% |
| Smartphone | 1,141 | 91.4% |
| Tablet | 979 | 78.4% |
| No Computing Device | 38 | 3.0% |
| Total | 1,248 | 100.0% |
Internet Access in Golden Beach
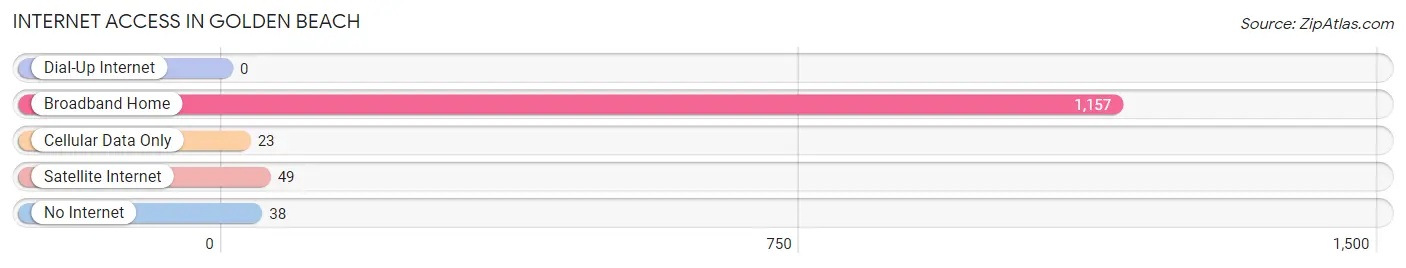
| Internet Type | # Households | % Households |
| Dial-Up Internet | 0 | 0.0% |
| Broadband Home | 1,157 | 92.7% |
| Cellular Data Only | 23 | 1.8% |
| Satellite Internet | 49 | 3.9% |
| No Internet | 38 | 3.0% |
| Total | 1,248 | 100.0% |
Golden Beach Summary
History
Golden Beach is a small town located in Maryland, United States. It is situated on the Chesapeake Bay, just south of the Maryland-Virginia border. The town was founded in the late 19th century by a group of wealthy businessmen from Baltimore. The town was originally known as "The Golden Beach Club" and was a popular destination for wealthy vacationers. The town was incorporated in 1906 and has since grown to a population of approximately 1,000 people.
The town has a rich history of fishing and crabbing. In the early 1900s, the town was home to a large fishing fleet and was known for its abundance of crabs. The town was also home to a number of oyster shucking houses, which were popular with the locals.
The town was also home to a number of resorts and hotels, which attracted visitors from all over the country. The town was also home to a number of amusement parks, which were popular with the locals and visitors alike.
Geography
Golden Beach is located in Calvert County, Maryland. It is situated on the Chesapeake Bay, just south of the Maryland-Virginia border. The town is bordered by the Patuxent River to the north and the Chesapeake Bay to the south. The town is located approximately 30 miles south of Washington, D.C. and is part of the Washington-Baltimore metropolitan area.
The town is situated on a peninsula, which is surrounded by the Chesapeake Bay on three sides. The town is located on a flat, sandy plain, which is ideal for beach activities. The town is also home to a number of small islands, which are popular with boaters and fishermen.
Economy
The economy of Golden Beach is largely based on tourism and fishing. The town is home to a number of resorts and hotels, which attract visitors from all over the country. The town is also home to a number of restaurants, which serve local seafood dishes.
The town is also home to a number of marinas, which are popular with boaters and fishermen. The town is also home to a number of boatyards, which are popular with boat owners.
The town is also home to a number of small businesses, which provide goods and services to the local community. These businesses include grocery stores, hardware stores, and other retail outlets.
Demographics
As of the 2010 census, the population of Golden Beach was 1,000 people. The town is predominantly white, with a small African American population. The median age of the population is 44 years old. The median household income is $50,000.
The town is home to a number of churches, which serve the local community. The town is also home to a number of schools, which serve the local community. The town is served by the Calvert County Public Schools system.
Conclusion
Golden Beach is a small town located in Maryland, United States. It is situated on the Chesapeake Bay, just south of the Maryland-Virginia border. The town was founded in the late 19th century by a group of wealthy businessmen from Baltimore. The town has a rich history of fishing and crabbing and is home to a number of resorts and hotels, which attract visitors from all over the country. The economy of Golden Beach is largely based on tourism and fishing. The town is predominantly white, with a small African American population. The town is home to a number of churches, schools, and small businesses, which provide goods and services to the local community.
Common Questions
What is Per Capita Income in Golden Beach?
Per Capita income in Golden Beach is $40,763.
What is the Median Family Income in Golden Beach?
Median Family Income in Golden Beach is $145,191.
What is the Median Household income in Golden Beach?
Median Household Income in Golden Beach is $118,500.
What is Income or Wage Gap in Golden Beach?
Income or Wage Gap in Golden Beach is 43.4%.
Women in Golden Beach earn 56.6 cents for every dollar earned by a man.
What is Inequality or Gini Index in Golden Beach?
Inequality or Gini Index in Golden Beach is 0.33.
What is the Total Population of Golden Beach?
Total Population of Golden Beach is 3,933.
What is the Total Male Population of Golden Beach?
Total Male Population of Golden Beach is 2,148.
What is the Total Female Population of Golden Beach?
Total Female Population of Golden Beach is 1,785.
What is the Ratio of Males per 100 Females in Golden Beach?
There are 120.34 Males per 100 Females in Golden Beach.
What is the Ratio of Females per 100 Males in Golden Beach?
There are 83.10 Females per 100 Males in Golden Beach.
What is the Median Population Age in Golden Beach?
Median Population Age in Golden Beach is 33.0 Years.
What is the Average Family Size in Golden Beach
Average Family Size in Golden Beach is 3.6 People.
What is the Average Household Size in Golden Beach
Average Household Size in Golden Beach is 3.1 People.
How Large is the Labor Force in Golden Beach?
There are 1,985 People in the Labor Forcein in Golden Beach.
What is the Percentage of People in the Labor Force in Golden Beach?
70.3% of People are in the Labor Force in Golden Beach.
What is the Unemployment Rate in Golden Beach?
Unemployment Rate in Golden Beach is 2.1%.