Owings, MD Map & Demographics
Owings Map
Owings Overview
$67,610
PER CAPITA INCOME
$159,375
AVG FAMILY INCOME
$150,156
AVG HOUSEHOLD INCOME
50.6%
WAGE / INCOME GAP [ % ]
49.4¢/ $1
WAGE / INCOME GAP [ $ ]
0.27
INEQUALITY / GINI INDEX
2,376
TOTAL POPULATION
1,148
MALE POPULATION
1,228
FEMALE POPULATION
93.49
MALES / 100 FEMALES
106.97
FEMALES / 100 MALES
52.6
MEDIAN AGE
2.9
AVG FAMILY SIZE
2.6
AVG HOUSEHOLD SIZE
1,454
LABOR FORCE [ PEOPLE ]
74.2%
PERCENT IN LABOR FORCE
1.4%
UNEMPLOYMENT RATE
Owings Zip Codes
Owings Area Codes
Income in Owings
Income Overview in Owings
Per Capita Income in Owings is $67,610, while median incomes of families and households are $159,375 and $150,156 respectively.
| Characteristic | Number | Measure |
| Per Capita Income | 2,376 | $67,610 |
| Median Family Income | 731 | $159,375 |
| Mean Family Income | 731 | $182,495 |
| Median Household Income | 907 | $150,156 |
| Mean Household Income | 907 | $171,172 |
| Income Deficit | 731 | $0 |
| Wage / Income Gap (%) | 2,376 | 50.62% |
| Wage / Income Gap ($) | 2,376 | 49.38¢ per $1 |
| Gini / Inequality Index | 2,376 | 0.27 |
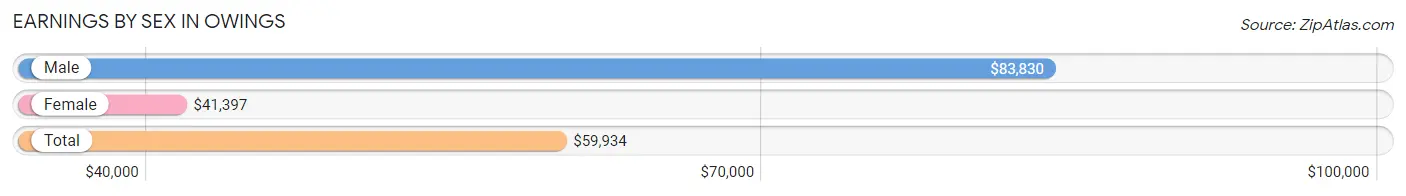
Earnings by Sex in Owings
Average Earnings in Owings are $59,934, $83,830 for men and $41,397 for women, a difference of 50.6%.
| Sex | Number | Average Earnings |
| Male | 742 (48.3%) | $83,830 |
| Female | 795 (51.7%) | $41,397 |
| Total | 1,537 (100.0%) | $59,934 |
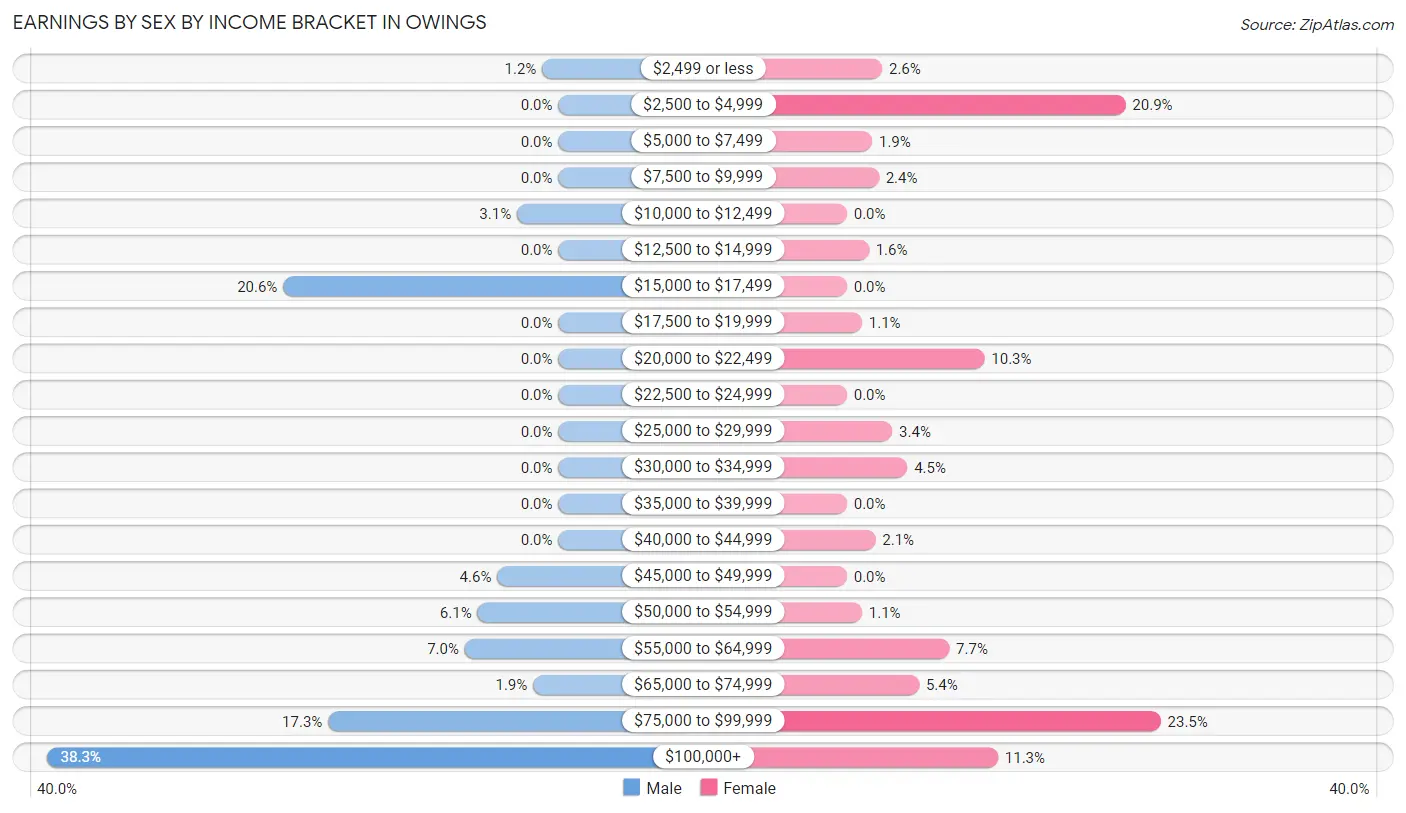
Earnings by Sex by Income Bracket in Owings
The most common earnings brackets in Owings are $100,000+ for men (284 | 38.3%) and $75,000 to $99,999 for women (187 | 23.5%).
| Income | Male | Female |
| $2,499 or less | 9 (1.2%) | 21 (2.6%) |
| $2,500 to $4,999 | 0 (0.0%) | 166 (20.9%) |
| $5,000 to $7,499 | 0 (0.0%) | 15 (1.9%) |
| $7,500 to $9,999 | 0 (0.0%) | 19 (2.4%) |
| $10,000 to $12,499 | 23 (3.1%) | 0 (0.0%) |
| $12,500 to $14,999 | 0 (0.0%) | 13 (1.6%) |
| $15,000 to $17,499 | 153 (20.6%) | 0 (0.0%) |
| $17,500 to $19,999 | 0 (0.0%) | 9 (1.1%) |
| $20,000 to $22,499 | 0 (0.0%) | 82 (10.3%) |
| $22,500 to $24,999 | 0 (0.0%) | 0 (0.0%) |
| $25,000 to $29,999 | 0 (0.0%) | 27 (3.4%) |
| $30,000 to $34,999 | 0 (0.0%) | 36 (4.5%) |
| $35,000 to $39,999 | 0 (0.0%) | 0 (0.0%) |
| $40,000 to $44,999 | 0 (0.0%) | 17 (2.1%) |
| $45,000 to $49,999 | 34 (4.6%) | 0 (0.0%) |
| $50,000 to $54,999 | 45 (6.1%) | 9 (1.1%) |
| $55,000 to $64,999 | 52 (7.0%) | 61 (7.7%) |
| $65,000 to $74,999 | 14 (1.9%) | 43 (5.4%) |
| $75,000 to $99,999 | 128 (17.2%) | 187 (23.5%) |
| $100,000+ | 284 (38.3%) | 90 (11.3%) |
| Total | 742 (100.0%) | 795 (100.0%) |
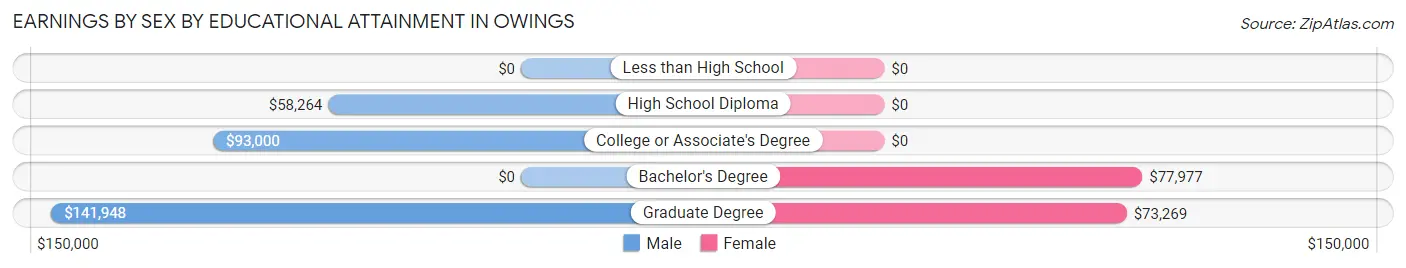
Earnings by Sex by Educational Attainment in Owings
Average earnings in Owings are $84,096 for men and $57,917 for women, a difference of 31.1%. Men with an educational attainment of graduate degree enjoy the highest average annual earnings of $141,948, while those with high school diploma education earn the least with $58,264. Women with an educational attainment of bachelor's degree earn the most with the average annual earnings of $77,977, while those with graduate degree education have the smallest earnings of $73,269.
| Educational Attainment | Male Income | Female Income |
| Less than High School | - | - |
| High School Diploma | $58,264 | $0 |
| College or Associate's Degree | $93,000 | $0 |
| Bachelor's Degree | - | - |
| Graduate Degree | $141,948 | $73,269 |
| Total | $84,096 | $57,917 |
Family Income in Owings
Family Income Brackets in Owings
According to the Owings family income data, there are 296 families falling into the $100,000 to $149,999 income range, which is the most common income bracket and makes up 40.5% of all families.
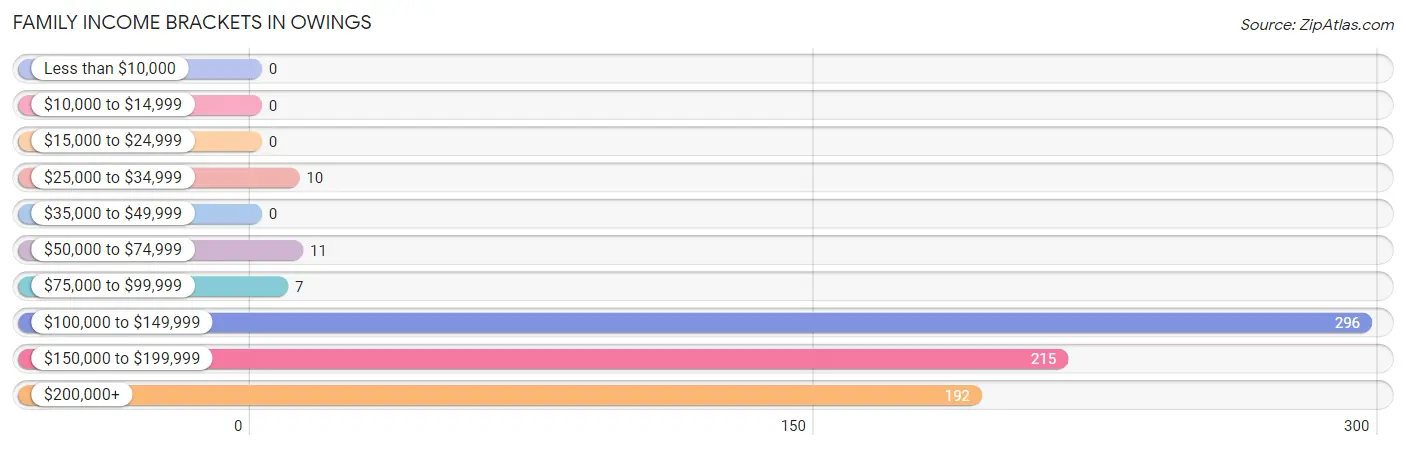
| Income Bracket | # Families | % Families |
| Less than $10,000 | 0 | 0.0% |
| $10,000 to $14,999 | 0 | 0.0% |
| $15,000 to $24,999 | 0 | 0.0% |
| $25,000 to $34,999 | 10 | 1.4% |
| $35,000 to $49,999 | 0 | 0.0% |
| $50,000 to $74,999 | 11 | 1.5% |
| $75,000 to $99,999 | 7 | 1.0% |
| $100,000 to $149,999 | 296 | 40.5% |
| $150,000 to $199,999 | 215 | 29.4% |
| $200,000+ | 192 | 26.3% |
Family Income by Famaliy Size in Owings
5-person families (70 | 9.6%) account for the highest median family income in Owings with $250,001 per family, while 2-person families (449 | 61.4%) have the highest median income of $64,596 per family member.
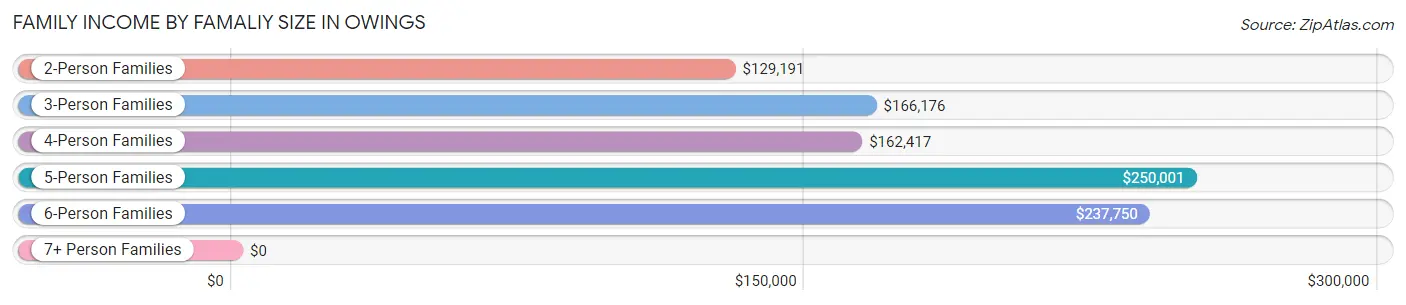
| Income Bracket | # Families | Median Income |
| 2-Person Families | 449 (61.4%) | $129,191 |
| 3-Person Families | 92 (12.6%) | $166,176 |
| 4-Person Families | 61 (8.3%) | $162,417 |
| 5-Person Families | 70 (9.6%) | $250,001 |
| 6-Person Families | 59 (8.1%) | $237,750 |
| 7+ Person Families | 0 (0.0%) | $0 |
| Total | 731 (100.0%) | $159,375 |
Family Income by Number of Earners in Owings
The median family income in Owings is $159,375, with families comprising 3+ earners (90) having the highest median family income of $239,545, while families with no earners (93) have the lowest median family income of $116,588, accounting for 12.3% and 12.7% of families, respectively.
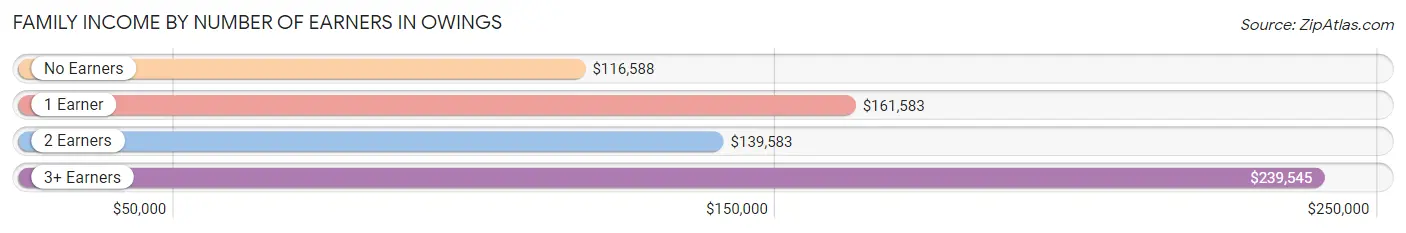
| Number of Earners | # Families | Median Income |
| No Earners | 93 (12.7%) | $116,588 |
| 1 Earner | 119 (16.3%) | $161,583 |
| 2 Earners | 429 (58.7%) | $139,583 |
| 3+ Earners | 90 (12.3%) | $239,545 |
| Total | 731 (100.0%) | $159,375 |
Household Income in Owings
Household Income Brackets in Owings
With 360 households falling in the category, the $100,000 to $149,999 income range is the most frequent in Owings, accounting for 39.7% of all households.
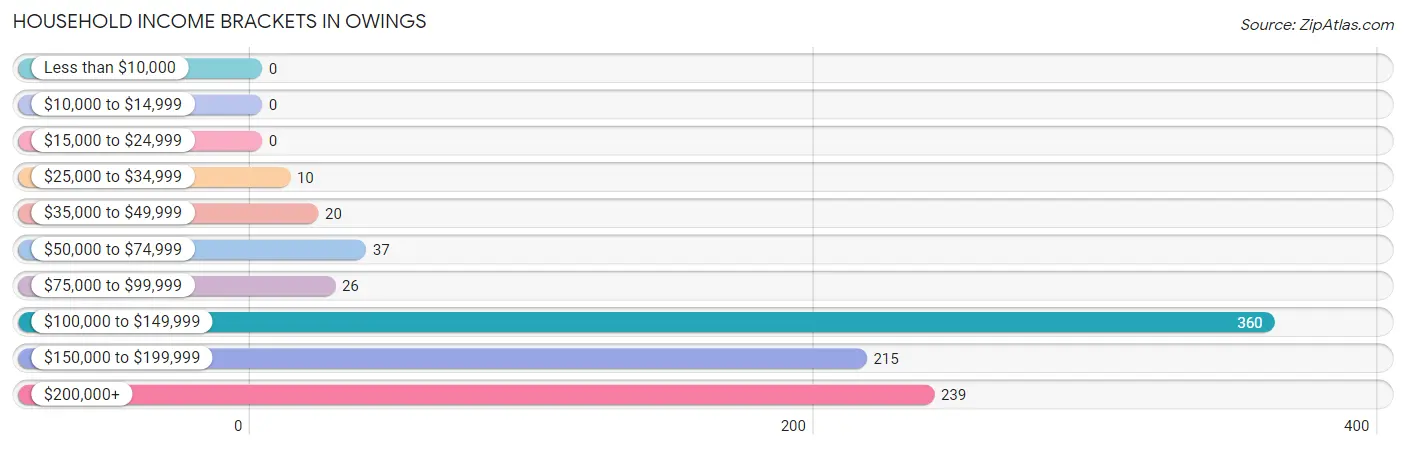
| Income Bracket | # Households | % Households |
| Less than $10,000 | 0 | 0.0% |
| $10,000 to $14,999 | 0 | 0.0% |
| $15,000 to $24,999 | 0 | 0.0% |
| $25,000 to $34,999 | 10 | 1.1% |
| $35,000 to $49,999 | 20 | 2.2% |
| $50,000 to $74,999 | 37 | 4.1% |
| $75,000 to $99,999 | 26 | 2.9% |
| $100,000 to $149,999 | 360 | 39.7% |
| $150,000 to $199,999 | 215 | 23.7% |
| $200,000+ | 239 | 26.4% |
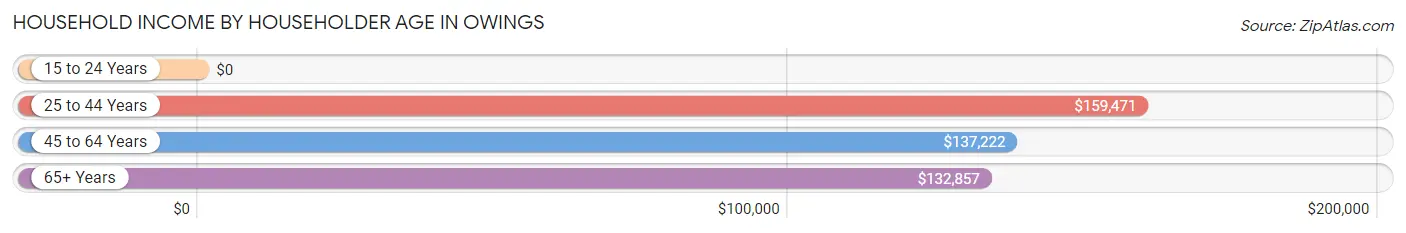
Household Income by Householder Age in Owings
The median household income in Owings is $150,156, with the highest median household income of $159,471 found in the 25 to 44 years age bracket for the primary householder. A total of 173 households (19.1%) fall into this category.
| Income Bracket | # Households | Median Income |
| 15 to 24 Years | 0 (0.0%) | $0 |
| 25 to 44 Years | 173 (19.1%) | $159,471 |
| 45 to 64 Years | 522 (57.6%) | $137,222 |
| 65+ Years | 212 (23.4%) | $132,857 |
| Total | 907 (100.0%) | $150,156 |
Poverty in Owings
Income Below Poverty by Sex and Age in Owings
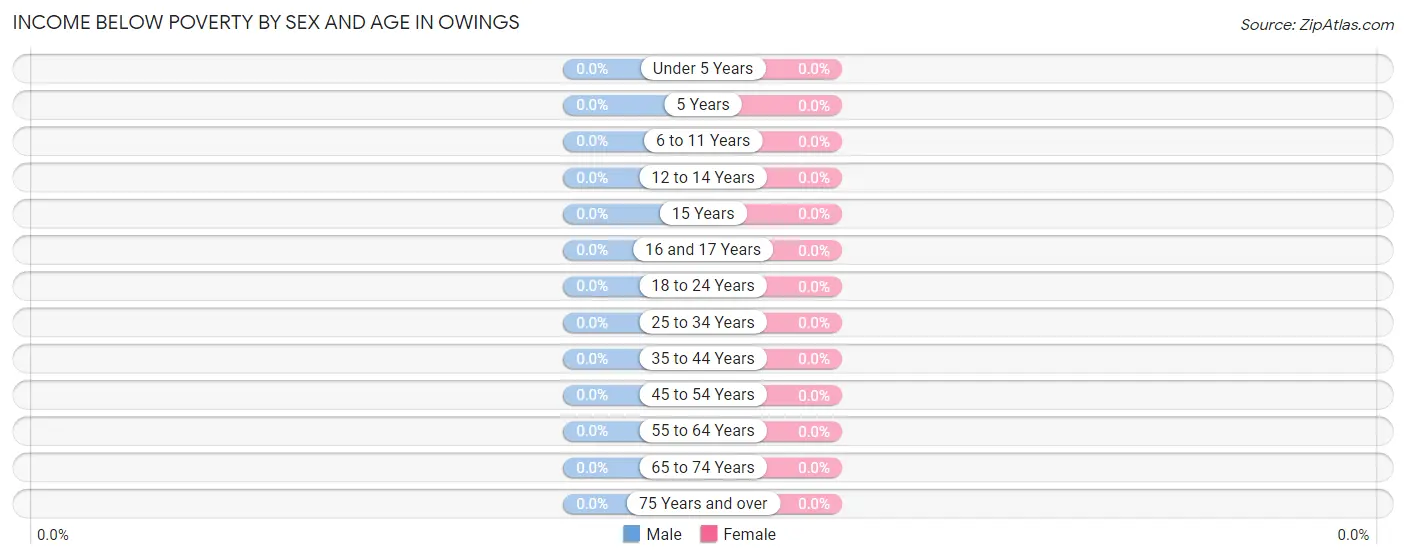
| Age Bracket | Male | Female |
| Under 5 Years | 0 (0.0%) | 0 (0.0%) |
| 5 Years | 0 (0.0%) | 0 (0.0%) |
| 6 to 11 Years | 0 (0.0%) | 0 (0.0%) |
| 12 to 14 Years | 0 (0.0%) | 0 (0.0%) |
| 15 Years | 0 (0.0%) | 0 (0.0%) |
| 16 and 17 Years | 0 (0.0%) | 0 (0.0%) |
| 18 to 24 Years | 0 (0.0%) | 0 (0.0%) |
| 25 to 34 Years | 0 (0.0%) | 0 (0.0%) |
| 35 to 44 Years | 0 (0.0%) | 0 (0.0%) |
| 45 to 54 Years | 0 (0.0%) | 0 (0.0%) |
| 55 to 64 Years | 0 (0.0%) | 0 (0.0%) |
| 65 to 74 Years | 0 (0.0%) | 0 (0.0%) |
| 75 Years and over | 0 (0.0%) | 0 (0.0%) |
| Total | 0 (0.0%) | 0 (0.0%) |
Income Above Poverty by Sex and Age in Owings
According to the poverty statistics in Owings, males aged under 5 years and females aged under 5 years are the age groups that are most secure financially, with 100.0% of males and 100.0% of females in these age groups living above the poverty line.
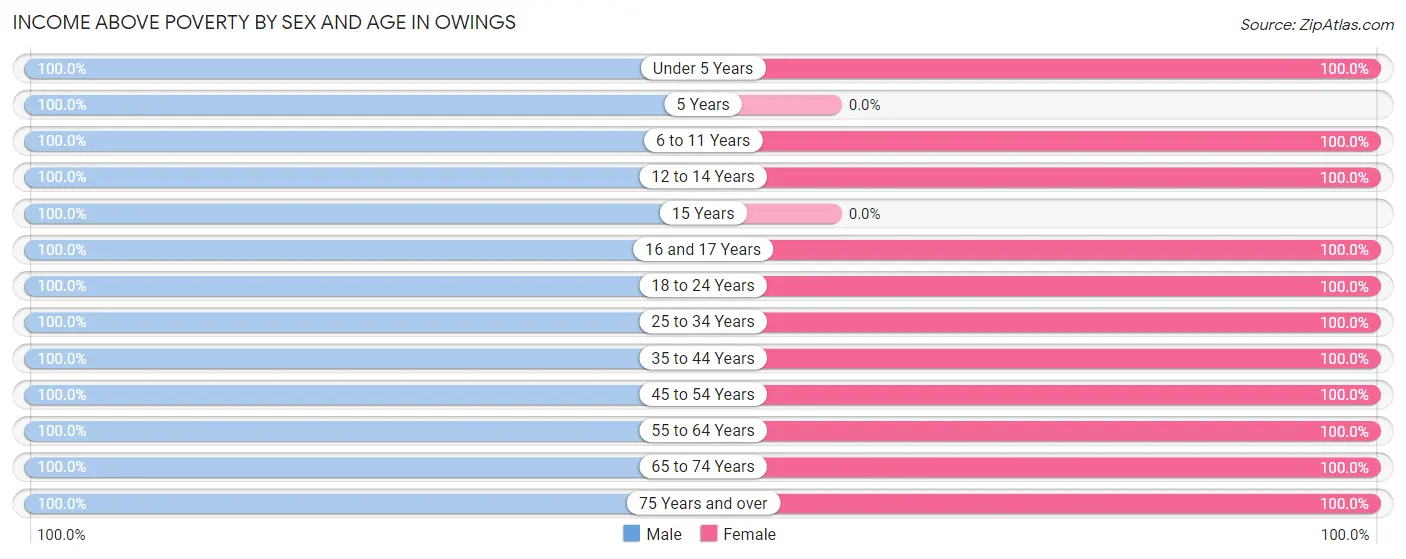
| Age Bracket | Male | Female |
| Under 5 Years | 59 (100.0%) | 40 (100.0%) |
| 5 Years | 11 (100.0%) | 0 (0.0%) |
| 6 to 11 Years | 71 (100.0%) | 25 (100.0%) |
| 12 to 14 Years | 70 (100.0%) | 117 (100.0%) |
| 15 Years | 24 (100.0%) | 0 (0.0%) |
| 16 and 17 Years | 22 (100.0%) | 32 (100.0%) |
| 18 to 24 Years | 10 (100.0%) | 69 (100.0%) |
| 25 to 34 Years | 82 (100.0%) | 107 (100.0%) |
| 35 to 44 Years | 78 (100.0%) | 124 (100.0%) |
| 45 to 54 Years | 163 (100.0%) | 219 (100.0%) |
| 55 to 64 Years | 379 (100.0%) | 305 (100.0%) |
| 65 to 74 Years | 109 (100.0%) | 89 (100.0%) |
| 75 Years and over | 70 (100.0%) | 98 (100.0%) |
| Total | 1,148 (100.0%) | 1,225 (100.0%) |
Income Below Poverty Among Married-Couple Families in Owings
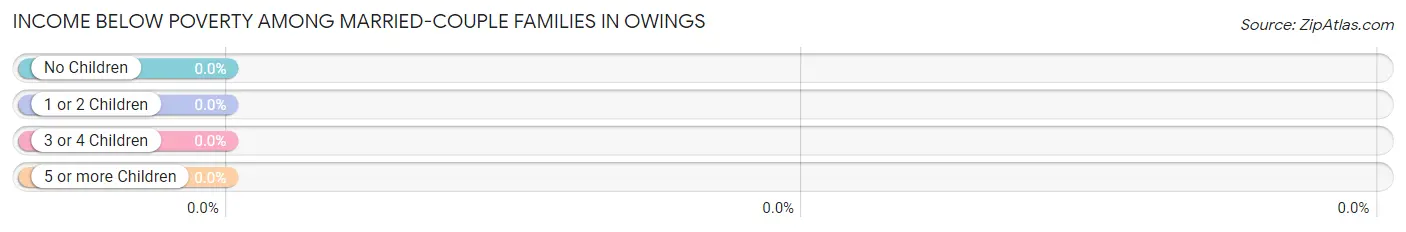
| Children | Above Poverty | Below Poverty |
| No Children | 476 (100.0%) | 0 (0.0%) |
| 1 or 2 Children | 106 (100.0%) | 0 (0.0%) |
| 3 or 4 Children | 94 (100.0%) | 0 (0.0%) |
| 5 or more Children | 0 (0.0%) | 0 (0.0%) |
| Total | 676 (100.0%) | 0 (0.0%) |
Income Below Poverty Among Single-Parent Households in Owings
| Children | Single Father | Single Mother |
| No Children | 0 (0.0%) | 0 (0.0%) |
| 1 or 2 Children | 0 (0.0%) | 0 (0.0%) |
| 3 or 4 Children | 0 (0.0%) | 0 (0.0%) |
| 5 or more Children | 0 (0.0%) | 0 (0.0%) |
| Total | 0 (0.0%) | 0 (0.0%) |
Income Below Poverty Among Married-Couple vs Single-Parent Households in Owings
| Children | Married-Couple Families | Single-Parent Households |
| No Children | 0 (0.0%) | 0 (0.0%) |
| 1 or 2 Children | 0 (0.0%) | 0 (0.0%) |
| 3 or 4 Children | 0 (0.0%) | 0 (0.0%) |
| 5 or more Children | 0 (0.0%) | 0 (0.0%) |
| Total | 0 (0.0%) | 0 (0.0%) |
Race in Owings
The most populous races in Owings are White / Caucasian (2,077 | 87.4%), Black / African American (259 | 10.9%), and Hispanic or Latino (77 | 3.2%).
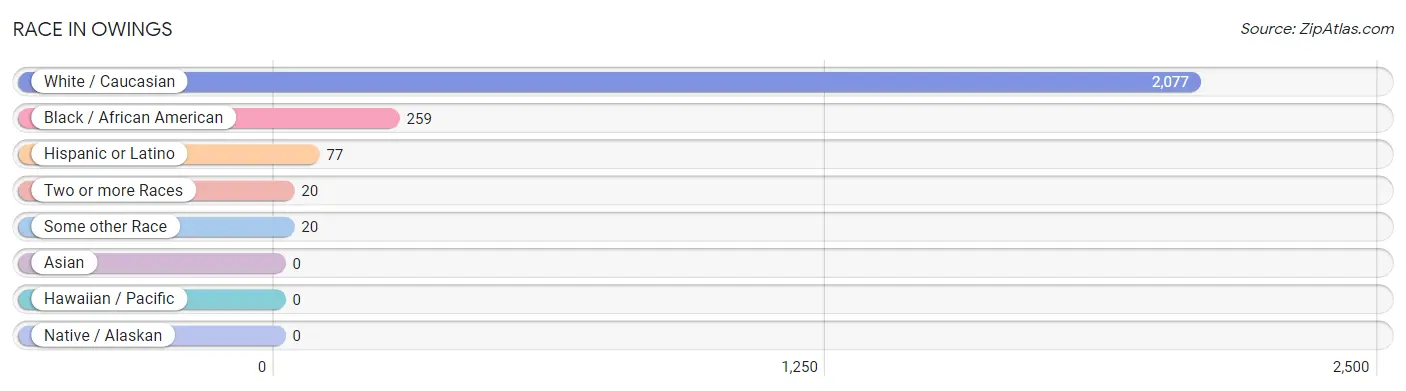
| Race | # Population | % Population |
| Asian | 0 | 0.0% |
| Black / African American | 259 | 10.9% |
| Hawaiian / Pacific | 0 | 0.0% |
| Hispanic or Latino | 77 | 3.2% |
| Native / Alaskan | 0 | 0.0% |
| White / Caucasian | 2,077 | 87.4% |
| Two or more Races | 20 | 0.8% |
| Some other Race | 20 | 0.8% |
| Total | 2,376 | 100.0% |
Ancestry in Owings
The most populous ancestries reported in Owings are German (514 | 21.6%), English (227 | 9.6%), Irish (214 | 9.0%), American (213 | 9.0%), and Polish (144 | 6.1%), together accounting for 55.2% of all Owings residents.
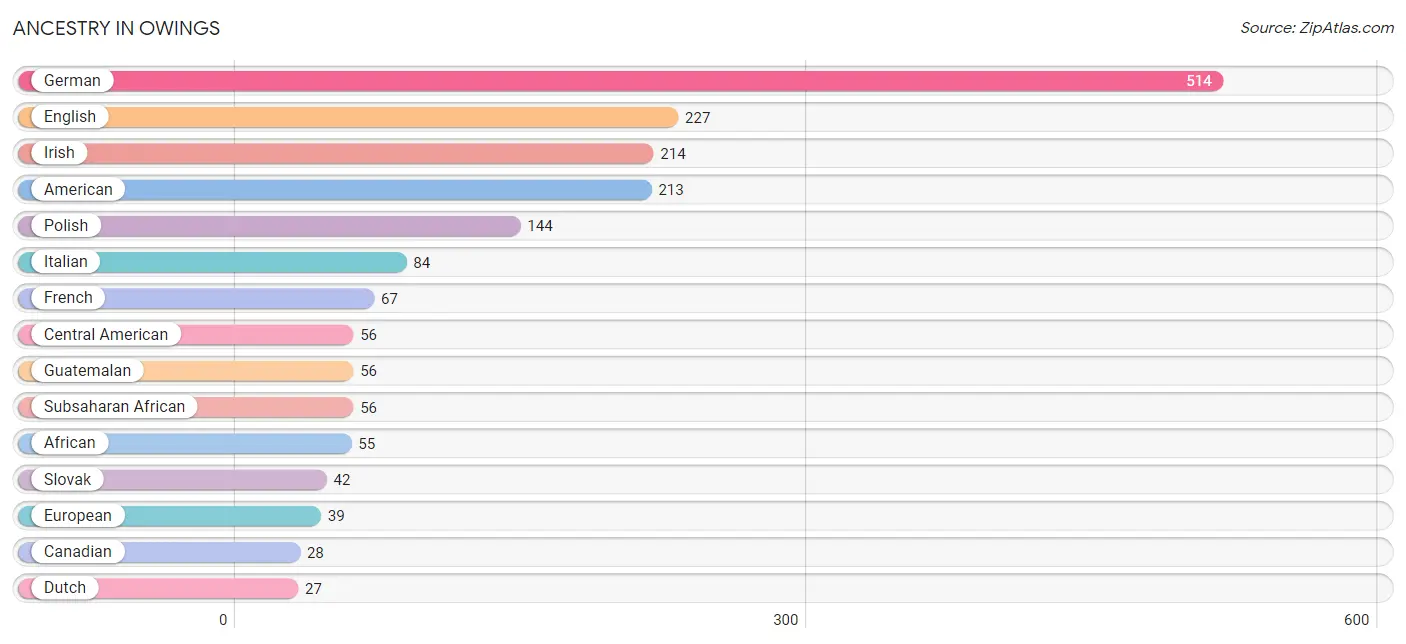
| Ancestry | # Population | % Population |
| African | 55 | 2.3% |
| American | 213 | 9.0% |
| Arab | 13 | 0.5% |
| Austrian | 10 | 0.4% |
| Canadian | 28 | 1.2% |
| Central American | 56 | 2.4% |
| Dutch | 27 | 1.1% |
| English | 227 | 9.6% |
| Ethiopian | 1 | 0.0% |
| European | 39 | 1.6% |
| French | 67 | 2.8% |
| German | 514 | 21.6% |
| Guatemalan | 56 | 2.4% |
| Hungarian | 21 | 0.9% |
| Irish | 214 | 9.0% |
| Iroquois | 6 | 0.3% |
| Italian | 84 | 3.5% |
| Latvian | 15 | 0.6% |
| Lebanese | 13 | 0.5% |
| Mexican | 21 | 0.9% |
| Northern European | 11 | 0.5% |
| Polish | 144 | 6.1% |
| Romanian | 23 | 1.0% |
| Scotch-Irish | 7 | 0.3% |
| Scottish | 22 | 0.9% |
| Slovak | 42 | 1.8% |
| Subsaharan African | 56 | 2.4% |
| Swedish | 27 | 1.1% |
| Swiss | 7 | 0.3% | View All 29 Rows |
Immigrants in Owings
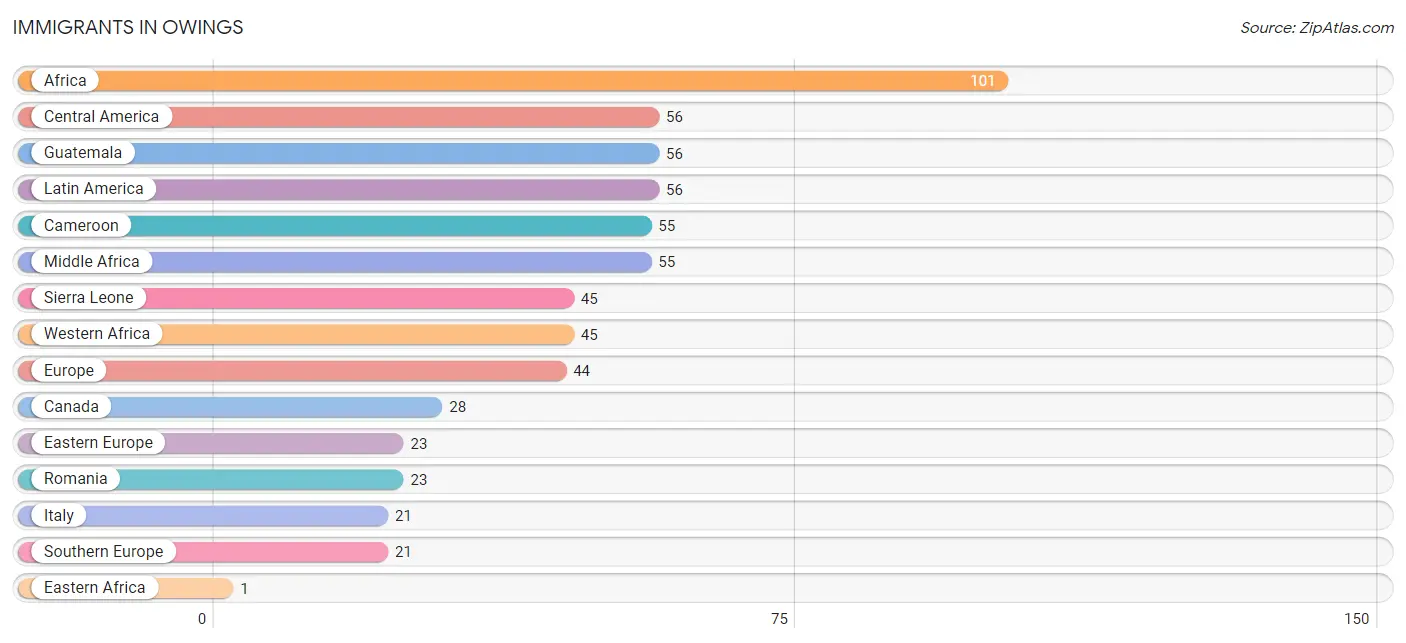
The most numerous immigrant groups reported in Owings came from Africa (101 | 4.3%), Central America (56 | 2.4%), Guatemala (56 | 2.4%), Latin America (56 | 2.4%), and Cameroon (55 | 2.3%), together accounting for 13.6% of all Owings residents.
| Immigration Origin | # Population | % Population |
| Africa | 101 | 4.3% |
| Cameroon | 55 | 2.3% |
| Canada | 28 | 1.2% |
| Central America | 56 | 2.4% |
| Eastern Africa | 1 | 0.0% |
| Eastern Europe | 23 | 1.0% |
| Ethiopia | 1 | 0.0% |
| Europe | 44 | 1.8% |
| Guatemala | 56 | 2.4% |
| Italy | 21 | 0.9% |
| Latin America | 56 | 2.4% |
| Middle Africa | 55 | 2.3% |
| Romania | 23 | 1.0% |
| Sierra Leone | 45 | 1.9% |
| Southern Europe | 21 | 0.9% |
| Western Africa | 45 | 1.9% | View All 16 Rows |
Sex and Age in Owings
Sex and Age in Owings
The most populous age groups in Owings are 60 to 64 Years (259 | 22.6%) for men and 60 to 64 Years (197 | 16.0%) for women.
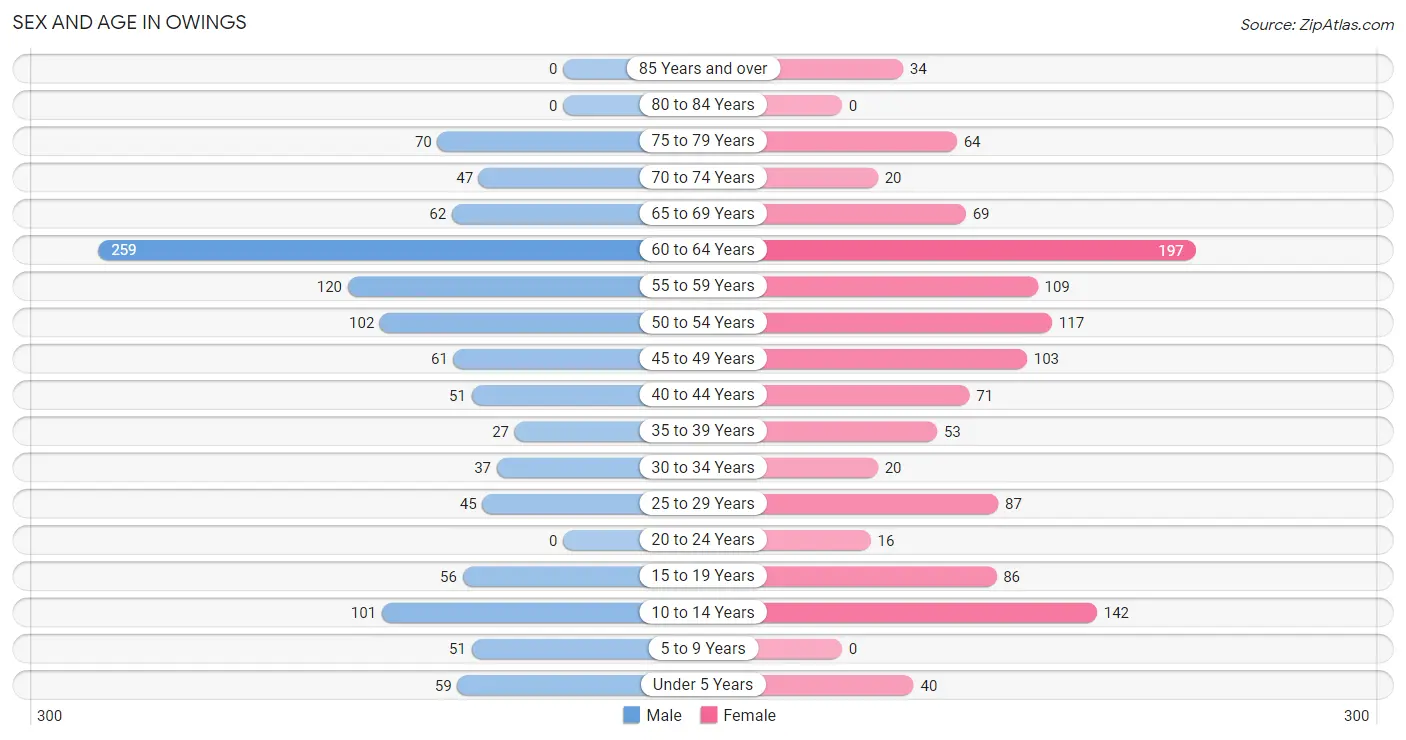
| Age Bracket | Male | Female |
| Under 5 Years | 59 (5.1%) | 40 (3.3%) |
| 5 to 9 Years | 51 (4.4%) | 0 (0.0%) |
| 10 to 14 Years | 101 (8.8%) | 142 (11.6%) |
| 15 to 19 Years | 56 (4.9%) | 86 (7.0%) |
| 20 to 24 Years | 0 (0.0%) | 16 (1.3%) |
| 25 to 29 Years | 45 (3.9%) | 87 (7.1%) |
| 30 to 34 Years | 37 (3.2%) | 20 (1.6%) |
| 35 to 39 Years | 27 (2.4%) | 53 (4.3%) |
| 40 to 44 Years | 51 (4.4%) | 71 (5.8%) |
| 45 to 49 Years | 61 (5.3%) | 103 (8.4%) |
| 50 to 54 Years | 102 (8.9%) | 117 (9.5%) |
| 55 to 59 Years | 120 (10.4%) | 109 (8.9%) |
| 60 to 64 Years | 259 (22.6%) | 197 (16.0%) |
| 65 to 69 Years | 62 (5.4%) | 69 (5.6%) |
| 70 to 74 Years | 47 (4.1%) | 20 (1.6%) |
| 75 to 79 Years | 70 (6.1%) | 64 (5.2%) |
| 80 to 84 Years | 0 (0.0%) | 0 (0.0%) |
| 85 Years and over | 0 (0.0%) | 34 (2.8%) |
| Total | 1,148 (100.0%) | 1,228 (100.0%) |
Families and Households in Owings
Median Family Size in Owings
The median family size in Owings is 2.94 persons per family, with single female/mother families (45 | 6.2%) accounting for the largest median family size of 3.24 persons per family. On the other hand, single male/father families (10 | 1.4%) represent the smallest median family size with 2.30 persons per family.
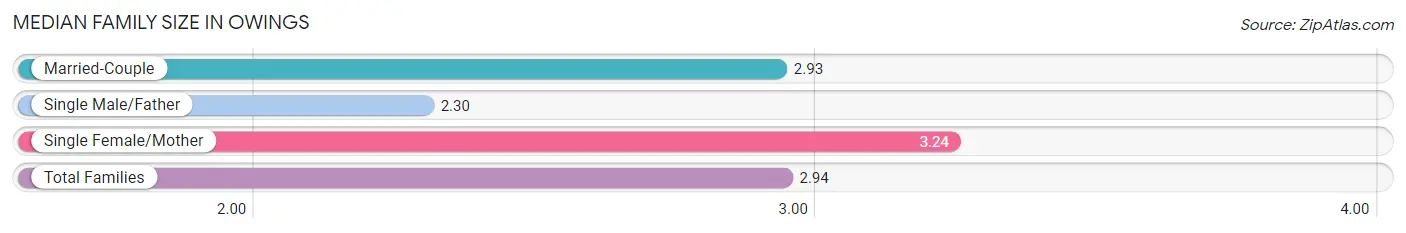
| Family Type | # Families | Family Size |
| Married-Couple | 676 (92.5%) | 2.93 |
| Single Male/Father | 10 (1.4%) | 2.30 |
| Single Female/Mother | 45 (6.2%) | 3.24 |
| Total Families | 731 (100.0%) | 2.94 |
Median Household Size in Owings
The median household size in Owings is 2.62 persons per household, with single female/mother households (45 | 5.0%) accounting for the largest median household size of 3.24 persons per household. non-family households (176 | 19.4%) represent the smallest median household size with 1.26 persons per household.
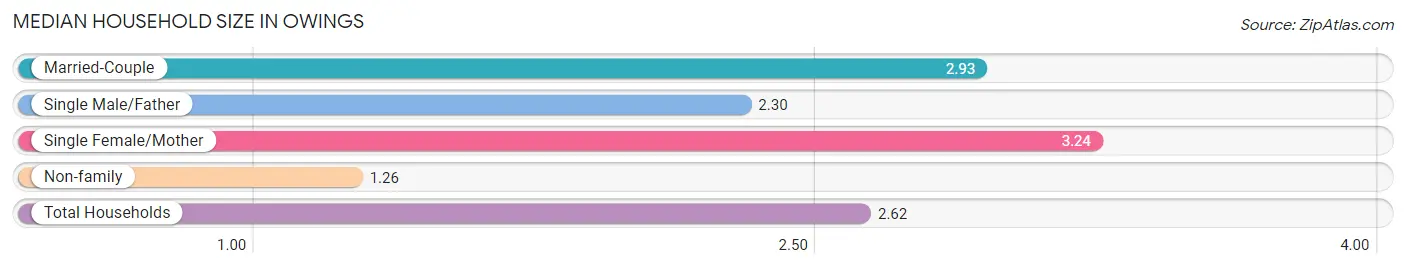
| Household Type | # Households | Household Size |
| Married-Couple | 676 (74.5%) | 2.93 |
| Single Male/Father | 10 (1.1%) | 2.30 |
| Single Female/Mother | 45 (5.0%) | 3.24 |
| Non-family | 176 (19.4%) | 1.26 |
| Total Households | 907 (100.0%) | 2.62 |
Household Size by Marriage Status in Owings
Out of a total of 907 households in Owings, 731 (80.6%) are family households, while 176 (19.4%) are nonfamily households. The most numerous type of family households are 2-person households, comprising 449, and the most common type of nonfamily households are 1-person households, comprising 121.
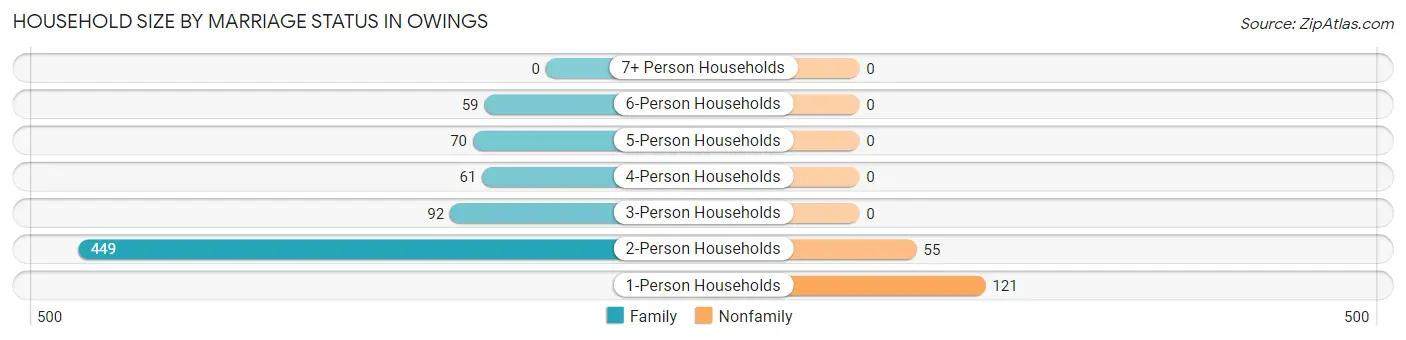
| Household Size | Family Households | Nonfamily Households |
| 1-Person Households | - | 121 (13.3%) |
| 2-Person Households | 449 (49.5%) | 55 (6.1%) |
| 3-Person Households | 92 (10.1%) | 0 (0.0%) |
| 4-Person Households | 61 (6.7%) | 0 (0.0%) |
| 5-Person Households | 70 (7.7%) | 0 (0.0%) |
| 6-Person Households | 59 (6.5%) | 0 (0.0%) |
| 7+ Person Households | 0 (0.0%) | 0 (0.0%) |
| Total | 731 (80.6%) | 176 (19.4%) |
Female Fertility in Owings
Fertility by Age in Owings
Average fertility rate in Owings is 34.0 births per 1,000 women. Women in the age bracket of 20 to 34 years have the highest fertility rate with 122.0 births per 1,000 women. Women in the age bracket of 20 to 34 years acount for 100.0% of all women with births.
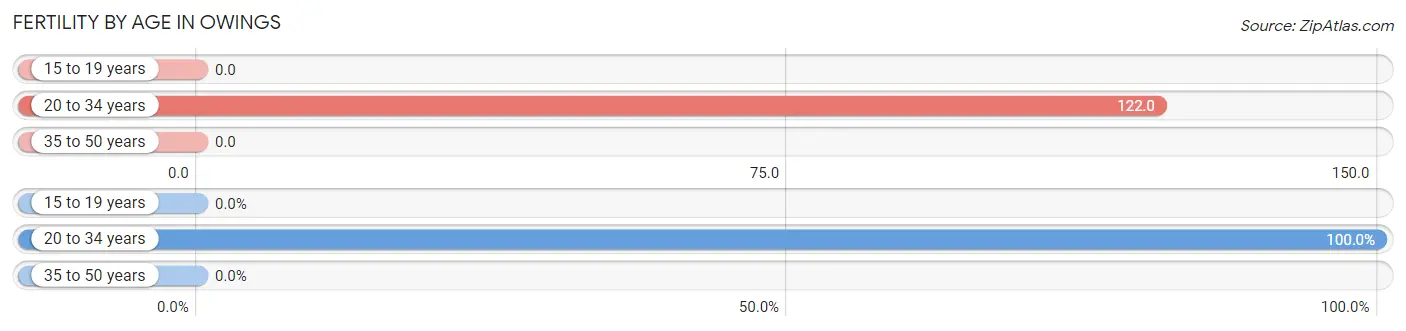
| Age Bracket | Women with Births | Births / 1,000 Women |
| 15 to 19 years | 0 (0.0%) | 0.0 |
| 20 to 34 years | 15 (100.0%) | 122.0 |
| 35 to 50 years | 0 (0.0%) | 0.0 |
| Total | 15 (100.0%) | 34.0 |
Fertility by Age by Marriage Status in Owings
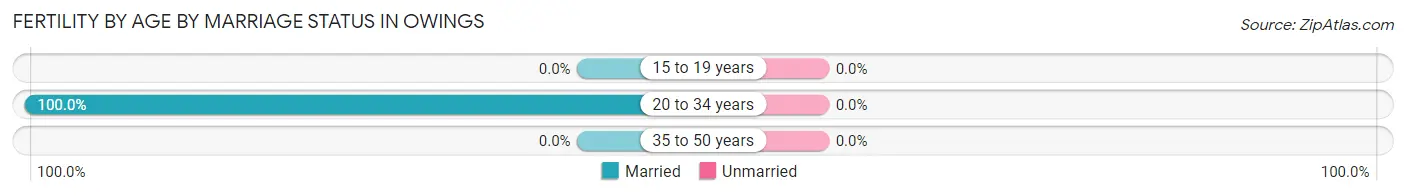
| Age Bracket | Married | Unmarried |
| 15 to 19 years | 0 (0.0%) | 0 (0.0%) |
| 20 to 34 years | 15 (100.0%) | 0 (0.0%) |
| 35 to 50 years | 0 (0.0%) | 0 (0.0%) |
| Total | 15 (100.0%) | 0 (0.0%) |
Fertility by Education in Owings
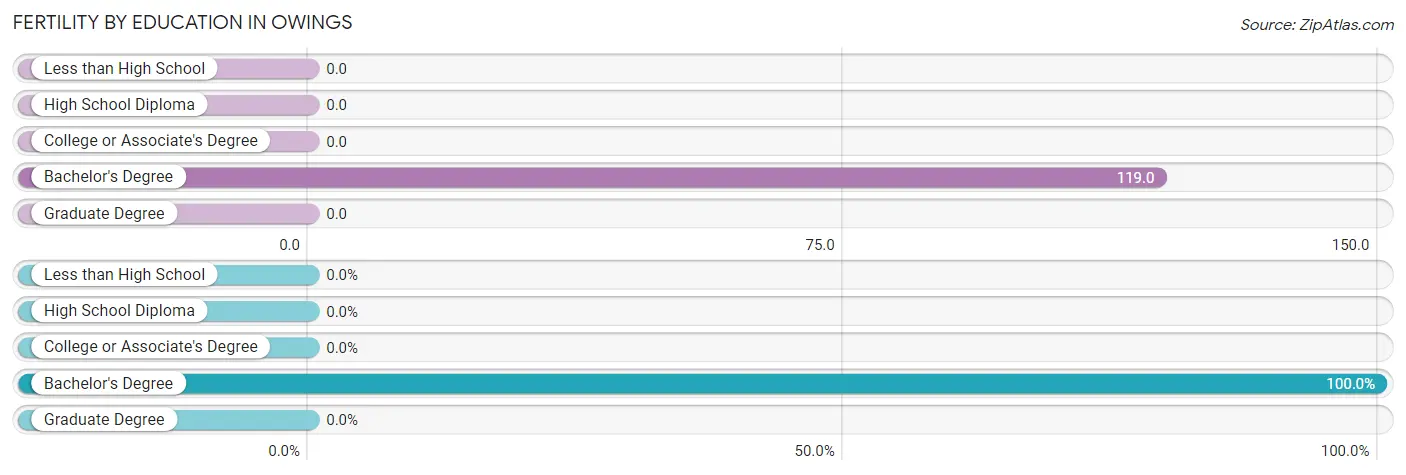
| Educational Attainment | Women with Births | Births / 1,000 Women |
| Less than High School | 0 (0.0%) | 0.0 |
| High School Diploma | 0 (0.0%) | 0.0 |
| College or Associate's Degree | 0 (0.0%) | 0.0 |
| Bachelor's Degree | 15 (100.0%) | 119.0 |
| Graduate Degree | 0 (0.0%) | 0.0 |
| Total | 15 (100.0%) | 34.0 |
Fertility by Education by Marriage Status in Owings
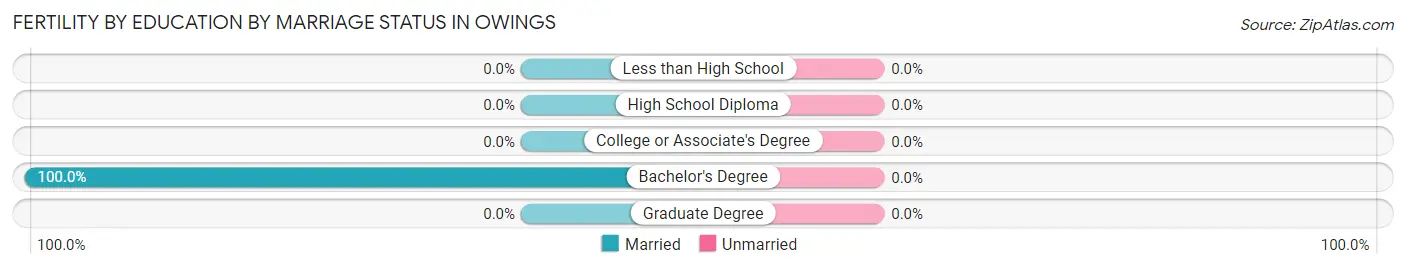
| Educational Attainment | Married | Unmarried |
| Less than High School | 0 (0.0%) | 0 (0.0%) |
| High School Diploma | 0 (0.0%) | 0 (0.0%) |
| College or Associate's Degree | 0 (0.0%) | 0 (0.0%) |
| Bachelor's Degree | 15 (100.0%) | 0 (0.0%) |
| Graduate Degree | 0 (0.0%) | 0 (0.0%) |
| Total | 15 (100.0%) | 0 (0.0%) |
Employment Characteristics in Owings
Employment by Class of Employer in Owings
Among the 1,434 employed individuals in Owings, private company employees (613 | 42.7%), local government employees (297 | 20.7%), and federal government employees (233 | 16.3%) make up the most common classes of employment.
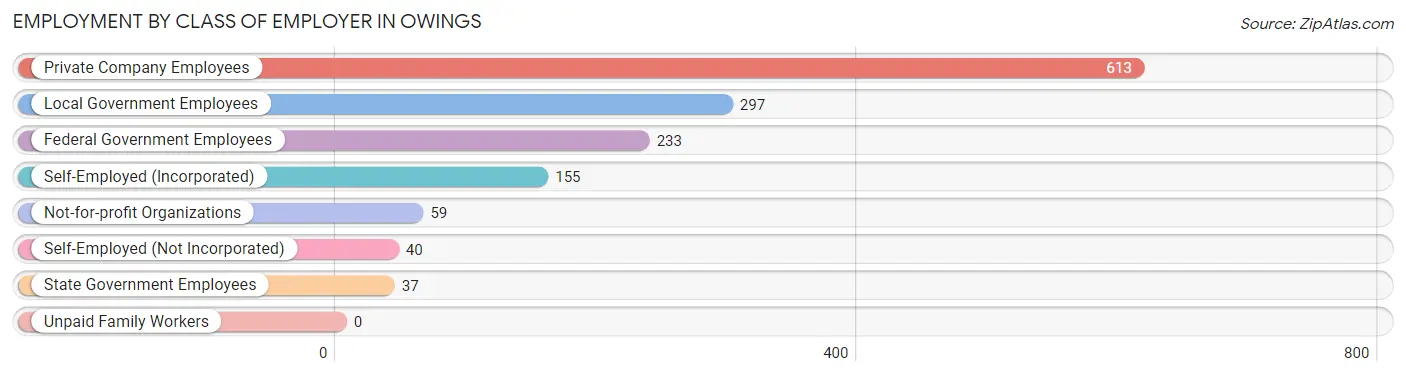
| Employer Class | # Employees | % Employees |
| Private Company Employees | 613 | 42.7% |
| Self-Employed (Incorporated) | 155 | 10.8% |
| Self-Employed (Not Incorporated) | 40 | 2.8% |
| Not-for-profit Organizations | 59 | 4.1% |
| Local Government Employees | 297 | 20.7% |
| State Government Employees | 37 | 2.6% |
| Federal Government Employees | 233 | 16.3% |
| Unpaid Family Workers | 0 | 0.0% |
| Total | 1,434 | 100.0% |
Employment Status by Age in Owings
According to the labor force statistics for Owings, out of the total population over 16 years of age (1,959), 74.2% or 1,454 individuals are in the labor force, with 1.4% or 20 of them unemployed. The age group with the highest labor force participation rate is 25 to 29 years, with 100.0% or 132 individuals in the labor force. Within the labor force, the 60 to 64 years age range has the highest percentage of unemployed individuals, with 3.2% or 13 of them being unemployed.
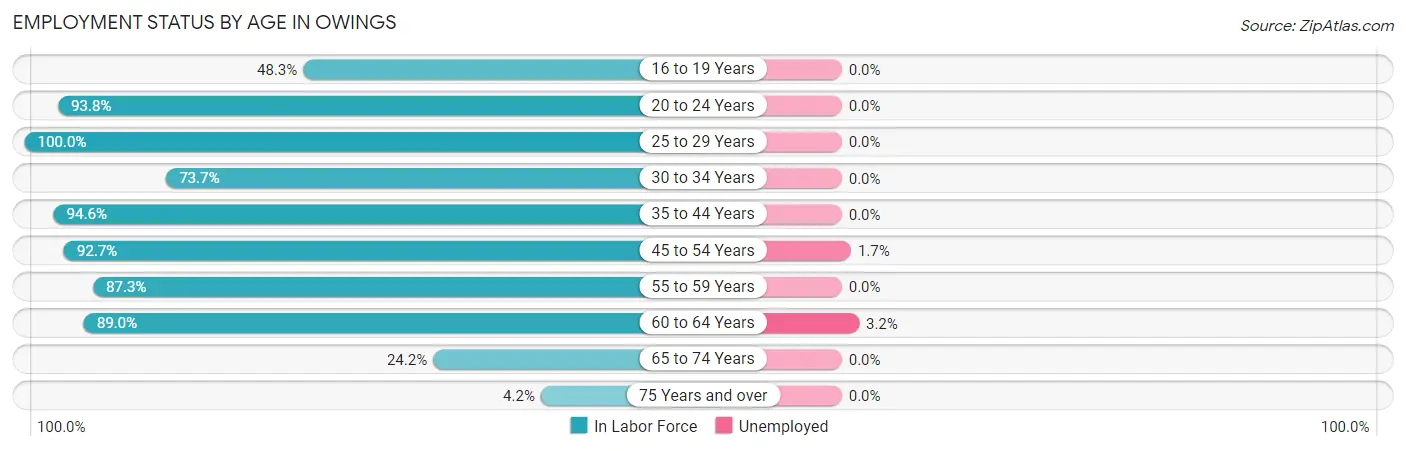
| Age Bracket | In Labor Force | Unemployed |
| 16 to 19 Years | 57 (48.3%) | 0 (0.0%) |
| 20 to 24 Years | 15 (93.8%) | 0 (0.0%) |
| 25 to 29 Years | 132 (100.0%) | 0 (0.0%) |
| 30 to 34 Years | 42 (73.7%) | 0 (0.0%) |
| 35 to 44 Years | 191 (94.6%) | 0 (0.0%) |
| 45 to 54 Years | 355 (92.7%) | 6 (1.7%) |
| 55 to 59 Years | 200 (87.3%) | 0 (0.0%) |
| 60 to 64 Years | 406 (89.0%) | 13 (3.2%) |
| 65 to 74 Years | 48 (24.2%) | 0 (0.0%) |
| 75 Years and over | 7 (4.2%) | 0 (0.0%) |
| Total | 1,454 (74.2%) | 20 (1.4%) |
Employment Status by Educational Attainment in Owings
According to labor force statistics for Owings, 90.9% of individuals (1,326) out of the total population between 25 and 64 years of age (1,459) are in the labor force, with 1.5% or 20 of them being unemployed. The group with the highest labor force participation rate are those with the educational attainment of less than high school, with 100.0% or 47 individuals in the labor force. Within the labor force, individuals with college / associate degree education have the highest percentage of unemployment, with 3.8% or 15 of them being unemployed.
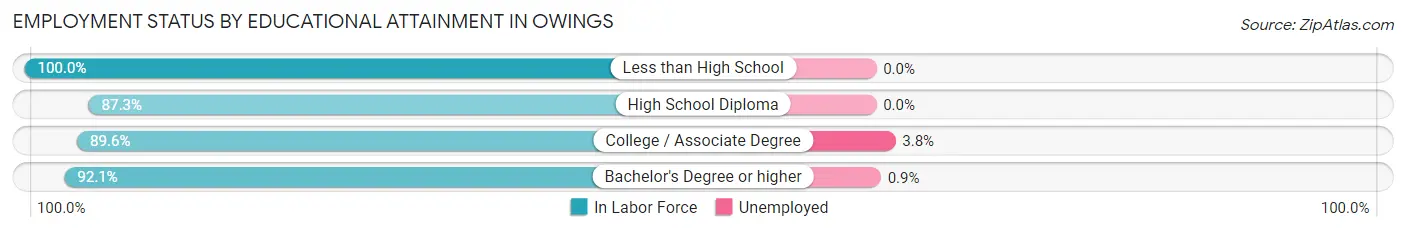
| Educational Attainment | In Labor Force | Unemployed |
| Less than High School | 47 (100.0%) | 0 (0.0%) |
| High School Diploma | 186 (87.3%) | 0 (0.0%) |
| College / Associate Degree | 395 (89.6%) | 17 (3.8%) |
| Bachelor's Degree or higher | 698 (92.1%) | 7 (0.9%) |
| Total | 1,326 (90.9%) | 22 (1.5%) |
Employment Occupations by Sex in Owings
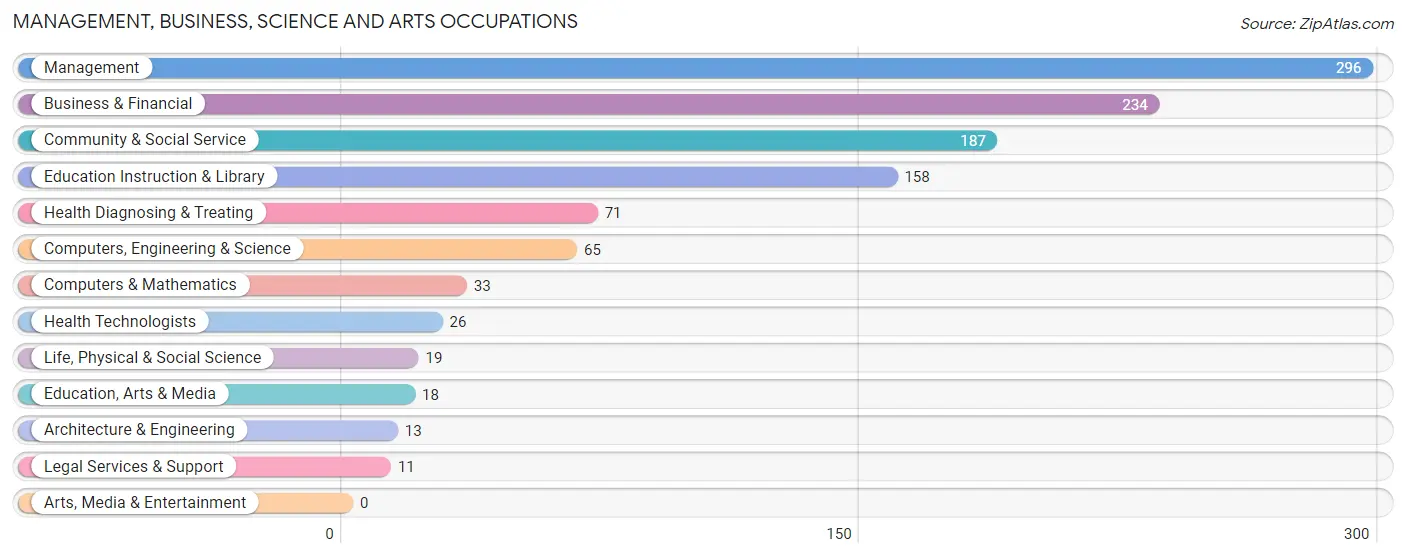
Management, Business, Science and Arts Occupations
The most common Management, Business, Science and Arts occupations in Owings are Management (296 | 21.9%), Business & Financial (234 | 17.3%), Community & Social Service (187 | 13.8%), Education Instruction & Library (158 | 11.7%), and Health Diagnosing & Treating (71 | 5.3%).
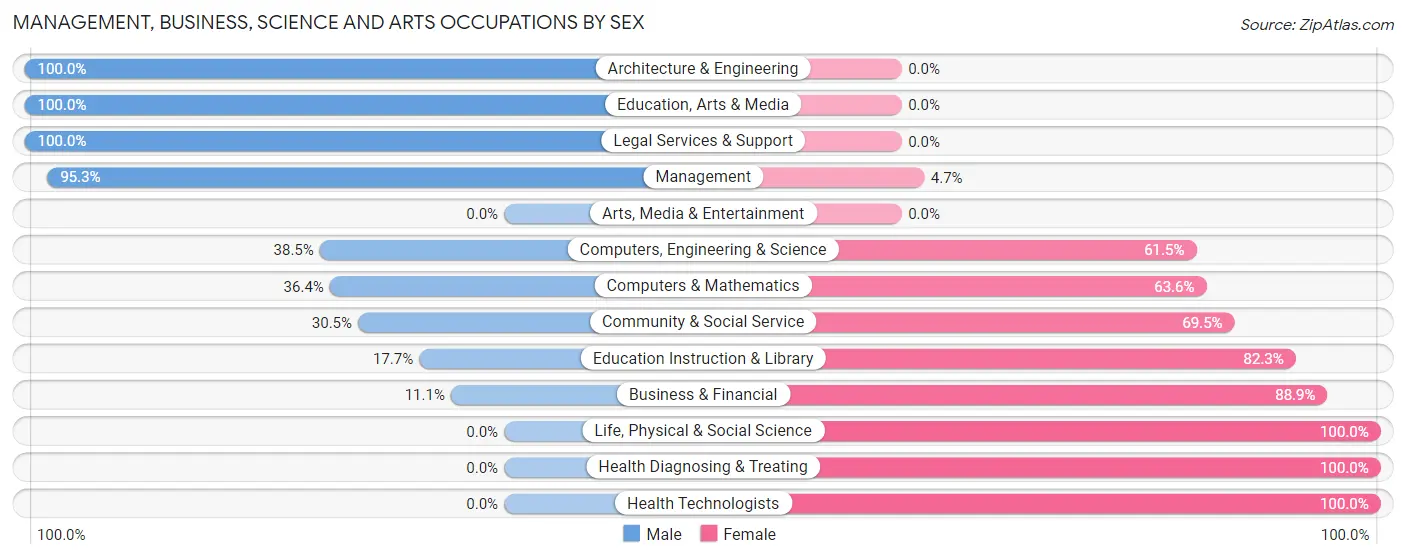
Management, Business, Science and Arts Occupations by Sex
Within the Management, Business, Science and Arts occupations in Owings, the most male-oriented occupations are Architecture & Engineering (100.0%), Education, Arts & Media (100.0%), and Legal Services & Support (100.0%), while the most female-oriented occupations are Life, Physical & Social Science (100.0%), Health Diagnosing & Treating (100.0%), and Health Technologists (100.0%).
| Occupation | Male | Female |
| Management | 282 (95.3%) | 14 (4.7%) |
| Business & Financial | 26 (11.1%) | 208 (88.9%) |
| Computers, Engineering & Science | 25 (38.5%) | 40 (61.5%) |
| Computers & Mathematics | 12 (36.4%) | 21 (63.6%) |
| Architecture & Engineering | 13 (100.0%) | 0 (0.0%) |
| Life, Physical & Social Science | 0 (0.0%) | 19 (100.0%) |
| Community & Social Service | 57 (30.5%) | 130 (69.5%) |
| Education, Arts & Media | 18 (100.0%) | 0 (0.0%) |
| Legal Services & Support | 11 (100.0%) | 0 (0.0%) |
| Education Instruction & Library | 28 (17.7%) | 130 (82.3%) |
| Arts, Media & Entertainment | 0 (0.0%) | 0 (0.0%) |
| Health Diagnosing & Treating | 0 (0.0%) | 71 (100.0%) |
| Health Technologists | 0 (0.0%) | 26 (100.0%) |
| Total (Category) | 390 (45.7%) | 463 (54.3%) |
| Total (Overall) | 664 (49.1%) | 687 (50.8%) |
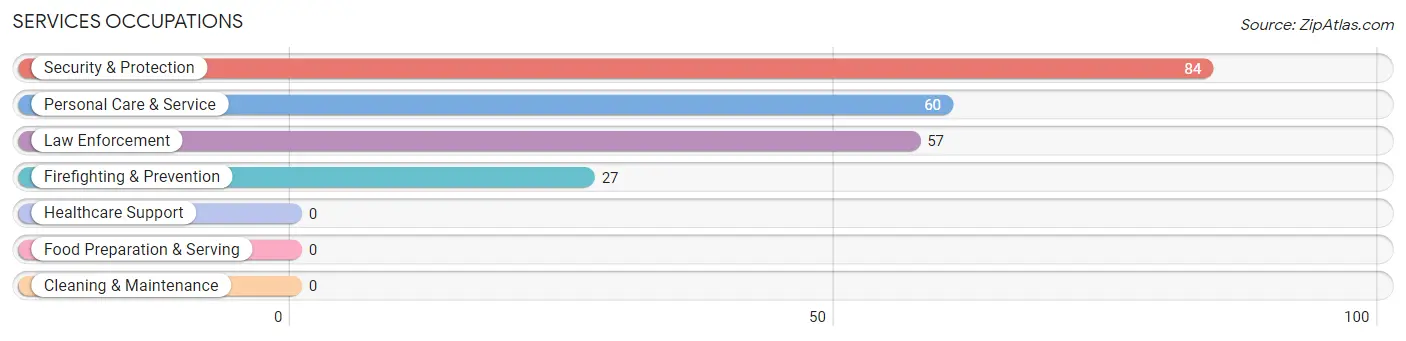
Services Occupations
The most common Services occupations in Owings are Security & Protection (84 | 6.2%), Personal Care & Service (60 | 4.4%), Law Enforcement (57 | 4.2%), and Firefighting & Prevention (27 | 2.0%).
Services Occupations by Sex
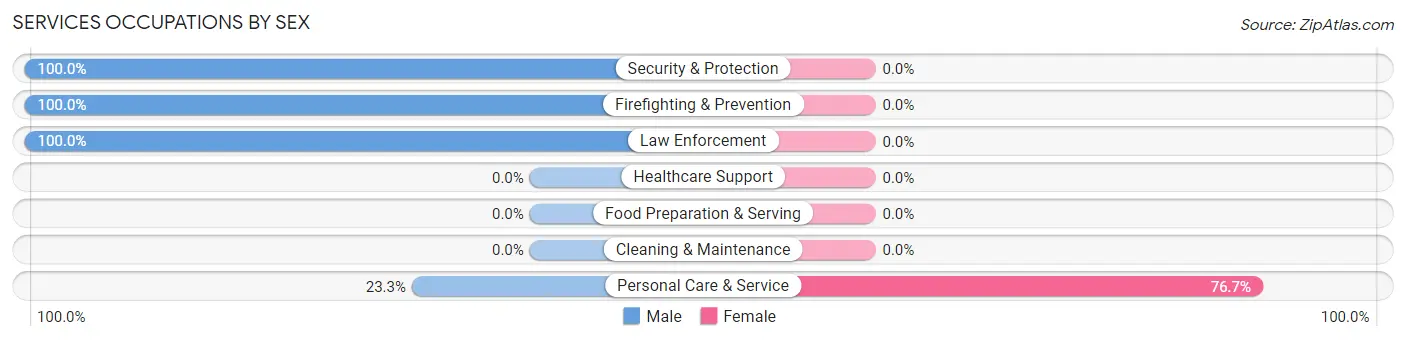
| Occupation | Male | Female |
| Healthcare Support | 0 (0.0%) | 0 (0.0%) |
| Security & Protection | 84 (100.0%) | 0 (0.0%) |
| Firefighting & Prevention | 27 (100.0%) | 0 (0.0%) |
| Law Enforcement | 57 (100.0%) | 0 (0.0%) |
| Food Preparation & Serving | 0 (0.0%) | 0 (0.0%) |
| Cleaning & Maintenance | 0 (0.0%) | 0 (0.0%) |
| Personal Care & Service | 14 (23.3%) | 46 (76.7%) |
| Total (Category) | 98 (68.1%) | 46 (31.9%) |
| Total (Overall) | 664 (49.1%) | 687 (50.8%) |
Sales and Office Occupations
The most common Sales and Office occupations in Owings are Office & Administration (178 | 13.2%), and Sales & Related (47 | 3.5%).
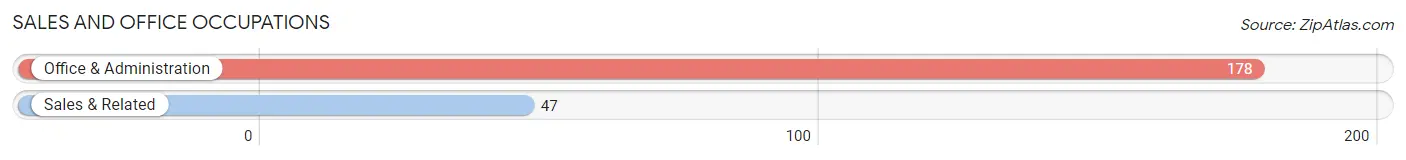
Sales and Office Occupations by Sex
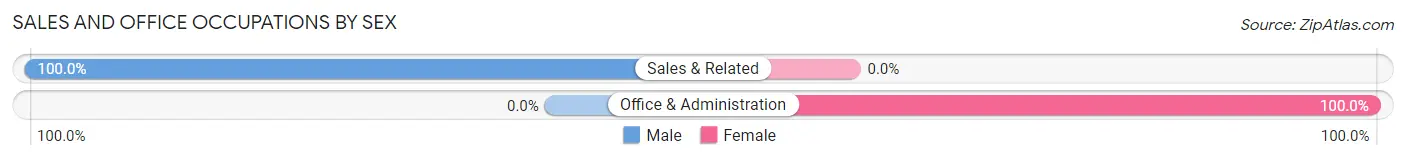
| Occupation | Male | Female |
| Sales & Related | 47 (100.0%) | 0 (0.0%) |
| Office & Administration | 0 (0.0%) | 178 (100.0%) |
| Total (Category) | 47 (20.9%) | 178 (79.1%) |
| Total (Overall) | 664 (49.1%) | 687 (50.8%) |
Natural Resources, Construction and Maintenance Occupations
The most common Natural Resources, Construction and Maintenance occupations in Owings are Construction & Extraction (74 | 5.5%), and Installation, Maintenance & Repair (28 | 2.1%).
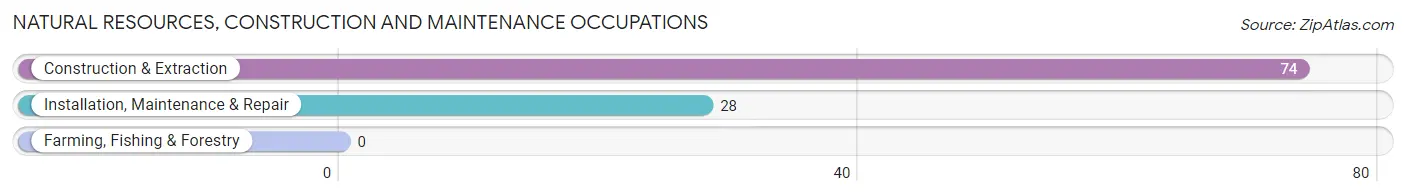
Natural Resources, Construction and Maintenance Occupations by Sex
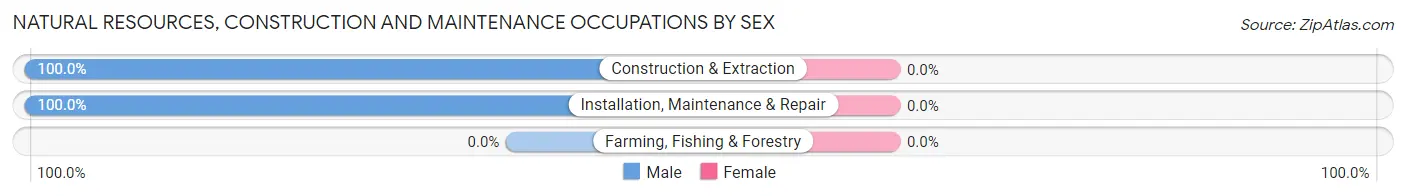
| Occupation | Male | Female |
| Farming, Fishing & Forestry | 0 (0.0%) | 0 (0.0%) |
| Construction & Extraction | 74 (100.0%) | 0 (0.0%) |
| Installation, Maintenance & Repair | 28 (100.0%) | 0 (0.0%) |
| Total (Category) | 102 (100.0%) | 0 (0.0%) |
| Total (Overall) | 664 (49.1%) | 687 (50.8%) |
Production, Transportation and Moving Occupations
The most common Production, Transportation and Moving occupations in Owings are Transportation (18 | 1.3%), and Production (9 | 0.7%).
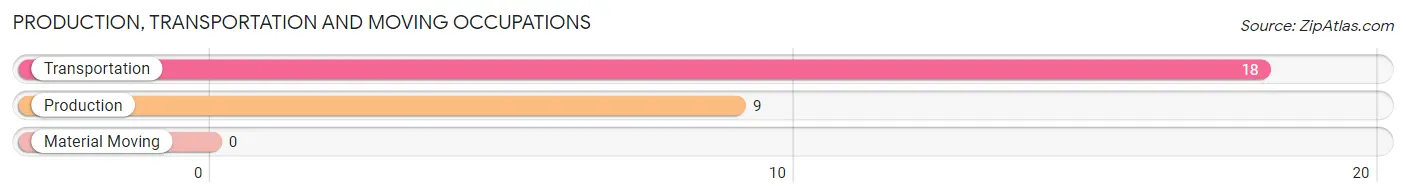
Production, Transportation and Moving Occupations by Sex
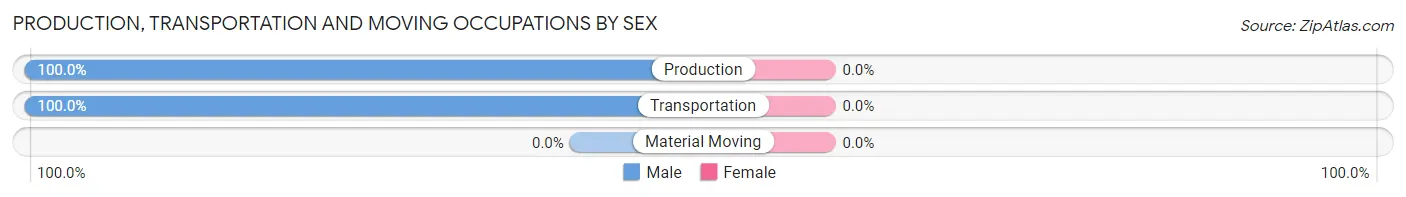
| Occupation | Male | Female |
| Production | 9 (100.0%) | 0 (0.0%) |
| Transportation | 18 (100.0%) | 0 (0.0%) |
| Material Moving | 0 (0.0%) | 0 (0.0%) |
| Total (Category) | 27 (100.0%) | 0 (0.0%) |
| Total (Overall) | 664 (49.1%) | 687 (50.8%) |
Employment Industries by Sex in Owings
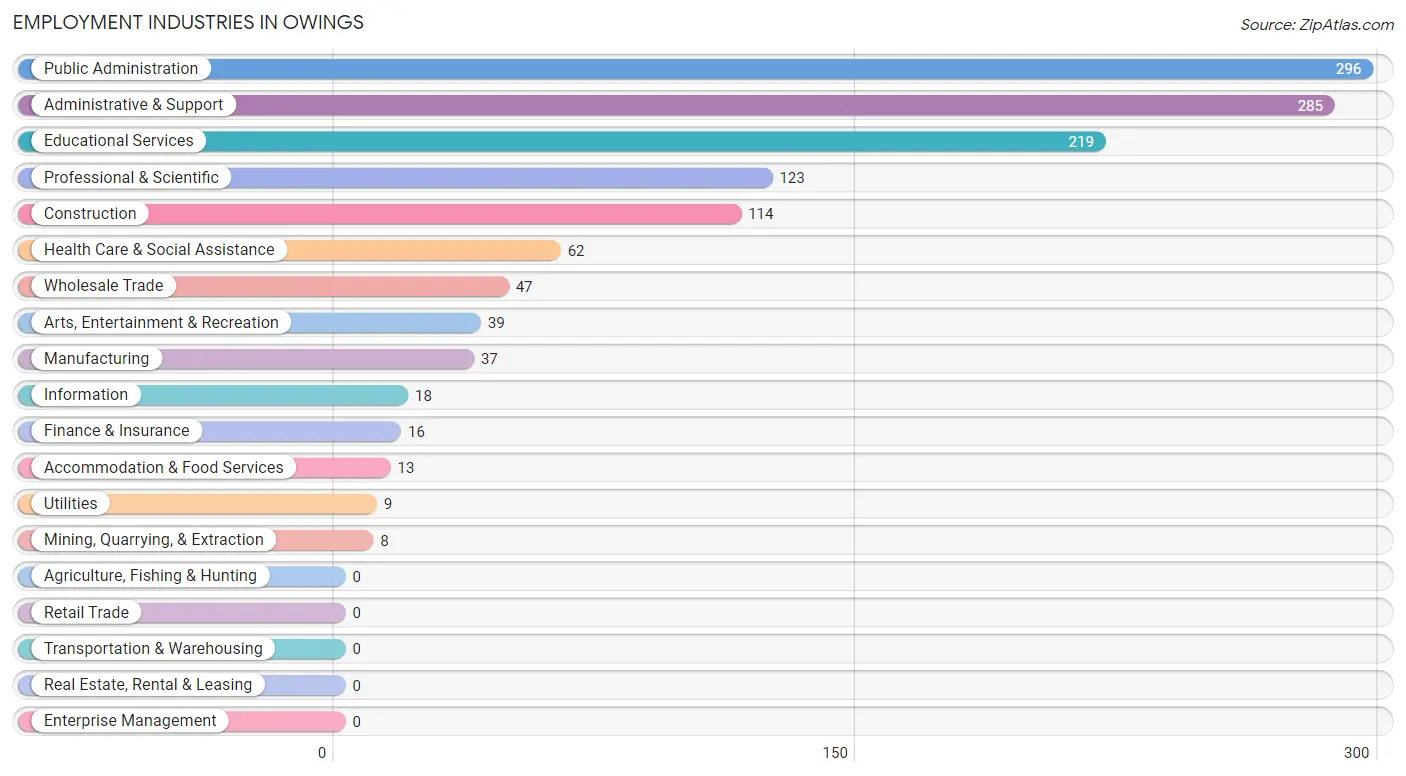
Employment Industries in Owings
The major employment industries in Owings include Public Administration (296 | 21.9%), Administrative & Support (285 | 21.1%), Educational Services (219 | 16.2%), Professional & Scientific (123 | 9.1%), and Construction (114 | 8.4%).
Employment Industries by Sex in Owings
The Owings industries that see more men than women are Mining, Quarrying, & Extraction (100.0%), Construction (100.0%), and Wholesale Trade (100.0%), whereas the industries that tend to have a higher number of women are Manufacturing (100.0%), Information (100.0%), and Finance & Insurance (100.0%).
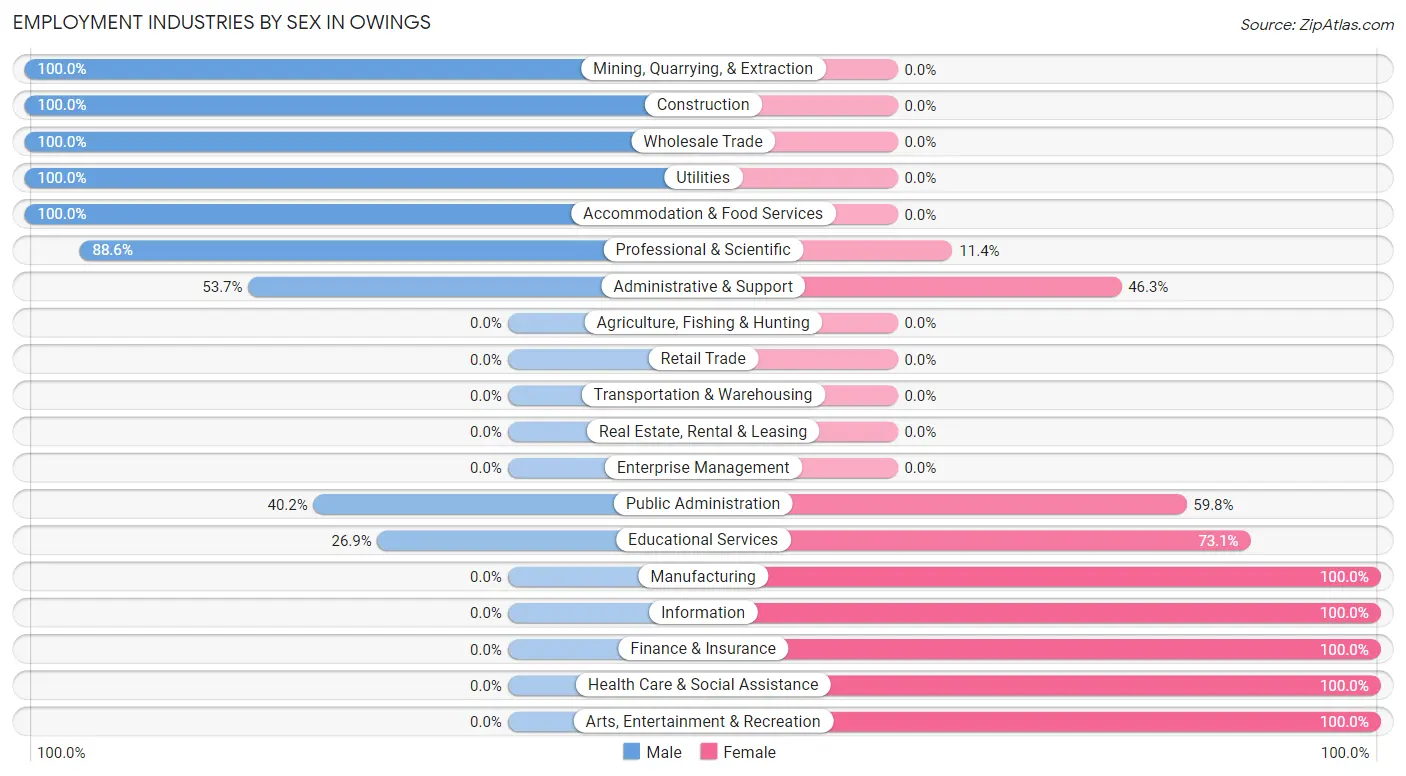
| Industry | Male | Female |
| Agriculture, Fishing & Hunting | 0 (0.0%) | 0 (0.0%) |
| Mining, Quarrying, & Extraction | 8 (100.0%) | 0 (0.0%) |
| Construction | 114 (100.0%) | 0 (0.0%) |
| Manufacturing | 0 (0.0%) | 37 (100.0%) |
| Wholesale Trade | 47 (100.0%) | 0 (0.0%) |
| Retail Trade | 0 (0.0%) | 0 (0.0%) |
| Transportation & Warehousing | 0 (0.0%) | 0 (0.0%) |
| Utilities | 9 (100.0%) | 0 (0.0%) |
| Information | 0 (0.0%) | 18 (100.0%) |
| Finance & Insurance | 0 (0.0%) | 16 (100.0%) |
| Real Estate, Rental & Leasing | 0 (0.0%) | 0 (0.0%) |
| Professional & Scientific | 109 (88.6%) | 14 (11.4%) |
| Enterprise Management | 0 (0.0%) | 0 (0.0%) |
| Administrative & Support | 153 (53.7%) | 132 (46.3%) |
| Educational Services | 59 (26.9%) | 160 (73.1%) |
| Health Care & Social Assistance | 0 (0.0%) | 62 (100.0%) |
| Arts, Entertainment & Recreation | 0 (0.0%) | 39 (100.0%) |
| Accommodation & Food Services | 13 (100.0%) | 0 (0.0%) |
| Public Administration | 119 (40.2%) | 177 (59.8%) |
| Total | 664 (49.1%) | 687 (50.8%) |
Education in Owings
School Enrollment in Owings
The most common levels of schooling among the 547 students in Owings are middle school (199 | 36.4%), college / undergraduate (120 | 21.9%), and high school (112 | 20.5%).
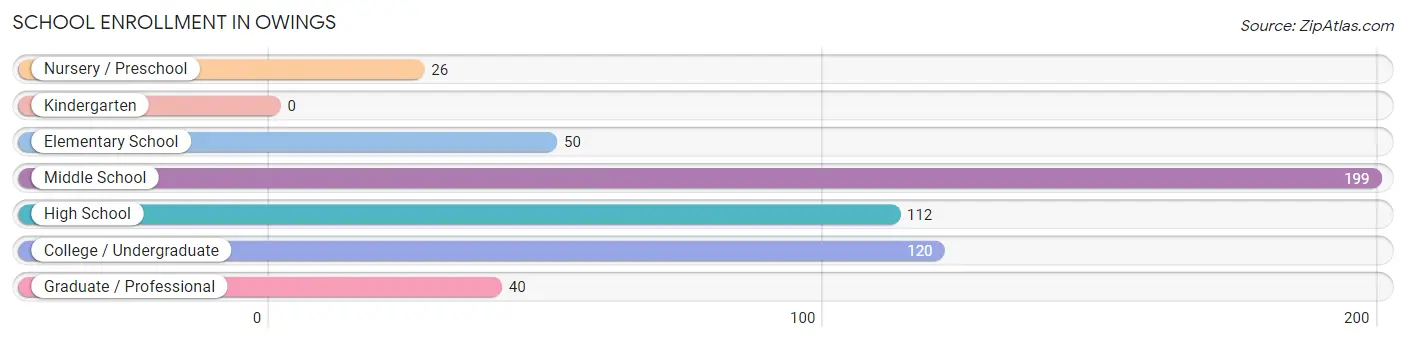
| School Level | # Students | % Students |
| Nursery / Preschool | 26 | 4.8% |
| Kindergarten | 0 | 0.0% |
| Elementary School | 50 | 9.1% |
| Middle School | 199 | 36.4% |
| High School | 112 | 20.5% |
| College / Undergraduate | 120 | 21.9% |
| Graduate / Professional | 40 | 7.3% |
| Total | 547 | 100.0% |
School Enrollment by Age by Funding Source in Owings
Out of a total of 547 students who are enrolled in schools in Owings, 78 (14.3%) attend a private institution, while the remaining 469 (85.7%) are enrolled in public schools. The age group of 15 to 17 year olds has the highest likelihood of being enrolled in private schools, with 42 (53.8% in the age bracket) enrolled. Conversely, the age group of 3 to 4 year olds has the lowest likelihood of being enrolled in a private school, with 15 (100.0% in the age bracket) attending a public institution.
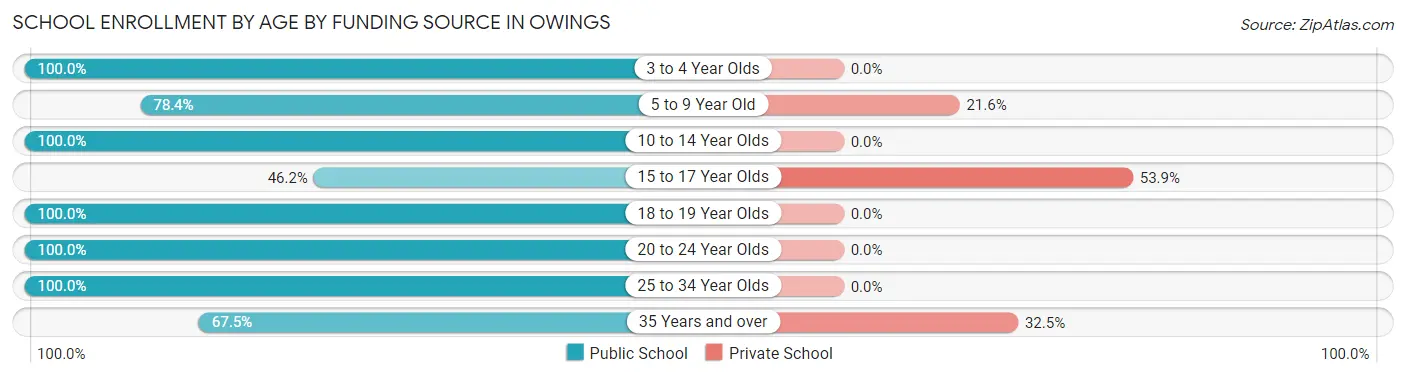
| Age Bracket | Public School | Private School |
| 3 to 4 Year Olds | 15 (100.0%) | 0 (0.0%) |
| 5 to 9 Year Old | 40 (78.4%) | 11 (21.6%) |
| 10 to 14 Year Olds | 243 (100.0%) | 0 (0.0%) |
| 15 to 17 Year Olds | 36 (46.2%) | 42 (53.8%) |
| 18 to 19 Year Olds | 27 (100.0%) | 0 (0.0%) |
| 20 to 24 Year Olds | 1 (100.0%) | 0 (0.0%) |
| 25 to 34 Year Olds | 55 (100.0%) | 0 (0.0%) |
| 35 Years and over | 52 (67.5%) | 25 (32.5%) |
| Total | 469 (85.7%) | 78 (14.3%) |
Educational Attainment by Field of Study in Owings
Engineering (173 | 19.7%), business (148 | 16.9%), education (134 | 15.3%), social sciences (96 | 10.9%), and bio, nature & agricultural (80 | 9.1%) are the most common fields of study among 878 individuals in Owings who have obtained a bachelor's degree or higher.
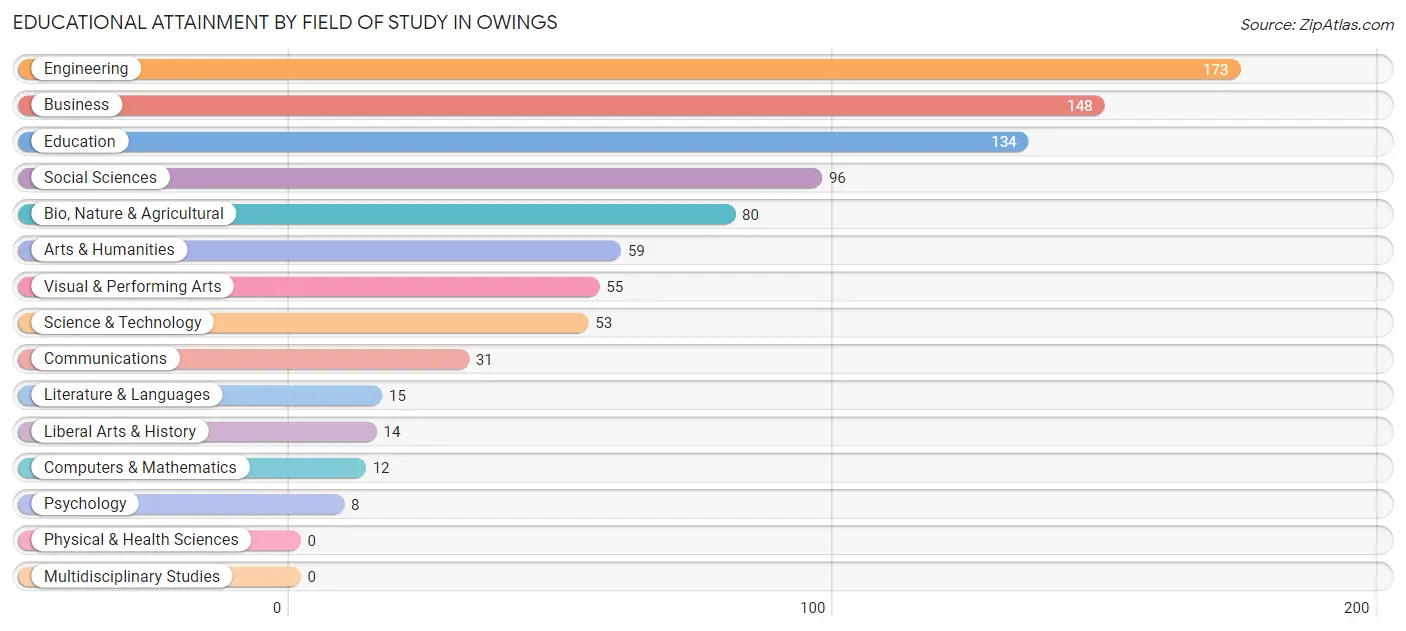
| Field of Study | # Graduates | % Graduates |
| Computers & Mathematics | 12 | 1.4% |
| Bio, Nature & Agricultural | 80 | 9.1% |
| Physical & Health Sciences | 0 | 0.0% |
| Psychology | 8 | 0.9% |
| Social Sciences | 96 | 10.9% |
| Engineering | 173 | 19.7% |
| Multidisciplinary Studies | 0 | 0.0% |
| Science & Technology | 53 | 6.0% |
| Business | 148 | 16.9% |
| Education | 134 | 15.3% |
| Literature & Languages | 15 | 1.7% |
| Liberal Arts & History | 14 | 1.6% |
| Visual & Performing Arts | 55 | 6.3% |
| Communications | 31 | 3.5% |
| Arts & Humanities | 59 | 6.7% |
| Total | 878 | 100.0% |
Transportation & Commute in Owings
Vehicle Availability by Sex in Owings
The most prevalent vehicle ownership categories in Owings are males with 3 vehicles (212, accounting for 29.6%) and females with 3 vehicles (255, making up 29.5%).
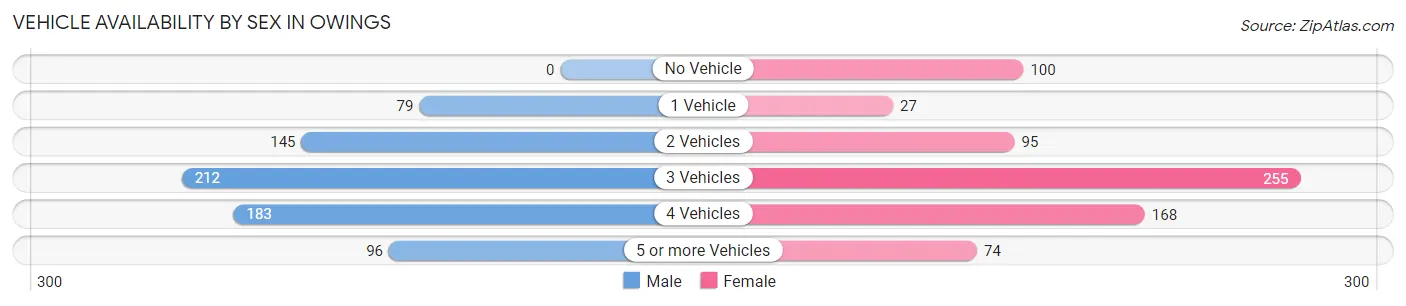
| Vehicles Available | Male | Female |
| No Vehicle | 0 (0.0%) | 100 (13.9%) |
| 1 Vehicle | 79 (11.1%) | 27 (3.8%) |
| 2 Vehicles | 145 (20.3%) | 95 (13.2%) |
| 3 Vehicles | 212 (29.6%) | 255 (35.5%) |
| 4 Vehicles | 183 (25.6%) | 168 (23.4%) |
| 5 or more Vehicles | 96 (13.4%) | 74 (10.3%) |
| Total | 715 (100.0%) | 719 (100.0%) |
Commute Time in Owings
The most frequently occuring commute durations in Owings are 5 to 9 minutes (343 commuters, 24.8%), 45 to 59 minutes (329 commuters, 23.7%), and 60 to 89 minutes (224 commuters, 16.2%).
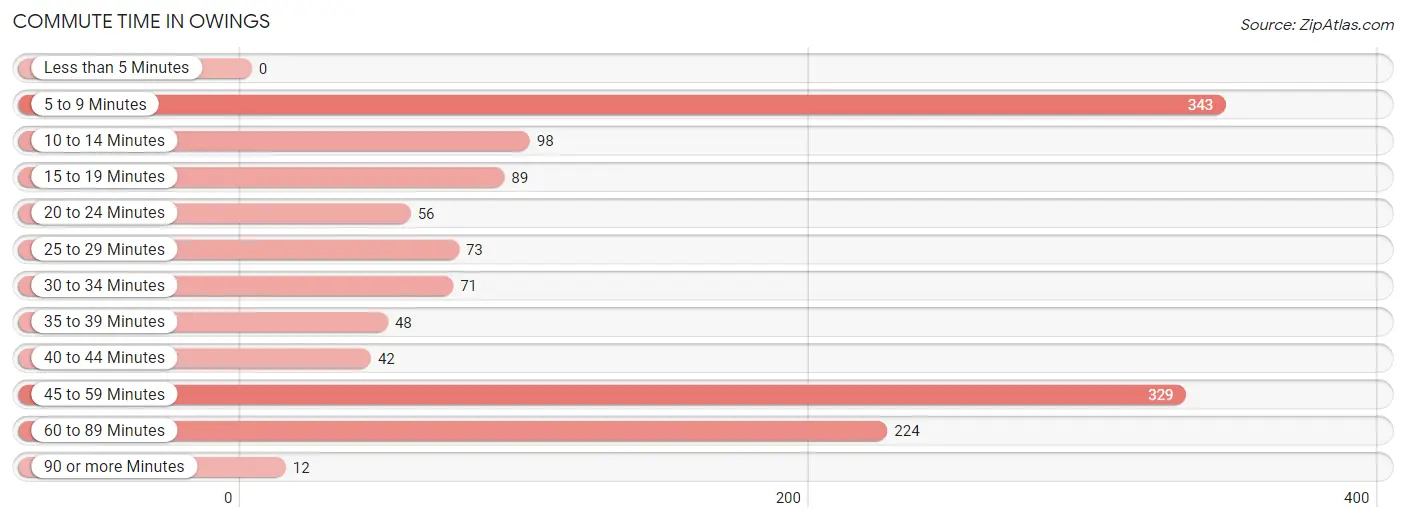
| Commute Time | # Commuters | % Commuters |
| Less than 5 Minutes | 0 | 0.0% |
| 5 to 9 Minutes | 343 | 24.8% |
| 10 to 14 Minutes | 98 | 7.1% |
| 15 to 19 Minutes | 89 | 6.4% |
| 20 to 24 Minutes | 56 | 4.0% |
| 25 to 29 Minutes | 73 | 5.3% |
| 30 to 34 Minutes | 71 | 5.1% |
| 35 to 39 Minutes | 48 | 3.5% |
| 40 to 44 Minutes | 42 | 3.0% |
| 45 to 59 Minutes | 329 | 23.7% |
| 60 to 89 Minutes | 224 | 16.2% |
| 90 or more Minutes | 12 | 0.9% |
Commute Time by Sex in Owings
The most common commute times in Owings are 45 to 59 minutes (256 commuters, 35.8%) for males and 5 to 9 minutes (181 commuters, 27.0%) for females.
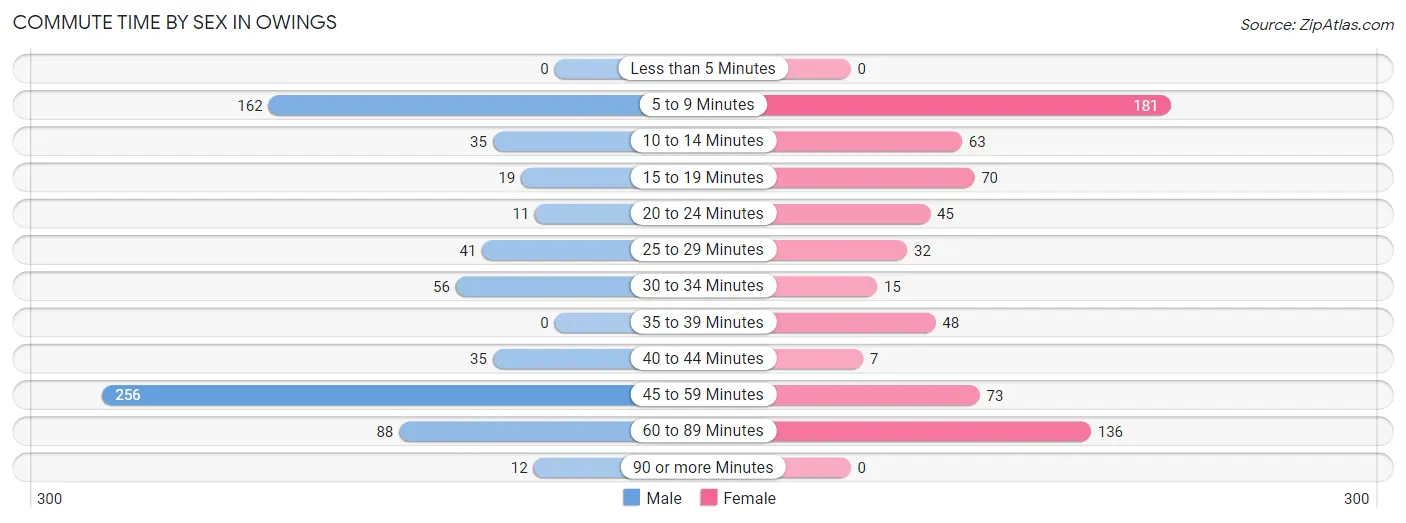
| Commute Time | Male | Female |
| Less than 5 Minutes | 0 (0.0%) | 0 (0.0%) |
| 5 to 9 Minutes | 162 (22.7%) | 181 (27.0%) |
| 10 to 14 Minutes | 35 (4.9%) | 63 (9.4%) |
| 15 to 19 Minutes | 19 (2.7%) | 70 (10.4%) |
| 20 to 24 Minutes | 11 (1.5%) | 45 (6.7%) |
| 25 to 29 Minutes | 41 (5.7%) | 32 (4.8%) |
| 30 to 34 Minutes | 56 (7.8%) | 15 (2.2%) |
| 35 to 39 Minutes | 0 (0.0%) | 48 (7.2%) |
| 40 to 44 Minutes | 35 (4.9%) | 7 (1.0%) |
| 45 to 59 Minutes | 256 (35.8%) | 73 (10.9%) |
| 60 to 89 Minutes | 88 (12.3%) | 136 (20.3%) |
| 90 or more Minutes | 12 (1.7%) | 0 (0.0%) |
Time of Departure to Work by Sex in Owings
The most frequent times of departure to work in Owings are 6:00 AM to 6:29 AM (164, 22.9%) for males and 10:00 AM to 10:59 AM (132, 19.7%) for females.
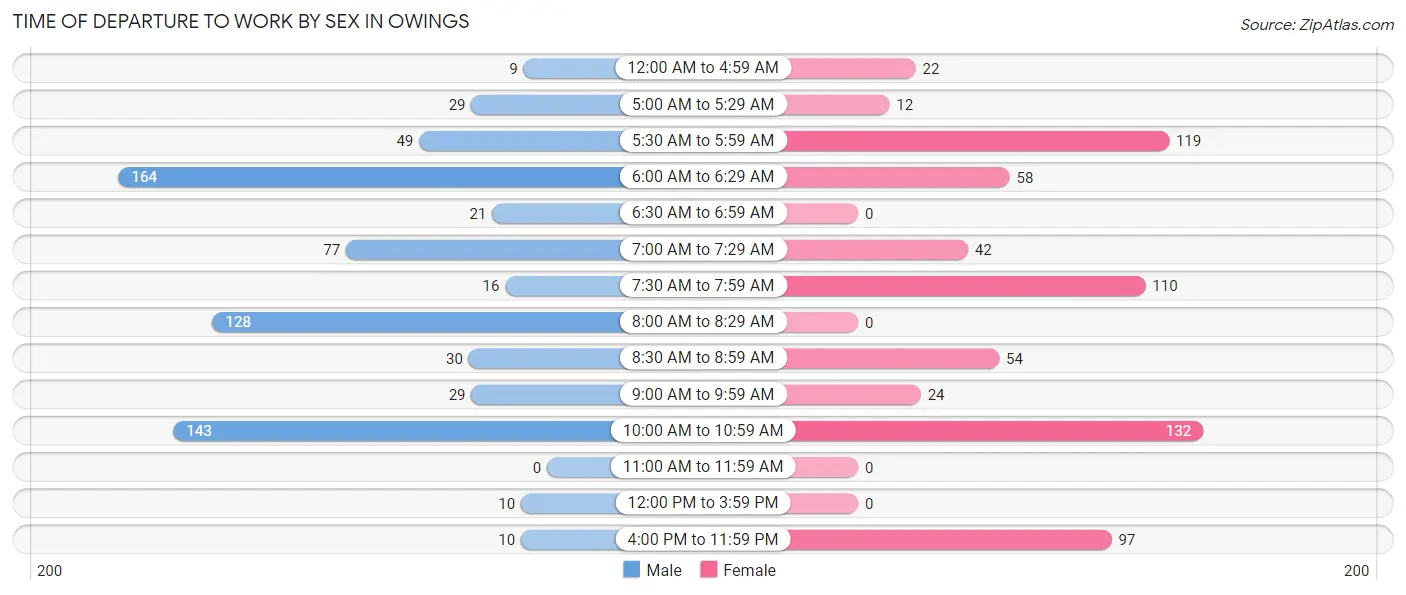
| Time of Departure | Male | Female |
| 12:00 AM to 4:59 AM | 9 (1.3%) | 22 (3.3%) |
| 5:00 AM to 5:29 AM | 29 (4.1%) | 12 (1.8%) |
| 5:30 AM to 5:59 AM | 49 (6.9%) | 119 (17.8%) |
| 6:00 AM to 6:29 AM | 164 (22.9%) | 58 (8.7%) |
| 6:30 AM to 6:59 AM | 21 (2.9%) | 0 (0.0%) |
| 7:00 AM to 7:29 AM | 77 (10.8%) | 42 (6.3%) |
| 7:30 AM to 7:59 AM | 16 (2.2%) | 110 (16.4%) |
| 8:00 AM to 8:29 AM | 128 (17.9%) | 0 (0.0%) |
| 8:30 AM to 8:59 AM | 30 (4.2%) | 54 (8.1%) |
| 9:00 AM to 9:59 AM | 29 (4.1%) | 24 (3.6%) |
| 10:00 AM to 10:59 AM | 143 (20.0%) | 132 (19.7%) |
| 11:00 AM to 11:59 AM | 0 (0.0%) | 0 (0.0%) |
| 12:00 PM to 3:59 PM | 10 (1.4%) | 0 (0.0%) |
| 4:00 PM to 11:59 PM | 10 (1.4%) | 97 (14.5%) |
| Total | 715 (100.0%) | 670 (100.0%) |
Housing Occupancy in Owings
Occupancy by Ownership in Owings
Of the total 907 dwellings in Owings, owner-occupied units account for 847 (93.4%), while renter-occupied units make up 60 (6.6%).
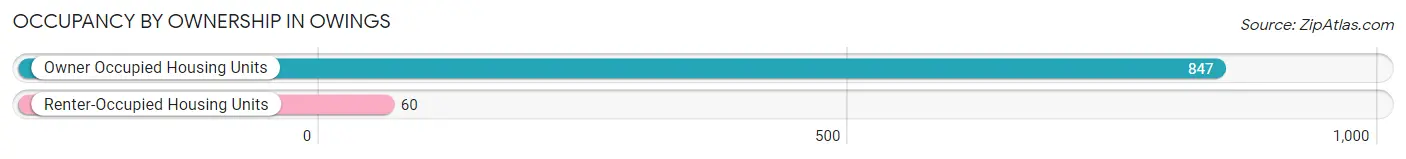
| Occupancy | # Housing Units | % Housing Units |
| Owner Occupied Housing Units | 847 | 93.4% |
| Renter-Occupied Housing Units | 60 | 6.6% |
| Total Occupied Housing Units | 907 | 100.0% |
Occupancy by Household Size in Owings
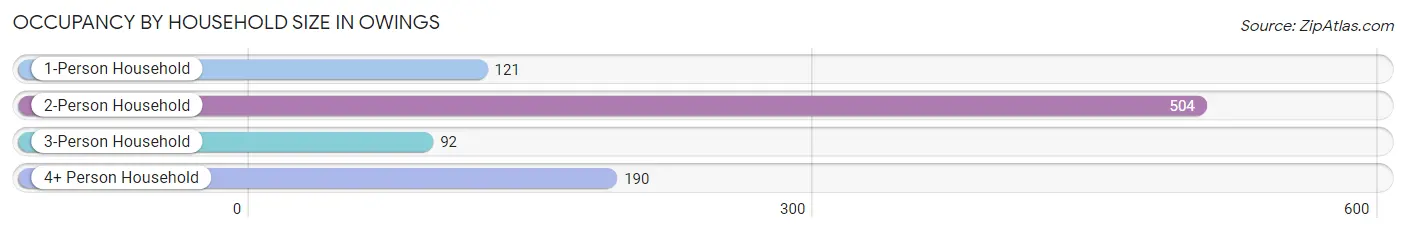
| Household Size | # Housing Units | % Housing Units |
| 1-Person Household | 121 | 13.3% |
| 2-Person Household | 504 | 55.6% |
| 3-Person Household | 92 | 10.1% |
| 4+ Person Household | 190 | 20.9% |
| Total Housing Units | 907 | 100.0% |
Occupancy by Ownership by Household Size in Owings
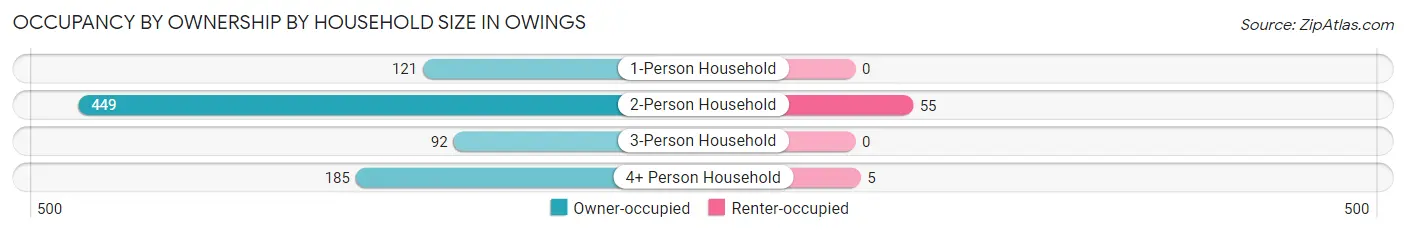
| Household Size | Owner-occupied | Renter-occupied |
| 1-Person Household | 121 (100.0%) | 0 (0.0%) |
| 2-Person Household | 449 (89.1%) | 55 (10.9%) |
| 3-Person Household | 92 (100.0%) | 0 (0.0%) |
| 4+ Person Household | 185 (97.4%) | 5 (2.6%) |
| Total Housing Units | 847 (93.4%) | 60 (6.6%) |
Occupancy by Educational Attainment in Owings
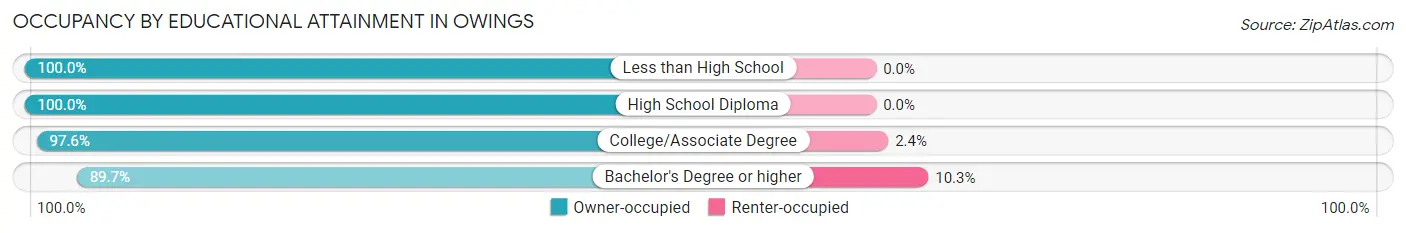
| Household Size | Owner-occupied | Renter-occupied |
| Less than High School | 52 (100.0%) | 0 (0.0%) |
| High School Diploma | 114 (100.0%) | 0 (0.0%) |
| College/Associate Degree | 204 (97.6%) | 5 (2.4%) |
| Bachelor's Degree or higher | 477 (89.7%) | 55 (10.3%) |
Occupancy by Age of Householder in Owings
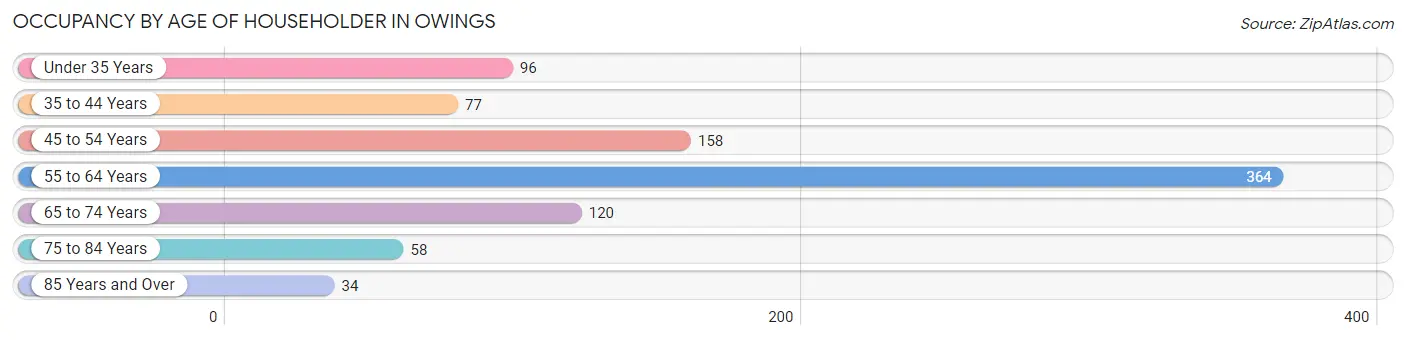
| Age Bracket | # Households | % Households |
| Under 35 Years | 96 | 10.6% |
| 35 to 44 Years | 77 | 8.5% |
| 45 to 54 Years | 158 | 17.4% |
| 55 to 64 Years | 364 | 40.1% |
| 65 to 74 Years | 120 | 13.2% |
| 75 to 84 Years | 58 | 6.4% |
| 85 Years and Over | 34 | 3.7% |
| Total | 907 | 100.0% |
Housing Finances in Owings
Median Income by Occupancy in Owings
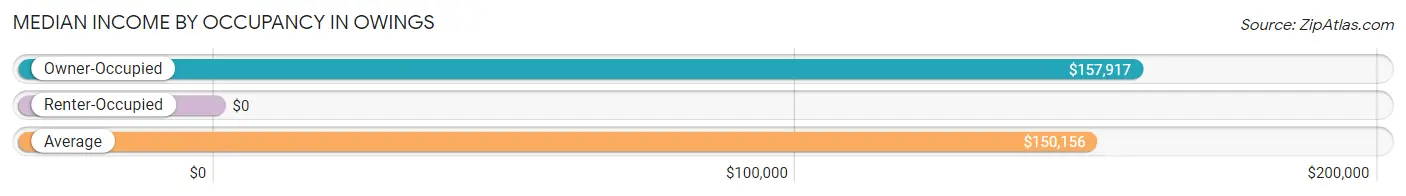
| Occupancy Type | # Households | Median Income |
| Owner-Occupied | 847 (93.4%) | $157,917 |
| Renter-Occupied | 60 (6.6%) | $0 |
| Average | 907 (100.0%) | $150,156 |
Occupancy by Householder Income Bracket in Owings
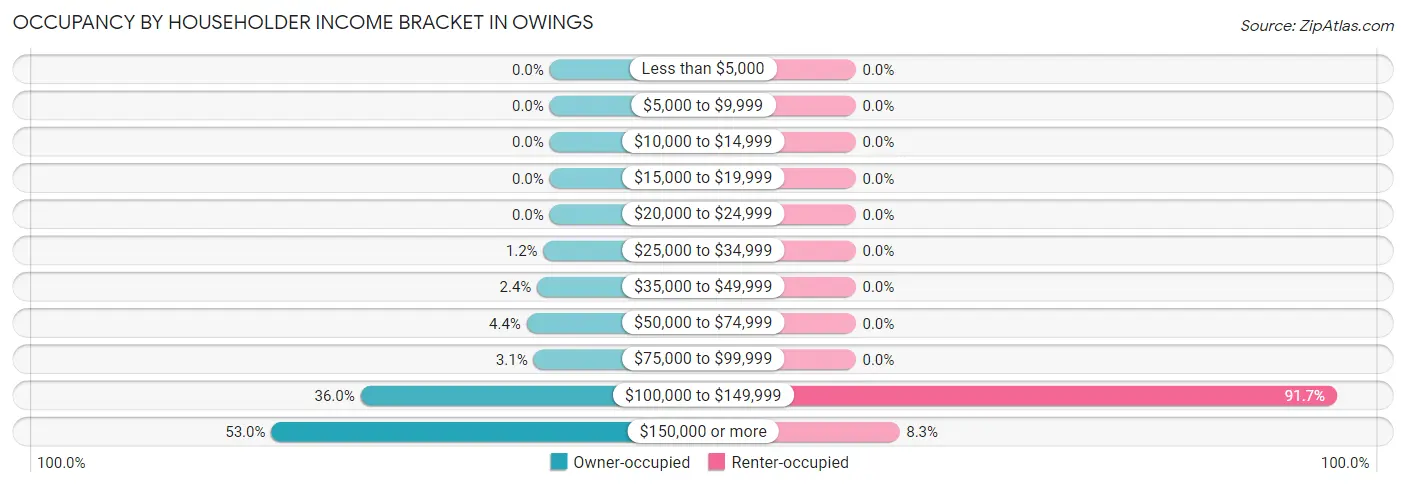
| Income Bracket | Owner-occupied | Renter-occupied |
| Less than $5,000 | 0 (0.0%) | 0 (0.0%) |
| $5,000 to $9,999 | 0 (0.0%) | 0 (0.0%) |
| $10,000 to $14,999 | 0 (0.0%) | 0 (0.0%) |
| $15,000 to $19,999 | 0 (0.0%) | 0 (0.0%) |
| $20,000 to $24,999 | 0 (0.0%) | 0 (0.0%) |
| $25,000 to $34,999 | 10 (1.2%) | 0 (0.0%) |
| $35,000 to $49,999 | 20 (2.4%) | 0 (0.0%) |
| $50,000 to $74,999 | 37 (4.4%) | 0 (0.0%) |
| $75,000 to $99,999 | 26 (3.1%) | 0 (0.0%) |
| $100,000 to $149,999 | 305 (36.0%) | 55 (91.7%) |
| $150,000 or more | 449 (53.0%) | 5 (8.3%) |
| Total | 847 (100.0%) | 60 (100.0%) |
Monthly Housing Cost Tiers in Owings
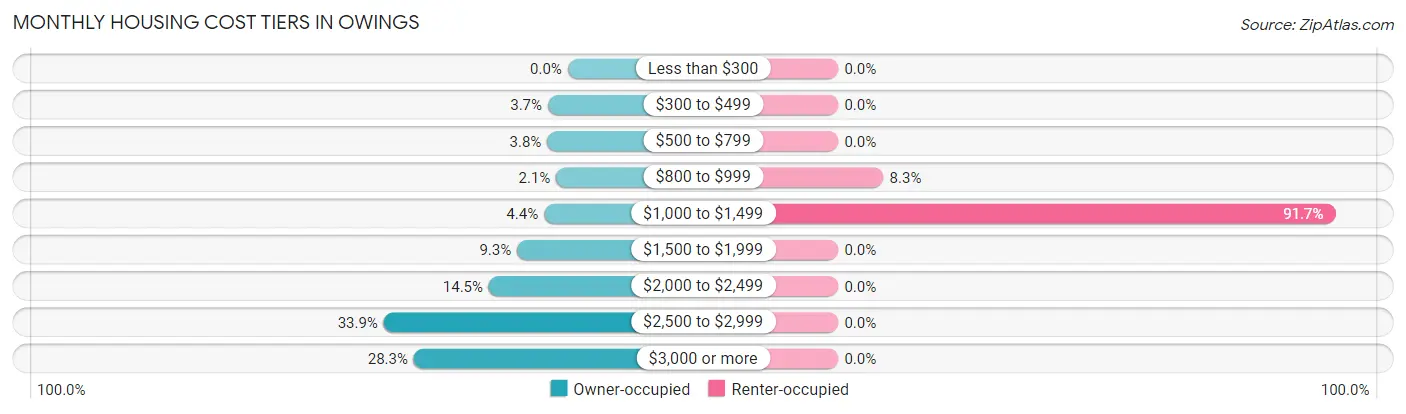
| Monthly Cost | Owner-occupied | Renter-occupied |
| Less than $300 | 0 (0.0%) | 0 (0.0%) |
| $300 to $499 | 31 (3.7%) | 0 (0.0%) |
| $500 to $799 | 32 (3.8%) | 0 (0.0%) |
| $800 to $999 | 18 (2.1%) | 5 (8.3%) |
| $1,000 to $1,499 | 37 (4.4%) | 55 (91.7%) |
| $1,500 to $1,999 | 79 (9.3%) | 0 (0.0%) |
| $2,000 to $2,499 | 123 (14.5%) | 0 (0.0%) |
| $2,500 to $2,999 | 287 (33.9%) | 0 (0.0%) |
| $3,000 or more | 240 (28.3%) | 0 (0.0%) |
| Total | 847 (100.0%) | 60 (100.0%) |
Physical Housing Characteristics in Owings
Housing Structures in Owings
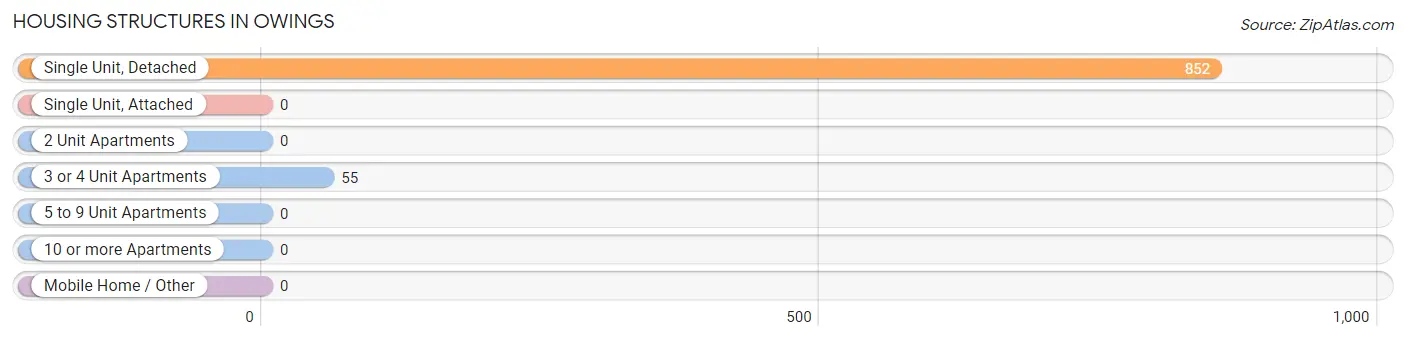
| Structure Type | # Housing Units | % Housing Units |
| Single Unit, Detached | 852 | 93.9% |
| Single Unit, Attached | 0 | 0.0% |
| 2 Unit Apartments | 0 | 0.0% |
| 3 or 4 Unit Apartments | 55 | 6.1% |
| 5 to 9 Unit Apartments | 0 | 0.0% |
| 10 or more Apartments | 0 | 0.0% |
| Mobile Home / Other | 0 | 0.0% |
| Total | 907 | 100.0% |
Housing Structures by Occupancy in Owings
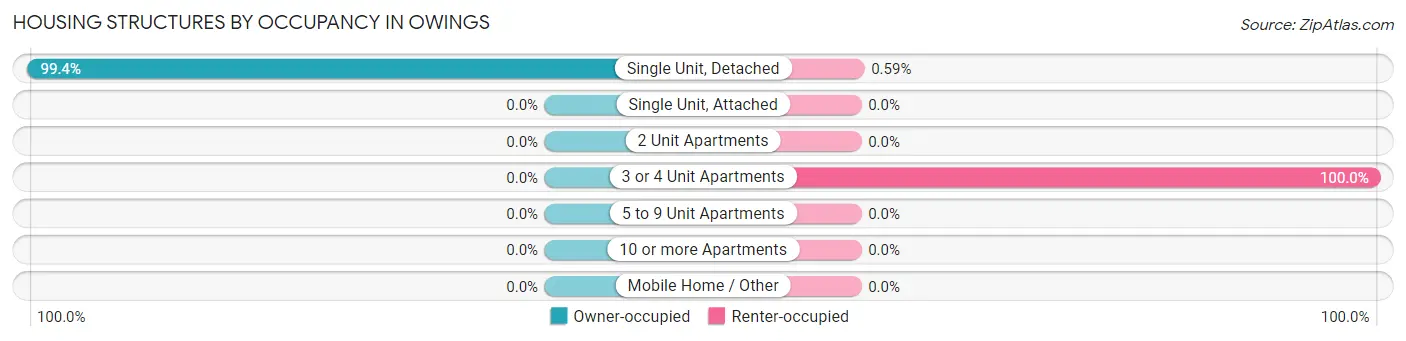
| Structure Type | Owner-occupied | Renter-occupied |
| Single Unit, Detached | 847 (99.4%) | 5 (0.6%) |
| Single Unit, Attached | 0 (0.0%) | 0 (0.0%) |
| 2 Unit Apartments | 0 (0.0%) | 0 (0.0%) |
| 3 or 4 Unit Apartments | 0 (0.0%) | 55 (100.0%) |
| 5 to 9 Unit Apartments | 0 (0.0%) | 0 (0.0%) |
| 10 or more Apartments | 0 (0.0%) | 0 (0.0%) |
| Mobile Home / Other | 0 (0.0%) | 0 (0.0%) |
| Total | 847 (93.4%) | 60 (6.6%) |
Housing Structures by Number of Rooms in Owings
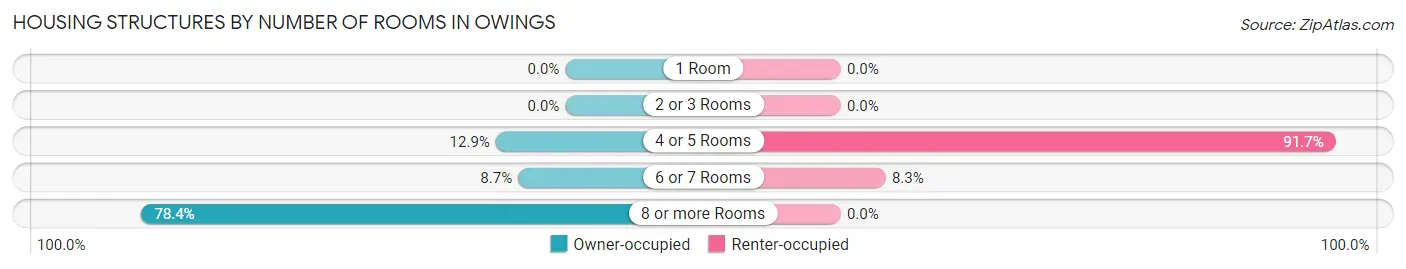
| Number of Rooms | Owner-occupied | Renter-occupied |
| 1 Room | 0 (0.0%) | 0 (0.0%) |
| 2 or 3 Rooms | 0 (0.0%) | 0 (0.0%) |
| 4 or 5 Rooms | 109 (12.9%) | 55 (91.7%) |
| 6 or 7 Rooms | 74 (8.7%) | 5 (8.3%) |
| 8 or more Rooms | 664 (78.4%) | 0 (0.0%) |
| Total | 847 (100.0%) | 60 (100.0%) |
Housing Structure by Heating Type in Owings
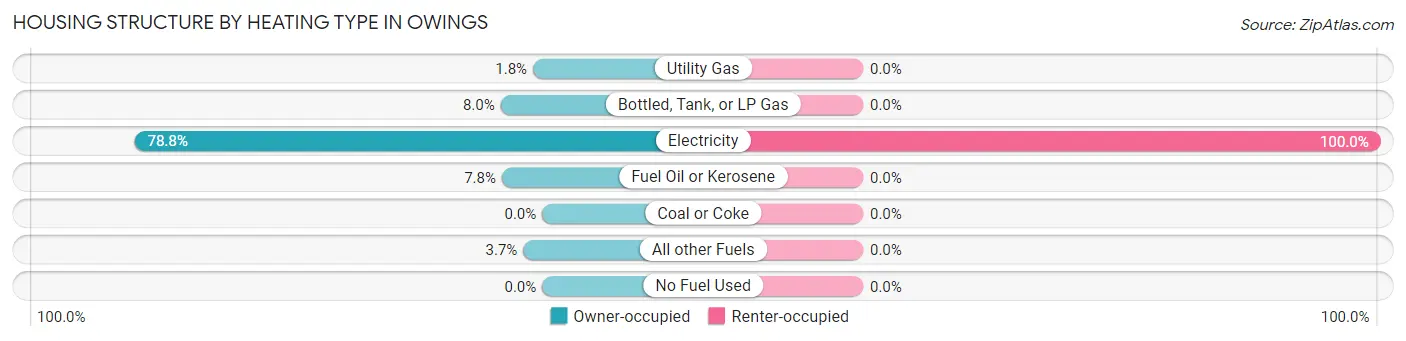
| Heating Type | Owner-occupied | Renter-occupied |
| Utility Gas | 15 (1.8%) | 0 (0.0%) |
| Bottled, Tank, or LP Gas | 68 (8.0%) | 0 (0.0%) |
| Electricity | 667 (78.7%) | 60 (100.0%) |
| Fuel Oil or Kerosene | 66 (7.8%) | 0 (0.0%) |
| Coal or Coke | 0 (0.0%) | 0 (0.0%) |
| All other Fuels | 31 (3.7%) | 0 (0.0%) |
| No Fuel Used | 0 (0.0%) | 0 (0.0%) |
| Total | 847 (100.0%) | 60 (100.0%) |
Household Vehicle Usage in Owings
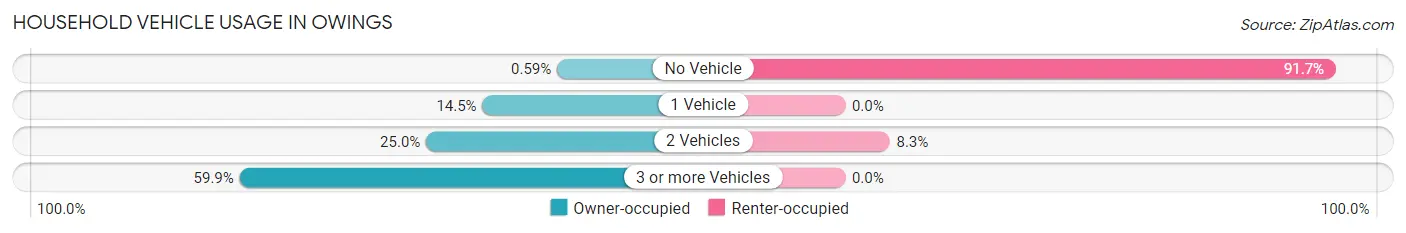
| Vehicles per Household | Owner-occupied | Renter-occupied |
| No Vehicle | 5 (0.6%) | 55 (91.7%) |
| 1 Vehicle | 123 (14.5%) | 0 (0.0%) |
| 2 Vehicles | 212 (25.0%) | 5 (8.3%) |
| 3 or more Vehicles | 507 (59.9%) | 0 (0.0%) |
| Total | 847 (100.0%) | 60 (100.0%) |
Real Estate & Mortgages in Owings
Real Estate and Mortgage Overview in Owings
| Characteristic | Without Mortgage | With Mortgage |
| Housing Units | 107 | 740 |
| Median Property Value | $469,400 | $585,600 |
| Median Household Income | $61,250 | $424 |
| Monthly Housing Costs | $808 | $240 |
| Real Estate Taxes | $4,321 | $15 |
Property Value by Mortgage Status in Owings
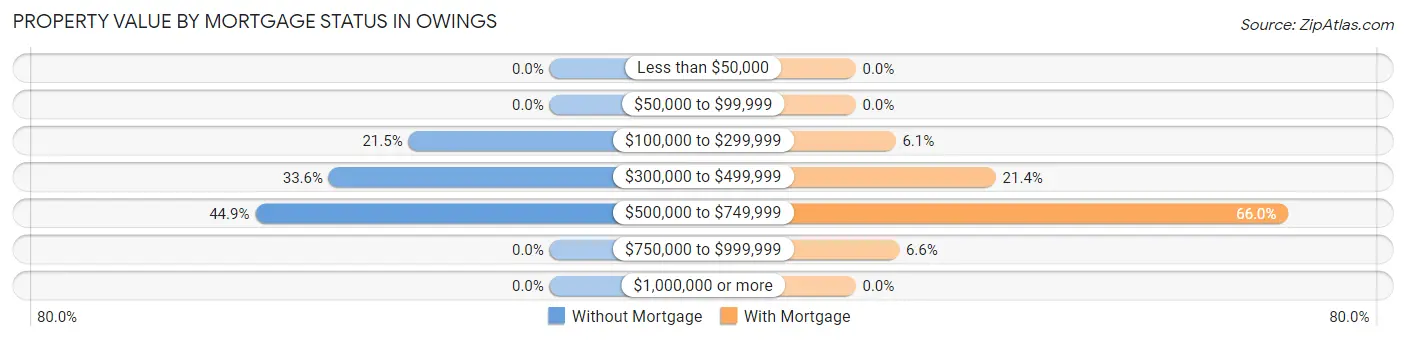
| Property Value | Without Mortgage | With Mortgage |
| Less than $50,000 | 0 (0.0%) | 0 (0.0%) |
| $50,000 to $99,999 | 0 (0.0%) | 0 (0.0%) |
| $100,000 to $299,999 | 23 (21.5%) | 45 (6.1%) |
| $300,000 to $499,999 | 36 (33.6%) | 158 (21.3%) |
| $500,000 to $749,999 | 48 (44.9%) | 488 (65.9%) |
| $750,000 to $999,999 | 0 (0.0%) | 49 (6.6%) |
| $1,000,000 or more | 0 (0.0%) | 0 (0.0%) |
| Total | 107 (100.0%) | 740 (100.0%) |
Household Income by Mortgage Status in Owings
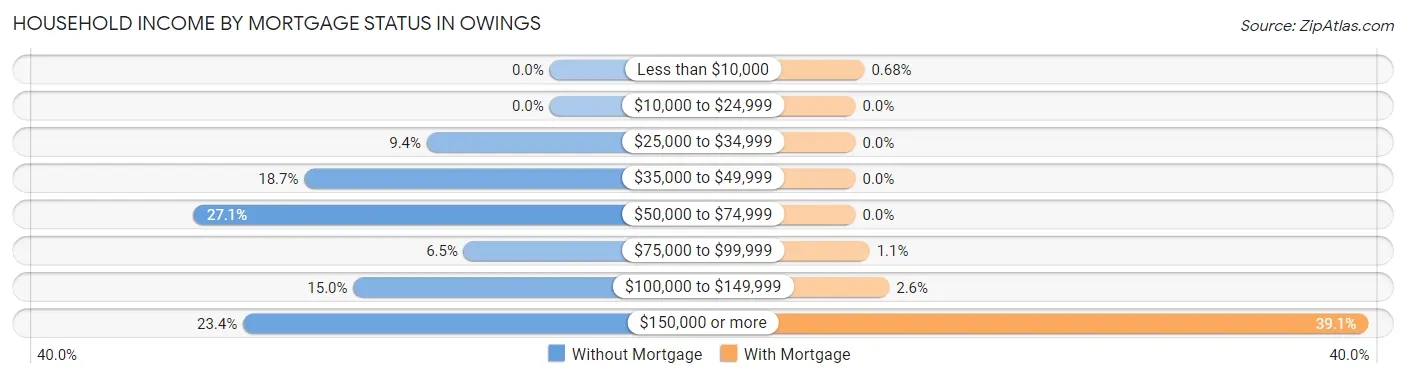
| Household Income | Without Mortgage | With Mortgage |
| Less than $10,000 | 0 (0.0%) | 5 (0.7%) |
| $10,000 to $24,999 | 0 (0.0%) | 0 (0.0%) |
| $25,000 to $34,999 | 10 (9.3%) | 0 (0.0%) |
| $35,000 to $49,999 | 20 (18.7%) | 0 (0.0%) |
| $50,000 to $74,999 | 29 (27.1%) | 0 (0.0%) |
| $75,000 to $99,999 | 7 (6.5%) | 8 (1.1%) |
| $100,000 to $149,999 | 16 (14.9%) | 19 (2.6%) |
| $150,000 or more | 25 (23.4%) | 289 (39.1%) |
| Total | 107 (100.0%) | 740 (100.0%) |
Property Value to Household Income Ratio in Owings
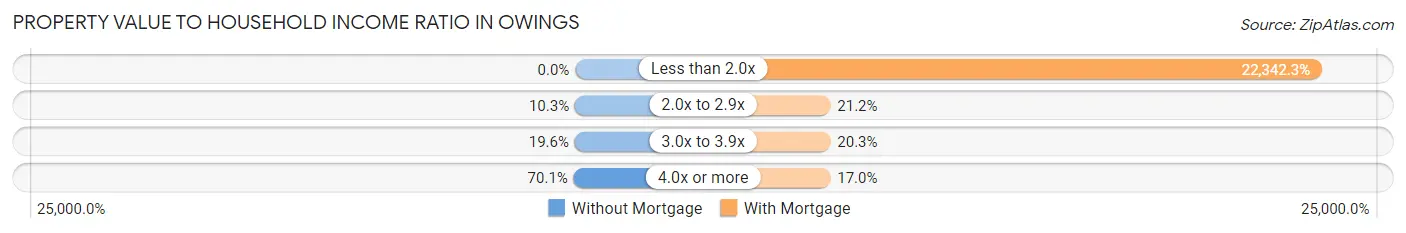
| Value-to-Income Ratio | Without Mortgage | With Mortgage |
| Less than 2.0x | 0 (0.0%) | 165,333 (22,342.3%) |
| 2.0x to 2.9x | 11 (10.3%) | 157 (21.2%) |
| 3.0x to 3.9x | 21 (19.6%) | 150 (20.3%) |
| 4.0x or more | 75 (70.1%) | 126 (17.0%) |
| Total | 107 (100.0%) | 740 (100.0%) |
Real Estate Taxes by Mortgage Status in Owings
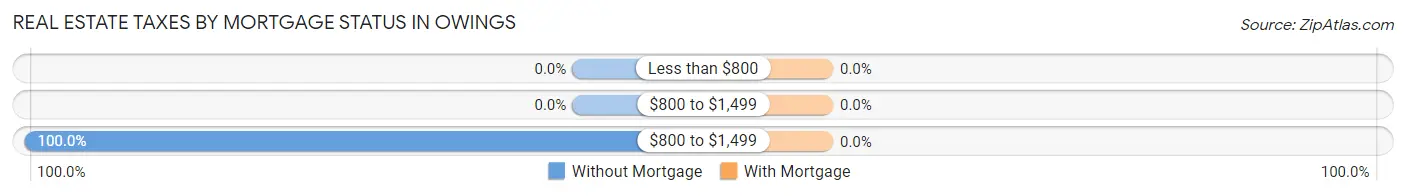
| Property Taxes | Without Mortgage | With Mortgage |
| Less than $800 | 0 (0.0%) | 0 (0.0%) |
| $800 to $1,499 | 0 (0.0%) | 0 (0.0%) |
| $800 to $1,499 | 107 (100.0%) | 0 (0.0%) |
| Total | 107 (100.0%) | 740 (100.0%) |
Health & Disability in Owings
Health Insurance Coverage by Age in Owings
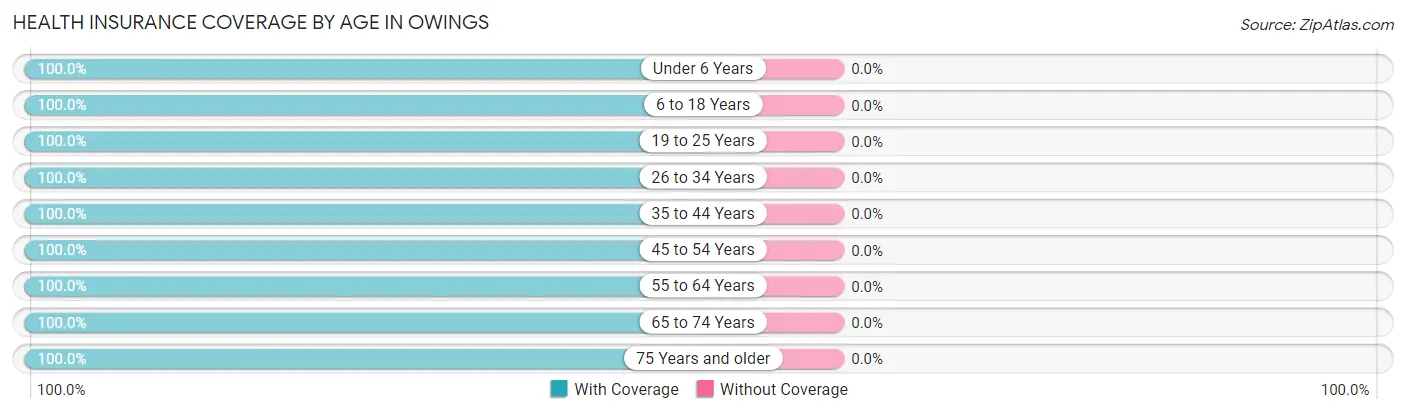
| Age Bracket | With Coverage | Without Coverage |
| Under 6 Years | 110 (100.0%) | 0 (0.0%) |
| 6 to 18 Years | 388 (100.0%) | 0 (0.0%) |
| 19 to 25 Years | 52 (100.0%) | 0 (0.0%) |
| 26 to 34 Years | 136 (100.0%) | 0 (0.0%) |
| 35 to 44 Years | 172 (100.0%) | 0 (0.0%) |
| 45 to 54 Years | 382 (100.0%) | 0 (0.0%) |
| 55 to 64 Years | 684 (100.0%) | 0 (0.0%) |
| 65 to 74 Years | 198 (100.0%) | 0 (0.0%) |
| 75 Years and older | 168 (100.0%) | 0 (0.0%) |
| Total | 2,290 (100.0%) | 0 (0.0%) |
Health Insurance Coverage by Citizenship Status in Owings
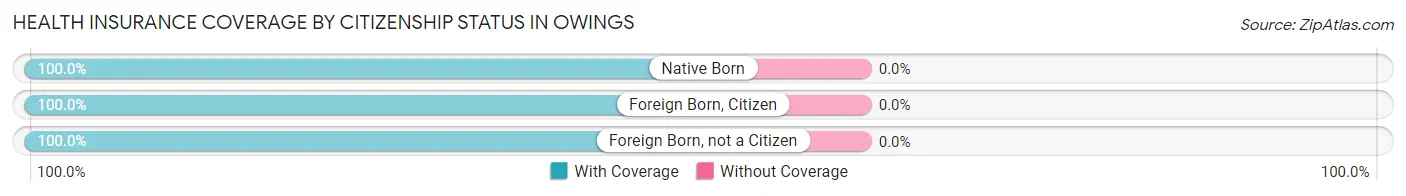
| Citizenship Status | With Coverage | Without Coverage |
| Native Born | 110 (100.0%) | 0 (0.0%) |
| Foreign Born, Citizen | 388 (100.0%) | 0 (0.0%) |
| Foreign Born, not a Citizen | 52 (100.0%) | 0 (0.0%) |
Health Insurance Coverage by Household Income in Owings
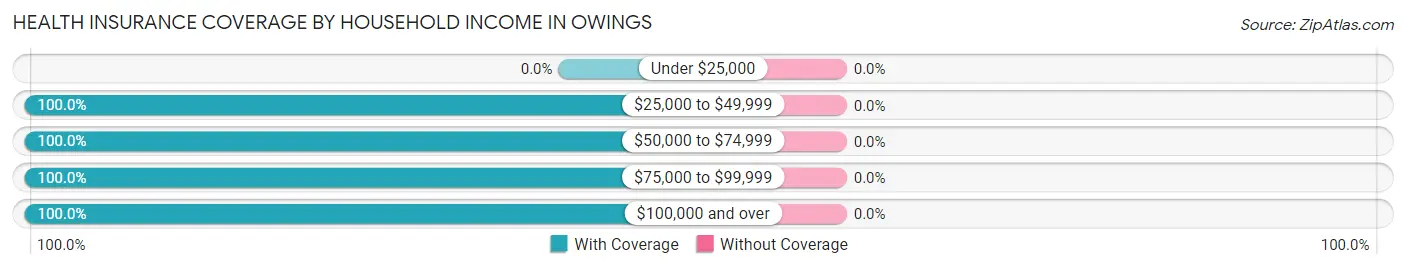
| Household Income | With Coverage | Without Coverage |
| Under $25,000 | 0 (0.0%) | 0 (0.0%) |
| $25,000 to $49,999 | 43 (100.0%) | 0 (0.0%) |
| $50,000 to $74,999 | 47 (100.0%) | 0 (0.0%) |
| $75,000 to $99,999 | 34 (100.0%) | 0 (0.0%) |
| $100,000 and over | 2,166 (100.0%) | 0 (0.0%) |
Public vs Private Health Insurance Coverage by Age in Owings
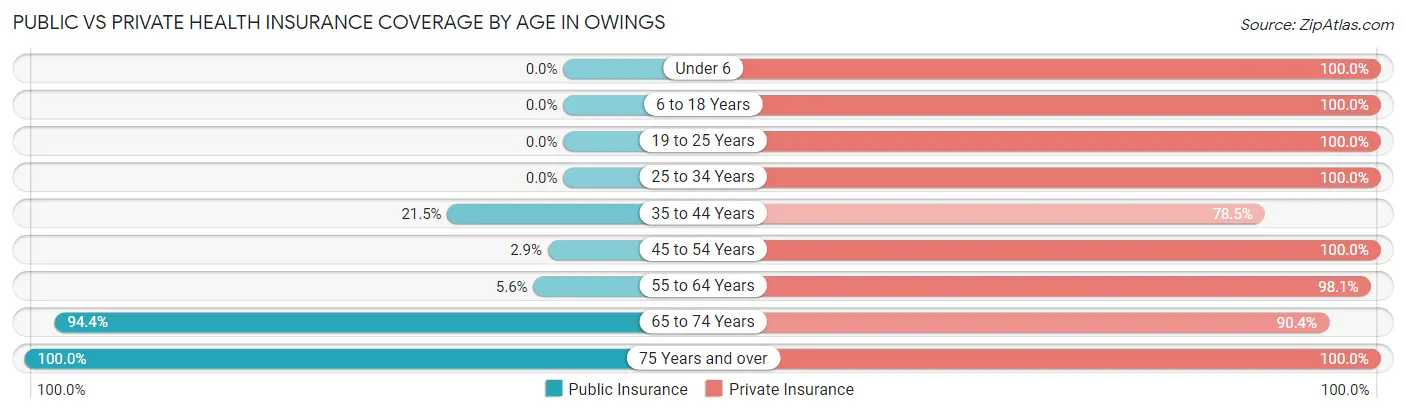
| Age Bracket | Public Insurance | Private Insurance |
| Under 6 | 0 (0.0%) | 110 (100.0%) |
| 6 to 18 Years | 0 (0.0%) | 388 (100.0%) |
| 19 to 25 Years | 0 (0.0%) | 52 (100.0%) |
| 25 to 34 Years | 0 (0.0%) | 136 (100.0%) |
| 35 to 44 Years | 37 (21.5%) | 135 (78.5%) |
| 45 to 54 Years | 11 (2.9%) | 382 (100.0%) |
| 55 to 64 Years | 38 (5.6%) | 671 (98.1%) |
| 65 to 74 Years | 187 (94.4%) | 179 (90.4%) |
| 75 Years and over | 168 (100.0%) | 168 (100.0%) |
| Total | 441 (19.3%) | 2,221 (97.0%) |
Disability Status by Sex by Age in Owings
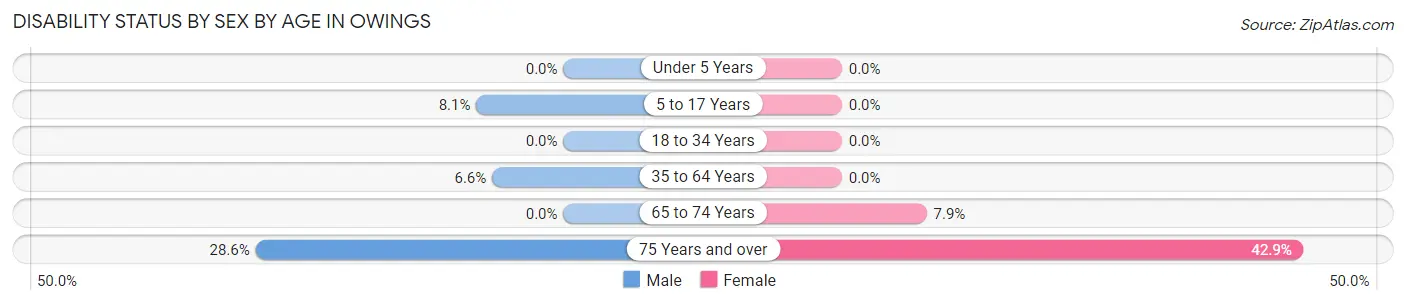
| Age Bracket | Male | Female |
| Under 5 Years | 0 (0.0%) | 0 (0.0%) |
| 5 to 17 Years | 16 (8.1%) | 0 (0.0%) |
| 18 to 34 Years | 0 (0.0%) | 0 (0.0%) |
| 35 to 64 Years | 39 (6.6%) | 0 (0.0%) |
| 65 to 74 Years | 0 (0.0%) | 7 (7.9%) |
| 75 Years and over | 20 (28.6%) | 42 (42.9%) |
Disability Class by Sex by Age in Owings
Disability Class: Hearing Difficulty
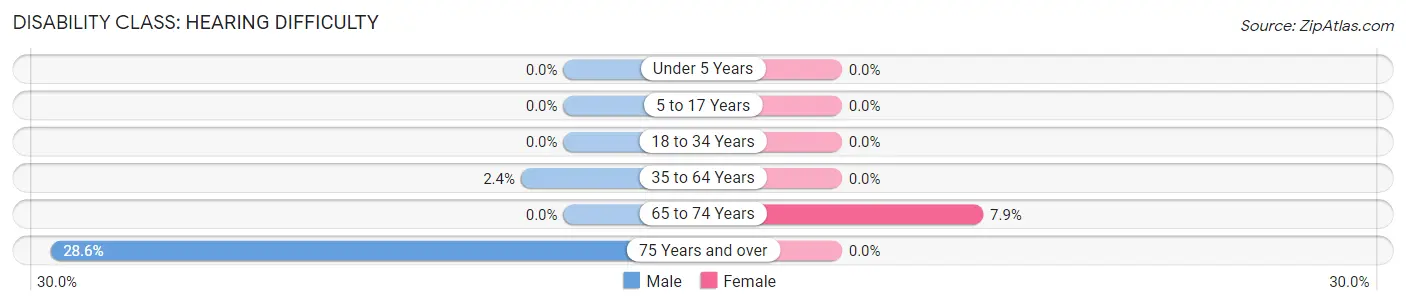
| Age Bracket | Male | Female |
| Under 5 Years | 0 (0.0%) | 0 (0.0%) |
| 5 to 17 Years | 0 (0.0%) | 0 (0.0%) |
| 18 to 34 Years | 0 (0.0%) | 0 (0.0%) |
| 35 to 64 Years | 14 (2.4%) | 0 (0.0%) |
| 65 to 74 Years | 0 (0.0%) | 7 (7.9%) |
| 75 Years and over | 20 (28.6%) | 0 (0.0%) |
Disability Class: Vision Difficulty
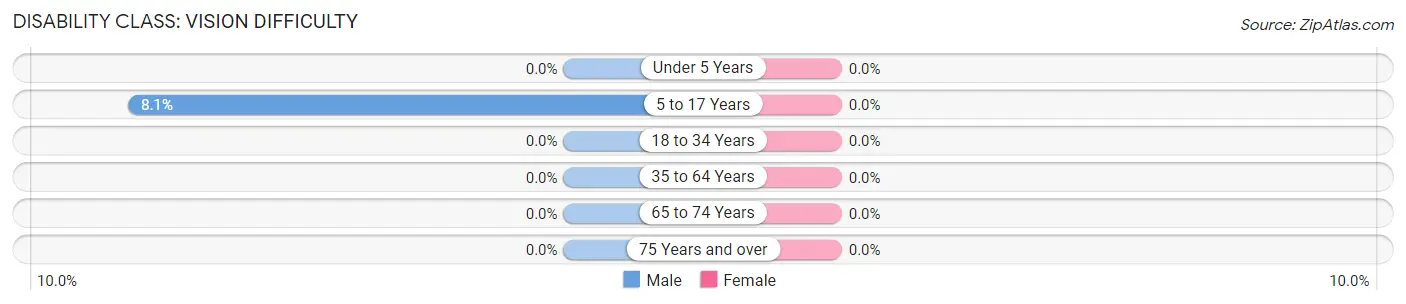
| Age Bracket | Male | Female |
| Under 5 Years | 0 (0.0%) | 0 (0.0%) |
| 5 to 17 Years | 16 (8.1%) | 0 (0.0%) |
| 18 to 34 Years | 0 (0.0%) | 0 (0.0%) |
| 35 to 64 Years | 0 (0.0%) | 0 (0.0%) |
| 65 to 74 Years | 0 (0.0%) | 0 (0.0%) |
| 75 Years and over | 0 (0.0%) | 0 (0.0%) |
Disability Class: Cognitive Difficulty
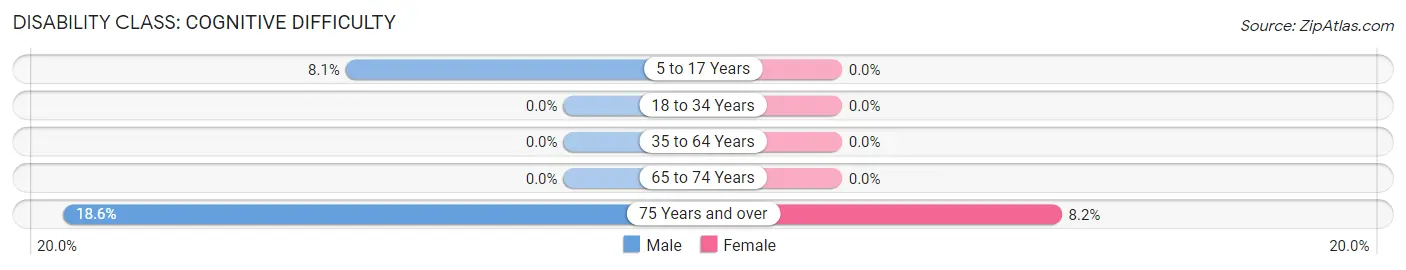
| Age Bracket | Male | Female |
| 5 to 17 Years | 16 (8.1%) | 0 (0.0%) |
| 18 to 34 Years | 0 (0.0%) | 0 (0.0%) |
| 35 to 64 Years | 0 (0.0%) | 0 (0.0%) |
| 65 to 74 Years | 0 (0.0%) | 0 (0.0%) |
| 75 Years and over | 13 (18.6%) | 8 (8.2%) |
Disability Class: Ambulatory Difficulty
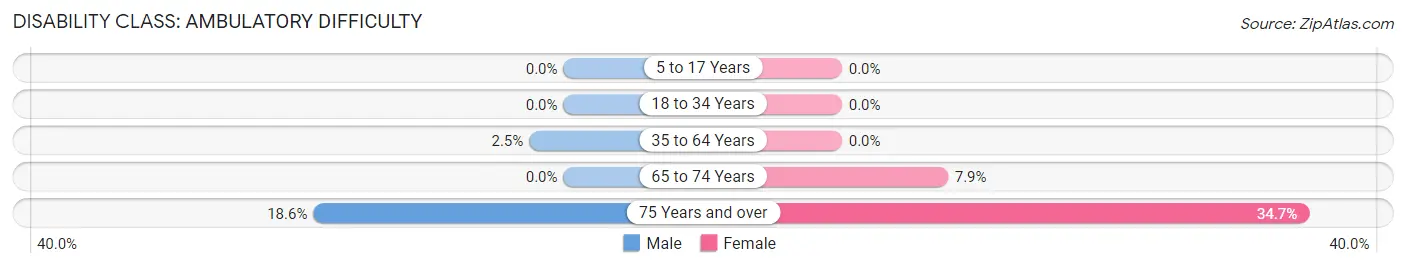
| Age Bracket | Male | Female |
| 5 to 17 Years | 0 (0.0%) | 0 (0.0%) |
| 18 to 34 Years | 0 (0.0%) | 0 (0.0%) |
| 35 to 64 Years | 15 (2.5%) | 0 (0.0%) |
| 65 to 74 Years | 0 (0.0%) | 7 (7.9%) |
| 75 Years and over | 13 (18.6%) | 34 (34.7%) |
Disability Class: Self-Care Difficulty
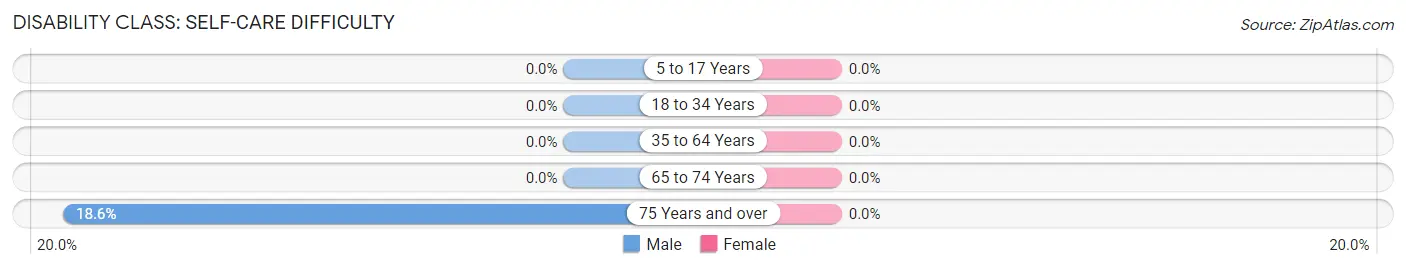
| Age Bracket | Male | Female |
| 5 to 17 Years | 0 (0.0%) | 0 (0.0%) |
| 18 to 34 Years | 0 (0.0%) | 0 (0.0%) |
| 35 to 64 Years | 0 (0.0%) | 0 (0.0%) |
| 65 to 74 Years | 0 (0.0%) | 0 (0.0%) |
| 75 Years and over | 13 (18.6%) | 0 (0.0%) |
Technology Access in Owings
Computing Device Access in Owings
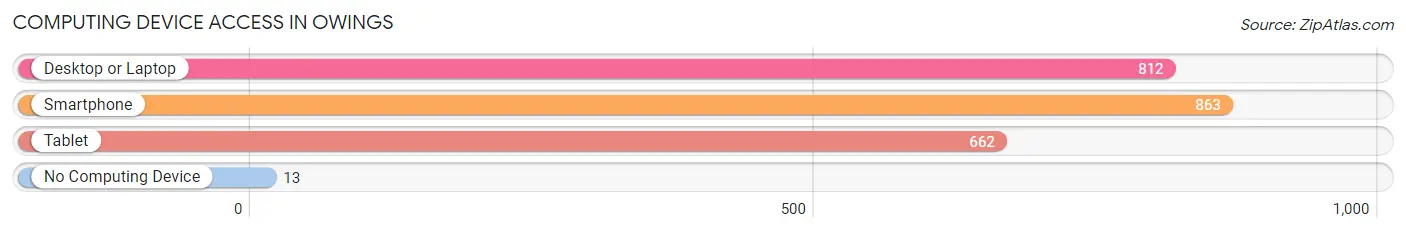
| Device Type | # Households | % Households |
| Desktop or Laptop | 812 | 89.5% |
| Smartphone | 863 | 95.2% |
| Tablet | 662 | 73.0% |
| No Computing Device | 13 | 1.4% |
| Total | 907 | 100.0% |
Internet Access in Owings
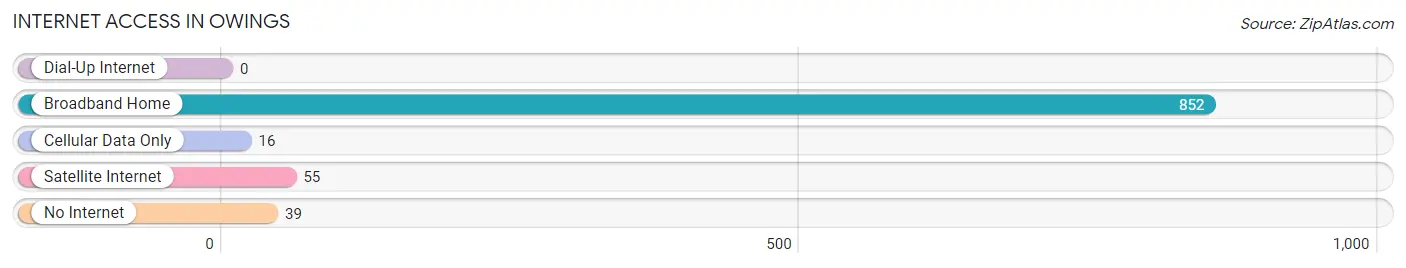
| Internet Type | # Households | % Households |
| Dial-Up Internet | 0 | 0.0% |
| Broadband Home | 852 | 93.9% |
| Cellular Data Only | 16 | 1.8% |
| Satellite Internet | 55 | 6.1% |
| No Internet | 39 | 4.3% |
| Total | 907 | 100.0% |
Owings Summary
Owings is an unincorporated community located in Calvert County, Maryland. It is situated on the western shore of the Chesapeake Bay, approximately 25 miles south of Annapolis. The community is part of the Washington Metropolitan Area and is located within the Baltimore-Washington Metropolitan Statistical Area.
History
Owings was first settled in the early 1700s by English settlers. The community was named after the Owings family, who were among the first settlers in the area. The community was originally a farming community, with the main crops being tobacco, corn, and wheat. In the late 1800s, the community began to grow as a resort town, with many people coming to the area to enjoy the beaches and fishing.
In the early 1900s, the community began to develop as a residential area. The community was home to a number of small businesses, including a general store, a post office, and a few restaurants. In the 1950s, the community began to experience a population boom, as many people moved to the area from Washington, D.C. and Baltimore.
Geography
Owings is located in Calvert County, Maryland, on the western shore of the Chesapeake Bay. The community is situated approximately 25 miles south of Annapolis. The community is bordered by the Patuxent River to the north, the Chesapeake Bay to the east, and the Patuxent Wildlife Refuge to the south. The community is located within the Baltimore-Washington Metropolitan Statistical Area.
The climate in Owings is humid subtropical, with hot, humid summers and mild winters. The average annual temperature is around 60 degrees Fahrenheit, with an average high of around 80 degrees in the summer and an average low of around 40 degrees in the winter.
Economy
The economy of Owings is largely based on tourism and the service industry. The community is home to a number of small businesses, including restaurants, retail stores, and a few small manufacturing companies. The community is also home to a number of marinas, which provide services to boaters and fishermen.
Demographics
As of the 2010 census, the population of Owings was 4,845. The racial makeup of the community was 87.3% White, 8.2% African American, 0.7% Asian, 0.3% Native American, and 3.5% from other races. The median household income was $68,958, and the median family income was $76,958. The per capita income was $30,958.
Conclusion
Owings is an unincorporated community located in Calvert County, Maryland. It is situated on the western shore of the Chesapeake Bay, approximately 25 miles south of Annapolis. The community is part of the Washington Metropolitan Area and is located within the Baltimore-Washington Metropolitan Statistical Area. The economy of Owings is largely based on tourism and the service industry, and the population of the community was 4,845 as of the 2010 census.
Common Questions
What is Per Capita Income in Owings?
Per Capita income in Owings is $67,610.
What is the Median Family Income in Owings?
Median Family Income in Owings is $159,375.
What is the Median Household income in Owings?
Median Household Income in Owings is $150,156.
What is Income or Wage Gap in Owings?
Income or Wage Gap in Owings is 50.6%.
Women in Owings earn 49.4 cents for every dollar earned by a man.
What is Inequality or Gini Index in Owings?
Inequality or Gini Index in Owings is 0.27.
What is the Total Population of Owings?
Total Population of Owings is 2,376.
What is the Total Male Population of Owings?
Total Male Population of Owings is 1,148.
What is the Total Female Population of Owings?
Total Female Population of Owings is 1,228.
What is the Ratio of Males per 100 Females in Owings?
There are 93.49 Males per 100 Females in Owings.
What is the Ratio of Females per 100 Males in Owings?
There are 106.97 Females per 100 Males in Owings.
What is the Median Population Age in Owings?
Median Population Age in Owings is 52.6 Years.
What is the Average Family Size in Owings
Average Family Size in Owings is 2.9 People.
What is the Average Household Size in Owings
Average Household Size in Owings is 2.6 People.
How Large is the Labor Force in Owings?
There are 1,454 People in the Labor Forcein in Owings.
What is the Percentage of People in the Labor Force in Owings?
74.2% of People are in the Labor Force in Owings.
What is the Unemployment Rate in Owings?
Unemployment Rate in Owings is 1.4%.