Silver Hill, MD Map & Demographics
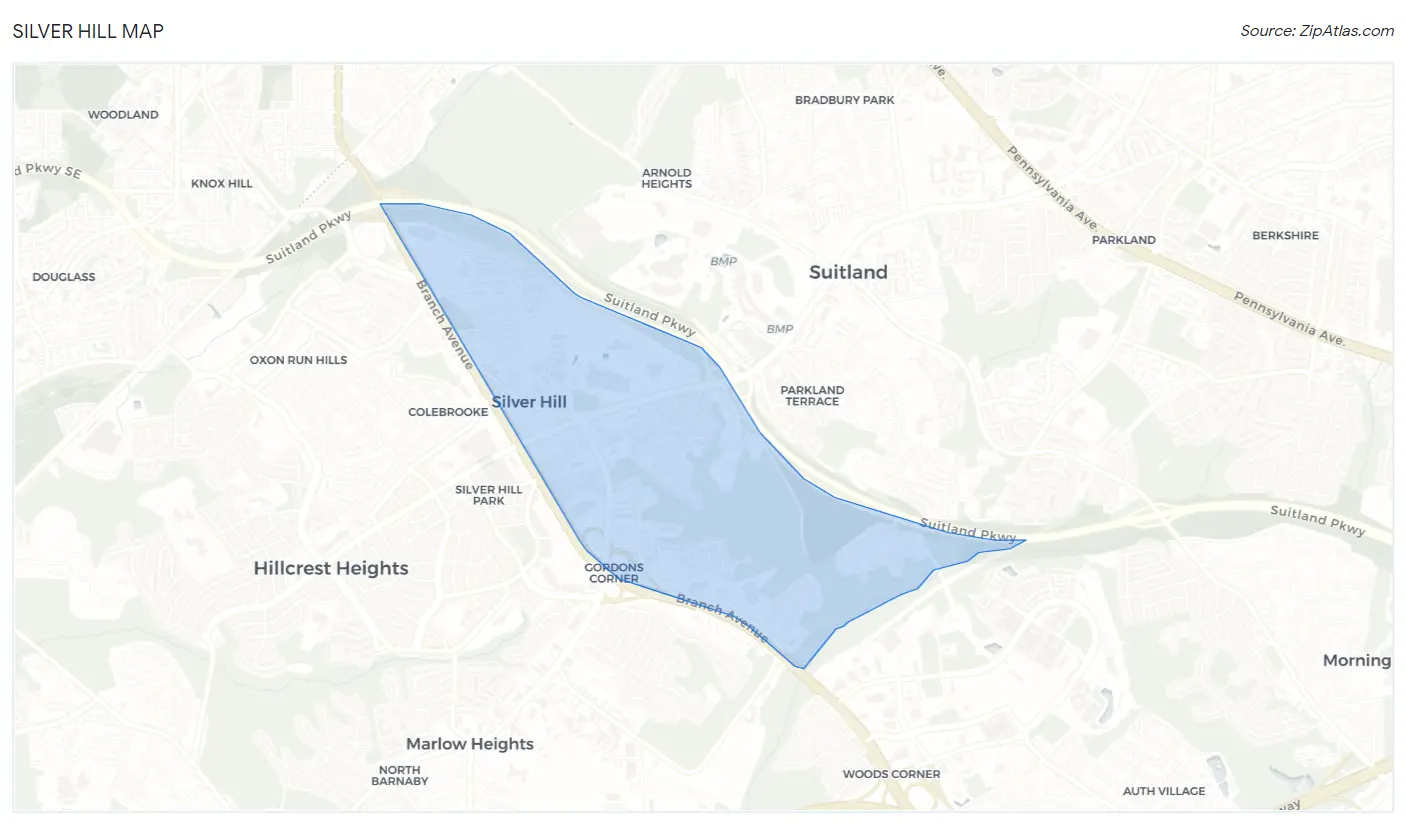
Silver Hill Map
Silver Hill Overview
$38,674
PER CAPITA INCOME
$79,261
AVG FAMILY INCOME
$65,096
AVG HOUSEHOLD INCOME
28.9%
WAGE / INCOME GAP [ % ]
71.1¢/ $1
WAGE / INCOME GAP [ $ ]
$3,402
FAMILY INCOME DEFICIT
0.38
INEQUALITY / GINI INDEX
5,455
TOTAL POPULATION
2,445
MALE POPULATION
3,010
FEMALE POPULATION
81.23
MALES / 100 FEMALES
123.11
FEMALES / 100 MALES
40.5
MEDIAN AGE
3.0
AVG FAMILY SIZE
2.0
AVG HOUSEHOLD SIZE
3,480
LABOR FORCE [ PEOPLE ]
73.2%
PERCENT IN LABOR FORCE
3.6%
UNEMPLOYMENT RATE
Income in Silver Hill
Income Overview in Silver Hill
Per Capita Income in Silver Hill is $38,674, while median incomes of families and households are $79,261 and $65,096 respectively.
| Characteristic | Number | Measure |
| Per Capita Income | 5,455 | $38,674 |
| Median Family Income | 1,105 | $79,261 |
| Mean Family Income | 1,105 | $85,803 |
| Median Household Income | 2,665 | $65,096 |
| Mean Household Income | 2,665 | $76,463 |
| Income Deficit | 1,105 | $3,402 |
| Wage / Income Gap (%) | 5,455 | 28.90% |
| Wage / Income Gap ($) | 5,455 | 71.10¢ per $1 |
| Gini / Inequality Index | 5,455 | 0.38 |
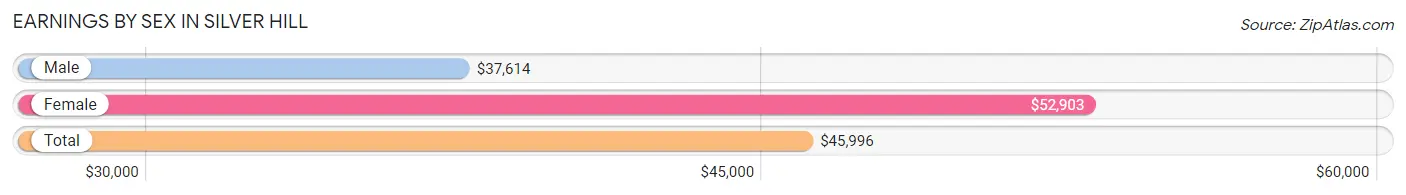
Earnings by Sex in Silver Hill
Average Earnings in Silver Hill are $45,996, $37,614 for men and $52,903 for women, a difference of 28.9%.
| Sex | Number | Average Earnings |
| Male | 1,768 (49.4%) | $37,614 |
| Female | 1,811 (50.6%) | $52,903 |
| Total | 3,579 (100.0%) | $45,996 |
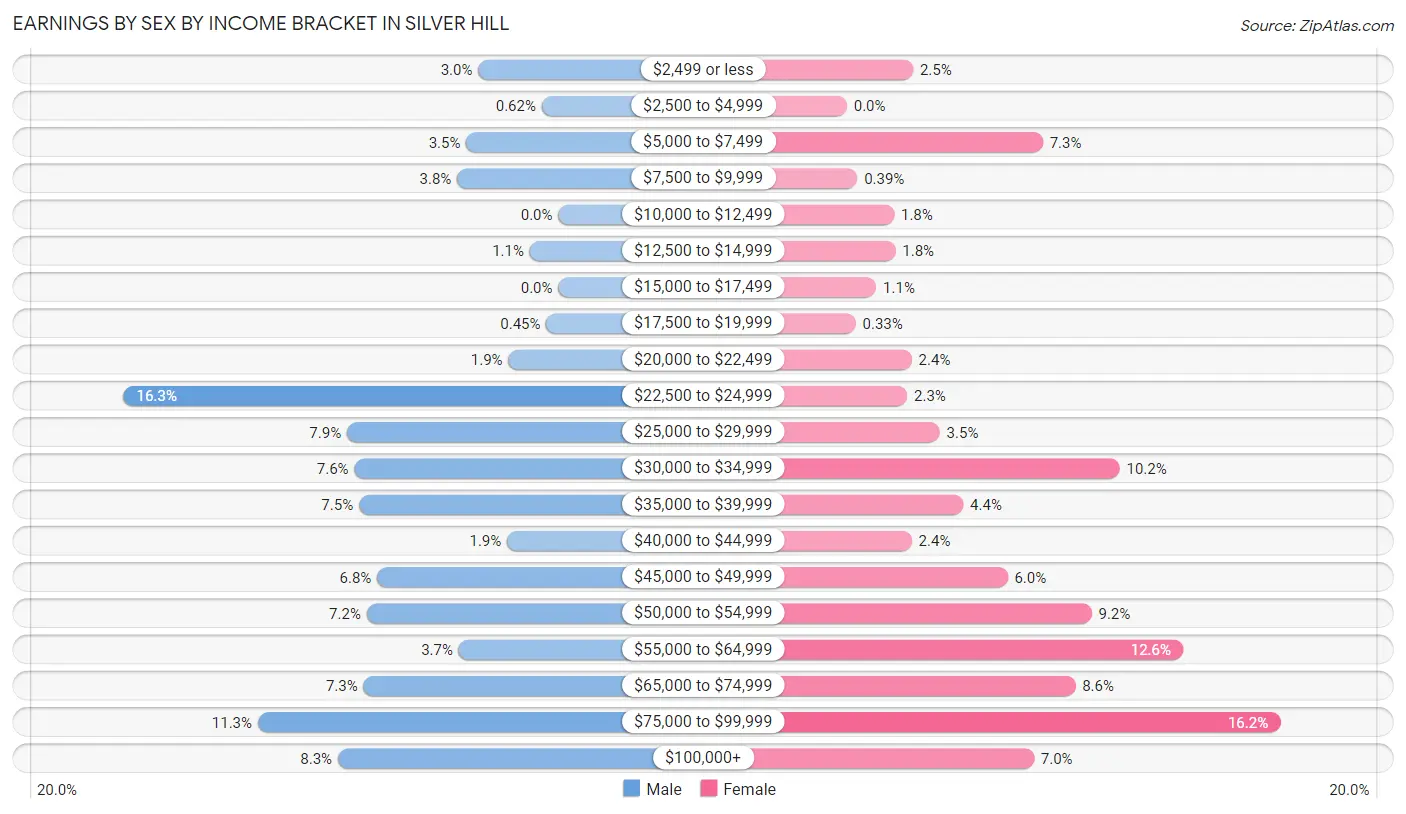
Earnings by Sex by Income Bracket in Silver Hill
The most common earnings brackets in Silver Hill are $22,500 to $24,999 for men (288 | 16.3%) and $75,000 to $99,999 for women (294 | 16.2%).
| Income | Male | Female |
| $2,499 or less | 53 (3.0%) | 45 (2.5%) |
| $2,500 to $4,999 | 11 (0.6%) | 0 (0.0%) |
| $5,000 to $7,499 | 61 (3.5%) | 133 (7.3%) |
| $7,500 to $9,999 | 67 (3.8%) | 7 (0.4%) |
| $10,000 to $12,499 | 0 (0.0%) | 32 (1.8%) |
| $12,500 to $14,999 | 19 (1.1%) | 33 (1.8%) |
| $15,000 to $17,499 | 0 (0.0%) | 20 (1.1%) |
| $17,500 to $19,999 | 8 (0.4%) | 6 (0.3%) |
| $20,000 to $22,499 | 33 (1.9%) | 44 (2.4%) |
| $22,500 to $24,999 | 288 (16.3%) | 41 (2.3%) |
| $25,000 to $29,999 | 140 (7.9%) | 63 (3.5%) |
| $30,000 to $34,999 | 135 (7.6%) | 185 (10.2%) |
| $35,000 to $39,999 | 132 (7.5%) | 79 (4.4%) |
| $40,000 to $44,999 | 34 (1.9%) | 44 (2.4%) |
| $45,000 to $49,999 | 120 (6.8%) | 109 (6.0%) |
| $50,000 to $54,999 | 127 (7.2%) | 166 (9.2%) |
| $55,000 to $64,999 | 66 (3.7%) | 228 (12.6%) |
| $65,000 to $74,999 | 129 (7.3%) | 155 (8.6%) |
| $75,000 to $99,999 | 199 (11.3%) | 294 (16.2%) |
| $100,000+ | 146 (8.3%) | 127 (7.0%) |
| Total | 1,768 (100.0%) | 1,811 (100.0%) |
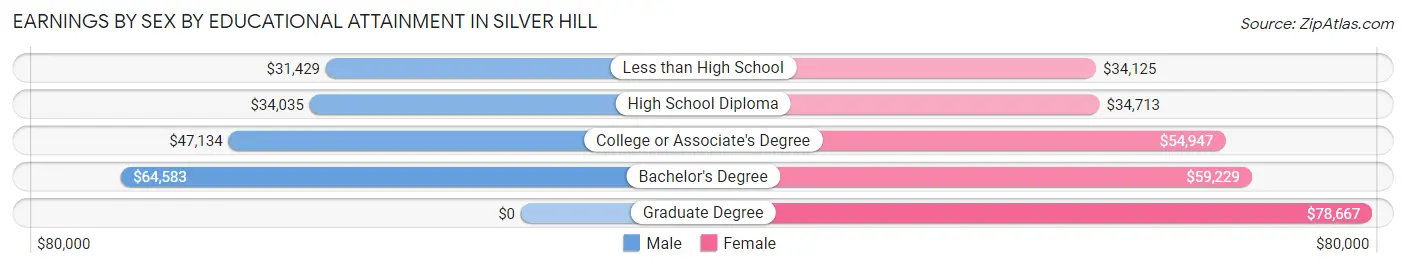
Earnings by Sex by Educational Attainment in Silver Hill
Average earnings in Silver Hill are $39,015 for men and $55,056 for women, a difference of 29.1%. Men with an educational attainment of bachelor's degree enjoy the highest average annual earnings of $64,583, while those with less than high school education earn the least with $31,429. Women with an educational attainment of graduate degree earn the most with the average annual earnings of $78,667, while those with less than high school education have the smallest earnings of $34,125.
| Educational Attainment | Male Income | Female Income |
| Less than High School | $31,429 | $34,125 |
| High School Diploma | $34,035 | $34,713 |
| College or Associate's Degree | $47,134 | $54,947 |
| Bachelor's Degree | $64,583 | $59,229 |
| Graduate Degree | - | - |
| Total | $39,015 | $55,056 |
Family Income in Silver Hill
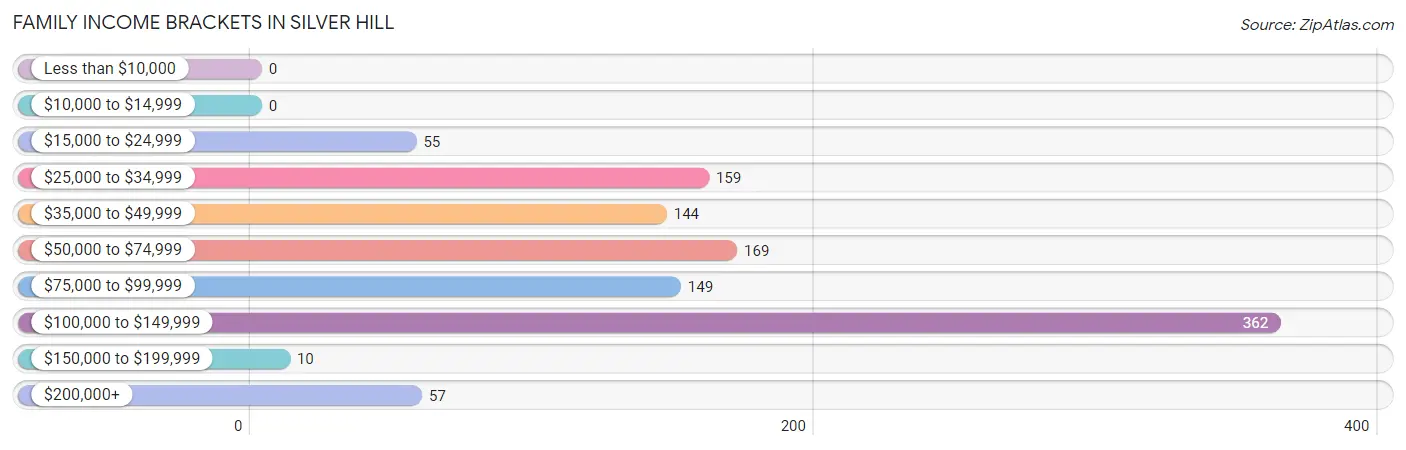
Family Income Brackets in Silver Hill
According to the Silver Hill family income data, there are 362 families falling into the $100,000 to $149,999 income range, which is the most common income bracket and makes up 32.8% of all families.
| Income Bracket | # Families | % Families |
| Less than $10,000 | 0 | 0.0% |
| $10,000 to $14,999 | 0 | 0.0% |
| $15,000 to $24,999 | 55 | 5.0% |
| $25,000 to $34,999 | 159 | 14.4% |
| $35,000 to $49,999 | 144 | 13.0% |
| $50,000 to $74,999 | 169 | 15.3% |
| $75,000 to $99,999 | 149 | 13.5% |
| $100,000 to $149,999 | 362 | 32.8% |
| $150,000 to $199,999 | 10 | 0.9% |
| $200,000+ | 57 | 5.2% |
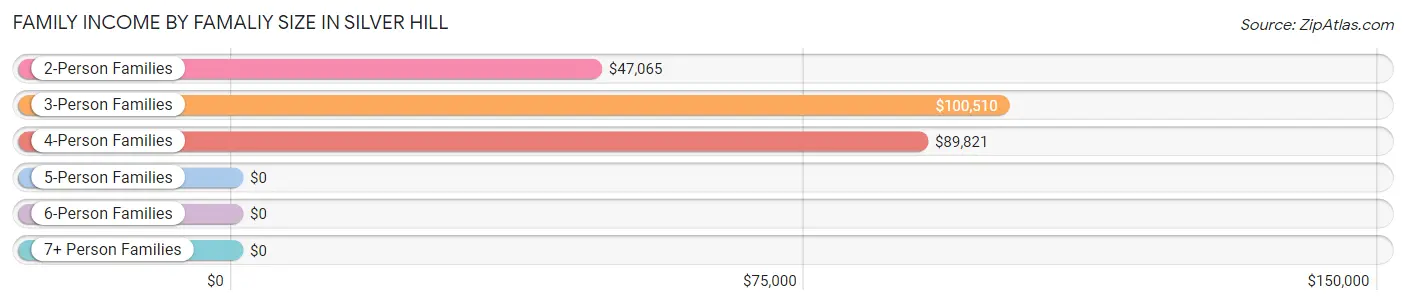
Family Income by Famaliy Size in Silver Hill
3-person families (316 | 28.6%) account for the highest median family income in Silver Hill with $100,510 per family, while 3-person families (316 | 28.6%) have the highest median income of $33,503 per family member.
| Income Bracket | # Families | Median Income |
| 2-Person Families | 560 (50.7%) | $47,065 |
| 3-Person Families | 316 (28.6%) | $100,510 |
| 4-Person Families | 159 (14.4%) | $89,821 |
| 5-Person Families | 40 (3.6%) | $0 |
| 6-Person Families | 20 (1.8%) | $0 |
| 7+ Person Families | 10 (0.9%) | $0 |
| Total | 1,105 (100.0%) | $79,261 |
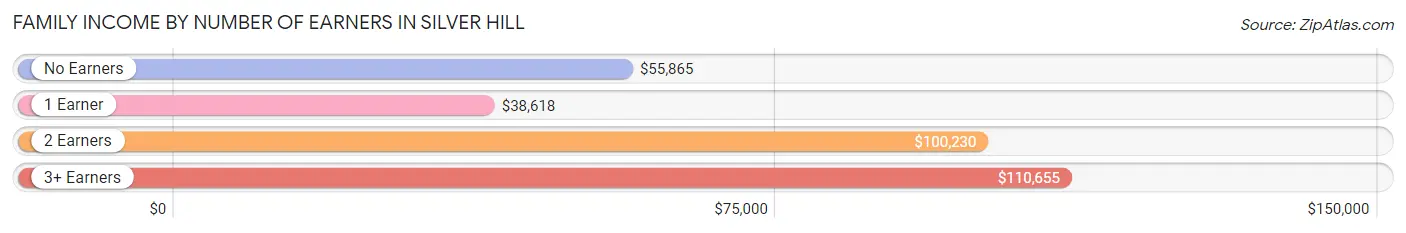
Family Income by Number of Earners in Silver Hill
The median family income in Silver Hill is $79,261, with families comprising 3+ earners (171) having the highest median family income of $110,655, while families with 1 earner (474) have the lowest median family income of $38,618, accounting for 15.5% and 42.9% of families, respectively.
| Number of Earners | # Families | Median Income |
| No Earners | 53 (4.8%) | $55,865 |
| 1 Earner | 474 (42.9%) | $38,618 |
| 2 Earners | 407 (36.8%) | $100,230 |
| 3+ Earners | 171 (15.5%) | $110,655 |
| Total | 1,105 (100.0%) | $79,261 |
Household Income in Silver Hill
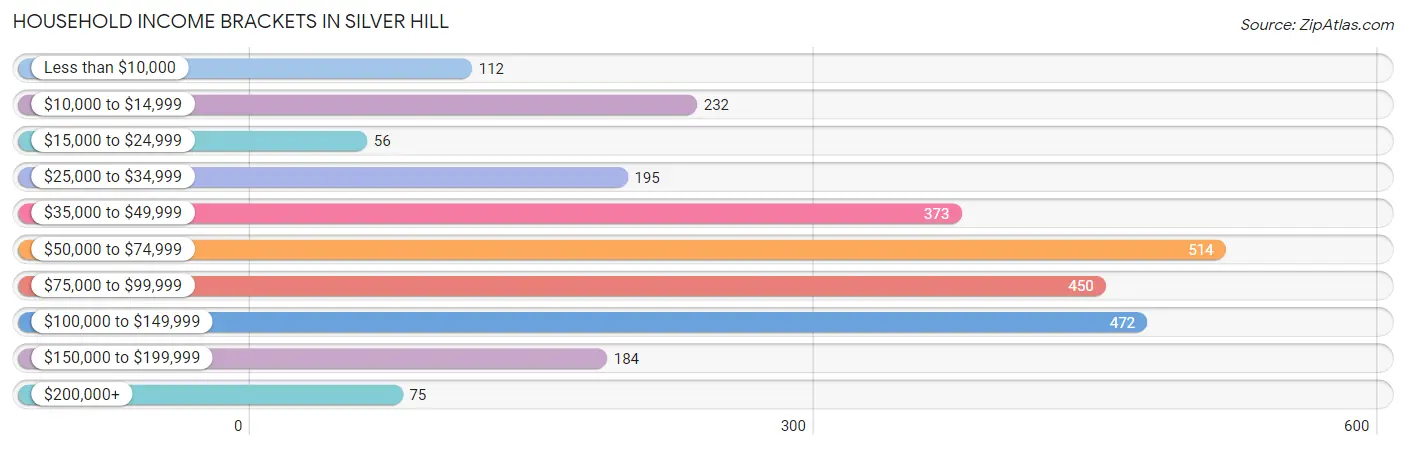
Household Income Brackets in Silver Hill
With 514 households falling in the category, the $50,000 to $74,999 income range is the most frequent in Silver Hill, accounting for 19.3% of all households. In contrast, only 56 households (2.1%) fall into the $15,000 to $24,999 income bracket, making it the least populous group.
| Income Bracket | # Households | % Households |
| Less than $10,000 | 112 | 4.2% |
| $10,000 to $14,999 | 232 | 8.7% |
| $15,000 to $24,999 | 56 | 2.1% |
| $25,000 to $34,999 | 195 | 7.3% |
| $35,000 to $49,999 | 373 | 14.0% |
| $50,000 to $74,999 | 514 | 19.3% |
| $75,000 to $99,999 | 450 | 16.9% |
| $100,000 to $149,999 | 472 | 17.7% |
| $150,000 to $199,999 | 184 | 6.9% |
| $200,000+ | 75 | 2.8% |
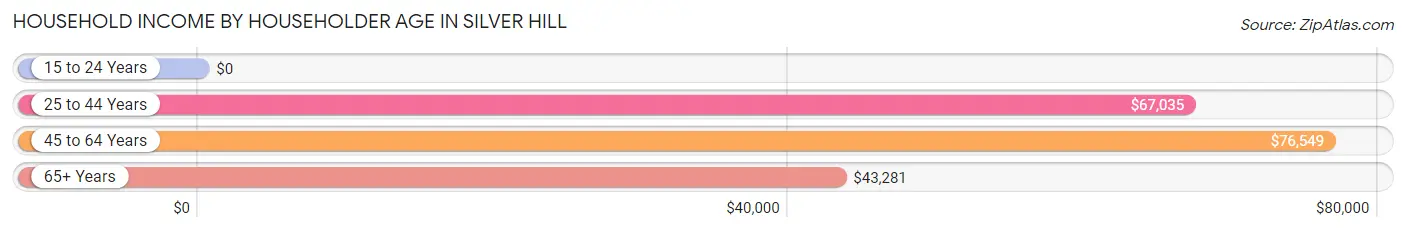
Household Income by Householder Age in Silver Hill
The median household income in Silver Hill is $65,096, with the highest median household income of $76,549 found in the 45 to 64 years age bracket for the primary householder. A total of 981 households (36.8%) fall into this category.
| Income Bracket | # Households | Median Income |
| 15 to 24 Years | 0 (0.0%) | $0 |
| 25 to 44 Years | 1,186 (44.5%) | $67,035 |
| 45 to 64 Years | 981 (36.8%) | $76,549 |
| 65+ Years | 498 (18.7%) | $43,281 |
| Total | 2,665 (100.0%) | $65,096 |
Poverty in Silver Hill
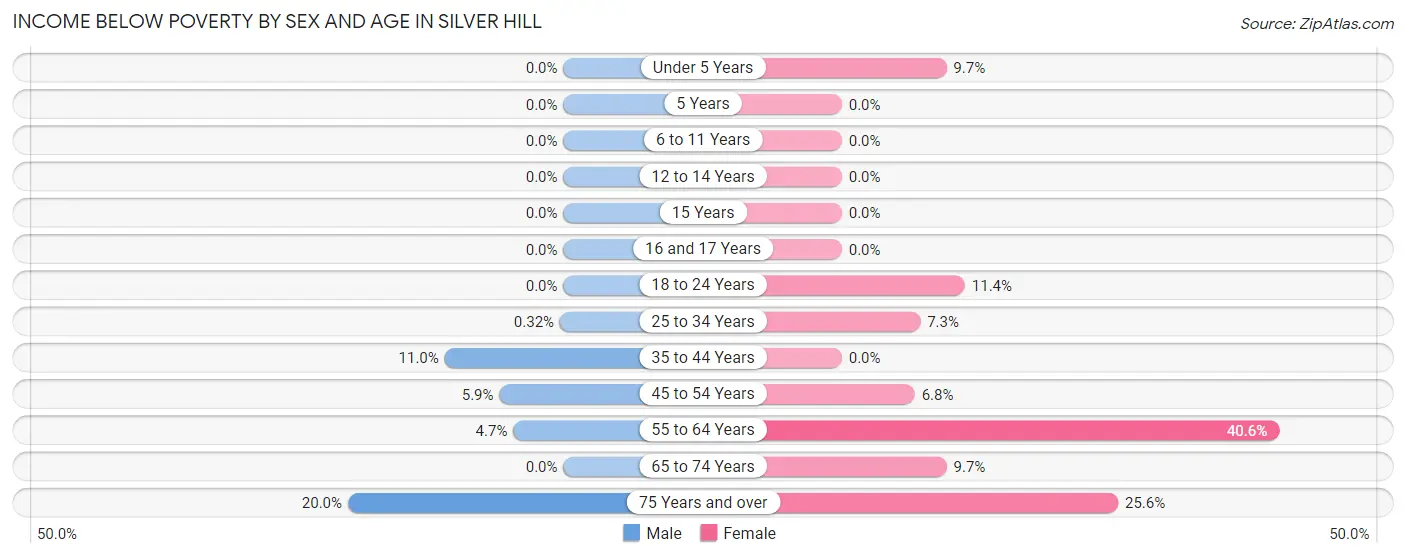
Income Below Poverty by Sex and Age in Silver Hill
With 4.3% poverty level for males and 12.4% for females among the residents of Silver Hill, 75 year old and over males and 55 to 64 year old females are the most vulnerable to poverty, with 21 males (20.0%) and 170 females (40.6%) in their respective age groups living below the poverty level.
| Age Bracket | Male | Female |
| Under 5 Years | 0 (0.0%) | 20 (9.7%) |
| 5 Years | 0 (0.0%) | 0 (0.0%) |
| 6 to 11 Years | 0 (0.0%) | 0 (0.0%) |
| 12 to 14 Years | 0 (0.0%) | 0 (0.0%) |
| 15 Years | 0 (0.0%) | 0 (0.0%) |
| 16 and 17 Years | 0 (0.0%) | 0 (0.0%) |
| 18 to 24 Years | 0 (0.0%) | 25 (11.4%) |
| 25 to 34 Years | 2 (0.3%) | 46 (7.3%) |
| 35 to 44 Years | 40 (11.0%) | 0 (0.0%) |
| 45 to 54 Years | 30 (5.9%) | 31 (6.8%) |
| 55 to 64 Years | 12 (4.6%) | 170 (40.6%) |
| 65 to 74 Years | 0 (0.0%) | 22 (9.7%) |
| 75 Years and over | 21 (20.0%) | 60 (25.6%) |
| Total | 105 (4.3%) | 374 (12.4%) |
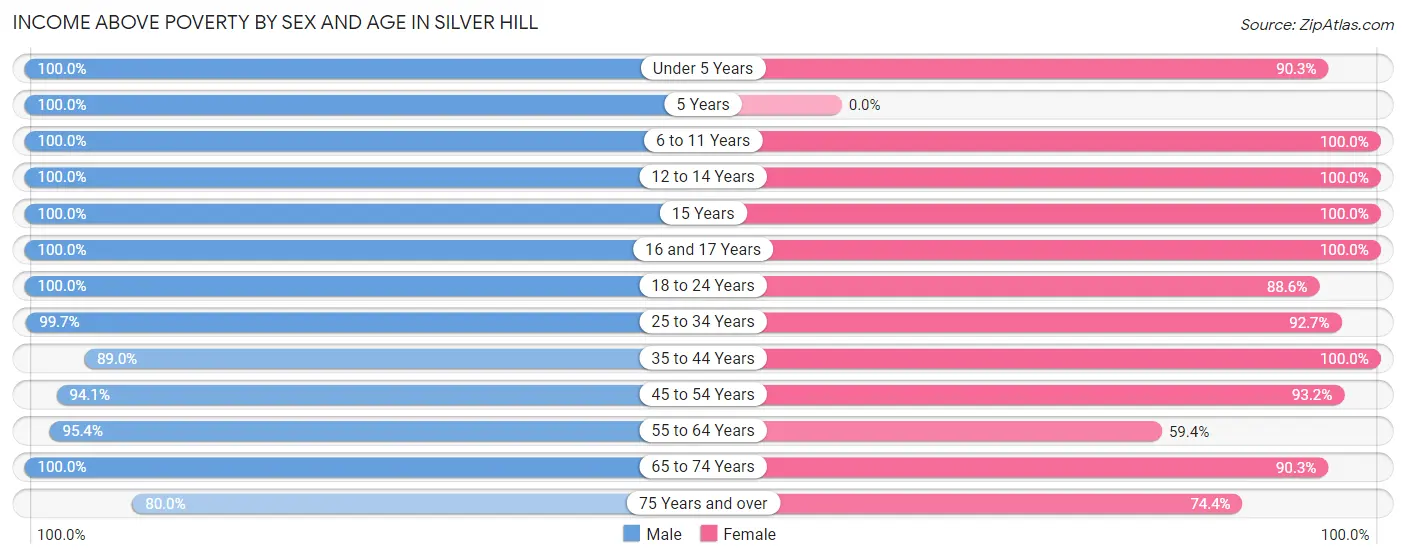
Income Above Poverty by Sex and Age in Silver Hill
According to the poverty statistics in Silver Hill, males aged under 5 years and females aged 6 to 11 years are the age groups that are most secure financially, with 100.0% of males and 100.0% of females in these age groups living above the poverty line.
| Age Bracket | Male | Female |
| Under 5 Years | 114 (100.0%) | 186 (90.3%) |
| 5 Years | 54 (100.0%) | 0 (0.0%) |
| 6 to 11 Years | 71 (100.0%) | 63 (100.0%) |
| 12 to 14 Years | 20 (100.0%) | 124 (100.0%) |
| 15 Years | 42 (100.0%) | 7 (100.0%) |
| 16 and 17 Years | 90 (100.0%) | 22 (100.0%) |
| 18 to 24 Years | 107 (100.0%) | 194 (88.6%) |
| 25 to 34 Years | 618 (99.7%) | 586 (92.7%) |
| 35 to 44 Years | 323 (89.0%) | 400 (100.0%) |
| 45 to 54 Years | 475 (94.1%) | 427 (93.2%) |
| 55 to 64 Years | 246 (95.4%) | 249 (59.4%) |
| 65 to 74 Years | 96 (100.0%) | 204 (90.3%) |
| 75 Years and over | 84 (80.0%) | 174 (74.4%) |
| Total | 2,340 (95.7%) | 2,636 (87.6%) |
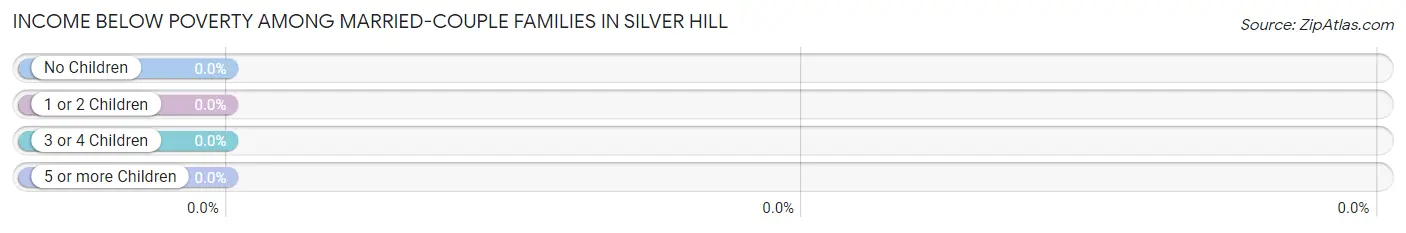
Income Below Poverty Among Married-Couple Families in Silver Hill
| Children | Above Poverty | Below Poverty |
| No Children | 272 (100.0%) | 0 (0.0%) |
| 1 or 2 Children | 126 (100.0%) | 0 (0.0%) |
| 3 or 4 Children | 22 (100.0%) | 0 (0.0%) |
| 5 or more Children | 0 (0.0%) | 0 (0.0%) |
| Total | 420 (100.0%) | 0 (0.0%) |
Income Below Poverty Among Single-Parent Households in Silver Hill
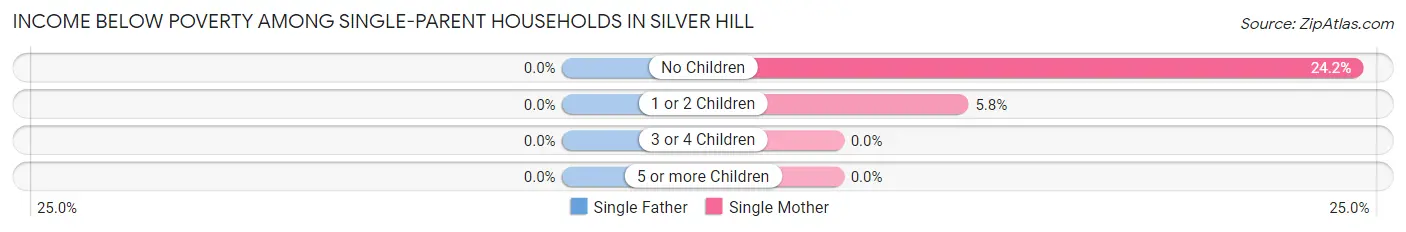
| Children | Single Father | Single Mother |
| No Children | 0 (0.0%) | 22 (24.2%) |
| 1 or 2 Children | 0 (0.0%) | 20 (5.8%) |
| 3 or 4 Children | 0 (0.0%) | 0 (0.0%) |
| 5 or more Children | 0 (0.0%) | 0 (0.0%) |
| Total | 0 (0.0%) | 42 (9.7%) |
Income Below Poverty Among Married-Couple vs Single-Parent Households in Silver Hill
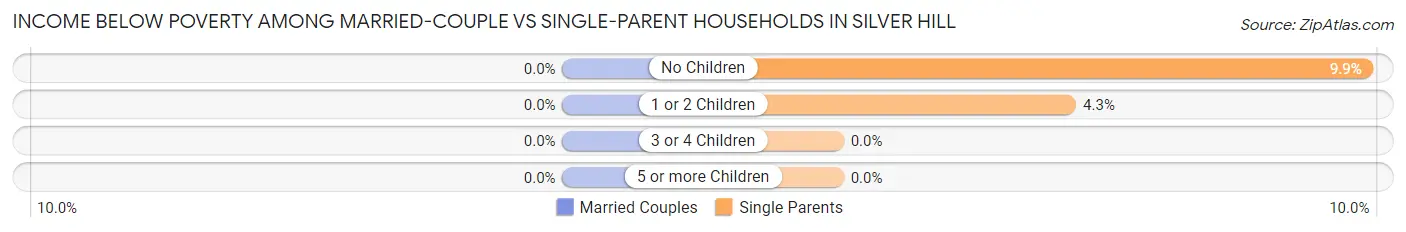
| Children | Married-Couple Families | Single-Parent Households |
| No Children | 0 (0.0%) | 22 (9.9%) |
| 1 or 2 Children | 0 (0.0%) | 20 (4.3%) |
| 3 or 4 Children | 0 (0.0%) | 0 (0.0%) |
| 5 or more Children | 0 (0.0%) | 0 (0.0%) |
| Total | 0 (0.0%) | 42 (6.1%) |
Race in Silver Hill
The most populous races in Silver Hill are Black / African American (5,107 | 93.6%), Two or more Races (190 | 3.5%), and Hispanic or Latino (157 | 2.9%).
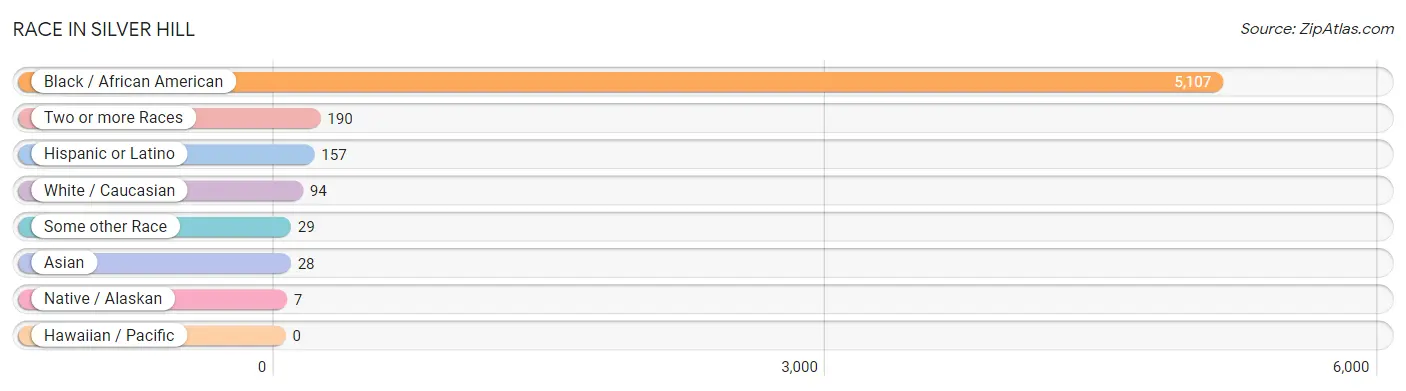
| Race | # Population | % Population |
| Asian | 28 | 0.5% |
| Black / African American | 5,107 | 93.6% |
| Hawaiian / Pacific | 0 | 0.0% |
| Hispanic or Latino | 157 | 2.9% |
| Native / Alaskan | 7 | 0.1% |
| White / Caucasian | 94 | 1.7% |
| Two or more Races | 190 | 3.5% |
| Some other Race | 29 | 0.5% |
| Total | 5,455 | 100.0% |
Ancestry in Silver Hill
The most populous ancestries reported in Silver Hill are American (274 | 5.0%), Subsaharan African (137 | 2.5%), Jamaican (85 | 1.6%), Central American (65 | 1.2%), and Salvadoran (65 | 1.2%), together accounting for 11.5% of all Silver Hill residents.
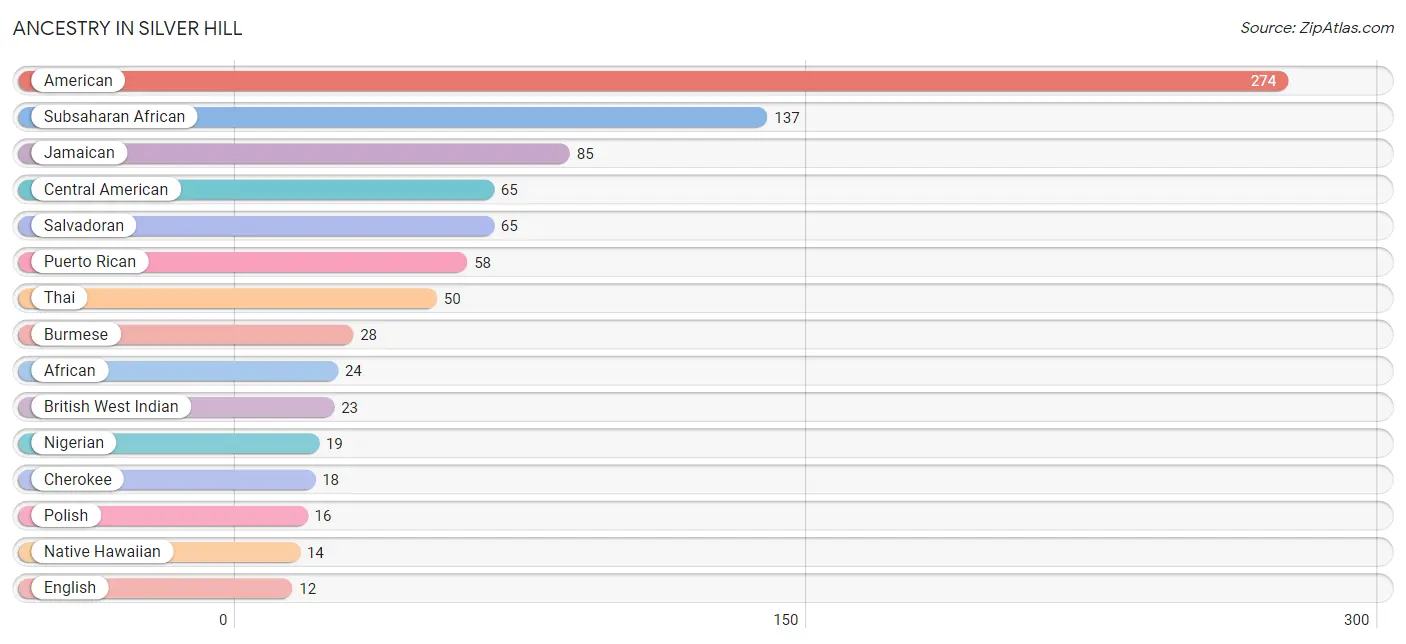
| Ancestry | # Population | % Population |
| African | 24 | 0.4% |
| American | 274 | 5.0% |
| Arab | 11 | 0.2% |
| British West Indian | 23 | 0.4% |
| Burmese | 28 | 0.5% |
| Central American | 65 | 1.2% |
| Cherokee | 18 | 0.3% |
| Cuban | 11 | 0.2% |
| Egyptian | 11 | 0.2% |
| English | 12 | 0.2% |
| Italian | 10 | 0.2% |
| Jamaican | 85 | 1.6% |
| Native Hawaiian | 14 | 0.3% |
| Nigerian | 19 | 0.4% |
| Polish | 16 | 0.3% |
| Puerto Rican | 58 | 1.1% |
| Salvadoran | 65 | 1.2% |
| Scotch-Irish | 12 | 0.2% |
| Subsaharan African | 137 | 2.5% |
| Thai | 50 | 0.9% |
| West Indian | 7 | 0.1% | View All 21 Rows |
Immigrants in Silver Hill
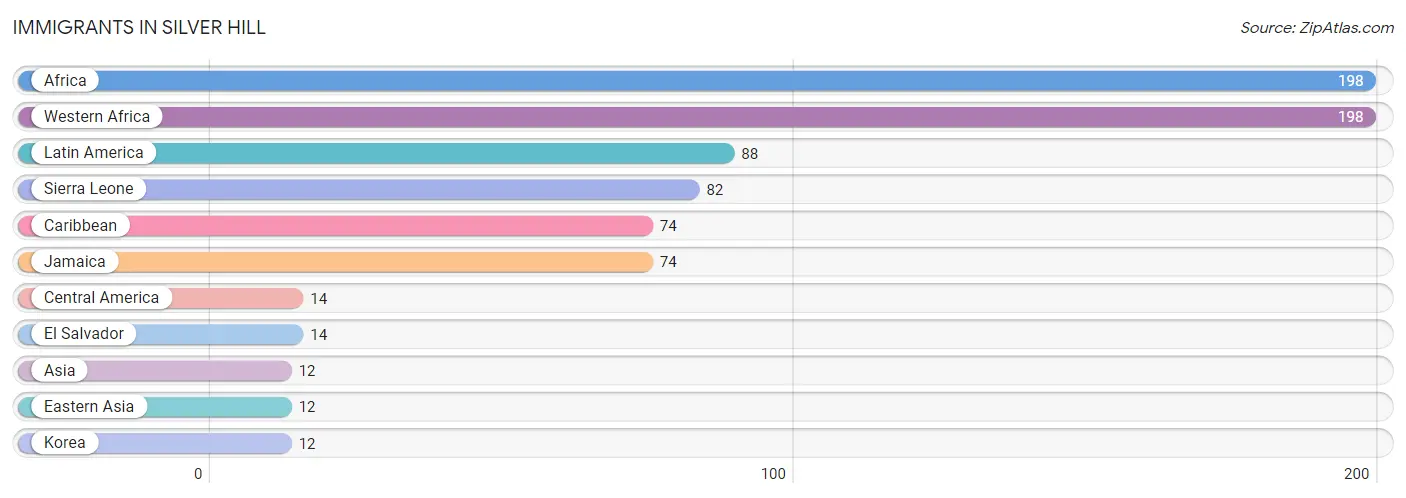
The most numerous immigrant groups reported in Silver Hill came from Africa (198 | 3.6%), Western Africa (198 | 3.6%), Latin America (88 | 1.6%), Sierra Leone (82 | 1.5%), and Caribbean (74 | 1.4%), together accounting for 11.7% of all Silver Hill residents.
| Immigration Origin | # Population | % Population |
| Africa | 198 | 3.6% |
| Asia | 12 | 0.2% |
| Caribbean | 74 | 1.4% |
| Central America | 14 | 0.3% |
| Eastern Asia | 12 | 0.2% |
| El Salvador | 14 | 0.3% |
| Jamaica | 74 | 1.4% |
| Korea | 12 | 0.2% |
| Latin America | 88 | 1.6% |
| Sierra Leone | 82 | 1.5% |
| Western Africa | 198 | 3.6% | View All 11 Rows |
Sex and Age in Silver Hill
Sex and Age in Silver Hill
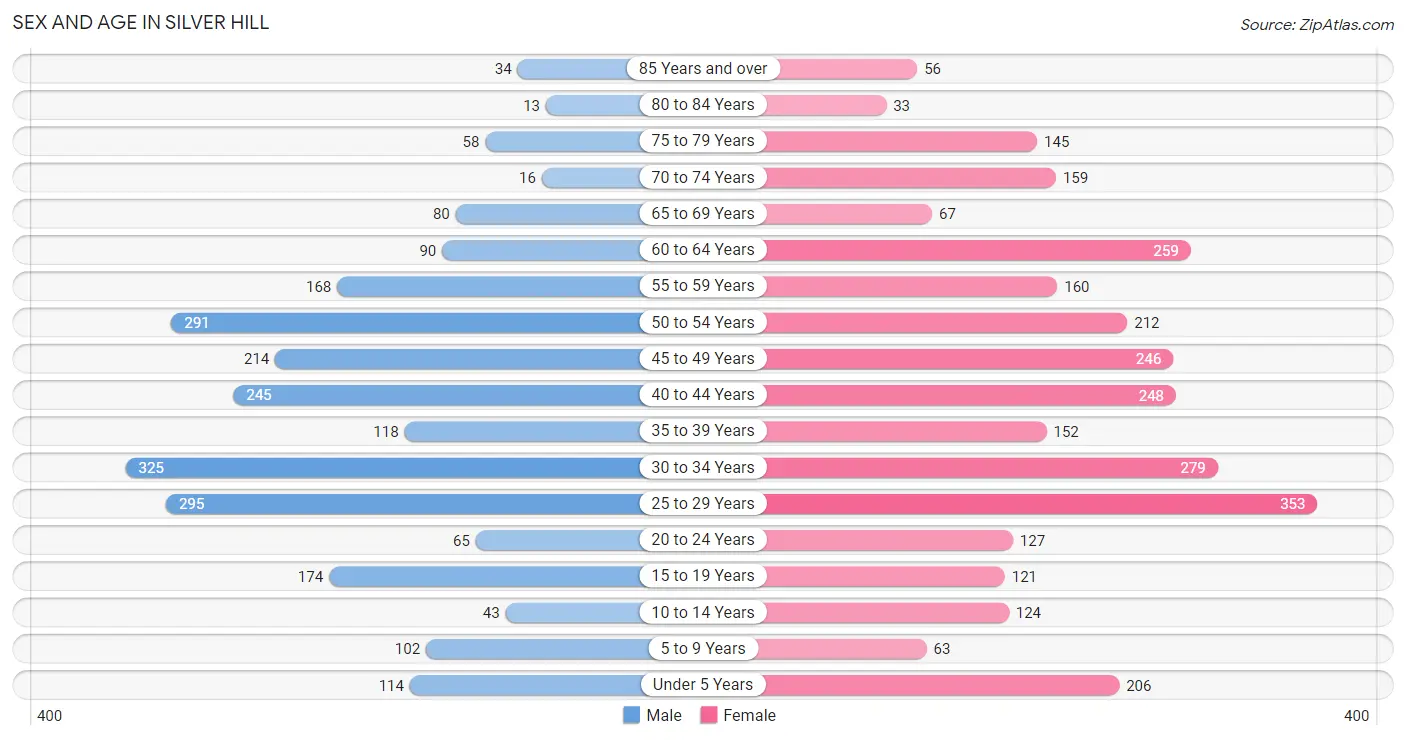
The most populous age groups in Silver Hill are 30 to 34 Years (325 | 13.3%) for men and 25 to 29 Years (353 | 11.7%) for women.
| Age Bracket | Male | Female |
| Under 5 Years | 114 (4.7%) | 206 (6.8%) |
| 5 to 9 Years | 102 (4.2%) | 63 (2.1%) |
| 10 to 14 Years | 43 (1.8%) | 124 (4.1%) |
| 15 to 19 Years | 174 (7.1%) | 121 (4.0%) |
| 20 to 24 Years | 65 (2.7%) | 127 (4.2%) |
| 25 to 29 Years | 295 (12.1%) | 353 (11.7%) |
| 30 to 34 Years | 325 (13.3%) | 279 (9.3%) |
| 35 to 39 Years | 118 (4.8%) | 152 (5.1%) |
| 40 to 44 Years | 245 (10.0%) | 248 (8.2%) |
| 45 to 49 Years | 214 (8.7%) | 246 (8.2%) |
| 50 to 54 Years | 291 (11.9%) | 212 (7.0%) |
| 55 to 59 Years | 168 (6.9%) | 160 (5.3%) |
| 60 to 64 Years | 90 (3.7%) | 259 (8.6%) |
| 65 to 69 Years | 80 (3.3%) | 67 (2.2%) |
| 70 to 74 Years | 16 (0.6%) | 159 (5.3%) |
| 75 to 79 Years | 58 (2.4%) | 145 (4.8%) |
| 80 to 84 Years | 13 (0.5%) | 33 (1.1%) |
| 85 Years and over | 34 (1.4%) | 56 (1.9%) |
| Total | 2,445 (100.0%) | 3,010 (100.0%) |
Families and Households in Silver Hill
Median Family Size in Silver Hill
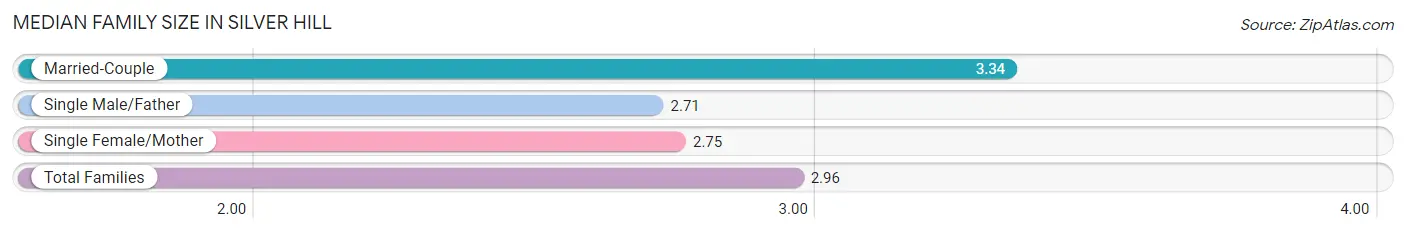
The median family size in Silver Hill is 2.96 persons per family, with married-couple families (420 | 38.0%) accounting for the largest median family size of 3.34 persons per family. On the other hand, single male/father families (250 | 22.6%) represent the smallest median family size with 2.71 persons per family.
| Family Type | # Families | Family Size |
| Married-Couple | 420 (38.0%) | 3.34 |
| Single Male/Father | 250 (22.6%) | 2.71 |
| Single Female/Mother | 435 (39.4%) | 2.75 |
| Total Families | 1,105 (100.0%) | 2.96 |
Median Household Size in Silver Hill
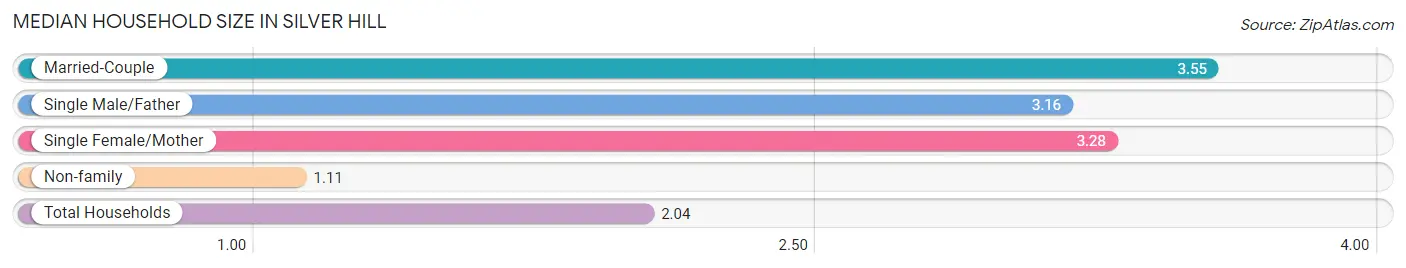
The median household size in Silver Hill is 2.04 persons per household, with married-couple households (420 | 15.8%) accounting for the largest median household size of 3.55 persons per household. non-family households (1,560 | 58.5%) represent the smallest median household size with 1.11 persons per household.
| Household Type | # Households | Household Size |
| Married-Couple | 420 (15.8%) | 3.55 |
| Single Male/Father | 250 (9.4%) | 3.16 |
| Single Female/Mother | 435 (16.3%) | 3.28 |
| Non-family | 1,560 (58.5%) | 1.11 |
| Total Households | 2,665 (100.0%) | 2.04 |
Household Size by Marriage Status in Silver Hill
Out of a total of 2,665 households in Silver Hill, 1,105 (41.5%) are family households, while 1,560 (58.5%) are nonfamily households. The most numerous type of family households are 3-person households, comprising 430, and the most common type of nonfamily households are 1-person households, comprising 1,408.
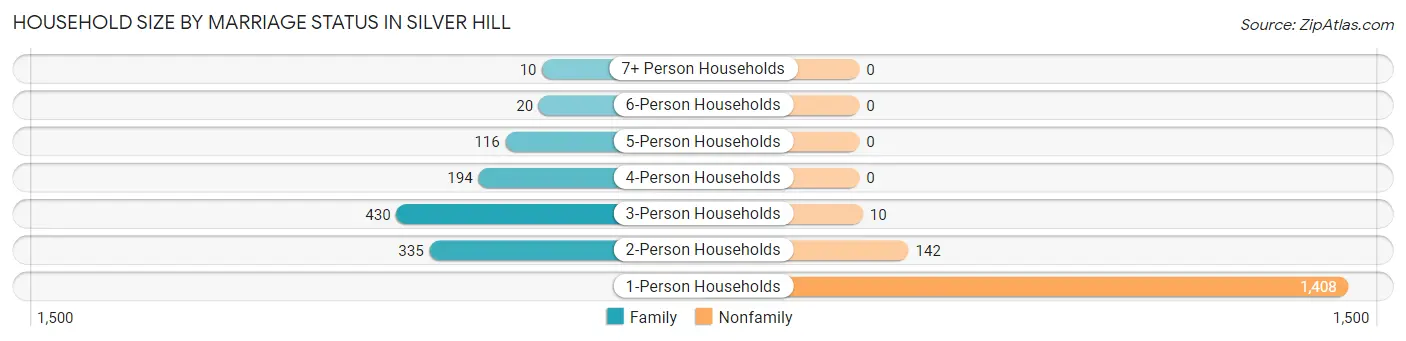
| Household Size | Family Households | Nonfamily Households |
| 1-Person Households | - | 1,408 (52.8%) |
| 2-Person Households | 335 (12.6%) | 142 (5.3%) |
| 3-Person Households | 430 (16.1%) | 10 (0.4%) |
| 4-Person Households | 194 (7.3%) | 0 (0.0%) |
| 5-Person Households | 116 (4.3%) | 0 (0.0%) |
| 6-Person Households | 20 (0.7%) | 0 (0.0%) |
| 7+ Person Households | 10 (0.4%) | 0 (0.0%) |
| Total | 1,105 (41.5%) | 1,560 (58.5%) |
Female Fertility in Silver Hill
Fertility by Age in Silver Hill
Average fertility rate in Silver Hill is 62.0 births per 1,000 women. Women in the age bracket of 20 to 34 years have the highest fertility rate with 119.0 births per 1,000 women. Women in the age bracket of 20 to 34 years acount for 93.8% of all women with births.
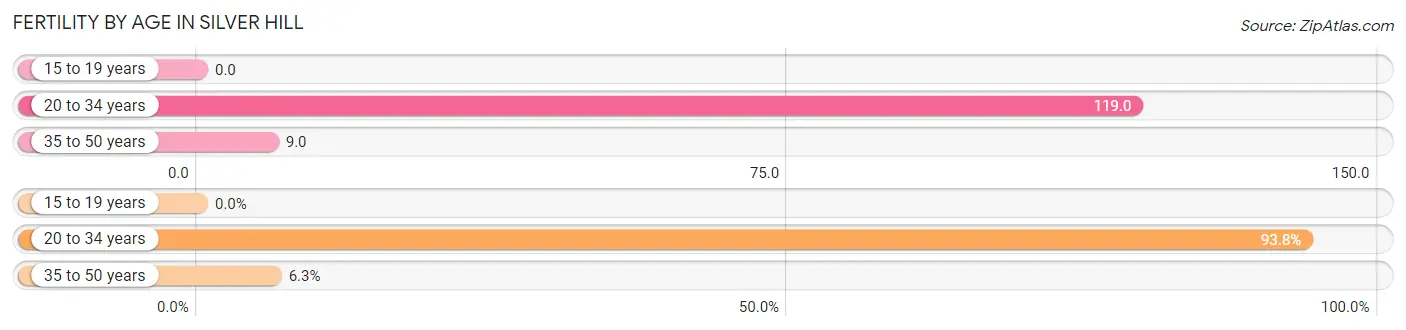
| Age Bracket | Women with Births | Births / 1,000 Women |
| 15 to 19 years | 0 (0.0%) | 0.0 |
| 20 to 34 years | 90 (93.8%) | 119.0 |
| 35 to 50 years | 6 (6.2%) | 9.0 |
| Total | 96 (100.0%) | 62.0 |
Fertility by Age by Marriage Status in Silver Hill
37.5% of women with births (96) in Silver Hill are married. The highest percentage of unmarried women with births falls into 20 to 34 years age bracket with 66.7% of them unmarried at the time of birth, while the lowest percentage of unmarried women with births belong to 35 to 50 years age bracket with 0.0% of them unmarried.
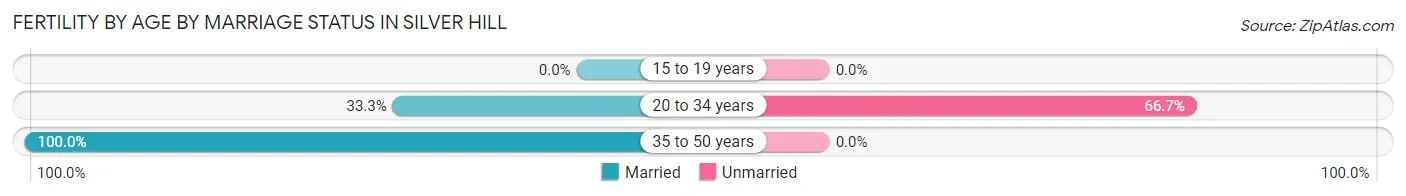
| Age Bracket | Married | Unmarried |
| 15 to 19 years | 0 (0.0%) | 0 (0.0%) |
| 20 to 34 years | 30 (33.3%) | 60 (66.7%) |
| 35 to 50 years | 6 (100.0%) | 0 (0.0%) |
| Total | 36 (37.5%) | 60 (62.5%) |
Fertility by Education in Silver Hill
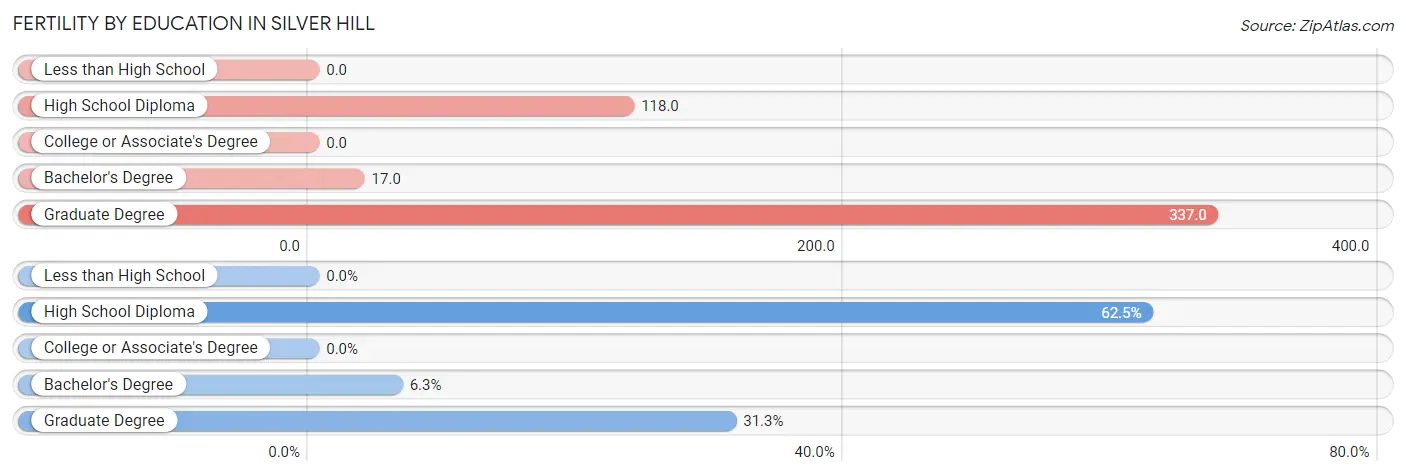
| Educational Attainment | Women with Births | Births / 1,000 Women |
| Less than High School | 0 (0.0%) | 0.0 |
| High School Diploma | 60 (62.5%) | 118.0 |
| College or Associate's Degree | 0 (0.0%) | 0.0 |
| Bachelor's Degree | 6 (6.2%) | 17.0 |
| Graduate Degree | 30 (31.2%) | 337.0 |
| Total | 96 (100.0%) | 62.0 |
Fertility by Education by Marriage Status in Silver Hill
62.5% of women with births in Silver Hill are unmarried. Women with the educational attainment of bachelor's degree are most likely to be married with 100.0% of them married at childbirth, while women with the educational attainment of high school diploma are least likely to be married with 100.0% of them unmarried at childbirth.
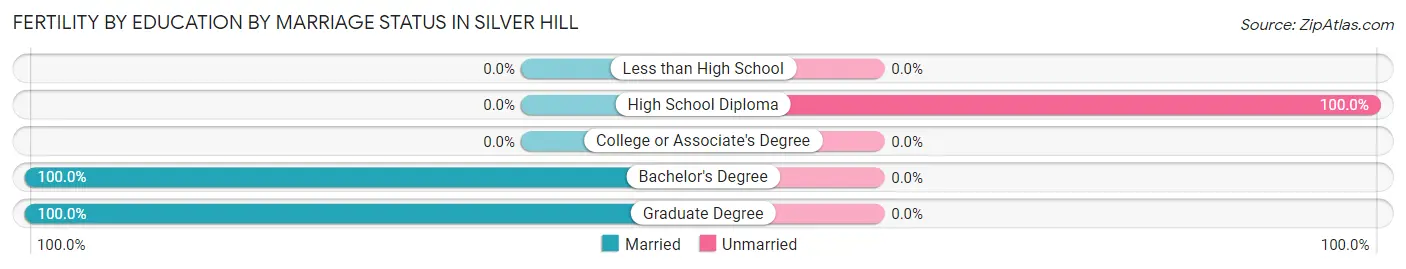
| Educational Attainment | Married | Unmarried |
| Less than High School | 0 (0.0%) | 0 (0.0%) |
| High School Diploma | 0 (0.0%) | 60 (100.0%) |
| College or Associate's Degree | 0 (0.0%) | 0 (0.0%) |
| Bachelor's Degree | 6 (100.0%) | 0 (0.0%) |
| Graduate Degree | 30 (100.0%) | 0 (0.0%) |
| Total | 36 (37.5%) | 60 (62.5%) |
Employment Characteristics in Silver Hill
Employment by Class of Employer in Silver Hill
Among the 3,263 employed individuals in Silver Hill, private company employees (1,900 | 58.2%), federal government employees (531 | 16.3%), and local government employees (230 | 7.0%) make up the most common classes of employment.
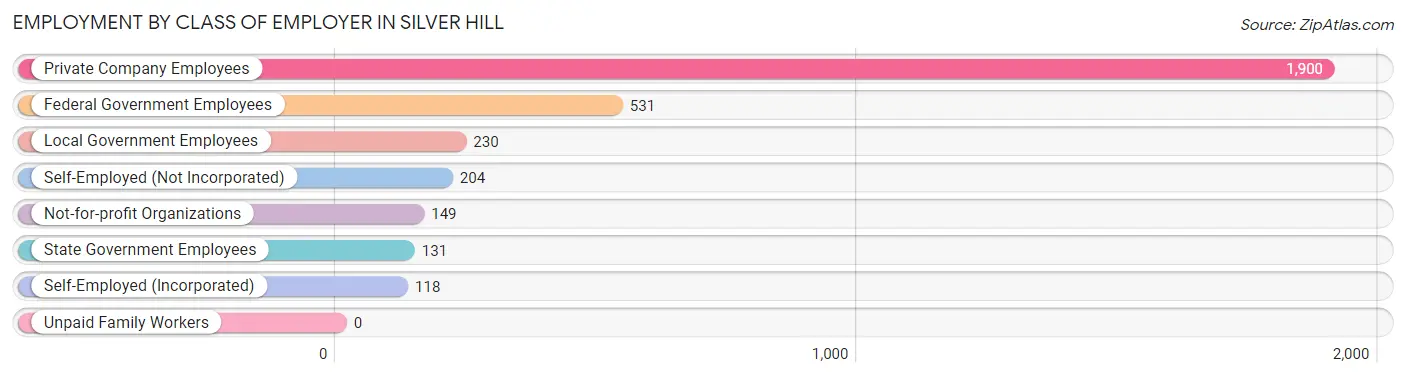
| Employer Class | # Employees | % Employees |
| Private Company Employees | 1,900 | 58.2% |
| Self-Employed (Incorporated) | 118 | 3.6% |
| Self-Employed (Not Incorporated) | 204 | 6.2% |
| Not-for-profit Organizations | 149 | 4.6% |
| Local Government Employees | 230 | 7.0% |
| State Government Employees | 131 | 4.0% |
| Federal Government Employees | 531 | 16.3% |
| Unpaid Family Workers | 0 | 0.0% |
| Total | 3,263 | 100.0% |
Employment Status by Age in Silver Hill
According to the labor force statistics for Silver Hill, out of the total population over 16 years of age (4,754), 73.2% or 3,480 individuals are in the labor force, with 3.6% or 125 of them unemployed. The age group with the highest labor force participation rate is 30 to 34 years, with 95.5% or 577 individuals in the labor force. Within the labor force, the 20 to 24 years age range has the highest percentage of unemployed individuals, with 22.0% or 37 of them being unemployed.
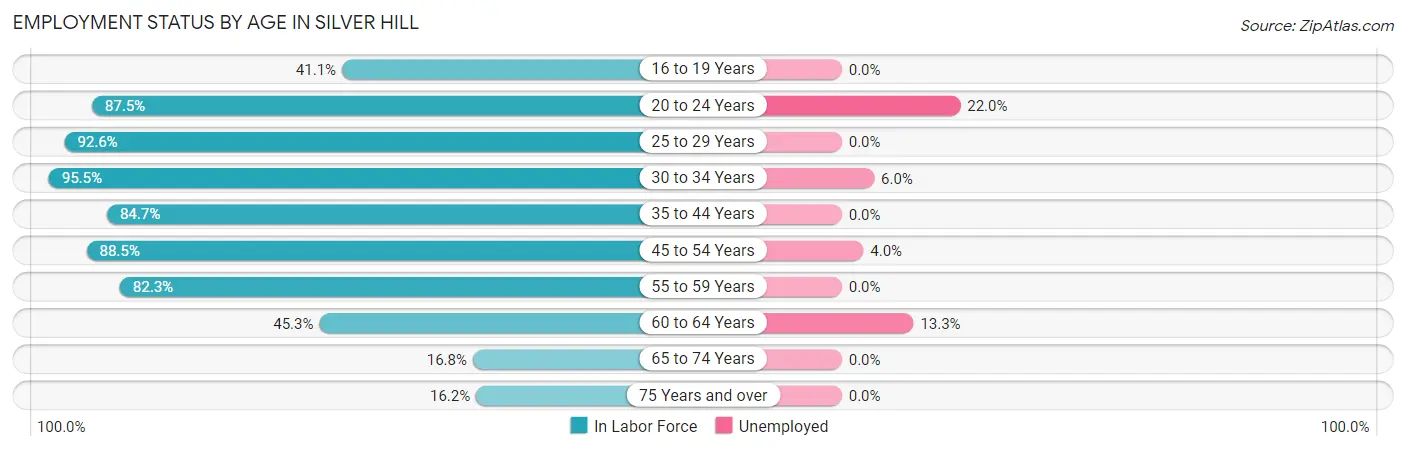
| Age Bracket | In Labor Force | Unemployed |
| 16 to 19 Years | 101 (41.1%) | 0 (0.0%) |
| 20 to 24 Years | 168 (87.5%) | 37 (22.0%) |
| 25 to 29 Years | 600 (92.6%) | 0 (0.0%) |
| 30 to 34 Years | 577 (95.5%) | 35 (6.0%) |
| 35 to 44 Years | 646 (84.7%) | 0 (0.0%) |
| 45 to 54 Years | 852 (88.5%) | 34 (4.0%) |
| 55 to 59 Years | 270 (82.3%) | 0 (0.0%) |
| 60 to 64 Years | 158 (45.3%) | 21 (13.3%) |
| 65 to 74 Years | 54 (16.8%) | 0 (0.0%) |
| 75 Years and over | 55 (16.2%) | 0 (0.0%) |
| Total | 3,480 (73.2%) | 125 (3.6%) |
Employment Status by Educational Attainment in Silver Hill
According to labor force statistics for Silver Hill, 84.9% of individuals (3,103) out of the total population between 25 and 64 years of age (3,655) are in the labor force, with 2.9% or 90 of them being unemployed. The group with the highest labor force participation rate are those with the educational attainment of bachelor's degree or higher, with 94.7% or 666 individuals in the labor force. Within the labor force, individuals with less than high school education have the highest percentage of unemployment, with 10.4% or 21 of them being unemployed.
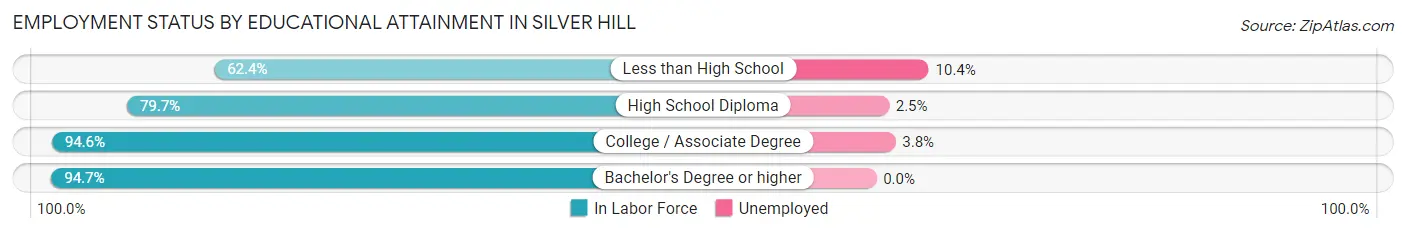
| Educational Attainment | In Labor Force | Unemployed |
| Less than High School | 201 (62.4%) | 33 (10.4%) |
| High School Diploma | 1,352 (79.7%) | 42 (2.5%) |
| College / Associate Degree | 884 (94.6%) | 35 (3.8%) |
| Bachelor's Degree or higher | 666 (94.7%) | 0 (0.0%) |
| Total | 3,103 (84.9%) | 106 (2.9%) |
Employment Occupations by Sex in Silver Hill
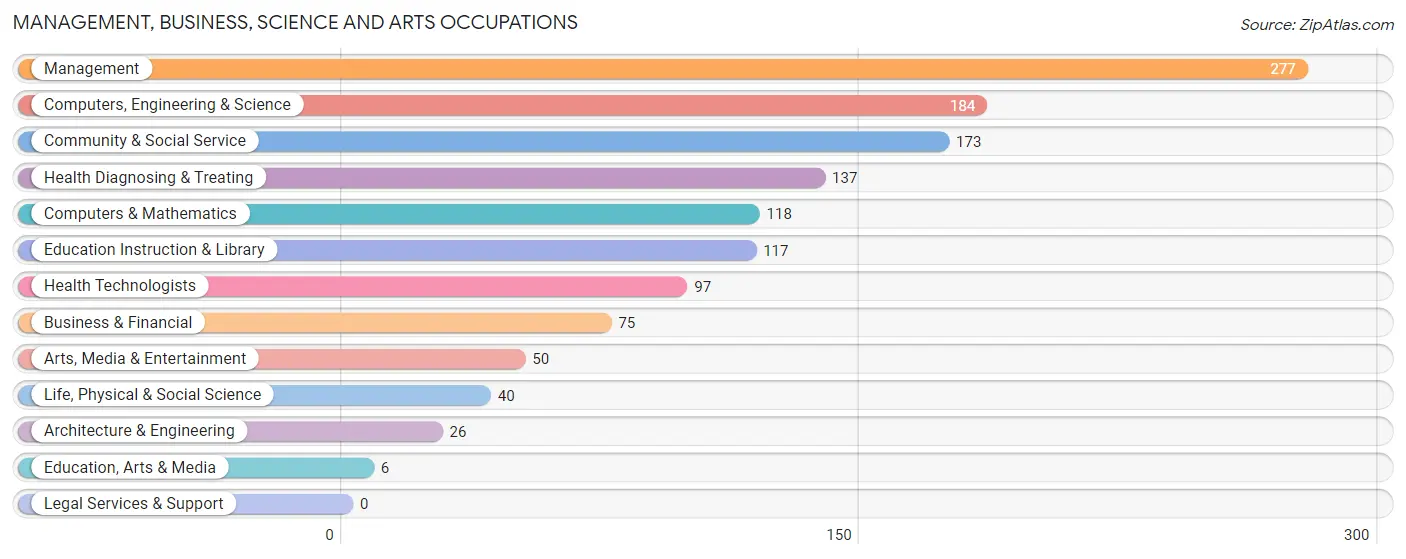
Management, Business, Science and Arts Occupations
The most common Management, Business, Science and Arts occupations in Silver Hill are Management (277 | 8.3%), Computers, Engineering & Science (184 | 5.5%), Community & Social Service (173 | 5.2%), Health Diagnosing & Treating (137 | 4.1%), and Computers & Mathematics (118 | 3.5%).
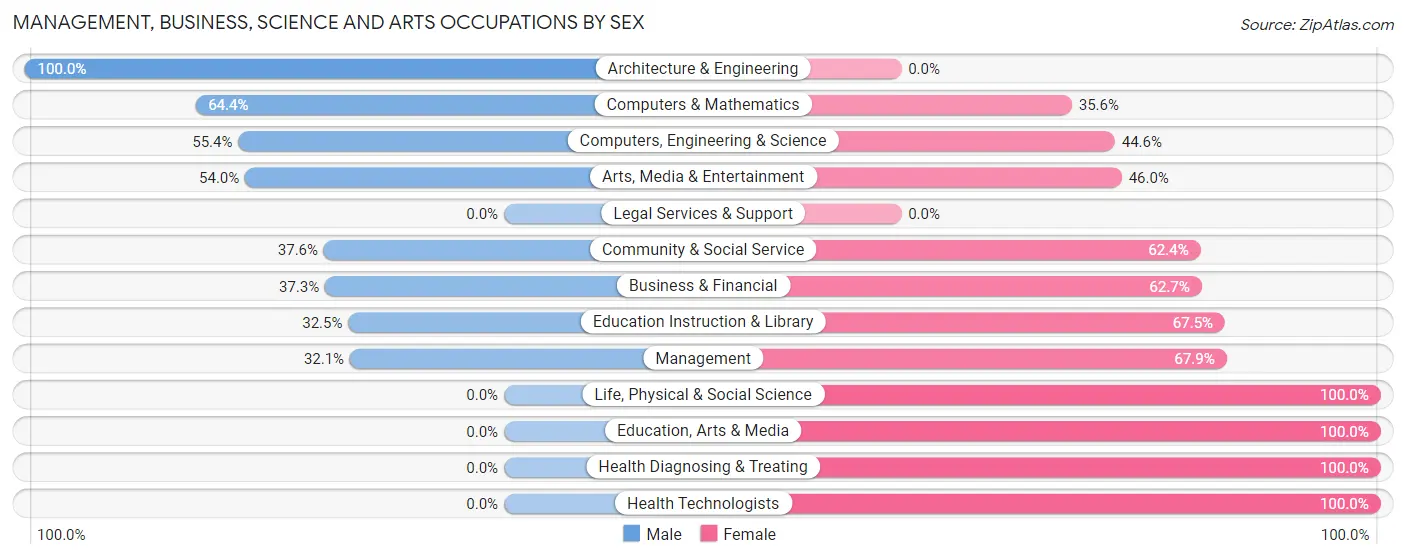
Management, Business, Science and Arts Occupations by Sex
Within the Management, Business, Science and Arts occupations in Silver Hill, the most male-oriented occupations are Architecture & Engineering (100.0%), Computers & Mathematics (64.4%), and Computers, Engineering & Science (55.4%), while the most female-oriented occupations are Life, Physical & Social Science (100.0%), Education, Arts & Media (100.0%), and Health Diagnosing & Treating (100.0%).
| Occupation | Male | Female |
| Management | 89 (32.1%) | 188 (67.9%) |
| Business & Financial | 28 (37.3%) | 47 (62.7%) |
| Computers, Engineering & Science | 102 (55.4%) | 82 (44.6%) |
| Computers & Mathematics | 76 (64.4%) | 42 (35.6%) |
| Architecture & Engineering | 26 (100.0%) | 0 (0.0%) |
| Life, Physical & Social Science | 0 (0.0%) | 40 (100.0%) |
| Community & Social Service | 65 (37.6%) | 108 (62.4%) |
| Education, Arts & Media | 0 (0.0%) | 6 (100.0%) |
| Legal Services & Support | 0 (0.0%) | 0 (0.0%) |
| Education Instruction & Library | 38 (32.5%) | 79 (67.5%) |
| Arts, Media & Entertainment | 27 (54.0%) | 23 (46.0%) |
| Health Diagnosing & Treating | 0 (0.0%) | 137 (100.0%) |
| Health Technologists | 0 (0.0%) | 97 (100.0%) |
| Total (Category) | 284 (33.6%) | 562 (66.4%) |
| Total (Overall) | 1,643 (49.1%) | 1,705 (50.9%) |
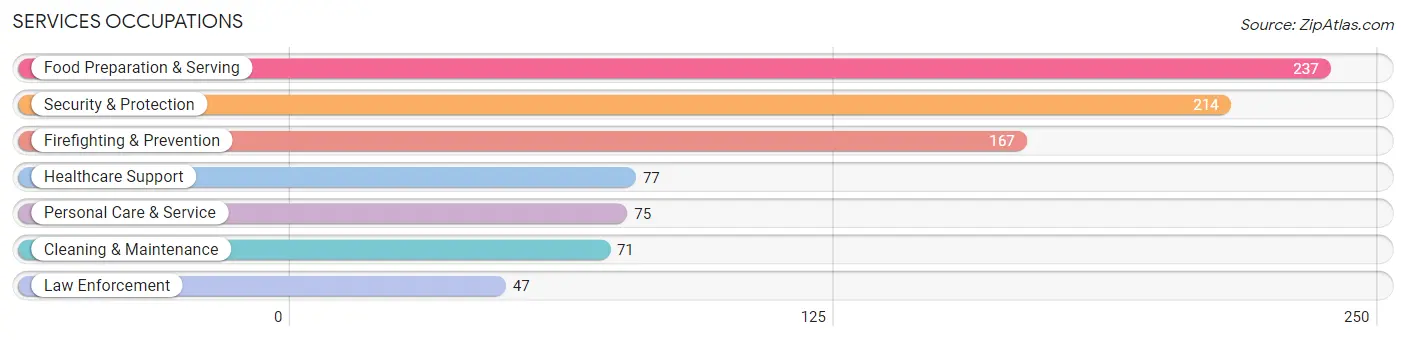
Services Occupations
The most common Services occupations in Silver Hill are Food Preparation & Serving (237 | 7.1%), Security & Protection (214 | 6.4%), Firefighting & Prevention (167 | 5.0%), Healthcare Support (77 | 2.3%), and Personal Care & Service (75 | 2.2%).
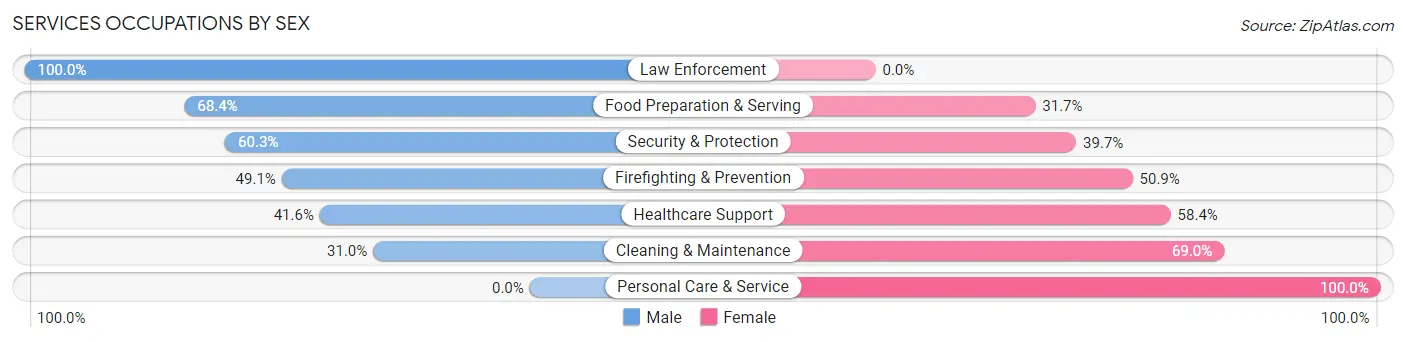
Services Occupations by Sex
Within the Services occupations in Silver Hill, the most male-oriented occupations are Law Enforcement (100.0%), Food Preparation & Serving (68.3%), and Security & Protection (60.3%), while the most female-oriented occupations are Personal Care & Service (100.0%), Cleaning & Maintenance (69.0%), and Healthcare Support (58.4%).
| Occupation | Male | Female |
| Healthcare Support | 32 (41.6%) | 45 (58.4%) |
| Security & Protection | 129 (60.3%) | 85 (39.7%) |
| Firefighting & Prevention | 82 (49.1%) | 85 (50.9%) |
| Law Enforcement | 47 (100.0%) | 0 (0.0%) |
| Food Preparation & Serving | 162 (68.3%) | 75 (31.7%) |
| Cleaning & Maintenance | 22 (31.0%) | 49 (69.0%) |
| Personal Care & Service | 0 (0.0%) | 75 (100.0%) |
| Total (Category) | 345 (51.2%) | 329 (48.8%) |
| Total (Overall) | 1,643 (49.1%) | 1,705 (50.9%) |
Sales and Office Occupations
The most common Sales and Office occupations in Silver Hill are Office & Administration (513 | 15.3%), and Sales & Related (160 | 4.8%).
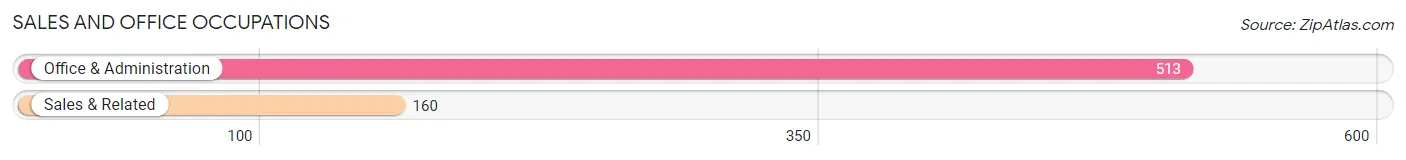
Sales and Office Occupations by Sex
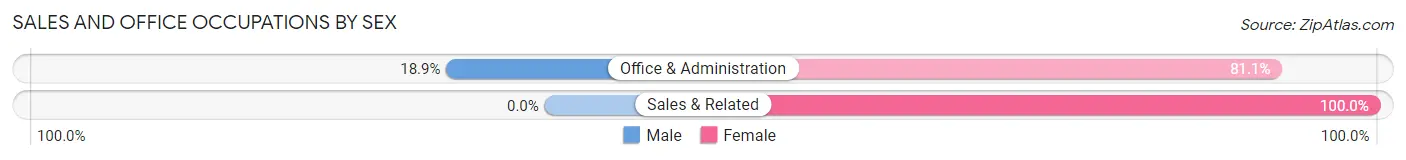
| Occupation | Male | Female |
| Sales & Related | 0 (0.0%) | 160 (100.0%) |
| Office & Administration | 97 (18.9%) | 416 (81.1%) |
| Total (Category) | 97 (14.4%) | 576 (85.6%) |
| Total (Overall) | 1,643 (49.1%) | 1,705 (50.9%) |
Natural Resources, Construction and Maintenance Occupations
The most common Natural Resources, Construction and Maintenance occupations in Silver Hill are Installation, Maintenance & Repair (394 | 11.8%), Construction & Extraction (248 | 7.4%), and Farming, Fishing & Forestry (16 | 0.5%).
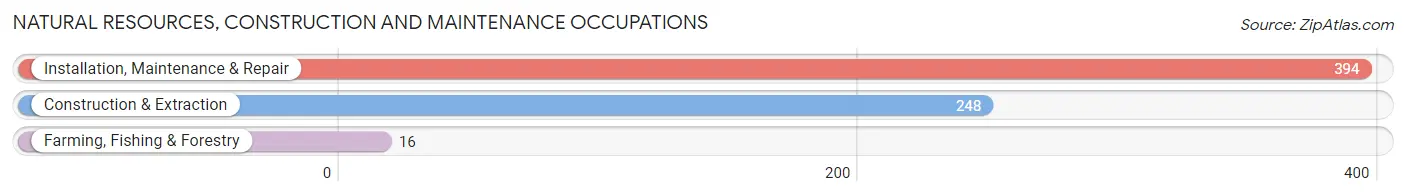
Natural Resources, Construction and Maintenance Occupations by Sex
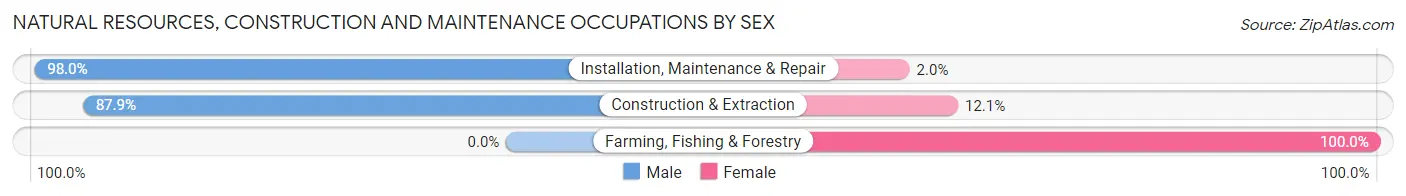
| Occupation | Male | Female |
| Farming, Fishing & Forestry | 0 (0.0%) | 16 (100.0%) |
| Construction & Extraction | 218 (87.9%) | 30 (12.1%) |
| Installation, Maintenance & Repair | 386 (98.0%) | 8 (2.0%) |
| Total (Category) | 604 (91.8%) | 54 (8.2%) |
| Total (Overall) | 1,643 (49.1%) | 1,705 (50.9%) |
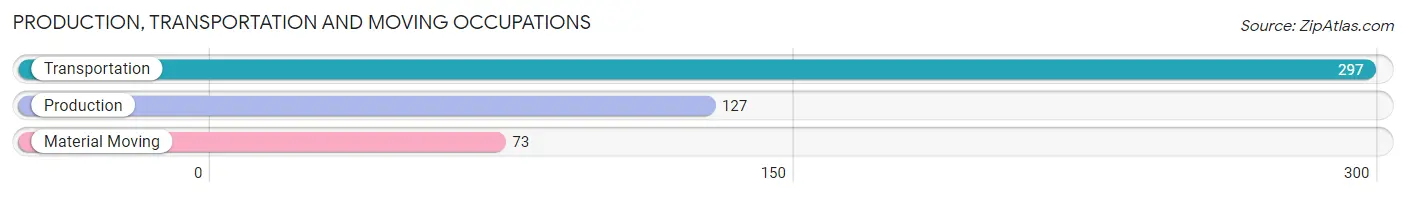
Production, Transportation and Moving Occupations
The most common Production, Transportation and Moving occupations in Silver Hill are Transportation (297 | 8.9%), Production (127 | 3.8%), and Material Moving (73 | 2.2%).
Production, Transportation and Moving Occupations by Sex
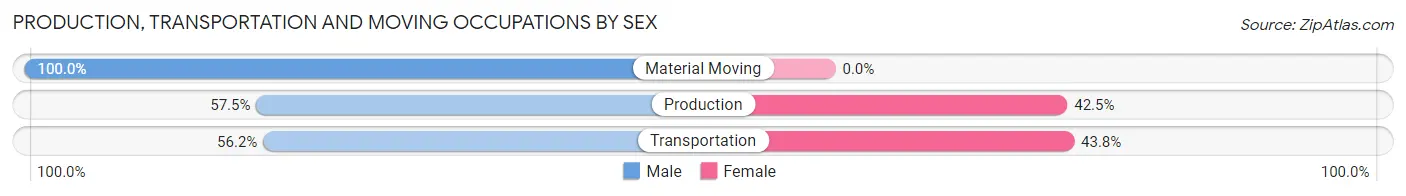
| Occupation | Male | Female |
| Production | 73 (57.5%) | 54 (42.5%) |
| Transportation | 167 (56.2%) | 130 (43.8%) |
| Material Moving | 73 (100.0%) | 0 (0.0%) |
| Total (Category) | 313 (63.0%) | 184 (37.0%) |
| Total (Overall) | 1,643 (49.1%) | 1,705 (50.9%) |
Employment Industries by Sex in Silver Hill
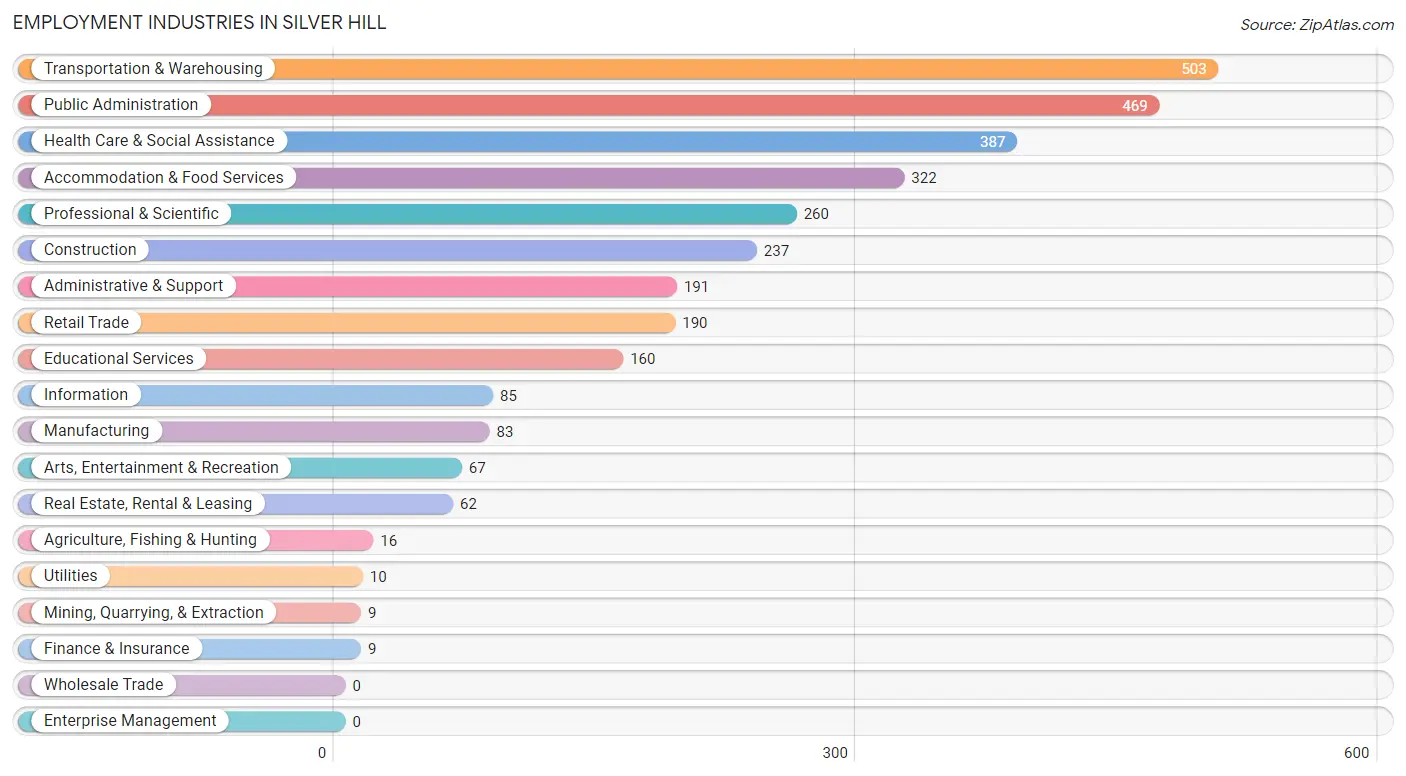
Employment Industries in Silver Hill
The major employment industries in Silver Hill include Transportation & Warehousing (503 | 15.0%), Public Administration (469 | 14.0%), Health Care & Social Assistance (387 | 11.6%), Accommodation & Food Services (322 | 9.6%), and Professional & Scientific (260 | 7.8%).
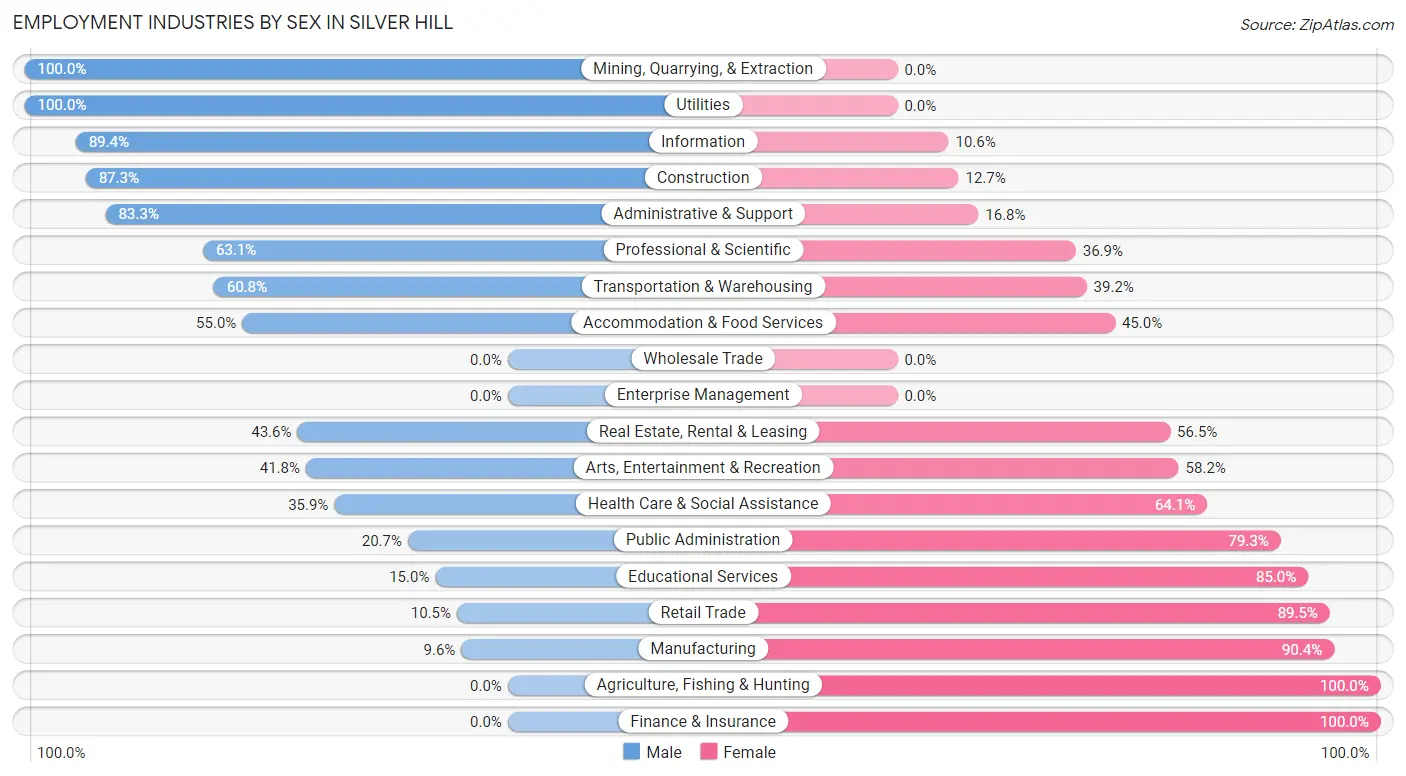
Employment Industries by Sex in Silver Hill
The Silver Hill industries that see more men than women are Mining, Quarrying, & Extraction (100.0%), Utilities (100.0%), and Information (89.4%), whereas the industries that tend to have a higher number of women are Agriculture, Fishing & Hunting (100.0%), Finance & Insurance (100.0%), and Manufacturing (90.4%).
| Industry | Male | Female |
| Agriculture, Fishing & Hunting | 0 (0.0%) | 16 (100.0%) |
| Mining, Quarrying, & Extraction | 9 (100.0%) | 0 (0.0%) |
| Construction | 207 (87.3%) | 30 (12.7%) |
| Manufacturing | 8 (9.6%) | 75 (90.4%) |
| Wholesale Trade | 0 (0.0%) | 0 (0.0%) |
| Retail Trade | 20 (10.5%) | 170 (89.5%) |
| Transportation & Warehousing | 306 (60.8%) | 197 (39.2%) |
| Utilities | 10 (100.0%) | 0 (0.0%) |
| Information | 76 (89.4%) | 9 (10.6%) |
| Finance & Insurance | 0 (0.0%) | 9 (100.0%) |
| Real Estate, Rental & Leasing | 27 (43.5%) | 35 (56.5%) |
| Professional & Scientific | 164 (63.1%) | 96 (36.9%) |
| Enterprise Management | 0 (0.0%) | 0 (0.0%) |
| Administrative & Support | 159 (83.3%) | 32 (16.8%) |
| Educational Services | 24 (15.0%) | 136 (85.0%) |
| Health Care & Social Assistance | 139 (35.9%) | 248 (64.1%) |
| Arts, Entertainment & Recreation | 28 (41.8%) | 39 (58.2%) |
| Accommodation & Food Services | 177 (55.0%) | 145 (45.0%) |
| Public Administration | 97 (20.7%) | 372 (79.3%) |
| Total | 1,643 (49.1%) | 1,705 (50.9%) |
Education in Silver Hill
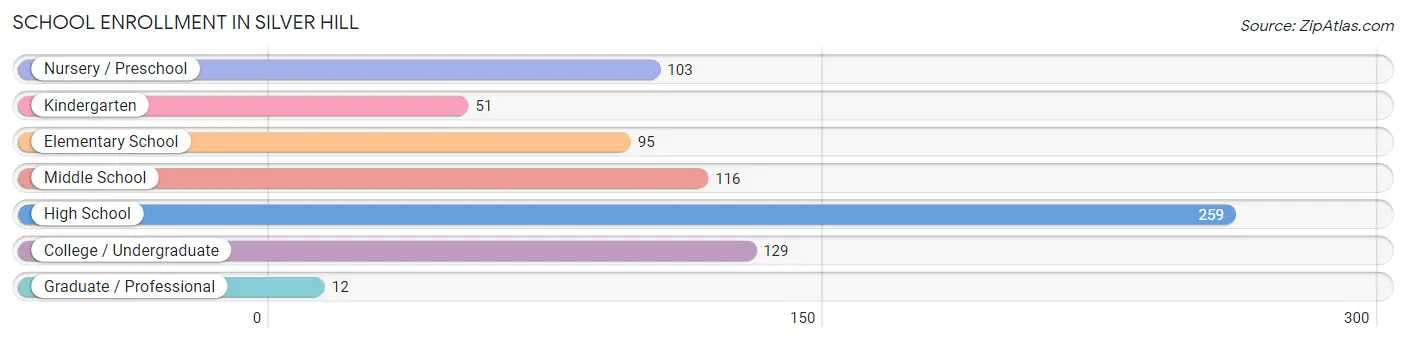
School Enrollment in Silver Hill
The most common levels of schooling among the 765 students in Silver Hill are high school (259 | 33.9%), college / undergraduate (129 | 16.9%), and middle school (116 | 15.2%).
| School Level | # Students | % Students |
| Nursery / Preschool | 103 | 13.5% |
| Kindergarten | 51 | 6.7% |
| Elementary School | 95 | 12.4% |
| Middle School | 116 | 15.2% |
| High School | 259 | 33.9% |
| College / Undergraduate | 129 | 16.9% |
| Graduate / Professional | 12 | 1.6% |
| Total | 765 | 100.0% |
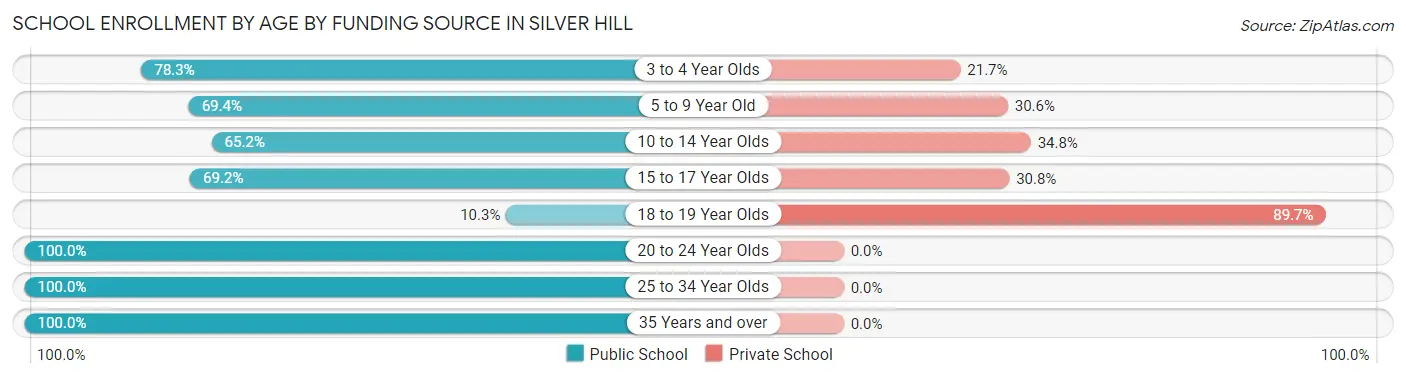
School Enrollment by Age by Funding Source in Silver Hill
Out of a total of 765 students who are enrolled in schools in Silver Hill, 224 (29.3%) attend a private institution, while the remaining 541 (70.7%) are enrolled in public schools. The age group of 18 to 19 year olds has the highest likelihood of being enrolled in private schools, with 61 (89.7% in the age bracket) enrolled. Conversely, the age group of 20 to 24 year olds has the lowest likelihood of being enrolled in a private school, with 38 (100.0% in the age bracket) attending a public institution.
| Age Bracket | Public School | Private School |
| 3 to 4 Year Olds | 72 (78.3%) | 20 (21.7%) |
| 5 to 9 Year Old | 109 (69.4%) | 48 (30.6%) |
| 10 to 14 Year Olds | 101 (65.2%) | 54 (34.8%) |
| 15 to 17 Year Olds | 92 (69.2%) | 41 (30.8%) |
| 18 to 19 Year Olds | 7 (10.3%) | 61 (89.7%) |
| 20 to 24 Year Olds | 38 (100.0%) | 0 (0.0%) |
| 25 to 34 Year Olds | 80 (100.0%) | 0 (0.0%) |
| 35 Years and over | 42 (100.0%) | 0 (0.0%) |
| Total | 541 (70.7%) | 224 (29.3%) |
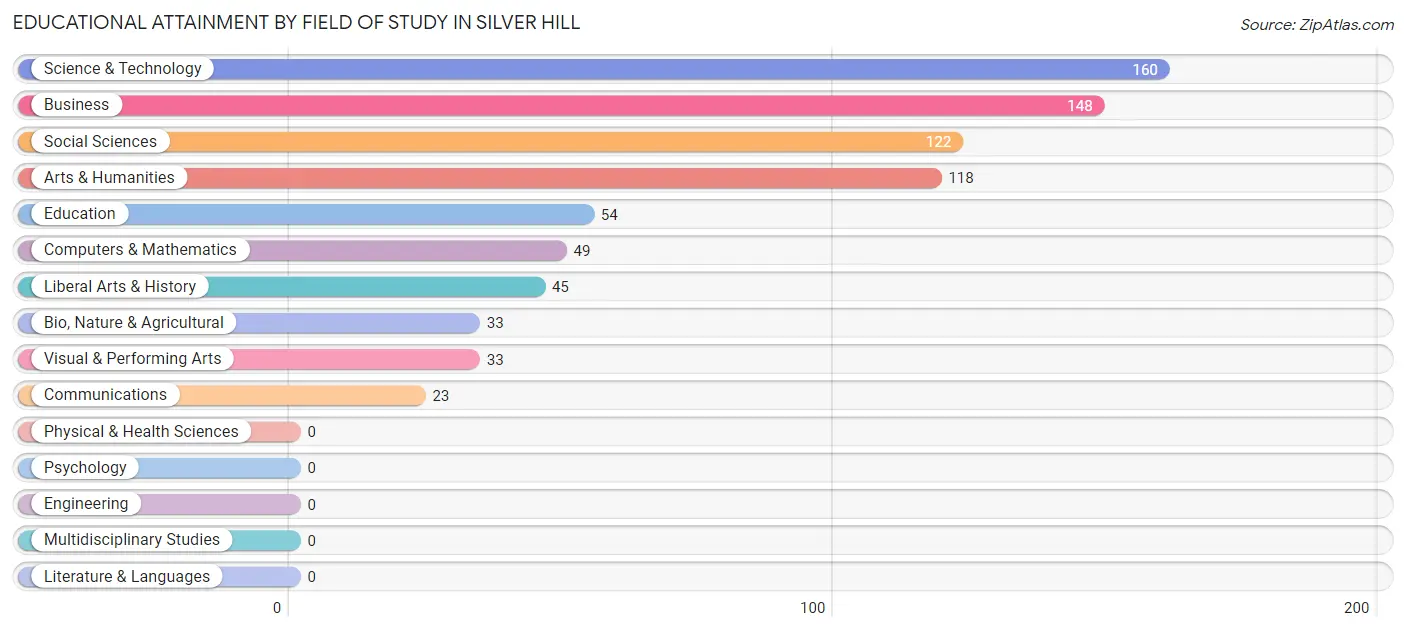
Educational Attainment by Field of Study in Silver Hill
Science & technology (160 | 20.4%), business (148 | 18.9%), social sciences (122 | 15.5%), arts & humanities (118 | 15.0%), and education (54 | 6.9%) are the most common fields of study among 785 individuals in Silver Hill who have obtained a bachelor's degree or higher.
| Field of Study | # Graduates | % Graduates |
| Computers & Mathematics | 49 | 6.2% |
| Bio, Nature & Agricultural | 33 | 4.2% |
| Physical & Health Sciences | 0 | 0.0% |
| Psychology | 0 | 0.0% |
| Social Sciences | 122 | 15.5% |
| Engineering | 0 | 0.0% |
| Multidisciplinary Studies | 0 | 0.0% |
| Science & Technology | 160 | 20.4% |
| Business | 148 | 18.9% |
| Education | 54 | 6.9% |
| Literature & Languages | 0 | 0.0% |
| Liberal Arts & History | 45 | 5.7% |
| Visual & Performing Arts | 33 | 4.2% |
| Communications | 23 | 2.9% |
| Arts & Humanities | 118 | 15.0% |
| Total | 785 | 100.0% |
Transportation & Commute in Silver Hill
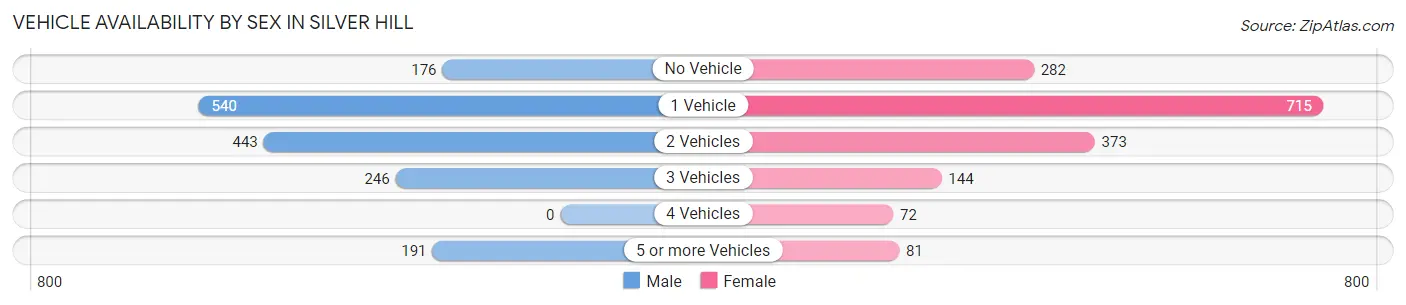
Vehicle Availability by Sex in Silver Hill
The most prevalent vehicle ownership categories in Silver Hill are males with 1 vehicle (540, accounting for 33.8%) and females with 1 vehicle (715, making up 32.4%).
| Vehicles Available | Male | Female |
| No Vehicle | 176 (11.0%) | 282 (16.9%) |
| 1 Vehicle | 540 (33.8%) | 715 (42.9%) |
| 2 Vehicles | 443 (27.8%) | 373 (22.4%) |
| 3 Vehicles | 246 (15.4%) | 144 (8.6%) |
| 4 Vehicles | 0 (0.0%) | 72 (4.3%) |
| 5 or more Vehicles | 191 (12.0%) | 81 (4.9%) |
| Total | 1,596 (100.0%) | 1,667 (100.0%) |
Commute Time in Silver Hill
The most frequently occuring commute durations in Silver Hill are 30 to 34 minutes (1,060 commuters, 34.2%), 60 to 89 minutes (729 commuters, 23.5%), and 45 to 59 minutes (401 commuters, 12.9%).
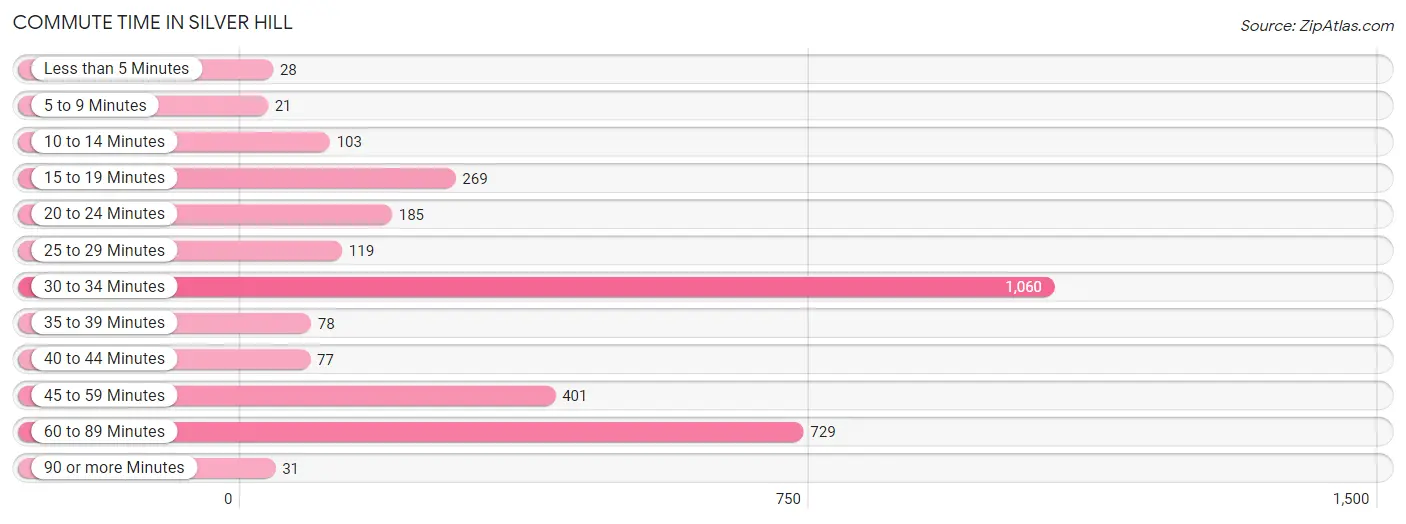
| Commute Time | # Commuters | % Commuters |
| Less than 5 Minutes | 28 | 0.9% |
| 5 to 9 Minutes | 21 | 0.7% |
| 10 to 14 Minutes | 103 | 3.3% |
| 15 to 19 Minutes | 269 | 8.7% |
| 20 to 24 Minutes | 185 | 6.0% |
| 25 to 29 Minutes | 119 | 3.8% |
| 30 to 34 Minutes | 1,060 | 34.2% |
| 35 to 39 Minutes | 78 | 2.5% |
| 40 to 44 Minutes | 77 | 2.5% |
| 45 to 59 Minutes | 401 | 12.9% |
| 60 to 89 Minutes | 729 | 23.5% |
| 90 or more Minutes | 31 | 1.0% |
Commute Time by Sex in Silver Hill
The most common commute times in Silver Hill are 30 to 34 minutes (607 commuters, 39.1%) for males and 30 to 34 minutes (453 commuters, 29.2%) for females.
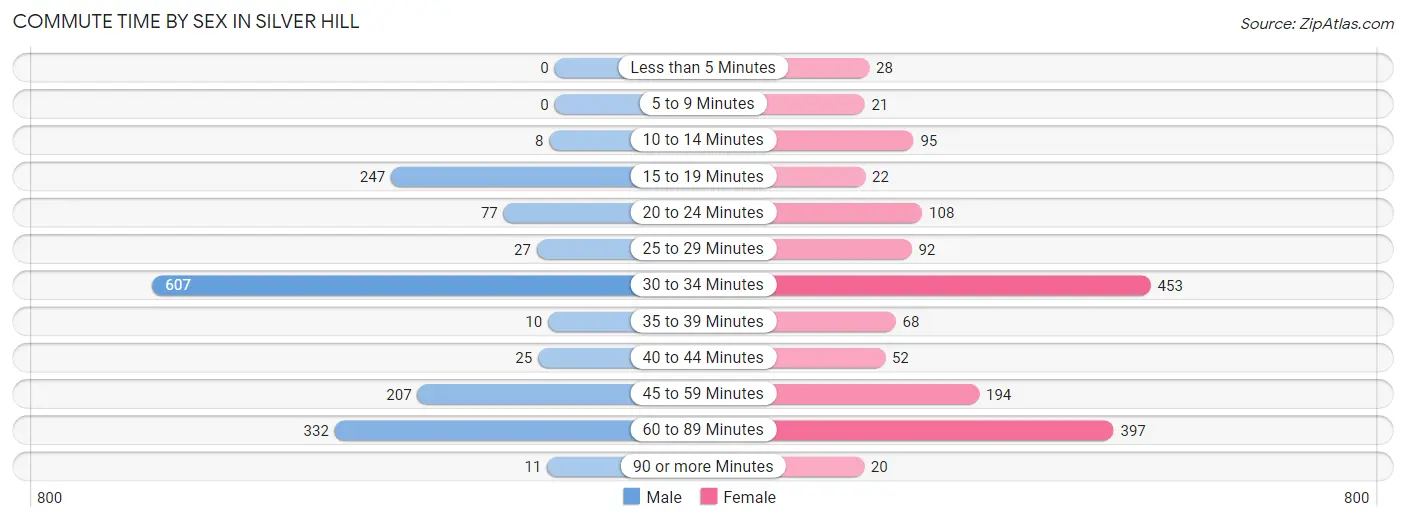
| Commute Time | Male | Female |
| Less than 5 Minutes | 0 (0.0%) | 28 (1.8%) |
| 5 to 9 Minutes | 0 (0.0%) | 21 (1.3%) |
| 10 to 14 Minutes | 8 (0.5%) | 95 (6.1%) |
| 15 to 19 Minutes | 247 (15.9%) | 22 (1.4%) |
| 20 to 24 Minutes | 77 (5.0%) | 108 (7.0%) |
| 25 to 29 Minutes | 27 (1.7%) | 92 (5.9%) |
| 30 to 34 Minutes | 607 (39.1%) | 453 (29.2%) |
| 35 to 39 Minutes | 10 (0.6%) | 68 (4.4%) |
| 40 to 44 Minutes | 25 (1.6%) | 52 (3.4%) |
| 45 to 59 Minutes | 207 (13.4%) | 194 (12.5%) |
| 60 to 89 Minutes | 332 (21.4%) | 397 (25.6%) |
| 90 or more Minutes | 11 (0.7%) | 20 (1.3%) |
Time of Departure to Work by Sex in Silver Hill
The most frequent times of departure to work in Silver Hill are 8:00 AM to 8:29 AM (399, 25.7%) for males and 8:00 AM to 8:29 AM (373, 24.1%) for females.
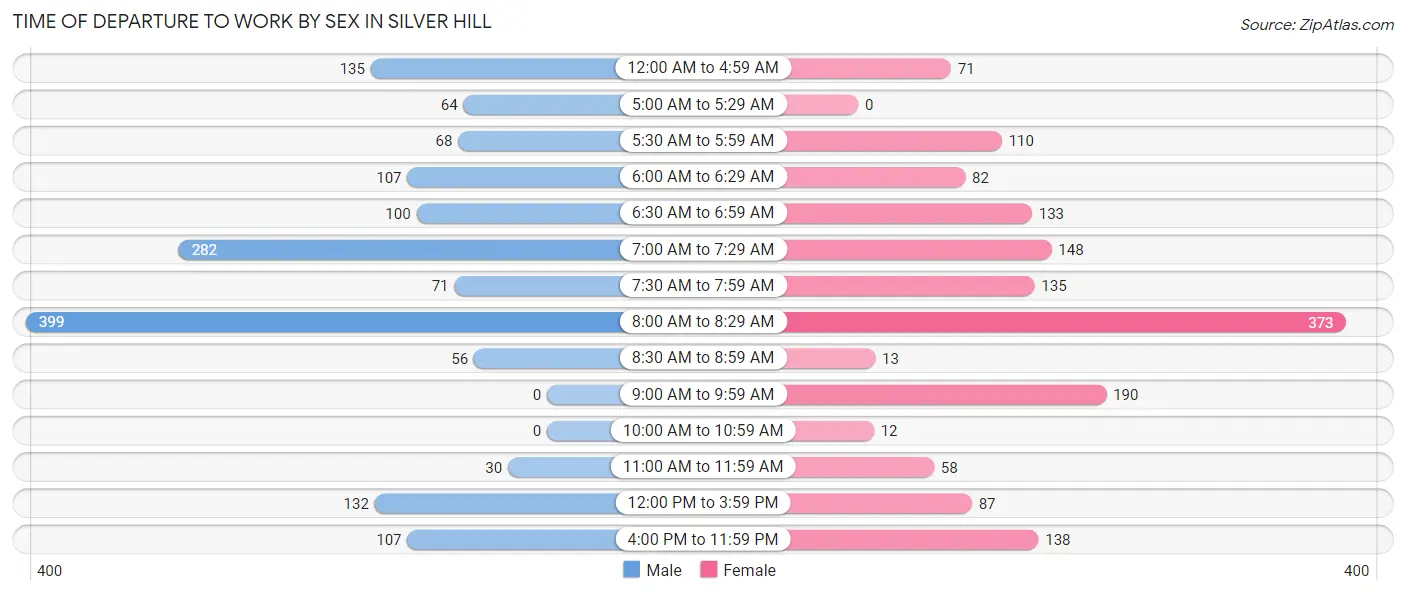
| Time of Departure | Male | Female |
| 12:00 AM to 4:59 AM | 135 (8.7%) | 71 (4.6%) |
| 5:00 AM to 5:29 AM | 64 (4.1%) | 0 (0.0%) |
| 5:30 AM to 5:59 AM | 68 (4.4%) | 110 (7.1%) |
| 6:00 AM to 6:29 AM | 107 (6.9%) | 82 (5.3%) |
| 6:30 AM to 6:59 AM | 100 (6.5%) | 133 (8.6%) |
| 7:00 AM to 7:29 AM | 282 (18.2%) | 148 (9.6%) |
| 7:30 AM to 7:59 AM | 71 (4.6%) | 135 (8.7%) |
| 8:00 AM to 8:29 AM | 399 (25.7%) | 373 (24.1%) |
| 8:30 AM to 8:59 AM | 56 (3.6%) | 13 (0.8%) |
| 9:00 AM to 9:59 AM | 0 (0.0%) | 190 (12.3%) |
| 10:00 AM to 10:59 AM | 0 (0.0%) | 12 (0.8%) |
| 11:00 AM to 11:59 AM | 30 (1.9%) | 58 (3.7%) |
| 12:00 PM to 3:59 PM | 132 (8.5%) | 87 (5.6%) |
| 4:00 PM to 11:59 PM | 107 (6.9%) | 138 (8.9%) |
| Total | 1,551 (100.0%) | 1,550 (100.0%) |
Housing Occupancy in Silver Hill
Occupancy by Ownership in Silver Hill
Of the total 2,665 dwellings in Silver Hill, owner-occupied units account for 621 (23.3%), while renter-occupied units make up 2,044 (76.7%).
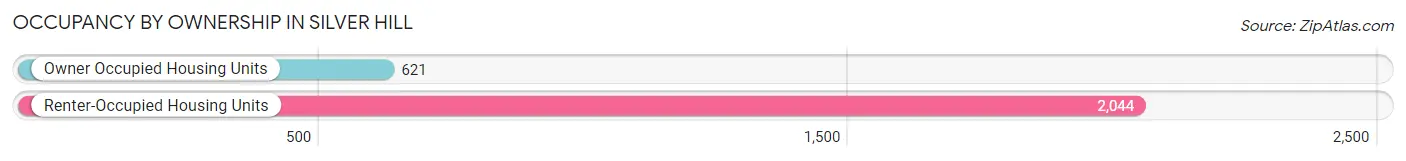
| Occupancy | # Housing Units | % Housing Units |
| Owner Occupied Housing Units | 621 | 23.3% |
| Renter-Occupied Housing Units | 2,044 | 76.7% |
| Total Occupied Housing Units | 2,665 | 100.0% |
Occupancy by Household Size in Silver Hill
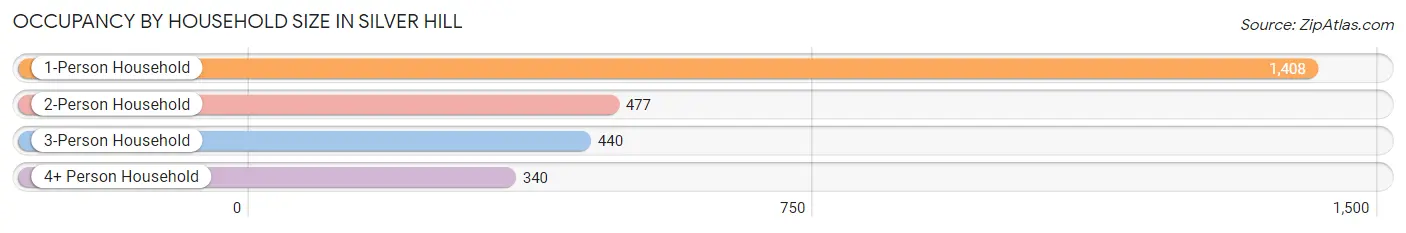
| Household Size | # Housing Units | % Housing Units |
| 1-Person Household | 1,408 | 52.8% |
| 2-Person Household | 477 | 17.9% |
| 3-Person Household | 440 | 16.5% |
| 4+ Person Household | 340 | 12.8% |
| Total Housing Units | 2,665 | 100.0% |
Occupancy by Ownership by Household Size in Silver Hill
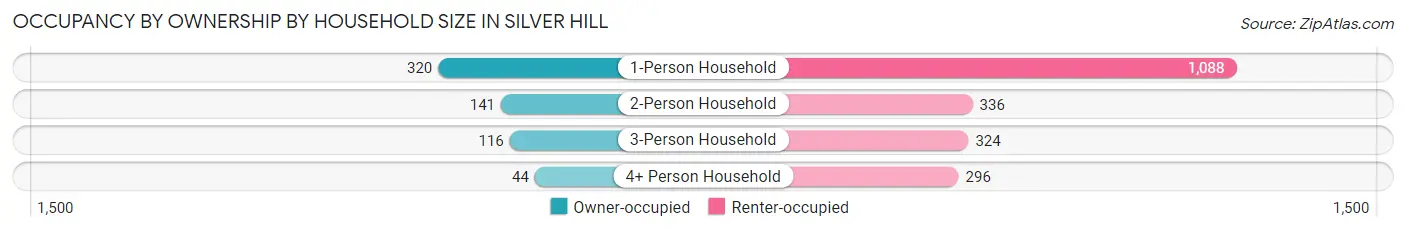
| Household Size | Owner-occupied | Renter-occupied |
| 1-Person Household | 320 (22.7%) | 1,088 (77.3%) |
| 2-Person Household | 141 (29.6%) | 336 (70.4%) |
| 3-Person Household | 116 (26.4%) | 324 (73.6%) |
| 4+ Person Household | 44 (12.9%) | 296 (87.1%) |
| Total Housing Units | 621 (23.3%) | 2,044 (76.7%) |
Occupancy by Educational Attainment in Silver Hill
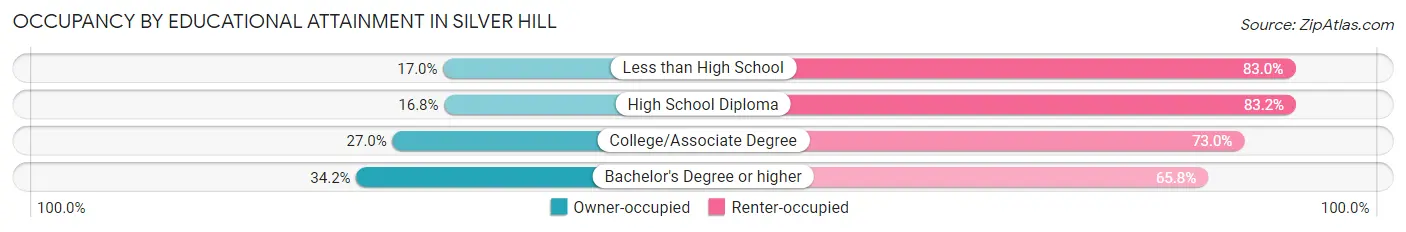
| Household Size | Owner-occupied | Renter-occupied |
| Less than High School | 47 (17.0%) | 230 (83.0%) |
| High School Diploma | 179 (16.8%) | 888 (83.2%) |
| College/Associate Degree | 215 (27.0%) | 580 (73.0%) |
| Bachelor's Degree or higher | 180 (34.2%) | 346 (65.8%) |
Occupancy by Age of Householder in Silver Hill
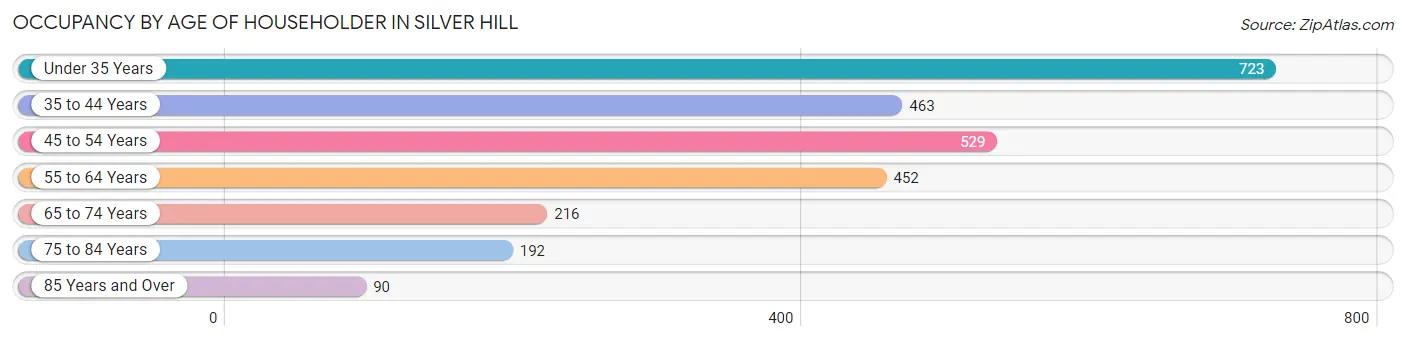
| Age Bracket | # Households | % Households |
| Under 35 Years | 723 | 27.1% |
| 35 to 44 Years | 463 | 17.4% |
| 45 to 54 Years | 529 | 19.9% |
| 55 to 64 Years | 452 | 17.0% |
| 65 to 74 Years | 216 | 8.1% |
| 75 to 84 Years | 192 | 7.2% |
| 85 Years and Over | 90 | 3.4% |
| Total | 2,665 | 100.0% |
Housing Finances in Silver Hill
Median Income by Occupancy in Silver Hill
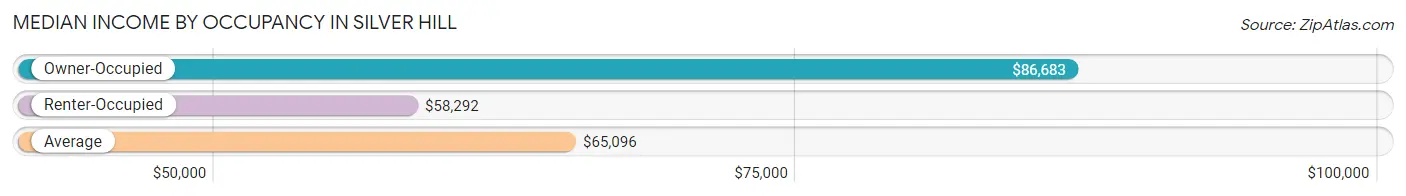
| Occupancy Type | # Households | Median Income |
| Owner-Occupied | 621 (23.3%) | $86,683 |
| Renter-Occupied | 2,044 (76.7%) | $58,292 |
| Average | 2,665 (100.0%) | $65,096 |
Occupancy by Householder Income Bracket in Silver Hill
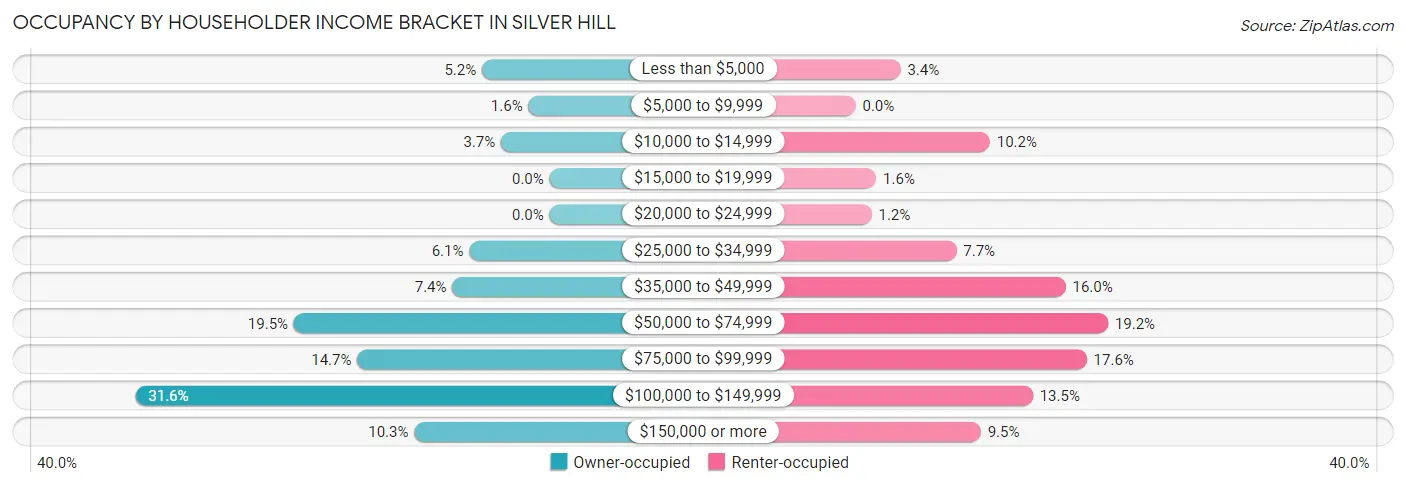
| Income Bracket | Owner-occupied | Renter-occupied |
| Less than $5,000 | 32 (5.1%) | 70 (3.4%) |
| $5,000 to $9,999 | 10 (1.6%) | 0 (0.0%) |
| $10,000 to $14,999 | 23 (3.7%) | 209 (10.2%) |
| $15,000 to $19,999 | 0 (0.0%) | 32 (1.6%) |
| $20,000 to $24,999 | 0 (0.0%) | 25 (1.2%) |
| $25,000 to $34,999 | 38 (6.1%) | 157 (7.7%) |
| $35,000 to $49,999 | 46 (7.4%) | 327 (16.0%) |
| $50,000 to $74,999 | 121 (19.5%) | 393 (19.2%) |
| $75,000 to $99,999 | 91 (14.6%) | 360 (17.6%) |
| $100,000 to $149,999 | 196 (31.6%) | 276 (13.5%) |
| $150,000 or more | 64 (10.3%) | 195 (9.5%) |
| Total | 621 (100.0%) | 2,044 (100.0%) |
Monthly Housing Cost Tiers in Silver Hill
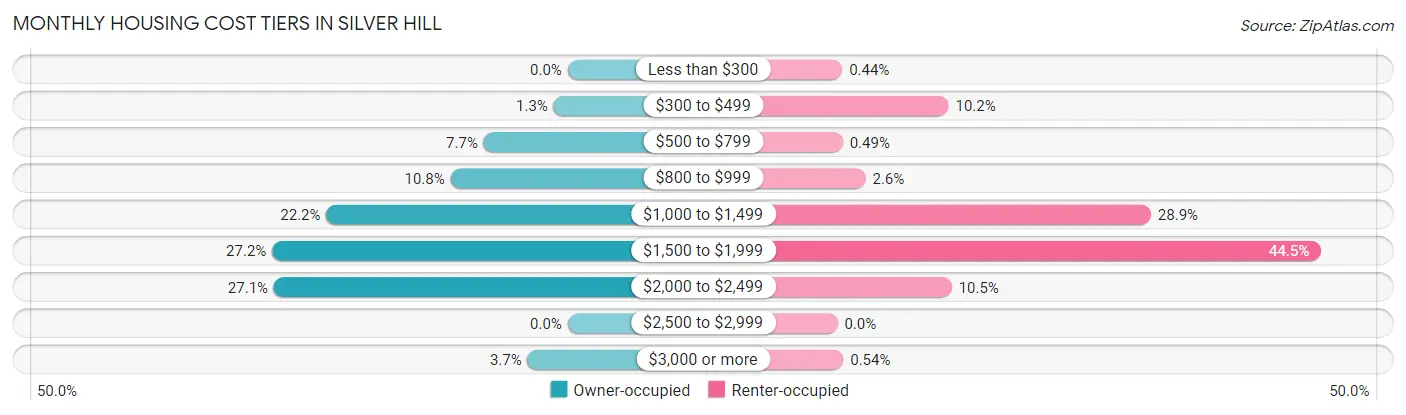
| Monthly Cost | Owner-occupied | Renter-occupied |
| Less than $300 | 0 (0.0%) | 9 (0.4%) |
| $300 to $499 | 8 (1.3%) | 209 (10.2%) |
| $500 to $799 | 48 (7.7%) | 10 (0.5%) |
| $800 to $999 | 67 (10.8%) | 53 (2.6%) |
| $1,000 to $1,499 | 138 (22.2%) | 590 (28.9%) |
| $1,500 to $1,999 | 169 (27.2%) | 910 (44.5%) |
| $2,000 to $2,499 | 168 (27.1%) | 215 (10.5%) |
| $2,500 to $2,999 | 0 (0.0%) | 0 (0.0%) |
| $3,000 or more | 23 (3.7%) | 11 (0.5%) |
| Total | 621 (100.0%) | 2,044 (100.0%) |
Physical Housing Characteristics in Silver Hill
Housing Structures in Silver Hill
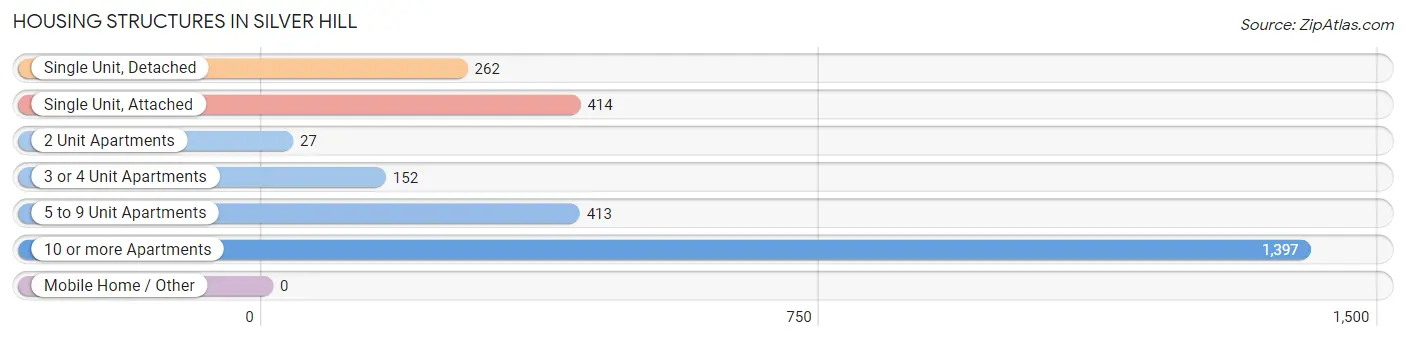
| Structure Type | # Housing Units | % Housing Units |
| Single Unit, Detached | 262 | 9.8% |
| Single Unit, Attached | 414 | 15.5% |
| 2 Unit Apartments | 27 | 1.0% |
| 3 or 4 Unit Apartments | 152 | 5.7% |
| 5 to 9 Unit Apartments | 413 | 15.5% |
| 10 or more Apartments | 1,397 | 52.4% |
| Mobile Home / Other | 0 | 0.0% |
| Total | 2,665 | 100.0% |
Housing Structures by Occupancy in Silver Hill
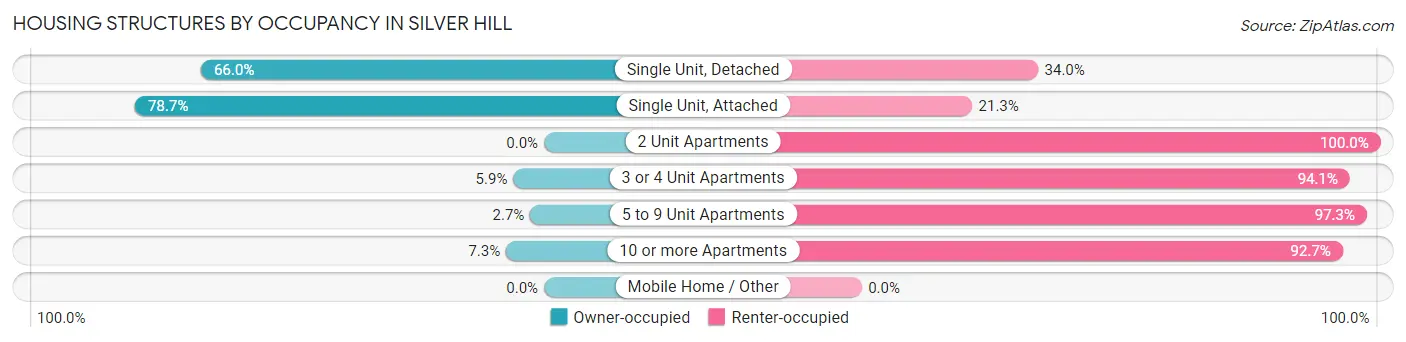
| Structure Type | Owner-occupied | Renter-occupied |
| Single Unit, Detached | 173 (66.0%) | 89 (34.0%) |
| Single Unit, Attached | 326 (78.7%) | 88 (21.3%) |
| 2 Unit Apartments | 0 (0.0%) | 27 (100.0%) |
| 3 or 4 Unit Apartments | 9 (5.9%) | 143 (94.1%) |
| 5 to 9 Unit Apartments | 11 (2.7%) | 402 (97.3%) |
| 10 or more Apartments | 102 (7.3%) | 1,295 (92.7%) |
| Mobile Home / Other | 0 (0.0%) | 0 (0.0%) |
| Total | 621 (23.3%) | 2,044 (76.7%) |
Housing Structures by Number of Rooms in Silver Hill
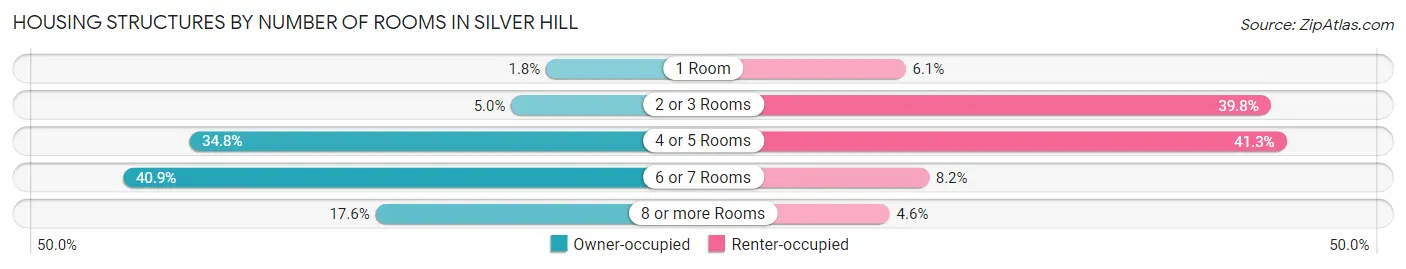
| Number of Rooms | Owner-occupied | Renter-occupied |
| 1 Room | 11 (1.8%) | 124 (6.1%) |
| 2 or 3 Rooms | 31 (5.0%) | 814 (39.8%) |
| 4 or 5 Rooms | 216 (34.8%) | 844 (41.3%) |
| 6 or 7 Rooms | 254 (40.9%) | 168 (8.2%) |
| 8 or more Rooms | 109 (17.5%) | 94 (4.6%) |
| Total | 621 (100.0%) | 2,044 (100.0%) |
Housing Structure by Heating Type in Silver Hill
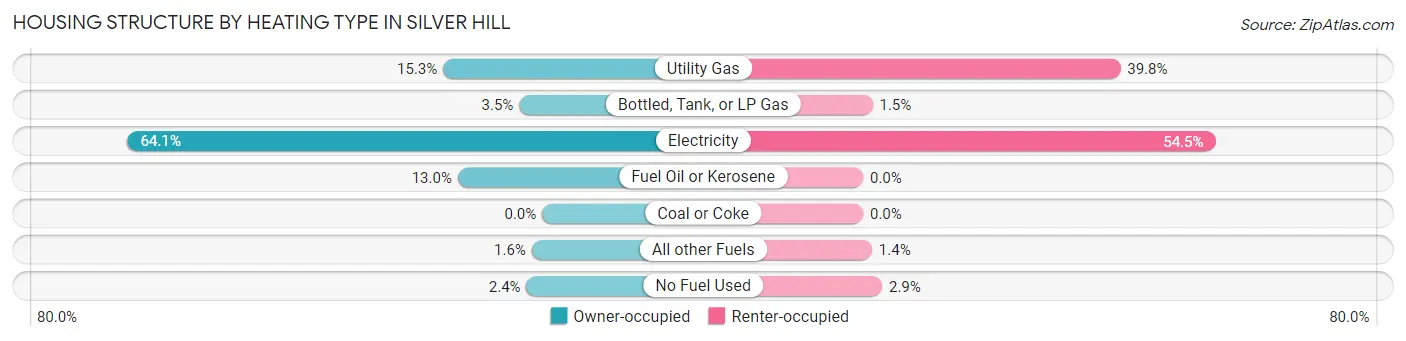
| Heating Type | Owner-occupied | Renter-occupied |
| Utility Gas | 95 (15.3%) | 813 (39.8%) |
| Bottled, Tank, or LP Gas | 22 (3.5%) | 30 (1.5%) |
| Electricity | 398 (64.1%) | 1,113 (54.4%) |
| Fuel Oil or Kerosene | 81 (13.0%) | 0 (0.0%) |
| Coal or Coke | 0 (0.0%) | 0 (0.0%) |
| All other Fuels | 10 (1.6%) | 28 (1.4%) |
| No Fuel Used | 15 (2.4%) | 60 (2.9%) |
| Total | 621 (100.0%) | 2,044 (100.0%) |
Household Vehicle Usage in Silver Hill
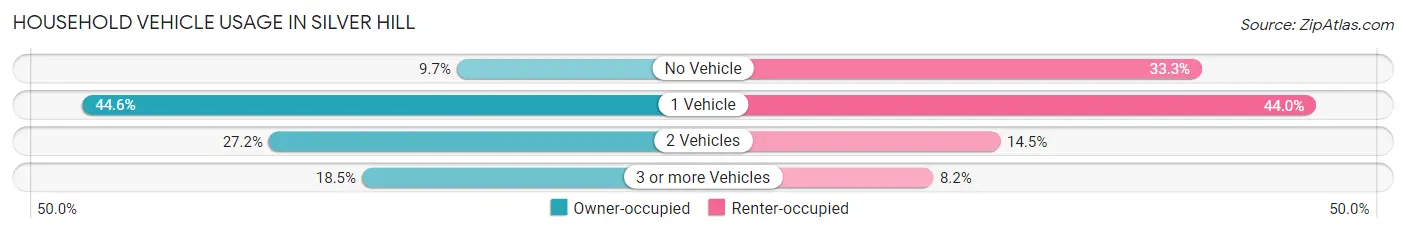
| Vehicles per Household | Owner-occupied | Renter-occupied |
| No Vehicle | 60 (9.7%) | 681 (33.3%) |
| 1 Vehicle | 277 (44.6%) | 899 (44.0%) |
| 2 Vehicles | 169 (27.2%) | 296 (14.5%) |
| 3 or more Vehicles | 115 (18.5%) | 168 (8.2%) |
| Total | 621 (100.0%) | 2,044 (100.0%) |
Real Estate & Mortgages in Silver Hill
Real Estate and Mortgage Overview in Silver Hill
| Characteristic | Without Mortgage | With Mortgage |
| Housing Units | 80 | 541 |
| Median Property Value | $253,500 | $259,600 |
| Median Household Income | - | - |
| Monthly Housing Costs | $741 | $23 |
| Real Estate Taxes | $3,321 | $44 |
Property Value by Mortgage Status in Silver Hill
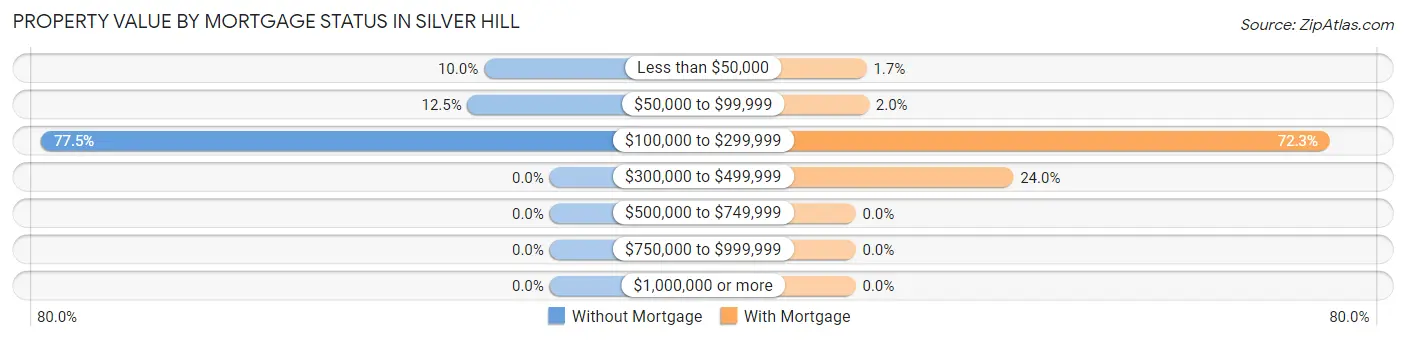
| Property Value | Without Mortgage | With Mortgage |
| Less than $50,000 | 8 (10.0%) | 9 (1.7%) |
| $50,000 to $99,999 | 10 (12.5%) | 11 (2.0%) |
| $100,000 to $299,999 | 62 (77.5%) | 391 (72.3%) |
| $300,000 to $499,999 | 0 (0.0%) | 130 (24.0%) |
| $500,000 to $749,999 | 0 (0.0%) | 0 (0.0%) |
| $750,000 to $999,999 | 0 (0.0%) | 0 (0.0%) |
| $1,000,000 or more | 0 (0.0%) | 0 (0.0%) |
| Total | 80 (100.0%) | 541 (100.0%) |
Household Income by Mortgage Status in Silver Hill
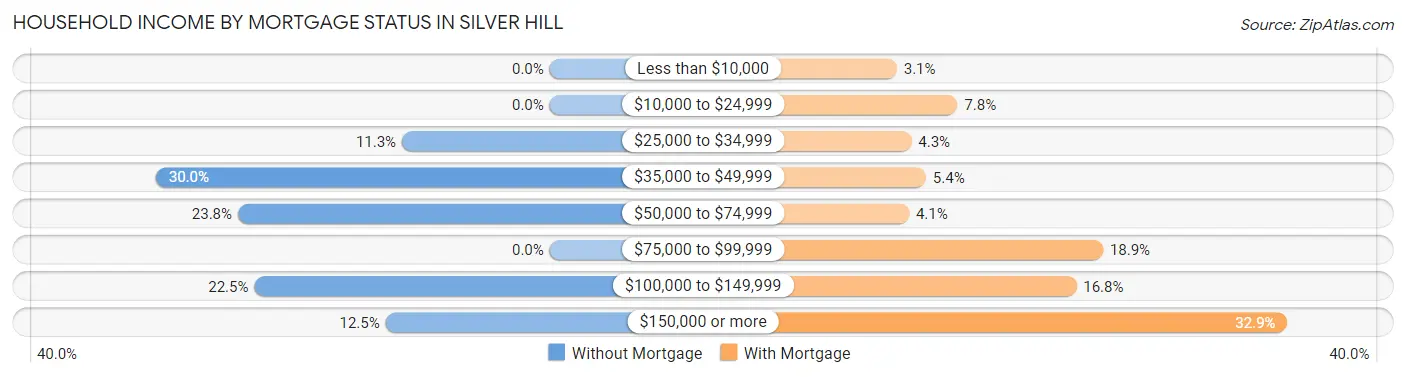
| Household Income | Without Mortgage | With Mortgage |
| Less than $10,000 | 0 (0.0%) | 17 (3.1%) |
| $10,000 to $24,999 | 0 (0.0%) | 42 (7.8%) |
| $25,000 to $34,999 | 9 (11.3%) | 23 (4.3%) |
| $35,000 to $49,999 | 24 (30.0%) | 29 (5.4%) |
| $50,000 to $74,999 | 19 (23.7%) | 22 (4.1%) |
| $75,000 to $99,999 | 0 (0.0%) | 102 (18.9%) |
| $100,000 to $149,999 | 18 (22.5%) | 91 (16.8%) |
| $150,000 or more | 10 (12.5%) | 178 (32.9%) |
| Total | 80 (100.0%) | 541 (100.0%) |
Property Value to Household Income Ratio in Silver Hill

| Value-to-Income Ratio | Without Mortgage | With Mortgage |
| Less than 2.0x | 28 (35.0%) | 90,972 (16,815.5%) |
| 2.0x to 2.9x | 8 (10.0%) | 119 (22.0%) |
| 3.0x to 3.9x | 0 (0.0%) | 169 (31.2%) |
| 4.0x or more | 44 (55.0%) | 86 (15.9%) |
| Total | 80 (100.0%) | 541 (100.0%) |
Real Estate Taxes by Mortgage Status in Silver Hill
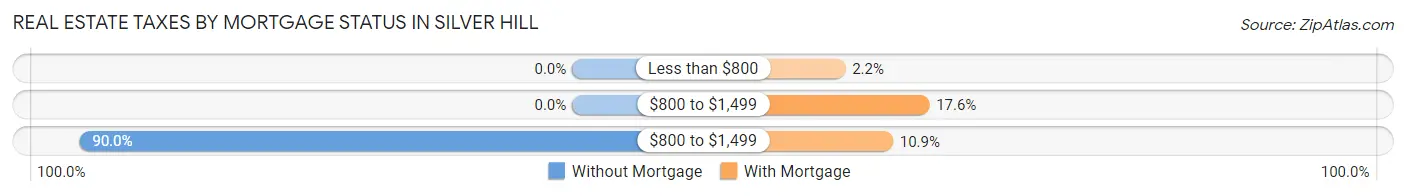
| Property Taxes | Without Mortgage | With Mortgage |
| Less than $800 | 0 (0.0%) | 12 (2.2%) |
| $800 to $1,499 | 0 (0.0%) | 95 (17.6%) |
| $800 to $1,499 | 72 (90.0%) | 59 (10.9%) |
| Total | 80 (100.0%) | 541 (100.0%) |
Health & Disability in Silver Hill
Health Insurance Coverage by Age in Silver Hill
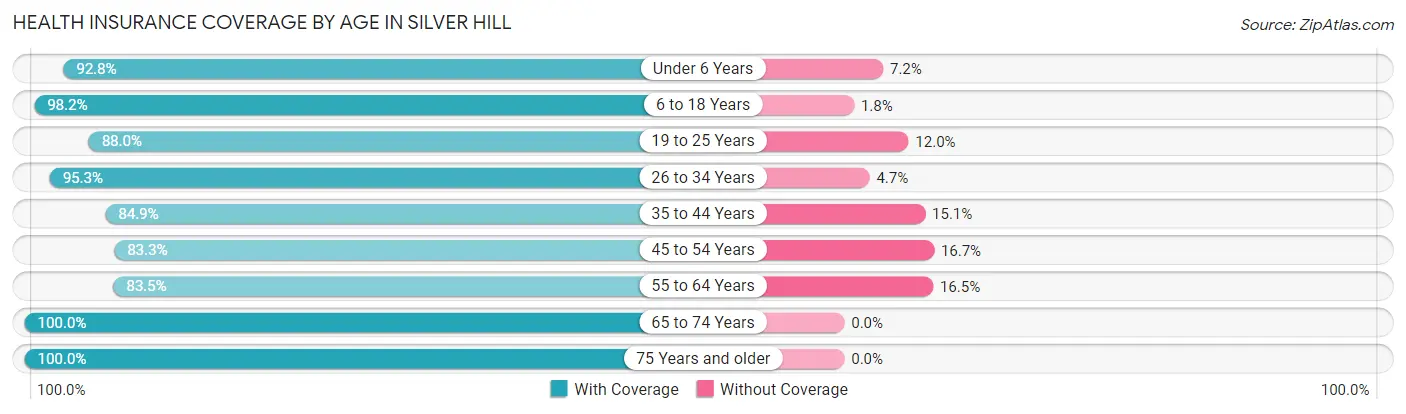
| Age Bracket | With Coverage | Without Coverage |
| Under 6 Years | 347 (92.8%) | 27 (7.2%) |
| 6 to 18 Years | 491 (98.2%) | 9 (1.8%) |
| 19 to 25 Years | 390 (88.0%) | 53 (12.0%) |
| 26 to 34 Years | 1,017 (95.3%) | 50 (4.7%) |
| 35 to 44 Years | 648 (84.9%) | 115 (15.1%) |
| 45 to 54 Years | 802 (83.3%) | 161 (16.7%) |
| 55 to 64 Years | 565 (83.5%) | 112 (16.5%) |
| 65 to 74 Years | 322 (100.0%) | 0 (0.0%) |
| 75 Years and older | 339 (100.0%) | 0 (0.0%) |
| Total | 4,921 (90.3%) | 527 (9.7%) |
Health Insurance Coverage by Citizenship Status in Silver Hill
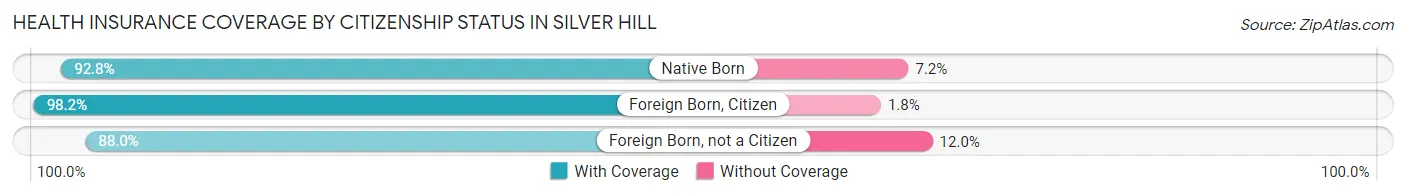
| Citizenship Status | With Coverage | Without Coverage |
| Native Born | 347 (92.8%) | 27 (7.2%) |
| Foreign Born, Citizen | 491 (98.2%) | 9 (1.8%) |
| Foreign Born, not a Citizen | 390 (88.0%) | 53 (12.0%) |
Health Insurance Coverage by Household Income in Silver Hill
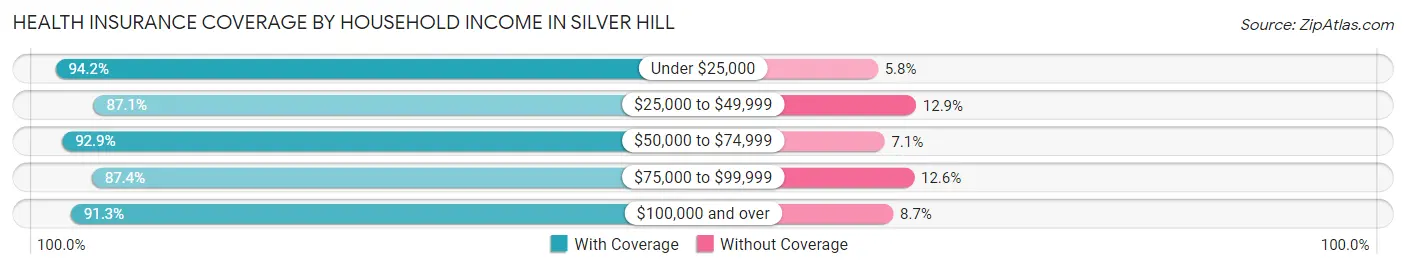
| Household Income | With Coverage | Without Coverage |
| Under $25,000 | 423 (94.2%) | 26 (5.8%) |
| $25,000 to $49,999 | 686 (87.1%) | 102 (12.9%) |
| $50,000 to $74,999 | 843 (92.9%) | 64 (7.1%) |
| $75,000 to $99,999 | 1,110 (87.4%) | 160 (12.6%) |
| $100,000 and over | 1,843 (91.3%) | 175 (8.7%) |
Public vs Private Health Insurance Coverage by Age in Silver Hill
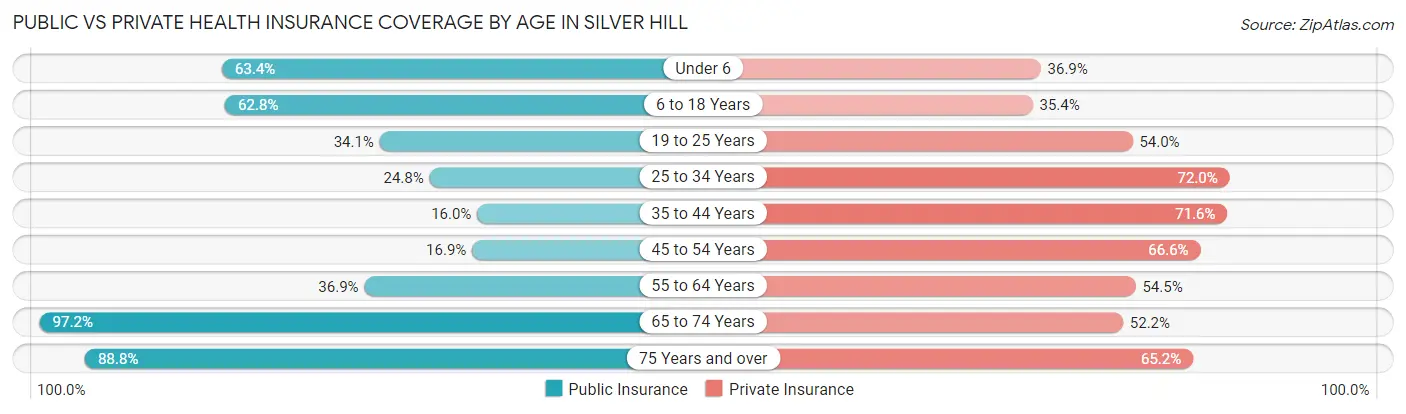
| Age Bracket | Public Insurance | Private Insurance |
| Under 6 | 237 (63.4%) | 138 (36.9%) |
| 6 to 18 Years | 314 (62.8%) | 177 (35.4%) |
| 19 to 25 Years | 151 (34.1%) | 239 (53.9%) |
| 25 to 34 Years | 265 (24.8%) | 768 (72.0%) |
| 35 to 44 Years | 122 (16.0%) | 546 (71.6%) |
| 45 to 54 Years | 163 (16.9%) | 641 (66.6%) |
| 55 to 64 Years | 250 (36.9%) | 369 (54.5%) |
| 65 to 74 Years | 313 (97.2%) | 168 (52.2%) |
| 75 Years and over | 301 (88.8%) | 221 (65.2%) |
| Total | 2,116 (38.8%) | 3,267 (60.0%) |
Disability Status by Sex by Age in Silver Hill
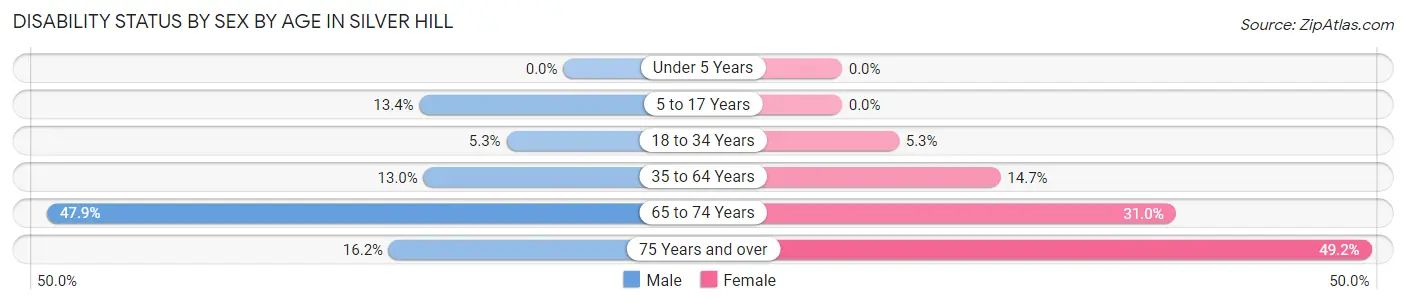
| Age Bracket | Male | Female |
| Under 5 Years | 0 (0.0%) | 0 (0.0%) |
| 5 to 17 Years | 37 (13.4%) | 0 (0.0%) |
| 18 to 34 Years | 38 (5.3%) | 45 (5.3%) |
| 35 to 64 Years | 146 (13.0%) | 188 (14.7%) |
| 65 to 74 Years | 46 (47.9%) | 70 (31.0%) |
| 75 Years and over | 17 (16.2%) | 115 (49.1%) |
Disability Class by Sex by Age in Silver Hill
Disability Class: Hearing Difficulty
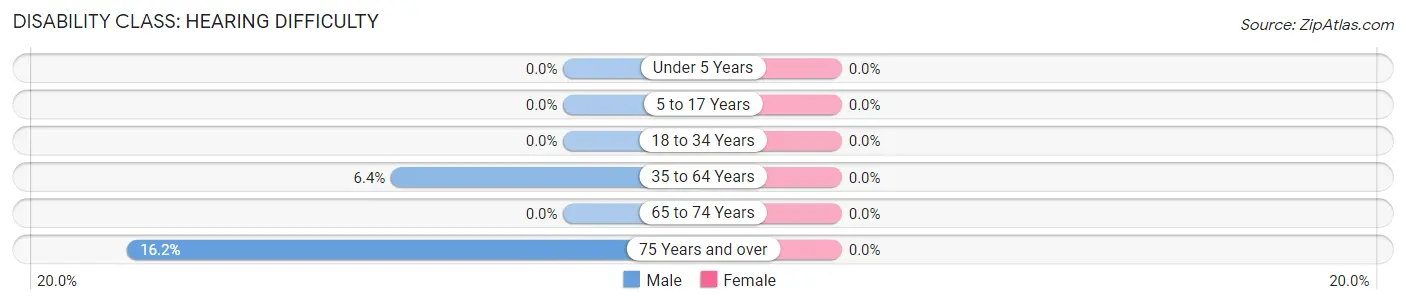
| Age Bracket | Male | Female |
| Under 5 Years | 0 (0.0%) | 0 (0.0%) |
| 5 to 17 Years | 0 (0.0%) | 0 (0.0%) |
| 18 to 34 Years | 0 (0.0%) | 0 (0.0%) |
| 35 to 64 Years | 72 (6.4%) | 0 (0.0%) |
| 65 to 74 Years | 0 (0.0%) | 0 (0.0%) |
| 75 Years and over | 17 (16.2%) | 0 (0.0%) |
Disability Class: Vision Difficulty
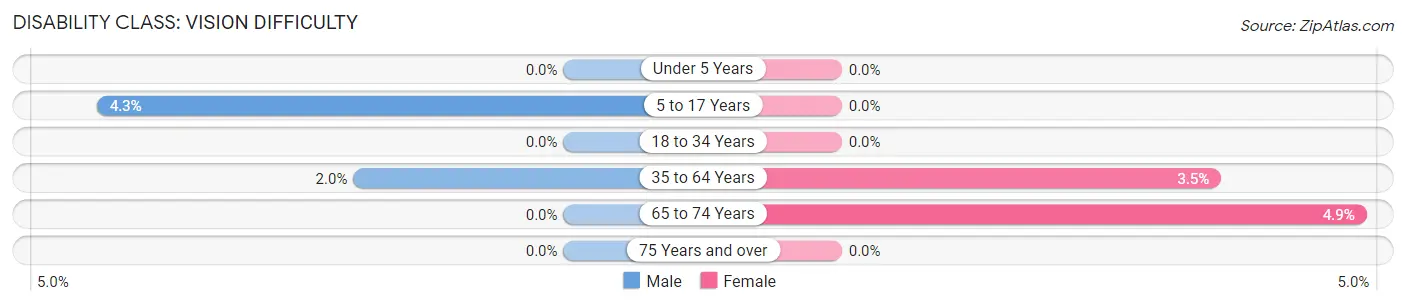
| Age Bracket | Male | Female |
| Under 5 Years | 0 (0.0%) | 0 (0.0%) |
| 5 to 17 Years | 12 (4.3%) | 0 (0.0%) |
| 18 to 34 Years | 0 (0.0%) | 0 (0.0%) |
| 35 to 64 Years | 22 (1.9%) | 45 (3.5%) |
| 65 to 74 Years | 0 (0.0%) | 11 (4.9%) |
| 75 Years and over | 0 (0.0%) | 0 (0.0%) |
Disability Class: Cognitive Difficulty
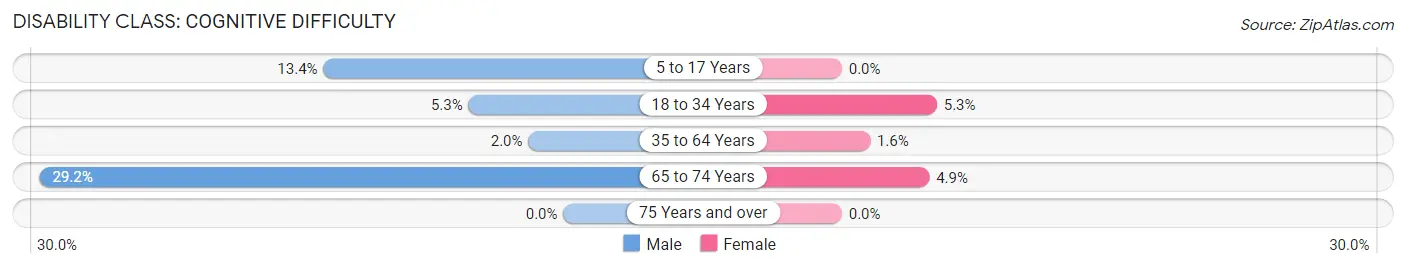
| Age Bracket | Male | Female |
| 5 to 17 Years | 37 (13.4%) | 0 (0.0%) |
| 18 to 34 Years | 38 (5.3%) | 45 (5.3%) |
| 35 to 64 Years | 22 (1.9%) | 20 (1.6%) |
| 65 to 74 Years | 28 (29.2%) | 11 (4.9%) |
| 75 Years and over | 0 (0.0%) | 0 (0.0%) |
Disability Class: Ambulatory Difficulty
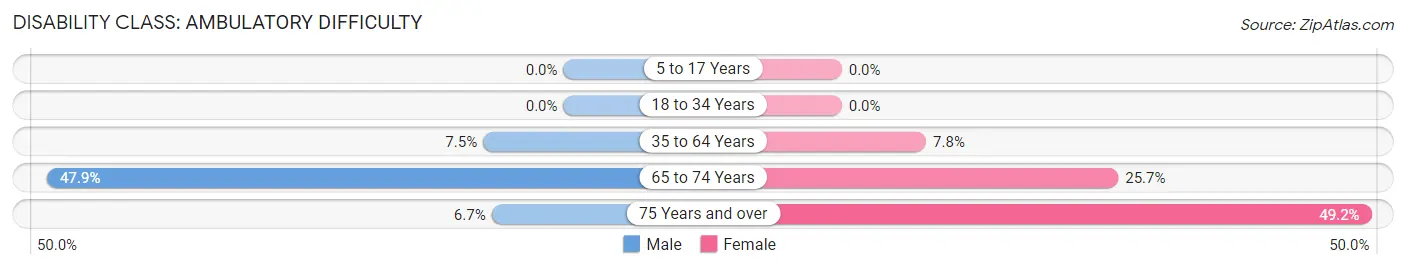
| Age Bracket | Male | Female |
| 5 to 17 Years | 0 (0.0%) | 0 (0.0%) |
| 18 to 34 Years | 0 (0.0%) | 0 (0.0%) |
| 35 to 64 Years | 84 (7.5%) | 100 (7.8%) |
| 65 to 74 Years | 46 (47.9%) | 58 (25.7%) |
| 75 Years and over | 7 (6.7%) | 115 (49.1%) |
Disability Class: Self-Care Difficulty
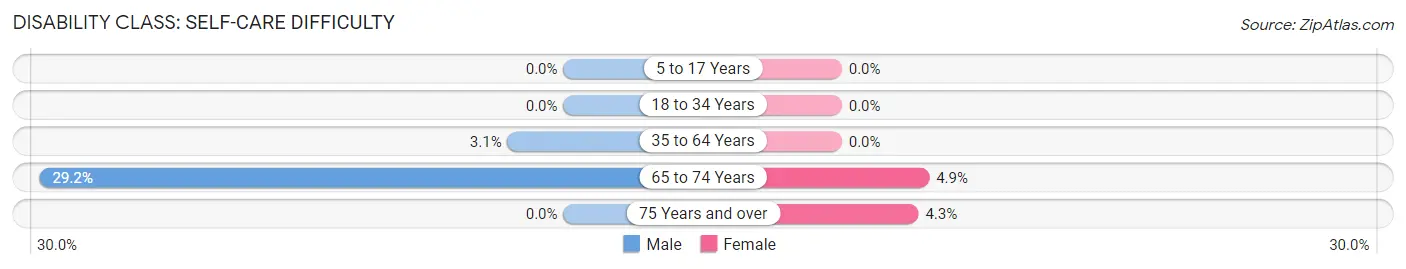
| Age Bracket | Male | Female |
| 5 to 17 Years | 0 (0.0%) | 0 (0.0%) |
| 18 to 34 Years | 0 (0.0%) | 0 (0.0%) |
| 35 to 64 Years | 35 (3.1%) | 0 (0.0%) |
| 65 to 74 Years | 28 (29.2%) | 11 (4.9%) |
| 75 Years and over | 0 (0.0%) | 10 (4.3%) |
Technology Access in Silver Hill
Computing Device Access in Silver Hill
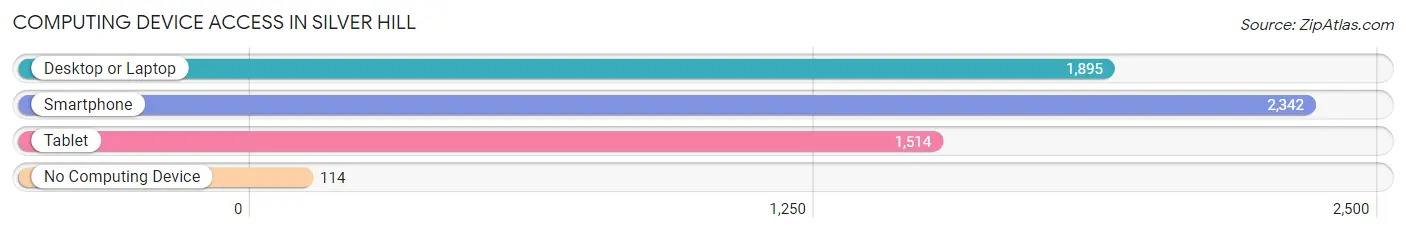
| Device Type | # Households | % Households |
| Desktop or Laptop | 1,895 | 71.1% |
| Smartphone | 2,342 | 87.9% |
| Tablet | 1,514 | 56.8% |
| No Computing Device | 114 | 4.3% |
| Total | 2,665 | 100.0% |
Internet Access in Silver Hill
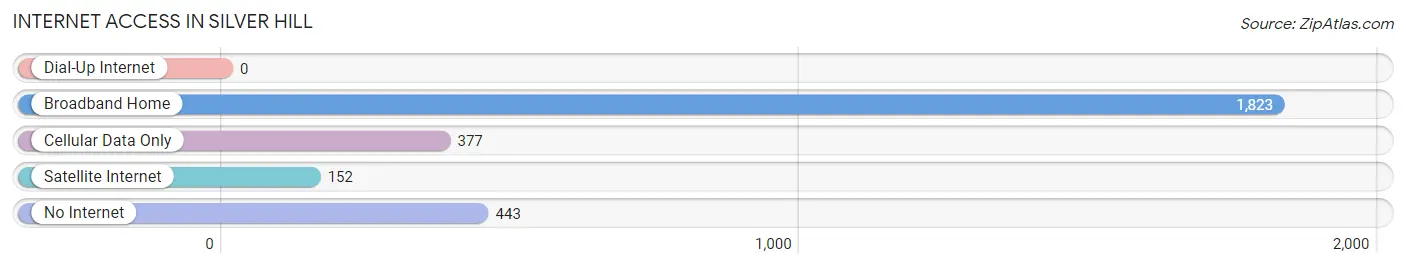
| Internet Type | # Households | % Households |
| Dial-Up Internet | 0 | 0.0% |
| Broadband Home | 1,823 | 68.4% |
| Cellular Data Only | 377 | 14.1% |
| Satellite Internet | 152 | 5.7% |
| No Internet | 443 | 16.6% |
| Total | 2,665 | 100.0% |
Silver Hill Summary
History
Silver Hill is a small unincorporated community located in Prince George’s County, Maryland. It is situated in the southeastern corner of the county, just north of the Washington, D.C. border. The area was first settled in the late 1700s by freed African-American slaves, who established a small farming community. The area was known as “Silver Hill” due to the abundance of silver ore in the area.
In the early 1800s, the area was home to a number of small farms and businesses, including a grist mill, a saw mill, and a blacksmith shop. The area was also home to a number of churches, including the Silver Hill Methodist Episcopal Church, which was established in 1820.
In the late 1800s, the area began to experience rapid growth due to its proximity to Washington, D.C. The area was home to a number of small businesses, including a general store, a post office, and a hotel. The area was also home to a number of churches, including the Silver Hill Baptist Church, which was established in 1891.
In the early 1900s, the area experienced a period of decline due to the Great Depression. Many of the businesses and churches in the area closed, and the population decreased significantly.
In the late 1900s, the area began to experience a period of revitalization. The area was home to a number of new businesses, including a grocery store, a gas station, and a restaurant. The area was also home to a number of churches, including the Silver Hill United Methodist Church, which was established in 1998.
Geography
Silver Hill is located in the southeastern corner of Prince George’s County, Maryland. It is situated just north of the Washington, D.C. border. The area is bordered by the towns of Bladensburg to the north, Hyattsville to the east, and Suitland to the south.
The area is primarily composed of residential neighborhoods, with a few commercial areas. The area is home to a number of parks, including Silver Hill Park, which is located in the center of the community.
Economy
The economy of Silver Hill is primarily based on the service industry. The area is home to a number of small businesses, including restaurants, grocery stores, gas stations, and retail stores. The area is also home to a number of churches, which provide employment opportunities for local residents.
Demographics
As of the 2010 census, the population of Silver Hill was 4,845. The racial makeup of the area was 57.3% African American, 33.2% White, 4.2% Hispanic or Latino, and 5.3% other. The median household income was $50,945, and the median home value was $223,000. The area is served by the Prince George’s County Public Schools system.
Common Questions
What is Per Capita Income in Silver Hill?
Per Capita income in Silver Hill is $38,674.
What is the Median Family Income in Silver Hill?
Median Family Income in Silver Hill is $79,261.
What is the Median Household income in Silver Hill?
Median Household Income in Silver Hill is $65,096.
What is Income or Wage Gap in Silver Hill?
Income or Wage Gap in Silver Hill is 28.9%.
Women in Silver Hill earn 71.1 cents for every dollar earned by a man.
What is Family Income Deficit in Silver Hill?
Family Income Deficit in Silver Hill is $3,402.
Families that are below poverty line in Silver Hill earn $3,402 less on average than the poverty threshold level.
What is Inequality or Gini Index in Silver Hill?
Inequality or Gini Index in Silver Hill is 0.38.
What is the Total Population of Silver Hill?
Total Population of Silver Hill is 5,455.
What is the Total Male Population of Silver Hill?
Total Male Population of Silver Hill is 2,445.
What is the Total Female Population of Silver Hill?
Total Female Population of Silver Hill is 3,010.
What is the Ratio of Males per 100 Females in Silver Hill?
There are 81.23 Males per 100 Females in Silver Hill.
What is the Ratio of Females per 100 Males in Silver Hill?
There are 123.11 Females per 100 Males in Silver Hill.
What is the Median Population Age in Silver Hill?
Median Population Age in Silver Hill is 40.5 Years.
What is the Average Family Size in Silver Hill
Average Family Size in Silver Hill is 3.0 People.
What is the Average Household Size in Silver Hill
Average Household Size in Silver Hill is 2.0 People.
How Large is the Labor Force in Silver Hill?
There are 3,480 People in the Labor Forcein in Silver Hill.
What is the Percentage of People in the Labor Force in Silver Hill?
73.2% of People are in the Labor Force in Silver Hill.
What is the Unemployment Rate in Silver Hill?
Unemployment Rate in Silver Hill is 3.6%.