Chance, MD Map & Demographics
Chance Map
Chance Overview
$34,386
PER CAPITA INCOME
$61,181
AVG FAMILY INCOME
$49,861
AVG HOUSEHOLD INCOME
10.0%
WAGE / INCOME GAP [ % ]
90.0¢/ $1
WAGE / INCOME GAP [ $ ]
0.37
INEQUALITY / GINI INDEX
267
TOTAL POPULATION
120
MALE POPULATION
147
FEMALE POPULATION
81.63
MALES / 100 FEMALES
122.50
FEMALES / 100 MALES
56.4
MEDIAN AGE
2.5
AVG FAMILY SIZE
2.1
AVG HOUSEHOLD SIZE
141
LABOR FORCE [ PEOPLE ]
55.5%
PERCENT IN LABOR FORCE
14.2%
UNEMPLOYMENT RATE
Chance Area Codes
Income in Chance
Income Overview in Chance
Per Capita Income in Chance is $34,386, while median incomes of families and households are $61,181 and $49,861 respectively.
| Characteristic | Number | Measure |
| Per Capita Income | 267 | $34,386 |
| Median Family Income | 85 | $61,181 |
| Mean Family Income | 85 | $78,831 |
| Median Household Income | 127 | $49,861 |
| Mean Household Income | 127 | $67,880 |
| Income Deficit | 85 | $0 |
| Wage / Income Gap (%) | 267 | 9.96% |
| Wage / Income Gap ($) | 267 | 90.04¢ per $1 |
| Gini / Inequality Index | 267 | 0.37 |
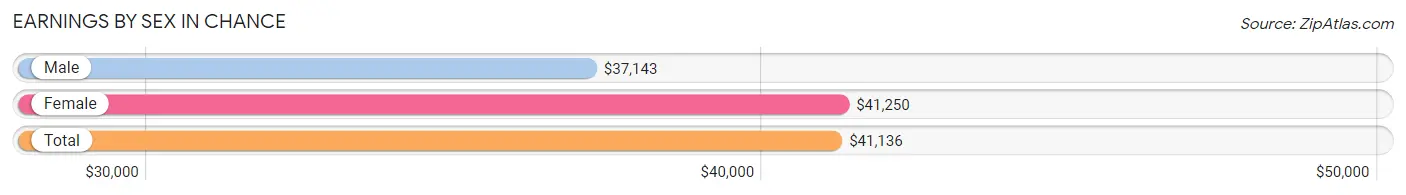
Earnings by Sex in Chance
Average Earnings in Chance are $41,136, $37,143 for men and $41,250 for women, a difference of 10.0%.
| Sex | Number | Average Earnings |
| Male | 44 (34.9%) | $37,143 |
| Female | 82 (65.1%) | $41,250 |
| Total | 126 (100.0%) | $41,136 |
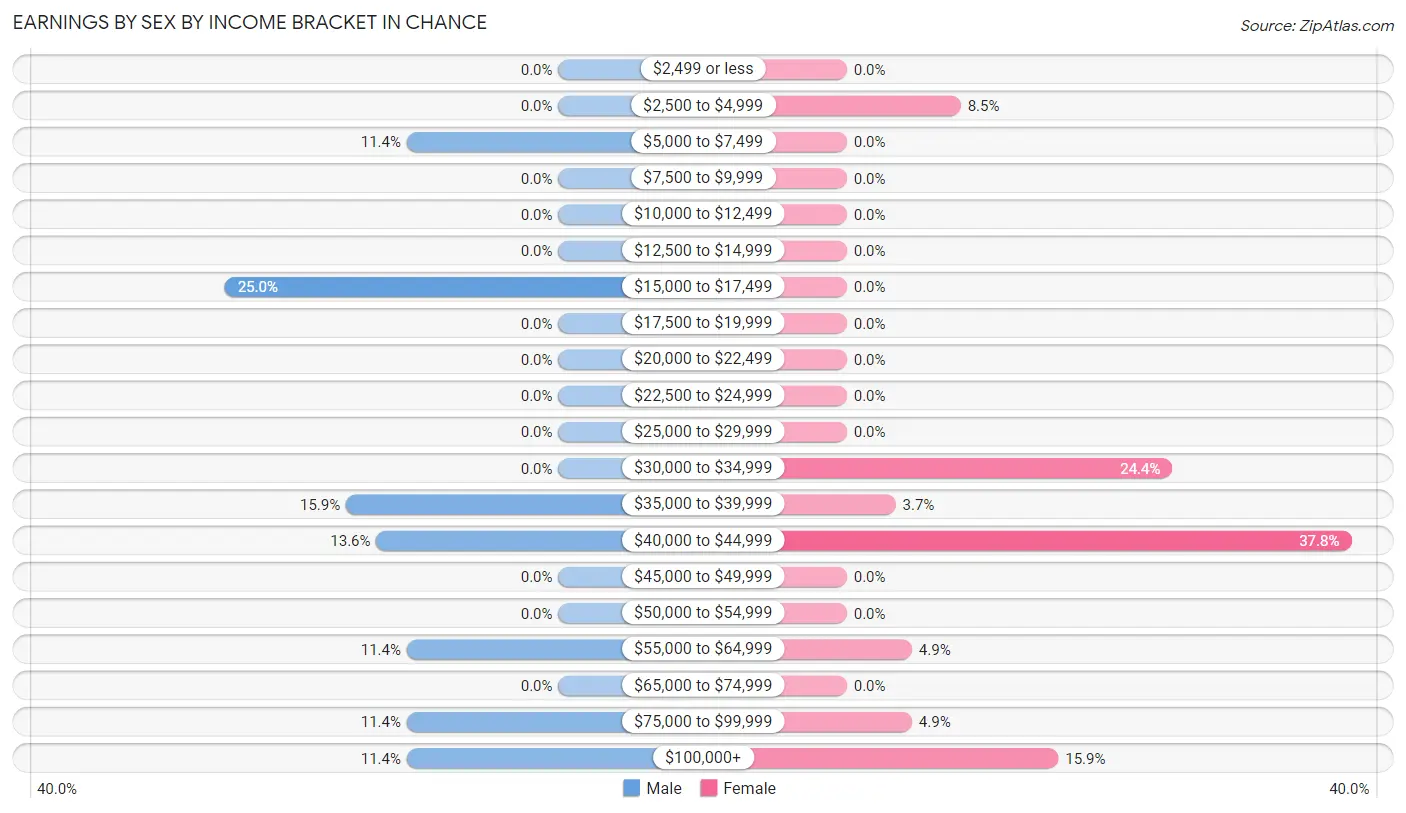
Earnings by Sex by Income Bracket in Chance
The most common earnings brackets in Chance are $15,000 to $17,499 for men (11 | 25.0%) and $40,000 to $44,999 for women (31 | 37.8%).
| Income | Male | Female |
| $2,499 or less | 0 (0.0%) | 0 (0.0%) |
| $2,500 to $4,999 | 0 (0.0%) | 7 (8.5%) |
| $5,000 to $7,499 | 5 (11.4%) | 0 (0.0%) |
| $7,500 to $9,999 | 0 (0.0%) | 0 (0.0%) |
| $10,000 to $12,499 | 0 (0.0%) | 0 (0.0%) |
| $12,500 to $14,999 | 0 (0.0%) | 0 (0.0%) |
| $15,000 to $17,499 | 11 (25.0%) | 0 (0.0%) |
| $17,500 to $19,999 | 0 (0.0%) | 0 (0.0%) |
| $20,000 to $22,499 | 0 (0.0%) | 0 (0.0%) |
| $22,500 to $24,999 | 0 (0.0%) | 0 (0.0%) |
| $25,000 to $29,999 | 0 (0.0%) | 0 (0.0%) |
| $30,000 to $34,999 | 0 (0.0%) | 20 (24.4%) |
| $35,000 to $39,999 | 7 (15.9%) | 3 (3.7%) |
| $40,000 to $44,999 | 6 (13.6%) | 31 (37.8%) |
| $45,000 to $49,999 | 0 (0.0%) | 0 (0.0%) |
| $50,000 to $54,999 | 0 (0.0%) | 0 (0.0%) |
| $55,000 to $64,999 | 5 (11.4%) | 4 (4.9%) |
| $65,000 to $74,999 | 0 (0.0%) | 0 (0.0%) |
| $75,000 to $99,999 | 5 (11.4%) | 4 (4.9%) |
| $100,000+ | 5 (11.4%) | 13 (15.9%) |
| Total | 44 (100.0%) | 82 (100.0%) |
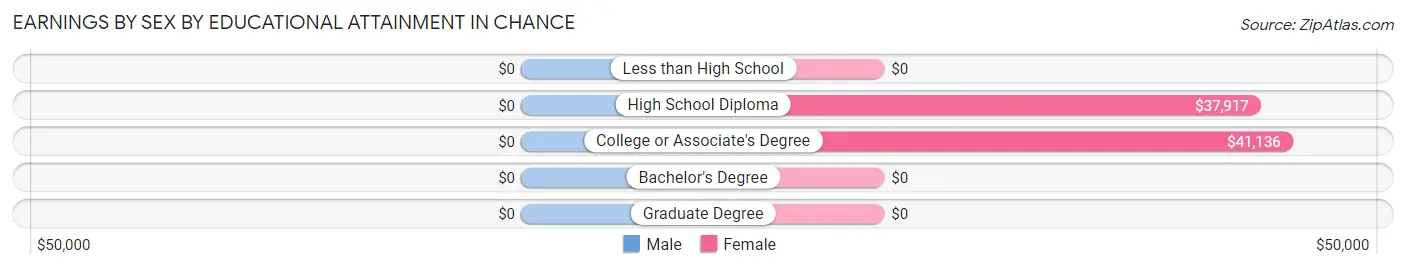
Earnings by Sex by Educational Attainment in Chance
| Educational Attainment | Male Income | Female Income |
| Less than High School | - | - |
| High School Diploma | - | - |
| College or Associate's Degree | - | - |
| Bachelor's Degree | - | - |
| Graduate Degree | - | - |
| Total | - | - |
Family Income in Chance
Family Income Brackets in Chance
According to the Chance family income data, there are 20 families falling into the $35,000 to $49,999 income range, which is the most common income bracket and makes up 23.5% of all families.
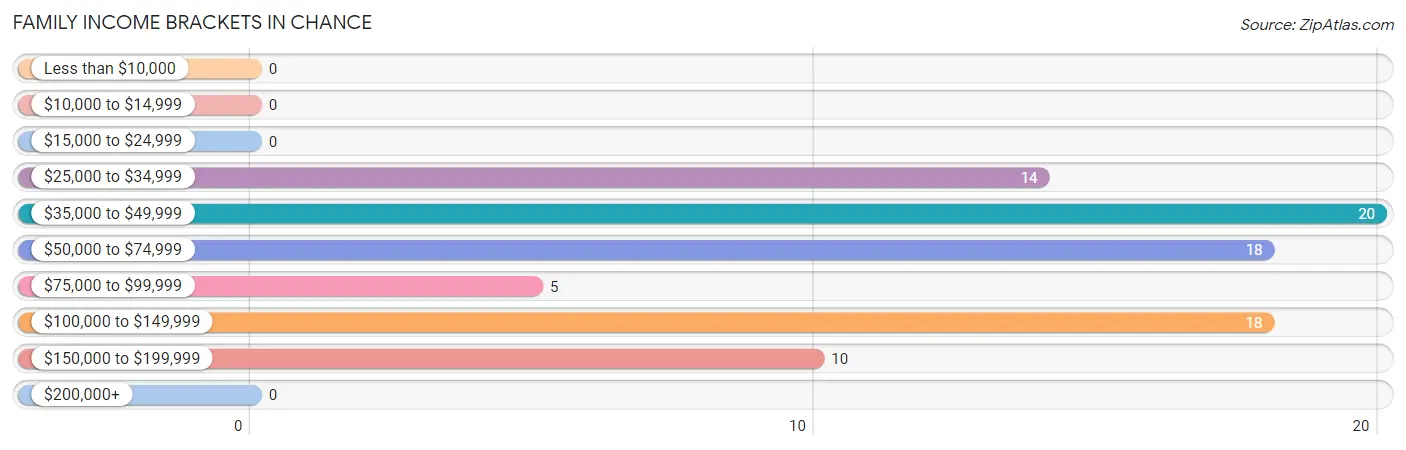
| Income Bracket | # Families | % Families |
| Less than $10,000 | 0 | 0.0% |
| $10,000 to $14,999 | 0 | 0.0% |
| $15,000 to $24,999 | 0 | 0.0% |
| $25,000 to $34,999 | 14 | 16.5% |
| $35,000 to $49,999 | 20 | 23.5% |
| $50,000 to $74,999 | 18 | 21.2% |
| $75,000 to $99,999 | 5 | 5.9% |
| $100,000 to $149,999 | 18 | 21.2% |
| $150,000 to $199,999 | 10 | 11.8% |
| $200,000+ | 0 | 0.0% |
Family Income by Famaliy Size in Chance
3-person families (10 | 11.8%) account for the highest median family income in Chance with $134,167 per family, while 3-person families (10 | 11.8%) have the highest median income of $44,722 per family member.
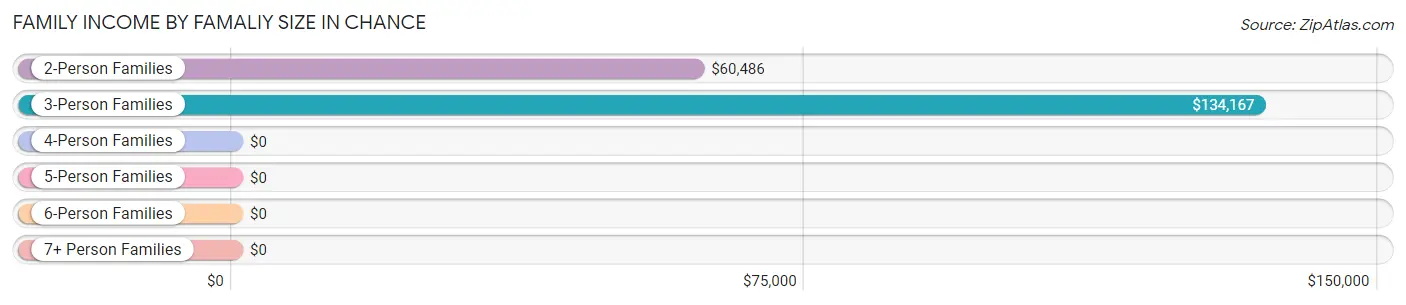
| Income Bracket | # Families | Median Income |
| 2-Person Families | 69 (81.2%) | $60,486 |
| 3-Person Families | 10 (11.8%) | $134,167 |
| 4-Person Families | 6 (7.1%) | $0 |
| 5-Person Families | 0 (0.0%) | $0 |
| 6-Person Families | 0 (0.0%) | $0 |
| 7+ Person Families | 0 (0.0%) | $0 |
| Total | 85 (100.0%) | $61,181 |
Family Income by Number of Earners in Chance
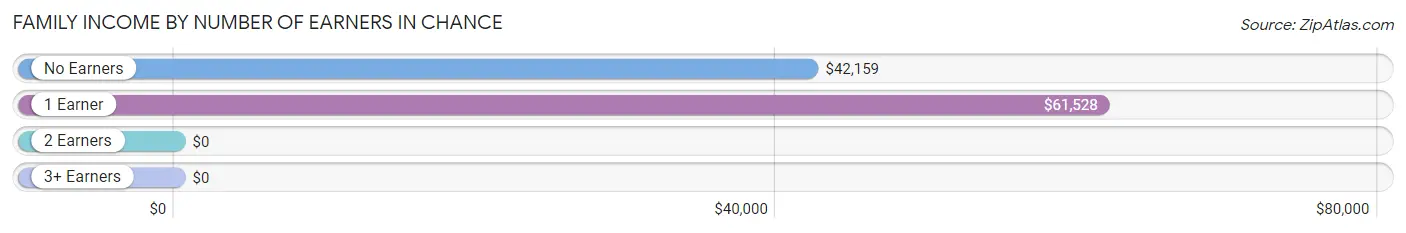
| Number of Earners | # Families | Median Income |
| No Earners | 19 (22.4%) | $42,159 |
| 1 Earner | 50 (58.8%) | $61,528 |
| 2 Earners | 9 (10.6%) | $0 |
| 3+ Earners | 7 (8.2%) | $0 |
| Total | 85 (100.0%) | $61,181 |
Household Income in Chance
Household Income Brackets in Chance
With 35 households falling in the category, the $25,000 to $34,999 income range is the most frequent in Chance, accounting for 27.6% of all households.
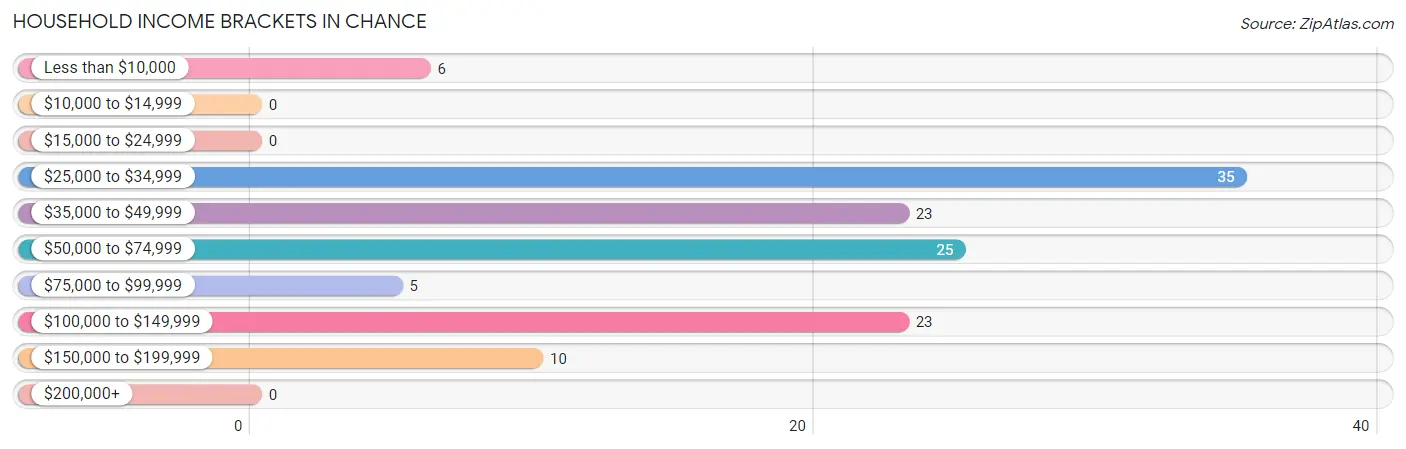
| Income Bracket | # Households | % Households |
| Less than $10,000 | 6 | 4.7% |
| $10,000 to $14,999 | 0 | 0.0% |
| $15,000 to $24,999 | 0 | 0.0% |
| $25,000 to $34,999 | 35 | 27.6% |
| $35,000 to $49,999 | 23 | 18.1% |
| $50,000 to $74,999 | 25 | 19.7% |
| $75,000 to $99,999 | 5 | 3.9% |
| $100,000 to $149,999 | 23 | 18.1% |
| $150,000 to $199,999 | 10 | 7.9% |
| $200,000+ | 0 | 0.0% |
Household Income by Householder Age in Chance
The median household income in Chance is $49,861, with the highest median household income of $61,458 found in the 25 to 44 years age bracket for the primary householder. A total of 27 households (21.3%) fall into this category.
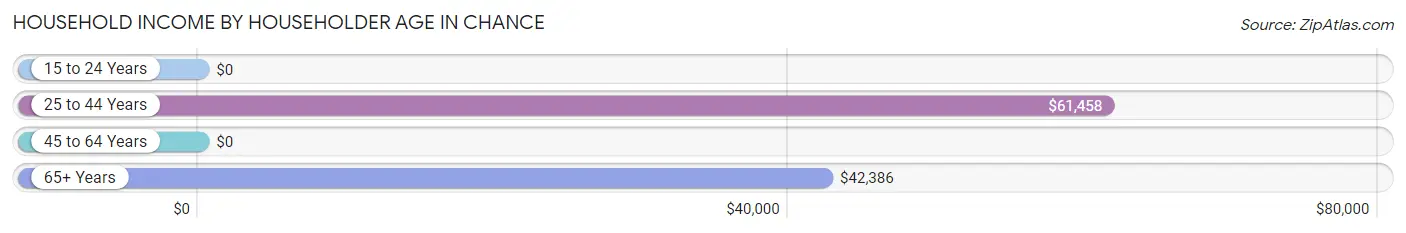
| Income Bracket | # Households | Median Income |
| 15 to 24 Years | 0 (0.0%) | $0 |
| 25 to 44 Years | 27 (21.3%) | $61,458 |
| 45 to 64 Years | 47 (37.0%) | $0 |
| 65+ Years | 53 (41.7%) | $42,386 |
| Total | 127 (100.0%) | $49,861 |
Poverty in Chance
Income Below Poverty by Sex and Age in Chance
With 5.8% poverty level for males and 4.1% for females among the residents of Chance, 65 to 74 year old males and 55 to 64 year old females are the most vulnerable to poverty, with 7 males (58.3%) and 6 females (11.8%) in their respective age groups living below the poverty level.
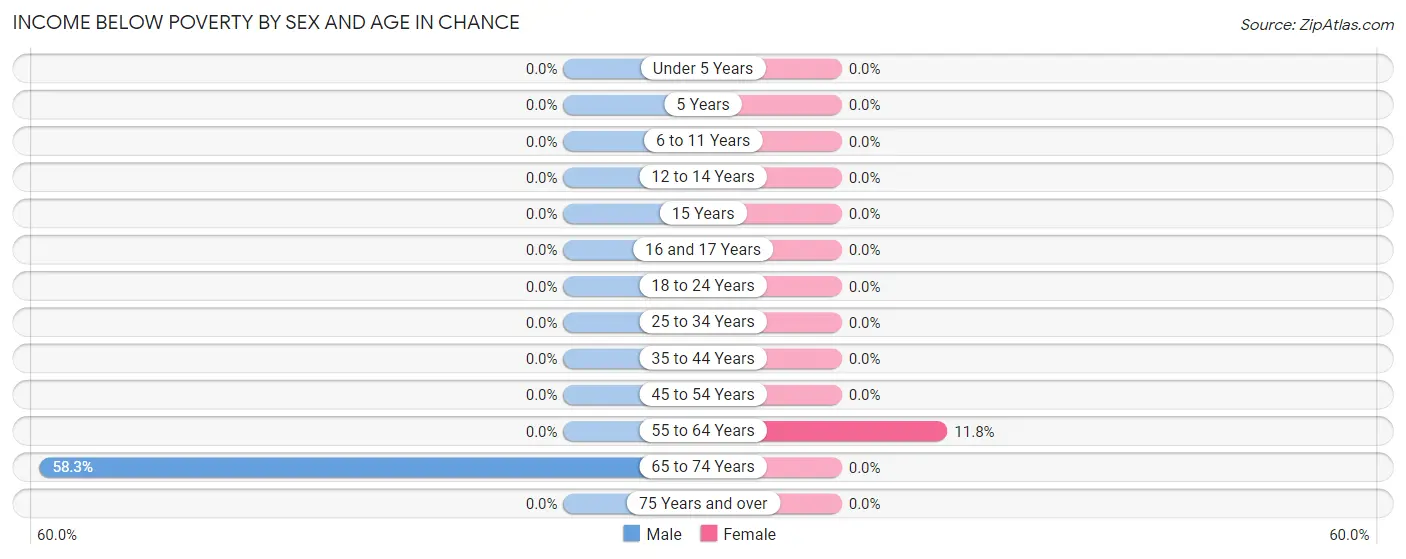
| Age Bracket | Male | Female |
| Under 5 Years | 0 (0.0%) | 0 (0.0%) |
| 5 Years | 0 (0.0%) | 0 (0.0%) |
| 6 to 11 Years | 0 (0.0%) | 0 (0.0%) |
| 12 to 14 Years | 0 (0.0%) | 0 (0.0%) |
| 15 Years | 0 (0.0%) | 0 (0.0%) |
| 16 and 17 Years | 0 (0.0%) | 0 (0.0%) |
| 18 to 24 Years | 0 (0.0%) | 0 (0.0%) |
| 25 to 34 Years | 0 (0.0%) | 0 (0.0%) |
| 35 to 44 Years | 0 (0.0%) | 0 (0.0%) |
| 45 to 54 Years | 0 (0.0%) | 0 (0.0%) |
| 55 to 64 Years | 0 (0.0%) | 6 (11.8%) |
| 65 to 74 Years | 7 (58.3%) | 0 (0.0%) |
| 75 Years and over | 0 (0.0%) | 0 (0.0%) |
| Total | 7 (5.8%) | 6 (4.1%) |
Income Above Poverty by Sex and Age in Chance
According to the poverty statistics in Chance, males aged 6 to 11 years and females aged 6 to 11 years are the age groups that are most secure financially, with 100.0% of males and 100.0% of females in these age groups living above the poverty line.
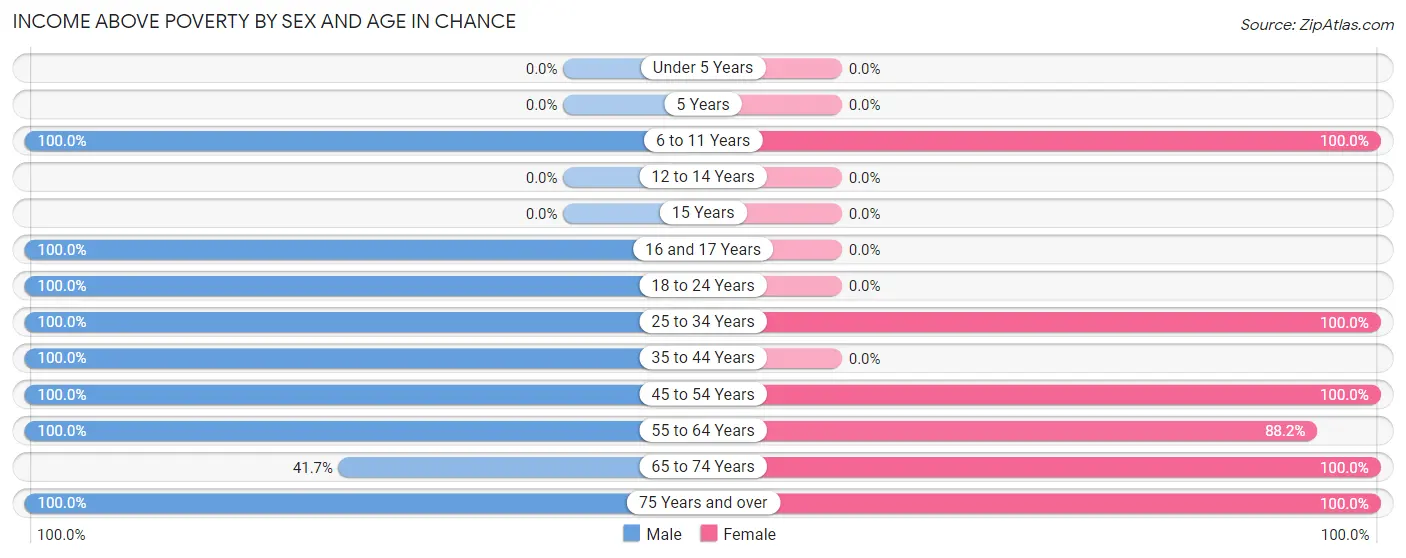
| Age Bracket | Male | Female |
| Under 5 Years | 0 (0.0%) | 0 (0.0%) |
| 5 Years | 0 (0.0%) | 0 (0.0%) |
| 6 to 11 Years | 8 (100.0%) | 5 (100.0%) |
| 12 to 14 Years | 0 (0.0%) | 0 (0.0%) |
| 15 Years | 0 (0.0%) | 0 (0.0%) |
| 16 and 17 Years | 5 (100.0%) | 0 (0.0%) |
| 18 to 24 Years | 7 (100.0%) | 0 (0.0%) |
| 25 to 34 Years | 18 (100.0%) | 35 (100.0%) |
| 35 to 44 Years | 34 (100.0%) | 0 (0.0%) |
| 45 to 54 Years | 5 (100.0%) | 11 (100.0%) |
| 55 to 64 Years | 14 (100.0%) | 45 (88.2%) |
| 65 to 74 Years | 5 (41.7%) | 10 (100.0%) |
| 75 Years and over | 17 (100.0%) | 35 (100.0%) |
| Total | 113 (94.2%) | 141 (95.9%) |
Income Below Poverty Among Married-Couple Families in Chance
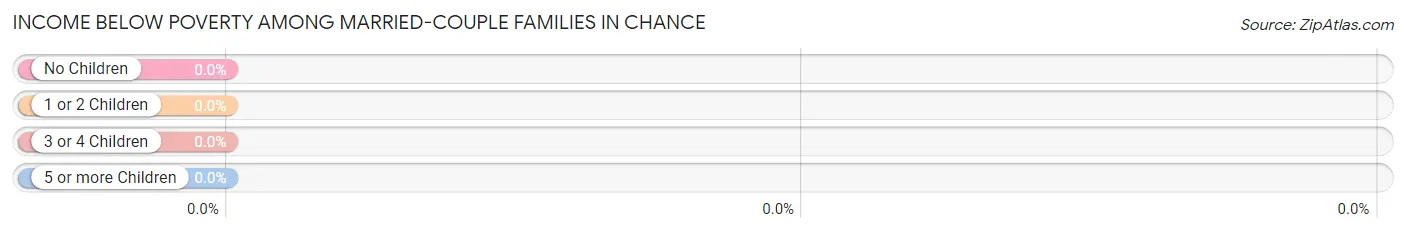
| Children | Above Poverty | Below Poverty |
| No Children | 47 (100.0%) | 0 (0.0%) |
| 1 or 2 Children | 12 (100.0%) | 0 (0.0%) |
| 3 or 4 Children | 0 (0.0%) | 0 (0.0%) |
| 5 or more Children | 0 (0.0%) | 0 (0.0%) |
| Total | 59 (100.0%) | 0 (0.0%) |
Income Below Poverty Among Single-Parent Households in Chance
| Children | Single Father | Single Mother |
| No Children | 0 (0.0%) | 0 (0.0%) |
| 1 or 2 Children | 0 (0.0%) | 0 (0.0%) |
| 3 or 4 Children | 0 (0.0%) | 0 (0.0%) |
| 5 or more Children | 0 (0.0%) | 0 (0.0%) |
| Total | 0 (0.0%) | 0 (0.0%) |
Income Below Poverty Among Married-Couple vs Single-Parent Households in Chance
| Children | Married-Couple Families | Single-Parent Households |
| No Children | 0 (0.0%) | 0 (0.0%) |
| 1 or 2 Children | 0 (0.0%) | 0 (0.0%) |
| 3 or 4 Children | 0 (0.0%) | 0 (0.0%) |
| 5 or more Children | 0 (0.0%) | 0 (0.0%) |
| Total | 0 (0.0%) | 0 (0.0%) |
Race in Chance
The most populous races in Chance are White / Caucasian (199 | 74.5%), Hispanic or Latino (40 | 15.0%), and Two or more Races (40 | 15.0%).
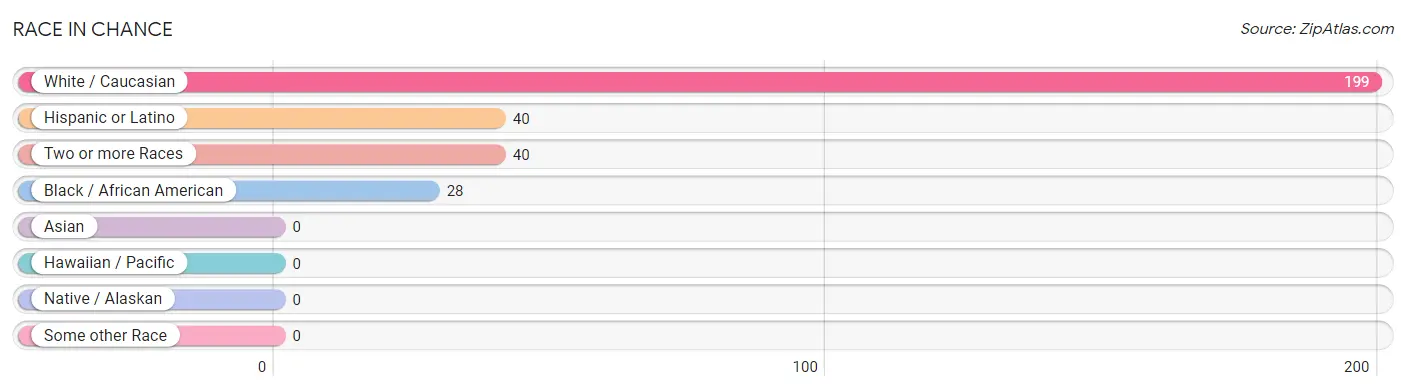
| Race | # Population | % Population |
| Asian | 0 | 0.0% |
| Black / African American | 28 | 10.5% |
| Hawaiian / Pacific | 0 | 0.0% |
| Hispanic or Latino | 40 | 15.0% |
| Native / Alaskan | 0 | 0.0% |
| White / Caucasian | 199 | 74.5% |
| Two or more Races | 40 | 15.0% |
| Some other Race | 0 | 0.0% |
| Total | 267 | 100.0% |
Ancestry in Chance
The most populous ancestries reported in Chance are American (87 | 32.6%), English (44 | 16.5%), German (32 | 12.0%), Dominican (22 | 8.2%), and European (19 | 7.1%), together accounting for 76.4% of all Chance residents.
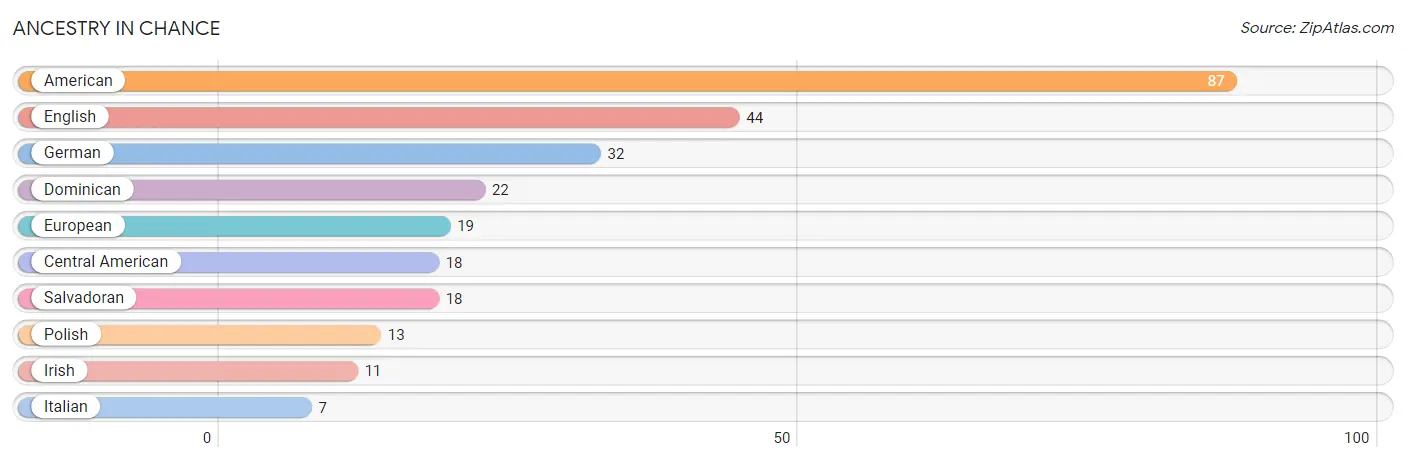
| Ancestry | # Population | % Population |
| American | 87 | 32.6% |
| Central American | 18 | 6.7% |
| Dominican | 22 | 8.2% |
| English | 44 | 16.5% |
| European | 19 | 7.1% |
| German | 32 | 12.0% |
| Irish | 11 | 4.1% |
| Italian | 7 | 2.6% |
| Polish | 13 | 4.9% |
| Salvadoran | 18 | 6.7% | View All 10 Rows |
Immigrants in Chance
The most numerous immigrant groups reported in Chance came from Latin America (40 | 15.0%), Caribbean (22 | 8.2%), Dominican Republic (22 | 8.2%), Central America (18 | 6.7%), and El Salvador (18 | 6.7%), together accounting for 44.9% of all Chance residents.
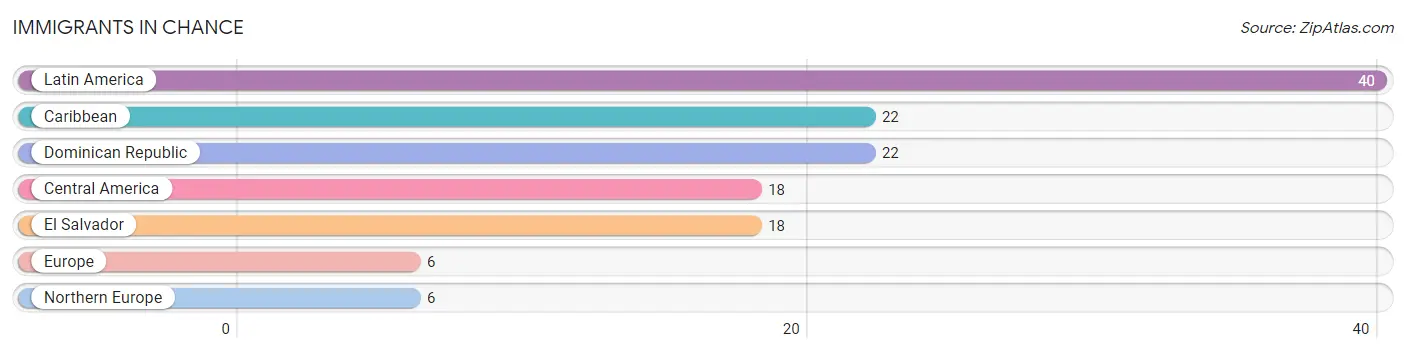
| Immigration Origin | # Population | % Population |
| Caribbean | 22 | 8.2% |
| Central America | 18 | 6.7% |
| Dominican Republic | 22 | 8.2% |
| El Salvador | 18 | 6.7% |
| Europe | 6 | 2.2% |
| Latin America | 40 | 15.0% |
| Northern Europe | 6 | 2.2% | View All 7 Rows |
Sex and Age in Chance
Sex and Age in Chance
The most populous age groups in Chance are 35 to 39 Years (34 | 28.3%) for men and 60 to 64 Years (39 | 26.5%) for women.
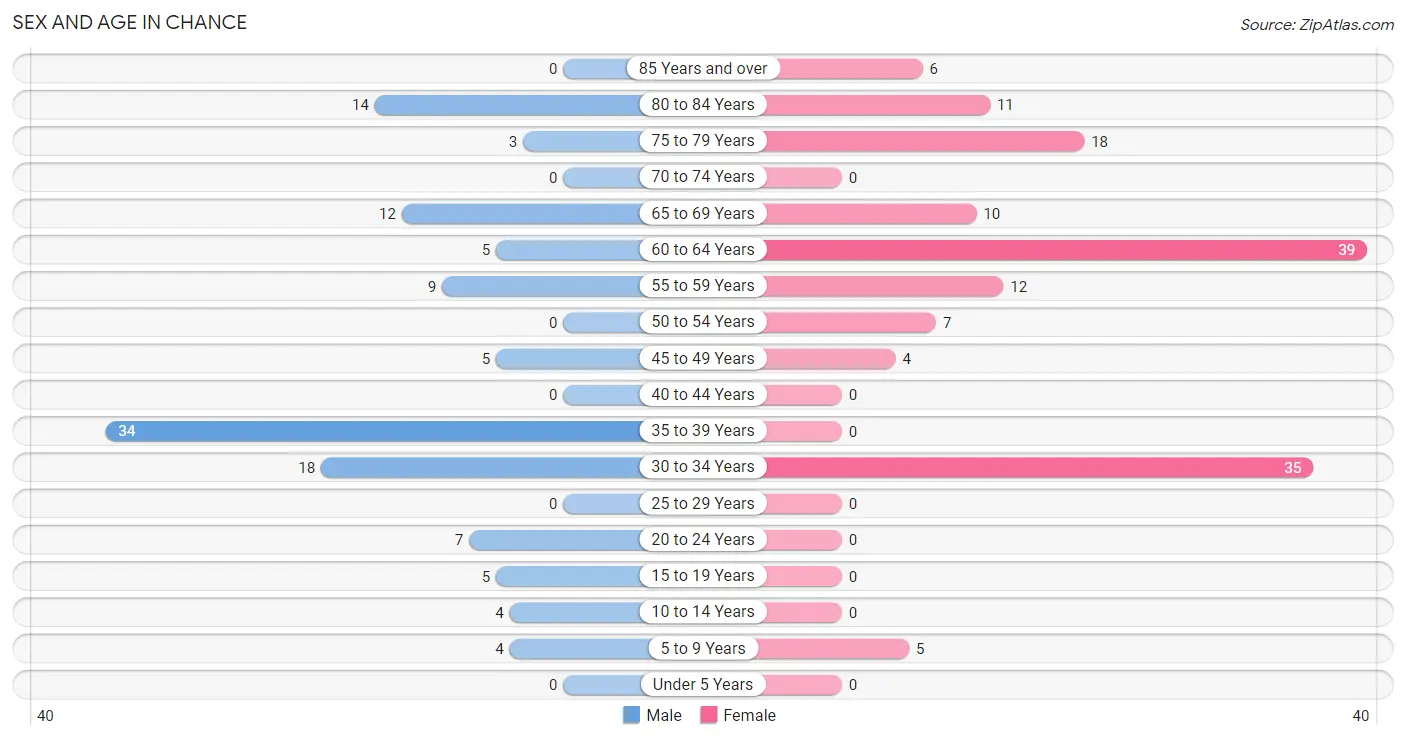
| Age Bracket | Male | Female |
| Under 5 Years | 0 (0.0%) | 0 (0.0%) |
| 5 to 9 Years | 4 (3.3%) | 5 (3.4%) |
| 10 to 14 Years | 4 (3.3%) | 0 (0.0%) |
| 15 to 19 Years | 5 (4.2%) | 0 (0.0%) |
| 20 to 24 Years | 7 (5.8%) | 0 (0.0%) |
| 25 to 29 Years | 0 (0.0%) | 0 (0.0%) |
| 30 to 34 Years | 18 (15.0%) | 35 (23.8%) |
| 35 to 39 Years | 34 (28.3%) | 0 (0.0%) |
| 40 to 44 Years | 0 (0.0%) | 0 (0.0%) |
| 45 to 49 Years | 5 (4.2%) | 4 (2.7%) |
| 50 to 54 Years | 0 (0.0%) | 7 (4.8%) |
| 55 to 59 Years | 9 (7.5%) | 12 (8.2%) |
| 60 to 64 Years | 5 (4.2%) | 39 (26.5%) |
| 65 to 69 Years | 12 (10.0%) | 10 (6.8%) |
| 70 to 74 Years | 0 (0.0%) | 0 (0.0%) |
| 75 to 79 Years | 3 (2.5%) | 18 (12.2%) |
| 80 to 84 Years | 14 (11.7%) | 11 (7.5%) |
| 85 Years and over | 0 (0.0%) | 6 (4.1%) |
| Total | 120 (100.0%) | 147 (100.0%) |
Families and Households in Chance
Median Family Size in Chance
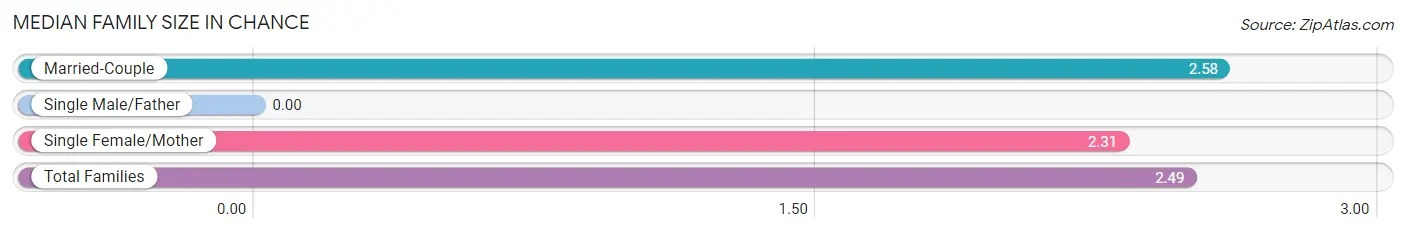
| Family Type | # Families | Family Size |
| Married-Couple | 59 (69.4%) | 2.58 |
| Single Male/Father | 0 (0.0%) | - |
| Single Female/Mother | 26 (30.6%) | 2.31 |
| Total Families | 85 (100.0%) | 2.49 |
Median Household Size in Chance
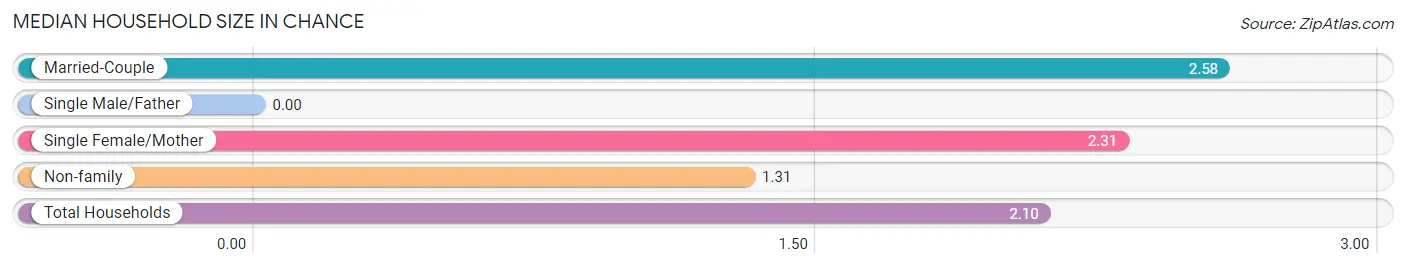
| Household Type | # Households | Household Size |
| Married-Couple | 59 (46.5%) | 2.58 |
| Single Male/Father | 0 (0.0%) | - |
| Single Female/Mother | 26 (20.5%) | 2.31 |
| Non-family | 42 (33.1%) | 1.31 |
| Total Households | 127 (100.0%) | 2.10 |
Household Size by Marriage Status in Chance
Out of a total of 127 households in Chance, 85 (66.9%) are family households, while 42 (33.1%) are nonfamily households. The most numerous type of family households are 2-person households, comprising 69, and the most common type of nonfamily households are 1-person households, comprising 32.
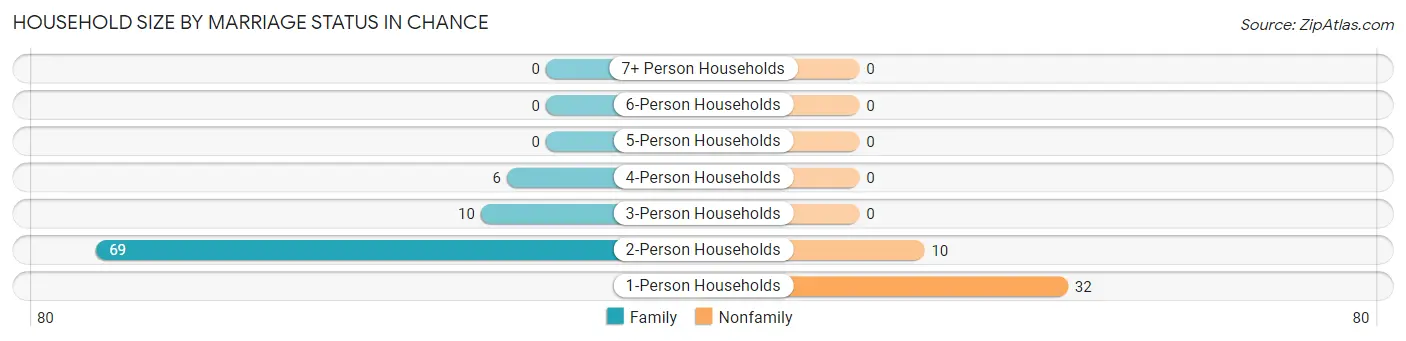
| Household Size | Family Households | Nonfamily Households |
| 1-Person Households | - | 32 (25.2%) |
| 2-Person Households | 69 (54.3%) | 10 (7.9%) |
| 3-Person Households | 10 (7.9%) | 0 (0.0%) |
| 4-Person Households | 6 (4.7%) | 0 (0.0%) |
| 5-Person Households | 0 (0.0%) | 0 (0.0%) |
| 6-Person Households | 0 (0.0%) | 0 (0.0%) |
| 7+ Person Households | 0 (0.0%) | 0 (0.0%) |
| Total | 85 (66.9%) | 42 (33.1%) |
Female Fertility in Chance
Fertility by Age in Chance
| Age Bracket | Women with Births | Births / 1,000 Women |
| 15 to 19 years | 0 (0.0%) | 0.0 |
| 20 to 34 years | 0 (0.0%) | 0.0 |
| 35 to 50 years | 0 (0.0%) | 0.0 |
| Total | 0 (0.0%) | 0.0 |
Fertility by Age by Marriage Status in Chance
| Age Bracket | Married | Unmarried |
| 15 to 19 years | 0 (0.0%) | 0 (0.0%) |
| 20 to 34 years | 0 (0.0%) | 0 (0.0%) |
| 35 to 50 years | 0 (0.0%) | 0 (0.0%) |
| Total | 0 (0.0%) | 0 (0.0%) |
Fertility by Education in Chance
| Educational Attainment | Women with Births | Births / 1,000 Women |
| Less than High School | 0 (0.0%) | 0.0 |
| High School Diploma | 0 (0.0%) | 0.0 |
| College or Associate's Degree | 0 (0.0%) | 0.0 |
| Bachelor's Degree | 0 (0.0%) | 0.0 |
| Graduate Degree | 0 (0.0%) | 0.0 |
| Total | 0 (0.0%) | 0.0 |
Fertility by Education by Marriage Status in Chance
| Educational Attainment | Married | Unmarried |
| Less than High School | 0 (0.0%) | 0 (0.0%) |
| High School Diploma | 0 (0.0%) | 0 (0.0%) |
| College or Associate's Degree | 0 (0.0%) | 0 (0.0%) |
| Bachelor's Degree | 0 (0.0%) | 0 (0.0%) |
| Graduate Degree | 0 (0.0%) | 0 (0.0%) |
| Total | 0 (0.0%) | 0 (0.0%) |
Employment Characteristics in Chance
Employment by Class of Employer in Chance
Among the 121 employed individuals in Chance, private company employees (64 | 52.9%), self-employed (not incorporated) (23 | 19.0%), and local government employees (17 | 14.1%) make up the most common classes of employment.
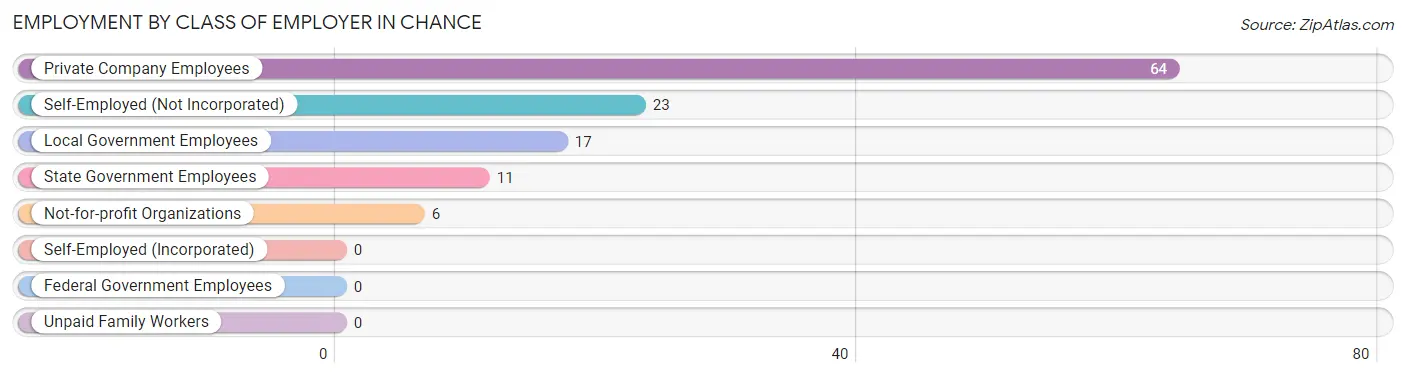
| Employer Class | # Employees | % Employees |
| Private Company Employees | 64 | 52.9% |
| Self-Employed (Incorporated) | 0 | 0.0% |
| Self-Employed (Not Incorporated) | 23 | 19.0% |
| Not-for-profit Organizations | 6 | 5.0% |
| Local Government Employees | 17 | 14.1% |
| State Government Employees | 11 | 9.1% |
| Federal Government Employees | 0 | 0.0% |
| Unpaid Family Workers | 0 | 0.0% |
| Total | 121 | 100.0% |
Employment Status by Age in Chance
According to the labor force statistics for Chance, out of the total population over 16 years of age (254), 55.5% or 141 individuals are in the labor force, with 14.2% or 20 of them unemployed. The age group with the highest labor force participation rate is 16 to 19 years, with 100.0% or 5 individuals in the labor force. Within the labor force, the 65 to 74 years age range has the highest percentage of unemployed individuals, with 33.3% or 5 of them being unemployed.
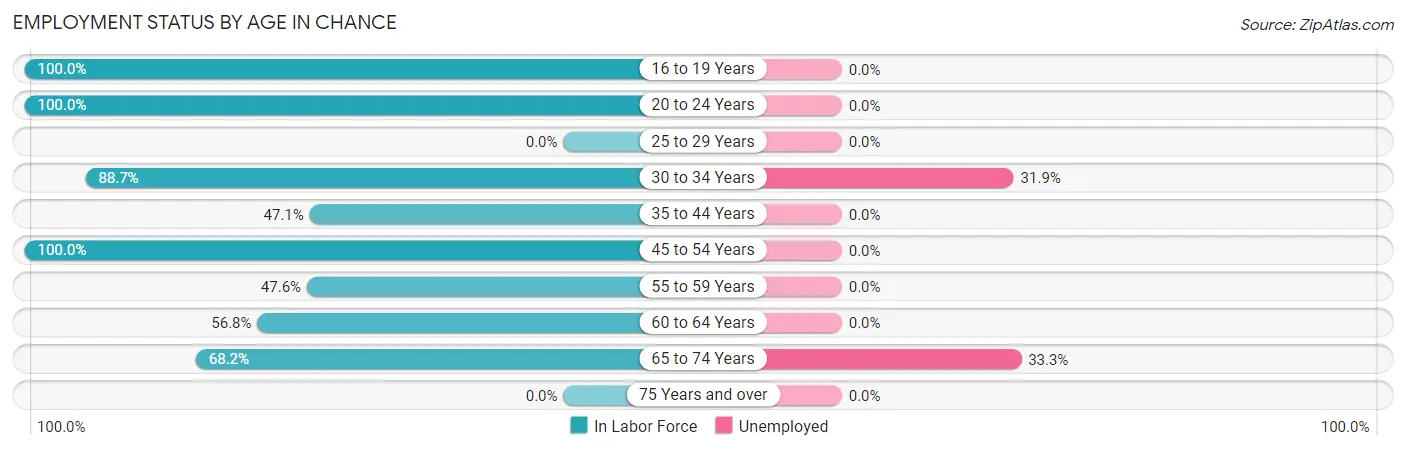
| Age Bracket | In Labor Force | Unemployed |
| 16 to 19 Years | 5 (100.0%) | 0 (0.0%) |
| 20 to 24 Years | 7 (100.0%) | 0 (0.0%) |
| 25 to 29 Years | 0 (0.0%) | 0 (0.0%) |
| 30 to 34 Years | 47 (88.7%) | 15 (31.9%) |
| 35 to 44 Years | 16 (47.1%) | 0 (0.0%) |
| 45 to 54 Years | 16 (100.0%) | 0 (0.0%) |
| 55 to 59 Years | 10 (47.6%) | 0 (0.0%) |
| 60 to 64 Years | 25 (56.8%) | 0 (0.0%) |
| 65 to 74 Years | 15 (68.2%) | 5 (33.3%) |
| 75 Years and over | 0 (0.0%) | 0 (0.0%) |
| Total | 141 (55.5%) | 20 (14.2%) |
Employment Status by Educational Attainment in Chance
According to labor force statistics for Chance, 67.9% of individuals (114) out of the total population between 25 and 64 years of age (168) are in the labor force, with 13.2% or 15 of them being unemployed. The group with the highest labor force participation rate are those with the educational attainment of bachelor's degree or higher, with 100.0% or 10 individuals in the labor force. Within the labor force, individuals with high school diploma education have the highest percentage of unemployment, with 25.4% or 15 of them being unemployed.
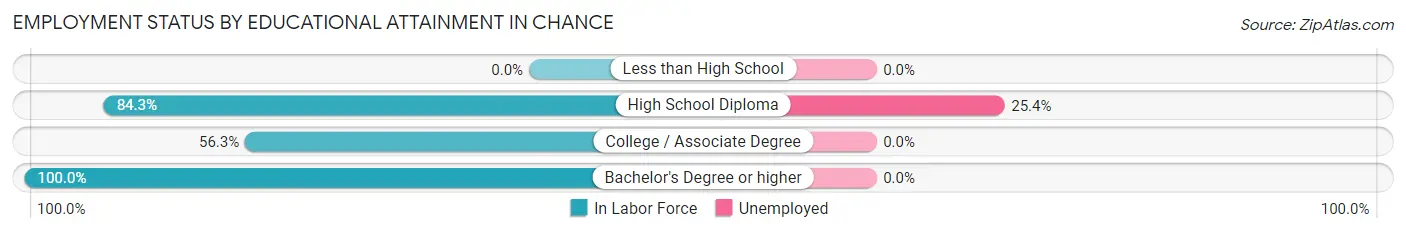
| Educational Attainment | In Labor Force | Unemployed |
| Less than High School | 0 (0.0%) | 0 (0.0%) |
| High School Diploma | 59 (84.3%) | 18 (25.4%) |
| College / Associate Degree | 45 (56.3%) | 0 (0.0%) |
| Bachelor's Degree or higher | 10 (100.0%) | 0 (0.0%) |
| Total | 114 (67.9%) | 22 (13.2%) |
Employment Occupations by Sex in Chance
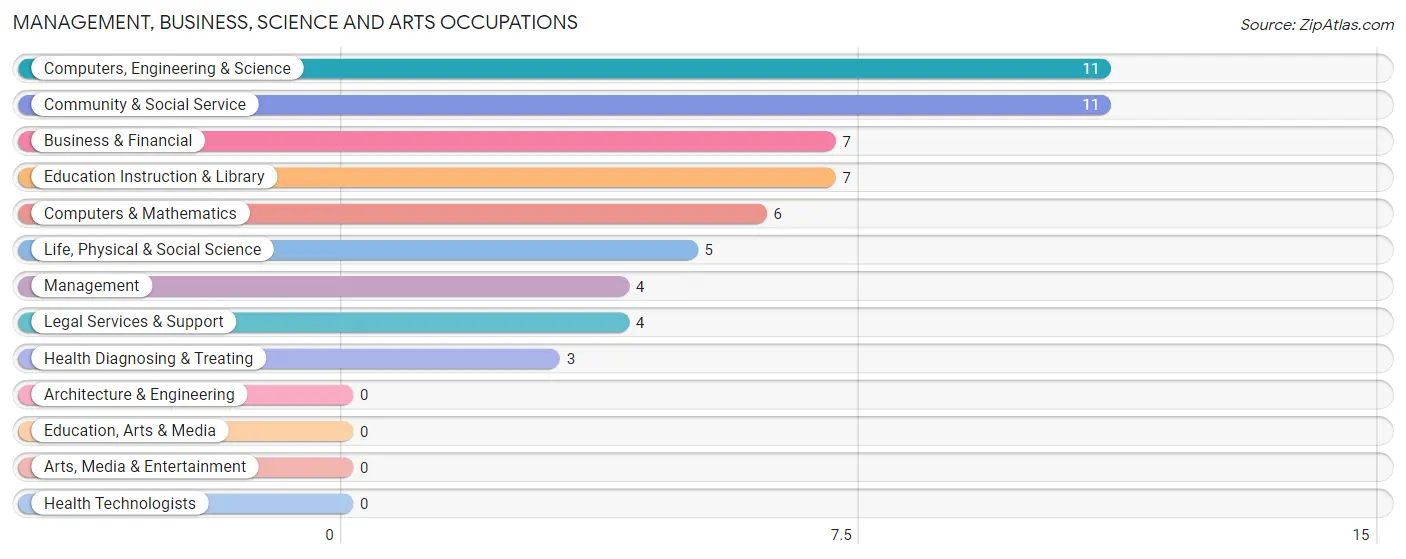
Management, Business, Science and Arts Occupations
The most common Management, Business, Science and Arts occupations in Chance are Computers, Engineering & Science (11 | 9.1%), Community & Social Service (11 | 9.1%), Business & Financial (7 | 5.8%), Education Instruction & Library (7 | 5.8%), and Computers & Mathematics (6 | 5.0%).
Management, Business, Science and Arts Occupations by Sex
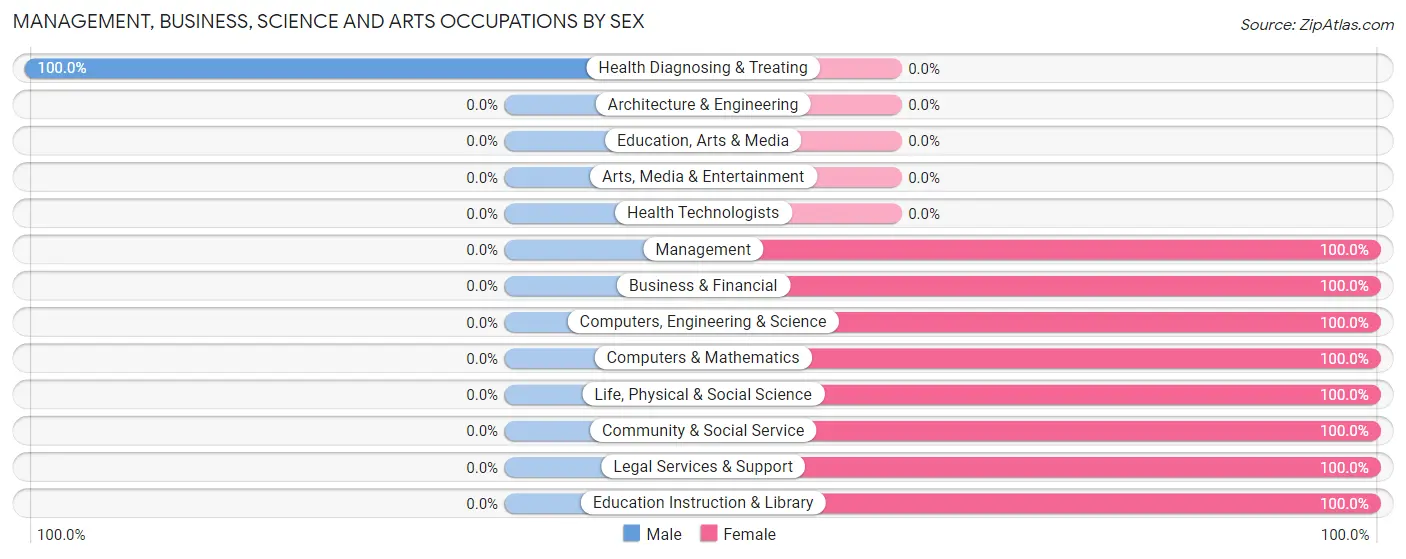
| Occupation | Male | Female |
| Management | 0 (0.0%) | 4 (100.0%) |
| Business & Financial | 0 (0.0%) | 7 (100.0%) |
| Computers, Engineering & Science | 0 (0.0%) | 11 (100.0%) |
| Computers & Mathematics | 0 (0.0%) | 6 (100.0%) |
| Architecture & Engineering | 0 (0.0%) | 0 (0.0%) |
| Life, Physical & Social Science | 0 (0.0%) | 5 (100.0%) |
| Community & Social Service | 0 (0.0%) | 11 (100.0%) |
| Education, Arts & Media | 0 (0.0%) | 0 (0.0%) |
| Legal Services & Support | 0 (0.0%) | 4 (100.0%) |
| Education Instruction & Library | 0 (0.0%) | 7 (100.0%) |
| Arts, Media & Entertainment | 0 (0.0%) | 0 (0.0%) |
| Health Diagnosing & Treating | 3 (100.0%) | 0 (0.0%) |
| Health Technologists | 0 (0.0%) | 0 (0.0%) |
| Total (Category) | 3 (8.3%) | 33 (91.7%) |
| Total (Overall) | 39 (32.2%) | 82 (67.8%) |
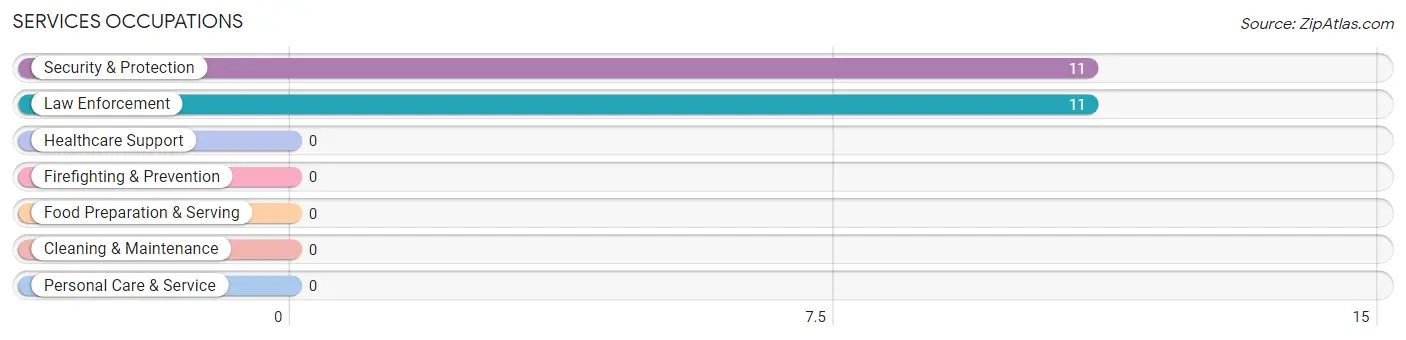
Services Occupations
The most common Services occupations in Chance are Security & Protection (11 | 9.1%), and Law Enforcement (11 | 9.1%).
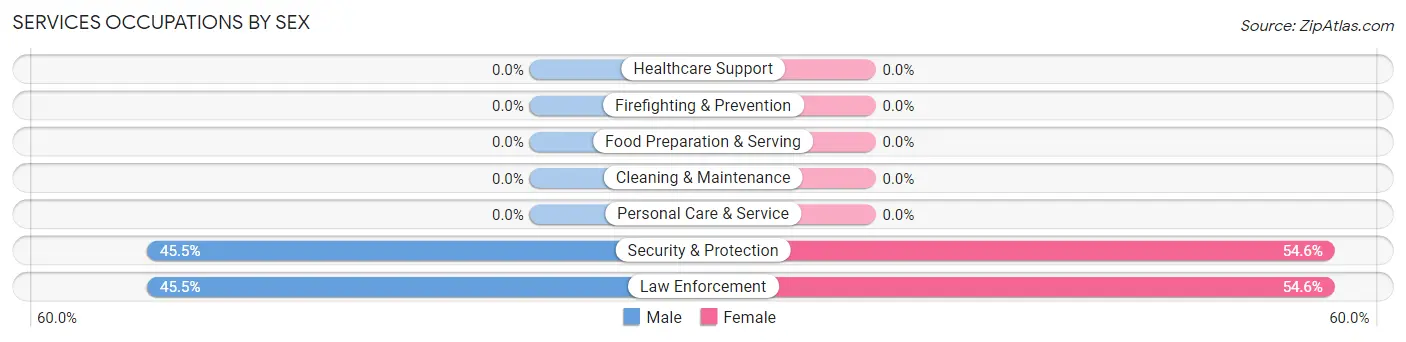
Services Occupations by Sex
Within the Services occupations in Chance, the most male-oriented occupations are Security & Protection (45.5%), and Law Enforcement (45.5%), while the most female-oriented occupations are Security & Protection (54.5%), and Law Enforcement (54.5%).
| Occupation | Male | Female |
| Healthcare Support | 0 (0.0%) | 0 (0.0%) |
| Security & Protection | 5 (45.5%) | 6 (54.5%) |
| Firefighting & Prevention | 0 (0.0%) | 0 (0.0%) |
| Law Enforcement | 5 (45.5%) | 6 (54.5%) |
| Food Preparation & Serving | 0 (0.0%) | 0 (0.0%) |
| Cleaning & Maintenance | 0 (0.0%) | 0 (0.0%) |
| Personal Care & Service | 0 (0.0%) | 0 (0.0%) |
| Total (Category) | 5 (45.5%) | 6 (54.5%) |
| Total (Overall) | 39 (32.2%) | 82 (67.8%) |
Sales and Office Occupations
The most common Sales and Office occupations in Chance are , and Office & Administration (30 | 24.8%).
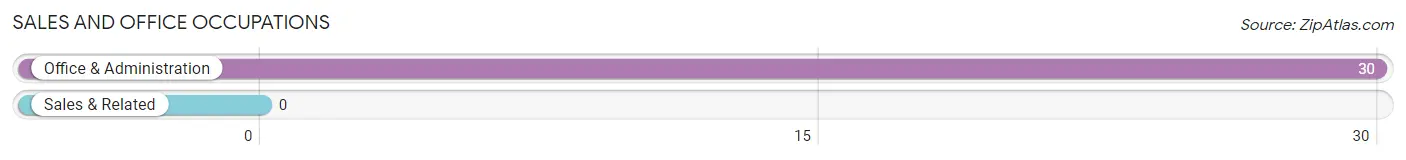
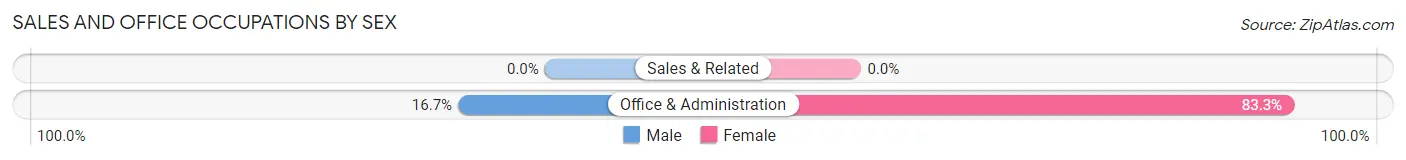
Sales and Office Occupations by Sex
| Occupation | Male | Female |
| Sales & Related | 0 (0.0%) | 0 (0.0%) |
| Office & Administration | 5 (16.7%) | 25 (83.3%) |
| Total (Category) | 5 (16.7%) | 25 (83.3%) |
| Total (Overall) | 39 (32.2%) | 82 (67.8%) |
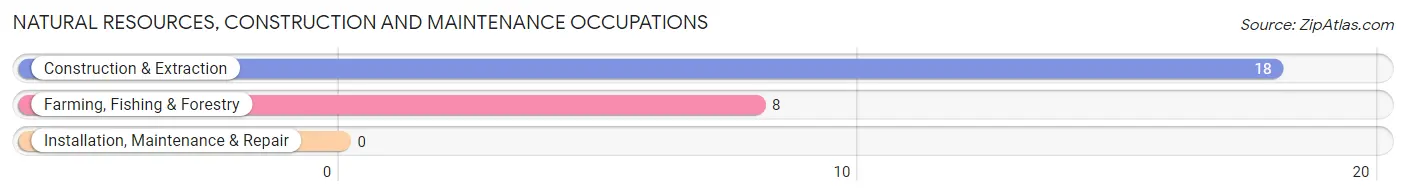
Natural Resources, Construction and Maintenance Occupations
The most common Natural Resources, Construction and Maintenance occupations in Chance are Construction & Extraction (18 | 14.9%), and Farming, Fishing & Forestry (8 | 6.6%).
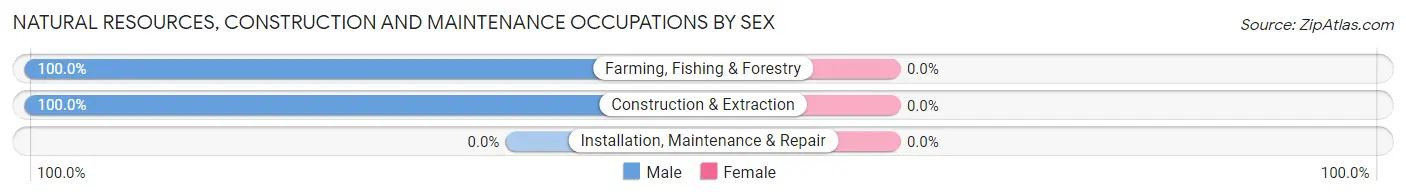
Natural Resources, Construction and Maintenance Occupations by Sex
| Occupation | Male | Female |
| Farming, Fishing & Forestry | 8 (100.0%) | 0 (0.0%) |
| Construction & Extraction | 18 (100.0%) | 0 (0.0%) |
| Installation, Maintenance & Repair | 0 (0.0%) | 0 (0.0%) |
| Total (Category) | 26 (100.0%) | 0 (0.0%) |
| Total (Overall) | 39 (32.2%) | 82 (67.8%) |
Production, Transportation and Moving Occupations
The most common Production, Transportation and Moving occupations in Chance are Transportation (14 | 11.6%), and Production (4 | 3.3%).
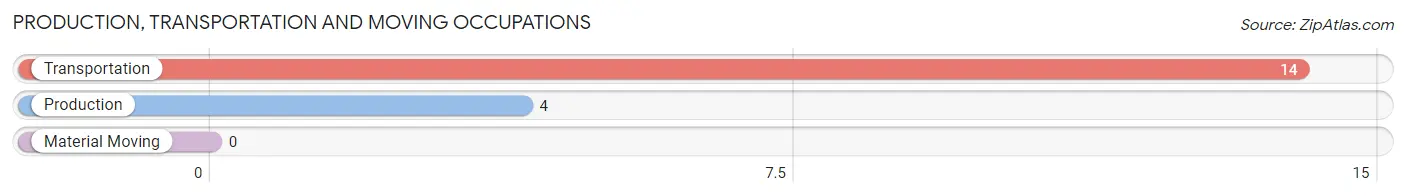
Production, Transportation and Moving Occupations by Sex
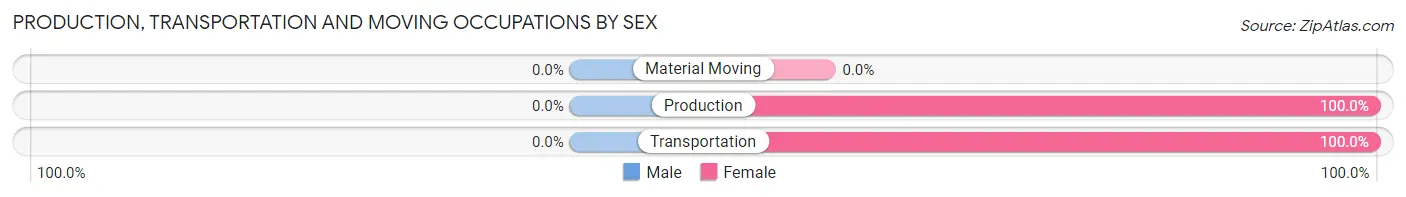
| Occupation | Male | Female |
| Production | 0 (0.0%) | 4 (100.0%) |
| Transportation | 0 (0.0%) | 14 (100.0%) |
| Material Moving | 0 (0.0%) | 0 (0.0%) |
| Total (Category) | 0 (0.0%) | 18 (100.0%) |
| Total (Overall) | 39 (32.2%) | 82 (67.8%) |
Employment Industries by Sex in Chance
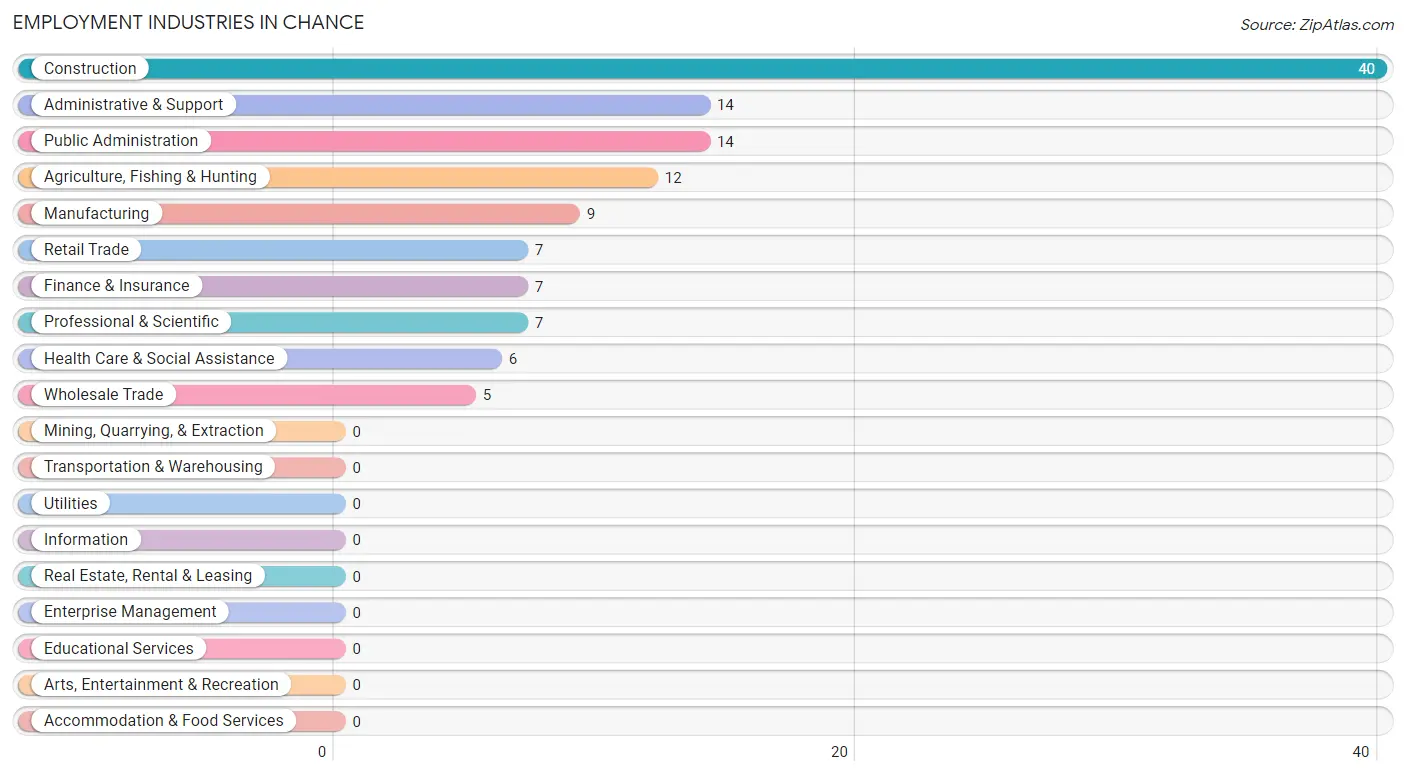
Employment Industries in Chance
The major employment industries in Chance include Construction (40 | 33.1%), Administrative & Support (14 | 11.6%), Public Administration (14 | 11.6%), Agriculture, Fishing & Hunting (12 | 9.9%), and Manufacturing (9 | 7.4%).
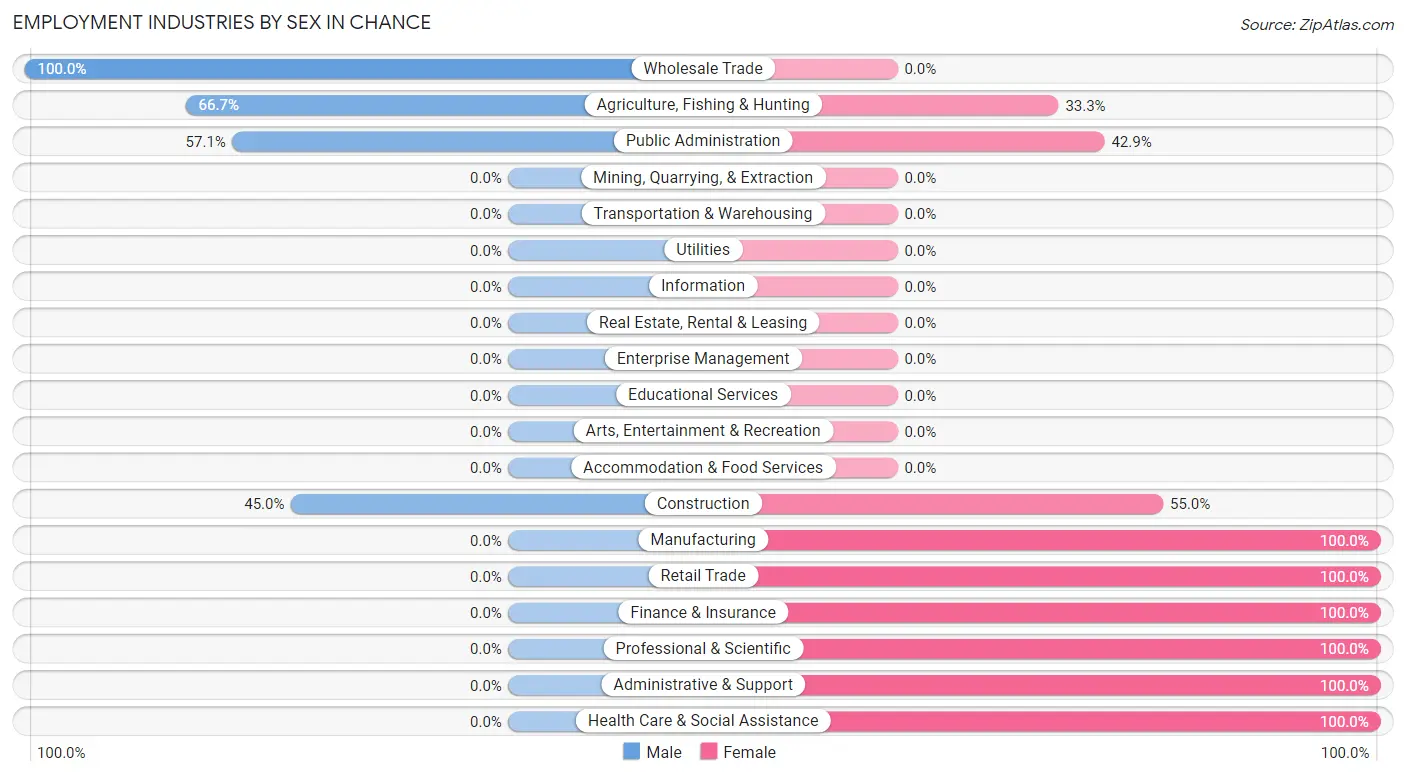
Employment Industries by Sex in Chance
The Chance industries that see more men than women are Wholesale Trade (100.0%), Agriculture, Fishing & Hunting (66.7%), and Public Administration (57.1%), whereas the industries that tend to have a higher number of women are Manufacturing (100.0%), Retail Trade (100.0%), and Finance & Insurance (100.0%).
| Industry | Male | Female |
| Agriculture, Fishing & Hunting | 8 (66.7%) | 4 (33.3%) |
| Mining, Quarrying, & Extraction | 0 (0.0%) | 0 (0.0%) |
| Construction | 18 (45.0%) | 22 (55.0%) |
| Manufacturing | 0 (0.0%) | 9 (100.0%) |
| Wholesale Trade | 5 (100.0%) | 0 (0.0%) |
| Retail Trade | 0 (0.0%) | 7 (100.0%) |
| Transportation & Warehousing | 0 (0.0%) | 0 (0.0%) |
| Utilities | 0 (0.0%) | 0 (0.0%) |
| Information | 0 (0.0%) | 0 (0.0%) |
| Finance & Insurance | 0 (0.0%) | 7 (100.0%) |
| Real Estate, Rental & Leasing | 0 (0.0%) | 0 (0.0%) |
| Professional & Scientific | 0 (0.0%) | 7 (100.0%) |
| Enterprise Management | 0 (0.0%) | 0 (0.0%) |
| Administrative & Support | 0 (0.0%) | 14 (100.0%) |
| Educational Services | 0 (0.0%) | 0 (0.0%) |
| Health Care & Social Assistance | 0 (0.0%) | 6 (100.0%) |
| Arts, Entertainment & Recreation | 0 (0.0%) | 0 (0.0%) |
| Accommodation & Food Services | 0 (0.0%) | 0 (0.0%) |
| Public Administration | 8 (57.1%) | 6 (42.9%) |
| Total | 39 (32.2%) | 82 (67.8%) |
Education in Chance
School Enrollment in Chance
The most common levels of schooling among the 18 students in Chance are elementary school (9 | 50.0%), high school (5 | 27.8%), and middle school (4 | 22.2%).
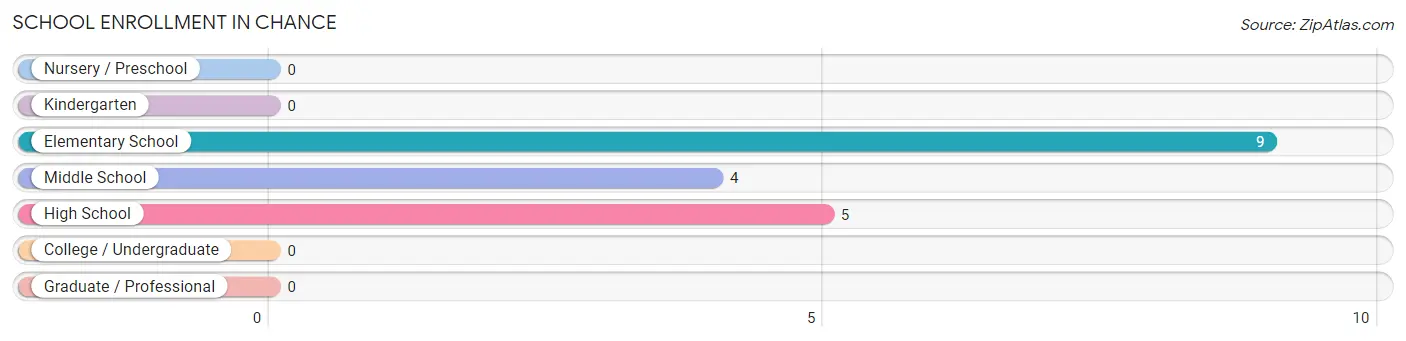
| School Level | # Students | % Students |
| Nursery / Preschool | 0 | 0.0% |
| Kindergarten | 0 | 0.0% |
| Elementary School | 9 | 50.0% |
| Middle School | 4 | 22.2% |
| High School | 5 | 27.8% |
| College / Undergraduate | 0 | 0.0% |
| Graduate / Professional | 0 | 0.0% |
| Total | 18 | 100.0% |
School Enrollment by Age by Funding Source in Chance
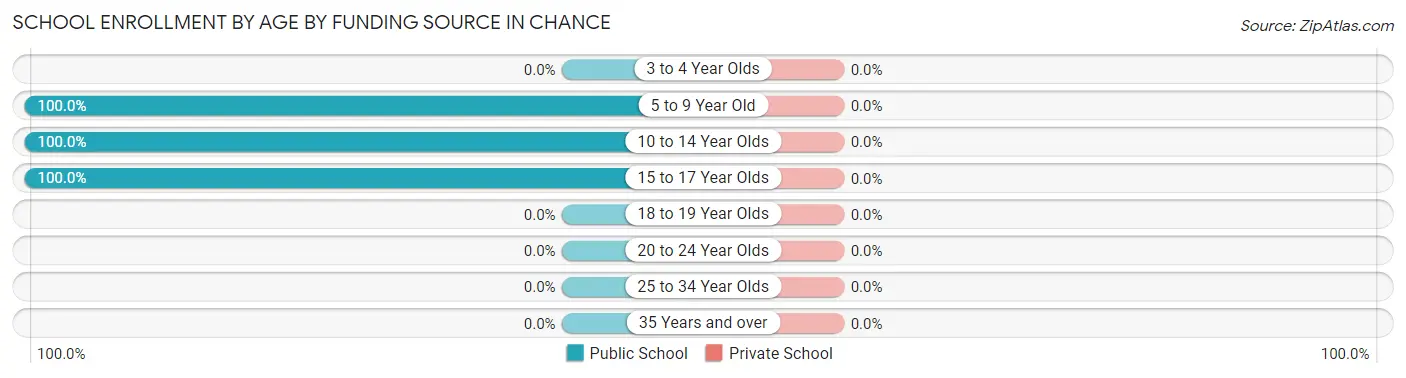
| Age Bracket | Public School | Private School |
| 3 to 4 Year Olds | 0 (0.0%) | 0 (0.0%) |
| 5 to 9 Year Old | 9 (100.0%) | 0 (0.0%) |
| 10 to 14 Year Olds | 4 (100.0%) | 0 (0.0%) |
| 15 to 17 Year Olds | 5 (100.0%) | 0 (0.0%) |
| 18 to 19 Year Olds | 0 (0.0%) | 0 (0.0%) |
| 20 to 24 Year Olds | 0 (0.0%) | 0 (0.0%) |
| 25 to 34 Year Olds | 0 (0.0%) | 0 (0.0%) |
| 35 Years and over | 0 (0.0%) | 0 (0.0%) |
| Total | 18 (100.0%) | 0 (0.0%) |
Educational Attainment by Field of Study in Chance
Computers & mathematics (7 | 70.0%), and arts & humanities (3 | 30.0%) are the most common fields of study among 10 individuals in Chance who have obtained a bachelor's degree or higher.
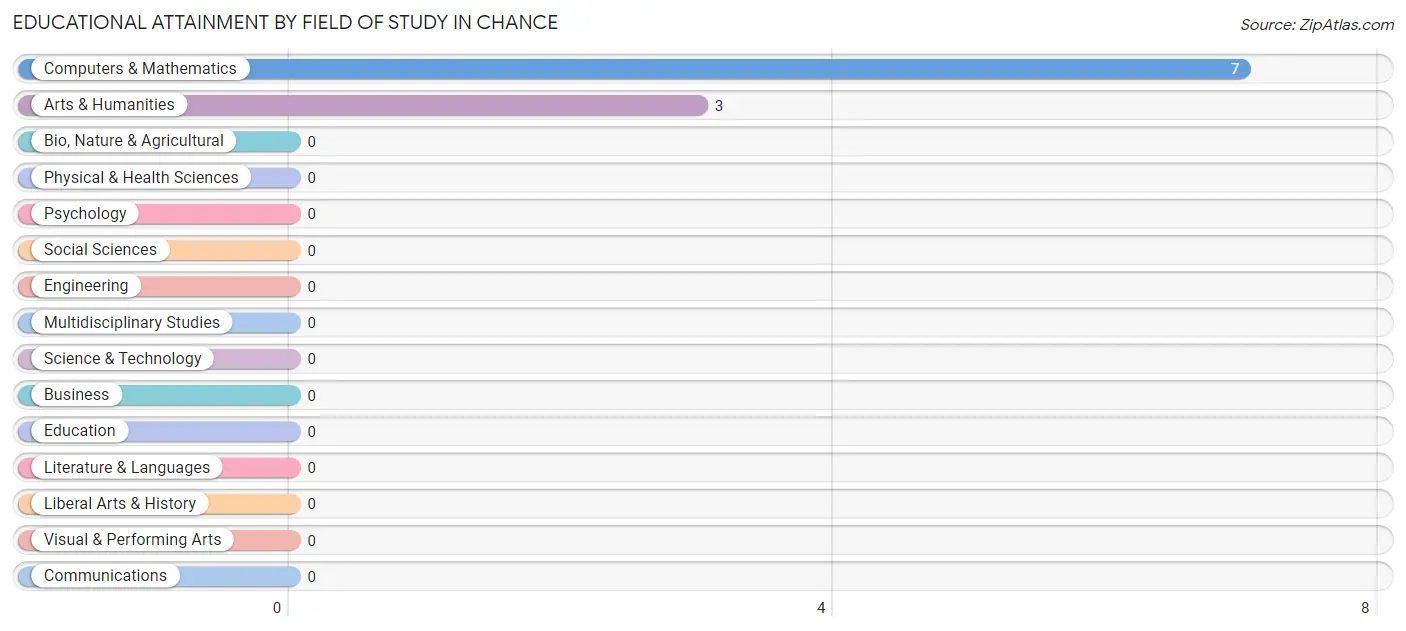
| Field of Study | # Graduates | % Graduates |
| Computers & Mathematics | 7 | 70.0% |
| Bio, Nature & Agricultural | 0 | 0.0% |
| Physical & Health Sciences | 0 | 0.0% |
| Psychology | 0 | 0.0% |
| Social Sciences | 0 | 0.0% |
| Engineering | 0 | 0.0% |
| Multidisciplinary Studies | 0 | 0.0% |
| Science & Technology | 0 | 0.0% |
| Business | 0 | 0.0% |
| Education | 0 | 0.0% |
| Literature & Languages | 0 | 0.0% |
| Liberal Arts & History | 0 | 0.0% |
| Visual & Performing Arts | 0 | 0.0% |
| Communications | 0 | 0.0% |
| Arts & Humanities | 3 | 30.0% |
| Total | 10 | 100.0% |
Transportation & Commute in Chance
Vehicle Availability by Sex in Chance
The most prevalent vehicle ownership categories in Chance are males with 3 vehicles (20, accounting for 51.3%) and females with 3 vehicles (16, making up 24.4%).
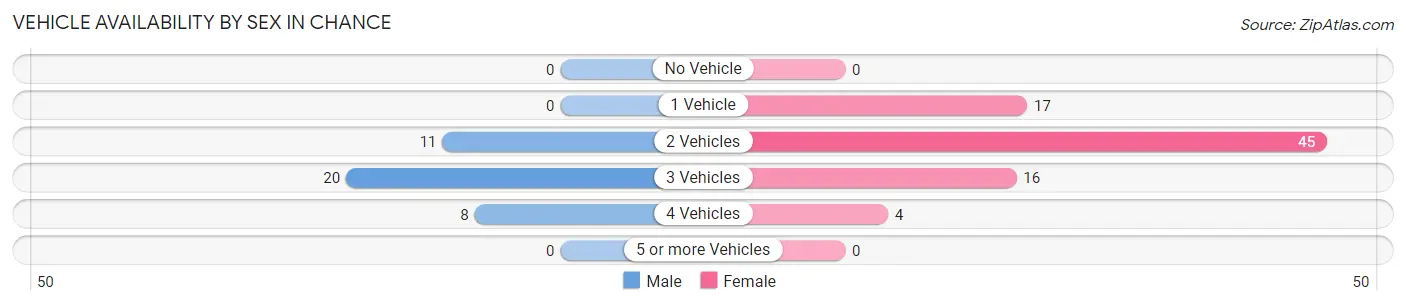
| Vehicles Available | Male | Female |
| No Vehicle | 0 (0.0%) | 0 (0.0%) |
| 1 Vehicle | 0 (0.0%) | 17 (20.7%) |
| 2 Vehicles | 11 (28.2%) | 45 (54.9%) |
| 3 Vehicles | 20 (51.3%) | 16 (19.5%) |
| 4 Vehicles | 8 (20.5%) | 4 (4.9%) |
| 5 or more Vehicles | 0 (0.0%) | 0 (0.0%) |
| Total | 39 (100.0%) | 82 (100.0%) |
Commute Time in Chance
The most frequently occuring commute durations in Chance are 45 to 59 minutes (33 commuters, 30.6%), 30 to 34 minutes (27 commuters, 25.0%), and 5 to 9 minutes (14 commuters, 13.0%).
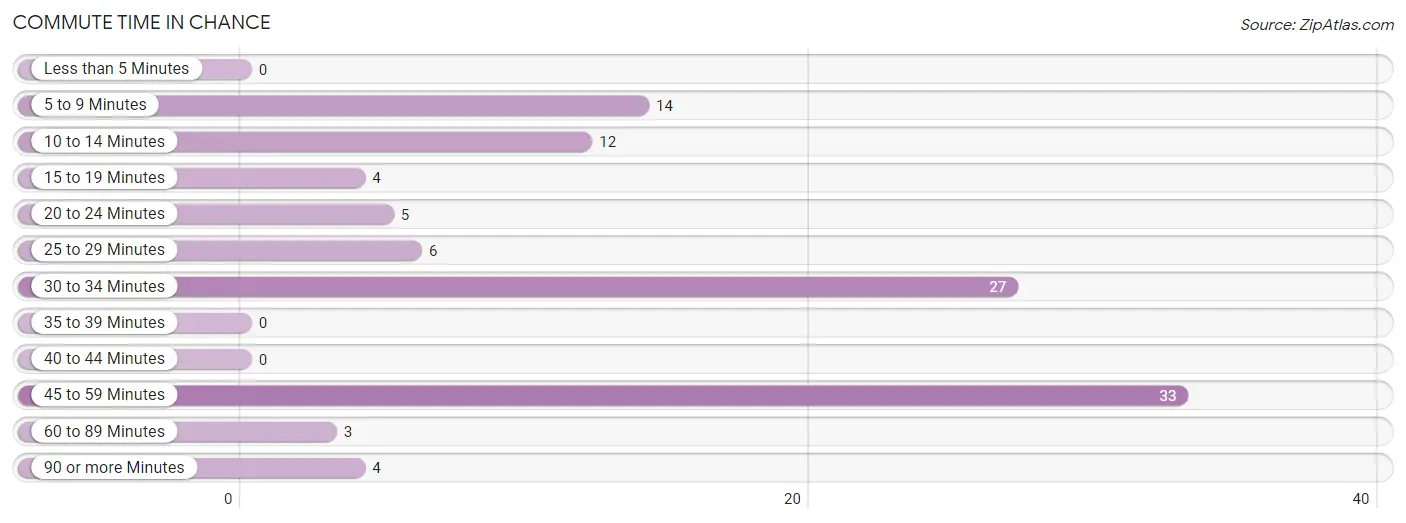
| Commute Time | # Commuters | % Commuters |
| Less than 5 Minutes | 0 | 0.0% |
| 5 to 9 Minutes | 14 | 13.0% |
| 10 to 14 Minutes | 12 | 11.1% |
| 15 to 19 Minutes | 4 | 3.7% |
| 20 to 24 Minutes | 5 | 4.6% |
| 25 to 29 Minutes | 6 | 5.6% |
| 30 to 34 Minutes | 27 | 25.0% |
| 35 to 39 Minutes | 0 | 0.0% |
| 40 to 44 Minutes | 0 | 0.0% |
| 45 to 59 Minutes | 33 | 30.6% |
| 60 to 89 Minutes | 3 | 2.8% |
| 90 or more Minutes | 4 | 3.7% |
Commute Time by Sex in Chance
The most common commute times in Chance are 45 to 59 minutes (21 commuters, 53.8%) for males and 30 to 34 minutes (22 commuters, 31.9%) for females.
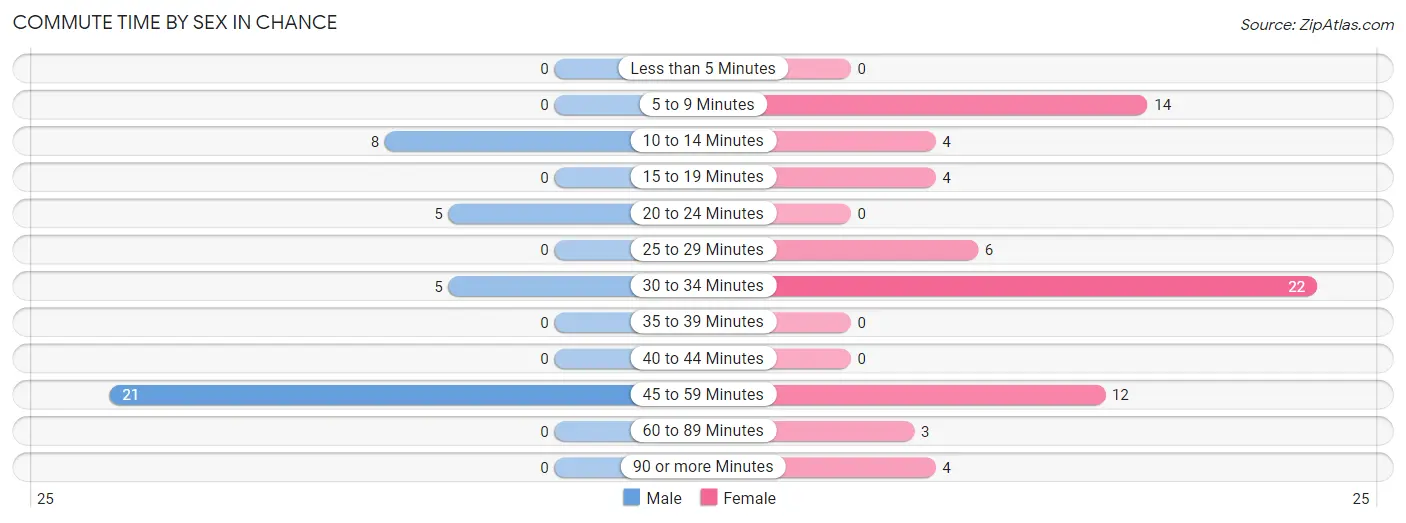
| Commute Time | Male | Female |
| Less than 5 Minutes | 0 (0.0%) | 0 (0.0%) |
| 5 to 9 Minutes | 0 (0.0%) | 14 (20.3%) |
| 10 to 14 Minutes | 8 (20.5%) | 4 (5.8%) |
| 15 to 19 Minutes | 0 (0.0%) | 4 (5.8%) |
| 20 to 24 Minutes | 5 (12.8%) | 0 (0.0%) |
| 25 to 29 Minutes | 0 (0.0%) | 6 (8.7%) |
| 30 to 34 Minutes | 5 (12.8%) | 22 (31.9%) |
| 35 to 39 Minutes | 0 (0.0%) | 0 (0.0%) |
| 40 to 44 Minutes | 0 (0.0%) | 0 (0.0%) |
| 45 to 59 Minutes | 21 (53.8%) | 12 (17.4%) |
| 60 to 89 Minutes | 0 (0.0%) | 3 (4.3%) |
| 90 or more Minutes | 0 (0.0%) | 4 (5.8%) |
Time of Departure to Work by Sex in Chance
The most frequent times of departure to work in Chance are 6:00 AM to 6:29 AM (16, 41.0%) for males and 7:30 AM to 7:59 AM (22, 31.9%) for females.
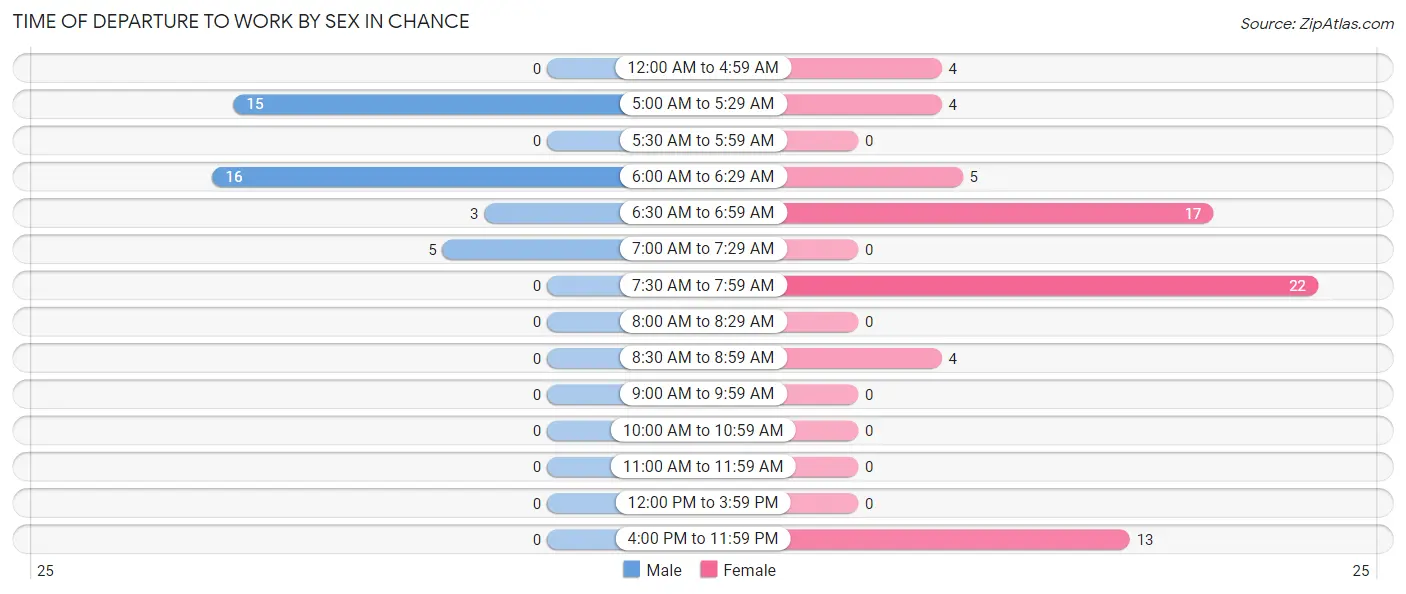
| Time of Departure | Male | Female |
| 12:00 AM to 4:59 AM | 0 (0.0%) | 4 (5.8%) |
| 5:00 AM to 5:29 AM | 15 (38.5%) | 4 (5.8%) |
| 5:30 AM to 5:59 AM | 0 (0.0%) | 0 (0.0%) |
| 6:00 AM to 6:29 AM | 16 (41.0%) | 5 (7.2%) |
| 6:30 AM to 6:59 AM | 3 (7.7%) | 17 (24.6%) |
| 7:00 AM to 7:29 AM | 5 (12.8%) | 0 (0.0%) |
| 7:30 AM to 7:59 AM | 0 (0.0%) | 22 (31.9%) |
| 8:00 AM to 8:29 AM | 0 (0.0%) | 0 (0.0%) |
| 8:30 AM to 8:59 AM | 0 (0.0%) | 4 (5.8%) |
| 9:00 AM to 9:59 AM | 0 (0.0%) | 0 (0.0%) |
| 10:00 AM to 10:59 AM | 0 (0.0%) | 0 (0.0%) |
| 11:00 AM to 11:59 AM | 0 (0.0%) | 0 (0.0%) |
| 12:00 PM to 3:59 PM | 0 (0.0%) | 0 (0.0%) |
| 4:00 PM to 11:59 PM | 0 (0.0%) | 13 (18.8%) |
| Total | 39 (100.0%) | 69 (100.0%) |
Housing Occupancy in Chance
Occupancy by Ownership in Chance
Of the total 127 dwellings in Chance, owner-occupied units account for 124 (97.6%), while renter-occupied units make up 3 (2.4%).
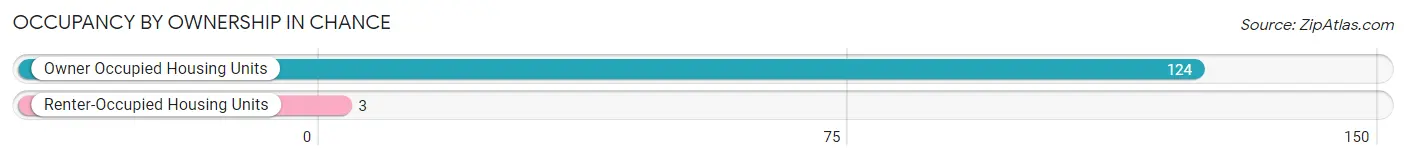
| Occupancy | # Housing Units | % Housing Units |
| Owner Occupied Housing Units | 124 | 97.6% |
| Renter-Occupied Housing Units | 3 | 2.4% |
| Total Occupied Housing Units | 127 | 100.0% |
Occupancy by Household Size in Chance
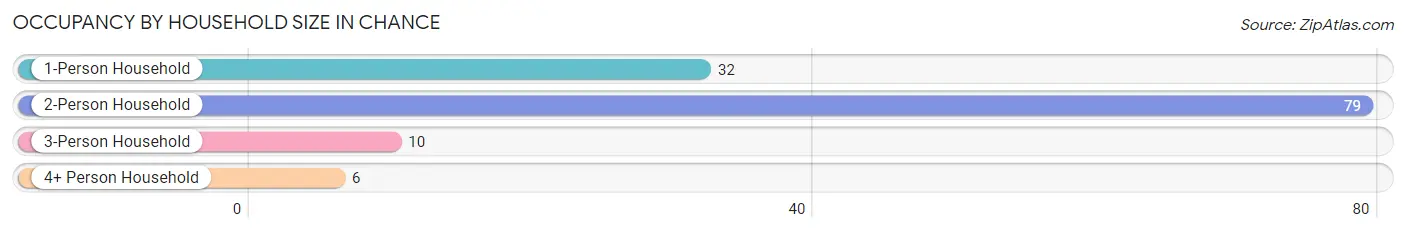
| Household Size | # Housing Units | % Housing Units |
| 1-Person Household | 32 | 25.2% |
| 2-Person Household | 79 | 62.2% |
| 3-Person Household | 10 | 7.9% |
| 4+ Person Household | 6 | 4.7% |
| Total Housing Units | 127 | 100.0% |
Occupancy by Ownership by Household Size in Chance
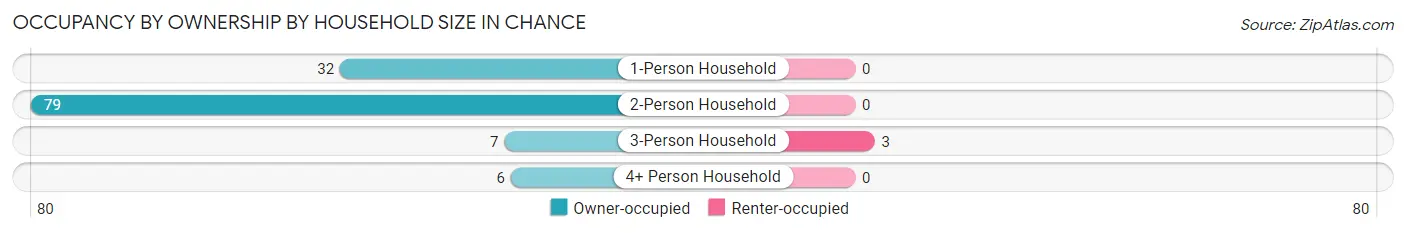
| Household Size | Owner-occupied | Renter-occupied |
| 1-Person Household | 32 (100.0%) | 0 (0.0%) |
| 2-Person Household | 79 (100.0%) | 0 (0.0%) |
| 3-Person Household | 7 (70.0%) | 3 (30.0%) |
| 4+ Person Household | 6 (100.0%) | 0 (0.0%) |
| Total Housing Units | 124 (97.6%) | 3 (2.4%) |
Occupancy by Educational Attainment in Chance
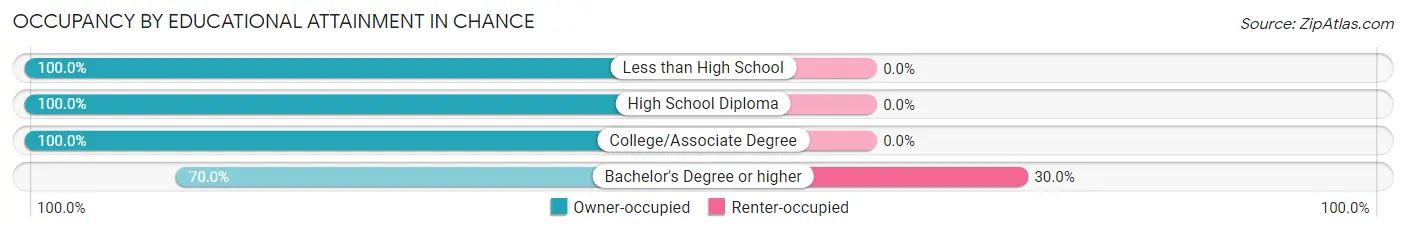
| Household Size | Owner-occupied | Renter-occupied |
| Less than High School | 27 (100.0%) | 0 (0.0%) |
| High School Diploma | 36 (100.0%) | 0 (0.0%) |
| College/Associate Degree | 54 (100.0%) | 0 (0.0%) |
| Bachelor's Degree or higher | 7 (70.0%) | 3 (30.0%) |
Occupancy by Age of Householder in Chance
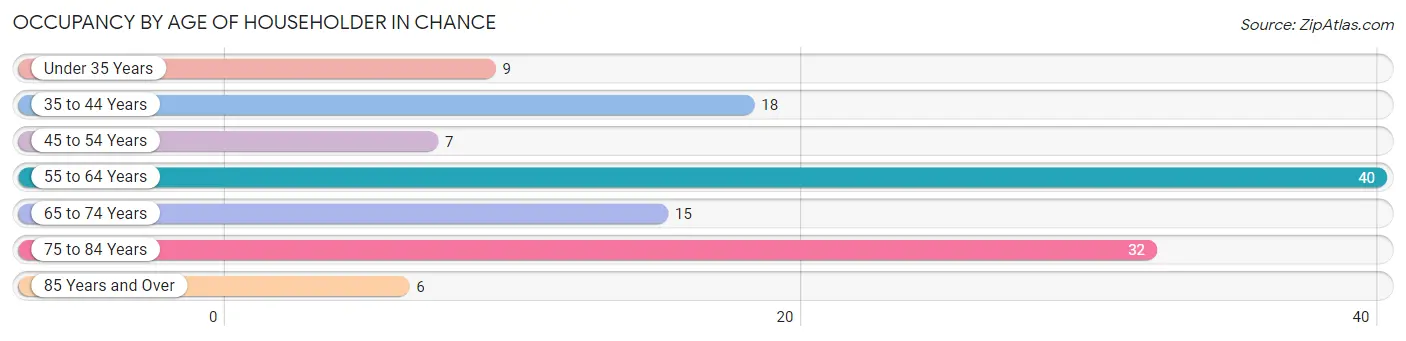
| Age Bracket | # Households | % Households |
| Under 35 Years | 9 | 7.1% |
| 35 to 44 Years | 18 | 14.2% |
| 45 to 54 Years | 7 | 5.5% |
| 55 to 64 Years | 40 | 31.5% |
| 65 to 74 Years | 15 | 11.8% |
| 75 to 84 Years | 32 | 25.2% |
| 85 Years and Over | 6 | 4.7% |
| Total | 127 | 100.0% |
Housing Finances in Chance
Median Income by Occupancy in Chance
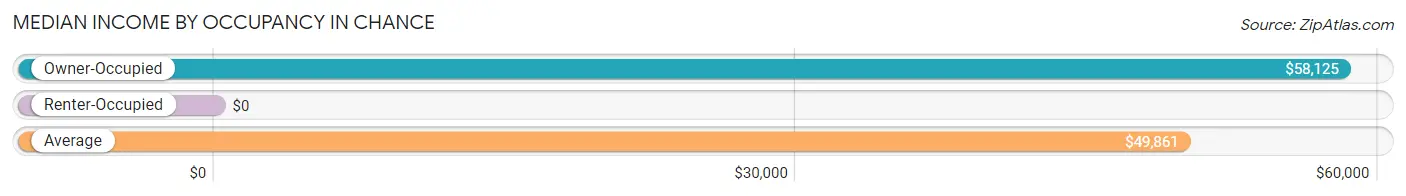
| Occupancy Type | # Households | Median Income |
| Owner-Occupied | 124 (97.6%) | $58,125 |
| Renter-Occupied | 3 (2.4%) | $0 |
| Average | 127 (100.0%) | $49,861 |
Occupancy by Householder Income Bracket in Chance
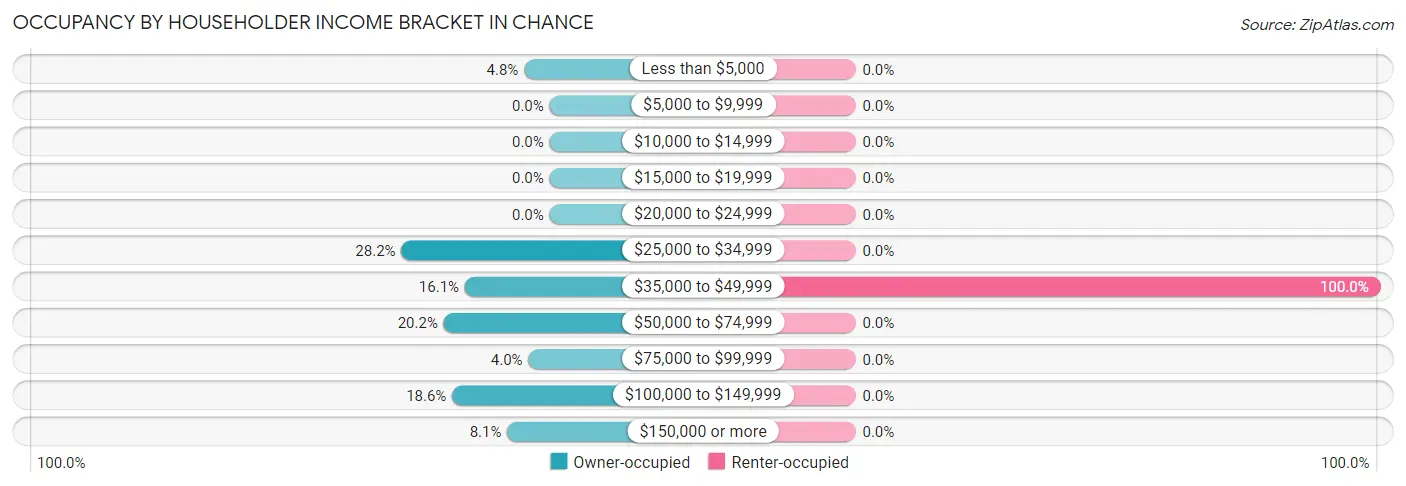
| Income Bracket | Owner-occupied | Renter-occupied |
| Less than $5,000 | 6 (4.8%) | 0 (0.0%) |
| $5,000 to $9,999 | 0 (0.0%) | 0 (0.0%) |
| $10,000 to $14,999 | 0 (0.0%) | 0 (0.0%) |
| $15,000 to $19,999 | 0 (0.0%) | 0 (0.0%) |
| $20,000 to $24,999 | 0 (0.0%) | 0 (0.0%) |
| $25,000 to $34,999 | 35 (28.2%) | 0 (0.0%) |
| $35,000 to $49,999 | 20 (16.1%) | 3 (100.0%) |
| $50,000 to $74,999 | 25 (20.2%) | 0 (0.0%) |
| $75,000 to $99,999 | 5 (4.0%) | 0 (0.0%) |
| $100,000 to $149,999 | 23 (18.5%) | 0 (0.0%) |
| $150,000 or more | 10 (8.1%) | 0 (0.0%) |
| Total | 124 (100.0%) | 3 (100.0%) |
Monthly Housing Cost Tiers in Chance
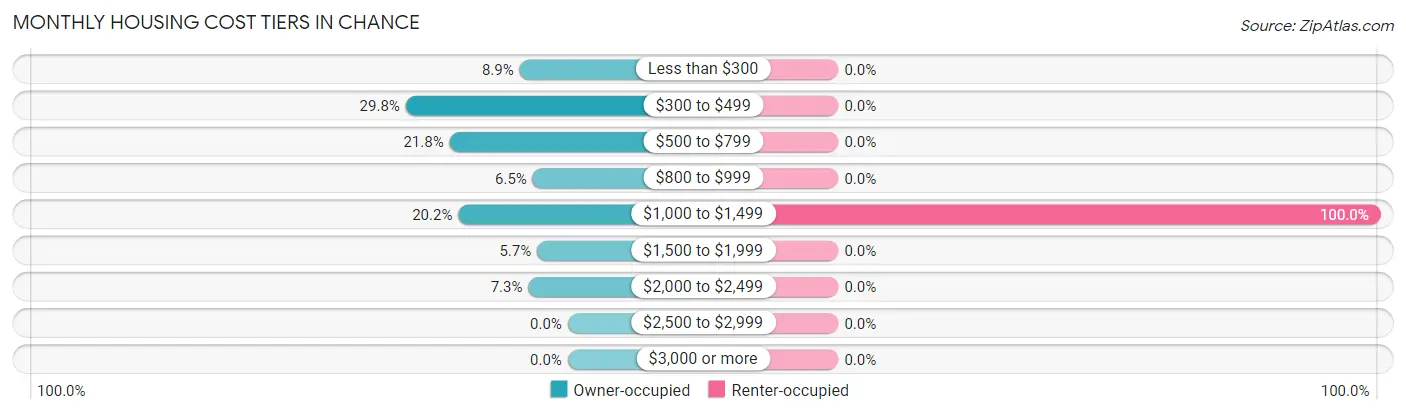
| Monthly Cost | Owner-occupied | Renter-occupied |
| Less than $300 | 11 (8.9%) | 0 (0.0%) |
| $300 to $499 | 37 (29.8%) | 0 (0.0%) |
| $500 to $799 | 27 (21.8%) | 0 (0.0%) |
| $800 to $999 | 8 (6.5%) | 0 (0.0%) |
| $1,000 to $1,499 | 25 (20.2%) | 3 (100.0%) |
| $1,500 to $1,999 | 7 (5.7%) | 0 (0.0%) |
| $2,000 to $2,499 | 9 (7.3%) | 0 (0.0%) |
| $2,500 to $2,999 | 0 (0.0%) | 0 (0.0%) |
| $3,000 or more | 0 (0.0%) | 0 (0.0%) |
| Total | 124 (100.0%) | 3 (100.0%) |
Physical Housing Characteristics in Chance
Housing Structures in Chance
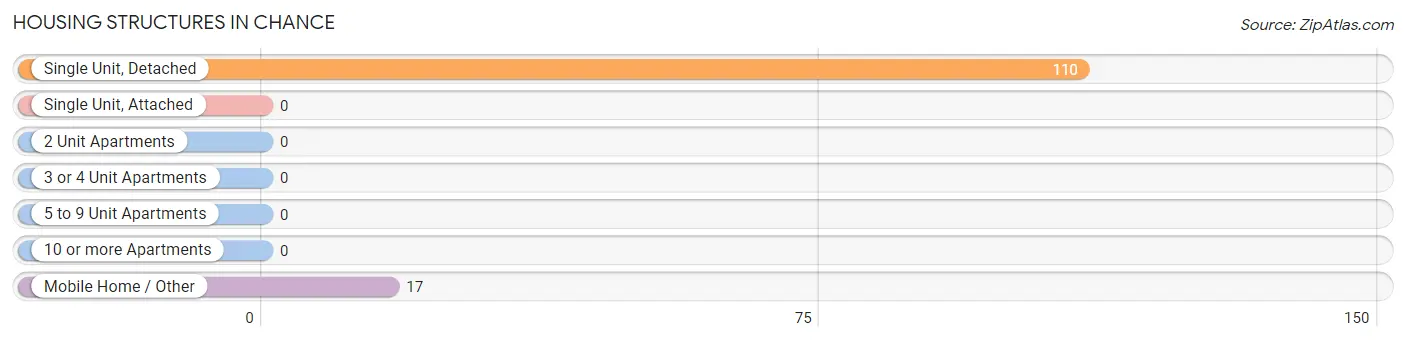
| Structure Type | # Housing Units | % Housing Units |
| Single Unit, Detached | 110 | 86.6% |
| Single Unit, Attached | 0 | 0.0% |
| 2 Unit Apartments | 0 | 0.0% |
| 3 or 4 Unit Apartments | 0 | 0.0% |
| 5 to 9 Unit Apartments | 0 | 0.0% |
| 10 or more Apartments | 0 | 0.0% |
| Mobile Home / Other | 17 | 13.4% |
| Total | 127 | 100.0% |
Housing Structures by Occupancy in Chance
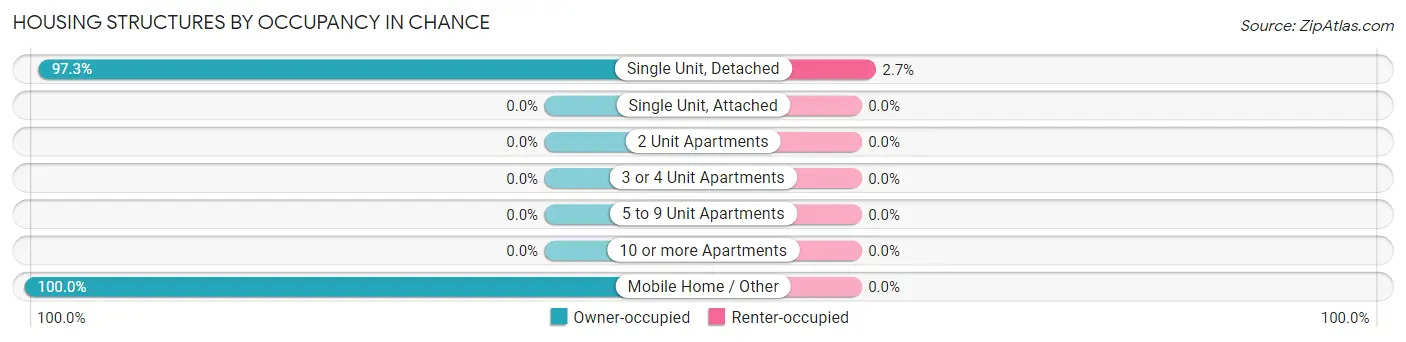
| Structure Type | Owner-occupied | Renter-occupied |
| Single Unit, Detached | 107 (97.3%) | 3 (2.7%) |
| Single Unit, Attached | 0 (0.0%) | 0 (0.0%) |
| 2 Unit Apartments | 0 (0.0%) | 0 (0.0%) |
| 3 or 4 Unit Apartments | 0 (0.0%) | 0 (0.0%) |
| 5 to 9 Unit Apartments | 0 (0.0%) | 0 (0.0%) |
| 10 or more Apartments | 0 (0.0%) | 0 (0.0%) |
| Mobile Home / Other | 17 (100.0%) | 0 (0.0%) |
| Total | 124 (97.6%) | 3 (2.4%) |
Housing Structures by Number of Rooms in Chance
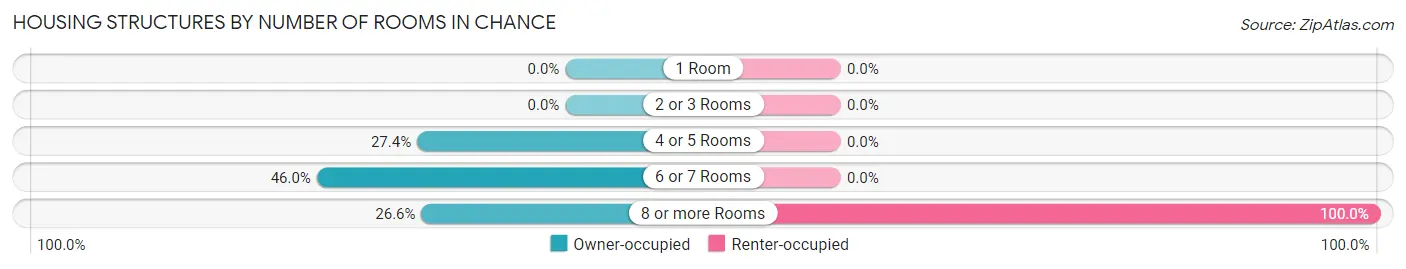
| Number of Rooms | Owner-occupied | Renter-occupied |
| 1 Room | 0 (0.0%) | 0 (0.0%) |
| 2 or 3 Rooms | 0 (0.0%) | 0 (0.0%) |
| 4 or 5 Rooms | 34 (27.4%) | 0 (0.0%) |
| 6 or 7 Rooms | 57 (46.0%) | 0 (0.0%) |
| 8 or more Rooms | 33 (26.6%) | 3 (100.0%) |
| Total | 124 (100.0%) | 3 (100.0%) |
Housing Structure by Heating Type in Chance
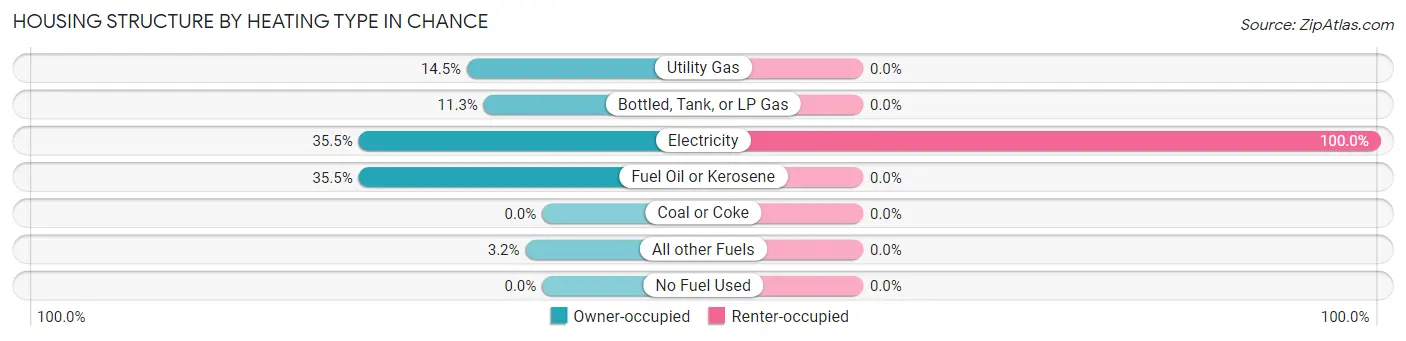
| Heating Type | Owner-occupied | Renter-occupied |
| Utility Gas | 18 (14.5%) | 0 (0.0%) |
| Bottled, Tank, or LP Gas | 14 (11.3%) | 0 (0.0%) |
| Electricity | 44 (35.5%) | 3 (100.0%) |
| Fuel Oil or Kerosene | 44 (35.5%) | 0 (0.0%) |
| Coal or Coke | 0 (0.0%) | 0 (0.0%) |
| All other Fuels | 4 (3.2%) | 0 (0.0%) |
| No Fuel Used | 0 (0.0%) | 0 (0.0%) |
| Total | 124 (100.0%) | 3 (100.0%) |
Household Vehicle Usage in Chance
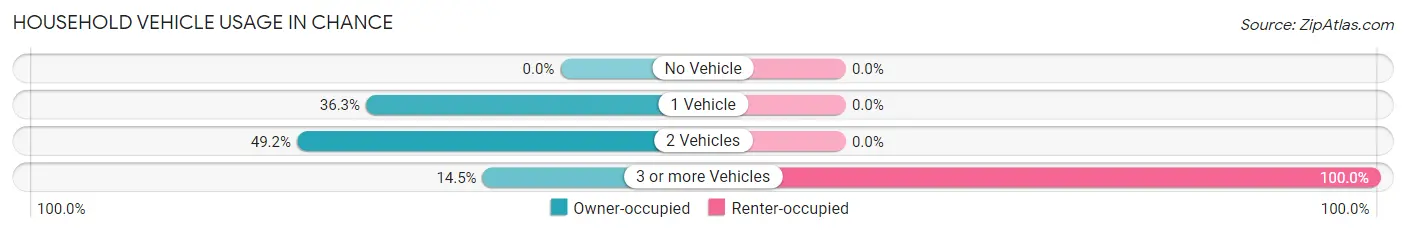
| Vehicles per Household | Owner-occupied | Renter-occupied |
| No Vehicle | 0 (0.0%) | 0 (0.0%) |
| 1 Vehicle | 45 (36.3%) | 0 (0.0%) |
| 2 Vehicles | 61 (49.2%) | 0 (0.0%) |
| 3 or more Vehicles | 18 (14.5%) | 3 (100.0%) |
| Total | 124 (100.0%) | 3 (100.0%) |
Real Estate & Mortgages in Chance
Real Estate and Mortgage Overview in Chance
| Characteristic | Without Mortgage | With Mortgage |
| Housing Units | 77 | 47 |
| Median Property Value | $263,200 | $164,800 |
| Median Household Income | $40,568 | $10 |
| Monthly Housing Costs | $455 | $0 |
| Real Estate Taxes | $3,047 | $0 |
Property Value by Mortgage Status in Chance
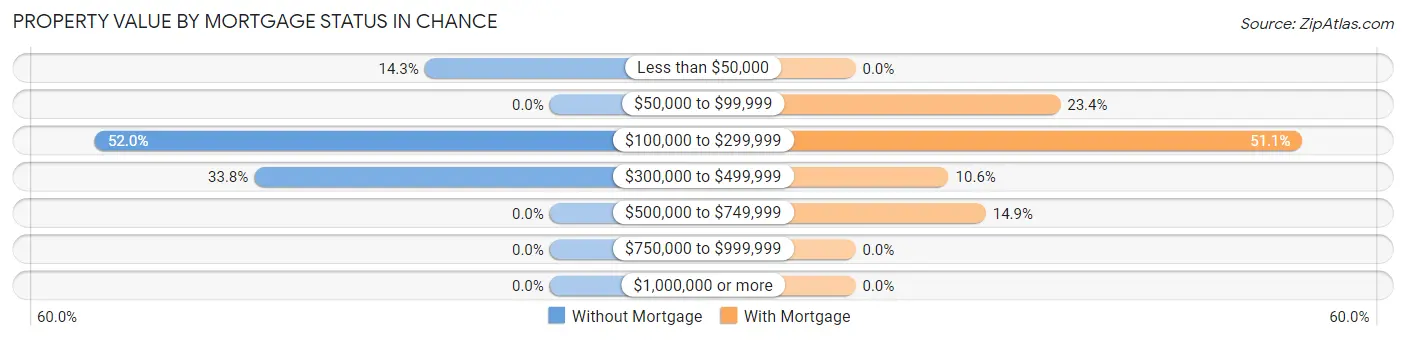
| Property Value | Without Mortgage | With Mortgage |
| Less than $50,000 | 11 (14.3%) | 0 (0.0%) |
| $50,000 to $99,999 | 0 (0.0%) | 11 (23.4%) |
| $100,000 to $299,999 | 40 (51.9%) | 24 (51.1%) |
| $300,000 to $499,999 | 26 (33.8%) | 5 (10.6%) |
| $500,000 to $749,999 | 0 (0.0%) | 7 (14.9%) |
| $750,000 to $999,999 | 0 (0.0%) | 0 (0.0%) |
| $1,000,000 or more | 0 (0.0%) | 0 (0.0%) |
| Total | 77 (100.0%) | 47 (100.0%) |
Household Income by Mortgage Status in Chance
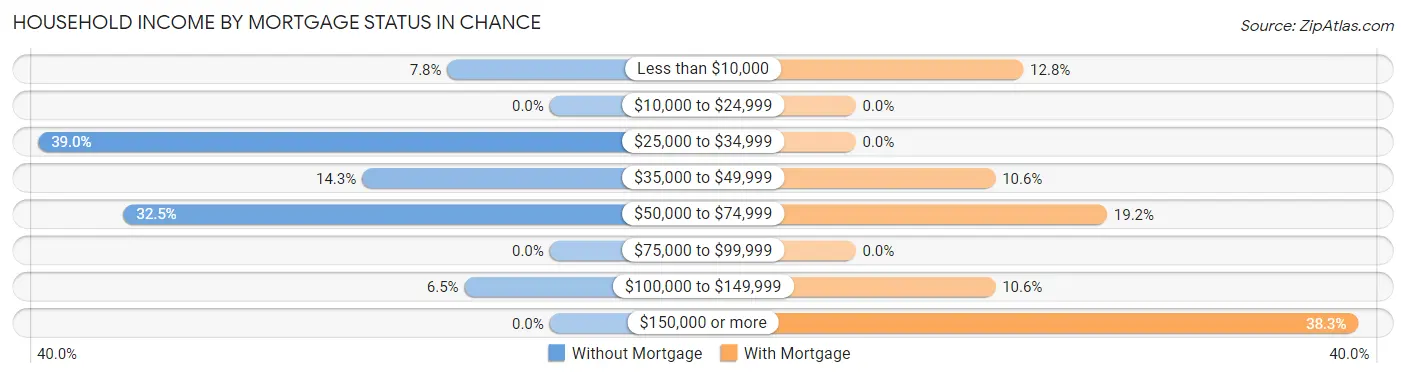
| Household Income | Without Mortgage | With Mortgage |
| Less than $10,000 | 6 (7.8%) | 6 (12.8%) |
| $10,000 to $24,999 | 0 (0.0%) | 0 (0.0%) |
| $25,000 to $34,999 | 30 (39.0%) | 0 (0.0%) |
| $35,000 to $49,999 | 11 (14.3%) | 5 (10.6%) |
| $50,000 to $74,999 | 25 (32.5%) | 9 (19.2%) |
| $75,000 to $99,999 | 0 (0.0%) | 0 (0.0%) |
| $100,000 to $149,999 | 5 (6.5%) | 5 (10.6%) |
| $150,000 or more | 0 (0.0%) | 18 (38.3%) |
| Total | 77 (100.0%) | 47 (100.0%) |
Property Value to Household Income Ratio in Chance
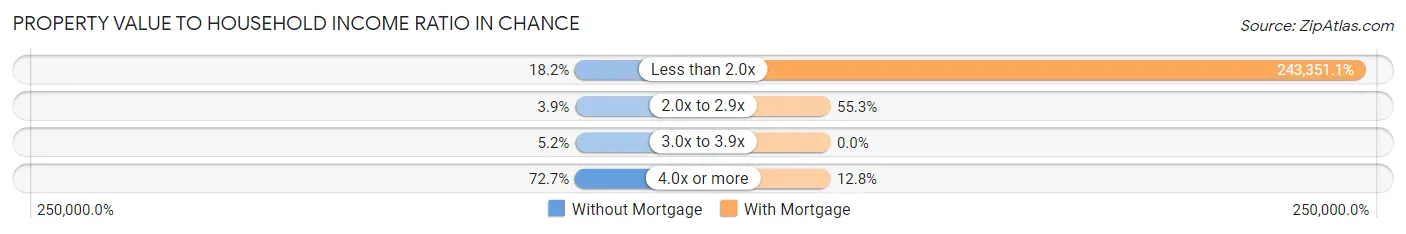
| Value-to-Income Ratio | Without Mortgage | With Mortgage |
| Less than 2.0x | 14 (18.2%) | 114,375 (243,351.1%) |
| 2.0x to 2.9x | 3 (3.9%) | 26 (55.3%) |
| 3.0x to 3.9x | 4 (5.2%) | 0 (0.0%) |
| 4.0x or more | 56 (72.7%) | 6 (12.8%) |
| Total | 77 (100.0%) | 47 (100.0%) |
Real Estate Taxes by Mortgage Status in Chance
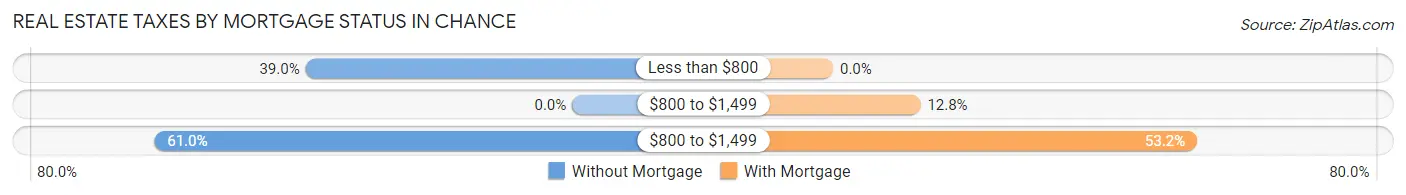
| Property Taxes | Without Mortgage | With Mortgage |
| Less than $800 | 30 (39.0%) | 0 (0.0%) |
| $800 to $1,499 | 0 (0.0%) | 6 (12.8%) |
| $800 to $1,499 | 47 (61.0%) | 25 (53.2%) |
| Total | 77 (100.0%) | 47 (100.0%) |
Health & Disability in Chance
Health Insurance Coverage by Age in Chance
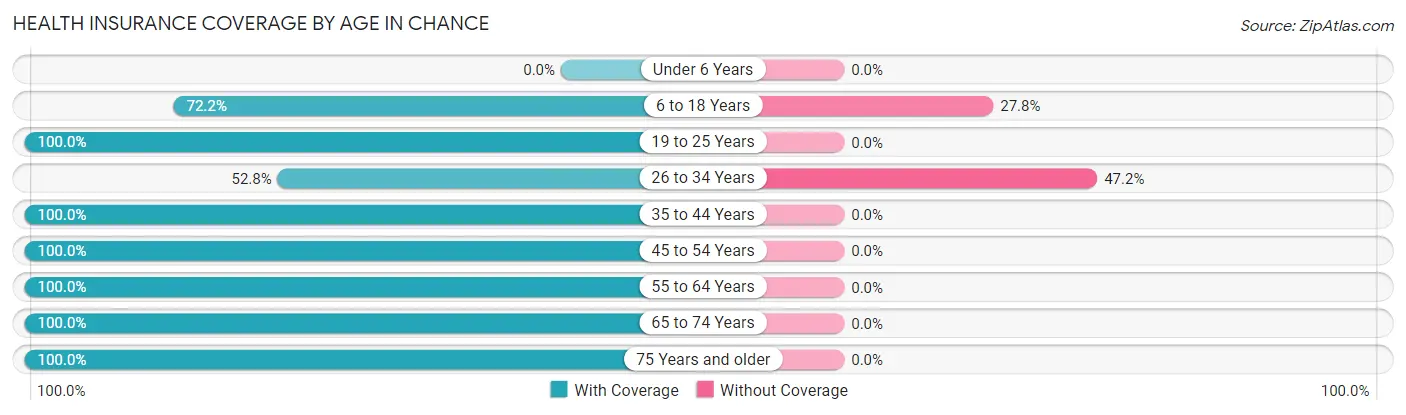
| Age Bracket | With Coverage | Without Coverage |
| Under 6 Years | 0 (0.0%) | 0 (0.0%) |
| 6 to 18 Years | 13 (72.2%) | 5 (27.8%) |
| 19 to 25 Years | 7 (100.0%) | 0 (0.0%) |
| 26 to 34 Years | 28 (52.8%) | 25 (47.2%) |
| 35 to 44 Years | 34 (100.0%) | 0 (0.0%) |
| 45 to 54 Years | 16 (100.0%) | 0 (0.0%) |
| 55 to 64 Years | 65 (100.0%) | 0 (0.0%) |
| 65 to 74 Years | 22 (100.0%) | 0 (0.0%) |
| 75 Years and older | 52 (100.0%) | 0 (0.0%) |
| Total | 237 (88.8%) | 30 (11.2%) |
Health Insurance Coverage by Citizenship Status in Chance
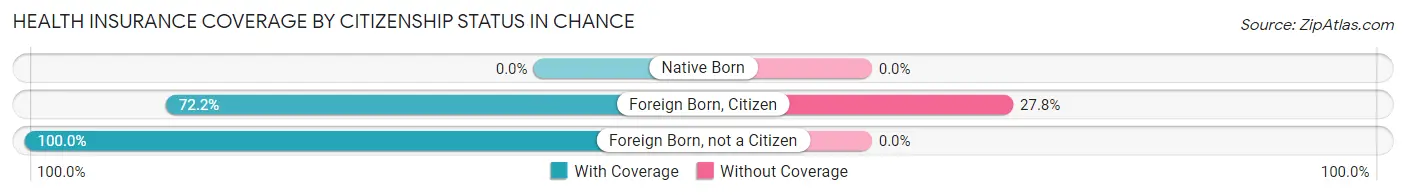
| Citizenship Status | With Coverage | Without Coverage |
| Native Born | 0 (0.0%) | 0 (0.0%) |
| Foreign Born, Citizen | 13 (72.2%) | 5 (27.8%) |
| Foreign Born, not a Citizen | 7 (100.0%) | 0 (0.0%) |
Health Insurance Coverage by Household Income in Chance
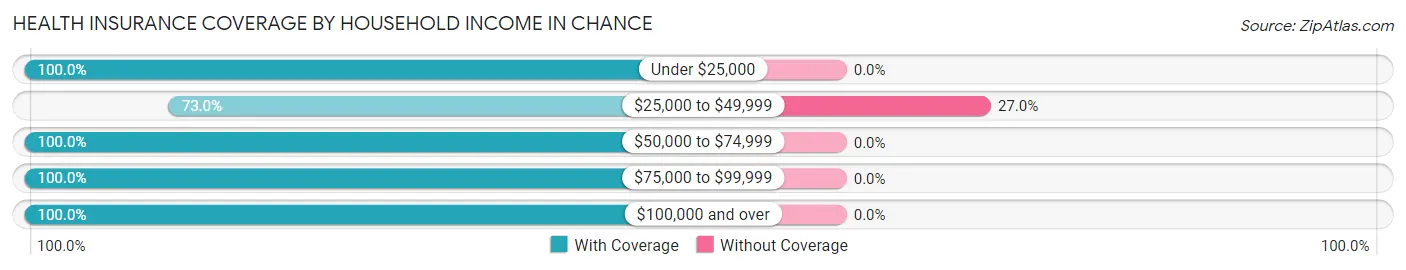
| Household Income | With Coverage | Without Coverage |
| Under $25,000 | 6 (100.0%) | 0 (0.0%) |
| $25,000 to $49,999 | 81 (73.0%) | 30 (27.0%) |
| $50,000 to $74,999 | 47 (100.0%) | 0 (0.0%) |
| $75,000 to $99,999 | 10 (100.0%) | 0 (0.0%) |
| $100,000 and over | 93 (100.0%) | 0 (0.0%) |
Public vs Private Health Insurance Coverage by Age in Chance
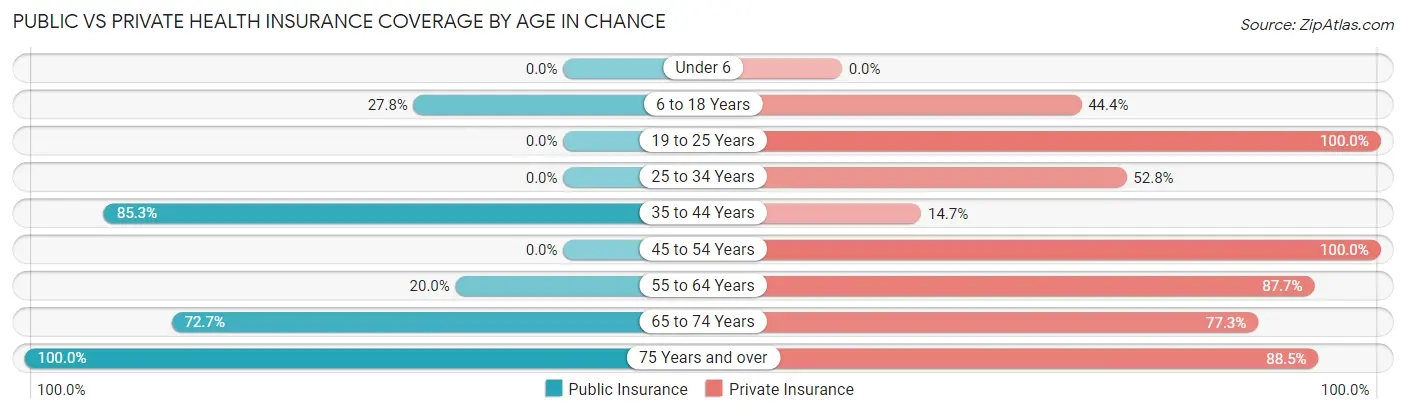
| Age Bracket | Public Insurance | Private Insurance |
| Under 6 | 0 (0.0%) | 0 (0.0%) |
| 6 to 18 Years | 5 (27.8%) | 8 (44.4%) |
| 19 to 25 Years | 0 (0.0%) | 7 (100.0%) |
| 25 to 34 Years | 0 (0.0%) | 28 (52.8%) |
| 35 to 44 Years | 29 (85.3%) | 5 (14.7%) |
| 45 to 54 Years | 0 (0.0%) | 16 (100.0%) |
| 55 to 64 Years | 13 (20.0%) | 57 (87.7%) |
| 65 to 74 Years | 16 (72.7%) | 17 (77.3%) |
| 75 Years and over | 52 (100.0%) | 46 (88.5%) |
| Total | 115 (43.1%) | 184 (68.9%) |
Disability Status by Sex by Age in Chance
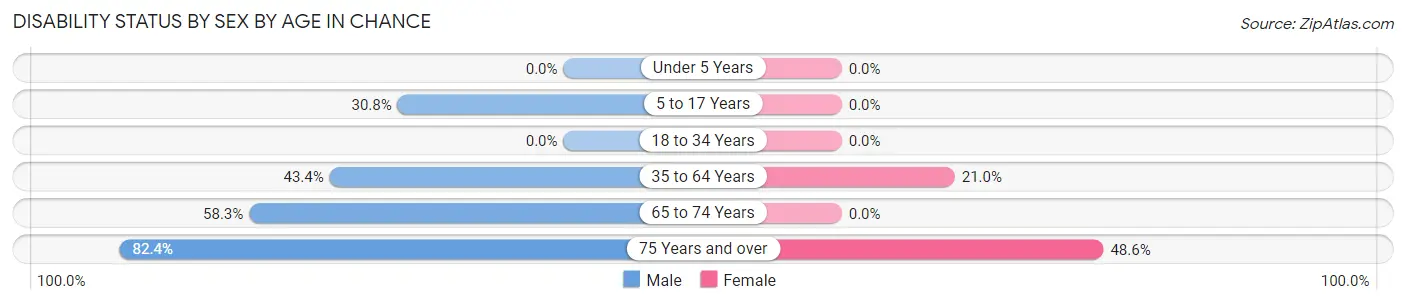
| Age Bracket | Male | Female |
| Under 5 Years | 0 (0.0%) | 0 (0.0%) |
| 5 to 17 Years | 4 (30.8%) | 0 (0.0%) |
| 18 to 34 Years | 0 (0.0%) | 0 (0.0%) |
| 35 to 64 Years | 23 (43.4%) | 13 (21.0%) |
| 65 to 74 Years | 7 (58.3%) | 0 (0.0%) |
| 75 Years and over | 14 (82.4%) | 17 (48.6%) |
Disability Class by Sex by Age in Chance
Disability Class: Hearing Difficulty
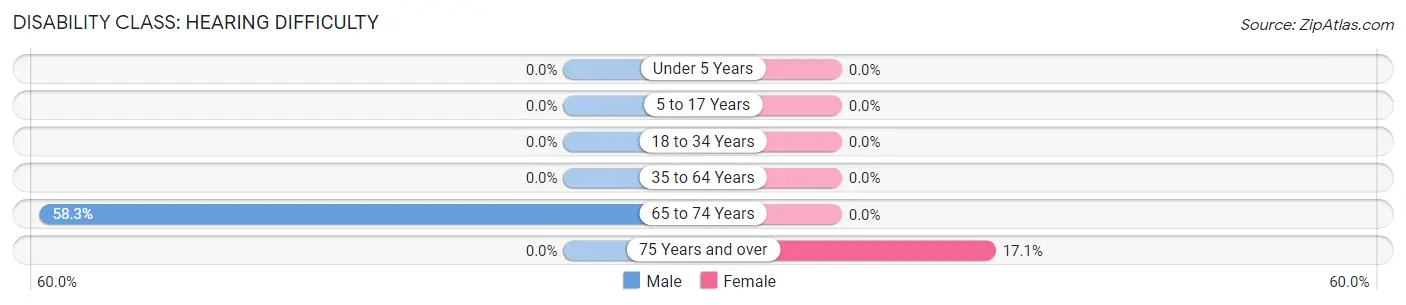
| Age Bracket | Male | Female |
| Under 5 Years | 0 (0.0%) | 0 (0.0%) |
| 5 to 17 Years | 0 (0.0%) | 0 (0.0%) |
| 18 to 34 Years | 0 (0.0%) | 0 (0.0%) |
| 35 to 64 Years | 0 (0.0%) | 0 (0.0%) |
| 65 to 74 Years | 7 (58.3%) | 0 (0.0%) |
| 75 Years and over | 0 (0.0%) | 6 (17.1%) |
Disability Class: Vision Difficulty
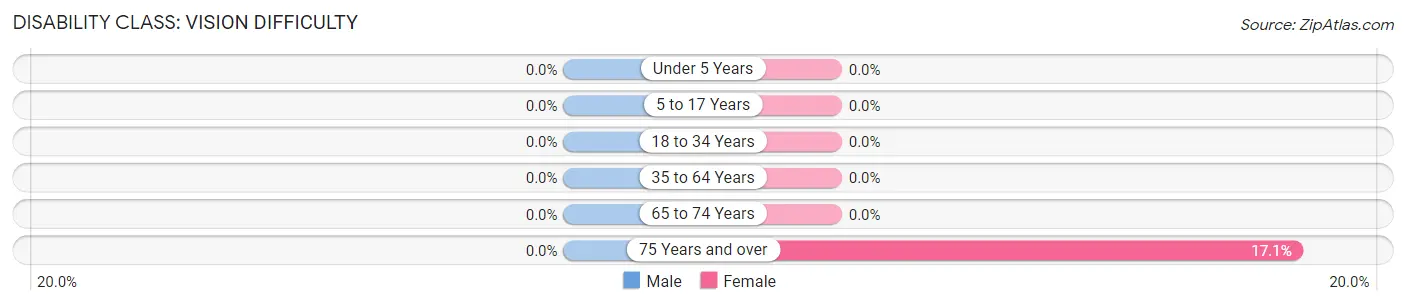
| Age Bracket | Male | Female |
| Under 5 Years | 0 (0.0%) | 0 (0.0%) |
| 5 to 17 Years | 0 (0.0%) | 0 (0.0%) |
| 18 to 34 Years | 0 (0.0%) | 0 (0.0%) |
| 35 to 64 Years | 0 (0.0%) | 0 (0.0%) |
| 65 to 74 Years | 0 (0.0%) | 0 (0.0%) |
| 75 Years and over | 0 (0.0%) | 6 (17.1%) |
Disability Class: Cognitive Difficulty
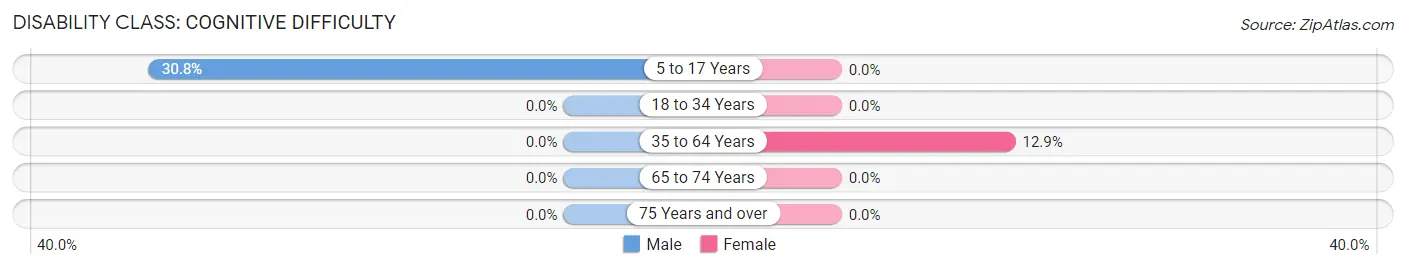
| Age Bracket | Male | Female |
| 5 to 17 Years | 4 (30.8%) | 0 (0.0%) |
| 18 to 34 Years | 0 (0.0%) | 0 (0.0%) |
| 35 to 64 Years | 0 (0.0%) | 8 (12.9%) |
| 65 to 74 Years | 0 (0.0%) | 0 (0.0%) |
| 75 Years and over | 0 (0.0%) | 0 (0.0%) |
Disability Class: Ambulatory Difficulty
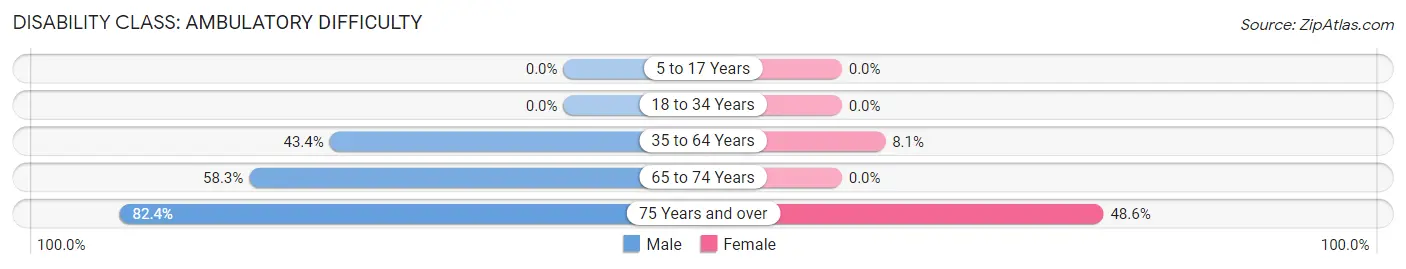
| Age Bracket | Male | Female |
| 5 to 17 Years | 0 (0.0%) | 0 (0.0%) |
| 18 to 34 Years | 0 (0.0%) | 0 (0.0%) |
| 35 to 64 Years | 23 (43.4%) | 5 (8.1%) |
| 65 to 74 Years | 7 (58.3%) | 0 (0.0%) |
| 75 Years and over | 14 (82.4%) | 17 (48.6%) |
Disability Class: Self-Care Difficulty
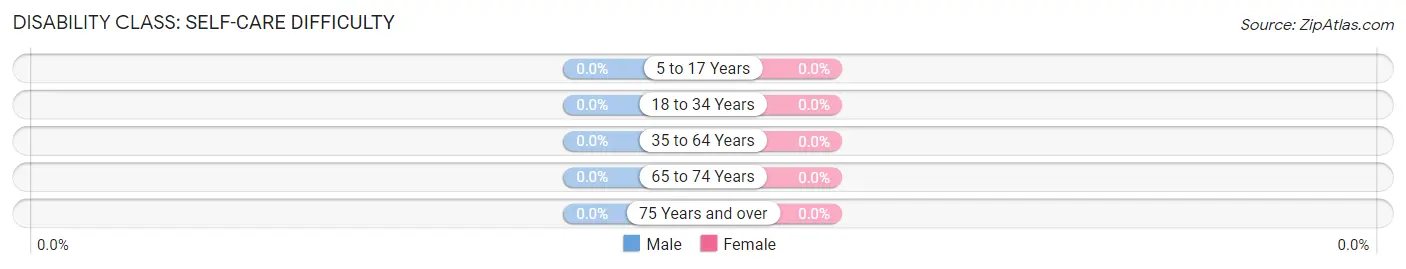
| Age Bracket | Male | Female |
| 5 to 17 Years | 0 (0.0%) | 0 (0.0%) |
| 18 to 34 Years | 0 (0.0%) | 0 (0.0%) |
| 35 to 64 Years | 0 (0.0%) | 0 (0.0%) |
| 65 to 74 Years | 0 (0.0%) | 0 (0.0%) |
| 75 Years and over | 0 (0.0%) | 0 (0.0%) |
Technology Access in Chance
Computing Device Access in Chance
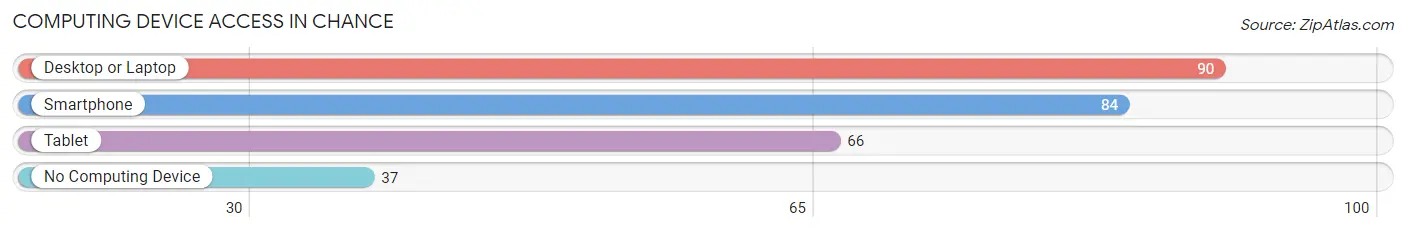
| Device Type | # Households | % Households |
| Desktop or Laptop | 90 | 70.9% |
| Smartphone | 84 | 66.1% |
| Tablet | 66 | 52.0% |
| No Computing Device | 37 | 29.1% |
| Total | 127 | 100.0% |
Internet Access in Chance
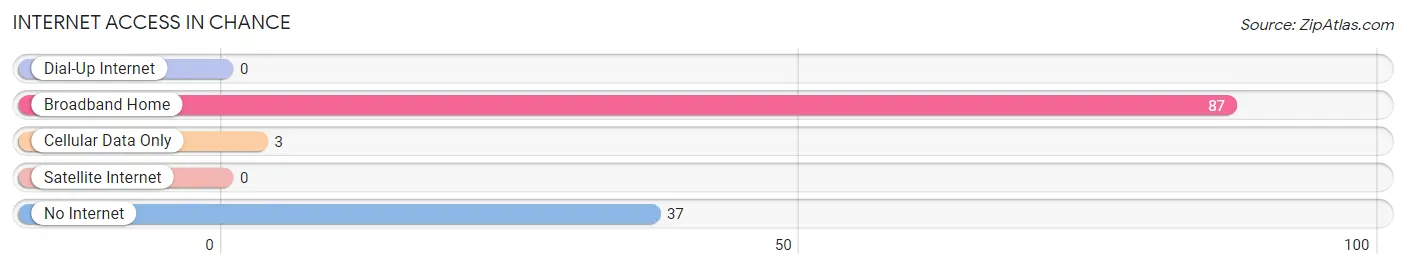
| Internet Type | # Households | % Households |
| Dial-Up Internet | 0 | 0.0% |
| Broadband Home | 87 | 68.5% |
| Cellular Data Only | 3 | 2.4% |
| Satellite Internet | 0 | 0.0% |
| No Internet | 37 | 29.1% |
| Total | 127 | 100.0% |
Chance Summary
The state of Maryland is located in the Mid-Atlantic region of the United States and is bordered by Virginia, West Virginia, Pennsylvania, Delaware, and Washington, D.C. It is the 42nd most populous state in the country, with a population of 6,016,447 as of 2019.
Geography
Maryland is divided into two distinct regions: the Eastern Shore and the Western Shore. The Eastern Shore is located on the Delmarva Peninsula and is bordered by the Chesapeake Bay and the Atlantic Ocean. It is home to the cities of Salisbury, Cambridge, and Ocean City. The Western Shore is located on the mainland and is bordered by Pennsylvania and West Virginia. It is home to the cities of Baltimore, Annapolis, and Frederick.
The state is divided into 23 counties and Baltimore City. The largest county by population is Montgomery County, with 1,050,688 residents. The smallest county by population is Kent County, with 20,197 residents.
The highest point in Maryland is Hoye-Crest, located in Garrett County, at 3,360 feet above sea level. The lowest point in Maryland is sea level, located along the Atlantic Ocean.
History
Maryland was founded in 1634 as a British colony. It was named after Queen Henrietta Maria, the wife of King Charles I of England. The colony was founded by George Calvert, the first Lord Baltimore, and was intended to be a refuge for English Catholics.
The colony was initially successful, but it was eventually taken over by the British during the American Revolution. After the war, Maryland became one of the original 13 states of the United States.
Economy
Maryland has a diverse economy, with a strong focus on technology, manufacturing, and services. The state is home to several Fortune 500 companies, including Lockheed Martin, Marriott International, and Under Armour.
The state’s largest industries are manufacturing, health care, and government. The state’s largest employers are the University of Maryland Medical System, Johns Hopkins University, and the U.S. Department of Defense.
Demographics
As of 2019, the population of Maryland was 6,016,447. The state is racially diverse, with a population that is 60.2% white, 29.2% black, 8.2% Hispanic, and 2.4% Asian.
The median household income in Maryland is $80,776, and the median home value is $320,000. The state’s poverty rate is 9.2%.
Conclusion
Maryland is a diverse state with a rich history and a strong economy. It is home to several Fortune 500 companies and is a major hub for technology, manufacturing, and services. The state is racially diverse, with a population that is 60.2% white, 29.2% black, 8.2% Hispanic, and 2.4% Asian. The median household income in Maryland is $80,776, and the median home value is $320,000.
Common Questions
What is Per Capita Income in Chance?
Per Capita income in Chance is $34,386.
What is the Median Family Income in Chance?
Median Family Income in Chance is $61,181.
What is the Median Household income in Chance?
Median Household Income in Chance is $49,861.
What is Income or Wage Gap in Chance?
Income or Wage Gap in Chance is 10.0%.
Women in Chance earn 90.0 cents for every dollar earned by a man.
What is Inequality or Gini Index in Chance?
Inequality or Gini Index in Chance is 0.37.
What is the Total Population of Chance?
Total Population of Chance is 267.
What is the Total Male Population of Chance?
Total Male Population of Chance is 120.
What is the Total Female Population of Chance?
Total Female Population of Chance is 147.
What is the Ratio of Males per 100 Females in Chance?
There are 81.63 Males per 100 Females in Chance.
What is the Ratio of Females per 100 Males in Chance?
There are 122.50 Females per 100 Males in Chance.
What is the Median Population Age in Chance?
Median Population Age in Chance is 56.4 Years.
What is the Average Family Size in Chance
Average Family Size in Chance is 2.5 People.
What is the Average Household Size in Chance
Average Household Size in Chance is 2.1 People.
How Large is the Labor Force in Chance?
There are 141 People in the Labor Forcein in Chance.
What is the Percentage of People in the Labor Force in Chance?
55.5% of People are in the Labor Force in Chance.
What is the Unemployment Rate in Chance?
Unemployment Rate in Chance is 14.2%.