Bartonsville, MD Map & Demographics
Bartonsville Map
Bartonsville Overview
$57,209
PER CAPITA INCOME
$146,985
AVG FAMILY INCOME
$131,789
AVG HOUSEHOLD INCOME
28.9%
WAGE / INCOME GAP [ % ]
71.1¢/ $1
WAGE / INCOME GAP [ $ ]
0.35
INEQUALITY / GINI INDEX
2,373
TOTAL POPULATION
1,120
MALE POPULATION
1,253
FEMALE POPULATION
89.39
MALES / 100 FEMALES
111.88
FEMALES / 100 MALES
35.9
MEDIAN AGE
3.1
AVG FAMILY SIZE
3.1
AVG HOUSEHOLD SIZE
1,400
LABOR FORCE [ PEOPLE ]
80.7%
PERCENT IN LABOR FORCE
2.5%
UNEMPLOYMENT RATE
Income in Bartonsville
Income Overview in Bartonsville
Per Capita Income in Bartonsville is $57,209, while median incomes of families and households are $146,985 and $131,789 respectively.
| Characteristic | Number | Measure |
| Per Capita Income | 2,373 | $57,209 |
| Median Family Income | 691 | $146,985 |
| Mean Family Income | 691 | $189,196 |
| Median Household Income | 773 | $131,789 |
| Mean Household Income | 773 | $180,365 |
| Income Deficit | 691 | $0 |
| Wage / Income Gap (%) | 2,373 | 28.88% |
| Wage / Income Gap ($) | 2,373 | 71.12¢ per $1 |
| Gini / Inequality Index | 2,373 | 0.35 |
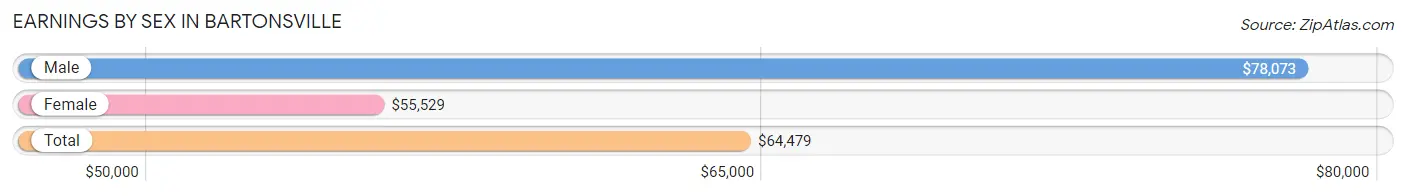
Earnings by Sex in Bartonsville
Average Earnings in Bartonsville are $64,479, $78,073 for men and $55,529 for women, a difference of 28.9%.
| Sex | Number | Average Earnings |
| Male | 709 (51.1%) | $78,073 |
| Female | 678 (48.9%) | $55,529 |
| Total | 1,387 (100.0%) | $64,479 |
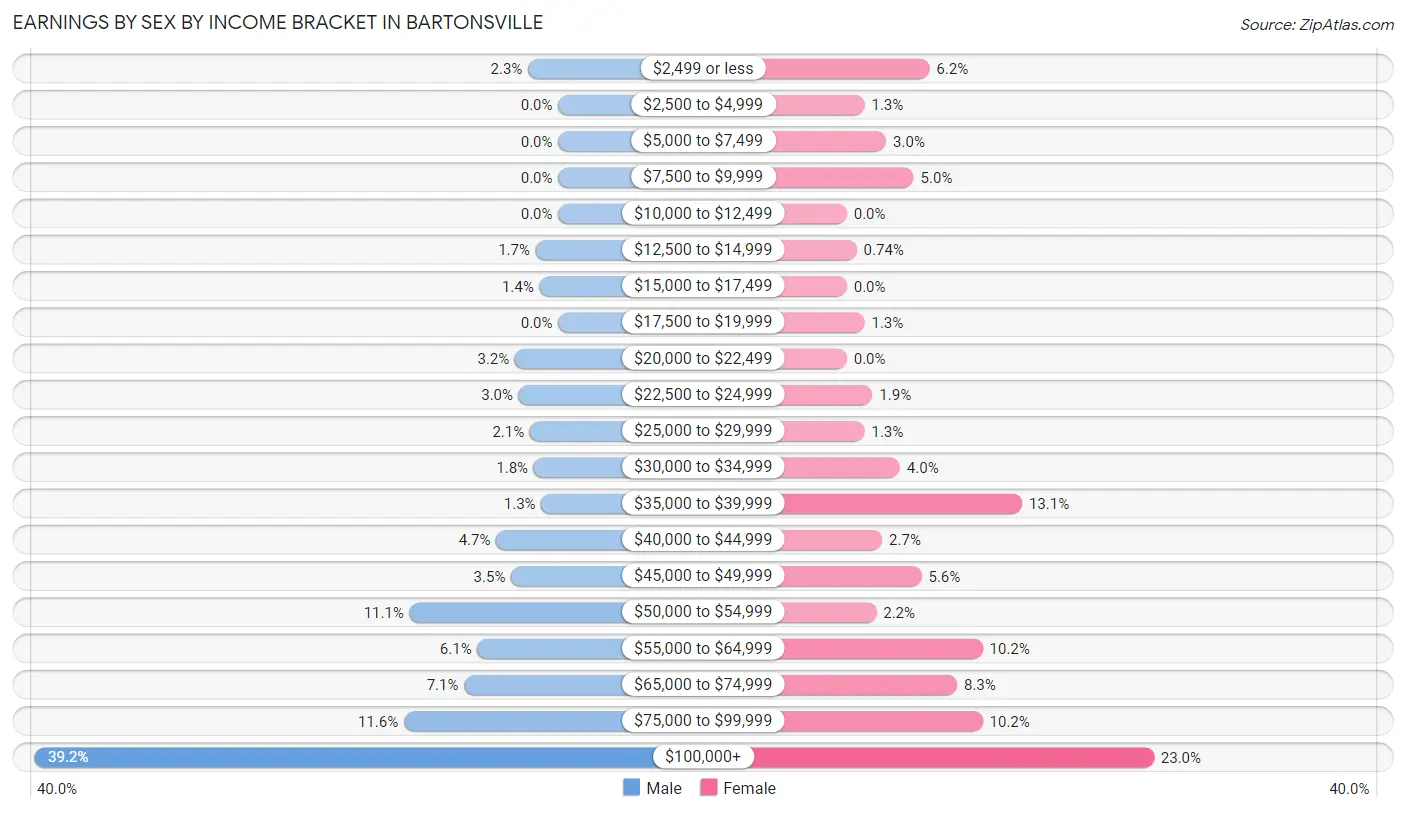
Earnings by Sex by Income Bracket in Bartonsville
The most common earnings brackets in Bartonsville are $100,000+ for men (278 | 39.2%) and $100,000+ for women (156 | 23.0%).
| Income | Male | Female |
| $2,499 or less | 16 (2.3%) | 42 (6.2%) |
| $2,500 to $4,999 | 0 (0.0%) | 9 (1.3%) |
| $5,000 to $7,499 | 0 (0.0%) | 20 (2.9%) |
| $7,500 to $9,999 | 0 (0.0%) | 34 (5.0%) |
| $10,000 to $12,499 | 0 (0.0%) | 0 (0.0%) |
| $12,500 to $14,999 | 12 (1.7%) | 5 (0.7%) |
| $15,000 to $17,499 | 10 (1.4%) | 0 (0.0%) |
| $17,500 to $19,999 | 0 (0.0%) | 9 (1.3%) |
| $20,000 to $22,499 | 23 (3.2%) | 0 (0.0%) |
| $22,500 to $24,999 | 21 (3.0%) | 13 (1.9%) |
| $25,000 to $29,999 | 15 (2.1%) | 9 (1.3%) |
| $30,000 to $34,999 | 13 (1.8%) | 27 (4.0%) |
| $35,000 to $39,999 | 9 (1.3%) | 89 (13.1%) |
| $40,000 to $44,999 | 33 (4.6%) | 18 (2.6%) |
| $45,000 to $49,999 | 25 (3.5%) | 38 (5.6%) |
| $50,000 to $54,999 | 79 (11.1%) | 15 (2.2%) |
| $55,000 to $64,999 | 43 (6.1%) | 69 (10.2%) |
| $65,000 to $74,999 | 50 (7.0%) | 56 (8.3%) |
| $75,000 to $99,999 | 82 (11.6%) | 69 (10.2%) |
| $100,000+ | 278 (39.2%) | 156 (23.0%) |
| Total | 709 (100.0%) | 678 (100.0%) |
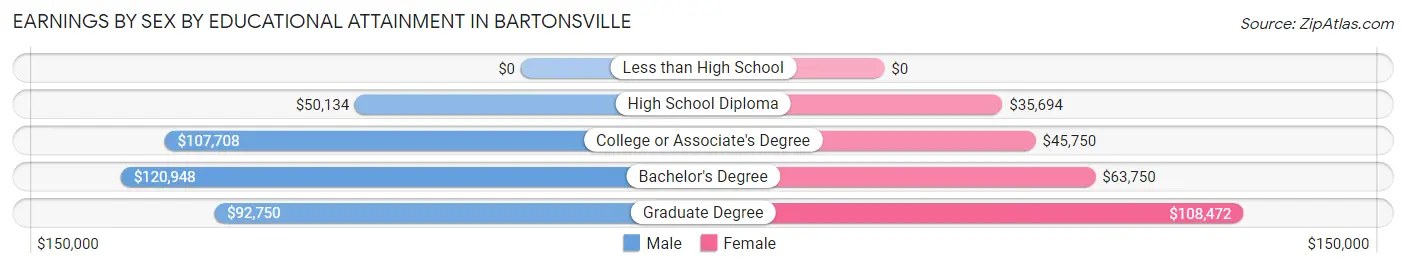
Earnings by Sex by Educational Attainment in Bartonsville
Average earnings in Bartonsville are $81,393 for men and $62,159 for women, a difference of 23.6%. Men with an educational attainment of bachelor's degree enjoy the highest average annual earnings of $120,948, while those with high school diploma education earn the least with $50,134. Women with an educational attainment of graduate degree earn the most with the average annual earnings of $108,472, while those with high school diploma education have the smallest earnings of $35,694.
| Educational Attainment | Male Income | Female Income |
| Less than High School | - | - |
| High School Diploma | $50,134 | $35,694 |
| College or Associate's Degree | $107,708 | $45,750 |
| Bachelor's Degree | $120,948 | $63,750 |
| Graduate Degree | $92,750 | $108,472 |
| Total | $81,393 | $62,159 |
Family Income in Bartonsville
Family Income Brackets in Bartonsville
According to the Bartonsville family income data, there are 269 families falling into the $200,000+ income range, which is the most common income bracket and makes up 38.9% of all families.
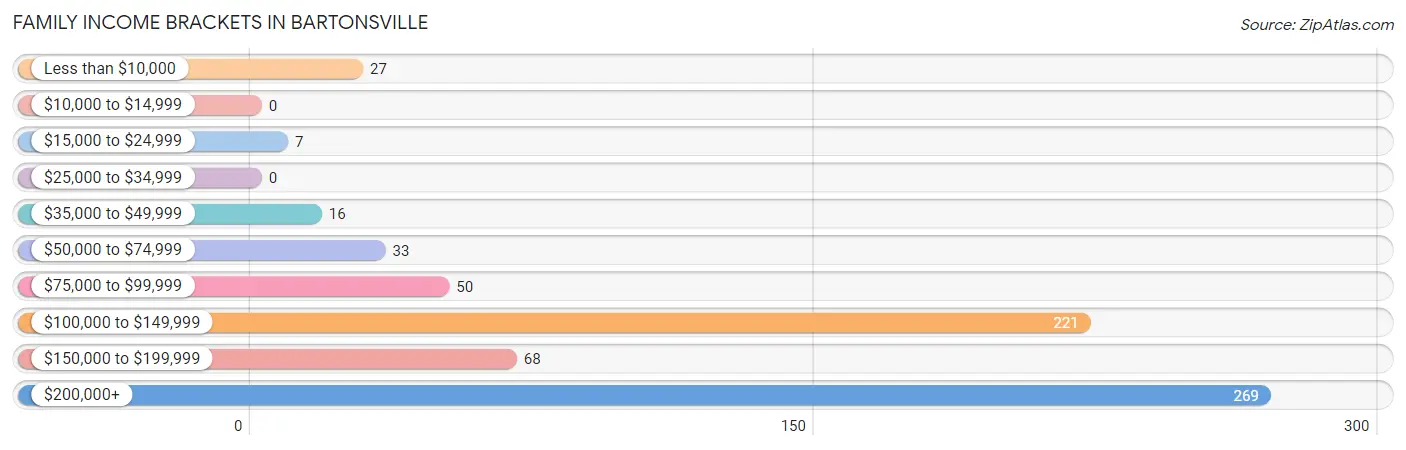
| Income Bracket | # Families | % Families |
| Less than $10,000 | 27 | 3.9% |
| $10,000 to $14,999 | 0 | 0.0% |
| $15,000 to $24,999 | 7 | 1.0% |
| $25,000 to $34,999 | 0 | 0.0% |
| $35,000 to $49,999 | 16 | 2.3% |
| $50,000 to $74,999 | 33 | 4.8% |
| $75,000 to $99,999 | 50 | 7.2% |
| $100,000 to $149,999 | 221 | 32.0% |
| $150,000 to $199,999 | 68 | 9.8% |
| $200,000+ | 269 | 38.9% |
Family Income by Famaliy Size in Bartonsville
6-person families (61 | 8.8%) account for the highest median family income in Bartonsville with $220,096 per family, while 2-person families (273 | 39.5%) have the highest median income of $64,244 per family member.
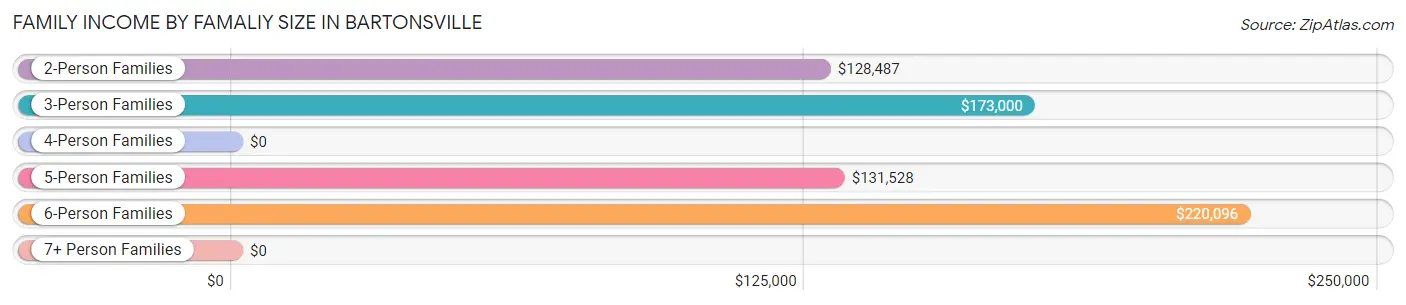
| Income Bracket | # Families | Median Income |
| 2-Person Families | 273 (39.5%) | $128,487 |
| 3-Person Families | 172 (24.9%) | $173,000 |
| 4-Person Families | 122 (17.7%) | $0 |
| 5-Person Families | 63 (9.1%) | $131,528 |
| 6-Person Families | 61 (8.8%) | $220,096 |
| 7+ Person Families | 0 (0.0%) | $0 |
| Total | 691 (100.0%) | $146,985 |
Family Income by Number of Earners in Bartonsville
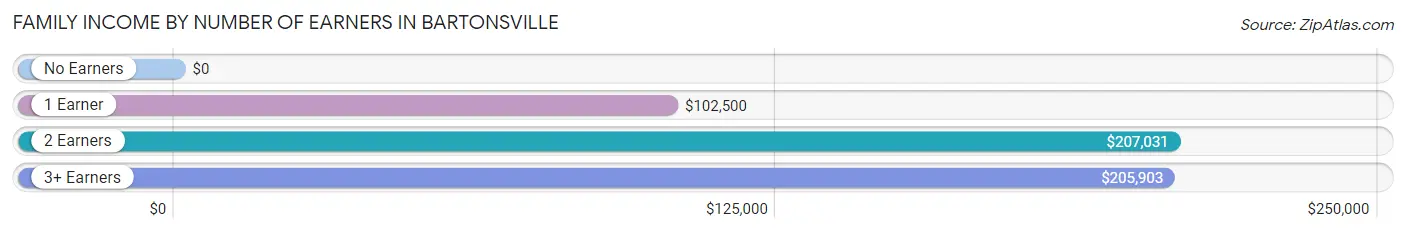
| Number of Earners | # Families | Median Income |
| No Earners | 67 (9.7%) | $0 |
| 1 Earner | 130 (18.8%) | $102,500 |
| 2 Earners | 395 (57.2%) | $207,031 |
| 3+ Earners | 99 (14.3%) | $205,903 |
| Total | 691 (100.0%) | $146,985 |
Household Income in Bartonsville
Household Income Brackets in Bartonsville
With 272 households falling in the category, the $100,000 to $149,999 income range is the most frequent in Bartonsville, accounting for 35.2% of all households.
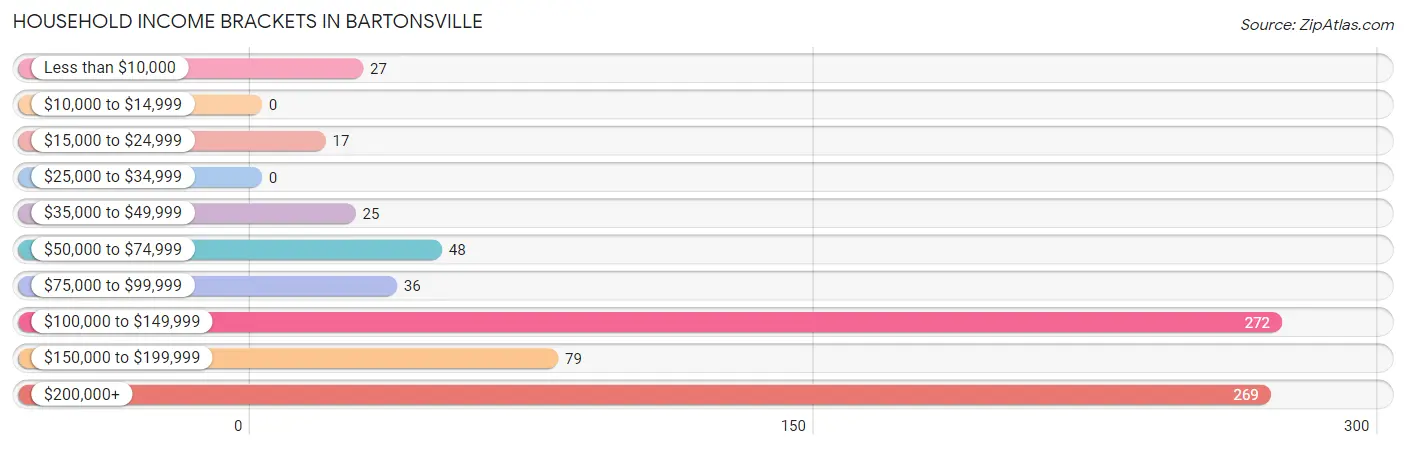
| Income Bracket | # Households | % Households |
| Less than $10,000 | 27 | 3.5% |
| $10,000 to $14,999 | 0 | 0.0% |
| $15,000 to $24,999 | 17 | 2.2% |
| $25,000 to $34,999 | 0 | 0.0% |
| $35,000 to $49,999 | 25 | 3.2% |
| $50,000 to $74,999 | 48 | 6.2% |
| $75,000 to $99,999 | 36 | 4.7% |
| $100,000 to $149,999 | 272 | 35.2% |
| $150,000 to $199,999 | 79 | 10.2% |
| $200,000+ | 269 | 34.8% |
Household Income by Householder Age in Bartonsville
The median household income in Bartonsville is $131,789, with the highest median household income of $172,750 found in the 45 to 64 years age bracket for the primary householder. A total of 298 households (38.6%) fall into this category.
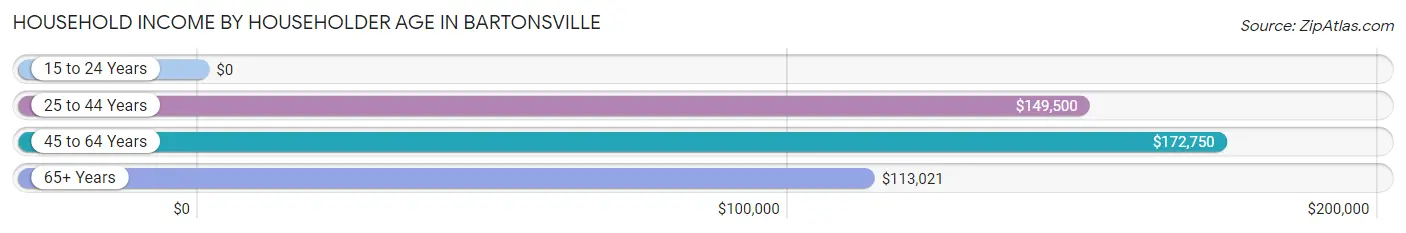
| Income Bracket | # Households | Median Income |
| 15 to 24 Years | 0 (0.0%) | $0 |
| 25 to 44 Years | 378 (48.9%) | $149,500 |
| 45 to 64 Years | 298 (38.6%) | $172,750 |
| 65+ Years | 97 (12.6%) | $113,021 |
| Total | 773 (100.0%) | $131,789 |
Poverty in Bartonsville
Income Below Poverty by Sex and Age in Bartonsville
With 6.1% poverty level for males and 5.3% for females among the residents of Bartonsville, 18 to 24 year old males and 5 year old females are the most vulnerable to poverty, with 31 males (29.0%) and 16 females (31.4%) in their respective age groups living below the poverty level.
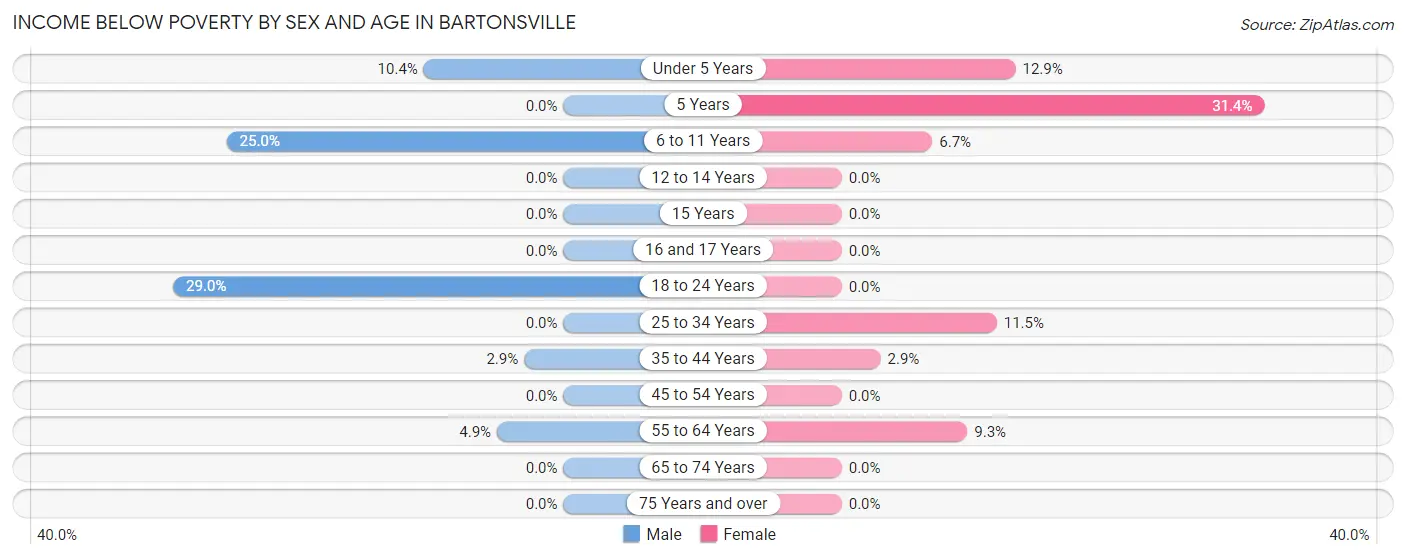
| Age Bracket | Male | Female |
| Under 5 Years | 14 (10.4%) | 8 (12.9%) |
| 5 Years | 0 (0.0%) | 16 (31.4%) |
| 6 to 11 Years | 7 (25.0%) | 9 (6.7%) |
| 12 to 14 Years | 0 (0.0%) | 0 (0.0%) |
| 15 Years | 0 (0.0%) | 0 (0.0%) |
| 16 and 17 Years | 0 (0.0%) | 0 (0.0%) |
| 18 to 24 Years | 31 (29.0%) | 0 (0.0%) |
| 25 to 34 Years | 0 (0.0%) | 16 (11.5%) |
| 35 to 44 Years | 8 (2.9%) | 7 (2.9%) |
| 45 to 54 Years | 0 (0.0%) | 0 (0.0%) |
| 55 to 64 Years | 7 (4.9%) | 11 (9.3%) |
| 65 to 74 Years | 0 (0.0%) | 0 (0.0%) |
| 75 Years and over | 0 (0.0%) | 0 (0.0%) |
| Total | 67 (6.1%) | 67 (5.3%) |
Income Above Poverty by Sex and Age in Bartonsville
According to the poverty statistics in Bartonsville, males aged 5 years and females aged 12 to 14 years are the age groups that are most secure financially, with 100.0% of males and 100.0% of females in these age groups living above the poverty line.
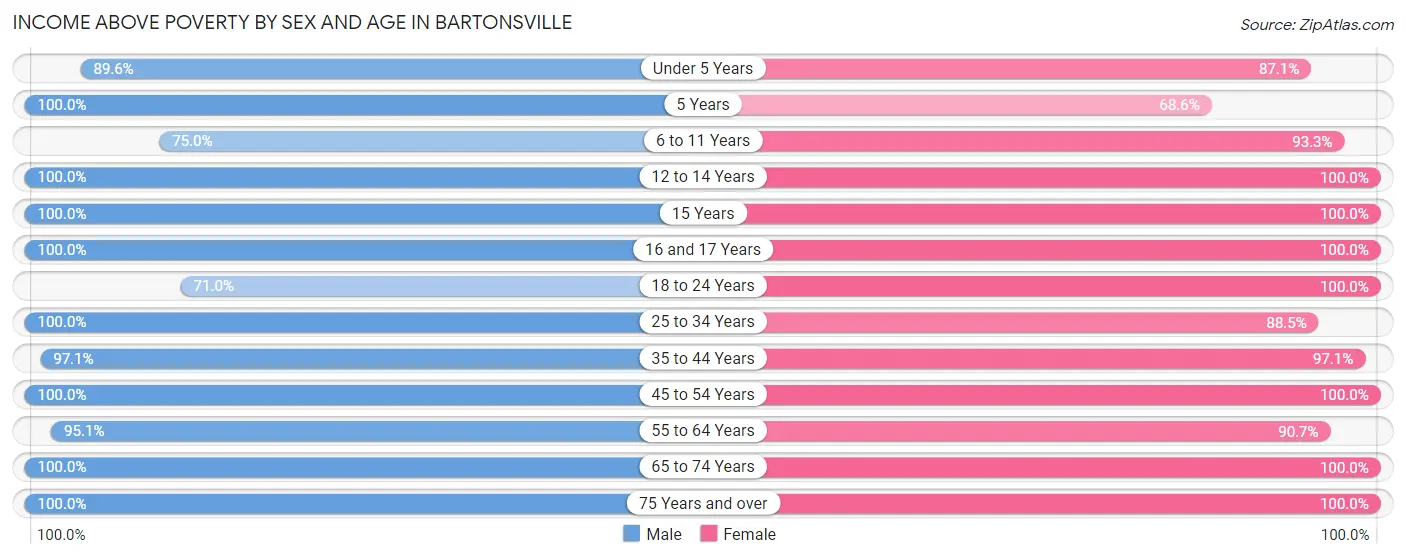
| Age Bracket | Male | Female |
| Under 5 Years | 121 (89.6%) | 54 (87.1%) |
| 5 Years | 11 (100.0%) | 35 (68.6%) |
| 6 to 11 Years | 21 (75.0%) | 125 (93.3%) |
| 12 to 14 Years | 38 (100.0%) | 90 (100.0%) |
| 15 Years | 41 (100.0%) | 27 (100.0%) |
| 16 and 17 Years | 40 (100.0%) | 70 (100.0%) |
| 18 to 24 Years | 76 (71.0%) | 51 (100.0%) |
| 25 to 34 Years | 87 (100.0%) | 123 (88.5%) |
| 35 to 44 Years | 266 (97.1%) | 236 (97.1%) |
| 45 to 54 Years | 140 (100.0%) | 131 (100.0%) |
| 55 to 64 Years | 135 (95.1%) | 107 (90.7%) |
| 65 to 74 Years | 51 (100.0%) | 105 (100.0%) |
| 75 Years and over | 5 (100.0%) | 32 (100.0%) |
| Total | 1,032 (93.9%) | 1,186 (94.7%) |
Income Below Poverty Among Married-Couple Families in Bartonsville
The poverty statistics for married-couple families in Bartonsville show that 3.0% or 18 of the total 590 families live below the poverty line. Families with 1 or 2 children have the highest poverty rate of 5.4%, comprising of 18 families. On the other hand, families with no children have the lowest poverty rate of 0.0%, which includes 0 families.
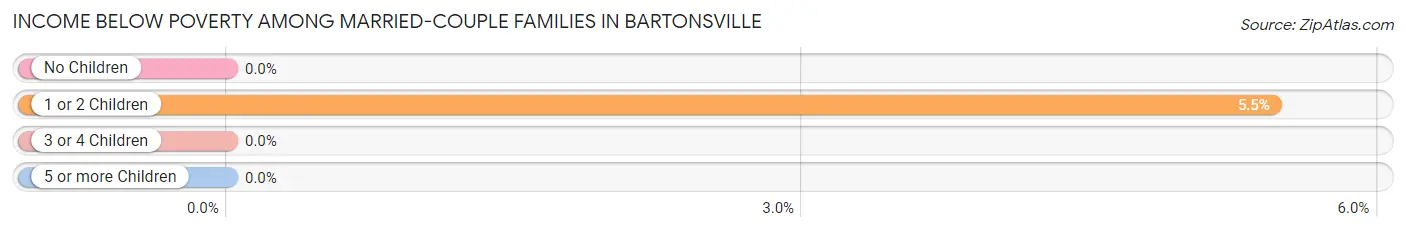
| Children | Above Poverty | Below Poverty |
| No Children | 236 (100.0%) | 0 (0.0%) |
| 1 or 2 Children | 312 (94.6%) | 18 (5.4%) |
| 3 or 4 Children | 24 (100.0%) | 0 (0.0%) |
| 5 or more Children | 0 (0.0%) | 0 (0.0%) |
| Total | 572 (97.0%) | 18 (3.0%) |
Income Below Poverty Among Single-Parent Households in Bartonsville
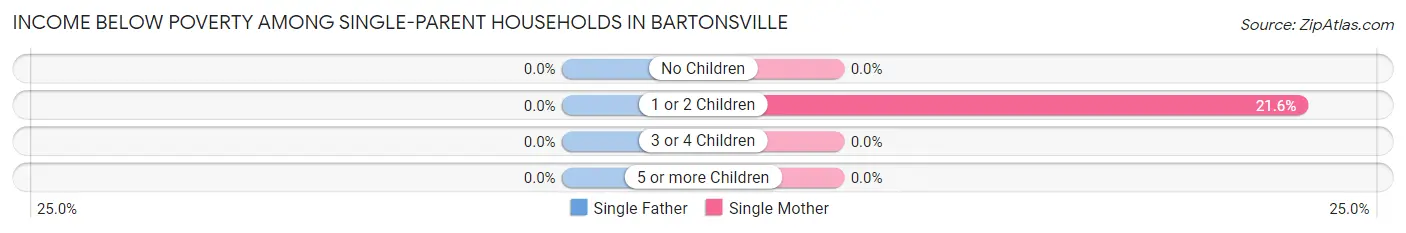
| Children | Single Father | Single Mother |
| No Children | 0 (0.0%) | 0 (0.0%) |
| 1 or 2 Children | 0 (0.0%) | 16 (21.6%) |
| 3 or 4 Children | 0 (0.0%) | 0 (0.0%) |
| 5 or more Children | 0 (0.0%) | 0 (0.0%) |
| Total | 0 (0.0%) | 16 (19.1%) |
Income Below Poverty Among Married-Couple vs Single-Parent Households in Bartonsville
The poverty data for Bartonsville shows that 18 of the married-couple family households (3.0%) and 16 of the single-parent households (15.8%) are living below the poverty level. Within the married-couple family households, those with 1 or 2 children have the highest poverty rate, with 18 households (5.4%) falling below the poverty line. Among the single-parent households, those with 1 or 2 children have the highest poverty rate, with 16 household (17.6%) living below poverty.
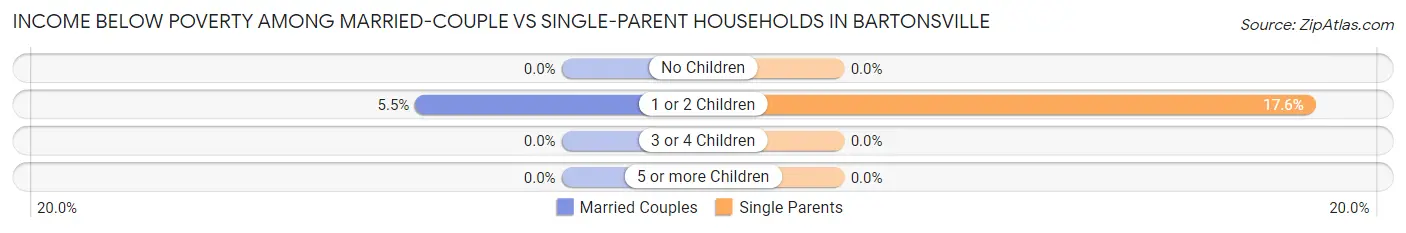
| Children | Married-Couple Families | Single-Parent Households |
| No Children | 0 (0.0%) | 0 (0.0%) |
| 1 or 2 Children | 18 (5.4%) | 16 (17.6%) |
| 3 or 4 Children | 0 (0.0%) | 0 (0.0%) |
| 5 or more Children | 0 (0.0%) | 0 (0.0%) |
| Total | 18 (3.0%) | 16 (15.8%) |
Race in Bartonsville
The most populous races in Bartonsville are White / Caucasian (1,703 | 71.8%), Black / African American (283 | 11.9%), and Asian (235 | 9.9%).
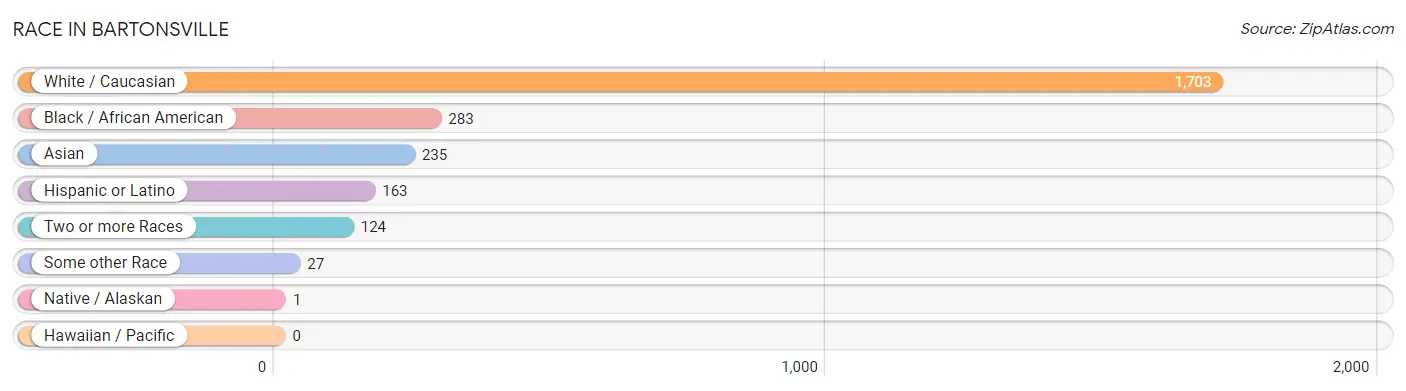
| Race | # Population | % Population |
| Asian | 235 | 9.9% |
| Black / African American | 283 | 11.9% |
| Hawaiian / Pacific | 0 | 0.0% |
| Hispanic or Latino | 163 | 6.9% |
| Native / Alaskan | 1 | 0.0% |
| White / Caucasian | 1,703 | 71.8% |
| Two or more Races | 124 | 5.2% |
| Some other Race | 27 | 1.1% |
| Total | 2,373 | 100.0% |
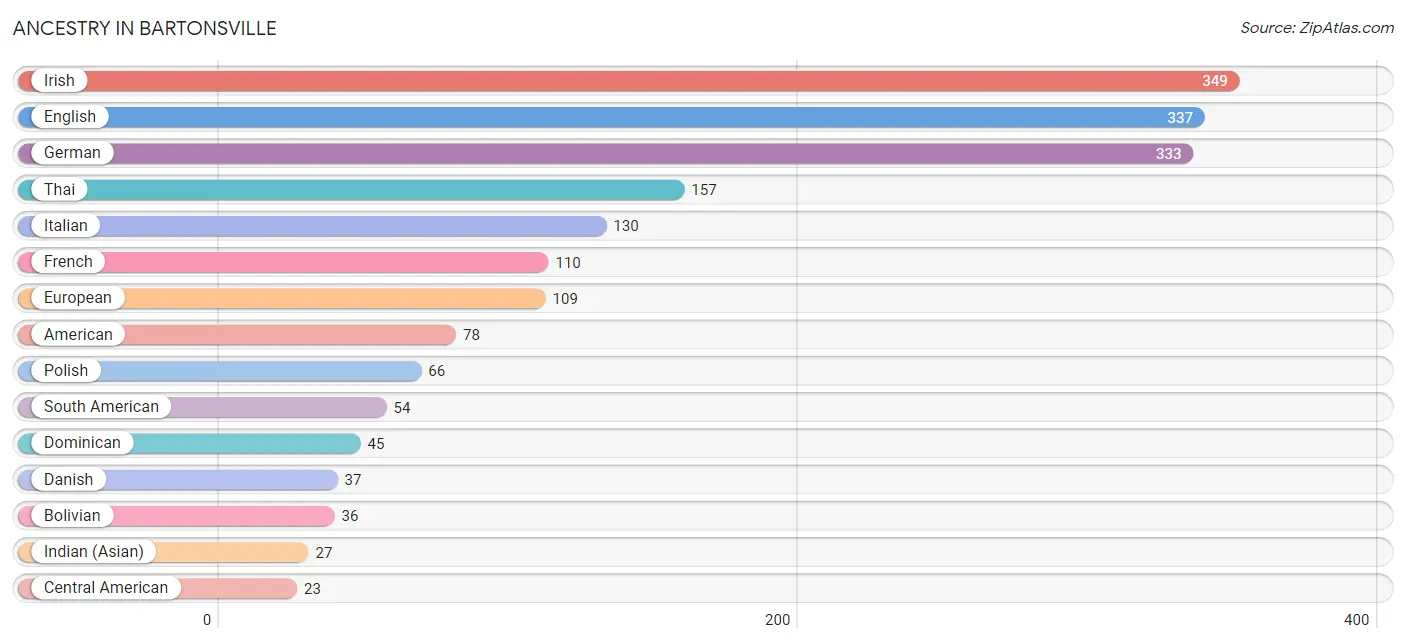
Ancestry in Bartonsville
The most populous ancestries reported in Bartonsville are Irish (349 | 14.7%), English (337 | 14.2%), German (333 | 14.0%), Thai (157 | 6.6%), and Italian (130 | 5.5%), together accounting for 55.0% of all Bartonsville residents.
| Ancestry | # Population | % Population |
| American | 78 | 3.3% |
| Arab | 11 | 0.5% |
| Austrian | 6 | 0.3% |
| Bolivian | 36 | 1.5% |
| British | 20 | 0.8% |
| Burmese | 7 | 0.3% |
| Central American | 23 | 1.0% |
| Cherokee | 1 | 0.0% |
| Croatian | 19 | 0.8% |
| Czech | 20 | 0.8% |
| Czechoslovakian | 12 | 0.5% |
| Danish | 37 | 1.6% |
| Dominican | 45 | 1.9% |
| Dutch | 16 | 0.7% |
| Eastern European | 13 | 0.5% |
| Egyptian | 11 | 0.5% |
| English | 337 | 14.2% |
| European | 109 | 4.6% |
| French | 110 | 4.6% |
| French Canadian | 10 | 0.4% |
| German | 333 | 14.0% |
| Greek | 10 | 0.4% |
| Guatemalan | 10 | 0.4% |
| Hungarian | 11 | 0.5% |
| Indian (Asian) | 27 | 1.1% |
| Indonesian | 9 | 0.4% |
| Irish | 349 | 14.7% |
| Italian | 130 | 5.5% |
| Jamaican | 11 | 0.5% |
| Korean | 19 | 0.8% |
| Latvian | 10 | 0.4% |
| Lithuanian | 20 | 0.8% |
| Mexican | 21 | 0.9% |
| Peruvian | 18 | 0.8% |
| Polish | 66 | 2.8% |
| Portuguese | 13 | 0.5% |
| Romanian | 17 | 0.7% |
| Russian | 8 | 0.3% |
| Salvadoran | 13 | 0.5% |
| Scandinavian | 17 | 0.7% |
| Scotch-Irish | 10 | 0.4% |
| Scottish | 22 | 0.9% |
| South American | 54 | 2.3% |
| Sri Lankan | 10 | 0.4% |
| Swedish | 19 | 0.8% |
| Swiss | 10 | 0.4% |
| Thai | 157 | 6.6% |
| Welsh | 6 | 0.3% | View All 48 Rows |
Immigrants in Bartonsville
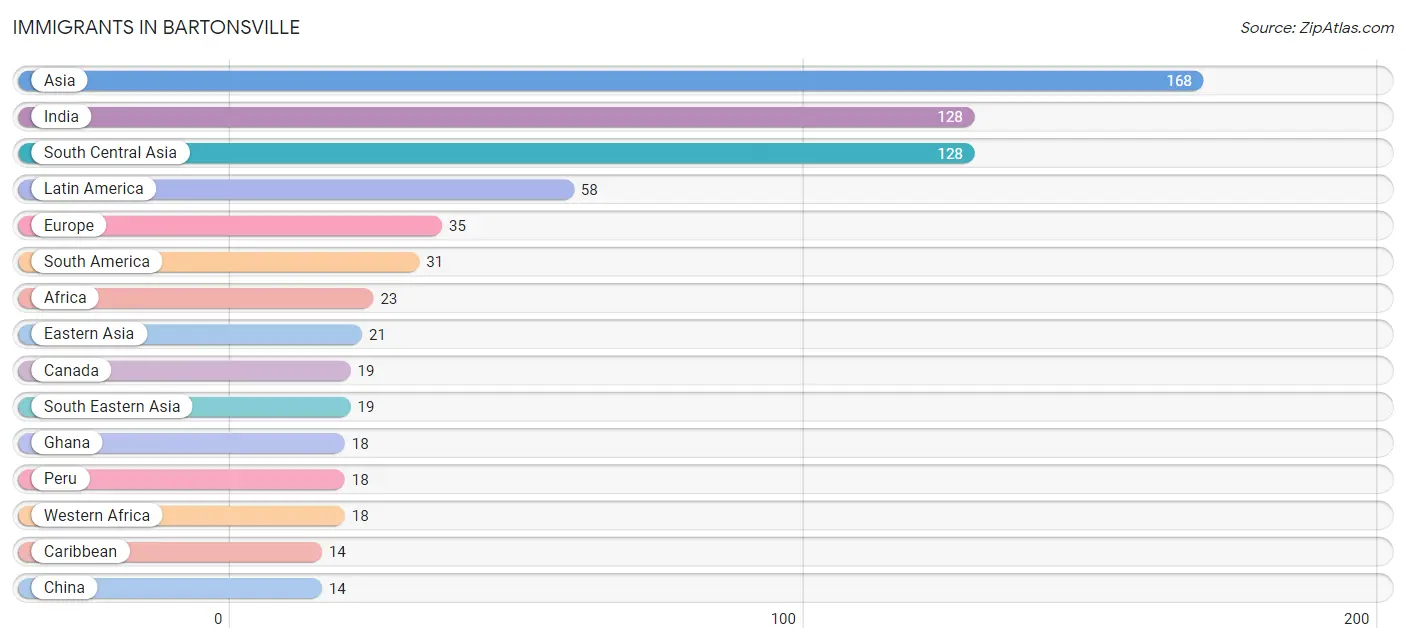
The most numerous immigrant groups reported in Bartonsville came from Asia (168 | 7.1%), India (128 | 5.4%), South Central Asia (128 | 5.4%), Latin America (58 | 2.4%), and Europe (35 | 1.5%), together accounting for 21.8% of all Bartonsville residents.
| Immigration Origin | # Population | % Population |
| Africa | 23 | 1.0% |
| Asia | 168 | 7.1% |
| Australia | 4 | 0.2% |
| Canada | 19 | 0.8% |
| Caribbean | 14 | 0.6% |
| Central America | 13 | 0.5% |
| Chile | 13 | 0.5% |
| China | 14 | 0.6% |
| Dominican Republic | 14 | 0.6% |
| Eastern Asia | 21 | 0.9% |
| Egypt | 5 | 0.2% |
| El Salvador | 13 | 0.5% |
| Europe | 35 | 1.5% |
| Germany | 13 | 0.5% |
| Ghana | 18 | 0.8% |
| Greece | 9 | 0.4% |
| Hong Kong | 3 | 0.1% |
| India | 128 | 5.4% |
| Korea | 7 | 0.3% |
| Latin America | 58 | 2.4% |
| Northern Africa | 5 | 0.2% |
| Northern Europe | 13 | 0.5% |
| Oceania | 4 | 0.2% |
| Peru | 18 | 0.8% |
| South America | 31 | 1.3% |
| South Central Asia | 128 | 5.4% |
| South Eastern Asia | 19 | 0.8% |
| Southern Europe | 9 | 0.4% |
| Taiwan | 8 | 0.3% |
| Vietnam | 10 | 0.4% |
| Western Africa | 18 | 0.8% |
| Western Europe | 13 | 0.5% | View All 32 Rows |
Sex and Age in Bartonsville
Sex and Age in Bartonsville
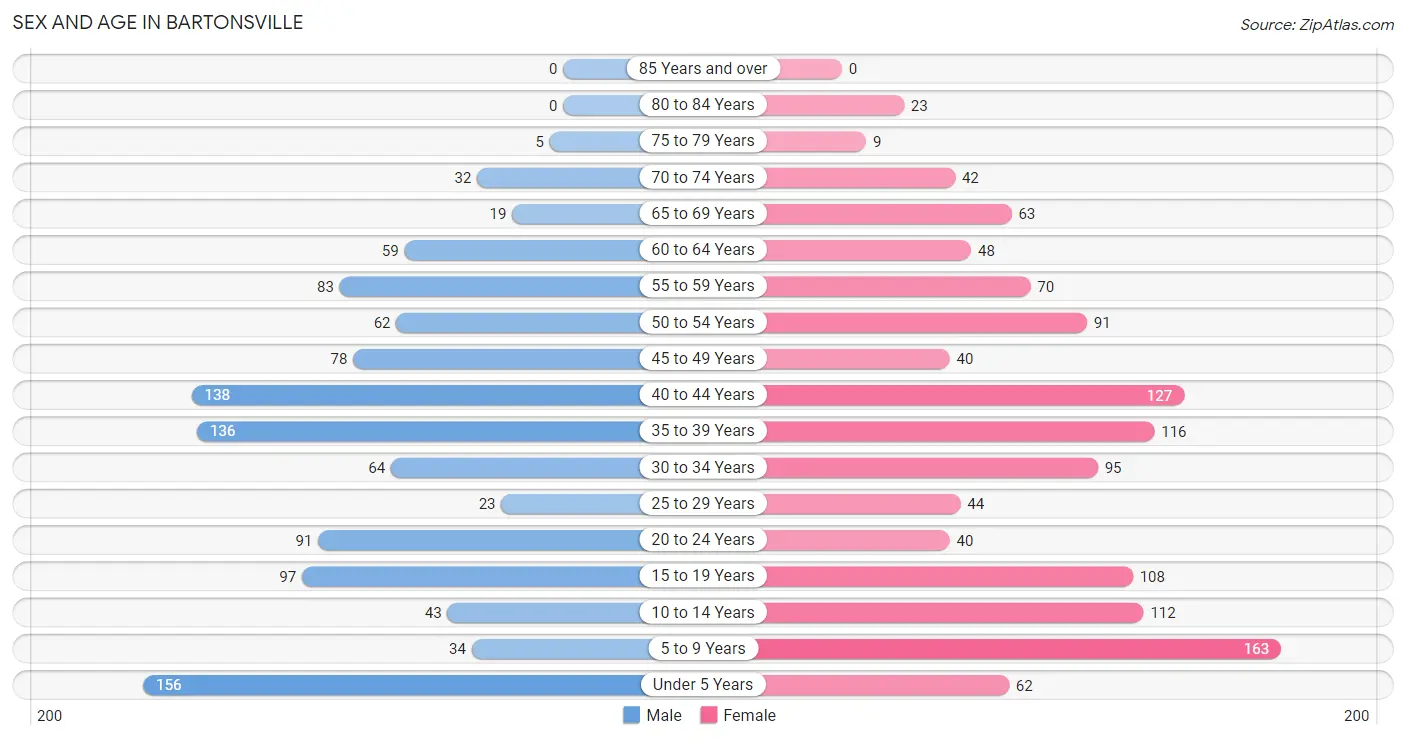
The most populous age groups in Bartonsville are Under 5 Years (156 | 13.9%) for men and 5 to 9 Years (163 | 13.0%) for women.
| Age Bracket | Male | Female |
| Under 5 Years | 156 (13.9%) | 62 (5.0%) |
| 5 to 9 Years | 34 (3.0%) | 163 (13.0%) |
| 10 to 14 Years | 43 (3.8%) | 112 (8.9%) |
| 15 to 19 Years | 97 (8.7%) | 108 (8.6%) |
| 20 to 24 Years | 91 (8.1%) | 40 (3.2%) |
| 25 to 29 Years | 23 (2.1%) | 44 (3.5%) |
| 30 to 34 Years | 64 (5.7%) | 95 (7.6%) |
| 35 to 39 Years | 136 (12.1%) | 116 (9.3%) |
| 40 to 44 Years | 138 (12.3%) | 127 (10.1%) |
| 45 to 49 Years | 78 (7.0%) | 40 (3.2%) |
| 50 to 54 Years | 62 (5.5%) | 91 (7.3%) |
| 55 to 59 Years | 83 (7.4%) | 70 (5.6%) |
| 60 to 64 Years | 59 (5.3%) | 48 (3.8%) |
| 65 to 69 Years | 19 (1.7%) | 63 (5.0%) |
| 70 to 74 Years | 32 (2.9%) | 42 (3.4%) |
| 75 to 79 Years | 5 (0.4%) | 9 (0.7%) |
| 80 to 84 Years | 0 (0.0%) | 23 (1.8%) |
| 85 Years and over | 0 (0.0%) | 0 (0.0%) |
| Total | 1,120 (100.0%) | 1,253 (100.0%) |
Families and Households in Bartonsville
Median Family Size in Bartonsville
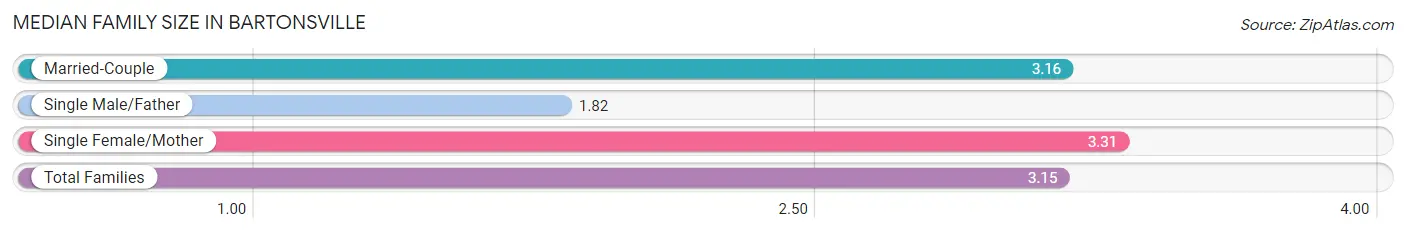
The median family size in Bartonsville is 3.15 persons per family, with single female/mother families (84 | 12.2%) accounting for the largest median family size of 3.31 persons per family. On the other hand, single male/father families (17 | 2.5%) represent the smallest median family size with 1.82 persons per family.
| Family Type | # Families | Family Size |
| Married-Couple | 590 (85.4%) | 3.16 |
| Single Male/Father | 17 (2.5%) | 1.82 |
| Single Female/Mother | 84 (12.2%) | 3.31 |
| Total Families | 691 (100.0%) | 3.15 |
Median Household Size in Bartonsville
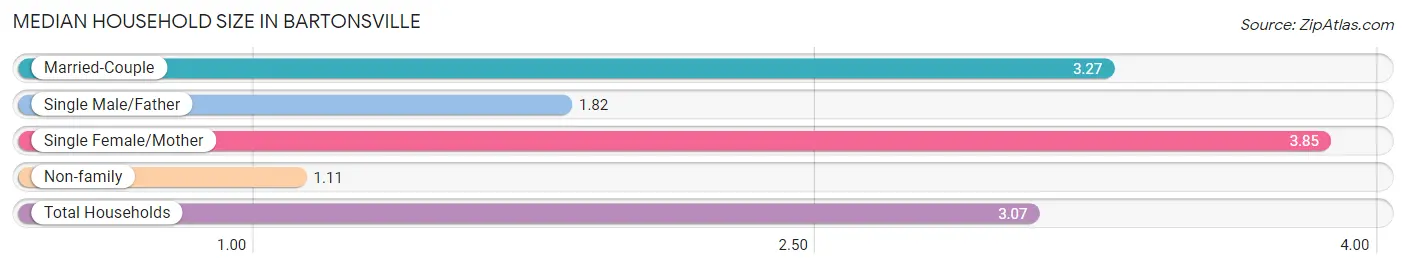
The median household size in Bartonsville is 3.07 persons per household, with single female/mother households (84 | 10.9%) accounting for the largest median household size of 3.85 persons per household. non-family households (82 | 10.6%) represent the smallest median household size with 1.11 persons per household.
| Household Type | # Households | Household Size |
| Married-Couple | 590 (76.3%) | 3.27 |
| Single Male/Father | 17 (2.2%) | 1.82 |
| Single Female/Mother | 84 (10.9%) | 3.85 |
| Non-family | 82 (10.6%) | 1.11 |
| Total Households | 773 (100.0%) | 3.07 |
Household Size by Marriage Status in Bartonsville
Out of a total of 773 households in Bartonsville, 691 (89.4%) are family households, while 82 (10.6%) are nonfamily households. The most numerous type of family households are 2-person households, comprising 226, and the most common type of nonfamily households are 1-person households, comprising 72.
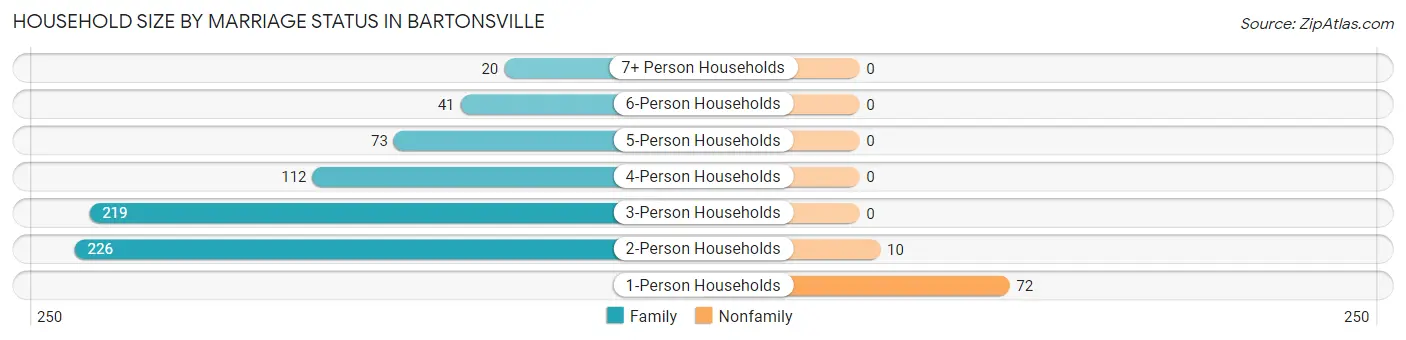
| Household Size | Family Households | Nonfamily Households |
| 1-Person Households | - | 72 (9.3%) |
| 2-Person Households | 226 (29.2%) | 10 (1.3%) |
| 3-Person Households | 219 (28.3%) | 0 (0.0%) |
| 4-Person Households | 112 (14.5%) | 0 (0.0%) |
| 5-Person Households | 73 (9.4%) | 0 (0.0%) |
| 6-Person Households | 41 (5.3%) | 0 (0.0%) |
| 7+ Person Households | 20 (2.6%) | 0 (0.0%) |
| Total | 691 (89.4%) | 82 (10.6%) |
Female Fertility in Bartonsville
Fertility by Age in Bartonsville
Average fertility rate in Bartonsville is 87.0 births per 1,000 women. Women in the age bracket of 35 to 50 years have the highest fertility rate with 109.0 births per 1,000 women. Women in the age bracket of 35 to 50 years acount for 65.4% of all women with births.
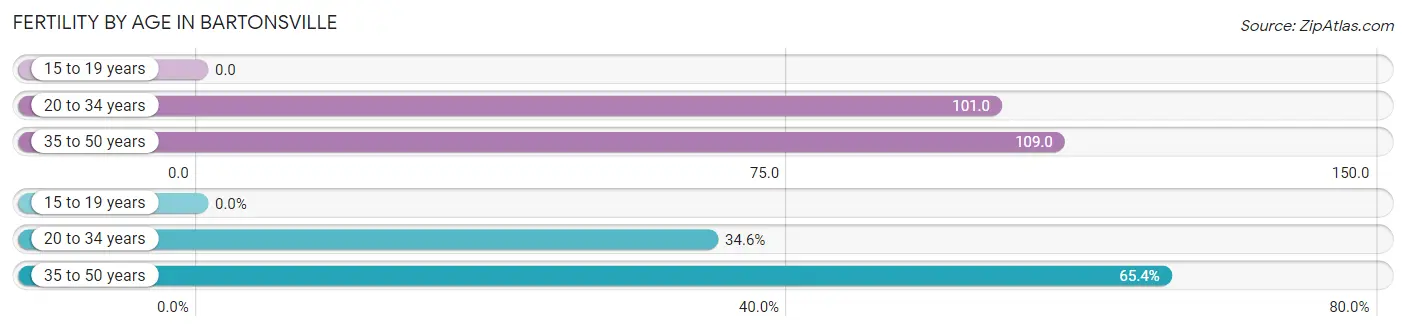
| Age Bracket | Women with Births | Births / 1,000 Women |
| 15 to 19 years | 0 (0.0%) | 0.0 |
| 20 to 34 years | 18 (34.6%) | 101.0 |
| 35 to 50 years | 34 (65.4%) | 109.0 |
| Total | 52 (100.0%) | 87.0 |
Fertility by Age by Marriage Status in Bartonsville
42.3% of women with births (52) in Bartonsville are married. The highest percentage of unmarried women with births falls into 35 to 50 years age bracket with 88.2% of them unmarried at the time of birth, while the lowest percentage of unmarried women with births belong to 20 to 34 years age bracket with 0.0% of them unmarried.
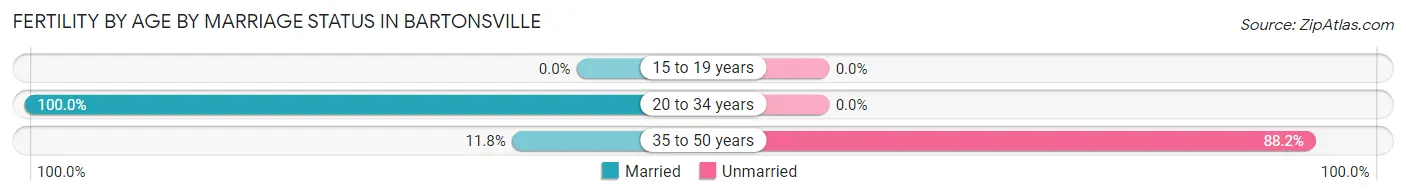
| Age Bracket | Married | Unmarried |
| 15 to 19 years | 0 (0.0%) | 0 (0.0%) |
| 20 to 34 years | 18 (100.0%) | 0 (0.0%) |
| 35 to 50 years | 4 (11.8%) | 30 (88.2%) |
| Total | 22 (42.3%) | 30 (57.7%) |
Fertility by Education in Bartonsville
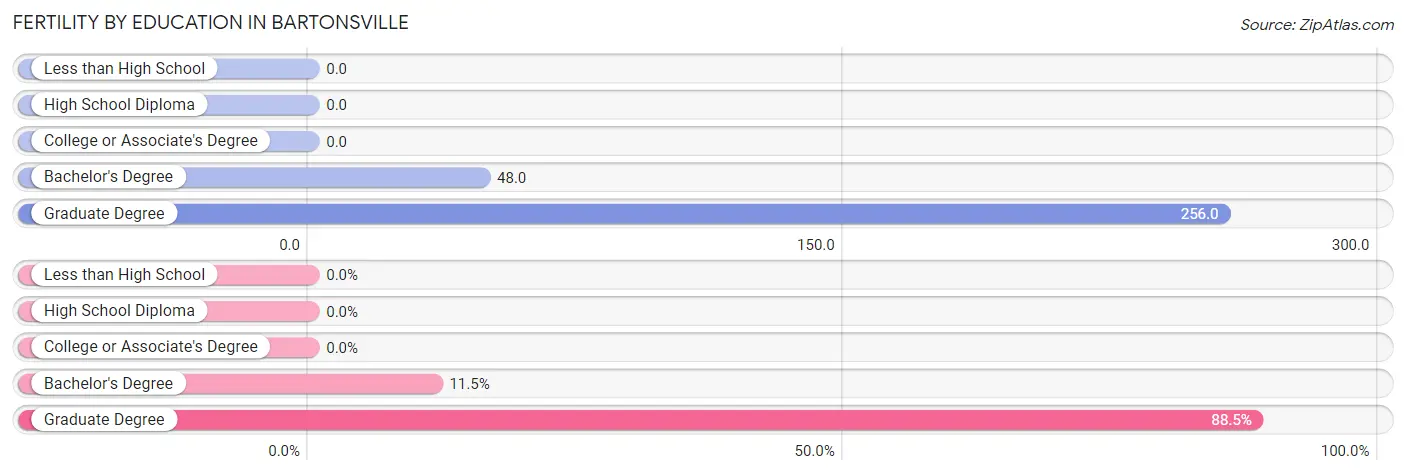
| Educational Attainment | Women with Births | Births / 1,000 Women |
| Less than High School | 0 (0.0%) | 0.0 |
| High School Diploma | 0 (0.0%) | 0.0 |
| College or Associate's Degree | 0 (0.0%) | 0.0 |
| Bachelor's Degree | 6 (11.5%) | 48.0 |
| Graduate Degree | 46 (88.5%) | 256.0 |
| Total | 52 (100.0%) | 87.0 |
Fertility by Education by Marriage Status in Bartonsville
57.7% of women with births in Bartonsville are unmarried. Women with the educational attainment of graduate degree are most likely to be married with 47.8% of them married at childbirth, while women with the educational attainment of bachelor's degree are least likely to be married with 100.0% of them unmarried at childbirth.
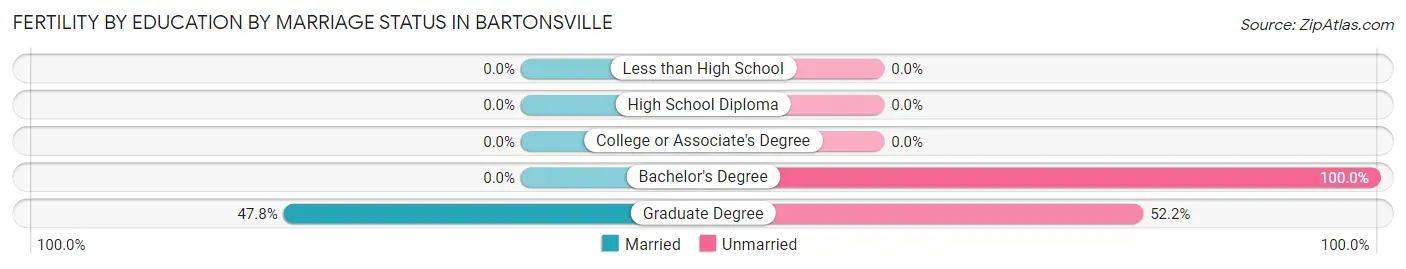
| Educational Attainment | Married | Unmarried |
| Less than High School | 0 (0.0%) | 0 (0.0%) |
| High School Diploma | 0 (0.0%) | 0 (0.0%) |
| College or Associate's Degree | 0 (0.0%) | 0 (0.0%) |
| Bachelor's Degree | 0 (0.0%) | 6 (100.0%) |
| Graduate Degree | 22 (47.8%) | 24 (52.2%) |
| Total | 22 (42.3%) | 30 (57.7%) |
Employment Characteristics in Bartonsville
Employment by Class of Employer in Bartonsville
Among the 1,341 employed individuals in Bartonsville, private company employees (670 | 50.0%), local government employees (154 | 11.5%), and not-for-profit organizations (140 | 10.4%) make up the most common classes of employment.
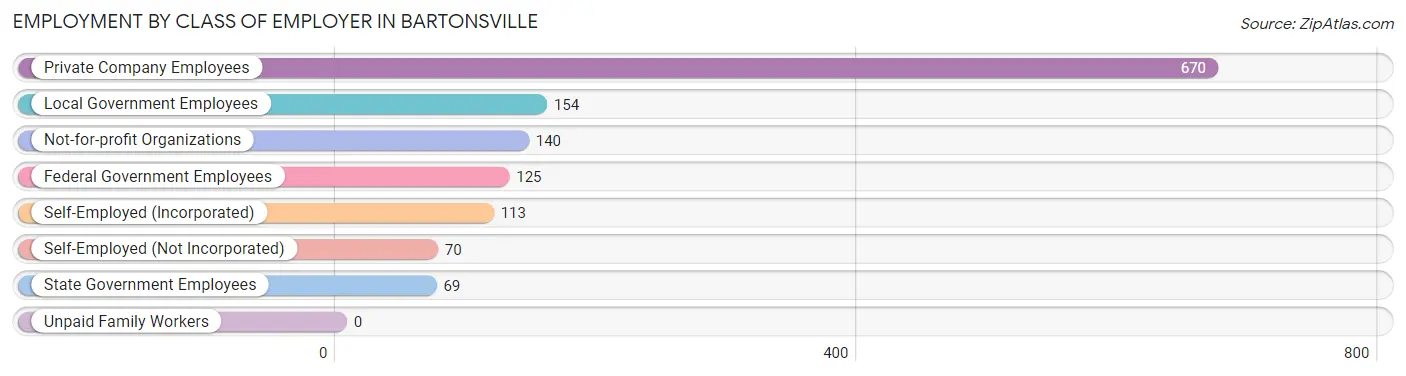
| Employer Class | # Employees | % Employees |
| Private Company Employees | 670 | 50.0% |
| Self-Employed (Incorporated) | 113 | 8.4% |
| Self-Employed (Not Incorporated) | 70 | 5.2% |
| Not-for-profit Organizations | 140 | 10.4% |
| Local Government Employees | 154 | 11.5% |
| State Government Employees | 69 | 5.1% |
| Federal Government Employees | 125 | 9.3% |
| Unpaid Family Workers | 0 | 0.0% |
| Total | 1,341 | 100.0% |
Employment Status by Age in Bartonsville
According to the labor force statistics for Bartonsville, out of the total population over 16 years of age (1,735), 80.7% or 1,400 individuals are in the labor force, with 2.5% or 35 of them unemployed. The age group with the highest labor force participation rate is 25 to 29 years, with 100.0% or 67 individuals in the labor force. Within the labor force, the 25 to 29 years age range has the highest percentage of unemployed individuals, with 31.4% or 21 of them being unemployed.
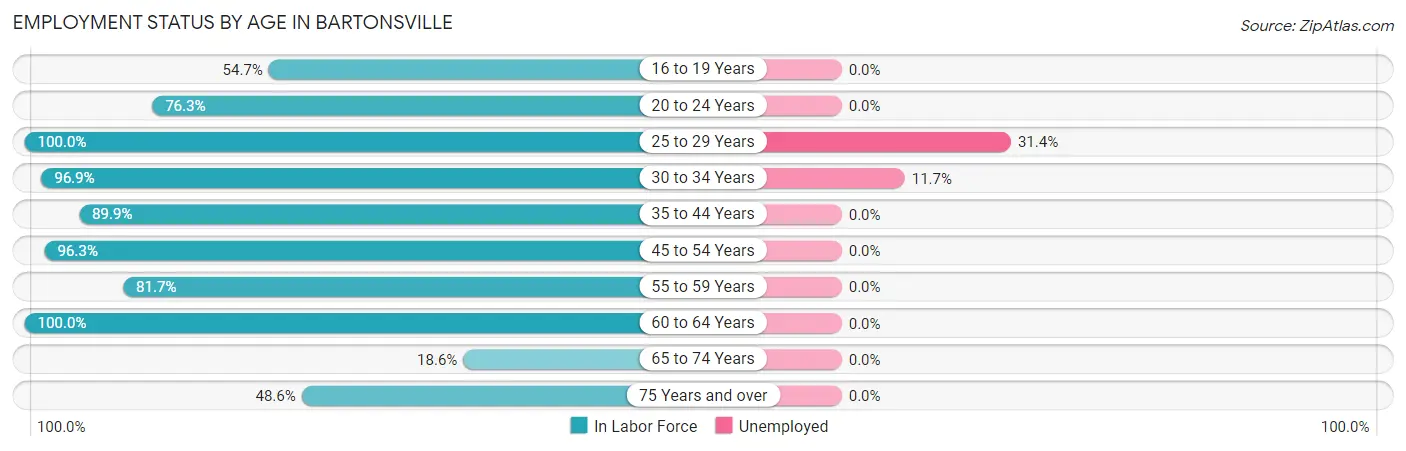
| Age Bracket | In Labor Force | Unemployed |
| 16 to 19 Years | 75 (54.7%) | 0 (0.0%) |
| 20 to 24 Years | 100 (76.3%) | 0 (0.0%) |
| 25 to 29 Years | 67 (100.0%) | 21 (31.4%) |
| 30 to 34 Years | 154 (96.9%) | 18 (11.7%) |
| 35 to 44 Years | 465 (89.9%) | 0 (0.0%) |
| 45 to 54 Years | 261 (96.3%) | 0 (0.0%) |
| 55 to 59 Years | 125 (81.7%) | 0 (0.0%) |
| 60 to 64 Years | 107 (100.0%) | 0 (0.0%) |
| 65 to 74 Years | 29 (18.6%) | 0 (0.0%) |
| 75 Years and over | 18 (48.6%) | 0 (0.0%) |
| Total | 1,400 (80.7%) | 35 (2.5%) |
Employment Status by Educational Attainment in Bartonsville
According to labor force statistics for Bartonsville, 92.5% of individuals (1,178) out of the total population between 25 and 64 years of age (1,274) are in the labor force, with 3.0% or 35 of them being unemployed. The group with the highest labor force participation rate are those with the educational attainment of less than high school, with 100.0% or 30 individuals in the labor force. Within the labor force, individuals with high school diploma education have the highest percentage of unemployment, with 9.6% or 17 of them being unemployed.
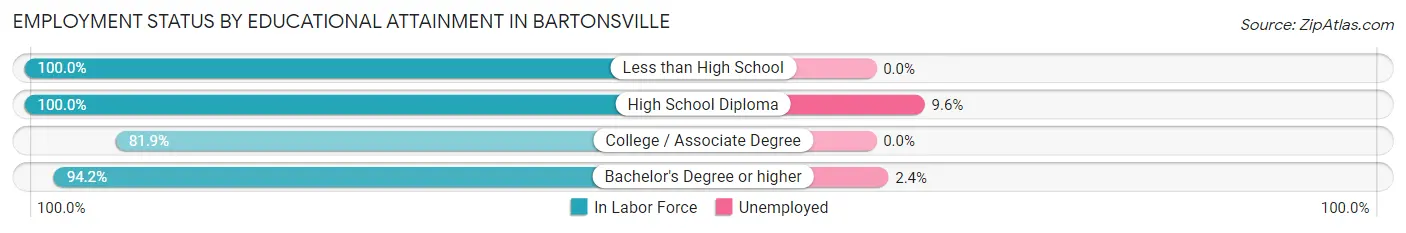
| Educational Attainment | In Labor Force | Unemployed |
| Less than High School | 30 (100.0%) | 0 (0.0%) |
| High School Diploma | 177 (100.0%) | 17 (9.6%) |
| College / Associate Degree | 222 (81.9%) | 0 (0.0%) |
| Bachelor's Degree or higher | 750 (94.2%) | 19 (2.4%) |
| Total | 1,178 (92.5%) | 38 (3.0%) |
Employment Occupations by Sex in Bartonsville
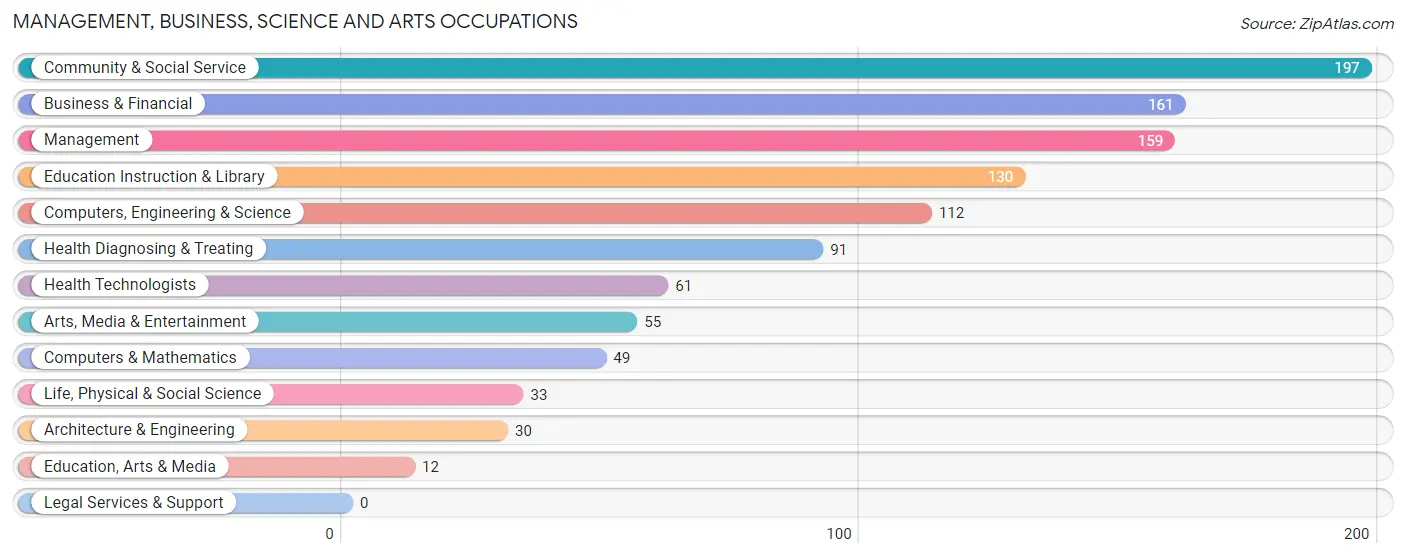
Management, Business, Science and Arts Occupations
The most common Management, Business, Science and Arts occupations in Bartonsville are Community & Social Service (197 | 14.7%), Business & Financial (161 | 12.0%), Management (159 | 11.9%), Education Instruction & Library (130 | 9.7%), and Computers, Engineering & Science (112 | 8.4%).
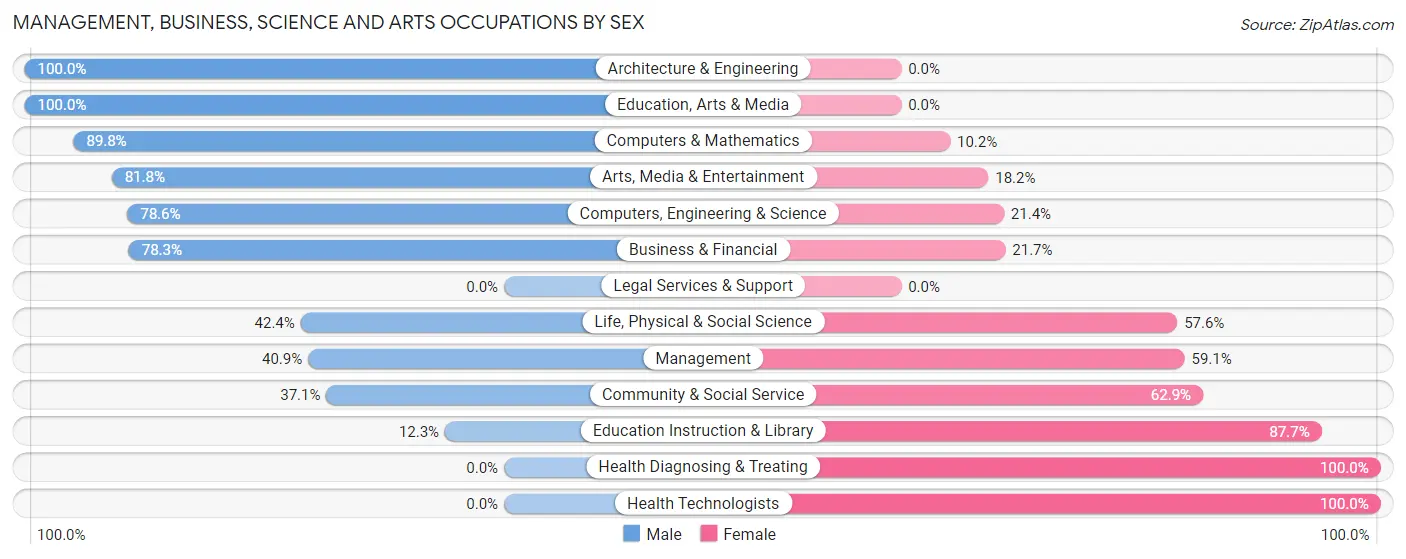
Management, Business, Science and Arts Occupations by Sex
Within the Management, Business, Science and Arts occupations in Bartonsville, the most male-oriented occupations are Architecture & Engineering (100.0%), Education, Arts & Media (100.0%), and Computers & Mathematics (89.8%), while the most female-oriented occupations are Health Diagnosing & Treating (100.0%), Health Technologists (100.0%), and Education Instruction & Library (87.7%).
| Occupation | Male | Female |
| Management | 65 (40.9%) | 94 (59.1%) |
| Business & Financial | 126 (78.3%) | 35 (21.7%) |
| Computers, Engineering & Science | 88 (78.6%) | 24 (21.4%) |
| Computers & Mathematics | 44 (89.8%) | 5 (10.2%) |
| Architecture & Engineering | 30 (100.0%) | 0 (0.0%) |
| Life, Physical & Social Science | 14 (42.4%) | 19 (57.6%) |
| Community & Social Service | 73 (37.1%) | 124 (62.9%) |
| Education, Arts & Media | 12 (100.0%) | 0 (0.0%) |
| Legal Services & Support | 0 (0.0%) | 0 (0.0%) |
| Education Instruction & Library | 16 (12.3%) | 114 (87.7%) |
| Arts, Media & Entertainment | 45 (81.8%) | 10 (18.2%) |
| Health Diagnosing & Treating | 0 (0.0%) | 91 (100.0%) |
| Health Technologists | 0 (0.0%) | 61 (100.0%) |
| Total (Category) | 352 (48.9%) | 368 (51.1%) |
| Total (Overall) | 702 (52.5%) | 636 (47.5%) |
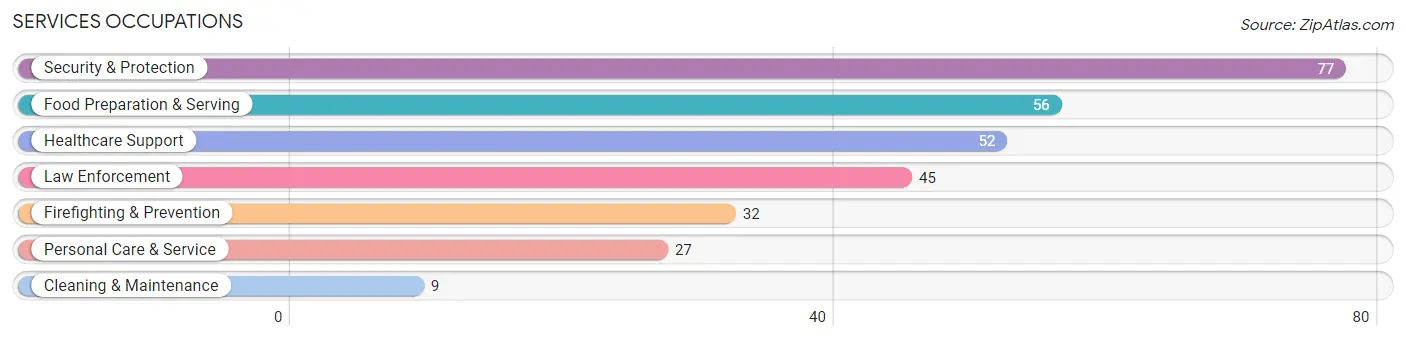
Services Occupations
The most common Services occupations in Bartonsville are Security & Protection (77 | 5.8%), Food Preparation & Serving (56 | 4.2%), Healthcare Support (52 | 3.9%), Law Enforcement (45 | 3.4%), and Firefighting & Prevention (32 | 2.4%).
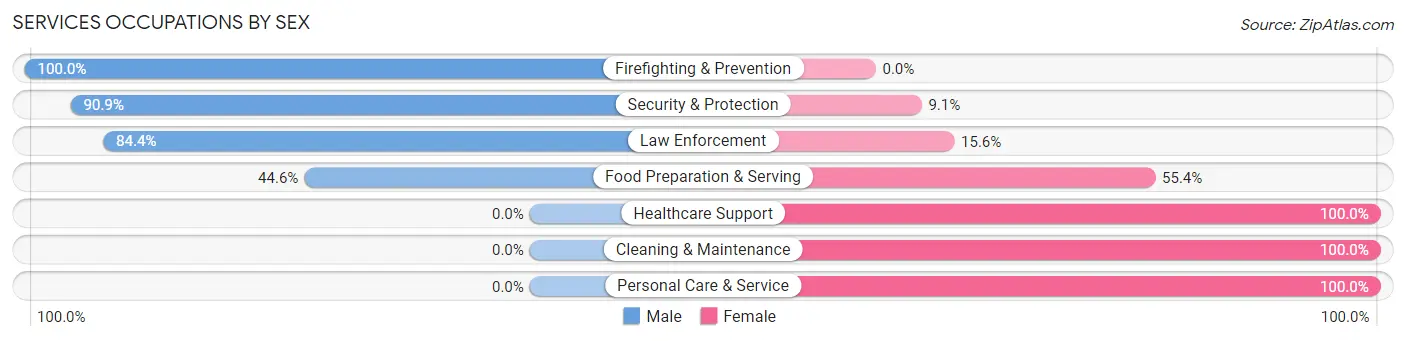
Services Occupations by Sex
Within the Services occupations in Bartonsville, the most male-oriented occupations are Firefighting & Prevention (100.0%), Security & Protection (90.9%), and Law Enforcement (84.4%), while the most female-oriented occupations are Healthcare Support (100.0%), Cleaning & Maintenance (100.0%), and Personal Care & Service (100.0%).
| Occupation | Male | Female |
| Healthcare Support | 0 (0.0%) | 52 (100.0%) |
| Security & Protection | 70 (90.9%) | 7 (9.1%) |
| Firefighting & Prevention | 32 (100.0%) | 0 (0.0%) |
| Law Enforcement | 38 (84.4%) | 7 (15.6%) |
| Food Preparation & Serving | 25 (44.6%) | 31 (55.4%) |
| Cleaning & Maintenance | 0 (0.0%) | 9 (100.0%) |
| Personal Care & Service | 0 (0.0%) | 27 (100.0%) |
| Total (Category) | 95 (43.0%) | 126 (57.0%) |
| Total (Overall) | 702 (52.5%) | 636 (47.5%) |
Sales and Office Occupations
The most common Sales and Office occupations in Bartonsville are Sales & Related (124 | 9.3%), and Office & Administration (91 | 6.8%).
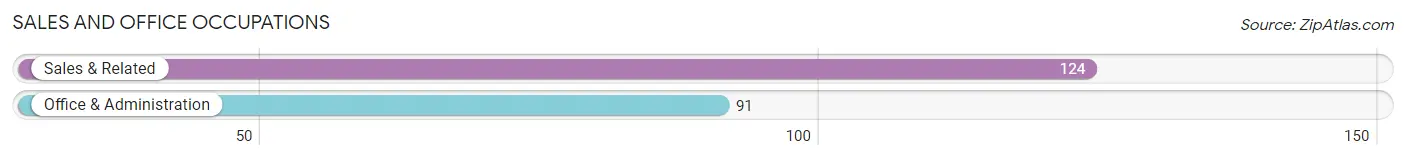
Sales and Office Occupations by Sex
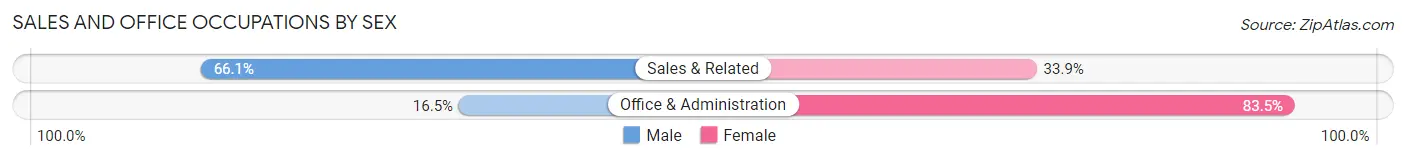
| Occupation | Male | Female |
| Sales & Related | 82 (66.1%) | 42 (33.9%) |
| Office & Administration | 15 (16.5%) | 76 (83.5%) |
| Total (Category) | 97 (45.1%) | 118 (54.9%) |
| Total (Overall) | 702 (52.5%) | 636 (47.5%) |
Natural Resources, Construction and Maintenance Occupations
The most common Natural Resources, Construction and Maintenance occupations in Bartonsville are Construction & Extraction (68 | 5.1%), and Installation, Maintenance & Repair (41 | 3.1%).
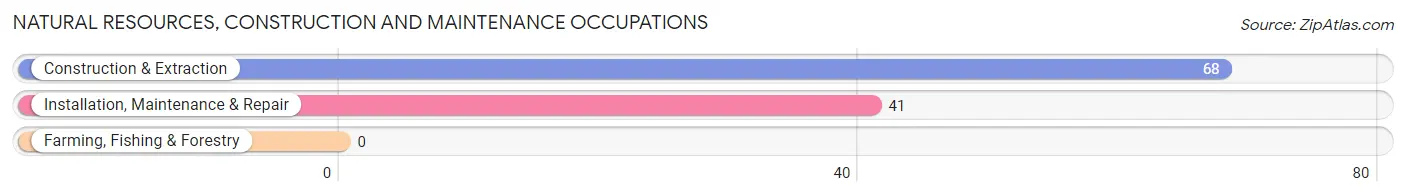
Natural Resources, Construction and Maintenance Occupations by Sex
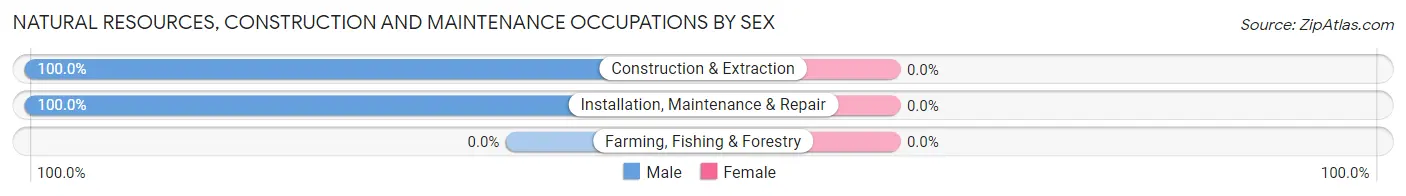
| Occupation | Male | Female |
| Farming, Fishing & Forestry | 0 (0.0%) | 0 (0.0%) |
| Construction & Extraction | 68 (100.0%) | 0 (0.0%) |
| Installation, Maintenance & Repair | 41 (100.0%) | 0 (0.0%) |
| Total (Category) | 109 (100.0%) | 0 (0.0%) |
| Total (Overall) | 702 (52.5%) | 636 (47.5%) |
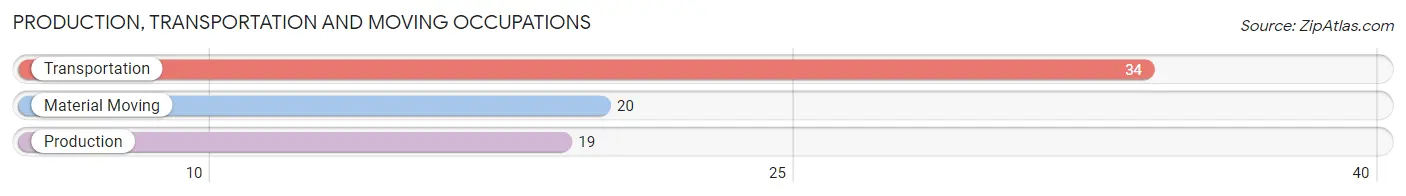
Production, Transportation and Moving Occupations
The most common Production, Transportation and Moving occupations in Bartonsville are Transportation (34 | 2.5%), Material Moving (20 | 1.5%), and Production (19 | 1.4%).
Production, Transportation and Moving Occupations by Sex
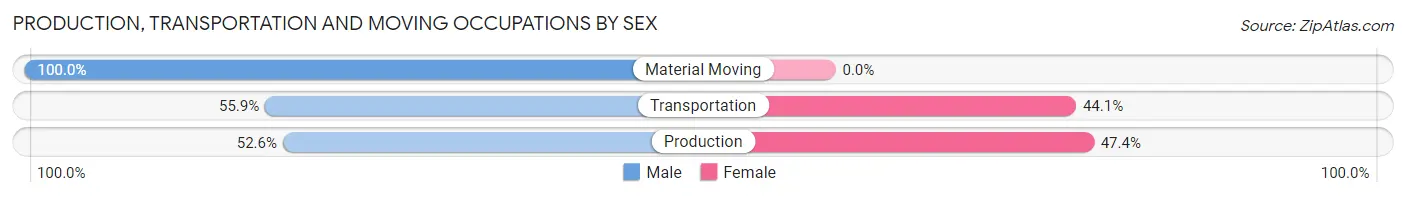
| Occupation | Male | Female |
| Production | 10 (52.6%) | 9 (47.4%) |
| Transportation | 19 (55.9%) | 15 (44.1%) |
| Material Moving | 20 (100.0%) | 0 (0.0%) |
| Total (Category) | 49 (67.1%) | 24 (32.9%) |
| Total (Overall) | 702 (52.5%) | 636 (47.5%) |
Employment Industries by Sex in Bartonsville
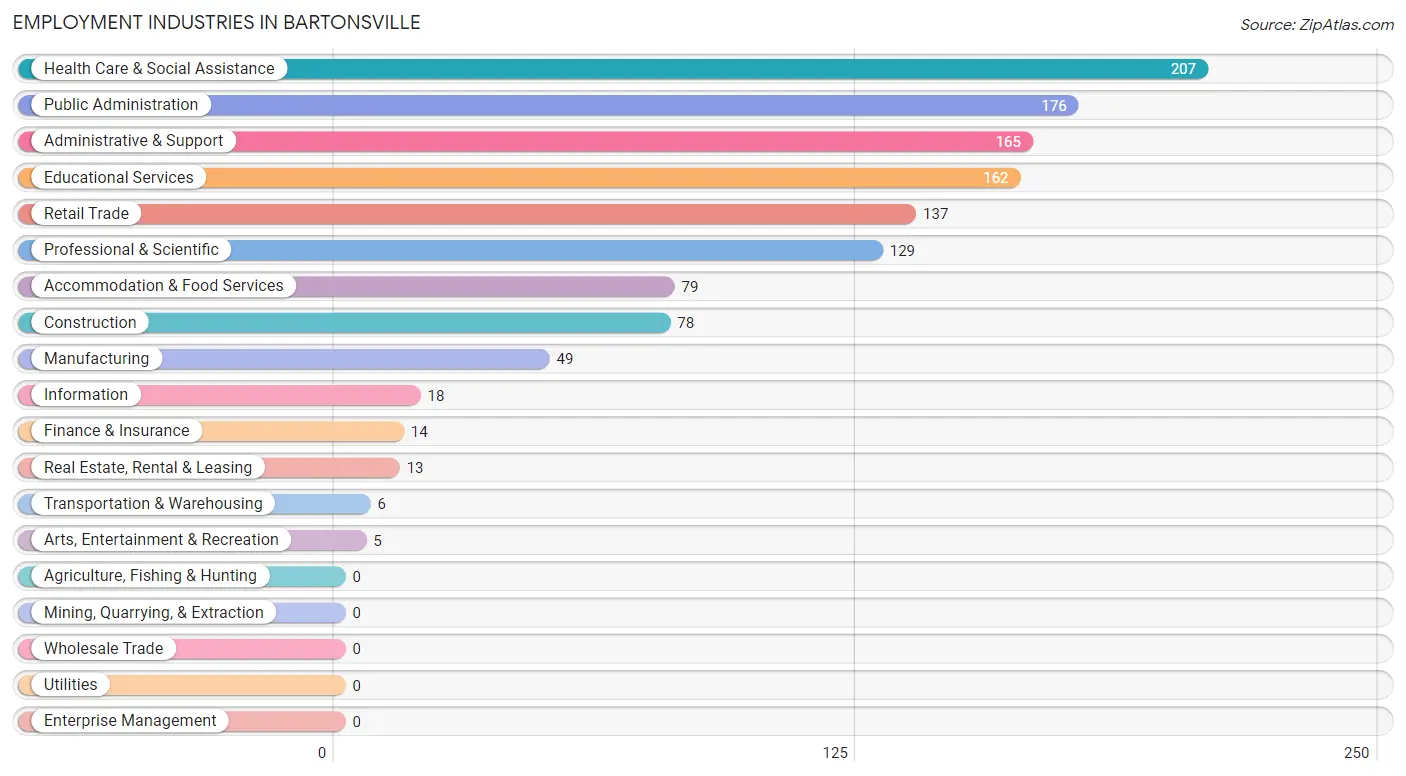
Employment Industries in Bartonsville
The major employment industries in Bartonsville include Health Care & Social Assistance (207 | 15.5%), Public Administration (176 | 13.2%), Administrative & Support (165 | 12.3%), Educational Services (162 | 12.1%), and Retail Trade (137 | 10.2%).
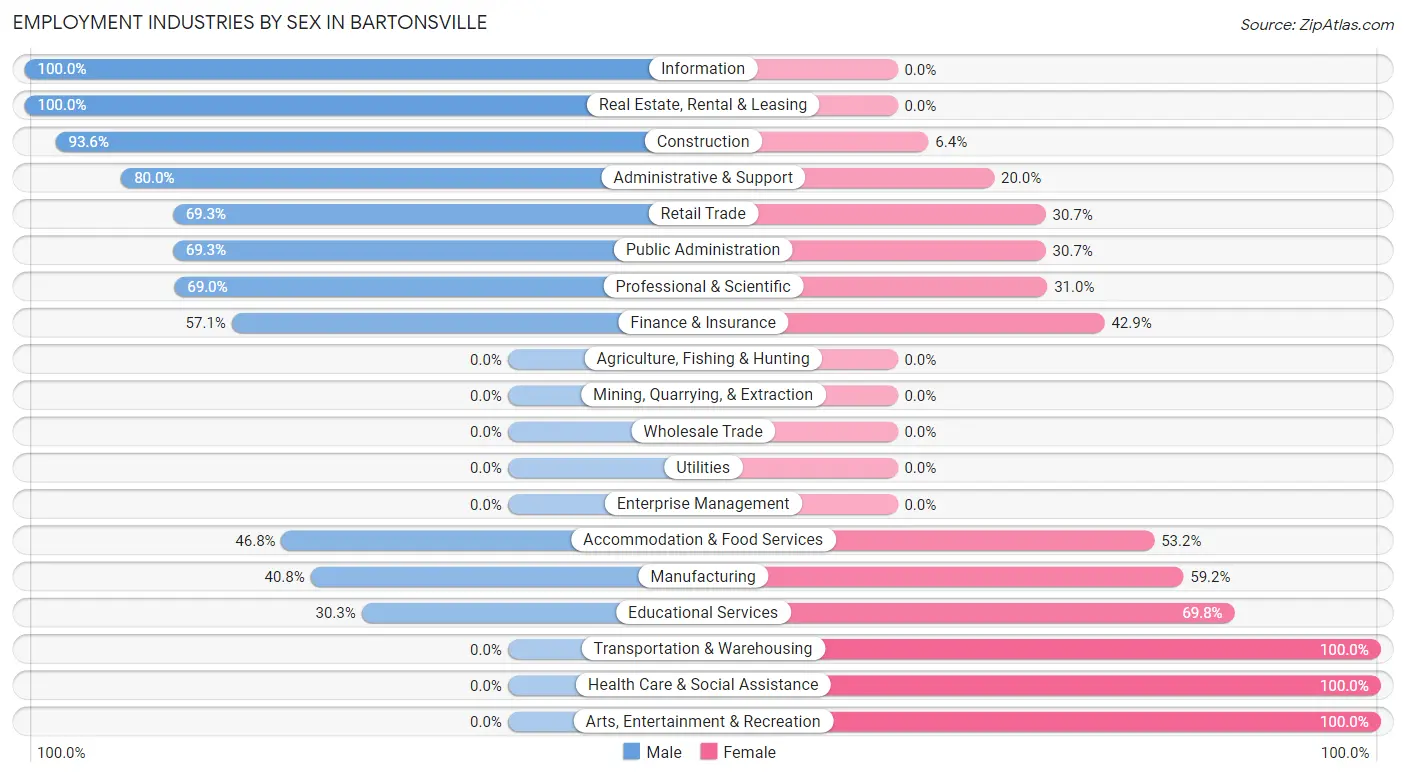
Employment Industries by Sex in Bartonsville
The Bartonsville industries that see more men than women are Information (100.0%), Real Estate, Rental & Leasing (100.0%), and Construction (93.6%), whereas the industries that tend to have a higher number of women are Transportation & Warehousing (100.0%), Health Care & Social Assistance (100.0%), and Arts, Entertainment & Recreation (100.0%).
| Industry | Male | Female |
| Agriculture, Fishing & Hunting | 0 (0.0%) | 0 (0.0%) |
| Mining, Quarrying, & Extraction | 0 (0.0%) | 0 (0.0%) |
| Construction | 73 (93.6%) | 5 (6.4%) |
| Manufacturing | 20 (40.8%) | 29 (59.2%) |
| Wholesale Trade | 0 (0.0%) | 0 (0.0%) |
| Retail Trade | 95 (69.3%) | 42 (30.7%) |
| Transportation & Warehousing | 0 (0.0%) | 6 (100.0%) |
| Utilities | 0 (0.0%) | 0 (0.0%) |
| Information | 18 (100.0%) | 0 (0.0%) |
| Finance & Insurance | 8 (57.1%) | 6 (42.9%) |
| Real Estate, Rental & Leasing | 13 (100.0%) | 0 (0.0%) |
| Professional & Scientific | 89 (69.0%) | 40 (31.0%) |
| Enterprise Management | 0 (0.0%) | 0 (0.0%) |
| Administrative & Support | 132 (80.0%) | 33 (20.0%) |
| Educational Services | 49 (30.2%) | 113 (69.8%) |
| Health Care & Social Assistance | 0 (0.0%) | 207 (100.0%) |
| Arts, Entertainment & Recreation | 0 (0.0%) | 5 (100.0%) |
| Accommodation & Food Services | 37 (46.8%) | 42 (53.2%) |
| Public Administration | 122 (69.3%) | 54 (30.7%) |
| Total | 702 (52.5%) | 636 (47.5%) |
Education in Bartonsville
School Enrollment in Bartonsville
The most common levels of schooling among the 740 students in Bartonsville are high school (182 | 24.6%), college / undergraduate (156 | 21.1%), and middle school (151 | 20.4%).
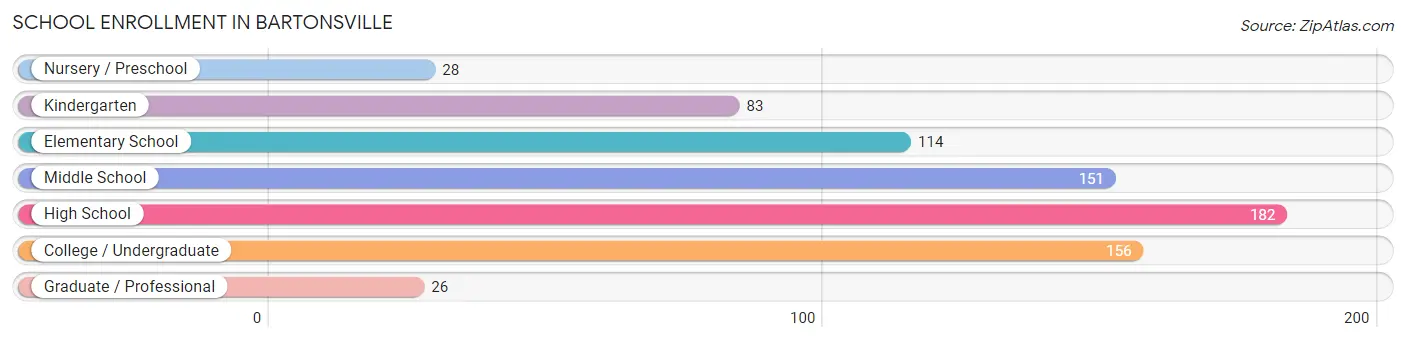
| School Level | # Students | % Students |
| Nursery / Preschool | 28 | 3.8% |
| Kindergarten | 83 | 11.2% |
| Elementary School | 114 | 15.4% |
| Middle School | 151 | 20.4% |
| High School | 182 | 24.6% |
| College / Undergraduate | 156 | 21.1% |
| Graduate / Professional | 26 | 3.5% |
| Total | 740 | 100.0% |
School Enrollment by Age by Funding Source in Bartonsville
Out of a total of 740 students who are enrolled in schools in Bartonsville, 92 (12.4%) attend a private institution, while the remaining 648 (87.6%) are enrolled in public schools. The age group of 3 to 4 year olds has the highest likelihood of being enrolled in private schools, with 25 (64.1% in the age bracket) enrolled. Conversely, the age group of 18 to 19 year olds has the lowest likelihood of being enrolled in a private school, with 27 (100.0% in the age bracket) attending a public institution.
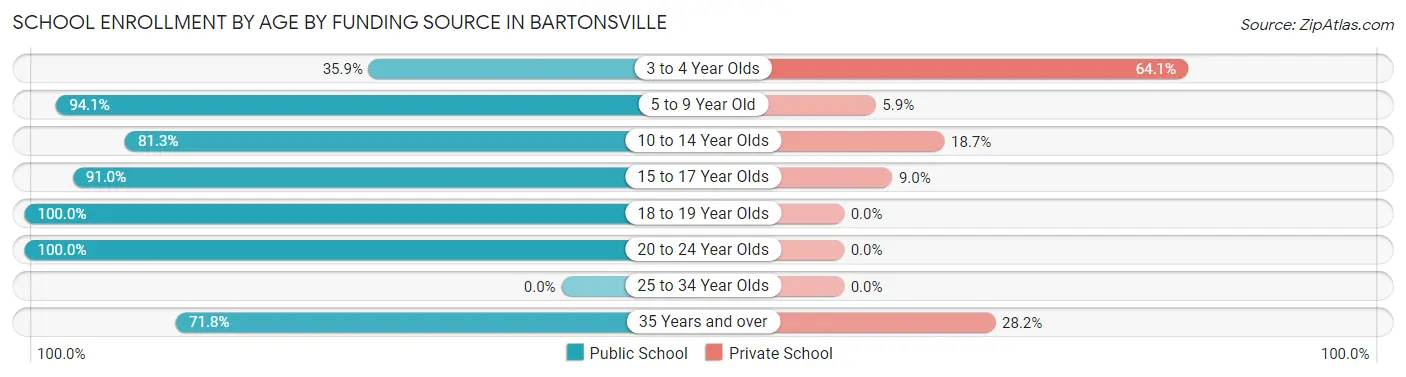
| Age Bracket | Public School | Private School |
| 3 to 4 Year Olds | 14 (35.9%) | 25 (64.1%) |
| 5 to 9 Year Old | 175 (94.1%) | 11 (5.9%) |
| 10 to 14 Year Olds | 126 (81.3%) | 29 (18.7%) |
| 15 to 17 Year Olds | 162 (91.0%) | 16 (9.0%) |
| 18 to 19 Year Olds | 27 (100.0%) | 0 (0.0%) |
| 20 to 24 Year Olds | 116 (100.0%) | 0 (0.0%) |
| 25 to 34 Year Olds | 0 (0.0%) | 0 (0.0%) |
| 35 Years and over | 28 (71.8%) | 11 (28.2%) |
| Total | 648 (87.6%) | 92 (12.4%) |
Educational Attainment by Field of Study in Bartonsville
Business (150 | 17.0%), science & technology (113 | 12.8%), arts & humanities (102 | 11.6%), social sciences (93 | 10.5%), and education (87 | 9.9%) are the most common fields of study among 882 individuals in Bartonsville who have obtained a bachelor's degree or higher.
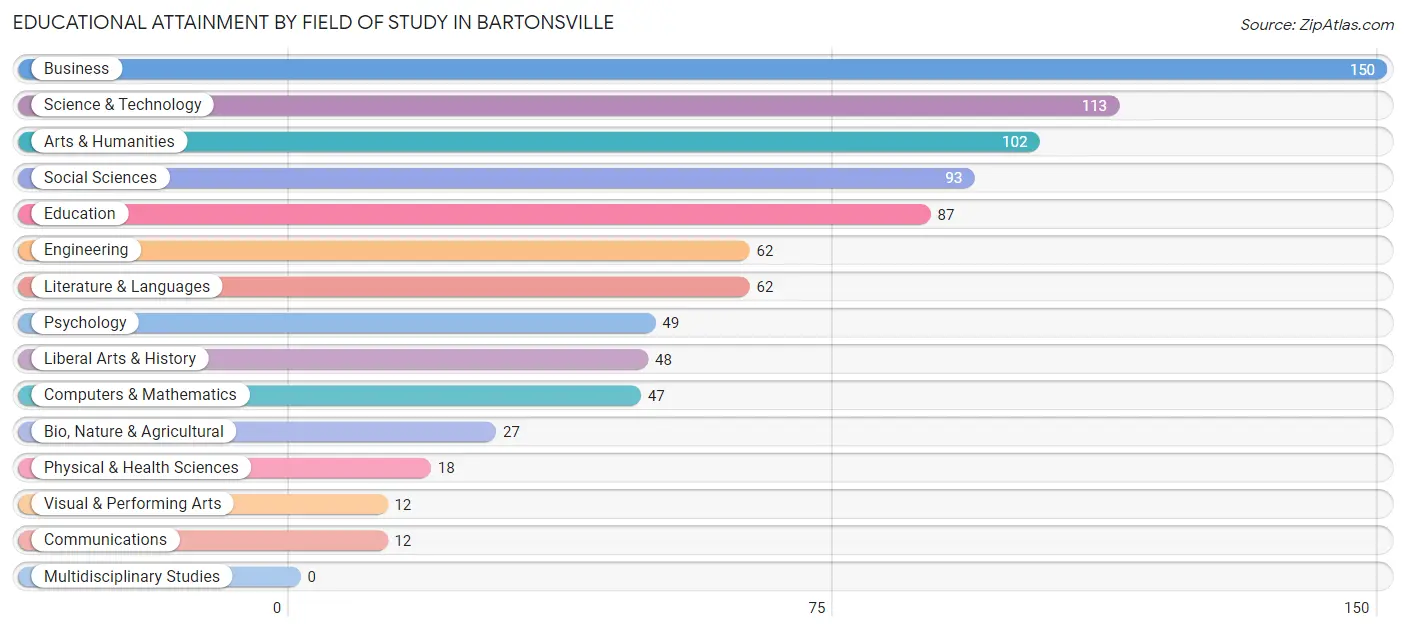
| Field of Study | # Graduates | % Graduates |
| Computers & Mathematics | 47 | 5.3% |
| Bio, Nature & Agricultural | 27 | 3.1% |
| Physical & Health Sciences | 18 | 2.0% |
| Psychology | 49 | 5.6% |
| Social Sciences | 93 | 10.5% |
| Engineering | 62 | 7.0% |
| Multidisciplinary Studies | 0 | 0.0% |
| Science & Technology | 113 | 12.8% |
| Business | 150 | 17.0% |
| Education | 87 | 9.9% |
| Literature & Languages | 62 | 7.0% |
| Liberal Arts & History | 48 | 5.4% |
| Visual & Performing Arts | 12 | 1.4% |
| Communications | 12 | 1.4% |
| Arts & Humanities | 102 | 11.6% |
| Total | 882 | 100.0% |
Transportation & Commute in Bartonsville
Vehicle Availability by Sex in Bartonsville
The most prevalent vehicle ownership categories in Bartonsville are males with 2 vehicles (274, accounting for 39.8%) and females with 2 vehicles (209, making up 42.0%).
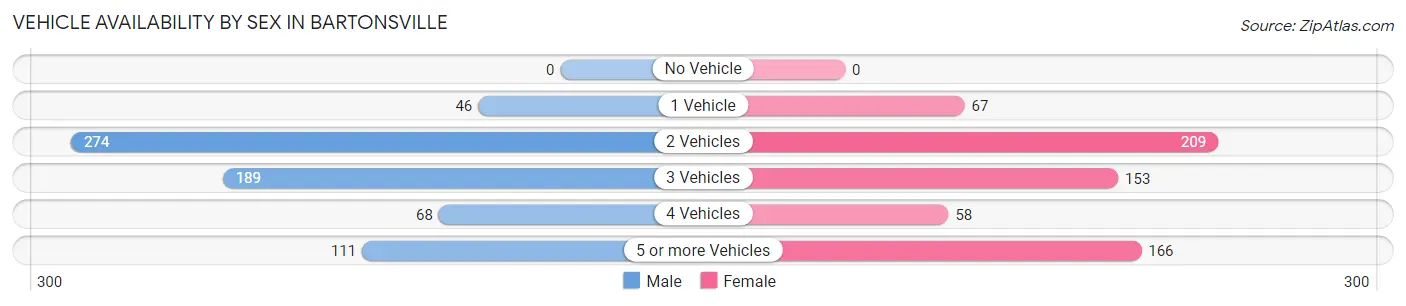
| Vehicles Available | Male | Female |
| No Vehicle | 0 (0.0%) | 0 (0.0%) |
| 1 Vehicle | 46 (6.7%) | 67 (10.3%) |
| 2 Vehicles | 274 (39.8%) | 209 (32.0%) |
| 3 Vehicles | 189 (27.5%) | 153 (23.4%) |
| 4 Vehicles | 68 (9.9%) | 58 (8.9%) |
| 5 or more Vehicles | 111 (16.1%) | 166 (25.4%) |
| Total | 688 (100.0%) | 653 (100.0%) |
Commute Time in Bartonsville
The most frequently occuring commute durations in Bartonsville are 15 to 19 minutes (186 commuters, 17.2%), 60 to 89 minutes (183 commuters, 16.9%), and 20 to 24 minutes (161 commuters, 14.8%).
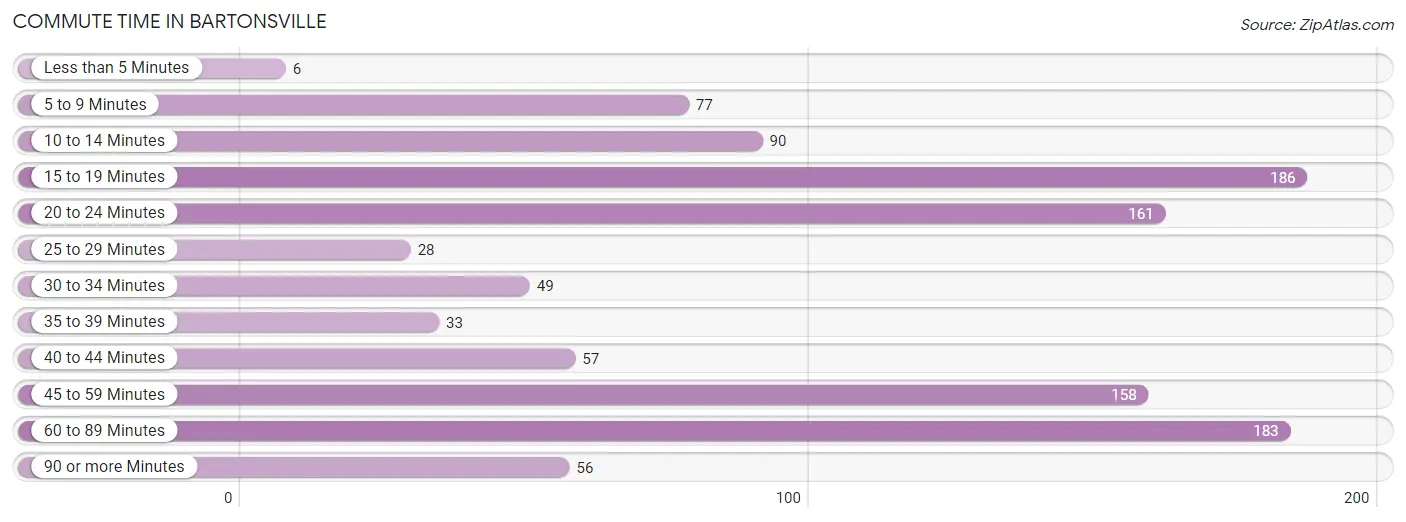
| Commute Time | # Commuters | % Commuters |
| Less than 5 Minutes | 6 | 0.5% |
| 5 to 9 Minutes | 77 | 7.1% |
| 10 to 14 Minutes | 90 | 8.3% |
| 15 to 19 Minutes | 186 | 17.2% |
| 20 to 24 Minutes | 161 | 14.8% |
| 25 to 29 Minutes | 28 | 2.6% |
| 30 to 34 Minutes | 49 | 4.5% |
| 35 to 39 Minutes | 33 | 3.0% |
| 40 to 44 Minutes | 57 | 5.3% |
| 45 to 59 Minutes | 158 | 14.6% |
| 60 to 89 Minutes | 183 | 16.9% |
| 90 or more Minutes | 56 | 5.2% |
Commute Time by Sex in Bartonsville
The most common commute times in Bartonsville are 60 to 89 minutes (138 commuters, 24.6%) for males and 15 to 19 minutes (104 commuters, 19.9%) for females.
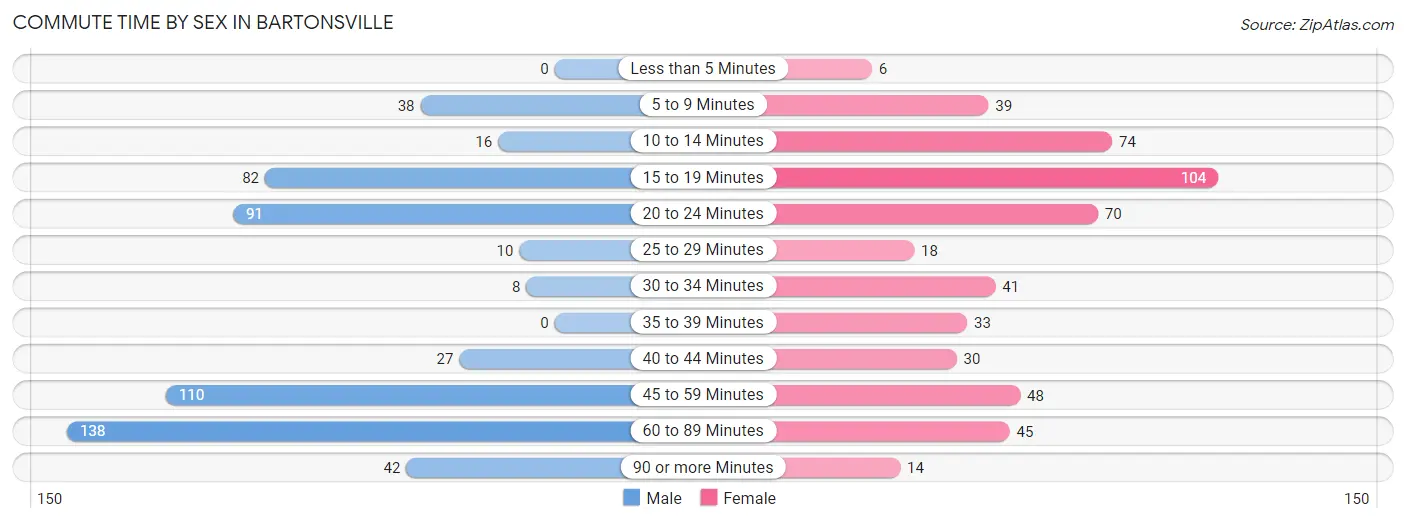
| Commute Time | Male | Female |
| Less than 5 Minutes | 0 (0.0%) | 6 (1.1%) |
| 5 to 9 Minutes | 38 (6.8%) | 39 (7.5%) |
| 10 to 14 Minutes | 16 (2.9%) | 74 (14.2%) |
| 15 to 19 Minutes | 82 (14.6%) | 104 (19.9%) |
| 20 to 24 Minutes | 91 (16.2%) | 70 (13.4%) |
| 25 to 29 Minutes | 10 (1.8%) | 18 (3.5%) |
| 30 to 34 Minutes | 8 (1.4%) | 41 (7.9%) |
| 35 to 39 Minutes | 0 (0.0%) | 33 (6.3%) |
| 40 to 44 Minutes | 27 (4.8%) | 30 (5.8%) |
| 45 to 59 Minutes | 110 (19.6%) | 48 (9.2%) |
| 60 to 89 Minutes | 138 (24.6%) | 45 (8.6%) |
| 90 or more Minutes | 42 (7.5%) | 14 (2.7%) |
Time of Departure to Work by Sex in Bartonsville
The most frequent times of departure to work in Bartonsville are 7:00 AM to 7:29 AM (131, 23.3%) for males and 7:30 AM to 7:59 AM (102, 19.5%) for females.
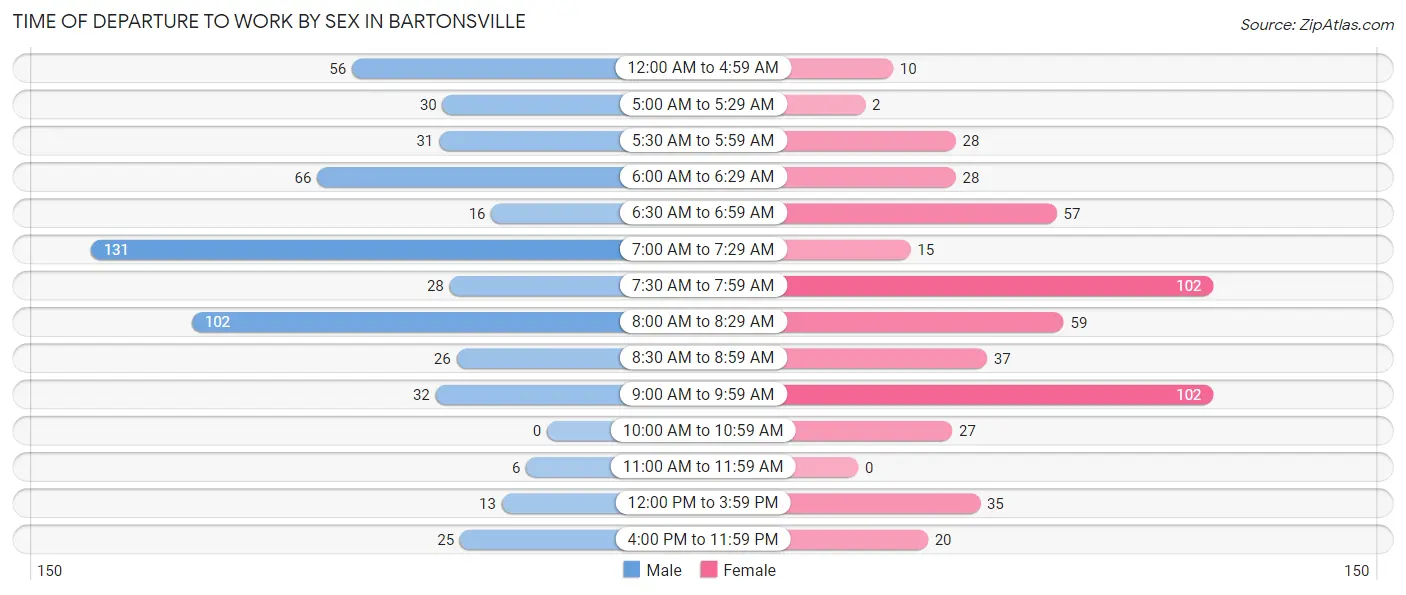
| Time of Departure | Male | Female |
| 12:00 AM to 4:59 AM | 56 (10.0%) | 10 (1.9%) |
| 5:00 AM to 5:29 AM | 30 (5.3%) | 2 (0.4%) |
| 5:30 AM to 5:59 AM | 31 (5.5%) | 28 (5.4%) |
| 6:00 AM to 6:29 AM | 66 (11.7%) | 28 (5.4%) |
| 6:30 AM to 6:59 AM | 16 (2.9%) | 57 (10.9%) |
| 7:00 AM to 7:29 AM | 131 (23.3%) | 15 (2.9%) |
| 7:30 AM to 7:59 AM | 28 (5.0%) | 102 (19.5%) |
| 8:00 AM to 8:29 AM | 102 (18.1%) | 59 (11.3%) |
| 8:30 AM to 8:59 AM | 26 (4.6%) | 37 (7.1%) |
| 9:00 AM to 9:59 AM | 32 (5.7%) | 102 (19.5%) |
| 10:00 AM to 10:59 AM | 0 (0.0%) | 27 (5.2%) |
| 11:00 AM to 11:59 AM | 6 (1.1%) | 0 (0.0%) |
| 12:00 PM to 3:59 PM | 13 (2.3%) | 35 (6.7%) |
| 4:00 PM to 11:59 PM | 25 (4.4%) | 20 (3.8%) |
| Total | 562 (100.0%) | 522 (100.0%) |
Housing Occupancy in Bartonsville
Occupancy by Ownership in Bartonsville
Of the total 773 dwellings in Bartonsville, owner-occupied units account for 737 (95.3%), while renter-occupied units make up 36 (4.7%).
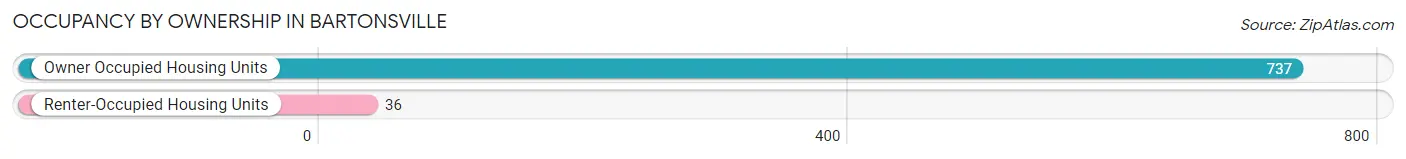
| Occupancy | # Housing Units | % Housing Units |
| Owner Occupied Housing Units | 737 | 95.3% |
| Renter-Occupied Housing Units | 36 | 4.7% |
| Total Occupied Housing Units | 773 | 100.0% |
Occupancy by Household Size in Bartonsville
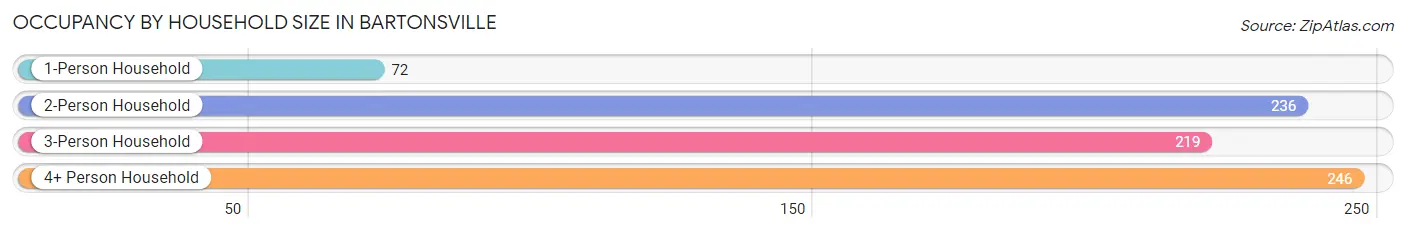
| Household Size | # Housing Units | % Housing Units |
| 1-Person Household | 72 | 9.3% |
| 2-Person Household | 236 | 30.5% |
| 3-Person Household | 219 | 28.3% |
| 4+ Person Household | 246 | 31.8% |
| Total Housing Units | 773 | 100.0% |
Occupancy by Ownership by Household Size in Bartonsville
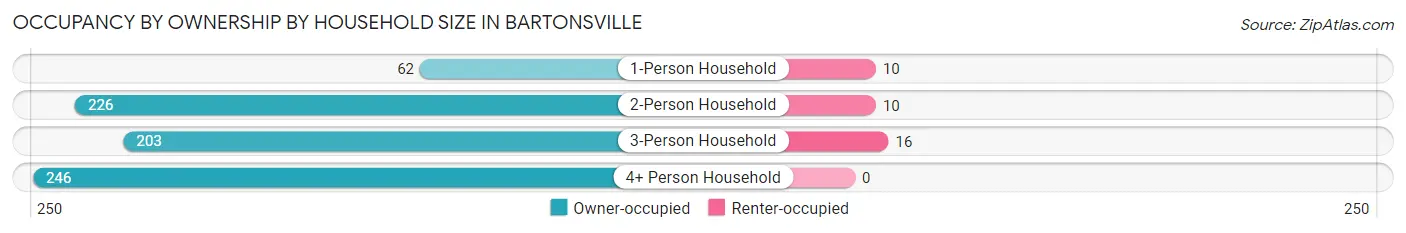
| Household Size | Owner-occupied | Renter-occupied |
| 1-Person Household | 62 (86.1%) | 10 (13.9%) |
| 2-Person Household | 226 (95.8%) | 10 (4.2%) |
| 3-Person Household | 203 (92.7%) | 16 (7.3%) |
| 4+ Person Household | 246 (100.0%) | 0 (0.0%) |
| Total Housing Units | 737 (95.3%) | 36 (4.7%) |
Occupancy by Educational Attainment in Bartonsville
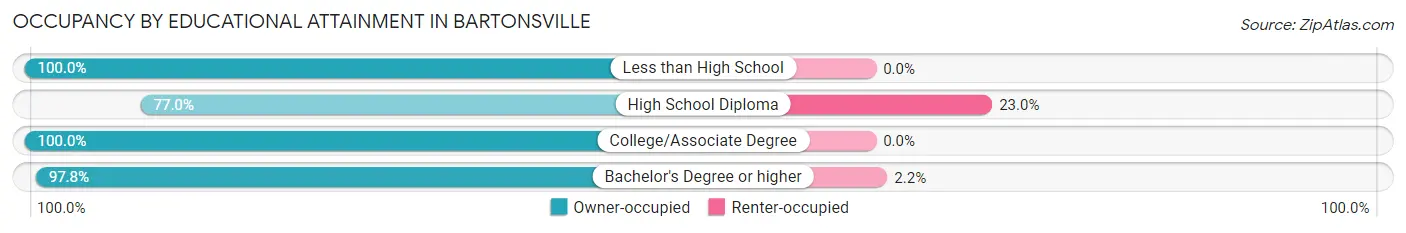
| Household Size | Owner-occupied | Renter-occupied |
| Less than High School | 10 (100.0%) | 0 (0.0%) |
| High School Diploma | 87 (77.0%) | 26 (23.0%) |
| College/Associate Degree | 202 (100.0%) | 0 (0.0%) |
| Bachelor's Degree or higher | 438 (97.8%) | 10 (2.2%) |
Occupancy by Age of Householder in Bartonsville
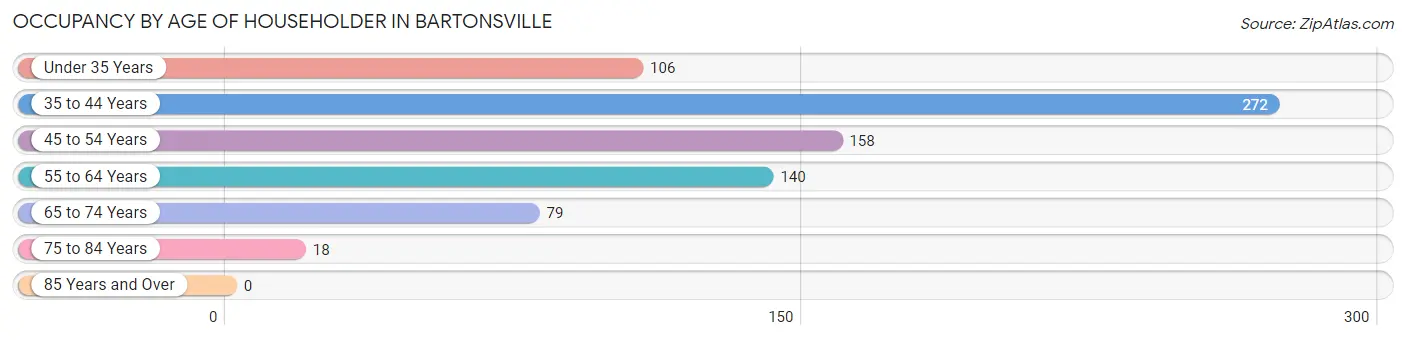
| Age Bracket | # Households | % Households |
| Under 35 Years | 106 | 13.7% |
| 35 to 44 Years | 272 | 35.2% |
| 45 to 54 Years | 158 | 20.4% |
| 55 to 64 Years | 140 | 18.1% |
| 65 to 74 Years | 79 | 10.2% |
| 75 to 84 Years | 18 | 2.3% |
| 85 Years and Over | 0 | 0.0% |
| Total | 773 | 100.0% |
Housing Finances in Bartonsville
Median Income by Occupancy in Bartonsville
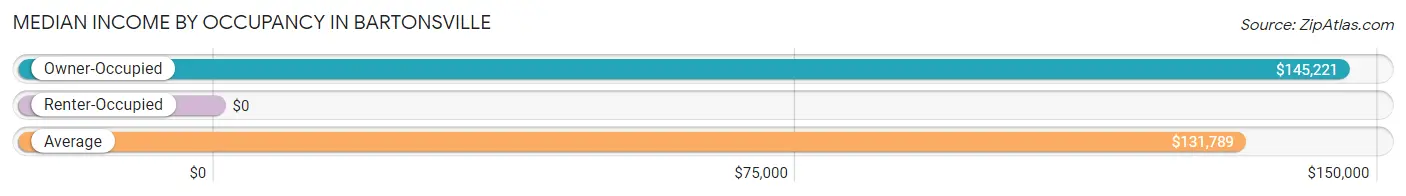
| Occupancy Type | # Households | Median Income |
| Owner-Occupied | 737 (95.3%) | $145,221 |
| Renter-Occupied | 36 (4.7%) | $0 |
| Average | 773 (100.0%) | $131,789 |
Occupancy by Householder Income Bracket in Bartonsville
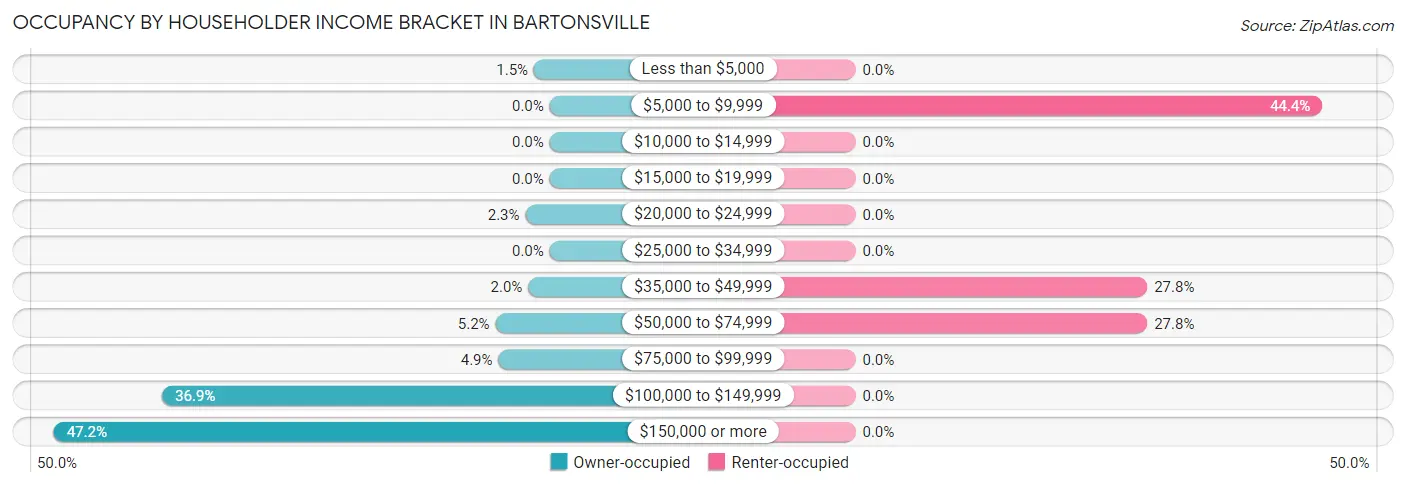
| Income Bracket | Owner-occupied | Renter-occupied |
| Less than $5,000 | 11 (1.5%) | 0 (0.0%) |
| $5,000 to $9,999 | 0 (0.0%) | 16 (44.4%) |
| $10,000 to $14,999 | 0 (0.0%) | 0 (0.0%) |
| $15,000 to $19,999 | 0 (0.0%) | 0 (0.0%) |
| $20,000 to $24,999 | 17 (2.3%) | 0 (0.0%) |
| $25,000 to $34,999 | 0 (0.0%) | 0 (0.0%) |
| $35,000 to $49,999 | 15 (2.0%) | 10 (27.8%) |
| $50,000 to $74,999 | 38 (5.2%) | 10 (27.8%) |
| $75,000 to $99,999 | 36 (4.9%) | 0 (0.0%) |
| $100,000 to $149,999 | 272 (36.9%) | 0 (0.0%) |
| $150,000 or more | 348 (47.2%) | 0 (0.0%) |
| Total | 737 (100.0%) | 36 (100.0%) |
Monthly Housing Cost Tiers in Bartonsville
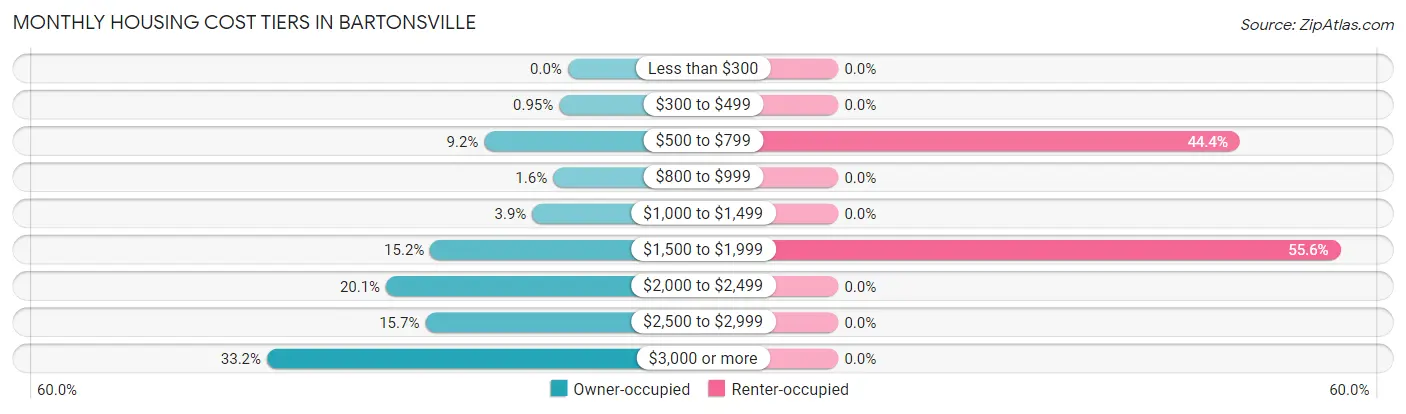
| Monthly Cost | Owner-occupied | Renter-occupied |
| Less than $300 | 0 (0.0%) | 0 (0.0%) |
| $300 to $499 | 7 (0.9%) | 0 (0.0%) |
| $500 to $799 | 68 (9.2%) | 16 (44.4%) |
| $800 to $999 | 12 (1.6%) | 0 (0.0%) |
| $1,000 to $1,499 | 29 (3.9%) | 0 (0.0%) |
| $1,500 to $1,999 | 112 (15.2%) | 20 (55.6%) |
| $2,000 to $2,499 | 148 (20.1%) | 0 (0.0%) |
| $2,500 to $2,999 | 116 (15.7%) | 0 (0.0%) |
| $3,000 or more | 245 (33.2%) | 0 (0.0%) |
| Total | 737 (100.0%) | 36 (100.0%) |
Physical Housing Characteristics in Bartonsville
Housing Structures in Bartonsville
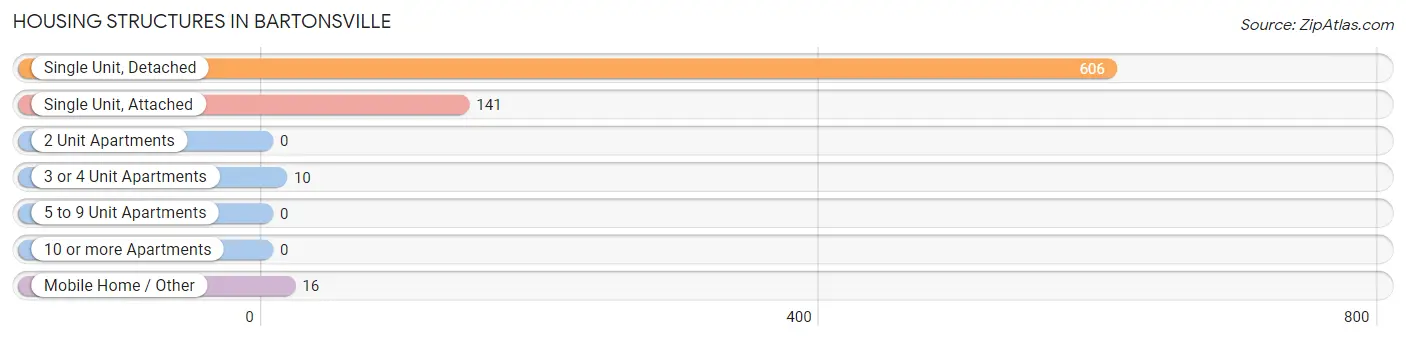
| Structure Type | # Housing Units | % Housing Units |
| Single Unit, Detached | 606 | 78.4% |
| Single Unit, Attached | 141 | 18.2% |
| 2 Unit Apartments | 0 | 0.0% |
| 3 or 4 Unit Apartments | 10 | 1.3% |
| 5 to 9 Unit Apartments | 0 | 0.0% |
| 10 or more Apartments | 0 | 0.0% |
| Mobile Home / Other | 16 | 2.1% |
| Total | 773 | 100.0% |
Housing Structures by Occupancy in Bartonsville
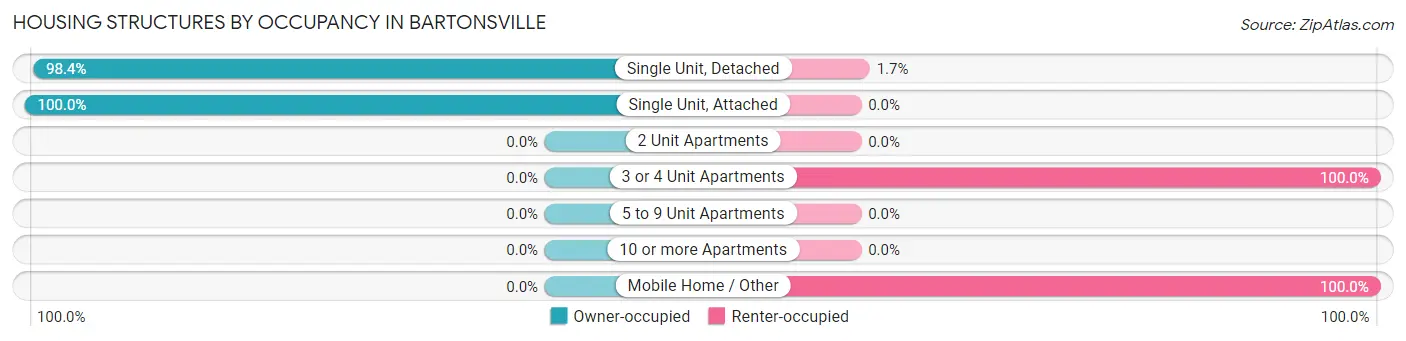
| Structure Type | Owner-occupied | Renter-occupied |
| Single Unit, Detached | 596 (98.4%) | 10 (1.7%) |
| Single Unit, Attached | 141 (100.0%) | 0 (0.0%) |
| 2 Unit Apartments | 0 (0.0%) | 0 (0.0%) |
| 3 or 4 Unit Apartments | 0 (0.0%) | 10 (100.0%) |
| 5 to 9 Unit Apartments | 0 (0.0%) | 0 (0.0%) |
| 10 or more Apartments | 0 (0.0%) | 0 (0.0%) |
| Mobile Home / Other | 0 (0.0%) | 16 (100.0%) |
| Total | 737 (95.3%) | 36 (4.7%) |
Housing Structures by Number of Rooms in Bartonsville
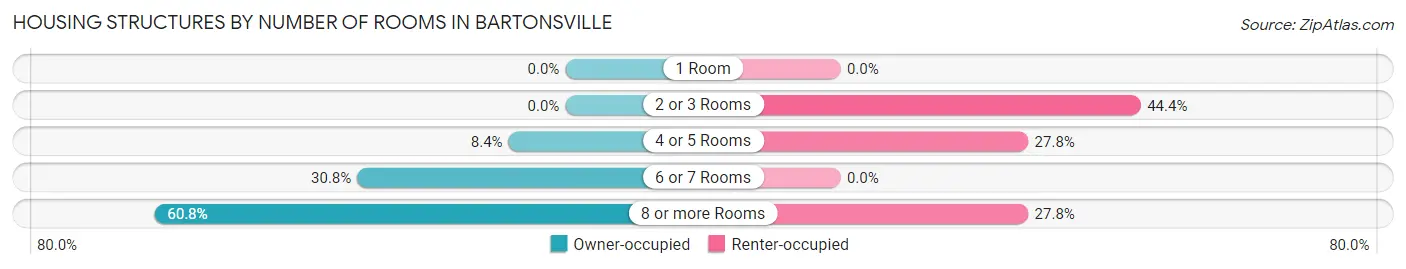
| Number of Rooms | Owner-occupied | Renter-occupied |
| 1 Room | 0 (0.0%) | 0 (0.0%) |
| 2 or 3 Rooms | 0 (0.0%) | 16 (44.4%) |
| 4 or 5 Rooms | 62 (8.4%) | 10 (27.8%) |
| 6 or 7 Rooms | 227 (30.8%) | 0 (0.0%) |
| 8 or more Rooms | 448 (60.8%) | 10 (27.8%) |
| Total | 737 (100.0%) | 36 (100.0%) |
Housing Structure by Heating Type in Bartonsville
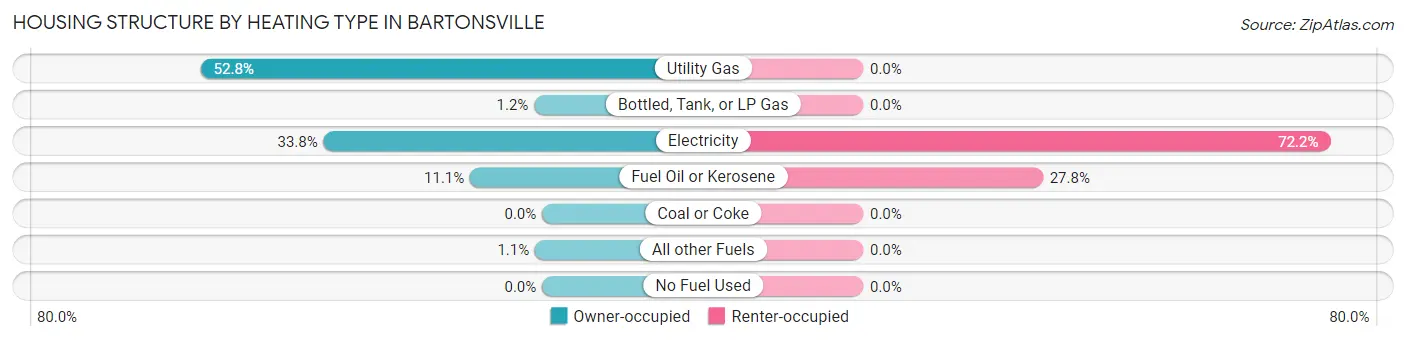
| Heating Type | Owner-occupied | Renter-occupied |
| Utility Gas | 389 (52.8%) | 0 (0.0%) |
| Bottled, Tank, or LP Gas | 9 (1.2%) | 0 (0.0%) |
| Electricity | 249 (33.8%) | 26 (72.2%) |
| Fuel Oil or Kerosene | 82 (11.1%) | 10 (27.8%) |
| Coal or Coke | 0 (0.0%) | 0 (0.0%) |
| All other Fuels | 8 (1.1%) | 0 (0.0%) |
| No Fuel Used | 0 (0.0%) | 0 (0.0%) |
| Total | 737 (100.0%) | 36 (100.0%) |
Household Vehicle Usage in Bartonsville
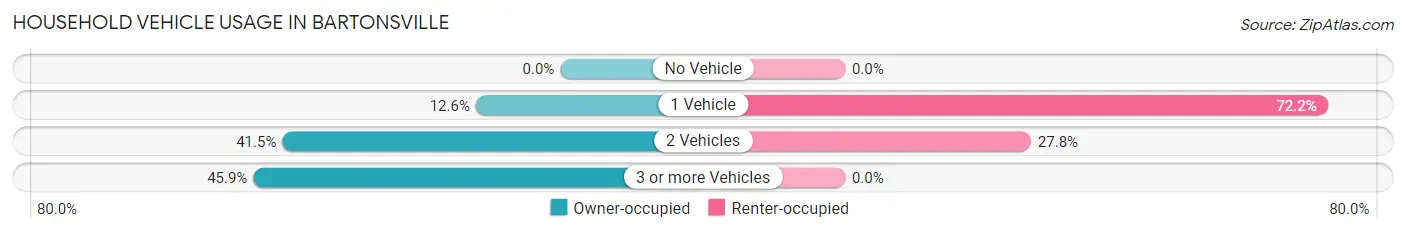
| Vehicles per Household | Owner-occupied | Renter-occupied |
| No Vehicle | 0 (0.0%) | 0 (0.0%) |
| 1 Vehicle | 93 (12.6%) | 26 (72.2%) |
| 2 Vehicles | 306 (41.5%) | 10 (27.8%) |
| 3 or more Vehicles | 338 (45.9%) | 0 (0.0%) |
| Total | 737 (100.0%) | 36 (100.0%) |
Real Estate & Mortgages in Bartonsville
Real Estate and Mortgage Overview in Bartonsville
| Characteristic | Without Mortgage | With Mortgage |
| Housing Units | 86 | 651 |
| Median Property Value | $433,300 | $557,900 |
| Median Household Income | $111,250 | $330 |
| Monthly Housing Costs | $719 | $245 |
| Real Estate Taxes | $4,359 | $29 |
Property Value by Mortgage Status in Bartonsville
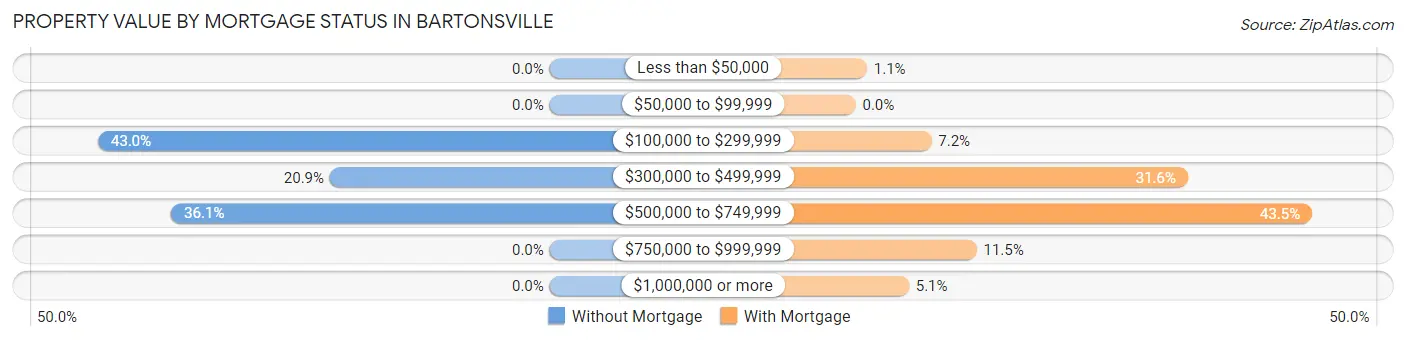
| Property Value | Without Mortgage | With Mortgage |
| Less than $50,000 | 0 (0.0%) | 7 (1.1%) |
| $50,000 to $99,999 | 0 (0.0%) | 0 (0.0%) |
| $100,000 to $299,999 | 37 (43.0%) | 47 (7.2%) |
| $300,000 to $499,999 | 18 (20.9%) | 206 (31.6%) |
| $500,000 to $749,999 | 31 (36.0%) | 283 (43.5%) |
| $750,000 to $999,999 | 0 (0.0%) | 75 (11.5%) |
| $1,000,000 or more | 0 (0.0%) | 33 (5.1%) |
| Total | 86 (100.0%) | 651 (100.0%) |
Household Income by Mortgage Status in Bartonsville
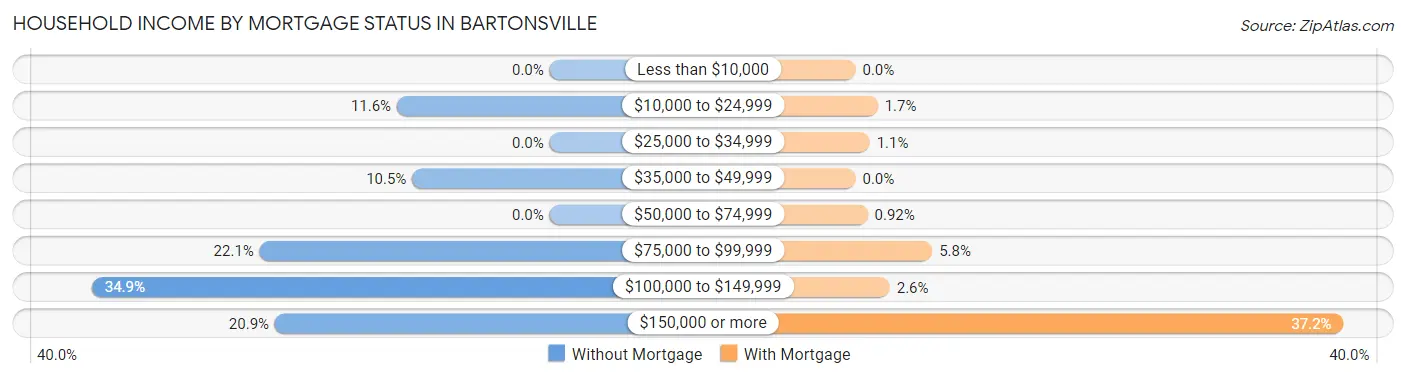
| Household Income | Without Mortgage | With Mortgage |
| Less than $10,000 | 0 (0.0%) | 0 (0.0%) |
| $10,000 to $24,999 | 10 (11.6%) | 11 (1.7%) |
| $25,000 to $34,999 | 0 (0.0%) | 7 (1.1%) |
| $35,000 to $49,999 | 9 (10.5%) | 0 (0.0%) |
| $50,000 to $74,999 | 0 (0.0%) | 6 (0.9%) |
| $75,000 to $99,999 | 19 (22.1%) | 38 (5.8%) |
| $100,000 to $149,999 | 30 (34.9%) | 17 (2.6%) |
| $150,000 or more | 18 (20.9%) | 242 (37.2%) |
| Total | 86 (100.0%) | 651 (100.0%) |
Property Value to Household Income Ratio in Bartonsville
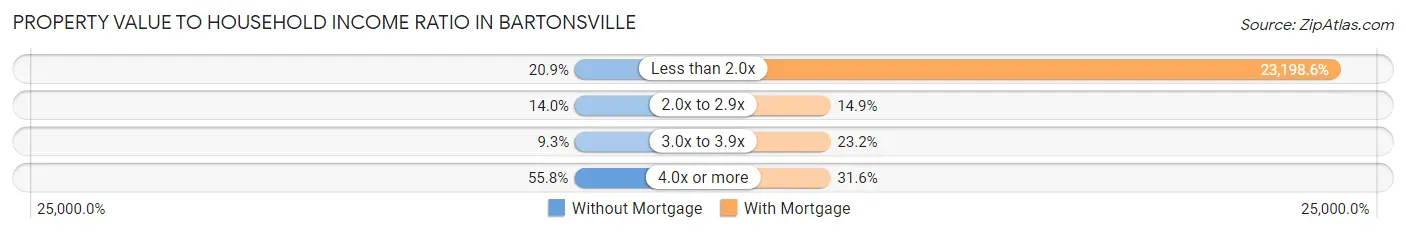
| Value-to-Income Ratio | Without Mortgage | With Mortgage |
| Less than 2.0x | 18 (20.9%) | 151,023 (23,198.6%) |
| 2.0x to 2.9x | 12 (14.0%) | 97 (14.9%) |
| 3.0x to 3.9x | 8 (9.3%) | 151 (23.2%) |
| 4.0x or more | 48 (55.8%) | 206 (31.6%) |
| Total | 86 (100.0%) | 651 (100.0%) |
Real Estate Taxes by Mortgage Status in Bartonsville
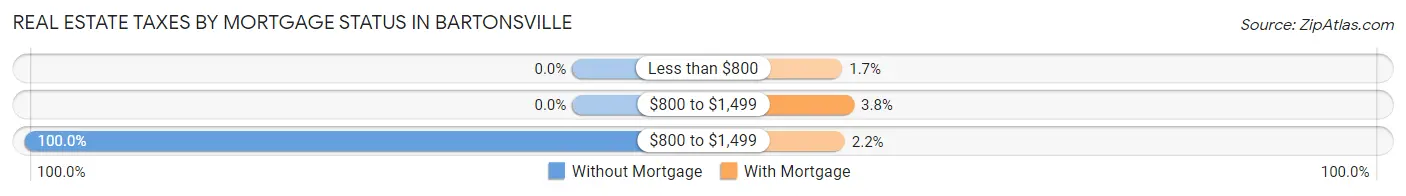
| Property Taxes | Without Mortgage | With Mortgage |
| Less than $800 | 0 (0.0%) | 11 (1.7%) |
| $800 to $1,499 | 0 (0.0%) | 25 (3.8%) |
| $800 to $1,499 | 86 (100.0%) | 14 (2.1%) |
| Total | 86 (100.0%) | 651 (100.0%) |
Health & Disability in Bartonsville
Health Insurance Coverage by Age in Bartonsville
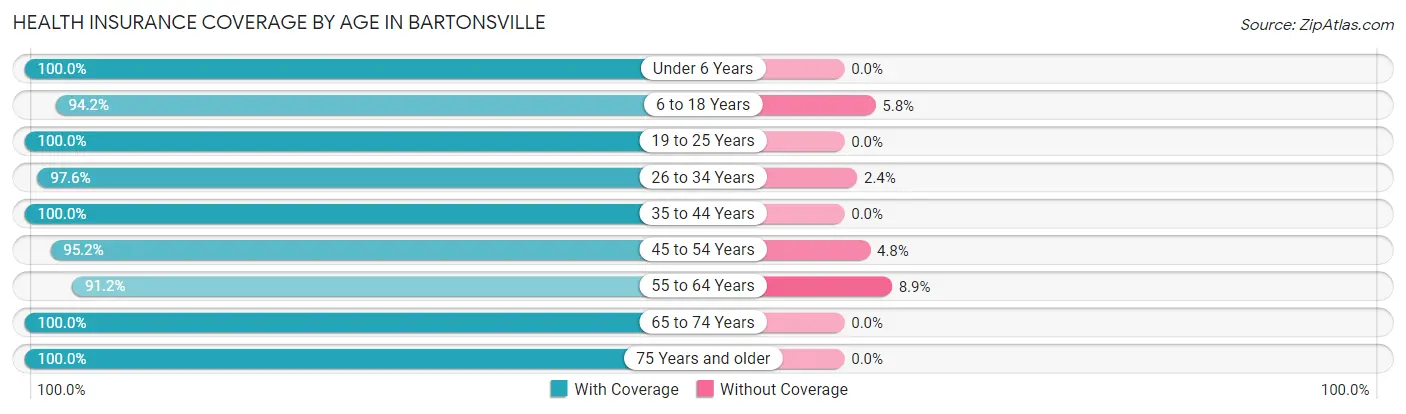
| Age Bracket | With Coverage | Without Coverage |
| Under 6 Years | 280 (100.0%) | 0 (0.0%) |
| 6 to 18 Years | 456 (94.2%) | 28 (5.8%) |
| 19 to 25 Years | 142 (100.0%) | 0 (0.0%) |
| 26 to 34 Years | 205 (97.6%) | 5 (2.4%) |
| 35 to 44 Years | 504 (100.0%) | 0 (0.0%) |
| 45 to 54 Years | 258 (95.2%) | 13 (4.8%) |
| 55 to 64 Years | 237 (91.1%) | 23 (8.8%) |
| 65 to 74 Years | 156 (100.0%) | 0 (0.0%) |
| 75 Years and older | 37 (100.0%) | 0 (0.0%) |
| Total | 2,275 (97.1%) | 69 (2.9%) |
Health Insurance Coverage by Citizenship Status in Bartonsville

| Citizenship Status | With Coverage | Without Coverage |
| Native Born | 280 (100.0%) | 0 (0.0%) |
| Foreign Born, Citizen | 456 (94.2%) | 28 (5.8%) |
| Foreign Born, not a Citizen | 142 (100.0%) | 0 (0.0%) |
Health Insurance Coverage by Household Income in Bartonsville

| Household Income | With Coverage | Without Coverage |
| Under $25,000 | 113 (100.0%) | 0 (0.0%) |
| $25,000 to $49,999 | 22 (68.8%) | 10 (31.2%) |
| $50,000 to $74,999 | 83 (76.1%) | 26 (23.8%) |
| $75,000 to $99,999 | 107 (100.0%) | 0 (0.0%) |
| $100,000 and over | 1,950 (98.3%) | 33 (1.7%) |
Public vs Private Health Insurance Coverage by Age in Bartonsville
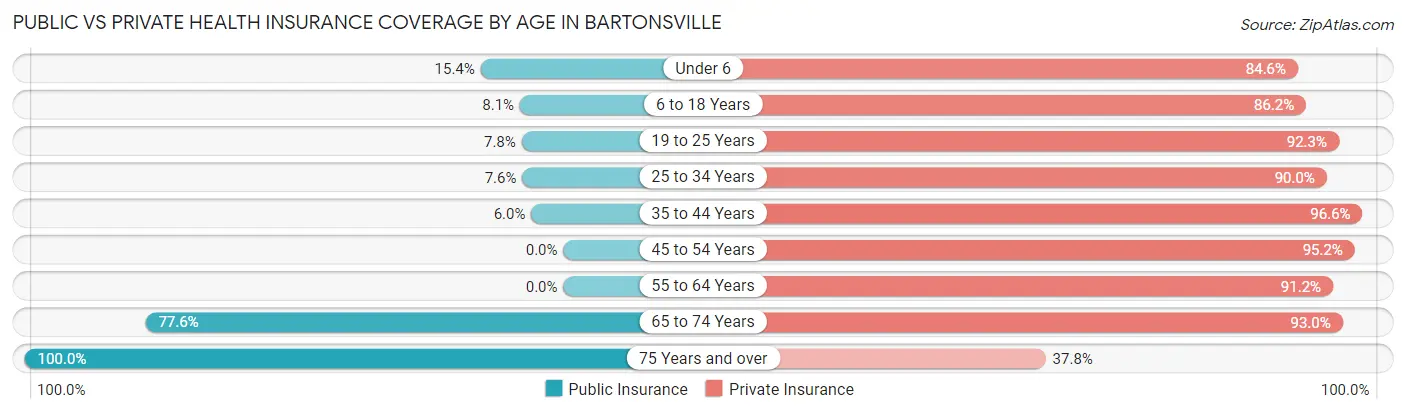
| Age Bracket | Public Insurance | Private Insurance |
| Under 6 | 43 (15.4%) | 237 (84.6%) |
| 6 to 18 Years | 39 (8.1%) | 417 (86.2%) |
| 19 to 25 Years | 11 (7.7%) | 131 (92.2%) |
| 25 to 34 Years | 16 (7.6%) | 189 (90.0%) |
| 35 to 44 Years | 30 (5.9%) | 487 (96.6%) |
| 45 to 54 Years | 0 (0.0%) | 258 (95.2%) |
| 55 to 64 Years | 0 (0.0%) | 237 (91.1%) |
| 65 to 74 Years | 121 (77.6%) | 145 (92.9%) |
| 75 Years and over | 37 (100.0%) | 14 (37.8%) |
| Total | 297 (12.7%) | 2,115 (90.2%) |
Disability Status by Sex by Age in Bartonsville
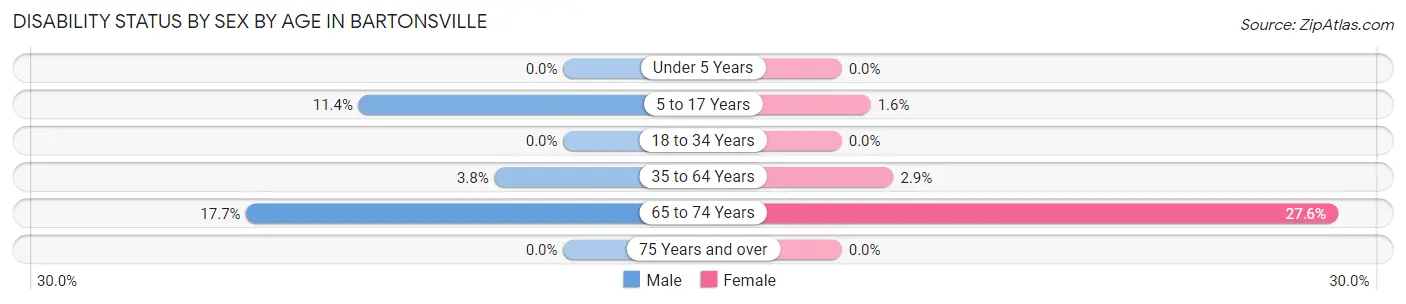
| Age Bracket | Male | Female |
| Under 5 Years | 0 (0.0%) | 0 (0.0%) |
| 5 to 17 Years | 18 (11.4%) | 6 (1.6%) |
| 18 to 34 Years | 0 (0.0%) | 0 (0.0%) |
| 35 to 64 Years | 21 (3.8%) | 14 (2.9%) |
| 65 to 74 Years | 9 (17.6%) | 29 (27.6%) |
| 75 Years and over | 0 (0.0%) | 0 (0.0%) |
Disability Class by Sex by Age in Bartonsville
Disability Class: Hearing Difficulty
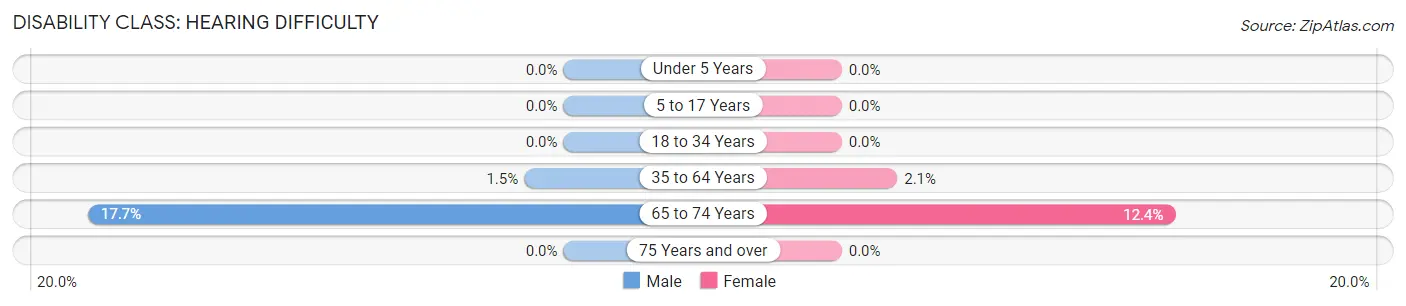
| Age Bracket | Male | Female |
| Under 5 Years | 0 (0.0%) | 0 (0.0%) |
| 5 to 17 Years | 0 (0.0%) | 0 (0.0%) |
| 18 to 34 Years | 0 (0.0%) | 0 (0.0%) |
| 35 to 64 Years | 8 (1.5%) | 10 (2.1%) |
| 65 to 74 Years | 9 (17.6%) | 13 (12.4%) |
| 75 Years and over | 0 (0.0%) | 0 (0.0%) |
Disability Class: Vision Difficulty
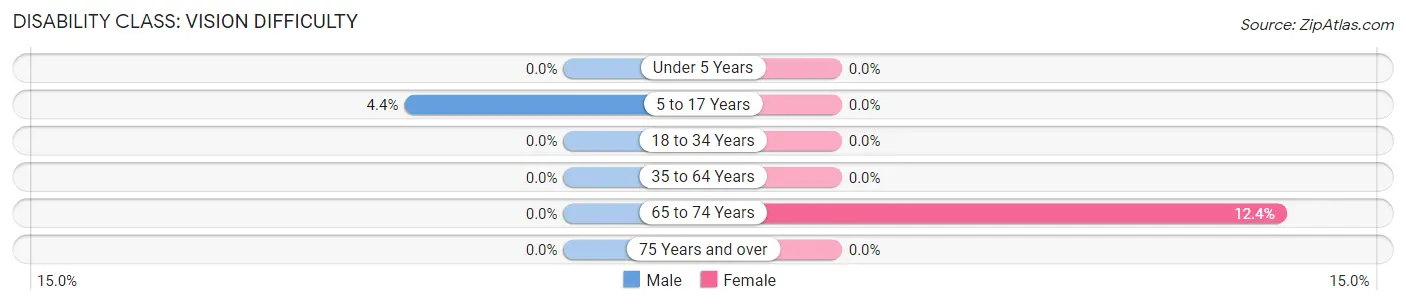
| Age Bracket | Male | Female |
| Under 5 Years | 0 (0.0%) | 0 (0.0%) |
| 5 to 17 Years | 7 (4.4%) | 0 (0.0%) |
| 18 to 34 Years | 0 (0.0%) | 0 (0.0%) |
| 35 to 64 Years | 0 (0.0%) | 0 (0.0%) |
| 65 to 74 Years | 0 (0.0%) | 13 (12.4%) |
| 75 Years and over | 0 (0.0%) | 0 (0.0%) |
Disability Class: Cognitive Difficulty
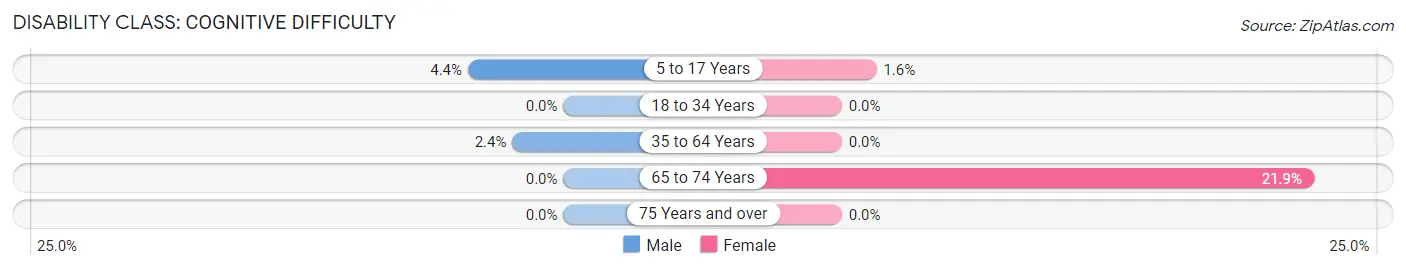
| Age Bracket | Male | Female |
| 5 to 17 Years | 7 (4.4%) | 6 (1.6%) |
| 18 to 34 Years | 0 (0.0%) | 0 (0.0%) |
| 35 to 64 Years | 13 (2.4%) | 0 (0.0%) |
| 65 to 74 Years | 0 (0.0%) | 23 (21.9%) |
| 75 Years and over | 0 (0.0%) | 0 (0.0%) |
Disability Class: Ambulatory Difficulty
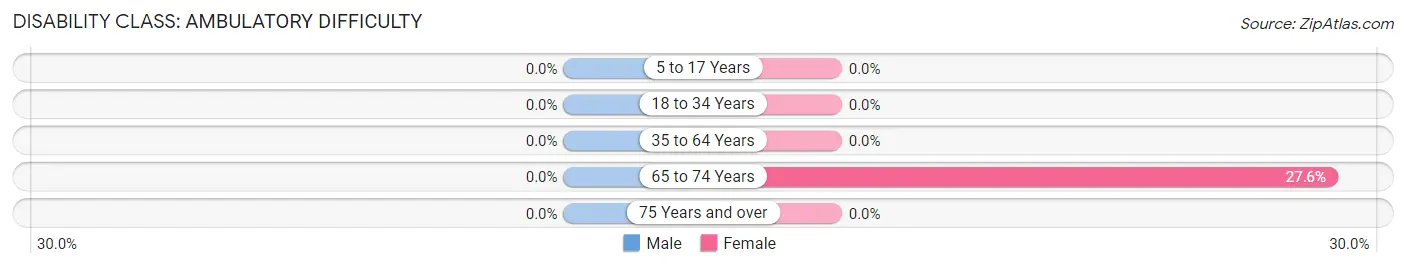
| Age Bracket | Male | Female |
| 5 to 17 Years | 0 (0.0%) | 0 (0.0%) |
| 18 to 34 Years | 0 (0.0%) | 0 (0.0%) |
| 35 to 64 Years | 0 (0.0%) | 0 (0.0%) |
| 65 to 74 Years | 0 (0.0%) | 29 (27.6%) |
| 75 Years and over | 0 (0.0%) | 0 (0.0%) |
Disability Class: Self-Care Difficulty
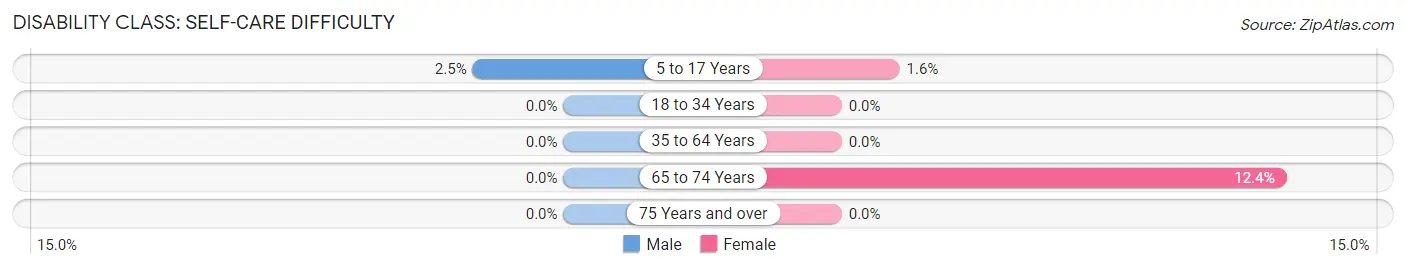
| Age Bracket | Male | Female |
| 5 to 17 Years | 4 (2.5%) | 6 (1.6%) |
| 18 to 34 Years | 0 (0.0%) | 0 (0.0%) |
| 35 to 64 Years | 0 (0.0%) | 0 (0.0%) |
| 65 to 74 Years | 0 (0.0%) | 13 (12.4%) |
| 75 Years and over | 0 (0.0%) | 0 (0.0%) |
Technology Access in Bartonsville
Computing Device Access in Bartonsville
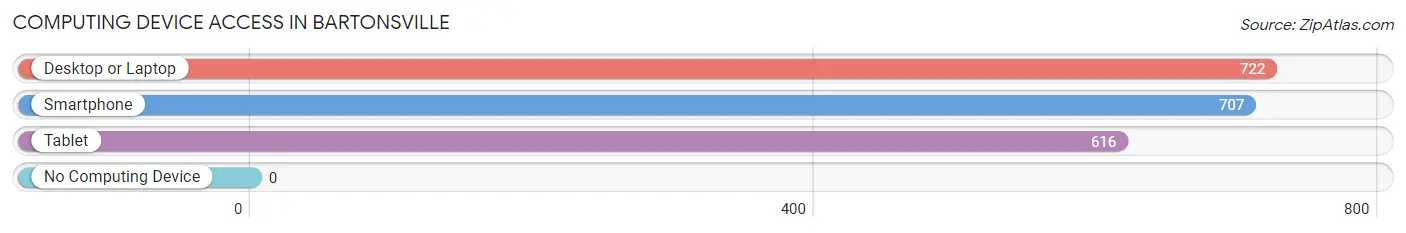
| Device Type | # Households | % Households |
| Desktop or Laptop | 722 | 93.4% |
| Smartphone | 707 | 91.5% |
| Tablet | 616 | 79.7% |
| No Computing Device | 0 | 0.0% |
| Total | 773 | 100.0% |
Internet Access in Bartonsville
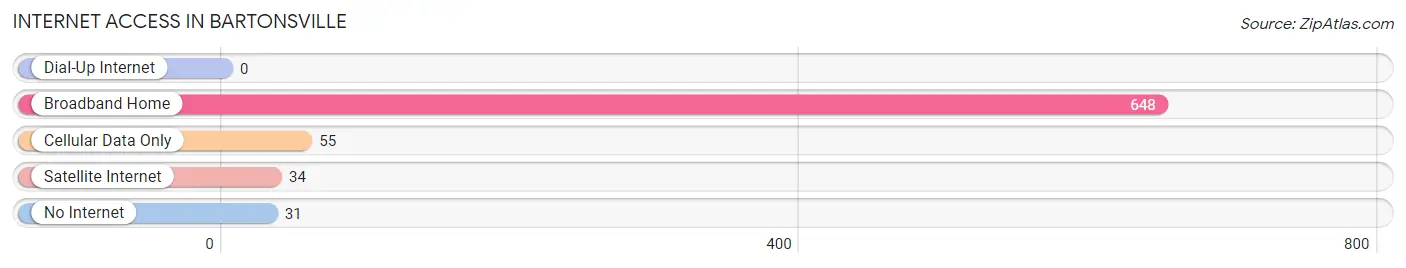
| Internet Type | # Households | % Households |
| Dial-Up Internet | 0 | 0.0% |
| Broadband Home | 648 | 83.8% |
| Cellular Data Only | 55 | 7.1% |
| Satellite Internet | 34 | 4.4% |
| No Internet | 31 | 4.0% |
| Total | 773 | 100.0% |
Bartonsville Summary
Bartonsville is an unincorporated community located in Frederick County, Maryland, United States. It is situated in the Catoctin Valley, approximately 8 miles (13 km) south of Frederick and 8 miles (13 km) north of Thurmont. The population of Bartonsville was estimated to be 1,845 in 2019.
History
Bartonsville was founded in 1790 by William Barton, a Revolutionary War veteran. The town was originally known as Barton's Crossroads, and was later renamed Bartonsville. The town was a major stop on the National Road, which was the first federally funded highway in the United States. The road was built in the early 19th century to connect the Potomac and Ohio Rivers.
The town was also home to a number of mills, including a grist mill, a saw mill, and a woolen mill. The mills were powered by the nearby Catoctin Creek. The town also had a post office, a general store, and a blacksmith shop.
Geography
Bartonsville is located in the Catoctin Valley of Frederick County, Maryland. The town is situated at the intersection of Maryland Route 15 and Maryland Route 77. The town is 8 miles (13 km) south of Frederick and 8 miles (13 km) north of Thurmont.
The town is located in the Appalachian Mountains, and is surrounded by rolling hills and forests. The Catoctin Creek runs through the town, and is a popular spot for fishing and canoeing.
Economy
The economy of Bartonsville is largely based on agriculture and tourism. The town is home to several farms, which produce a variety of crops, including corn, soybeans, and hay. The town is also home to several wineries, which produce a variety of wines.
The town is also a popular tourist destination, due to its proximity to the Catoctin Mountain Park and the Appalachian Trail. The town is home to several bed and breakfasts, as well as a number of restaurants and shops.
Demographics
As of the 2010 census, the population of Bartonsville was 1,845. The racial makeup of the town was 94.3% White, 2.2% African American, 0.3% Native American, 0.7% Asian, 0.1% Pacific Islander, 0.7% from other races, and 1.9% from two or more races. Hispanic or Latino of any race were 2.2% of the population.
The median household income in Bartonsville was $60,938, and the median family income was $68,750. The per capita income was $25,945. About 5.3% of families and 7.2% of the population were below the poverty line, including 8.3% of those under age 18 and 5.2% of those age 65 or over.
Common Questions
What is Per Capita Income in Bartonsville?
Per Capita income in Bartonsville is $57,209.
What is the Median Family Income in Bartonsville?
Median Family Income in Bartonsville is $146,985.
What is the Median Household income in Bartonsville?
Median Household Income in Bartonsville is $131,789.
What is Income or Wage Gap in Bartonsville?
Income or Wage Gap in Bartonsville is 28.9%.
Women in Bartonsville earn 71.1 cents for every dollar earned by a man.
What is Inequality or Gini Index in Bartonsville?
Inequality or Gini Index in Bartonsville is 0.35.
What is the Total Population of Bartonsville?
Total Population of Bartonsville is 2,373.
What is the Total Male Population of Bartonsville?
Total Male Population of Bartonsville is 1,120.
What is the Total Female Population of Bartonsville?
Total Female Population of Bartonsville is 1,253.
What is the Ratio of Males per 100 Females in Bartonsville?
There are 89.39 Males per 100 Females in Bartonsville.
What is the Ratio of Females per 100 Males in Bartonsville?
There are 111.88 Females per 100 Males in Bartonsville.
What is the Median Population Age in Bartonsville?
Median Population Age in Bartonsville is 35.9 Years.
What is the Average Family Size in Bartonsville
Average Family Size in Bartonsville is 3.1 People.
What is the Average Household Size in Bartonsville
Average Household Size in Bartonsville is 3.1 People.
How Large is the Labor Force in Bartonsville?
There are 1,400 People in the Labor Forcein in Bartonsville.
What is the Percentage of People in the Labor Force in Bartonsville?
80.7% of People are in the Labor Force in Bartonsville.
What is the Unemployment Rate in Bartonsville?
Unemployment Rate in Bartonsville is 2.5%.