Glenarden, MD Map & Demographics
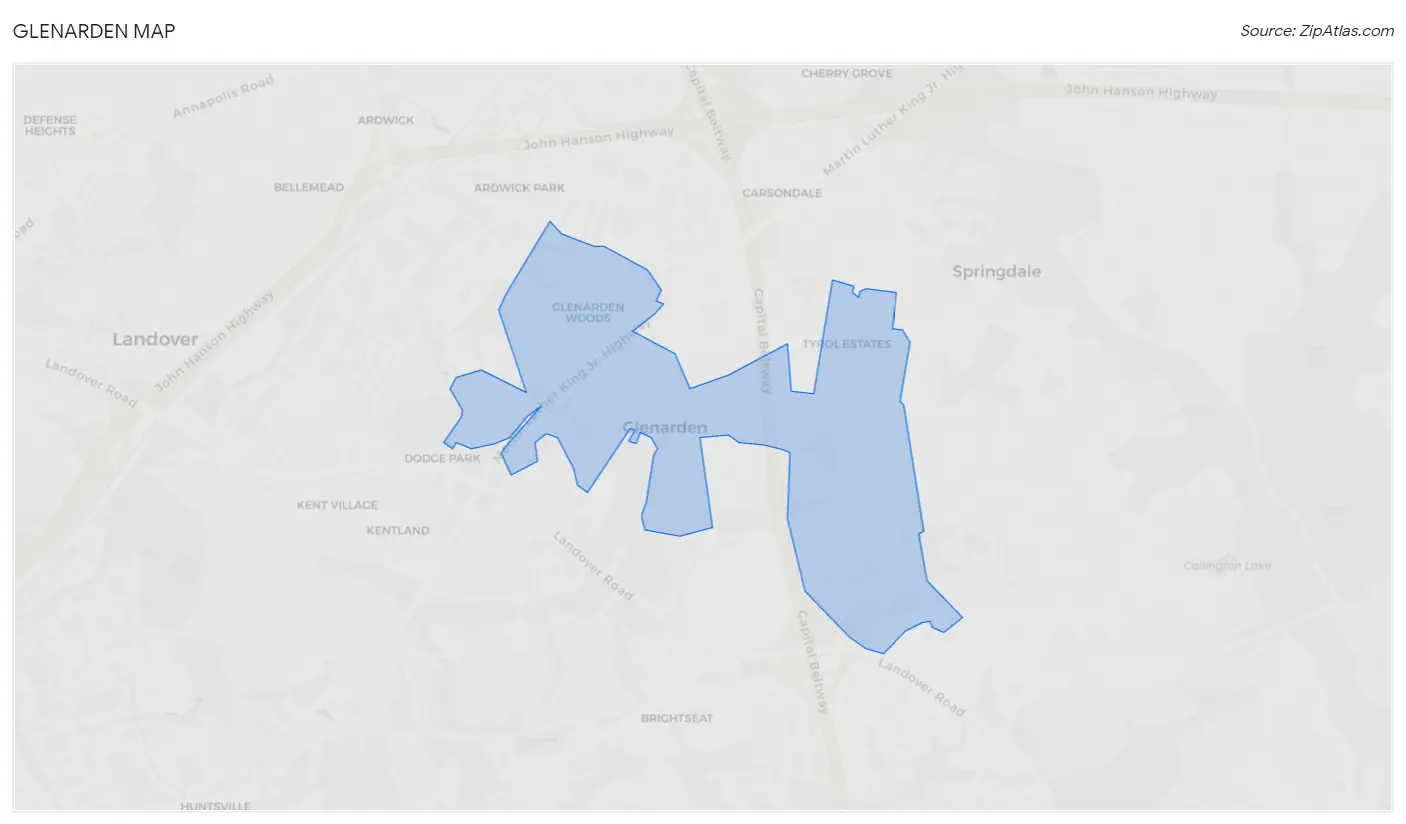
Glenarden Map
Glenarden Overview
$43,252
PER CAPITA INCOME
$110,058
AVG FAMILY INCOME
$100,179
AVG HOUSEHOLD INCOME
11.0%
WAGE / INCOME GAP [ % ]
89.0¢/ $1
WAGE / INCOME GAP [ $ ]
0.37
INEQUALITY / GINI INDEX
6,335
TOTAL POPULATION
3,197
MALE POPULATION
3,138
FEMALE POPULATION
101.88
MALES / 100 FEMALES
98.15
FEMALES / 100 MALES
39.6
MEDIAN AGE
3.5
AVG FAMILY SIZE
2.9
AVG HOUSEHOLD SIZE
3,339
LABOR FORCE [ PEOPLE ]
67.6%
PERCENT IN LABOR FORCE
4.2%
UNEMPLOYMENT RATE
Income in Glenarden
Income Overview in Glenarden
Per Capita Income in Glenarden is $43,252, while median incomes of families and households are $110,058 and $100,179 respectively.
| Characteristic | Number | Measure |
| Per Capita Income | 6,335 | $43,252 |
| Median Family Income | 1,564 | $110,058 |
| Mean Family Income | 1,564 | $138,258 |
| Median Household Income | 2,160 | $100,179 |
| Mean Household Income | 2,160 | $123,387 |
| Income Deficit | 1,564 | $0 |
| Wage / Income Gap (%) | 6,335 | 11.02% |
| Wage / Income Gap ($) | 6,335 | 88.98¢ per $1 |
| Gini / Inequality Index | 6,335 | 0.37 |
Earnings by Sex in Glenarden
Average Earnings in Glenarden are $53,834, $49,842 for men and $56,012 for women, a difference of 11.0%.
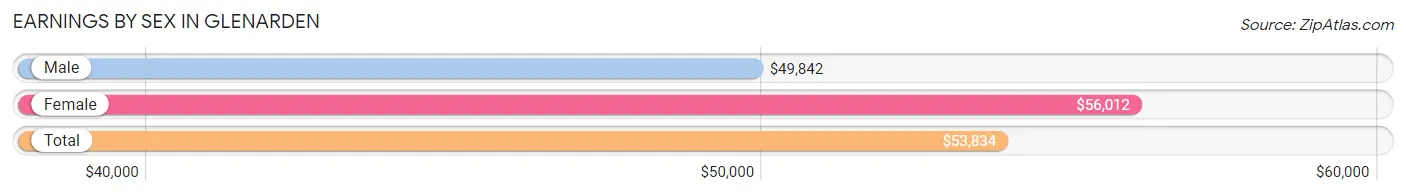
| Sex | Number | Average Earnings |
| Male | 1,641 (47.9%) | $49,842 |
| Female | 1,782 (52.1%) | $56,012 |
| Total | 3,423 (100.0%) | $53,834 |
Earnings by Sex by Income Bracket in Glenarden
The most common earnings brackets in Glenarden are $100,000+ for men (279 | 17.0%) and $100,000+ for women (515 | 28.9%).
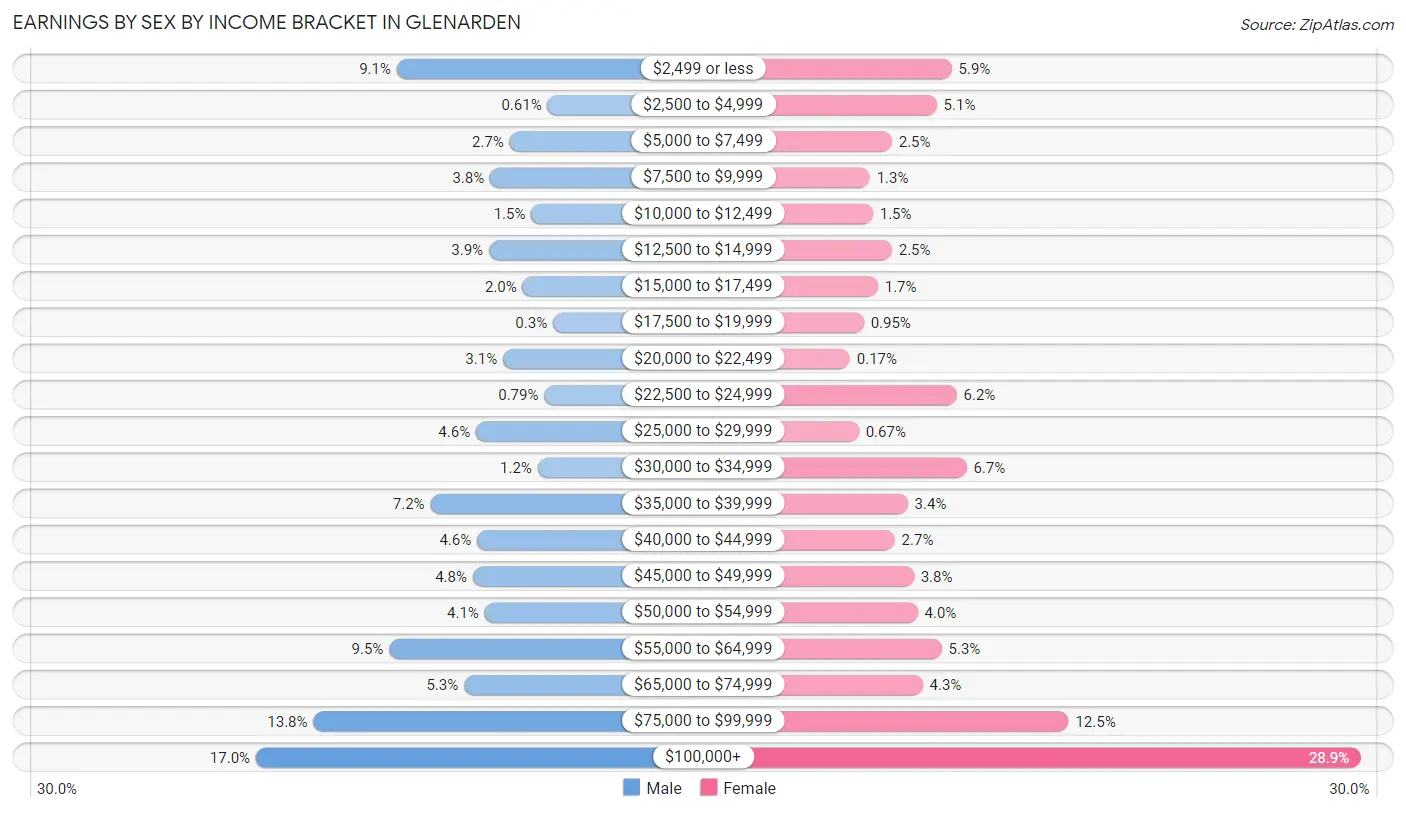
| Income | Male | Female |
| $2,499 or less | 149 (9.1%) | 105 (5.9%) |
| $2,500 to $4,999 | 10 (0.6%) | 90 (5.1%) |
| $5,000 to $7,499 | 45 (2.7%) | 45 (2.5%) |
| $7,500 to $9,999 | 63 (3.8%) | 23 (1.3%) |
| $10,000 to $12,499 | 25 (1.5%) | 26 (1.5%) |
| $12,500 to $14,999 | 64 (3.9%) | 45 (2.5%) |
| $15,000 to $17,499 | 33 (2.0%) | 31 (1.7%) |
| $17,500 to $19,999 | 5 (0.3%) | 17 (0.9%) |
| $20,000 to $22,499 | 51 (3.1%) | 3 (0.2%) |
| $22,500 to $24,999 | 13 (0.8%) | 110 (6.2%) |
| $25,000 to $29,999 | 76 (4.6%) | 12 (0.7%) |
| $30,000 to $34,999 | 19 (1.2%) | 120 (6.7%) |
| $35,000 to $39,999 | 118 (7.2%) | 61 (3.4%) |
| $40,000 to $44,999 | 75 (4.6%) | 48 (2.7%) |
| $45,000 to $49,999 | 79 (4.8%) | 67 (3.8%) |
| $50,000 to $54,999 | 68 (4.1%) | 71 (4.0%) |
| $55,000 to $64,999 | 156 (9.5%) | 95 (5.3%) |
| $65,000 to $74,999 | 87 (5.3%) | 76 (4.3%) |
| $75,000 to $99,999 | 226 (13.8%) | 222 (12.5%) |
| $100,000+ | 279 (17.0%) | 515 (28.9%) |
| Total | 1,641 (100.0%) | 1,782 (100.0%) |
Earnings by Sex by Educational Attainment in Glenarden
Average earnings in Glenarden are $57,171 for men and $73,938 for women, a difference of 22.7%. Men with an educational attainment of bachelor's degree enjoy the highest average annual earnings of $130,680, while those with less than high school education earn the least with $40,625. Women with an educational attainment of graduate degree earn the most with the average annual earnings of $111,726, while those with less than high school education have the smallest earnings of $17,614.
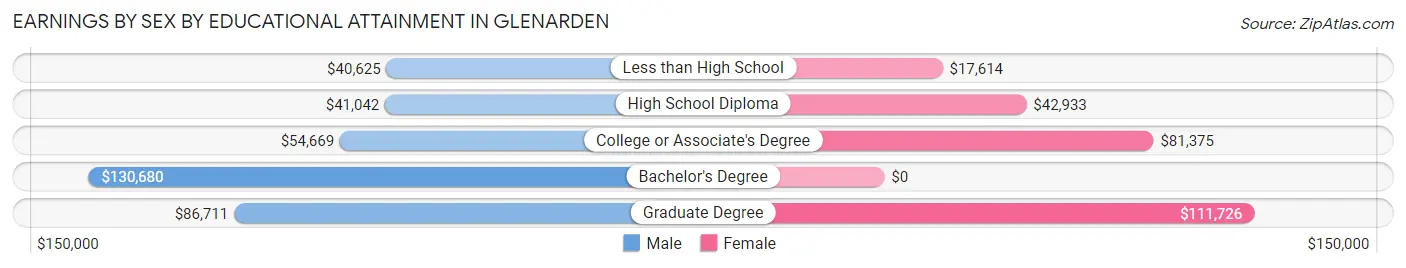
| Educational Attainment | Male Income | Female Income |
| Less than High School | $40,625 | $17,614 |
| High School Diploma | $41,042 | $42,933 |
| College or Associate's Degree | $54,669 | $81,375 |
| Bachelor's Degree | $130,680 | $0 |
| Graduate Degree | $86,711 | $111,726 |
| Total | $57,171 | $73,938 |
Family Income in Glenarden
Family Income Brackets in Glenarden
According to the Glenarden family income data, there are 396 families falling into the $75,000 to $99,999 income range, which is the most common income bracket and makes up 25.3% of all families. Conversely, the less than $10,000 income bracket is the least frequent group with only 6 families (0.4%) belonging to this category.
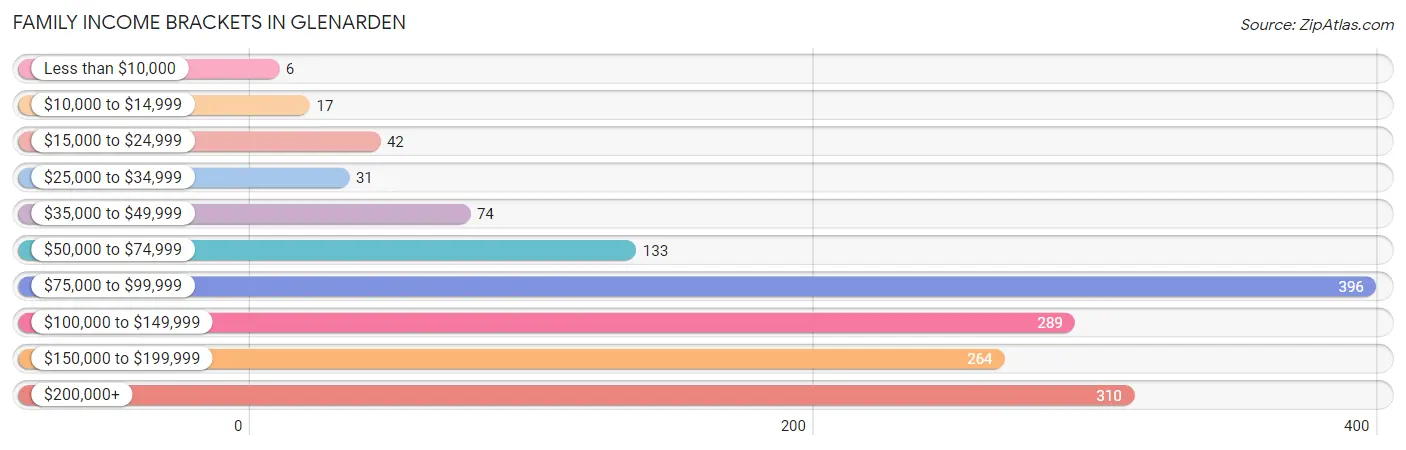
| Income Bracket | # Families | % Families |
| Less than $10,000 | 6 | 0.4% |
| $10,000 to $14,999 | 17 | 1.1% |
| $15,000 to $24,999 | 42 | 2.7% |
| $25,000 to $34,999 | 31 | 2.0% |
| $35,000 to $49,999 | 74 | 4.7% |
| $50,000 to $74,999 | 133 | 8.5% |
| $75,000 to $99,999 | 396 | 25.3% |
| $100,000 to $149,999 | 289 | 18.5% |
| $150,000 to $199,999 | 264 | 16.9% |
| $200,000+ | 310 | 19.8% |
Family Income by Famaliy Size in Glenarden
7+ person families (57 | 3.6%) account for the highest median family income in Glenarden with $166,250 per family, while 2-person families (567 | 36.2%) have the highest median income of $49,688 per family member.
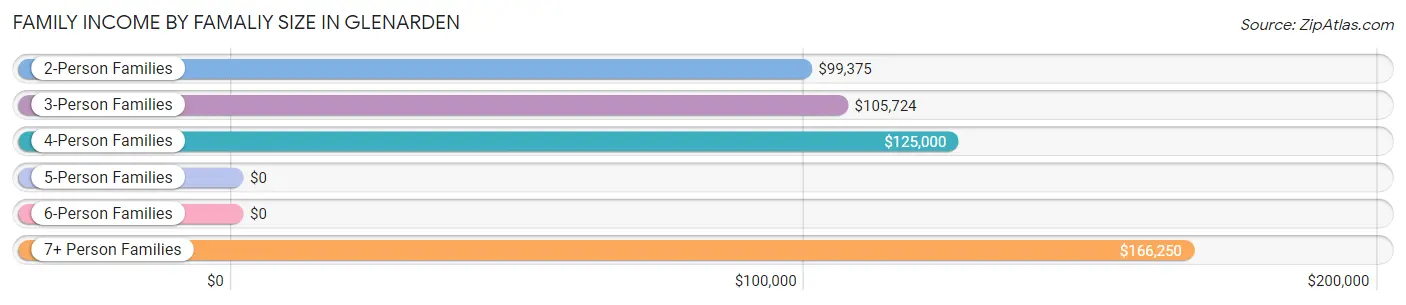
| Income Bracket | # Families | Median Income |
| 2-Person Families | 567 (36.2%) | $99,375 |
| 3-Person Families | 378 (24.2%) | $105,724 |
| 4-Person Families | 224 (14.3%) | $125,000 |
| 5-Person Families | 273 (17.5%) | $0 |
| 6-Person Families | 65 (4.2%) | $0 |
| 7+ Person Families | 57 (3.6%) | $166,250 |
| Total | 1,564 (100.0%) | $110,058 |
Family Income by Number of Earners in Glenarden
The median family income in Glenarden is $110,058, with families comprising 3+ earners (363) having the highest median family income of $190,558, while families with no earners (237) have the lowest median family income of $88,576, accounting for 23.2% and 15.1% of families, respectively.
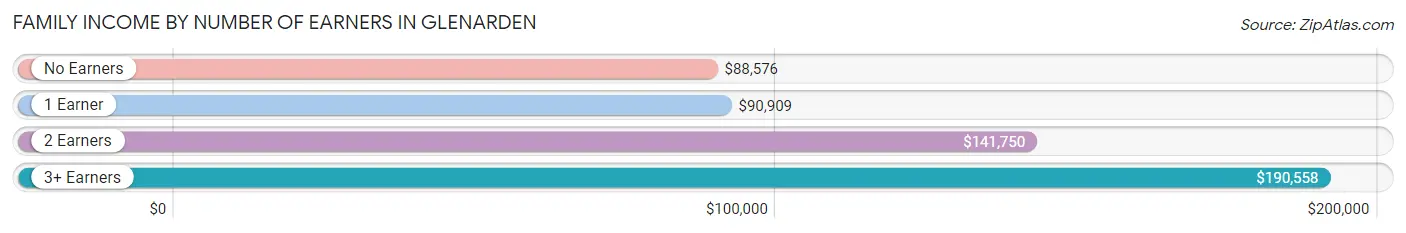
| Number of Earners | # Families | Median Income |
| No Earners | 237 (15.1%) | $88,576 |
| 1 Earner | 374 (23.9%) | $90,909 |
| 2 Earners | 590 (37.7%) | $141,750 |
| 3+ Earners | 363 (23.2%) | $190,558 |
| Total | 1,564 (100.0%) | $110,058 |
Household Income in Glenarden
Household Income Brackets in Glenarden
With 460 households falling in the category, the $75,000 to $99,999 income range is the most frequent in Glenarden, accounting for 21.3% of all households. In contrast, only 45 households (2.1%) fall into the less than $10,000 income bracket, making it the least populous group.
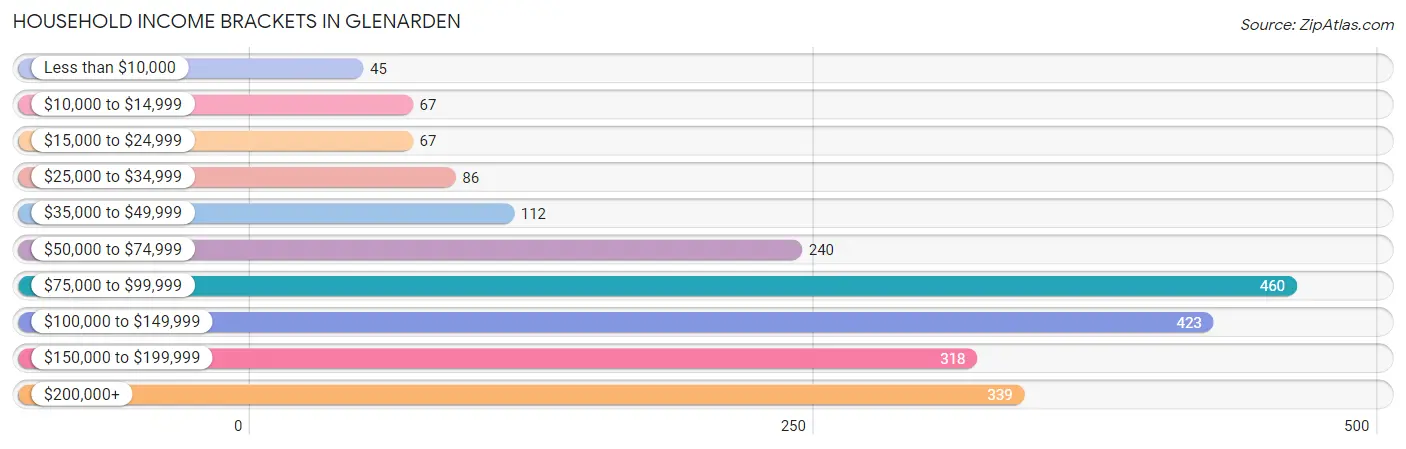
| Income Bracket | # Households | % Households |
| Less than $10,000 | 45 | 2.1% |
| $10,000 to $14,999 | 67 | 3.1% |
| $15,000 to $24,999 | 67 | 3.1% |
| $25,000 to $34,999 | 86 | 4.0% |
| $35,000 to $49,999 | 112 | 5.2% |
| $50,000 to $74,999 | 240 | 11.1% |
| $75,000 to $99,999 | 460 | 21.3% |
| $100,000 to $149,999 | 423 | 19.6% |
| $150,000 to $199,999 | 318 | 14.7% |
| $200,000+ | 339 | 15.7% |
Household Income by Householder Age in Glenarden
The median household income in Glenarden is $100,179, with the highest median household income of $113,456 found in the 25 to 44 years age bracket for the primary householder. A total of 731 households (33.8%) fall into this category. Meanwhile, the 15 to 24 years age bracket for the primary householder has the lowest median household income of $0, with 17 households (0.8%) in this group.
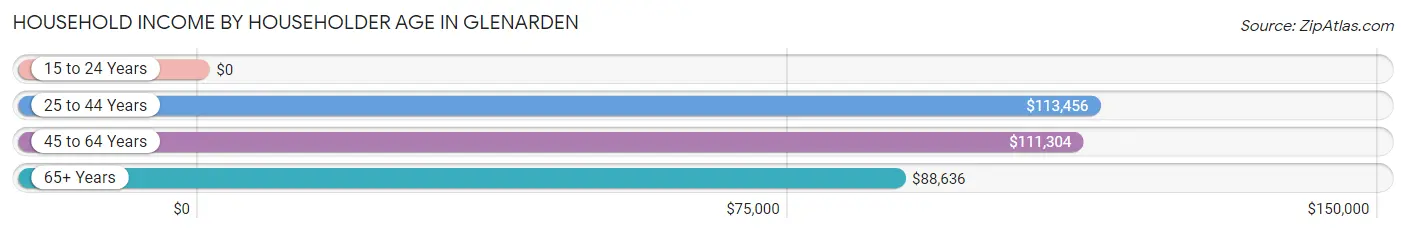
| Income Bracket | # Households | Median Income |
| 15 to 24 Years | 17 (0.8%) | $0 |
| 25 to 44 Years | 731 (33.8%) | $113,456 |
| 45 to 64 Years | 678 (31.4%) | $111,304 |
| 65+ Years | 734 (34.0%) | $88,636 |
| Total | 2,160 (100.0%) | $100,179 |
Poverty in Glenarden
Income Below Poverty by Sex and Age in Glenarden
With 4.1% poverty level for males and 8.5% for females among the residents of Glenarden, 5 year old males and under 5 year old females are the most vulnerable to poverty, with 17 males (47.2%) and 48 females (39.7%) in their respective age groups living below the poverty level.
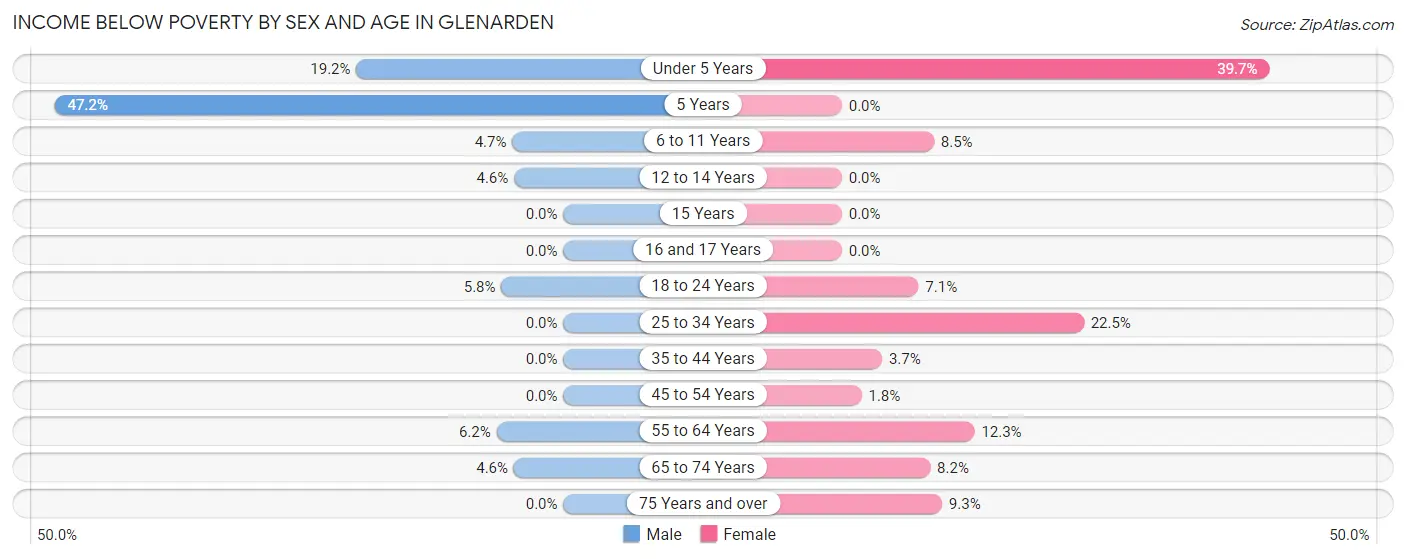
| Age Bracket | Male | Female |
| Under 5 Years | 39 (19.2%) | 48 (39.7%) |
| 5 Years | 17 (47.2%) | 0 (0.0%) |
| 6 to 11 Years | 17 (4.7%) | 17 (8.5%) |
| 12 to 14 Years | 8 (4.6%) | 0 (0.0%) |
| 15 Years | 0 (0.0%) | 0 (0.0%) |
| 16 and 17 Years | 0 (0.0%) | 0 (0.0%) |
| 18 to 24 Years | 15 (5.8%) | 17 (7.1%) |
| 25 to 34 Years | 0 (0.0%) | 44 (22.5%) |
| 35 to 44 Years | 0 (0.0%) | 26 (3.7%) |
| 45 to 54 Years | 0 (0.0%) | 6 (1.8%) |
| 55 to 64 Years | 25 (6.2%) | 58 (12.3%) |
| 65 to 74 Years | 10 (4.6%) | 30 (8.2%) |
| 75 Years and over | 0 (0.0%) | 17 (9.3%) |
| Total | 131 (4.1%) | 263 (8.5%) |
Income Above Poverty by Sex and Age in Glenarden
According to the poverty statistics in Glenarden, males aged 15 years and females aged 5 years are the age groups that are most secure financially, with 100.0% of males and 100.0% of females in these age groups living above the poverty line.
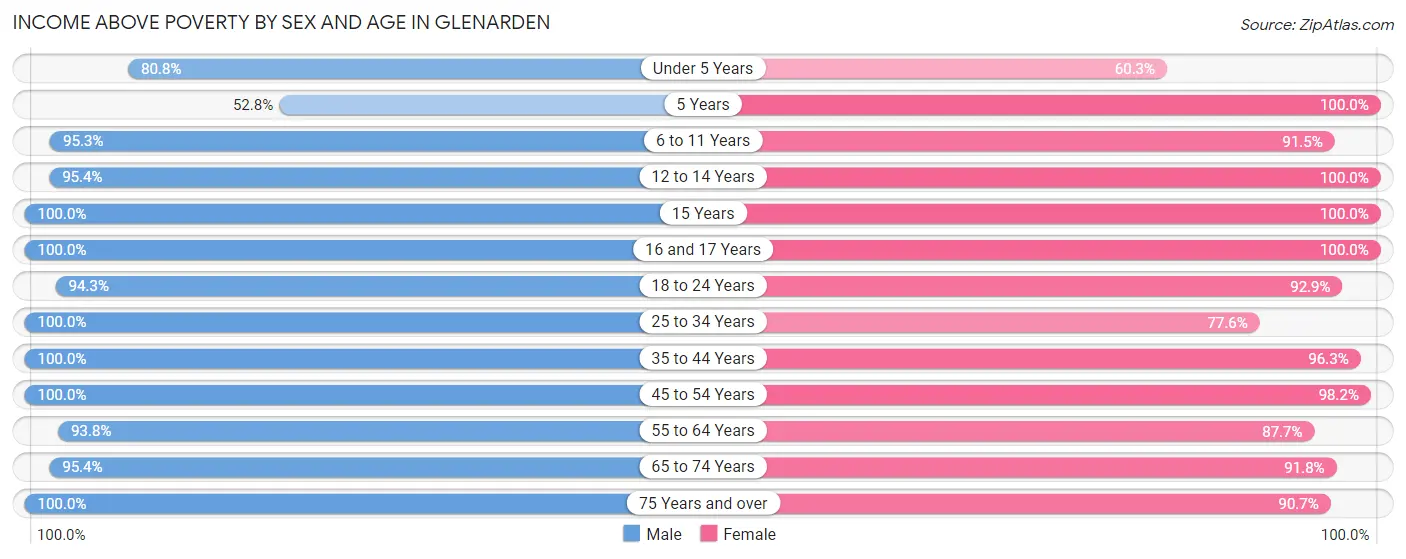
| Age Bracket | Male | Female |
| Under 5 Years | 164 (80.8%) | 73 (60.3%) |
| 5 Years | 19 (52.8%) | 5 (100.0%) |
| 6 to 11 Years | 342 (95.3%) | 182 (91.5%) |
| 12 to 14 Years | 167 (95.4%) | 102 (100.0%) |
| 15 Years | 59 (100.0%) | 118 (100.0%) |
| 16 and 17 Years | 160 (100.0%) | 89 (100.0%) |
| 18 to 24 Years | 246 (94.3%) | 222 (92.9%) |
| 25 to 34 Years | 318 (100.0%) | 152 (77.5%) |
| 35 to 44 Years | 543 (100.0%) | 671 (96.3%) |
| 45 to 54 Years | 270 (100.0%) | 321 (98.2%) |
| 55 to 64 Years | 378 (93.8%) | 413 (87.7%) |
| 65 to 74 Years | 208 (95.4%) | 336 (91.8%) |
| 75 Years and over | 188 (100.0%) | 166 (90.7%) |
| Total | 3,062 (95.9%) | 2,850 (91.5%) |
Income Below Poverty Among Married-Couple Families in Glenarden
The poverty statistics for married-couple families in Glenarden show that 1.3% or 10 of the total 787 families live below the poverty line. Families with no children have the highest poverty rate of 5.4%, comprising of 10 families. On the other hand, families with 1 or 2 children have the lowest poverty rate of 0.0%, which includes 0 families.
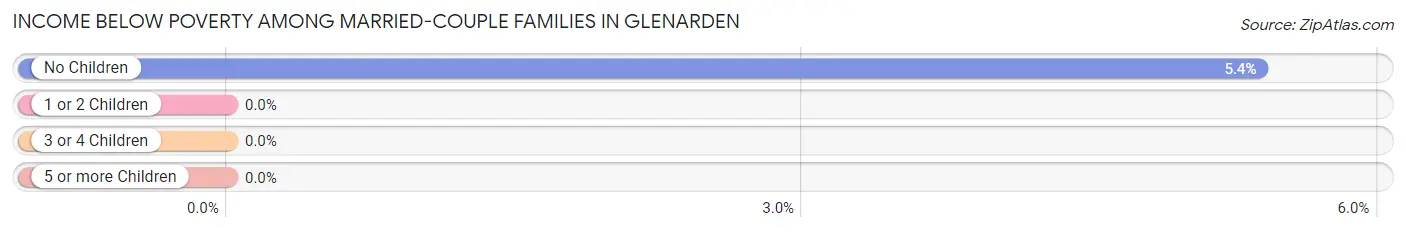
| Children | Above Poverty | Below Poverty |
| No Children | 176 (94.6%) | 10 (5.4%) |
| 1 or 2 Children | 521 (100.0%) | 0 (0.0%) |
| 3 or 4 Children | 75 (100.0%) | 0 (0.0%) |
| 5 or more Children | 5 (100.0%) | 0 (0.0%) |
| Total | 777 (98.7%) | 10 (1.3%) |
Income Below Poverty Among Single-Parent Households in Glenarden
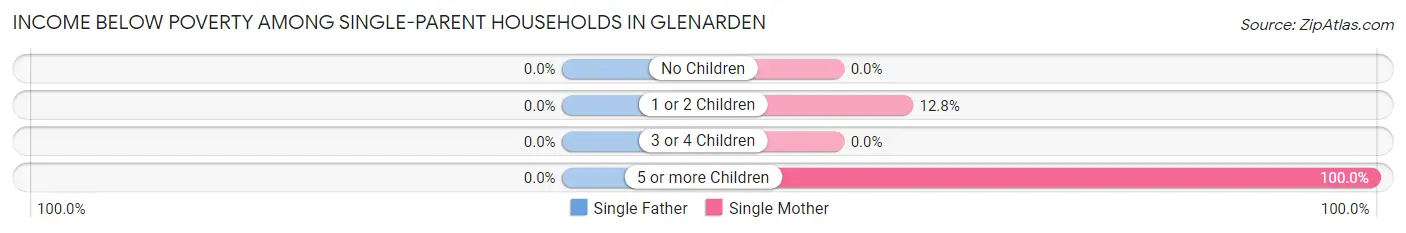
| Children | Single Father | Single Mother |
| No Children | 0 (0.0%) | 0 (0.0%) |
| 1 or 2 Children | 0 (0.0%) | 24 (12.8%) |
| 3 or 4 Children | 0 (0.0%) | 0 (0.0%) |
| 5 or more Children | 0 (0.0%) | 17 (100.0%) |
| Total | 0 (0.0%) | 41 (8.0%) |
Income Below Poverty Among Married-Couple vs Single-Parent Households in Glenarden
The poverty data for Glenarden shows that 10 of the married-couple family households (1.3%) and 41 of the single-parent households (5.3%) are living below the poverty level. Within the married-couple family households, those with no children have the highest poverty rate, with 10 households (5.4%) falling below the poverty line. Among the single-parent households, those with 5 or more children have the highest poverty rate, with 17 household (100.0%) living below poverty.
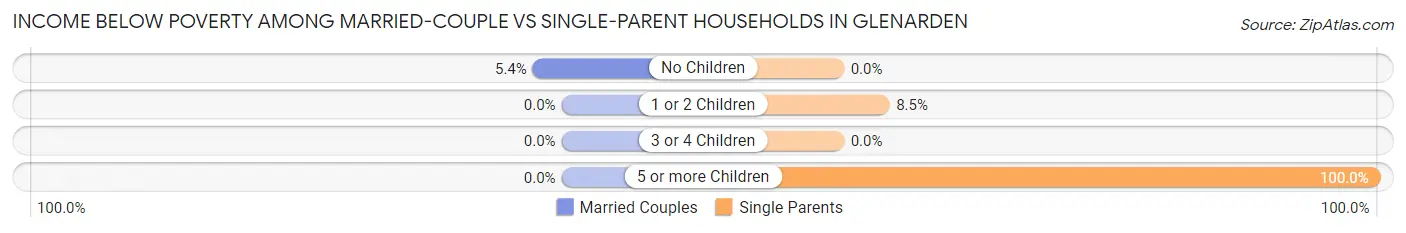
| Children | Married-Couple Families | Single-Parent Households |
| No Children | 10 (5.4%) | 0 (0.0%) |
| 1 or 2 Children | 0 (0.0%) | 24 (8.5%) |
| 3 or 4 Children | 0 (0.0%) | 0 (0.0%) |
| 5 or more Children | 0 (0.0%) | 17 (100.0%) |
| Total | 10 (1.3%) | 41 (5.3%) |
Race in Glenarden
The most populous races in Glenarden are Black / African American (4,955 | 78.2%), Hispanic or Latino (946 | 14.9%), and Some other Race (760 | 12.0%).
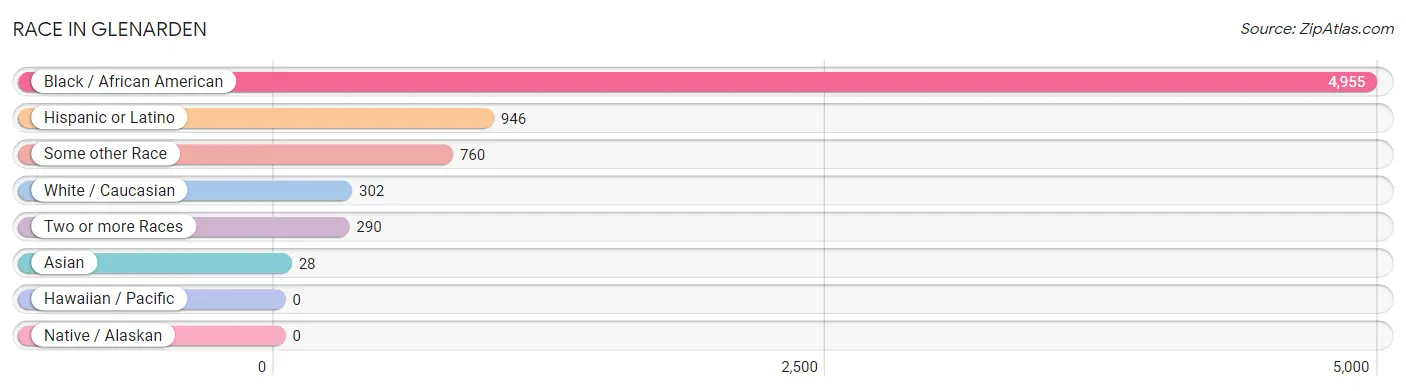
| Race | # Population | % Population |
| Asian | 28 | 0.4% |
| Black / African American | 4,955 | 78.2% |
| Hawaiian / Pacific | 0 | 0.0% |
| Hispanic or Latino | 946 | 14.9% |
| Native / Alaskan | 0 | 0.0% |
| White / Caucasian | 302 | 4.8% |
| Two or more Races | 290 | 4.6% |
| Some other Race | 760 | 12.0% |
| Total | 6,335 | 100.0% |
Ancestry in Glenarden
The most populous ancestries reported in Glenarden are Central American (684 | 10.8%), Subsaharan African (662 | 10.4%), Salvadoran (492 | 7.8%), Jamaican (483 | 7.6%), and Nigerian (482 | 7.6%), together accounting for 44.3% of all Glenarden residents.
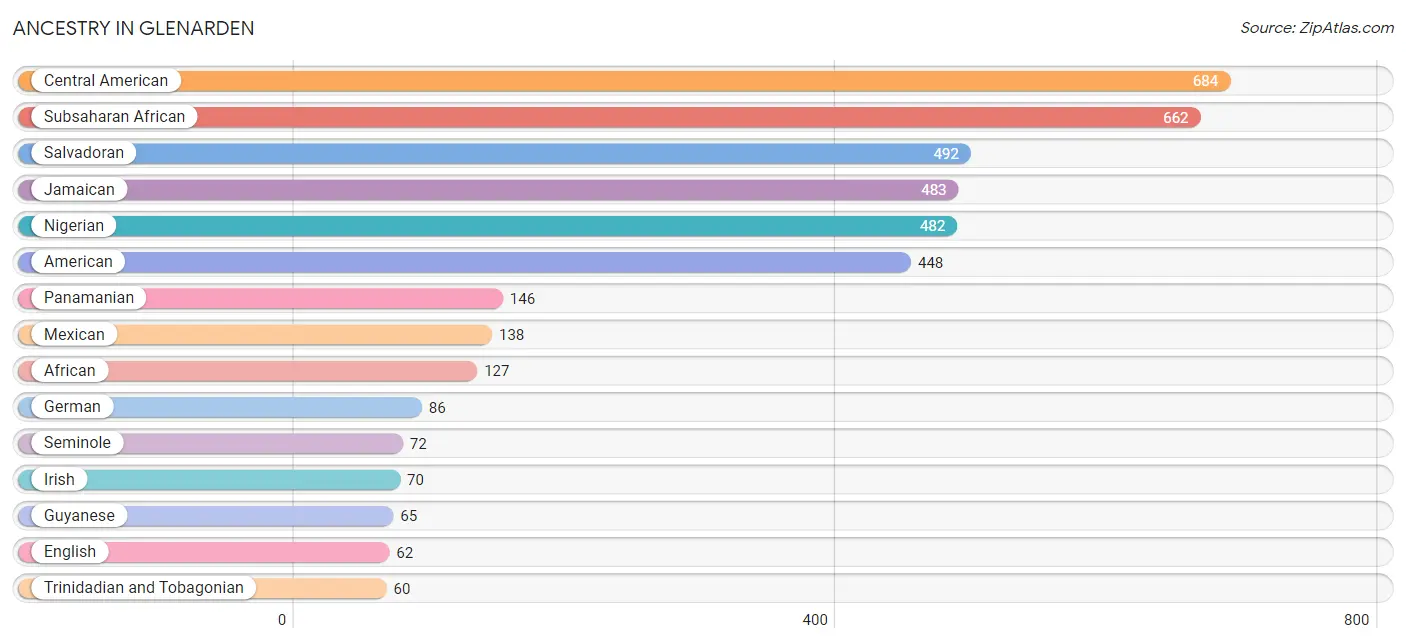
| Ancestry | # Population | % Population |
| African | 127 | 2.0% |
| American | 448 | 7.1% |
| Arab | 11 | 0.2% |
| Blackfeet | 14 | 0.2% |
| Bolivian | 5 | 0.1% |
| British West Indian | 26 | 0.4% |
| Central American | 684 | 10.8% |
| Central American Indian | 10 | 0.2% |
| Colombian | 4 | 0.1% |
| Cuban | 11 | 0.2% |
| Czech | 27 | 0.4% |
| Dominican | 57 | 0.9% |
| Dutch | 38 | 0.6% |
| English | 62 | 1.0% |
| German | 86 | 1.4% |
| Ghanaian | 5 | 0.1% |
| Guyanese | 65 | 1.0% |
| Haitian | 8 | 0.1% |
| Indian (Asian) | 10 | 0.2% |
| Irish | 70 | 1.1% |
| Jamaican | 483 | 7.6% |
| Korean | 18 | 0.3% |
| Lithuanian | 27 | 0.4% |
| Mexican | 138 | 2.2% |
| Nigerian | 482 | 7.6% |
| Panamanian | 146 | 2.3% |
| Puerto Rican | 10 | 0.2% |
| Russian | 27 | 0.4% |
| Salvadoran | 492 | 7.8% |
| Scandinavian | 18 | 0.3% |
| Scotch-Irish | 38 | 0.6% |
| Seminole | 72 | 1.1% |
| Senegalese | 8 | 0.1% |
| Sierra Leonean | 40 | 0.6% |
| South American | 9 | 0.1% |
| Subsaharan African | 662 | 10.4% |
| Trinidadian and Tobagonian | 60 | 0.9% |
| West Indian | 28 | 0.4% | View All 38 Rows |
Immigrants in Glenarden
The most numerous immigrant groups reported in Glenarden came from Latin America (817 | 12.9%), Africa (476 | 7.5%), Western Africa (476 | 7.5%), Central America (407 | 6.4%), and Caribbean (360 | 5.7%), together accounting for 40.0% of all Glenarden residents.
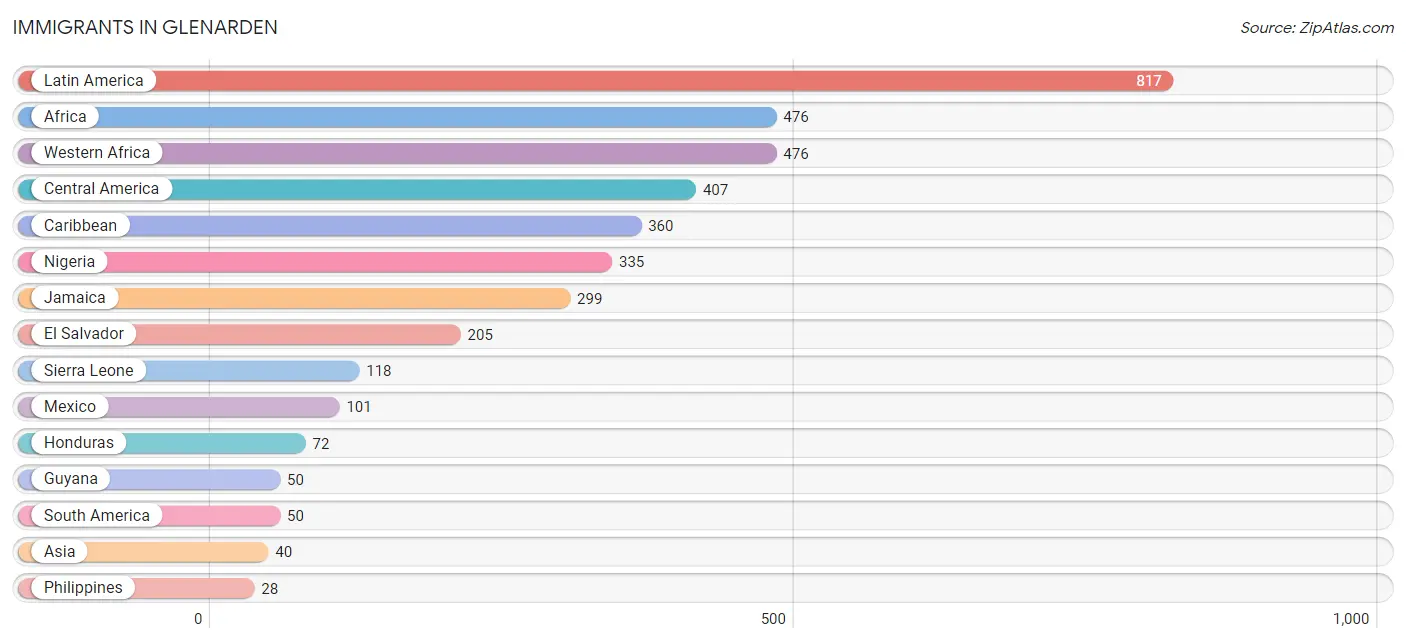
| Immigration Origin | # Population | % Population |
| Africa | 476 | 7.5% |
| Asia | 40 | 0.6% |
| Caribbean | 360 | 5.7% |
| Central America | 407 | 6.4% |
| Cuba | 11 | 0.2% |
| Dominican Republic | 24 | 0.4% |
| Eastern Asia | 12 | 0.2% |
| El Salvador | 205 | 3.2% |
| Europe | 12 | 0.2% |
| Ghana | 5 | 0.1% |
| Guyana | 50 | 0.8% |
| Honduras | 72 | 1.1% |
| Jamaica | 299 | 4.7% |
| Korea | 12 | 0.2% |
| Latin America | 817 | 12.9% |
| Liberia | 12 | 0.2% |
| Mexico | 101 | 1.6% |
| Nicaragua | 4 | 0.1% |
| Nigeria | 335 | 5.3% |
| Northern Europe | 12 | 0.2% |
| Philippines | 28 | 0.4% |
| Senegal | 6 | 0.1% |
| Sierra Leone | 118 | 1.9% |
| South America | 50 | 0.8% |
| South Eastern Asia | 28 | 0.4% |
| Western Africa | 476 | 7.5% | View All 26 Rows |
Sex and Age in Glenarden
Sex and Age in Glenarden
The most populous age groups in Glenarden are 40 to 44 Years (355 | 11.1%) for men and 35 to 39 Years (374 | 11.9%) for women.
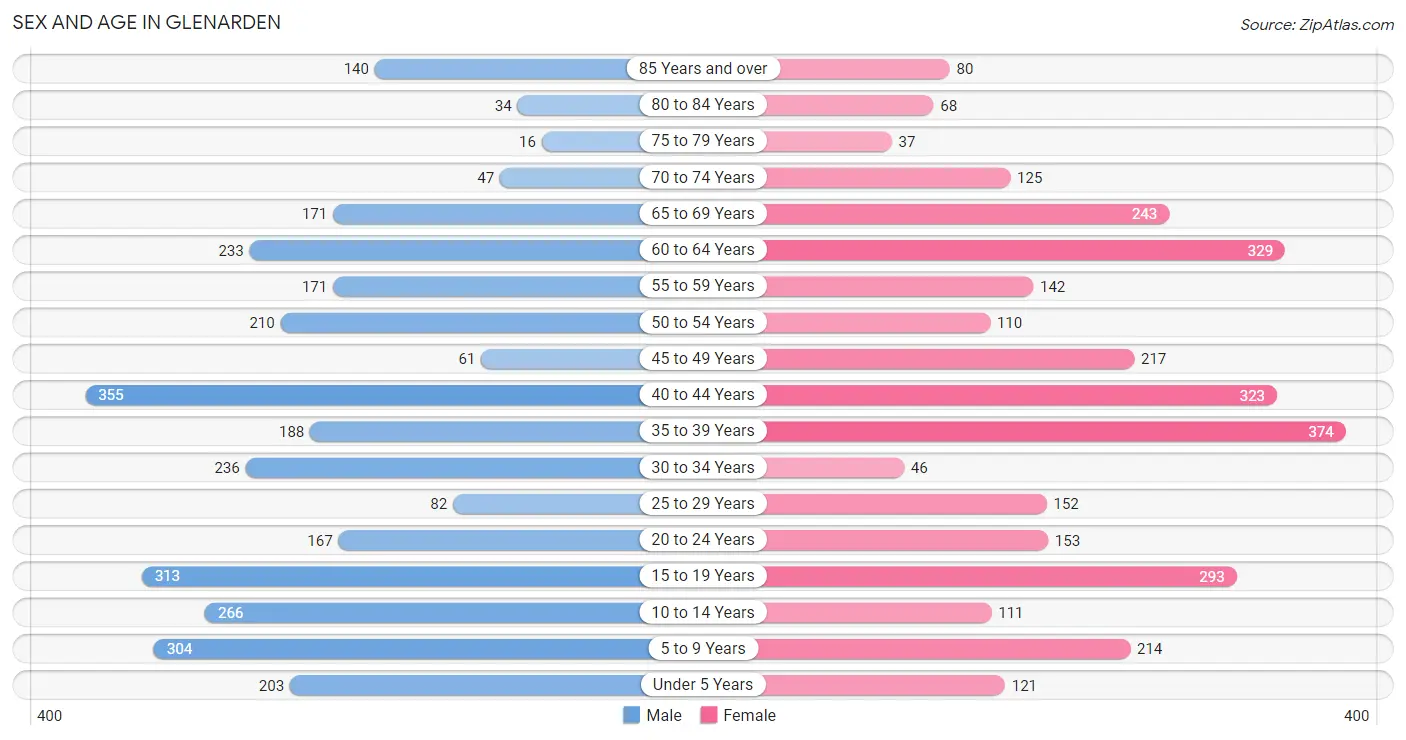
| Age Bracket | Male | Female |
| Under 5 Years | 203 (6.4%) | 121 (3.9%) |
| 5 to 9 Years | 304 (9.5%) | 214 (6.8%) |
| 10 to 14 Years | 266 (8.3%) | 111 (3.5%) |
| 15 to 19 Years | 313 (9.8%) | 293 (9.3%) |
| 20 to 24 Years | 167 (5.2%) | 153 (4.9%) |
| 25 to 29 Years | 82 (2.6%) | 152 (4.8%) |
| 30 to 34 Years | 236 (7.4%) | 46 (1.5%) |
| 35 to 39 Years | 188 (5.9%) | 374 (11.9%) |
| 40 to 44 Years | 355 (11.1%) | 323 (10.3%) |
| 45 to 49 Years | 61 (1.9%) | 217 (6.9%) |
| 50 to 54 Years | 210 (6.6%) | 110 (3.5%) |
| 55 to 59 Years | 171 (5.3%) | 142 (4.5%) |
| 60 to 64 Years | 233 (7.3%) | 329 (10.5%) |
| 65 to 69 Years | 171 (5.3%) | 243 (7.7%) |
| 70 to 74 Years | 47 (1.5%) | 125 (4.0%) |
| 75 to 79 Years | 16 (0.5%) | 37 (1.2%) |
| 80 to 84 Years | 34 (1.1%) | 68 (2.2%) |
| 85 Years and over | 140 (4.4%) | 80 (2.5%) |
| Total | 3,197 (100.0%) | 3,138 (100.0%) |
Families and Households in Glenarden
Median Family Size in Glenarden
The median family size in Glenarden is 3.54 persons per family, with married-couple families (787 | 50.3%) accounting for the largest median family size of 4.06 persons per family. On the other hand, single male/father families (263 | 16.8%) represent the smallest median family size with 2.38 persons per family.
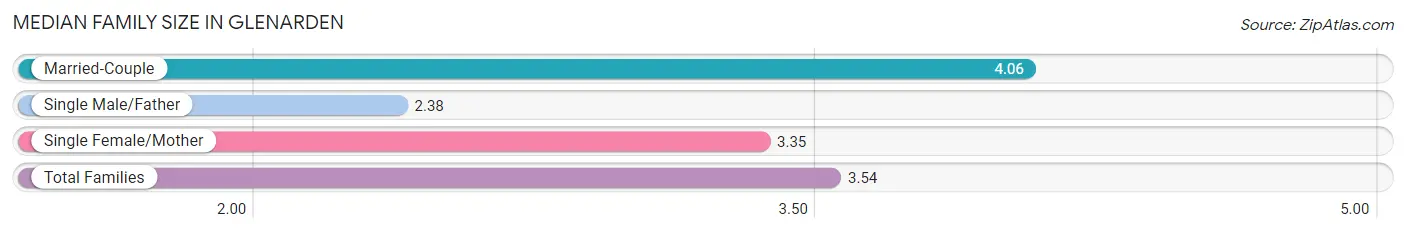
| Family Type | # Families | Family Size |
| Married-Couple | 787 (50.3%) | 4.06 |
| Single Male/Father | 263 (16.8%) | 2.38 |
| Single Female/Mother | 514 (32.9%) | 3.35 |
| Total Families | 1,564 (100.0%) | 3.54 |
Median Household Size in Glenarden
The median household size in Glenarden is 2.93 persons per household, with married-couple households (787 | 36.4%) accounting for the largest median household size of 4.09 persons per household. non-family households (596 | 27.6%) represent the smallest median household size with 1.17 persons per household.
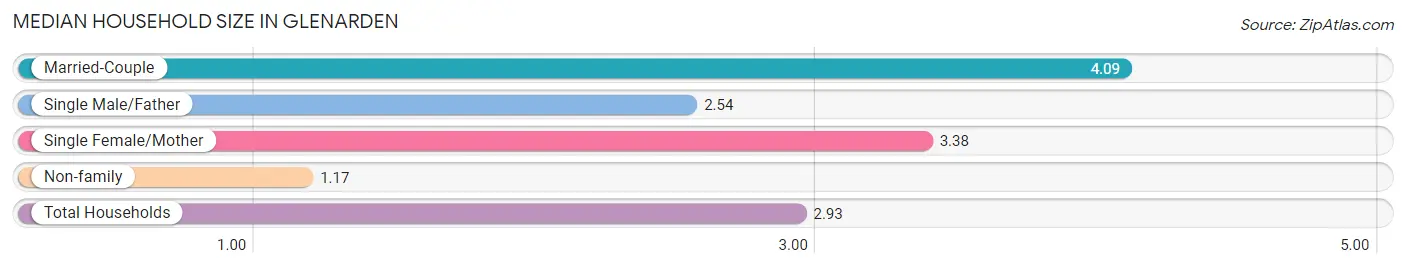
| Household Type | # Households | Household Size |
| Married-Couple | 787 (36.4%) | 4.09 |
| Single Male/Father | 263 (12.2%) | 2.54 |
| Single Female/Mother | 514 (23.8%) | 3.38 |
| Non-family | 596 (27.6%) | 1.17 |
| Total Households | 2,160 (100.0%) | 2.93 |
Household Size by Marriage Status in Glenarden
Out of a total of 2,160 households in Glenarden, 1,564 (72.4%) are family households, while 596 (27.6%) are nonfamily households. The most numerous type of family households are 2-person households, comprising 519, and the most common type of nonfamily households are 1-person households, comprising 522.
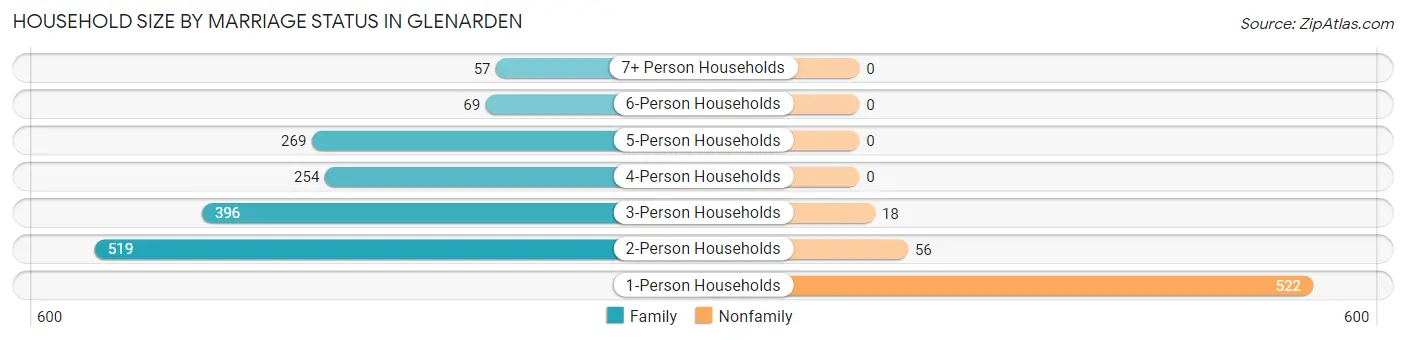
| Household Size | Family Households | Nonfamily Households |
| 1-Person Households | - | 522 (24.2%) |
| 2-Person Households | 519 (24.0%) | 56 (2.6%) |
| 3-Person Households | 396 (18.3%) | 18 (0.8%) |
| 4-Person Households | 254 (11.8%) | 0 (0.0%) |
| 5-Person Households | 269 (12.4%) | 0 (0.0%) |
| 6-Person Households | 69 (3.2%) | 0 (0.0%) |
| 7+ Person Households | 57 (2.6%) | 0 (0.0%) |
| Total | 1,564 (72.4%) | 596 (27.6%) |
Female Fertility in Glenarden
Fertility by Age in Glenarden
Average fertility rate in Glenarden is 71.0 births per 1,000 women. Women in the age bracket of 20 to 34 years have the highest fertility rate with 145.0 births per 1,000 women. Women in the age bracket of 35 to 50 years acount for 48.6% of all women with births.
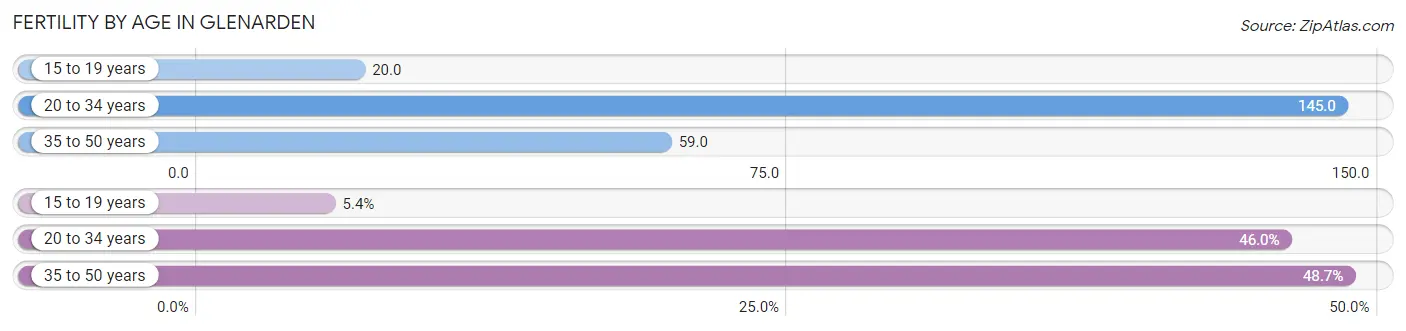
| Age Bracket | Women with Births | Births / 1,000 Women |
| 15 to 19 years | 6 (5.4%) | 20.0 |
| 20 to 34 years | 51 (46.0%) | 145.0 |
| 35 to 50 years | 54 (48.6%) | 59.0 |
| Total | 111 (100.0%) | 71.0 |
Fertility by Age by Marriage Status in Glenarden
21.6% of women with births (111) in Glenarden are married. The highest percentage of unmarried women with births falls into 15 to 19 years age bracket with 100.0% of them unmarried at the time of birth, while the lowest percentage of unmarried women with births belong to 35 to 50 years age bracket with 66.7% of them unmarried.
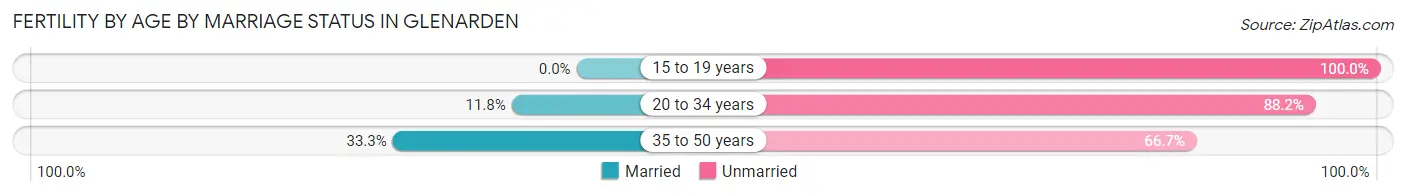
| Age Bracket | Married | Unmarried |
| 15 to 19 years | 0 (0.0%) | 6 (100.0%) |
| 20 to 34 years | 6 (11.8%) | 45 (88.2%) |
| 35 to 50 years | 18 (33.3%) | 36 (66.7%) |
| Total | 24 (21.6%) | 87 (78.4%) |
Fertility by Education in Glenarden
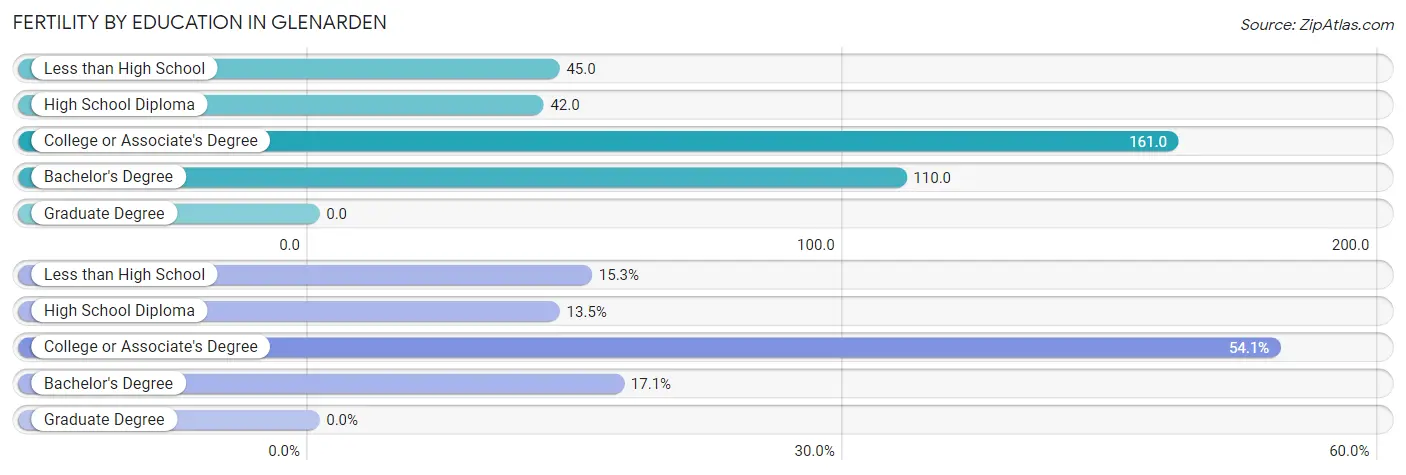
| Educational Attainment | Women with Births | Births / 1,000 Women |
| Less than High School | 17 (15.3%) | 45.0 |
| High School Diploma | 15 (13.5%) | 42.0 |
| College or Associate's Degree | 60 (54.0%) | 161.0 |
| Bachelor's Degree | 19 (17.1%) | 110.0 |
| Graduate Degree | 0 (0.0%) | 0.0 |
| Total | 111 (100.0%) | 71.0 |
Fertility by Education by Marriage Status in Glenarden
78.4% of women with births in Glenarden are unmarried. Women with the educational attainment of less than high school are most likely to be married with 64.7% of them married at childbirth, while women with the educational attainment of high school diploma are least likely to be married with 100.0% of them unmarried at childbirth.
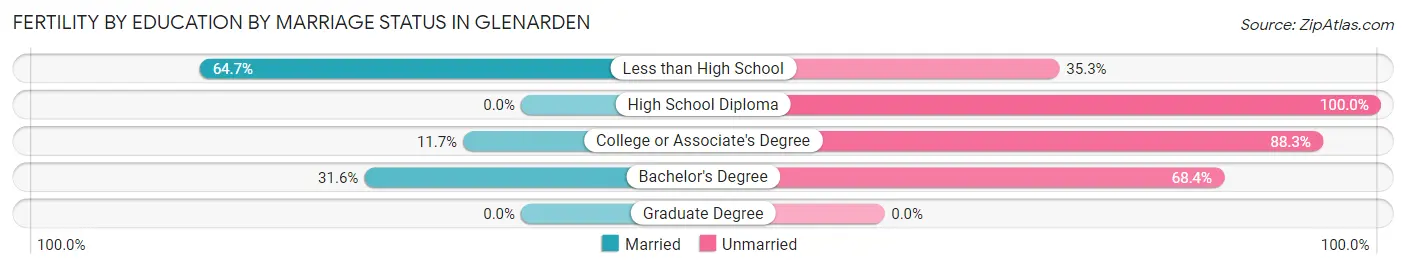
| Educational Attainment | Married | Unmarried |
| Less than High School | 11 (64.7%) | 6 (35.3%) |
| High School Diploma | 0 (0.0%) | 15 (100.0%) |
| College or Associate's Degree | 7 (11.7%) | 53 (88.3%) |
| Bachelor's Degree | 6 (31.6%) | 13 (68.4%) |
| Graduate Degree | 0 (0.0%) | 0 (0.0%) |
| Total | 24 (21.6%) | 87 (78.4%) |
Employment Characteristics in Glenarden
Employment by Class of Employer in Glenarden
Among the 3,127 employed individuals in Glenarden, private company employees (1,727 | 55.2%), federal government employees (551 | 17.6%), and not-for-profit organizations (355 | 11.4%) make up the most common classes of employment.
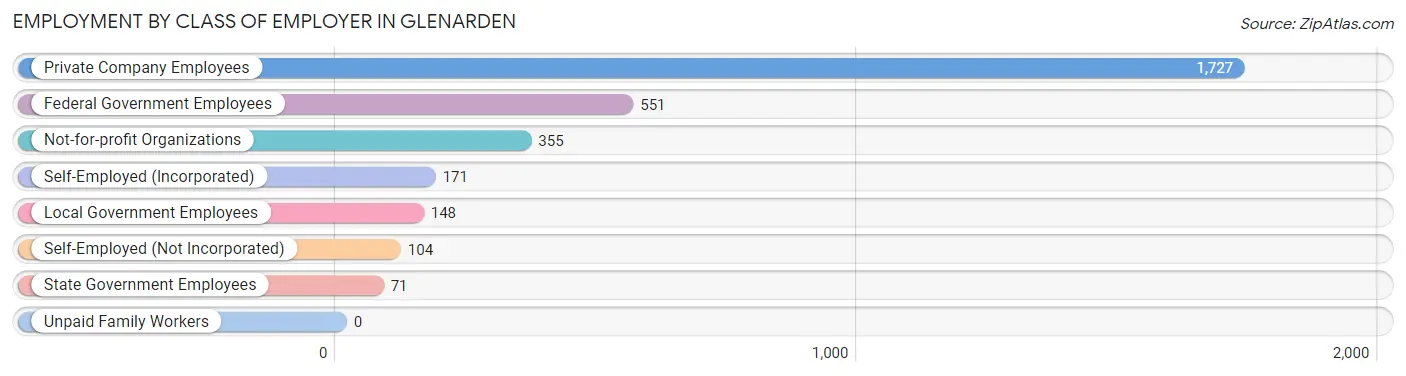
| Employer Class | # Employees | % Employees |
| Private Company Employees | 1,727 | 55.2% |
| Self-Employed (Incorporated) | 171 | 5.5% |
| Self-Employed (Not Incorporated) | 104 | 3.3% |
| Not-for-profit Organizations | 355 | 11.4% |
| Local Government Employees | 148 | 4.7% |
| State Government Employees | 71 | 2.3% |
| Federal Government Employees | 551 | 17.6% |
| Unpaid Family Workers | 0 | 0.0% |
| Total | 3,127 | 100.0% |
Employment Status by Age in Glenarden
According to the labor force statistics for Glenarden, out of the total population over 16 years of age (4,939), 67.6% or 3,339 individuals are in the labor force, with 4.2% or 140 of them unemployed. The age group with the highest labor force participation rate is 25 to 29 years, with 97.0% or 227 individuals in the labor force. Within the labor force, the 16 to 19 years age range has the highest percentage of unemployed individuals, with 17.3% or 30 of them being unemployed.
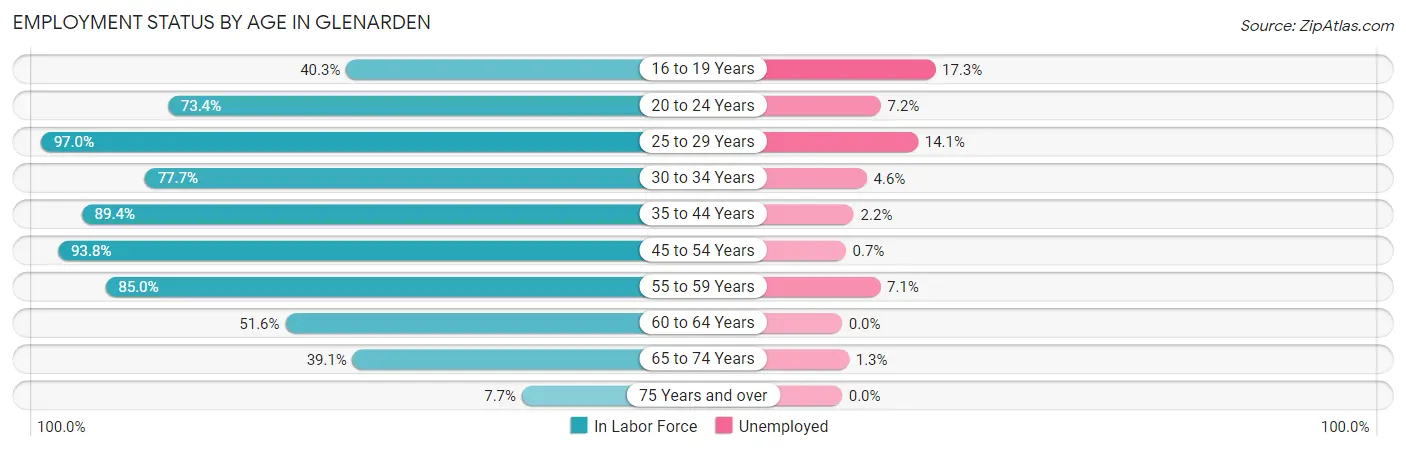
| Age Bracket | In Labor Force | Unemployed |
| 16 to 19 Years | 173 (40.3%) | 30 (17.3%) |
| 20 to 24 Years | 235 (73.4%) | 17 (7.2%) |
| 25 to 29 Years | 227 (97.0%) | 32 (14.1%) |
| 30 to 34 Years | 219 (77.7%) | 10 (4.6%) |
| 35 to 44 Years | 1,109 (89.4%) | 24 (2.2%) |
| 45 to 54 Years | 561 (93.8%) | 4 (0.7%) |
| 55 to 59 Years | 266 (85.0%) | 19 (7.1%) |
| 60 to 64 Years | 290 (51.6%) | 0 (0.0%) |
| 65 to 74 Years | 229 (39.1%) | 3 (1.3%) |
| 75 Years and over | 29 (7.7%) | 0 (0.0%) |
| Total | 3,339 (67.6%) | 140 (4.2%) |
Employment Status by Educational Attainment in Glenarden
According to labor force statistics for Glenarden, 82.7% of individuals (2,670) out of the total population between 25 and 64 years of age (3,229) are in the labor force, with 3.3% or 88 of them being unemployed. The group with the highest labor force participation rate are those with the educational attainment of college / associate degree, with 96.3% or 770 individuals in the labor force. Within the labor force, individuals with less than high school education have the highest percentage of unemployment, with 7.1% or 19 of them being unemployed.
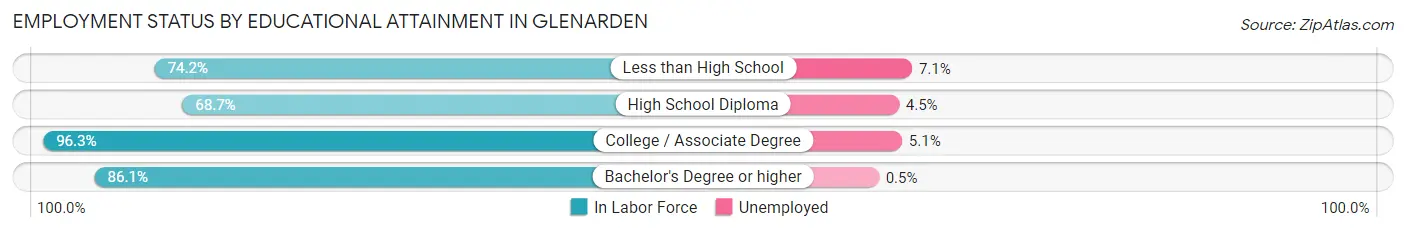
| Educational Attainment | In Labor Force | Unemployed |
| Less than High School | 267 (74.2%) | 26 (7.1%) |
| High School Diploma | 582 (68.7%) | 38 (4.5%) |
| College / Associate Degree | 770 (96.3%) | 41 (5.1%) |
| Bachelor's Degree or higher | 1,052 (86.1%) | 6 (0.5%) |
| Total | 2,670 (82.7%) | 107 (3.3%) |
Employment Occupations by Sex in Glenarden
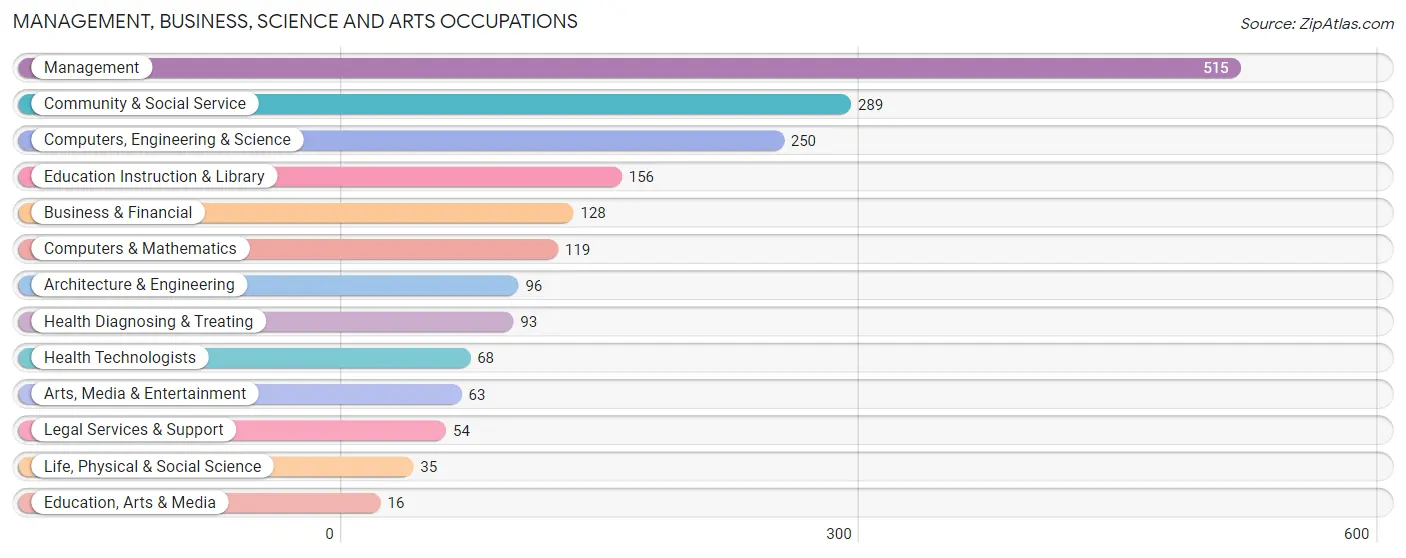
Management, Business, Science and Arts Occupations
The most common Management, Business, Science and Arts occupations in Glenarden are Management (515 | 16.2%), Community & Social Service (289 | 9.1%), Computers, Engineering & Science (250 | 7.9%), Education Instruction & Library (156 | 4.9%), and Business & Financial (128 | 4.0%).
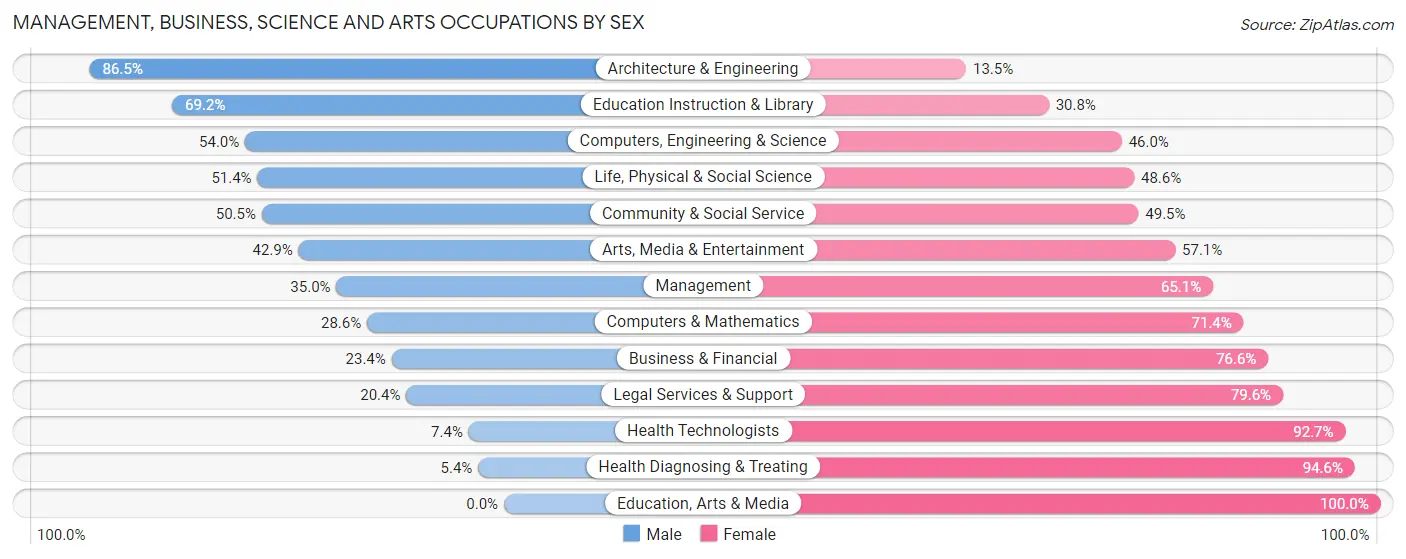
Management, Business, Science and Arts Occupations by Sex
Within the Management, Business, Science and Arts occupations in Glenarden, the most male-oriented occupations are Architecture & Engineering (86.5%), Education Instruction & Library (69.2%), and Computers, Engineering & Science (54.0%), while the most female-oriented occupations are Education, Arts & Media (100.0%), Health Diagnosing & Treating (94.6%), and Health Technologists (92.6%).
| Occupation | Male | Female |
| Management | 180 (34.9%) | 335 (65.0%) |
| Business & Financial | 30 (23.4%) | 98 (76.6%) |
| Computers, Engineering & Science | 135 (54.0%) | 115 (46.0%) |
| Computers & Mathematics | 34 (28.6%) | 85 (71.4%) |
| Architecture & Engineering | 83 (86.5%) | 13 (13.5%) |
| Life, Physical & Social Science | 18 (51.4%) | 17 (48.6%) |
| Community & Social Service | 146 (50.5%) | 143 (49.5%) |
| Education, Arts & Media | 0 (0.0%) | 16 (100.0%) |
| Legal Services & Support | 11 (20.4%) | 43 (79.6%) |
| Education Instruction & Library | 108 (69.2%) | 48 (30.8%) |
| Arts, Media & Entertainment | 27 (42.9%) | 36 (57.1%) |
| Health Diagnosing & Treating | 5 (5.4%) | 88 (94.6%) |
| Health Technologists | 5 (7.3%) | 63 (92.6%) |
| Total (Category) | 496 (38.9%) | 779 (61.1%) |
| Total (Overall) | 1,503 (47.2%) | 1,683 (52.8%) |
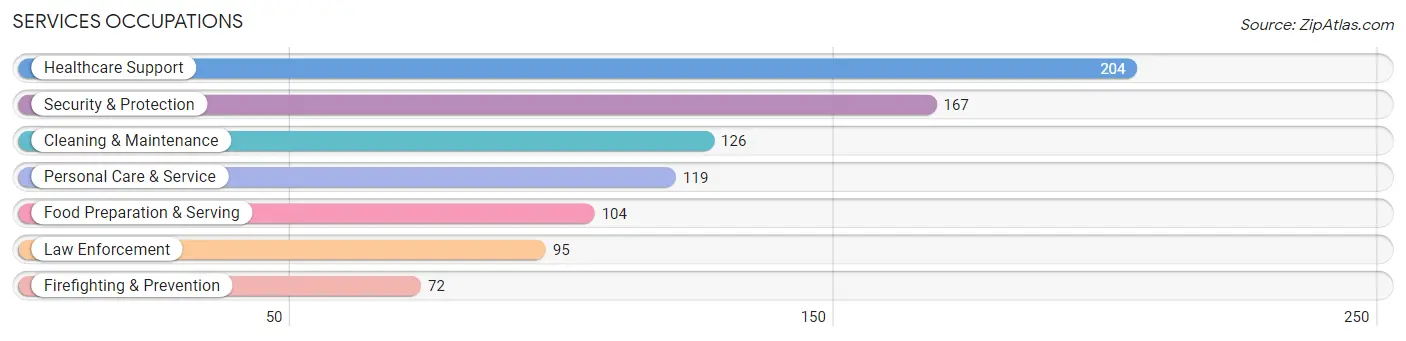
Services Occupations
The most common Services occupations in Glenarden are Healthcare Support (204 | 6.4%), Security & Protection (167 | 5.2%), Cleaning & Maintenance (126 | 4.0%), Personal Care & Service (119 | 3.7%), and Food Preparation & Serving (104 | 3.3%).
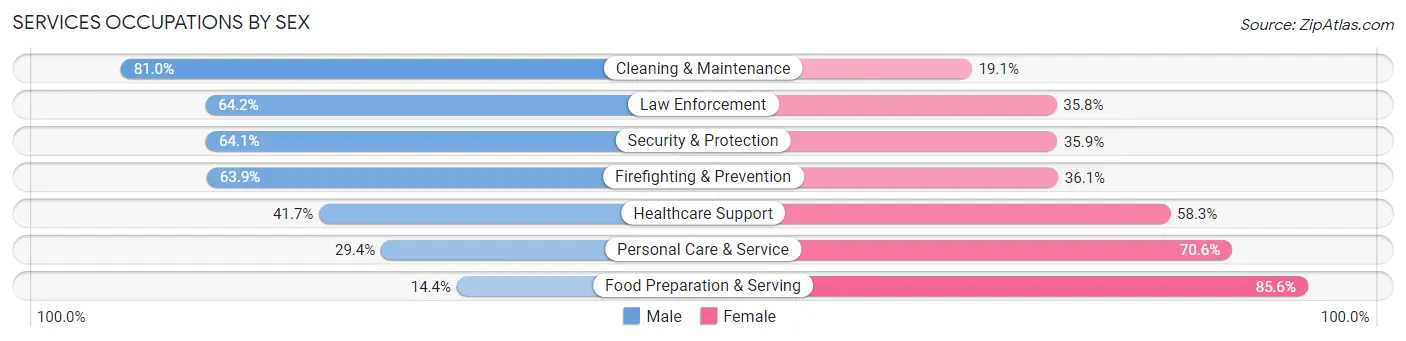
Services Occupations by Sex
Within the Services occupations in Glenarden, the most male-oriented occupations are Cleaning & Maintenance (80.9%), Law Enforcement (64.2%), and Security & Protection (64.1%), while the most female-oriented occupations are Food Preparation & Serving (85.6%), Personal Care & Service (70.6%), and Healthcare Support (58.3%).
| Occupation | Male | Female |
| Healthcare Support | 85 (41.7%) | 119 (58.3%) |
| Security & Protection | 107 (64.1%) | 60 (35.9%) |
| Firefighting & Prevention | 46 (63.9%) | 26 (36.1%) |
| Law Enforcement | 61 (64.2%) | 34 (35.8%) |
| Food Preparation & Serving | 15 (14.4%) | 89 (85.6%) |
| Cleaning & Maintenance | 102 (80.9%) | 24 (19.1%) |
| Personal Care & Service | 35 (29.4%) | 84 (70.6%) |
| Total (Category) | 344 (47.8%) | 376 (52.2%) |
| Total (Overall) | 1,503 (47.2%) | 1,683 (52.8%) |
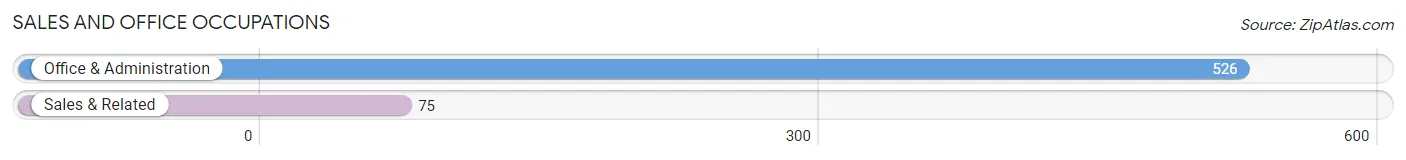
Sales and Office Occupations
The most common Sales and Office occupations in Glenarden are Office & Administration (526 | 16.5%), and Sales & Related (75 | 2.4%).
Sales and Office Occupations by Sex
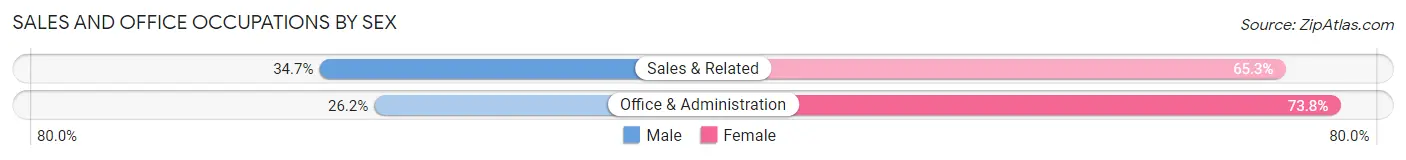
| Occupation | Male | Female |
| Sales & Related | 26 (34.7%) | 49 (65.3%) |
| Office & Administration | 138 (26.2%) | 388 (73.8%) |
| Total (Category) | 164 (27.3%) | 437 (72.7%) |
| Total (Overall) | 1,503 (47.2%) | 1,683 (52.8%) |
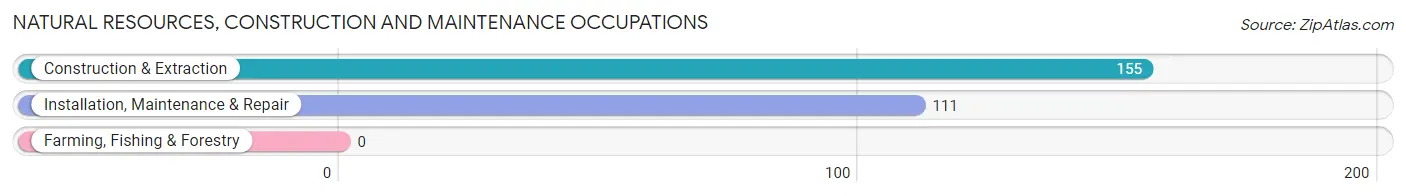
Natural Resources, Construction and Maintenance Occupations
The most common Natural Resources, Construction and Maintenance occupations in Glenarden are Construction & Extraction (155 | 4.9%), and Installation, Maintenance & Repair (111 | 3.5%).
Natural Resources, Construction and Maintenance Occupations by Sex
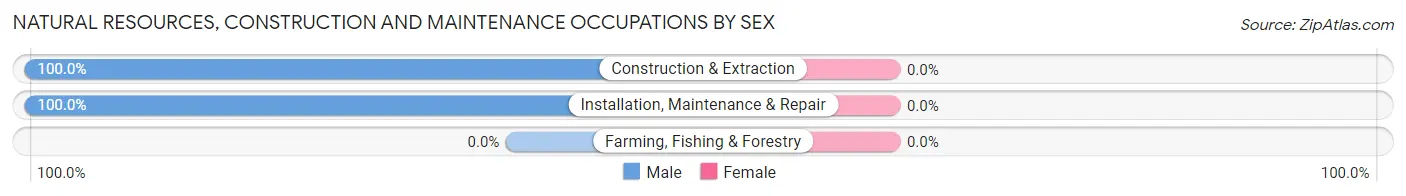
| Occupation | Male | Female |
| Farming, Fishing & Forestry | 0 (0.0%) | 0 (0.0%) |
| Construction & Extraction | 155 (100.0%) | 0 (0.0%) |
| Installation, Maintenance & Repair | 111 (100.0%) | 0 (0.0%) |
| Total (Category) | 266 (100.0%) | 0 (0.0%) |
| Total (Overall) | 1,503 (47.2%) | 1,683 (52.8%) |
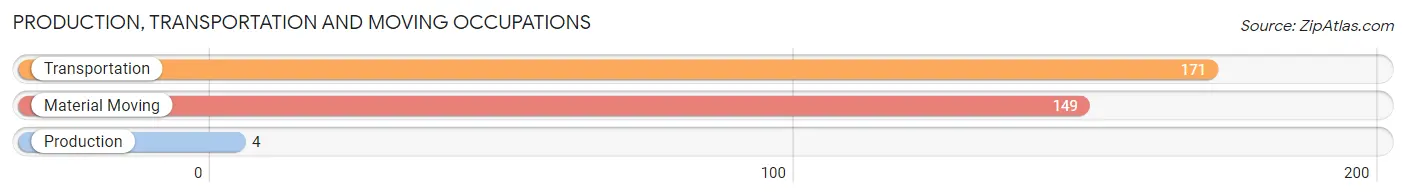
Production, Transportation and Moving Occupations
The most common Production, Transportation and Moving occupations in Glenarden are Transportation (171 | 5.4%), Material Moving (149 | 4.7%), and Production (4 | 0.1%).
Production, Transportation and Moving Occupations by Sex
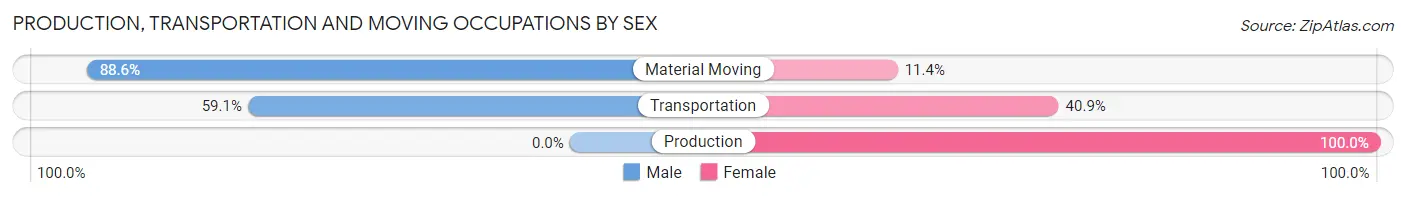
| Occupation | Male | Female |
| Production | 0 (0.0%) | 4 (100.0%) |
| Transportation | 101 (59.1%) | 70 (40.9%) |
| Material Moving | 132 (88.6%) | 17 (11.4%) |
| Total (Category) | 233 (71.9%) | 91 (28.1%) |
| Total (Overall) | 1,503 (47.2%) | 1,683 (52.8%) |
Employment Industries by Sex in Glenarden
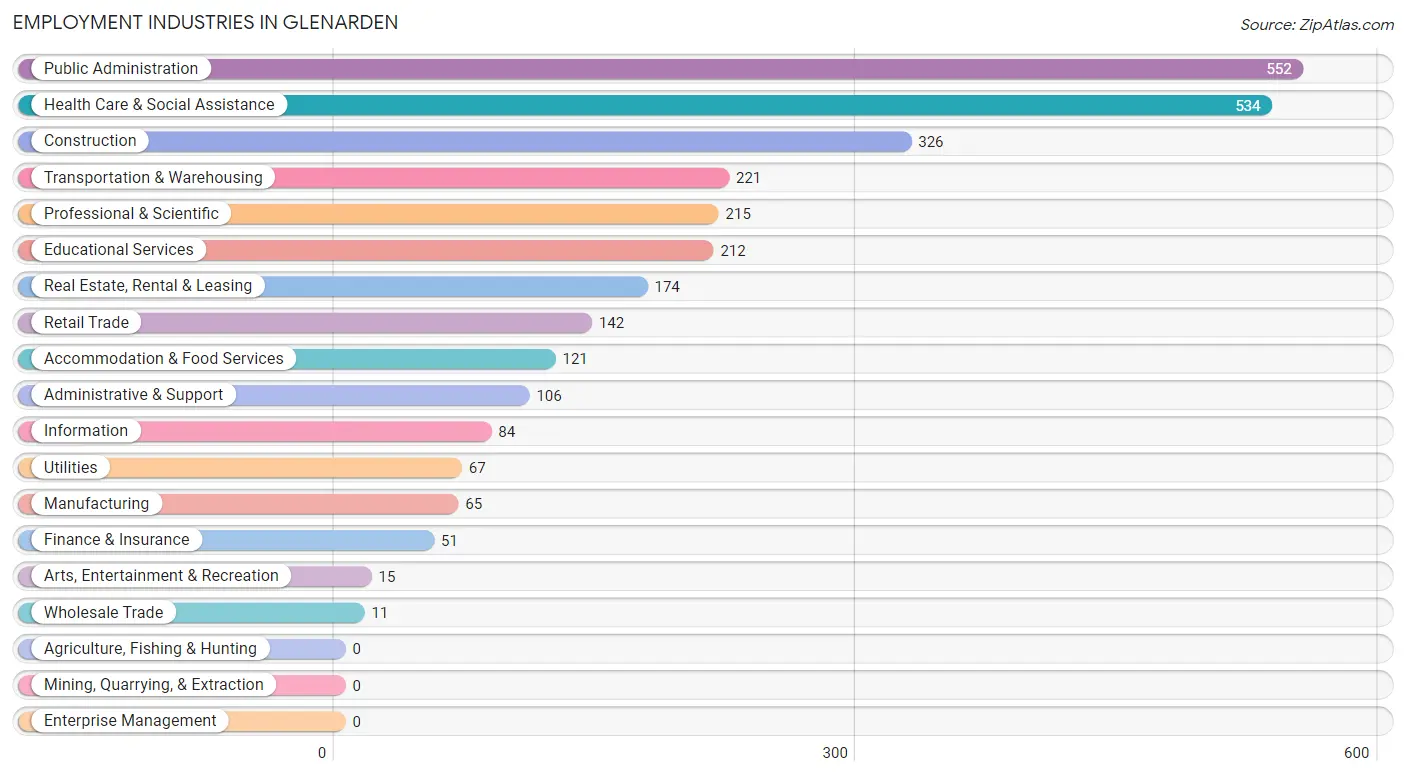
Employment Industries in Glenarden
The major employment industries in Glenarden include Public Administration (552 | 17.3%), Health Care & Social Assistance (534 | 16.8%), Construction (326 | 10.2%), Transportation & Warehousing (221 | 6.9%), and Professional & Scientific (215 | 6.8%).
Employment Industries by Sex in Glenarden
The Glenarden industries that see more men than women are Arts, Entertainment & Recreation (100.0%), Construction (94.8%), and Information (91.7%), whereas the industries that tend to have a higher number of women are Wholesale Trade (100.0%), Accommodation & Food Services (87.6%), and Health Care & Social Assistance (85.4%).
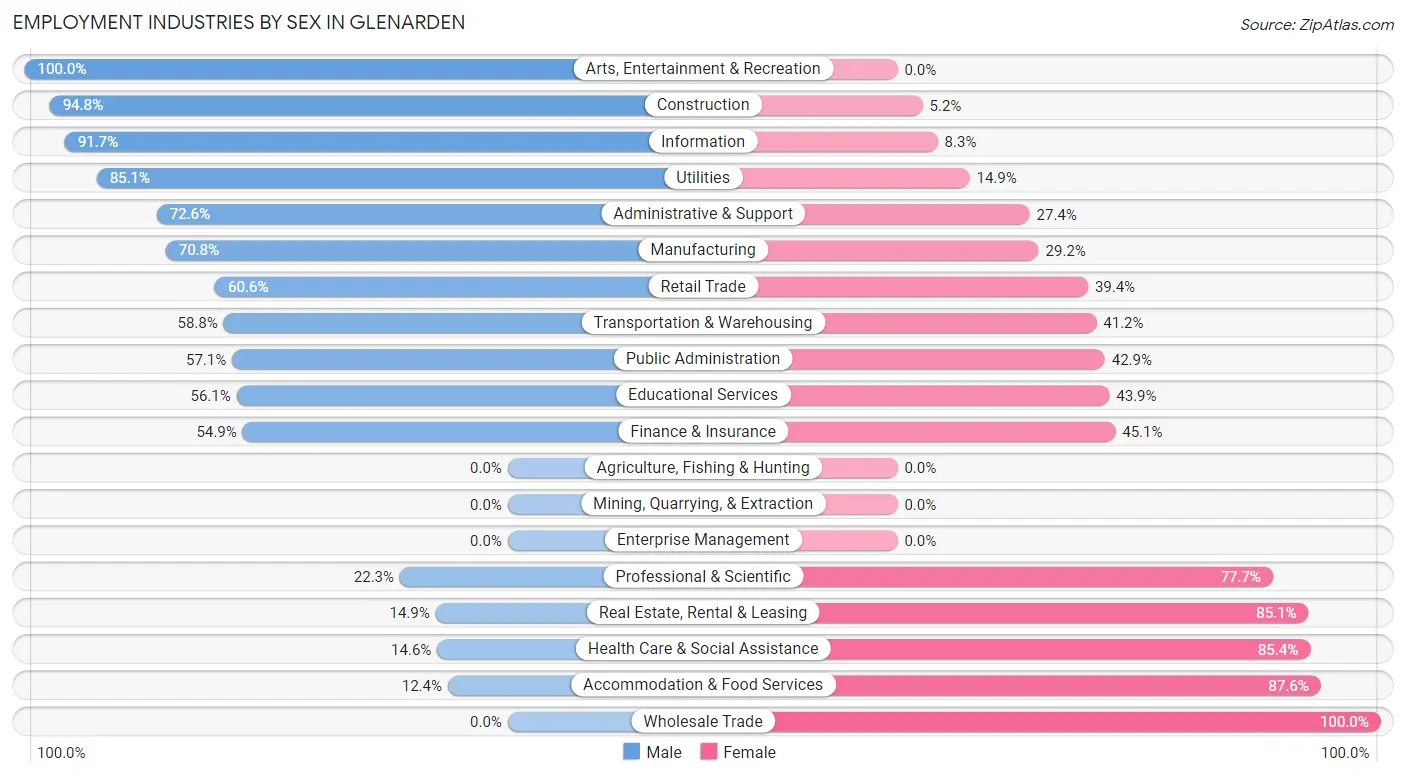
| Industry | Male | Female |
| Agriculture, Fishing & Hunting | 0 (0.0%) | 0 (0.0%) |
| Mining, Quarrying, & Extraction | 0 (0.0%) | 0 (0.0%) |
| Construction | 309 (94.8%) | 17 (5.2%) |
| Manufacturing | 46 (70.8%) | 19 (29.2%) |
| Wholesale Trade | 0 (0.0%) | 11 (100.0%) |
| Retail Trade | 86 (60.6%) | 56 (39.4%) |
| Transportation & Warehousing | 130 (58.8%) | 91 (41.2%) |
| Utilities | 57 (85.1%) | 10 (14.9%) |
| Information | 77 (91.7%) | 7 (8.3%) |
| Finance & Insurance | 28 (54.9%) | 23 (45.1%) |
| Real Estate, Rental & Leasing | 26 (14.9%) | 148 (85.1%) |
| Professional & Scientific | 48 (22.3%) | 167 (77.7%) |
| Enterprise Management | 0 (0.0%) | 0 (0.0%) |
| Administrative & Support | 77 (72.6%) | 29 (27.4%) |
| Educational Services | 119 (56.1%) | 93 (43.9%) |
| Health Care & Social Assistance | 78 (14.6%) | 456 (85.4%) |
| Arts, Entertainment & Recreation | 15 (100.0%) | 0 (0.0%) |
| Accommodation & Food Services | 15 (12.4%) | 106 (87.6%) |
| Public Administration | 315 (57.1%) | 237 (42.9%) |
| Total | 1,503 (47.2%) | 1,683 (52.8%) |
Education in Glenarden
School Enrollment in Glenarden
The most common levels of schooling among the 1,870 students in Glenarden are high school (575 | 30.7%), elementary school (465 | 24.9%), and middle school (289 | 15.4%).
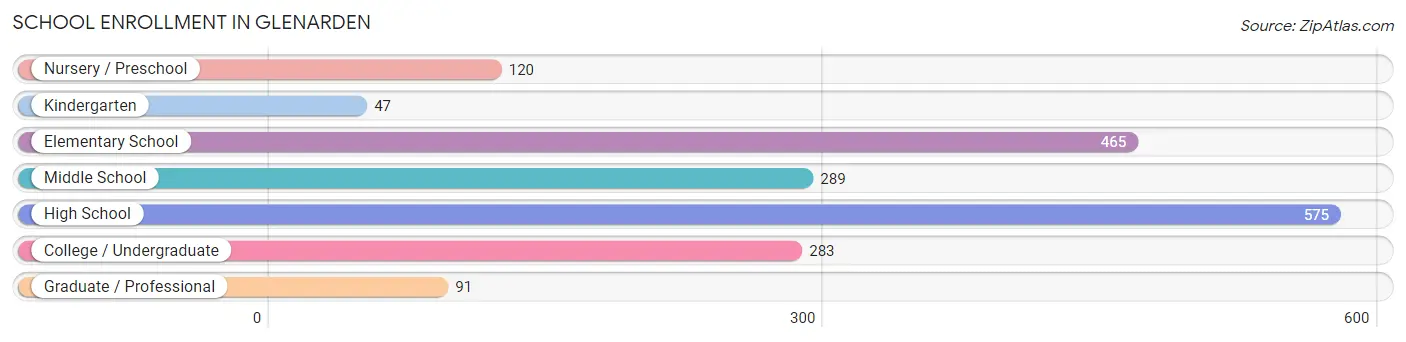
| School Level | # Students | % Students |
| Nursery / Preschool | 120 | 6.4% |
| Kindergarten | 47 | 2.5% |
| Elementary School | 465 | 24.9% |
| Middle School | 289 | 15.4% |
| High School | 575 | 30.7% |
| College / Undergraduate | 283 | 15.1% |
| Graduate / Professional | 91 | 4.9% |
| Total | 1,870 | 100.0% |
School Enrollment by Age by Funding Source in Glenarden
Out of a total of 1,870 students who are enrolled in schools in Glenarden, 482 (25.8%) attend a private institution, while the remaining 1,388 (74.2%) are enrolled in public schools. The age group of 3 to 4 year olds has the highest likelihood of being enrolled in private schools, with 66 (71.7% in the age bracket) enrolled. Conversely, the age group of 15 to 17 year olds has the lowest likelihood of being enrolled in a private school, with 426 (100.0% in the age bracket) attending a public institution.
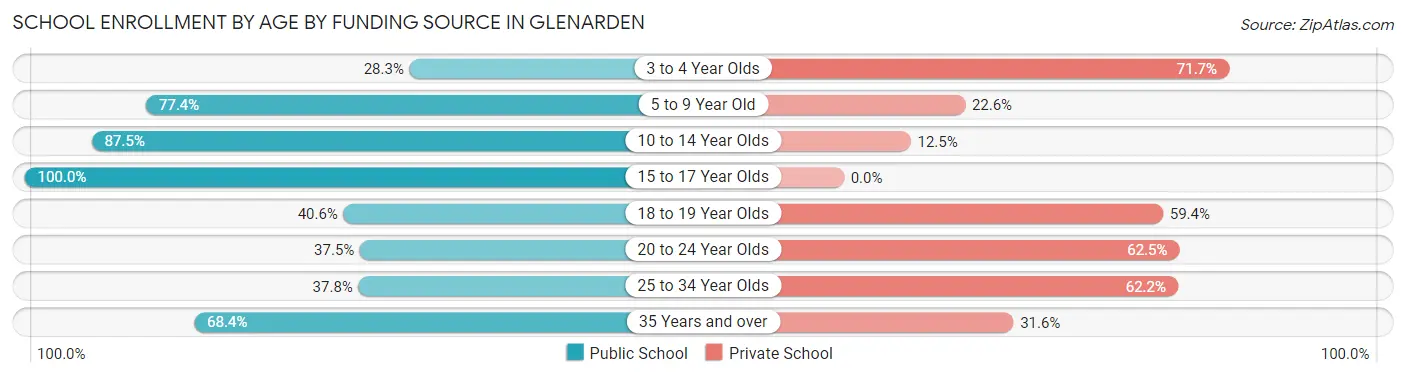
| Age Bracket | Public School | Private School |
| 3 to 4 Year Olds | 26 (28.3%) | 66 (71.7%) |
| 5 to 9 Year Old | 401 (77.4%) | 117 (22.6%) |
| 10 to 14 Year Olds | 295 (87.5%) | 42 (12.5%) |
| 15 to 17 Year Olds | 426 (100.0%) | 0 (0.0%) |
| 18 to 19 Year Olds | 73 (40.6%) | 107 (59.4%) |
| 20 to 24 Year Olds | 45 (37.5%) | 75 (62.5%) |
| 25 to 34 Year Olds | 17 (37.8%) | 28 (62.2%) |
| 35 Years and over | 104 (68.4%) | 48 (31.6%) |
| Total | 1,388 (74.2%) | 482 (25.8%) |
Educational Attainment by Field of Study in Glenarden
Business (274 | 18.0%), communications (213 | 14.0%), computers & mathematics (173 | 11.4%), science & technology (171 | 11.3%), and physical & health sciences (143 | 9.4%) are the most common fields of study among 1,519 individuals in Glenarden who have obtained a bachelor's degree or higher.
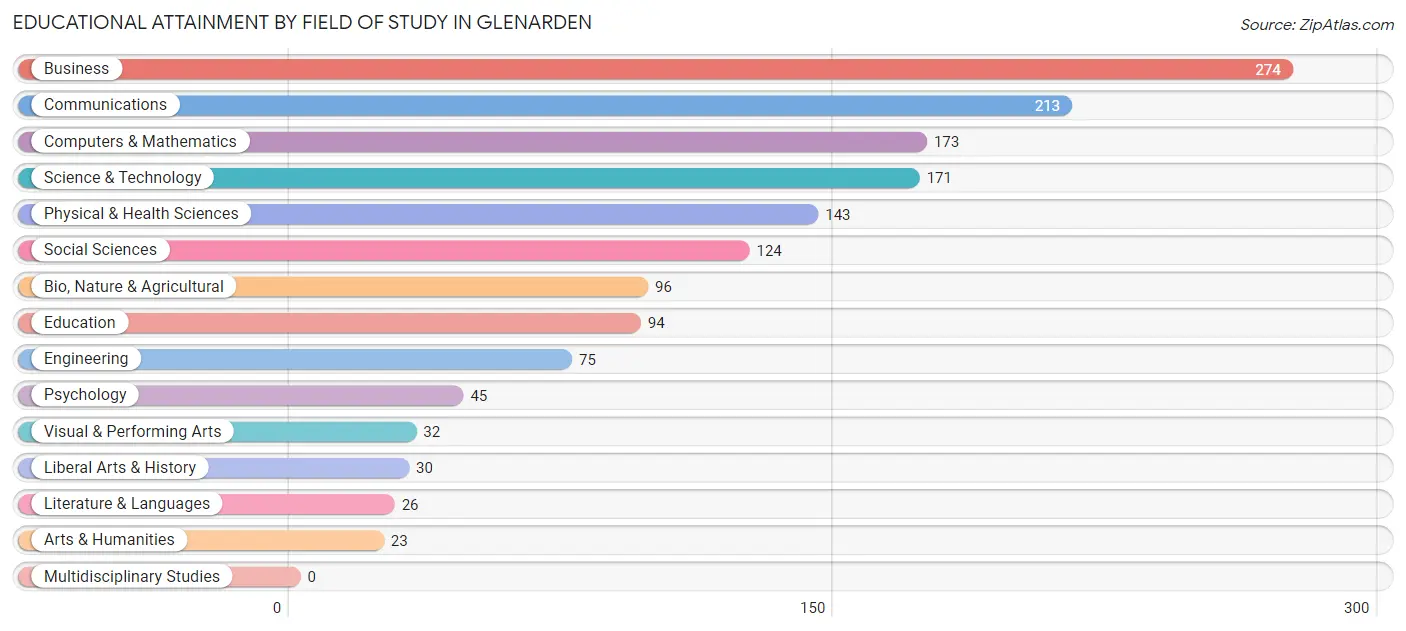
| Field of Study | # Graduates | % Graduates |
| Computers & Mathematics | 173 | 11.4% |
| Bio, Nature & Agricultural | 96 | 6.3% |
| Physical & Health Sciences | 143 | 9.4% |
| Psychology | 45 | 3.0% |
| Social Sciences | 124 | 8.2% |
| Engineering | 75 | 4.9% |
| Multidisciplinary Studies | 0 | 0.0% |
| Science & Technology | 171 | 11.3% |
| Business | 274 | 18.0% |
| Education | 94 | 6.2% |
| Literature & Languages | 26 | 1.7% |
| Liberal Arts & History | 30 | 2.0% |
| Visual & Performing Arts | 32 | 2.1% |
| Communications | 213 | 14.0% |
| Arts & Humanities | 23 | 1.5% |
| Total | 1,519 | 100.0% |
Transportation & Commute in Glenarden
Vehicle Availability by Sex in Glenarden
The most prevalent vehicle ownership categories in Glenarden are males with 2 vehicles (560, accounting for 37.6%) and females with 2 vehicles (646, making up 34.2%).
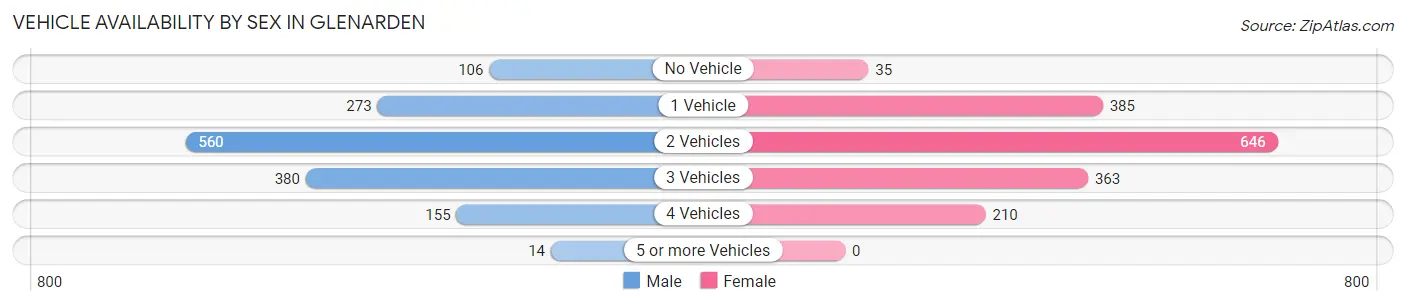
| Vehicles Available | Male | Female |
| No Vehicle | 106 (7.1%) | 35 (2.1%) |
| 1 Vehicle | 273 (18.3%) | 385 (23.5%) |
| 2 Vehicles | 560 (37.6%) | 646 (39.4%) |
| 3 Vehicles | 380 (25.5%) | 363 (22.2%) |
| 4 Vehicles | 155 (10.4%) | 210 (12.8%) |
| 5 or more Vehicles | 14 (0.9%) | 0 (0.0%) |
| Total | 1,488 (100.0%) | 1,639 (100.0%) |
Commute Time in Glenarden
The most frequently occuring commute durations in Glenarden are 45 to 59 minutes (374 commuters, 14.0%), 25 to 29 minutes (356 commuters, 13.3%), and 20 to 24 minutes (330 commuters, 12.3%).
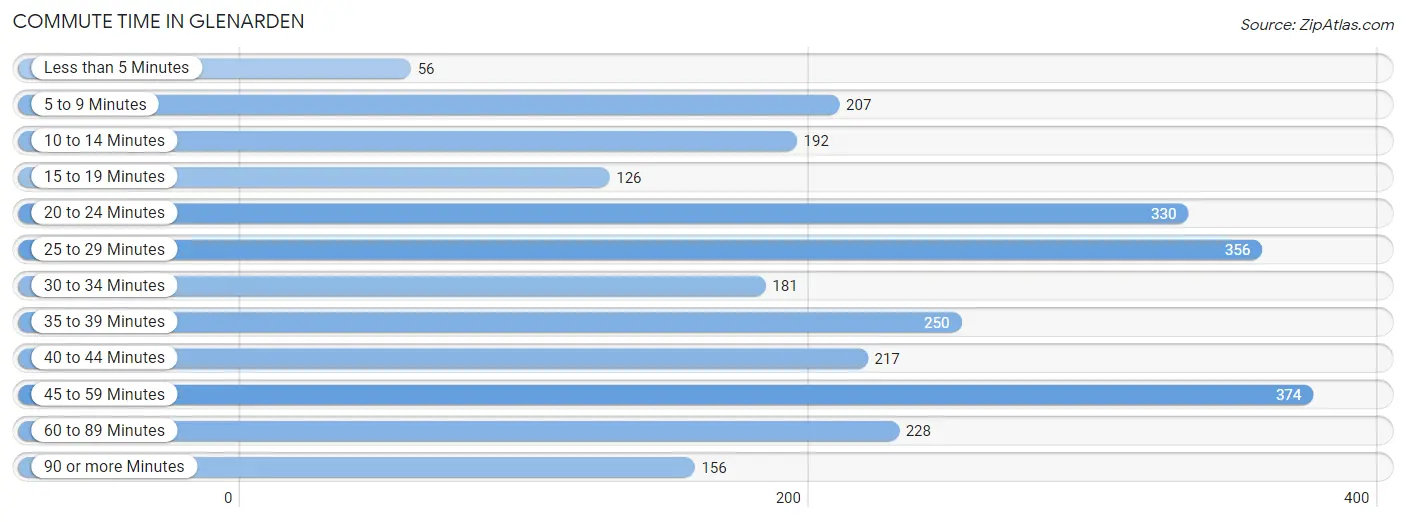
| Commute Time | # Commuters | % Commuters |
| Less than 5 Minutes | 56 | 2.1% |
| 5 to 9 Minutes | 207 | 7.7% |
| 10 to 14 Minutes | 192 | 7.2% |
| 15 to 19 Minutes | 126 | 4.7% |
| 20 to 24 Minutes | 330 | 12.3% |
| 25 to 29 Minutes | 356 | 13.3% |
| 30 to 34 Minutes | 181 | 6.8% |
| 35 to 39 Minutes | 250 | 9.3% |
| 40 to 44 Minutes | 217 | 8.1% |
| 45 to 59 Minutes | 374 | 14.0% |
| 60 to 89 Minutes | 228 | 8.5% |
| 90 or more Minutes | 156 | 5.8% |
Commute Time by Sex in Glenarden
The most common commute times in Glenarden are 20 to 24 minutes (189 commuters, 15.4%) for males and 45 to 59 minutes (210 commuters, 14.5%) for females.
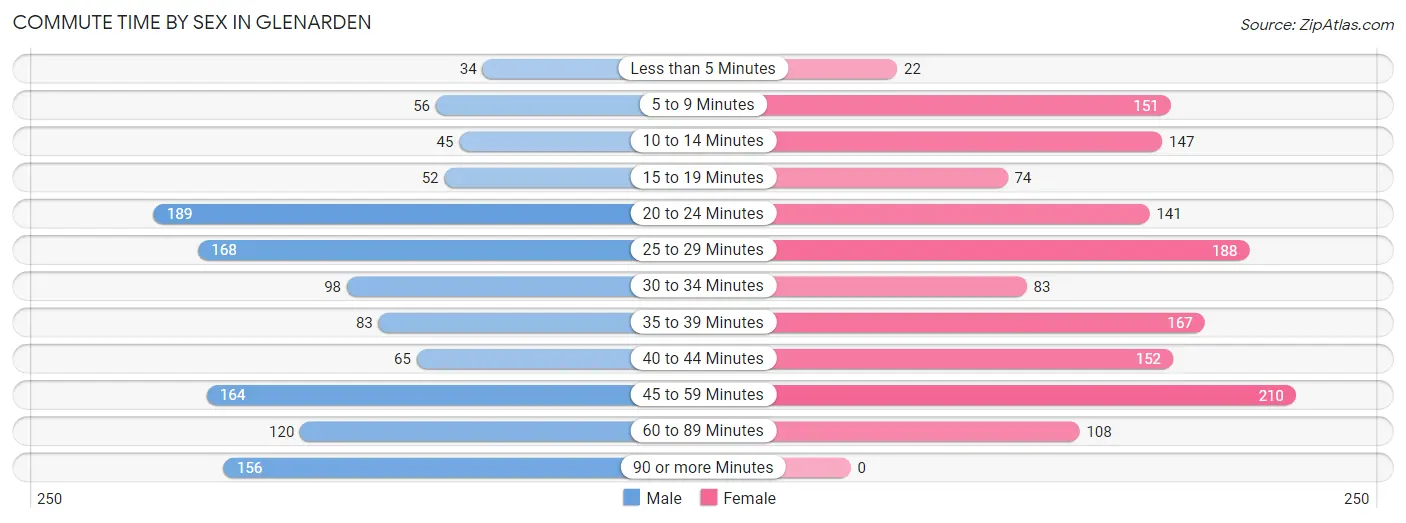
| Commute Time | Male | Female |
| Less than 5 Minutes | 34 (2.8%) | 22 (1.5%) |
| 5 to 9 Minutes | 56 (4.5%) | 151 (10.5%) |
| 10 to 14 Minutes | 45 (3.7%) | 147 (10.2%) |
| 15 to 19 Minutes | 52 (4.2%) | 74 (5.1%) |
| 20 to 24 Minutes | 189 (15.4%) | 141 (9.8%) |
| 25 to 29 Minutes | 168 (13.7%) | 188 (13.0%) |
| 30 to 34 Minutes | 98 (8.0%) | 83 (5.8%) |
| 35 to 39 Minutes | 83 (6.8%) | 167 (11.6%) |
| 40 to 44 Minutes | 65 (5.3%) | 152 (10.5%) |
| 45 to 59 Minutes | 164 (13.3%) | 210 (14.5%) |
| 60 to 89 Minutes | 120 (9.8%) | 108 (7.5%) |
| 90 or more Minutes | 156 (12.7%) | 0 (0.0%) |
Time of Departure to Work by Sex in Glenarden
The most frequent times of departure to work in Glenarden are 12:00 AM to 4:59 AM (194, 15.8%) for males and 6:00 AM to 6:29 AM (224, 15.5%) for females.
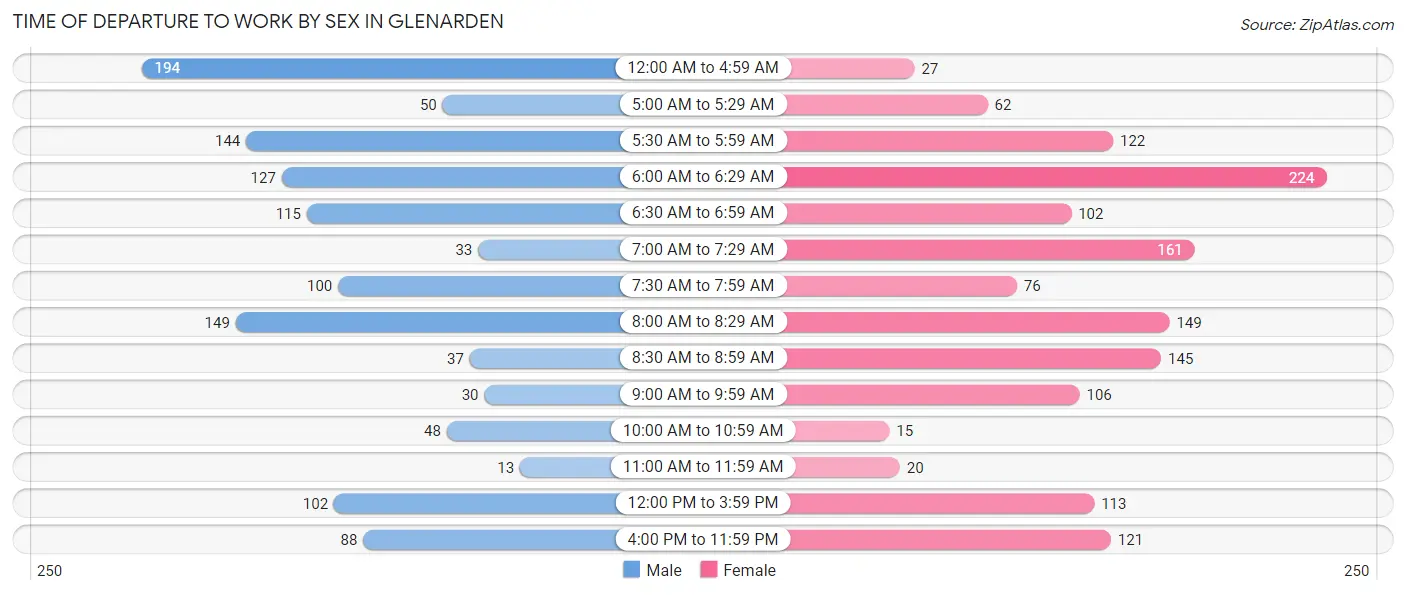
| Time of Departure | Male | Female |
| 12:00 AM to 4:59 AM | 194 (15.8%) | 27 (1.9%) |
| 5:00 AM to 5:29 AM | 50 (4.1%) | 62 (4.3%) |
| 5:30 AM to 5:59 AM | 144 (11.7%) | 122 (8.5%) |
| 6:00 AM to 6:29 AM | 127 (10.3%) | 224 (15.5%) |
| 6:30 AM to 6:59 AM | 115 (9.3%) | 102 (7.1%) |
| 7:00 AM to 7:29 AM | 33 (2.7%) | 161 (11.2%) |
| 7:30 AM to 7:59 AM | 100 (8.1%) | 76 (5.3%) |
| 8:00 AM to 8:29 AM | 149 (12.1%) | 149 (10.3%) |
| 8:30 AM to 8:59 AM | 37 (3.0%) | 145 (10.1%) |
| 9:00 AM to 9:59 AM | 30 (2.4%) | 106 (7.3%) |
| 10:00 AM to 10:59 AM | 48 (3.9%) | 15 (1.0%) |
| 11:00 AM to 11:59 AM | 13 (1.1%) | 20 (1.4%) |
| 12:00 PM to 3:59 PM | 102 (8.3%) | 113 (7.8%) |
| 4:00 PM to 11:59 PM | 88 (7.1%) | 121 (8.4%) |
| Total | 1,230 (100.0%) | 1,443 (100.0%) |
Housing Occupancy in Glenarden
Occupancy by Ownership in Glenarden
Of the total 2,160 dwellings in Glenarden, owner-occupied units account for 1,760 (81.5%), while renter-occupied units make up 400 (18.5%).
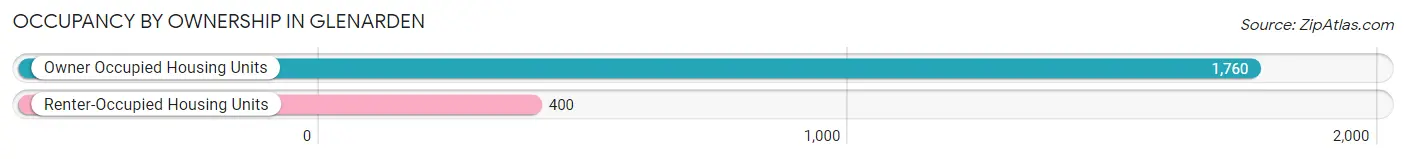
| Occupancy | # Housing Units | % Housing Units |
| Owner Occupied Housing Units | 1,760 | 81.5% |
| Renter-Occupied Housing Units | 400 | 18.5% |
| Total Occupied Housing Units | 2,160 | 100.0% |
Occupancy by Household Size in Glenarden
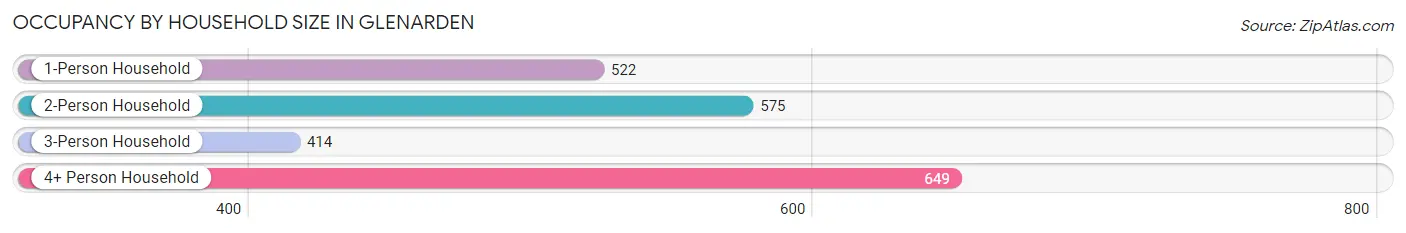
| Household Size | # Housing Units | % Housing Units |
| 1-Person Household | 522 | 24.2% |
| 2-Person Household | 575 | 26.6% |
| 3-Person Household | 414 | 19.2% |
| 4+ Person Household | 649 | 30.0% |
| Total Housing Units | 2,160 | 100.0% |
Occupancy by Ownership by Household Size in Glenarden
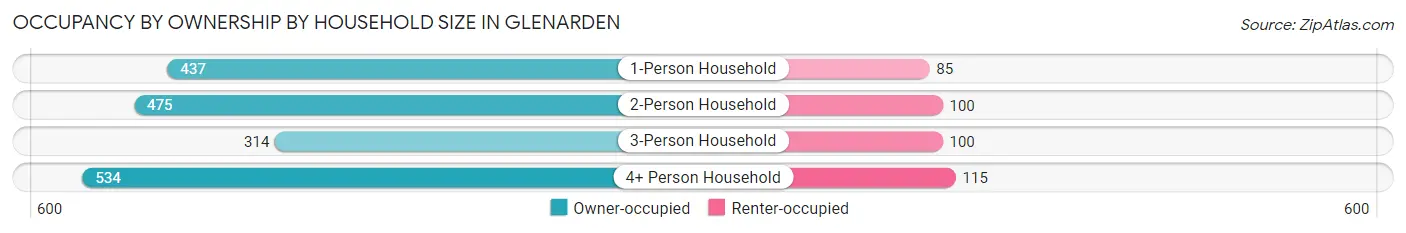
| Household Size | Owner-occupied | Renter-occupied |
| 1-Person Household | 437 (83.7%) | 85 (16.3%) |
| 2-Person Household | 475 (82.6%) | 100 (17.4%) |
| 3-Person Household | 314 (75.8%) | 100 (24.1%) |
| 4+ Person Household | 534 (82.3%) | 115 (17.7%) |
| Total Housing Units | 1,760 (81.5%) | 400 (18.5%) |
Occupancy by Educational Attainment in Glenarden
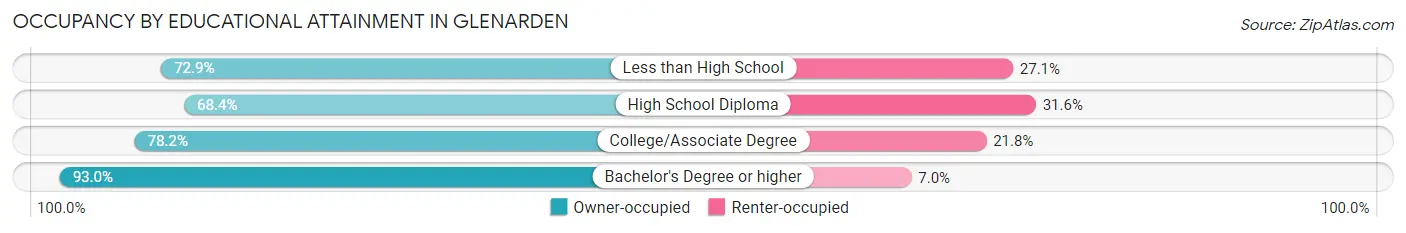
| Household Size | Owner-occupied | Renter-occupied |
| Less than High School | 113 (72.9%) | 42 (27.1%) |
| High School Diploma | 337 (68.4%) | 156 (31.6%) |
| College/Associate Degree | 509 (78.2%) | 142 (21.8%) |
| Bachelor's Degree or higher | 801 (93.0%) | 60 (7.0%) |
Occupancy by Age of Householder in Glenarden
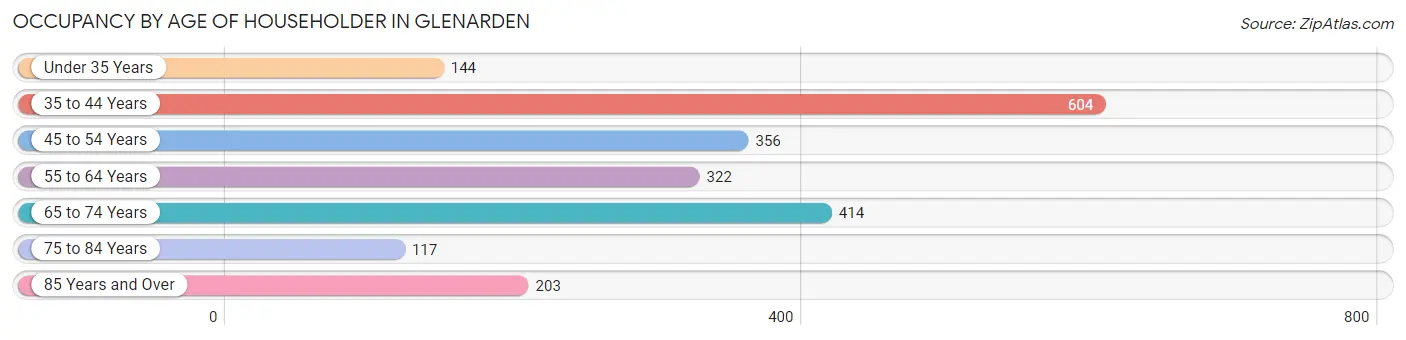
| Age Bracket | # Households | % Households |
| Under 35 Years | 144 | 6.7% |
| 35 to 44 Years | 604 | 28.0% |
| 45 to 54 Years | 356 | 16.5% |
| 55 to 64 Years | 322 | 14.9% |
| 65 to 74 Years | 414 | 19.2% |
| 75 to 84 Years | 117 | 5.4% |
| 85 Years and Over | 203 | 9.4% |
| Total | 2,160 | 100.0% |
Housing Finances in Glenarden
Median Income by Occupancy in Glenarden
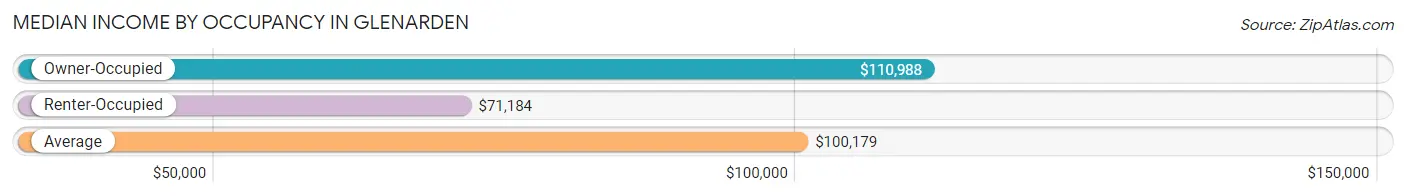
| Occupancy Type | # Households | Median Income |
| Owner-Occupied | 1,760 (81.5%) | $110,988 |
| Renter-Occupied | 400 (18.5%) | $71,184 |
| Average | 2,160 (100.0%) | $100,179 |
Occupancy by Householder Income Bracket in Glenarden
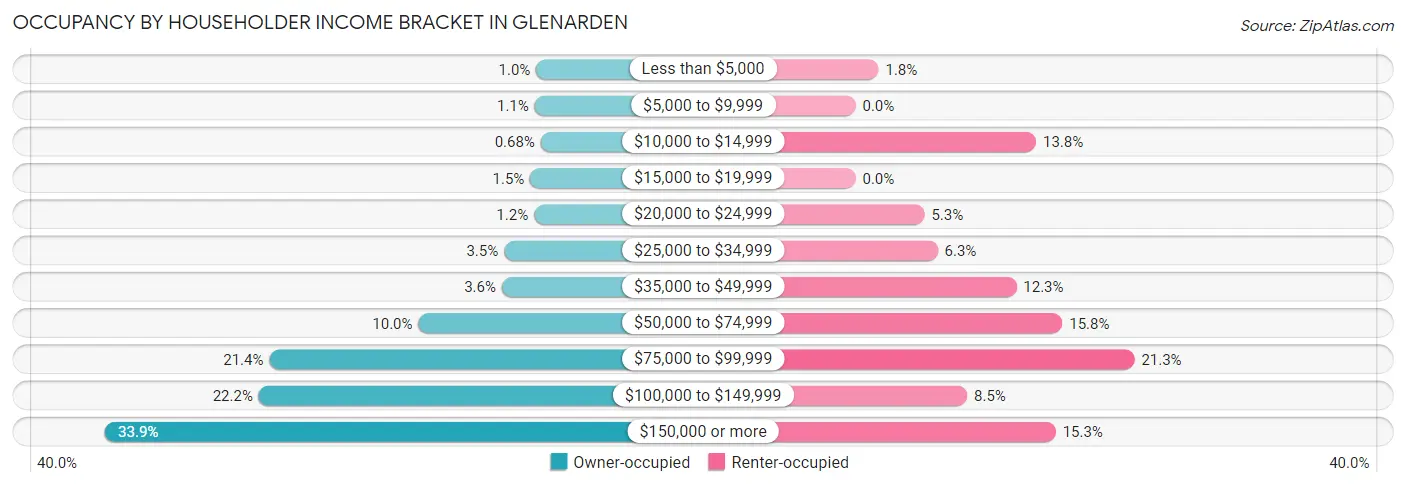
| Income Bracket | Owner-occupied | Renter-occupied |
| Less than $5,000 | 18 (1.0%) | 7 (1.8%) |
| $5,000 to $9,999 | 20 (1.1%) | 0 (0.0%) |
| $10,000 to $14,999 | 12 (0.7%) | 55 (13.8%) |
| $15,000 to $19,999 | 26 (1.5%) | 0 (0.0%) |
| $20,000 to $24,999 | 21 (1.2%) | 21 (5.2%) |
| $25,000 to $34,999 | 61 (3.5%) | 25 (6.2%) |
| $35,000 to $49,999 | 64 (3.6%) | 49 (12.2%) |
| $50,000 to $74,999 | 176 (10.0%) | 63 (15.8%) |
| $75,000 to $99,999 | 376 (21.4%) | 85 (21.2%) |
| $100,000 to $149,999 | 390 (22.2%) | 34 (8.5%) |
| $150,000 or more | 596 (33.9%) | 61 (15.2%) |
| Total | 1,760 (100.0%) | 400 (100.0%) |
Monthly Housing Cost Tiers in Glenarden
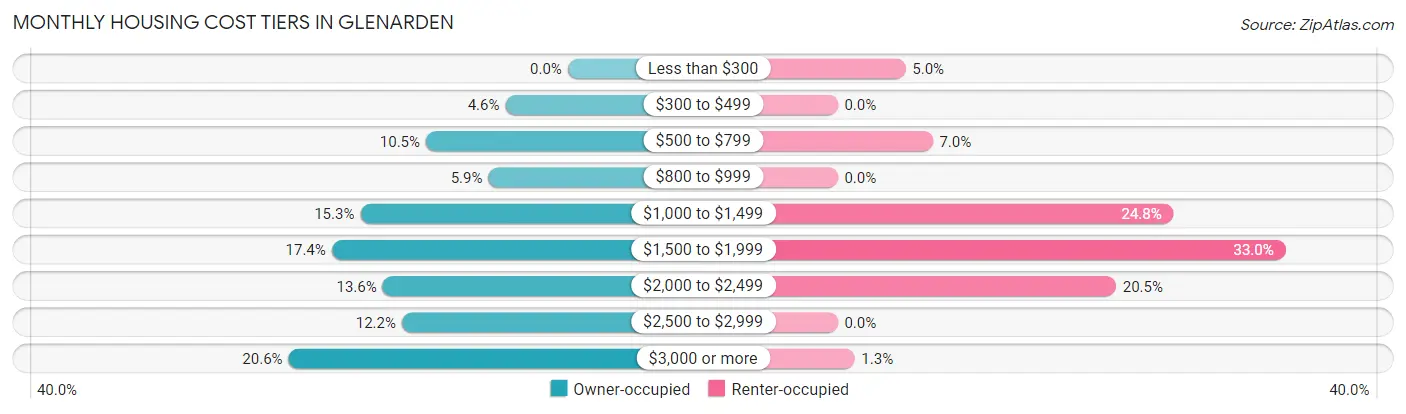
| Monthly Cost | Owner-occupied | Renter-occupied |
| Less than $300 | 0 (0.0%) | 20 (5.0%) |
| $300 to $499 | 81 (4.6%) | 0 (0.0%) |
| $500 to $799 | 184 (10.4%) | 28 (7.0%) |
| $800 to $999 | 103 (5.9%) | 0 (0.0%) |
| $1,000 to $1,499 | 269 (15.3%) | 99 (24.7%) |
| $1,500 to $1,999 | 306 (17.4%) | 132 (33.0%) |
| $2,000 to $2,499 | 240 (13.6%) | 82 (20.5%) |
| $2,500 to $2,999 | 215 (12.2%) | 0 (0.0%) |
| $3,000 or more | 362 (20.6%) | 5 (1.3%) |
| Total | 1,760 (100.0%) | 400 (100.0%) |
Physical Housing Characteristics in Glenarden
Housing Structures in Glenarden
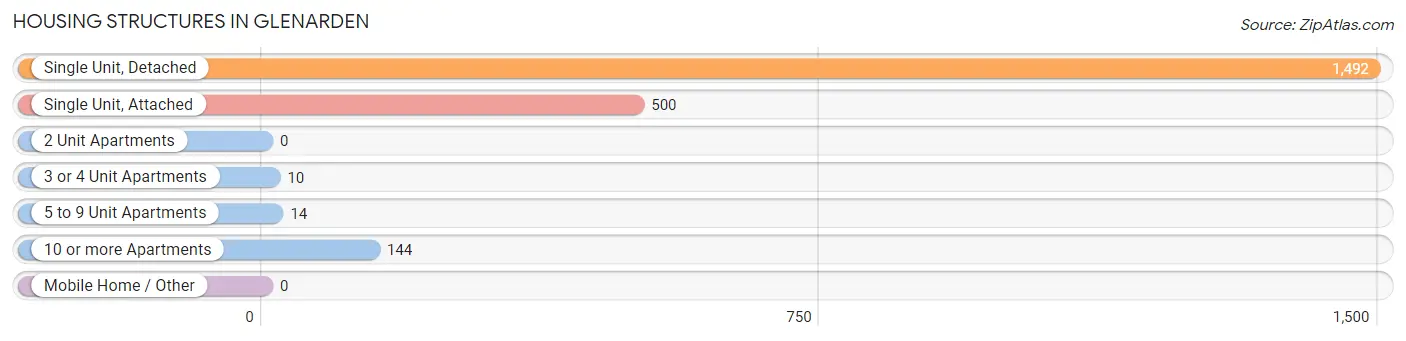
| Structure Type | # Housing Units | % Housing Units |
| Single Unit, Detached | 1,492 | 69.1% |
| Single Unit, Attached | 500 | 23.2% |
| 2 Unit Apartments | 0 | 0.0% |
| 3 or 4 Unit Apartments | 10 | 0.5% |
| 5 to 9 Unit Apartments | 14 | 0.6% |
| 10 or more Apartments | 144 | 6.7% |
| Mobile Home / Other | 0 | 0.0% |
| Total | 2,160 | 100.0% |
Housing Structures by Occupancy in Glenarden
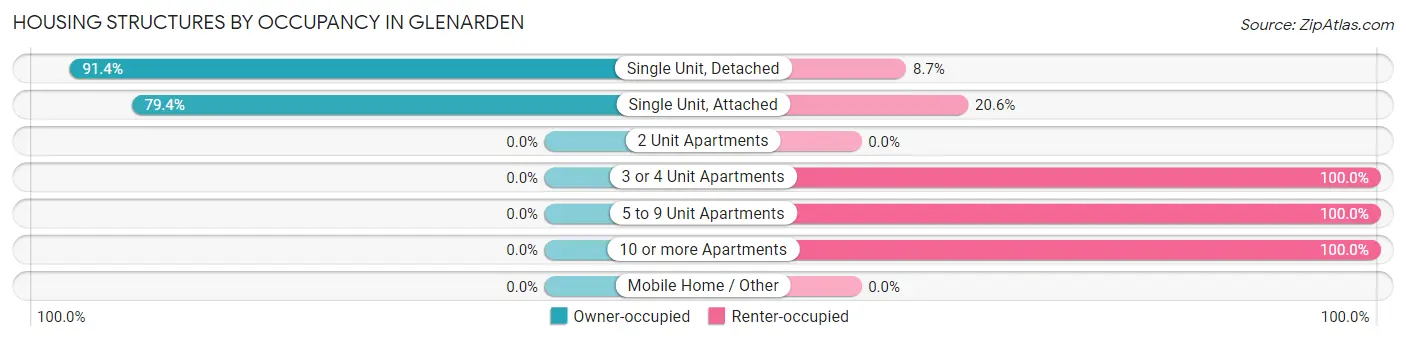
| Structure Type | Owner-occupied | Renter-occupied |
| Single Unit, Detached | 1,363 (91.3%) | 129 (8.6%) |
| Single Unit, Attached | 397 (79.4%) | 103 (20.6%) |
| 2 Unit Apartments | 0 (0.0%) | 0 (0.0%) |
| 3 or 4 Unit Apartments | 0 (0.0%) | 10 (100.0%) |
| 5 to 9 Unit Apartments | 0 (0.0%) | 14 (100.0%) |
| 10 or more Apartments | 0 (0.0%) | 144 (100.0%) |
| Mobile Home / Other | 0 (0.0%) | 0 (0.0%) |
| Total | 1,760 (81.5%) | 400 (18.5%) |
Housing Structures by Number of Rooms in Glenarden
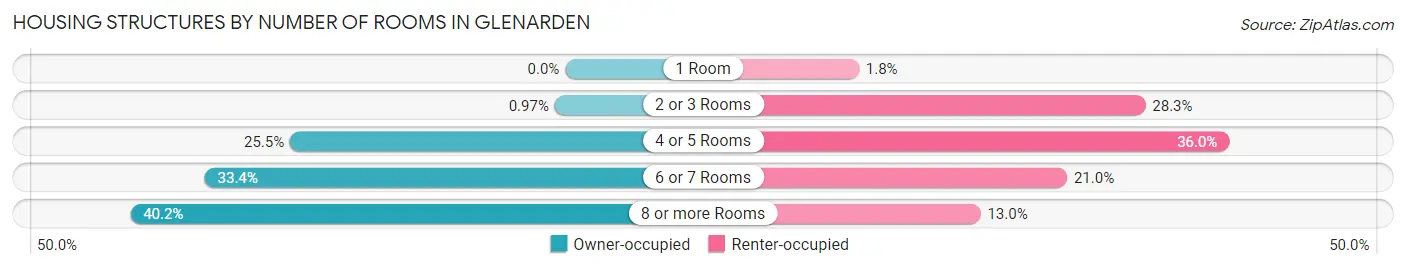
| Number of Rooms | Owner-occupied | Renter-occupied |
| 1 Room | 0 (0.0%) | 7 (1.8%) |
| 2 or 3 Rooms | 17 (1.0%) | 113 (28.2%) |
| 4 or 5 Rooms | 448 (25.5%) | 144 (36.0%) |
| 6 or 7 Rooms | 587 (33.4%) | 84 (21.0%) |
| 8 or more Rooms | 708 (40.2%) | 52 (13.0%) |
| Total | 1,760 (100.0%) | 400 (100.0%) |
Housing Structure by Heating Type in Glenarden
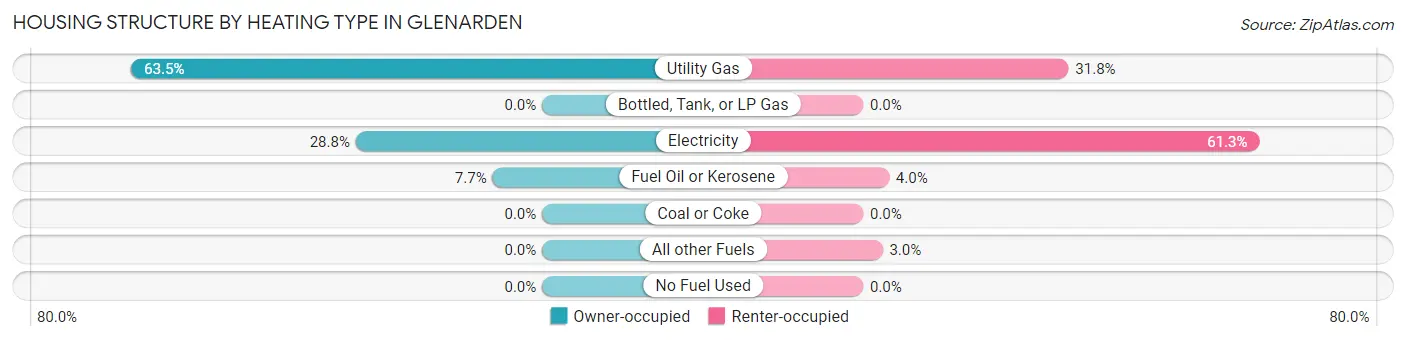
| Heating Type | Owner-occupied | Renter-occupied |
| Utility Gas | 1,118 (63.5%) | 127 (31.8%) |
| Bottled, Tank, or LP Gas | 0 (0.0%) | 0 (0.0%) |
| Electricity | 507 (28.8%) | 245 (61.3%) |
| Fuel Oil or Kerosene | 135 (7.7%) | 16 (4.0%) |
| Coal or Coke | 0 (0.0%) | 0 (0.0%) |
| All other Fuels | 0 (0.0%) | 12 (3.0%) |
| No Fuel Used | 0 (0.0%) | 0 (0.0%) |
| Total | 1,760 (100.0%) | 400 (100.0%) |
Household Vehicle Usage in Glenarden
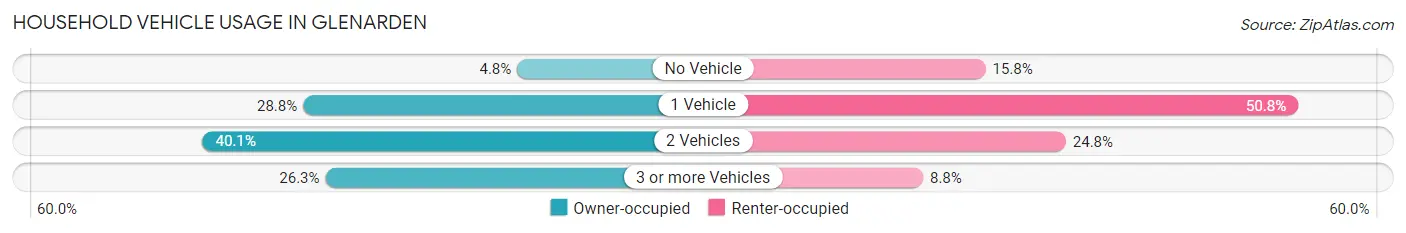
| Vehicles per Household | Owner-occupied | Renter-occupied |
| No Vehicle | 85 (4.8%) | 63 (15.8%) |
| 1 Vehicle | 507 (28.8%) | 203 (50.7%) |
| 2 Vehicles | 705 (40.1%) | 99 (24.7%) |
| 3 or more Vehicles | 463 (26.3%) | 35 (8.7%) |
| Total | 1,760 (100.0%) | 400 (100.0%) |
Real Estate & Mortgages in Glenarden
Real Estate and Mortgage Overview in Glenarden
| Characteristic | Without Mortgage | With Mortgage |
| Housing Units | 487 | 1,273 |
| Median Property Value | $355,100 | $406,300 |
| Median Household Income | $88,874 | $550 |
| Monthly Housing Costs | $834 | $362 |
| Real Estate Taxes | $5,237 | $8 |
Property Value by Mortgage Status in Glenarden
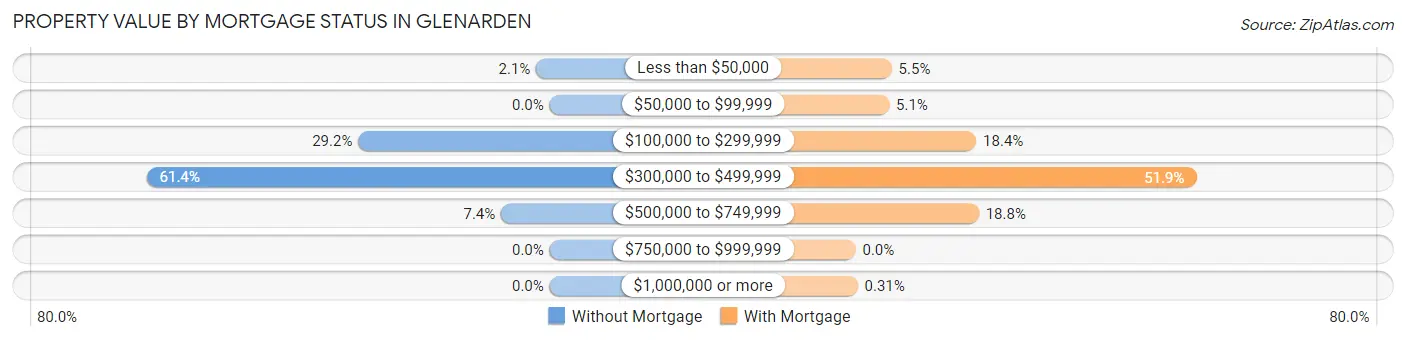
| Property Value | Without Mortgage | With Mortgage |
| Less than $50,000 | 10 (2.1%) | 70 (5.5%) |
| $50,000 to $99,999 | 0 (0.0%) | 65 (5.1%) |
| $100,000 to $299,999 | 142 (29.2%) | 234 (18.4%) |
| $300,000 to $499,999 | 299 (61.4%) | 661 (51.9%) |
| $500,000 to $749,999 | 36 (7.4%) | 239 (18.8%) |
| $750,000 to $999,999 | 0 (0.0%) | 0 (0.0%) |
| $1,000,000 or more | 0 (0.0%) | 4 (0.3%) |
| Total | 487 (100.0%) | 1,273 (100.0%) |
Household Income by Mortgage Status in Glenarden
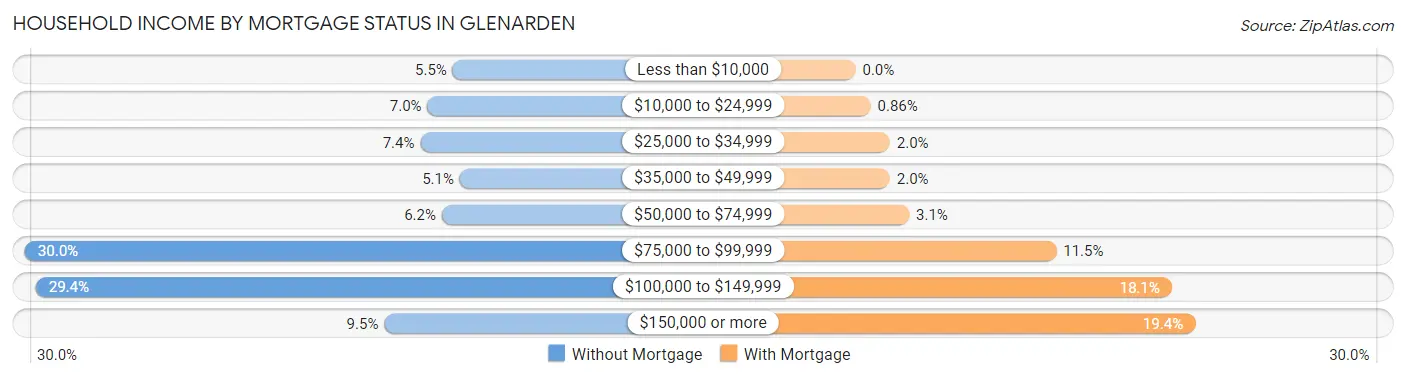
| Household Income | Without Mortgage | With Mortgage |
| Less than $10,000 | 27 (5.5%) | 0 (0.0%) |
| $10,000 to $24,999 | 34 (7.0%) | 11 (0.9%) |
| $25,000 to $34,999 | 36 (7.4%) | 25 (2.0%) |
| $35,000 to $49,999 | 25 (5.1%) | 25 (2.0%) |
| $50,000 to $74,999 | 30 (6.2%) | 39 (3.1%) |
| $75,000 to $99,999 | 146 (30.0%) | 146 (11.5%) |
| $100,000 to $149,999 | 143 (29.4%) | 230 (18.1%) |
| $150,000 or more | 46 (9.5%) | 247 (19.4%) |
| Total | 487 (100.0%) | 1,273 (100.0%) |
Property Value to Household Income Ratio in Glenarden
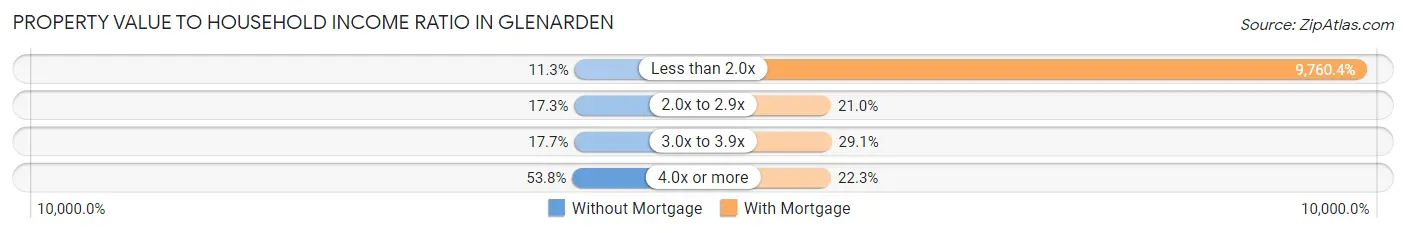
| Value-to-Income Ratio | Without Mortgage | With Mortgage |
| Less than 2.0x | 55 (11.3%) | 124,250 (9,760.4%) |
| 2.0x to 2.9x | 84 (17.2%) | 267 (21.0%) |
| 3.0x to 3.9x | 86 (17.7%) | 371 (29.1%) |
| 4.0x or more | 262 (53.8%) | 284 (22.3%) |
| Total | 487 (100.0%) | 1,273 (100.0%) |
Real Estate Taxes by Mortgage Status in Glenarden
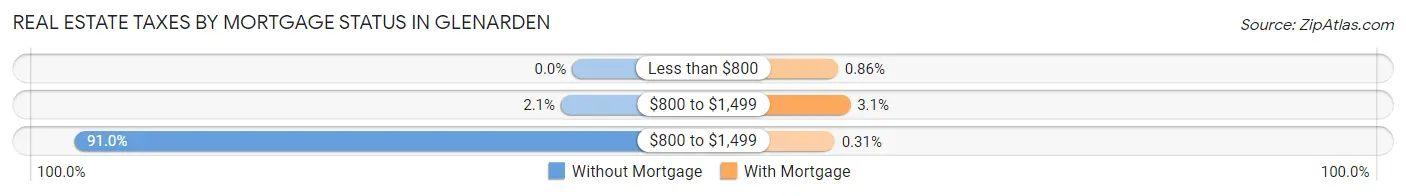
| Property Taxes | Without Mortgage | With Mortgage |
| Less than $800 | 0 (0.0%) | 11 (0.9%) |
| $800 to $1,499 | 10 (2.1%) | 40 (3.1%) |
| $800 to $1,499 | 443 (91.0%) | 4 (0.3%) |
| Total | 487 (100.0%) | 1,273 (100.0%) |
Health & Disability in Glenarden
Health Insurance Coverage by Age in Glenarden
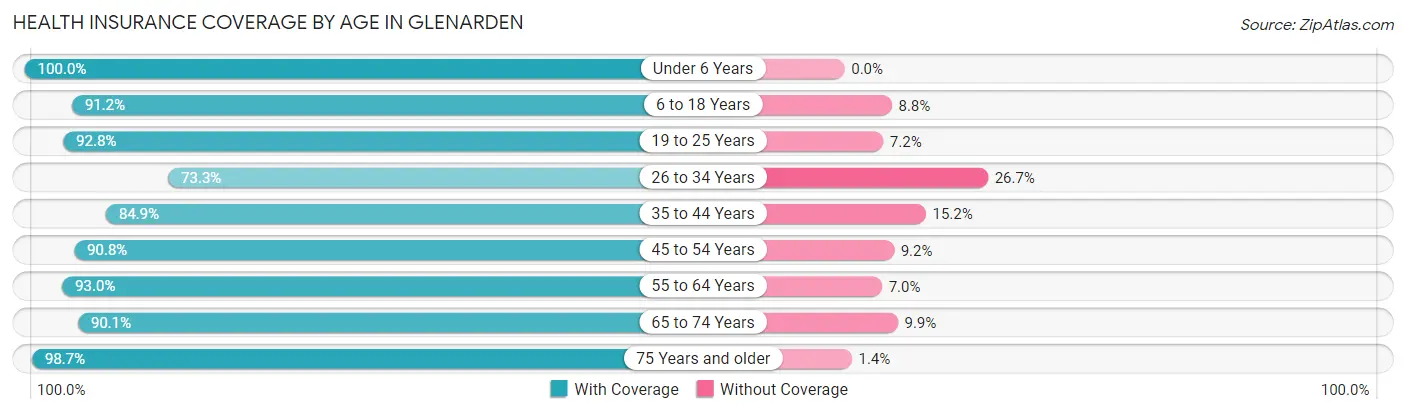
| Age Bracket | With Coverage | Without Coverage |
| Under 6 Years | 365 (100.0%) | 0 (0.0%) |
| 6 to 18 Years | 1,304 (91.2%) | 126 (8.8%) |
| 19 to 25 Years | 361 (92.8%) | 28 (7.2%) |
| 26 to 34 Years | 348 (73.3%) | 127 (26.7%) |
| 35 to 44 Years | 1,042 (84.9%) | 186 (15.1%) |
| 45 to 54 Years | 542 (90.8%) | 55 (9.2%) |
| 55 to 64 Years | 813 (93.0%) | 61 (7.0%) |
| 65 to 74 Years | 526 (90.1%) | 58 (9.9%) |
| 75 Years and older | 366 (98.7%) | 5 (1.3%) |
| Total | 5,667 (89.8%) | 646 (10.2%) |
Health Insurance Coverage by Citizenship Status in Glenarden
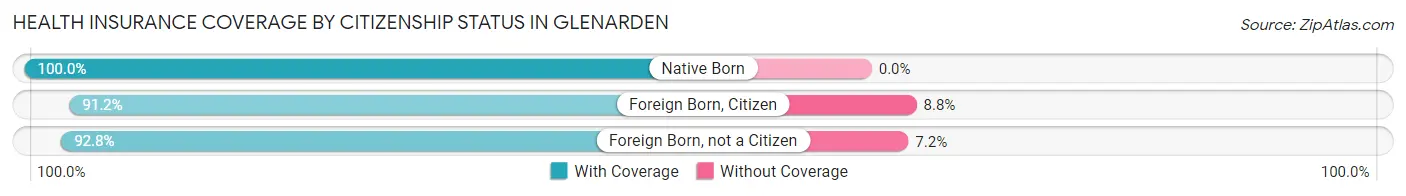
| Citizenship Status | With Coverage | Without Coverage |
| Native Born | 365 (100.0%) | 0 (0.0%) |
| Foreign Born, Citizen | 1,304 (91.2%) | 126 (8.8%) |
| Foreign Born, not a Citizen | 361 (92.8%) | 28 (7.2%) |
Health Insurance Coverage by Household Income in Glenarden
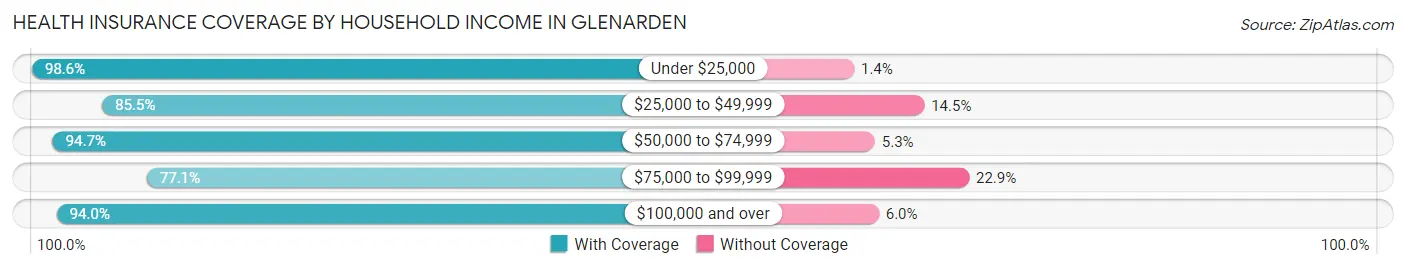
| Household Income | With Coverage | Without Coverage |
| Under $25,000 | 290 (98.6%) | 4 (1.4%) |
| $25,000 to $49,999 | 436 (85.5%) | 74 (14.5%) |
| $50,000 to $74,999 | 540 (94.7%) | 30 (5.3%) |
| $75,000 to $99,999 | 1,104 (77.1%) | 328 (22.9%) |
| $100,000 and over | 3,297 (94.0%) | 210 (6.0%) |
Public vs Private Health Insurance Coverage by Age in Glenarden
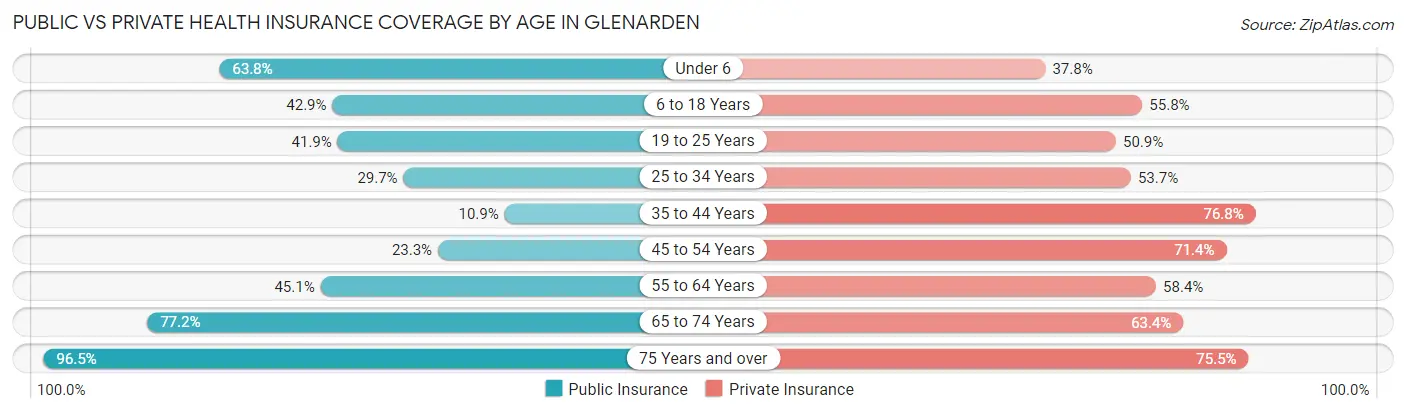
| Age Bracket | Public Insurance | Private Insurance |
| Under 6 | 233 (63.8%) | 138 (37.8%) |
| 6 to 18 Years | 613 (42.9%) | 798 (55.8%) |
| 19 to 25 Years | 163 (41.9%) | 198 (50.9%) |
| 25 to 34 Years | 141 (29.7%) | 255 (53.7%) |
| 35 to 44 Years | 134 (10.9%) | 943 (76.8%) |
| 45 to 54 Years | 139 (23.3%) | 426 (71.4%) |
| 55 to 64 Years | 394 (45.1%) | 510 (58.4%) |
| 65 to 74 Years | 451 (77.2%) | 370 (63.4%) |
| 75 Years and over | 358 (96.5%) | 280 (75.5%) |
| Total | 2,626 (41.6%) | 3,918 (62.1%) |
Disability Status by Sex by Age in Glenarden
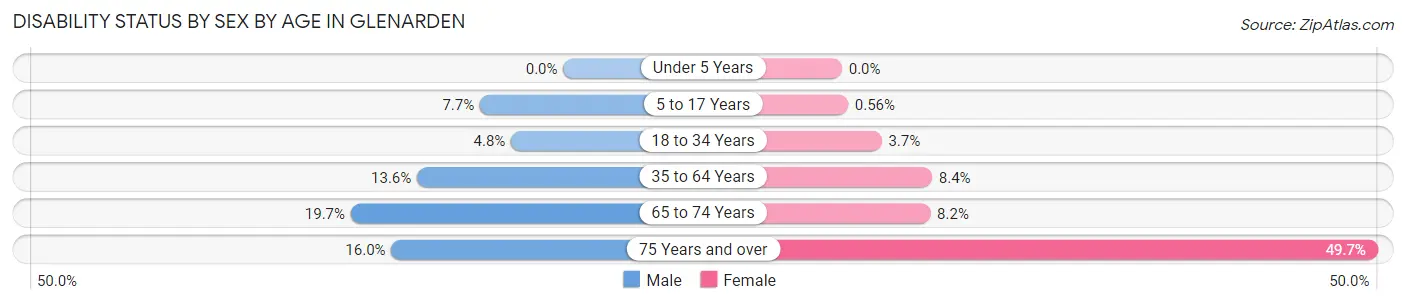
| Age Bracket | Male | Female |
| Under 5 Years | 0 (0.0%) | 0 (0.0%) |
| 5 to 17 Years | 61 (7.7%) | 3 (0.6%) |
| 18 to 34 Years | 28 (4.8%) | 16 (3.7%) |
| 35 to 64 Years | 165 (13.6%) | 124 (8.4%) |
| 65 to 74 Years | 43 (19.7%) | 30 (8.2%) |
| 75 Years and over | 30 (16.0%) | 91 (49.7%) |
Disability Class by Sex by Age in Glenarden
Disability Class: Hearing Difficulty
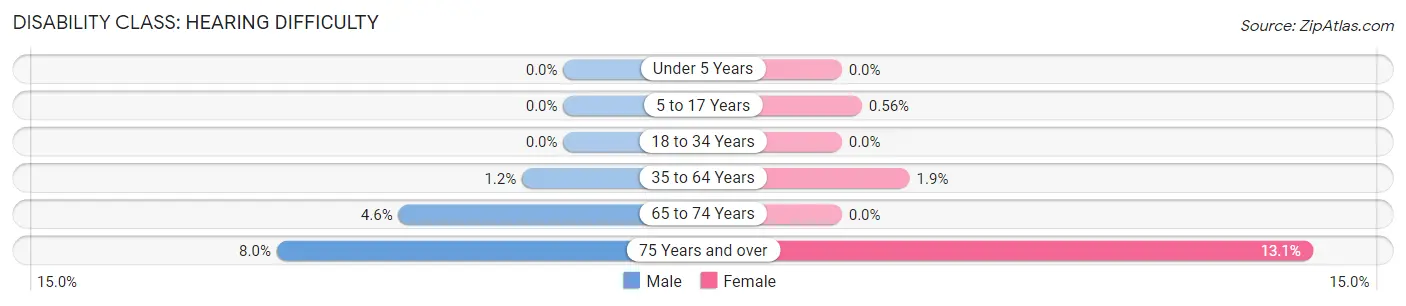
| Age Bracket | Male | Female |
| Under 5 Years | 0 (0.0%) | 0 (0.0%) |
| 5 to 17 Years | 0 (0.0%) | 3 (0.6%) |
| 18 to 34 Years | 0 (0.0%) | 0 (0.0%) |
| 35 to 64 Years | 14 (1.1%) | 28 (1.9%) |
| 65 to 74 Years | 10 (4.6%) | 0 (0.0%) |
| 75 Years and over | 15 (8.0%) | 24 (13.1%) |
Disability Class: Vision Difficulty
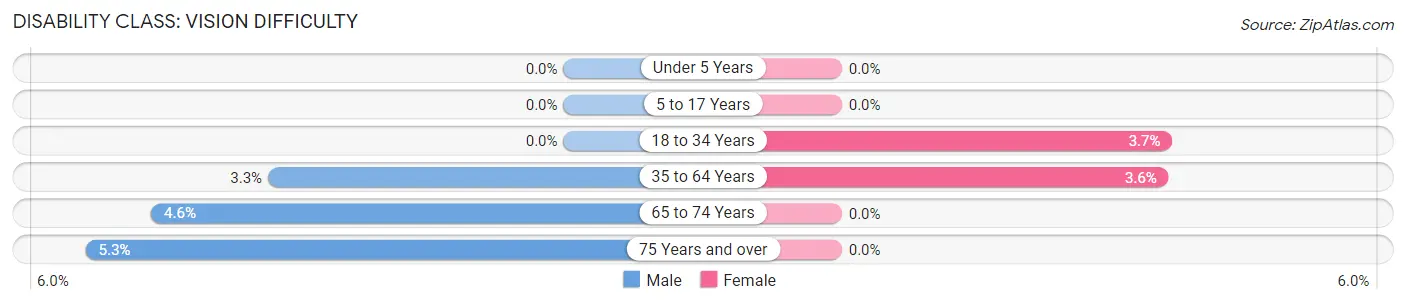
| Age Bracket | Male | Female |
| Under 5 Years | 0 (0.0%) | 0 (0.0%) |
| 5 to 17 Years | 0 (0.0%) | 0 (0.0%) |
| 18 to 34 Years | 0 (0.0%) | 16 (3.7%) |
| 35 to 64 Years | 40 (3.3%) | 54 (3.6%) |
| 65 to 74 Years | 10 (4.6%) | 0 (0.0%) |
| 75 Years and over | 10 (5.3%) | 0 (0.0%) |
Disability Class: Cognitive Difficulty
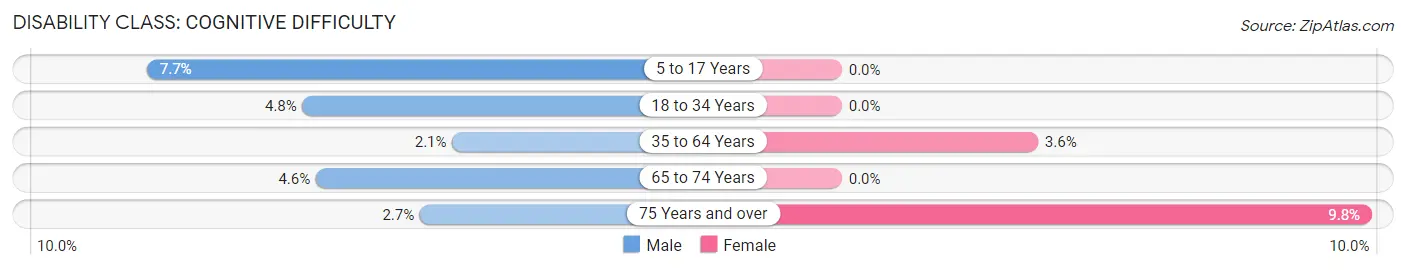
| Age Bracket | Male | Female |
| 5 to 17 Years | 61 (7.7%) | 0 (0.0%) |
| 18 to 34 Years | 28 (4.8%) | 0 (0.0%) |
| 35 to 64 Years | 25 (2.1%) | 54 (3.6%) |
| 65 to 74 Years | 10 (4.6%) | 0 (0.0%) |
| 75 Years and over | 5 (2.7%) | 18 (9.8%) |
Disability Class: Ambulatory Difficulty
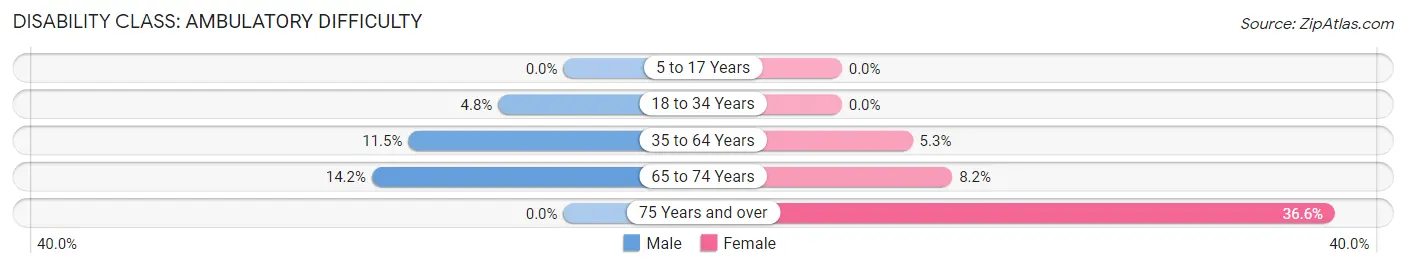
| Age Bracket | Male | Female |
| 5 to 17 Years | 0 (0.0%) | 0 (0.0%) |
| 18 to 34 Years | 28 (4.8%) | 0 (0.0%) |
| 35 to 64 Years | 140 (11.5%) | 78 (5.3%) |
| 65 to 74 Years | 31 (14.2%) | 30 (8.2%) |
| 75 Years and over | 0 (0.0%) | 67 (36.6%) |
Disability Class: Self-Care Difficulty
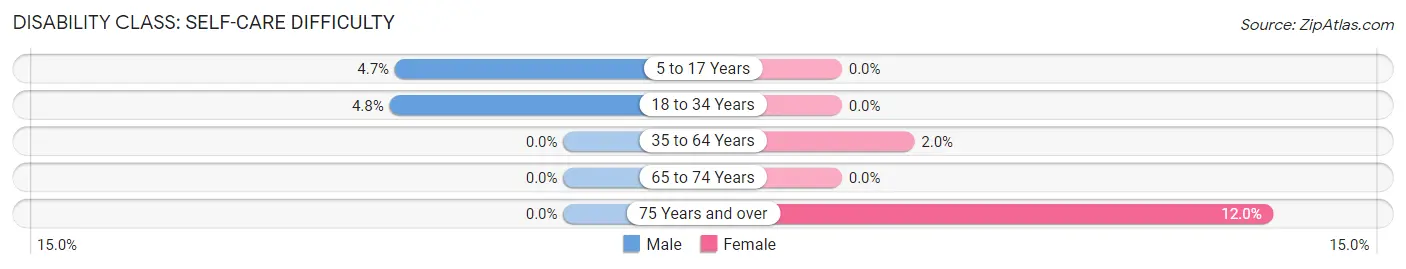
| Age Bracket | Male | Female |
| 5 to 17 Years | 37 (4.7%) | 0 (0.0%) |
| 18 to 34 Years | 28 (4.8%) | 0 (0.0%) |
| 35 to 64 Years | 0 (0.0%) | 30 (2.0%) |
| 65 to 74 Years | 0 (0.0%) | 0 (0.0%) |
| 75 Years and over | 0 (0.0%) | 22 (12.0%) |
Technology Access in Glenarden
Computing Device Access in Glenarden
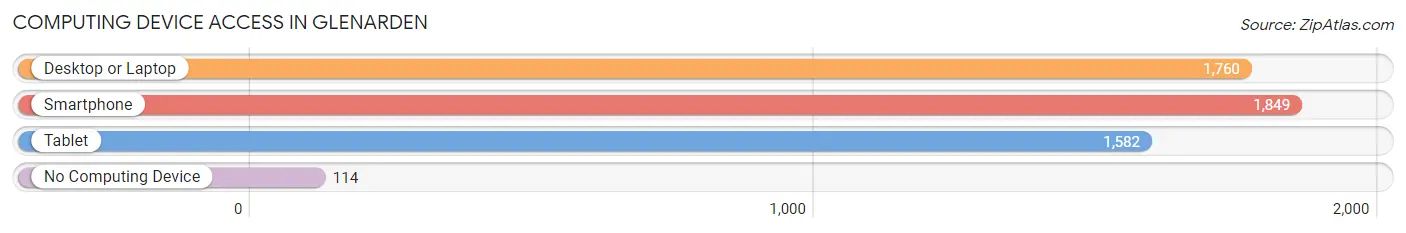
| Device Type | # Households | % Households |
| Desktop or Laptop | 1,760 | 81.5% |
| Smartphone | 1,849 | 85.6% |
| Tablet | 1,582 | 73.2% |
| No Computing Device | 114 | 5.3% |
| Total | 2,160 | 100.0% |
Internet Access in Glenarden
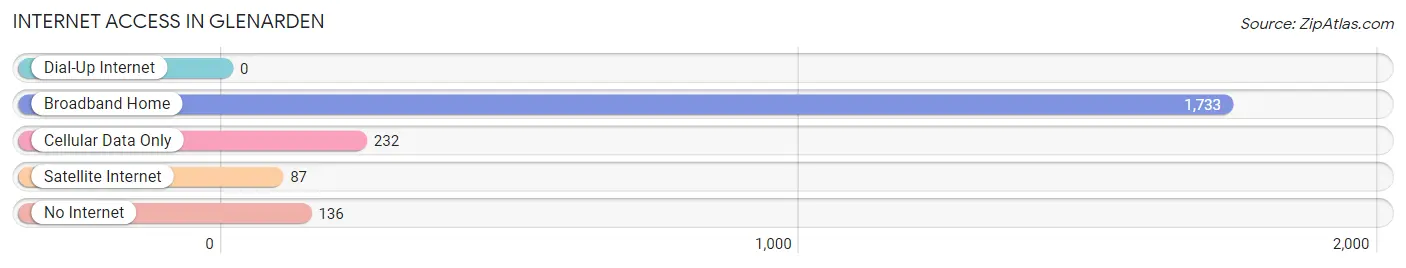
| Internet Type | # Households | % Households |
| Dial-Up Internet | 0 | 0.0% |
| Broadband Home | 1,733 | 80.2% |
| Cellular Data Only | 232 | 10.7% |
| Satellite Internet | 87 | 4.0% |
| No Internet | 136 | 6.3% |
| Total | 2,160 | 100.0% |
Glenarden Summary
Glenarden, Maryland is a small town located in Prince George’s County, Maryland. It is situated just east of Washington, D.C. and is part of the Washington metropolitan area. The town has a population of 6,000 people and is home to a diverse population of African Americans, Hispanics, and Caucasians.
History
Glenarden was first settled in the late 1700s by a group of freed slaves. The town was originally known as “Glenarden’s Crossroads” and was a stop on the Underground Railroad. The town was officially incorporated in 1892 and was named after the Glenarden family, who owned a large amount of land in the area.
In the early 1900s, Glenarden was a rural farming community. The town was home to several small businesses, including a general store, a blacksmith, and a post office. The town also had a school, which was attended by both African American and white students.
In the 1950s, the town began to experience rapid growth due to the construction of the Capital Beltway and the development of the Washington metropolitan area. The town’s population increased from 1,000 in 1950 to 6,000 in 2000.
Geography
Glenarden is located in Prince George’s County, Maryland. The town is situated just east of Washington, D.C. and is part of the Washington metropolitan area. The town is bordered by the towns of Landover, New Carrollton, and Upper Marlboro.
The town is situated on a flat plain and is surrounded by forests and wetlands. The town is located near the Patuxent River and is home to several parks and recreational areas.
Economy
Glenarden’s economy is largely based on the service industry. The town is home to several small businesses, including restaurants, retail stores, and professional services. The town is also home to a number of government offices, including the Prince George’s County Police Department and the Prince George’s County Fire Department.
The town is also home to several large employers, including the University of Maryland Medical Center, the Prince George’s County Public Schools, and the Prince George’s County Government.
Demographics
As of the 2010 census, the population of Glenarden was 6,000 people. The town is home to a diverse population of African Americans, Hispanics, and Caucasians. The median household income in the town is $50,000 and the median home value is $200,000.
The town is served by the Prince George’s County Public Schools system. The town is also home to several churches, including the First Baptist Church of Glenarden and the Church of the Redeemer.
Conclusion
Glenarden, Maryland is a small town located in Prince George’s County, Maryland. The town has a population of 6,000 people and is home to a diverse population of African Americans, Hispanics, and Caucasians. The town’s economy is largely based on the service industry and the town is home to several large employers. The town is served by the Prince George’s County Public Schools system and is home to several churches.
Common Questions
What is Per Capita Income in Glenarden?
Per Capita income in Glenarden is $43,252.
What is the Median Family Income in Glenarden?
Median Family Income in Glenarden is $110,058.
What is the Median Household income in Glenarden?
Median Household Income in Glenarden is $100,179.
What is Income or Wage Gap in Glenarden?
Income or Wage Gap in Glenarden is 11.0%.
Women in Glenarden earn 89.0 cents for every dollar earned by a man.
What is Inequality or Gini Index in Glenarden?
Inequality or Gini Index in Glenarden is 0.37.
What is the Total Population of Glenarden?
Total Population of Glenarden is 6,335.
What is the Total Male Population of Glenarden?
Total Male Population of Glenarden is 3,197.
What is the Total Female Population of Glenarden?
Total Female Population of Glenarden is 3,138.
What is the Ratio of Males per 100 Females in Glenarden?
There are 101.88 Males per 100 Females in Glenarden.
What is the Ratio of Females per 100 Males in Glenarden?
There are 98.15 Females per 100 Males in Glenarden.
What is the Median Population Age in Glenarden?
Median Population Age in Glenarden is 39.6 Years.
What is the Average Family Size in Glenarden
Average Family Size in Glenarden is 3.5 People.
What is the Average Household Size in Glenarden
Average Household Size in Glenarden is 2.9 People.
How Large is the Labor Force in Glenarden?
There are 3,339 People in the Labor Forcein in Glenarden.
What is the Percentage of People in the Labor Force in Glenarden?
67.6% of People are in the Labor Force in Glenarden.
What is the Unemployment Rate in Glenarden?
Unemployment Rate in Glenarden is 4.2%.