Marlton, MD Map & Demographics
Marlton Map
Marlton Overview
$55,918
PER CAPITA INCOME
$141,842
AVG FAMILY INCOME
$118,087
AVG HOUSEHOLD INCOME
28.8%
WAGE / INCOME GAP [ % ]
71.2¢/ $1
WAGE / INCOME GAP [ $ ]
0.38
INEQUALITY / GINI INDEX
10,168
TOTAL POPULATION
4,596
MALE POPULATION
5,572
FEMALE POPULATION
82.48
MALES / 100 FEMALES
121.24
FEMALES / 100 MALES
43.1
MEDIAN AGE
3.3
AVG FAMILY SIZE
2.7
AVG HOUSEHOLD SIZE
6,207
LABOR FORCE [ PEOPLE ]
74.1%
PERCENT IN LABOR FORCE
4.2%
UNEMPLOYMENT RATE
Income in Marlton
Income Overview in Marlton
Per Capita Income in Marlton is $55,918, while median incomes of families and households are $141,842 and $118,087 respectively.
| Characteristic | Number | Measure |
| Per Capita Income | 10,168 | $55,918 |
| Median Family Income | 2,610 | $141,842 |
| Mean Family Income | 2,610 | $160,459 |
| Median Household Income | 3,789 | $118,087 |
| Mean Household Income | 3,789 | $145,890 |
| Income Deficit | 2,610 | $0 |
| Wage / Income Gap (%) | 10,168 | 28.80% |
| Wage / Income Gap ($) | 10,168 | 71.20¢ per $1 |
| Gini / Inequality Index | 10,168 | 0.38 |
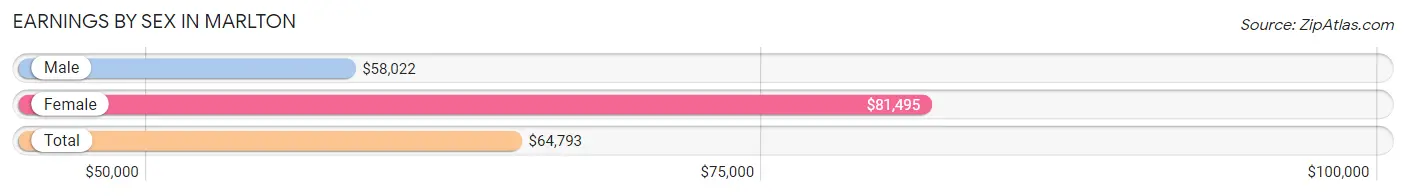
Earnings by Sex in Marlton
Average Earnings in Marlton are $64,793, $58,022 for men and $81,495 for women, a difference of 28.8%.
| Sex | Number | Average Earnings |
| Male | 2,929 (47.0%) | $58,022 |
| Female | 3,298 (53.0%) | $81,495 |
| Total | 6,227 (100.0%) | $64,793 |
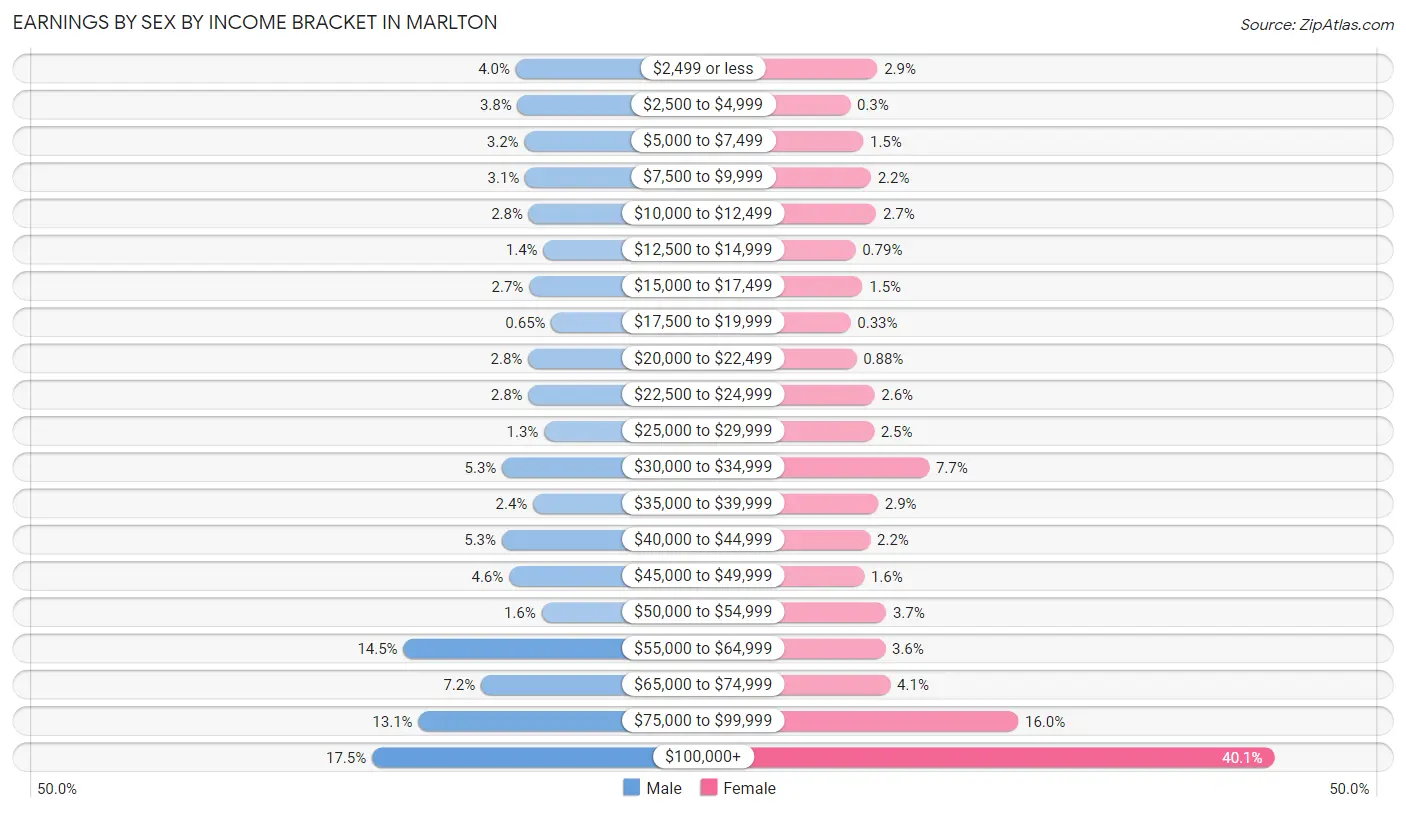
Earnings by Sex by Income Bracket in Marlton
The most common earnings brackets in Marlton are $100,000+ for men (511 | 17.4%) and $100,000+ for women (1,321 | 40.1%).
| Income | Male | Female |
| $2,499 or less | 117 (4.0%) | 94 (2.9%) |
| $2,500 to $4,999 | 112 (3.8%) | 10 (0.3%) |
| $5,000 to $7,499 | 93 (3.2%) | 50 (1.5%) |
| $7,500 to $9,999 | 91 (3.1%) | 74 (2.2%) |
| $10,000 to $12,499 | 81 (2.8%) | 90 (2.7%) |
| $12,500 to $14,999 | 41 (1.4%) | 26 (0.8%) |
| $15,000 to $17,499 | 80 (2.7%) | 48 (1.5%) |
| $17,500 to $19,999 | 19 (0.6%) | 11 (0.3%) |
| $20,000 to $22,499 | 83 (2.8%) | 29 (0.9%) |
| $22,500 to $24,999 | 82 (2.8%) | 85 (2.6%) |
| $25,000 to $29,999 | 39 (1.3%) | 83 (2.5%) |
| $30,000 to $34,999 | 154 (5.3%) | 254 (7.7%) |
| $35,000 to $39,999 | 69 (2.4%) | 96 (2.9%) |
| $40,000 to $44,999 | 155 (5.3%) | 72 (2.2%) |
| $45,000 to $49,999 | 135 (4.6%) | 53 (1.6%) |
| $50,000 to $54,999 | 46 (1.6%) | 121 (3.7%) |
| $55,000 to $64,999 | 425 (14.5%) | 118 (3.6%) |
| $65,000 to $74,999 | 212 (7.2%) | 134 (4.1%) |
| $75,000 to $99,999 | 384 (13.1%) | 529 (16.0%) |
| $100,000+ | 511 (17.4%) | 1,321 (40.1%) |
| Total | 2,929 (100.0%) | 3,298 (100.0%) |
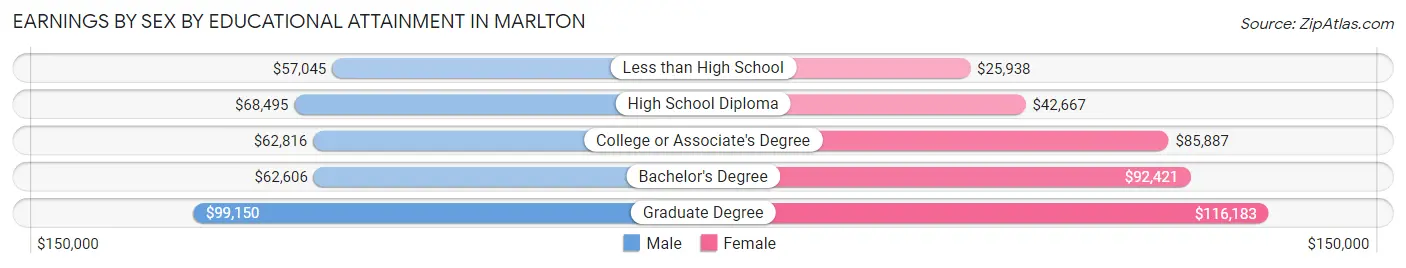
Earnings by Sex by Educational Attainment in Marlton
Average earnings in Marlton are $63,760 for men and $86,563 for women, a difference of 26.3%. Men with an educational attainment of graduate degree enjoy the highest average annual earnings of $99,150, while those with less than high school education earn the least with $57,045. Women with an educational attainment of graduate degree earn the most with the average annual earnings of $116,183, while those with less than high school education have the smallest earnings of $25,938.
| Educational Attainment | Male Income | Female Income |
| Less than High School | $57,045 | $25,938 |
| High School Diploma | $68,495 | $42,667 |
| College or Associate's Degree | $62,816 | $85,887 |
| Bachelor's Degree | $62,606 | $92,421 |
| Graduate Degree | $99,150 | $116,183 |
| Total | $63,760 | $86,563 |
Family Income in Marlton
Family Income Brackets in Marlton
According to the Marlton family income data, there are 812 families falling into the $100,000 to $149,999 income range, which is the most common income bracket and makes up 31.1% of all families.
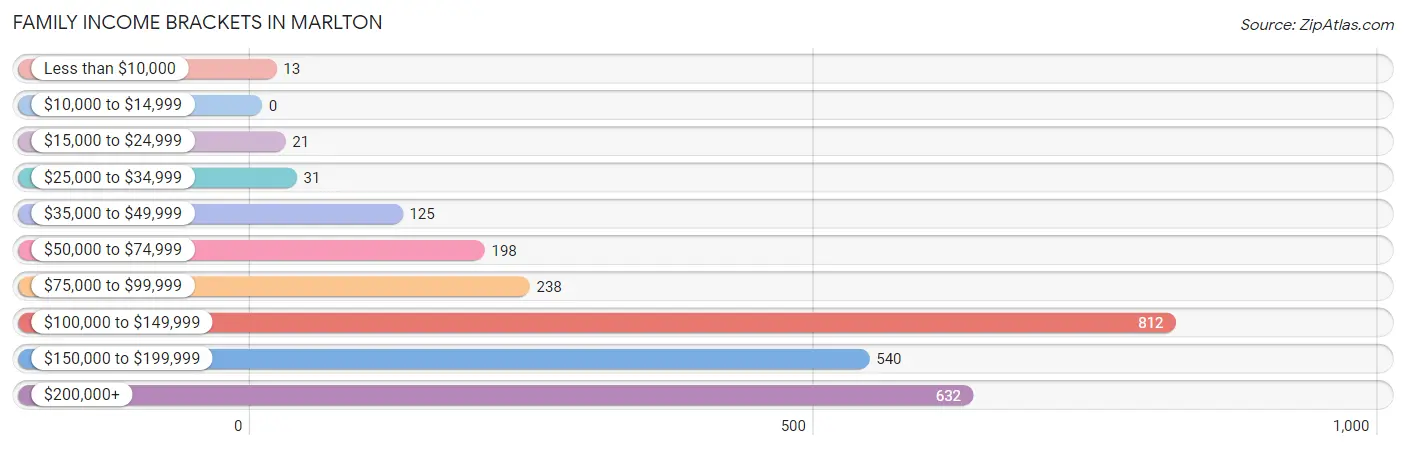
| Income Bracket | # Families | % Families |
| Less than $10,000 | 13 | 0.5% |
| $10,000 to $14,999 | 0 | 0.0% |
| $15,000 to $24,999 | 21 | 0.8% |
| $25,000 to $34,999 | 31 | 1.2% |
| $35,000 to $49,999 | 125 | 4.8% |
| $50,000 to $74,999 | 198 | 7.6% |
| $75,000 to $99,999 | 238 | 9.1% |
| $100,000 to $149,999 | 812 | 31.1% |
| $150,000 to $199,999 | 540 | 20.7% |
| $200,000+ | 632 | 24.2% |
Family Income by Famaliy Size in Marlton
7+ person families (107 | 4.1%) account for the highest median family income in Marlton with $250,001 per family, while 2-person families (1,128 | 43.2%) have the highest median income of $61,875 per family member.
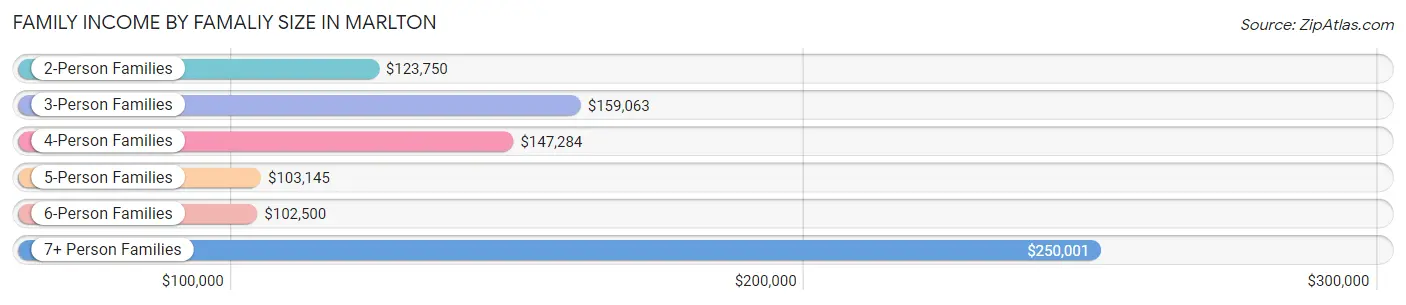
| Income Bracket | # Families | Median Income |
| 2-Person Families | 1,128 (43.2%) | $123,750 |
| 3-Person Families | 726 (27.8%) | $159,063 |
| 4-Person Families | 329 (12.6%) | $147,284 |
| 5-Person Families | 230 (8.8%) | $103,145 |
| 6-Person Families | 90 (3.5%) | $102,500 |
| 7+ Person Families | 107 (4.1%) | $250,001 |
| Total | 2,610 (100.0%) | $141,842 |
Family Income by Number of Earners in Marlton
The median family income in Marlton is $141,842, with families comprising 3+ earners (487) having the highest median family income of $162,721, while families with no earners (154) have the lowest median family income of $100,750, accounting for 18.7% and 5.9% of families, respectively.
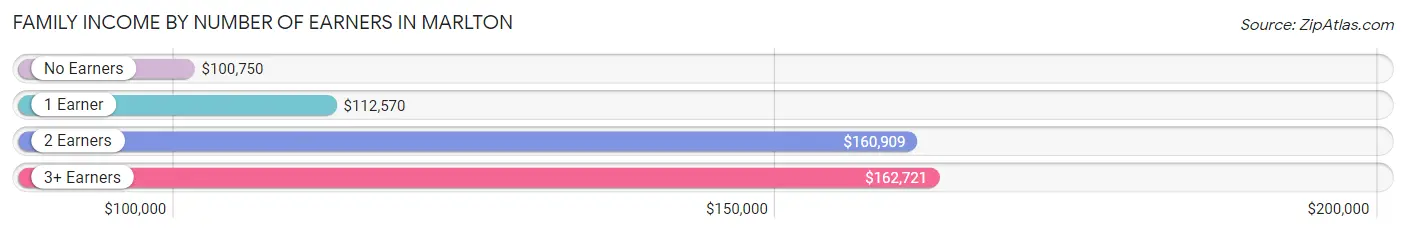
| Number of Earners | # Families | Median Income |
| No Earners | 154 (5.9%) | $100,750 |
| 1 Earner | 687 (26.3%) | $112,570 |
| 2 Earners | 1,282 (49.1%) | $160,909 |
| 3+ Earners | 487 (18.7%) | $162,721 |
| Total | 2,610 (100.0%) | $141,842 |
Household Income in Marlton
Household Income Brackets in Marlton
With 1,034 households falling in the category, the $100,000 to $149,999 income range is the most frequent in Marlton, accounting for 27.3% of all households. In contrast, only 42 households (1.1%) fall into the $15,000 to $24,999 income bracket, making it the least populous group.
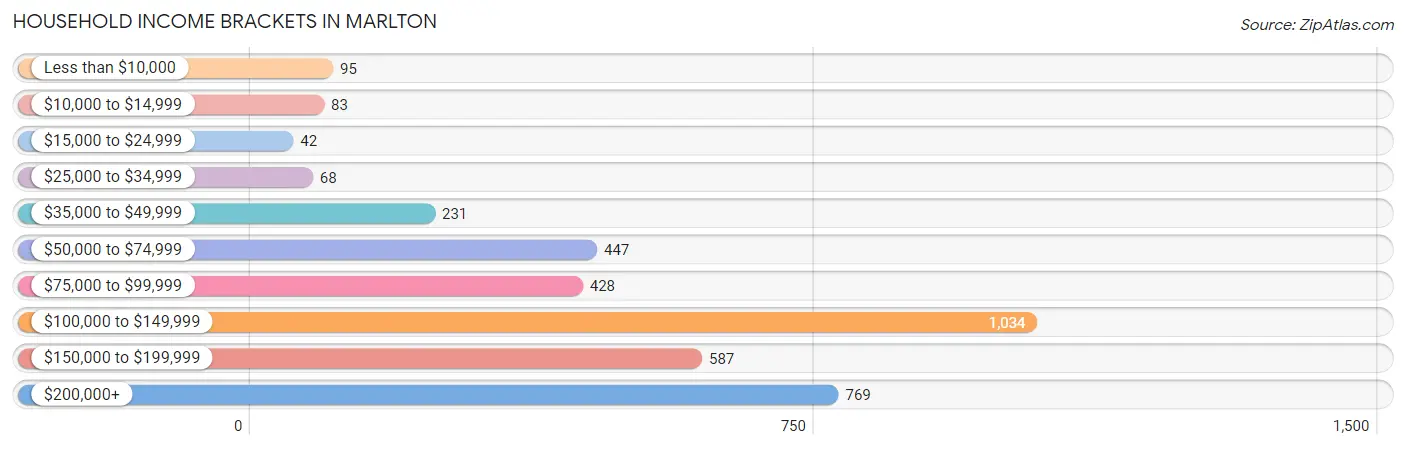
| Income Bracket | # Households | % Households |
| Less than $10,000 | 95 | 2.5% |
| $10,000 to $14,999 | 83 | 2.2% |
| $15,000 to $24,999 | 42 | 1.1% |
| $25,000 to $34,999 | 68 | 1.8% |
| $35,000 to $49,999 | 231 | 6.1% |
| $50,000 to $74,999 | 447 | 11.8% |
| $75,000 to $99,999 | 428 | 11.3% |
| $100,000 to $149,999 | 1,034 | 27.3% |
| $150,000 to $199,999 | 587 | 15.5% |
| $200,000+ | 769 | 20.3% |
Household Income by Householder Age in Marlton
The median household income in Marlton is $118,087, with the highest median household income of $139,821 found in the 45 to 64 years age bracket for the primary householder. A total of 2,136 households (56.4%) fall into this category. Meanwhile, the 15 to 24 years age bracket for the primary householder has the lowest median household income of $0, with 13 households (0.3%) in this group.
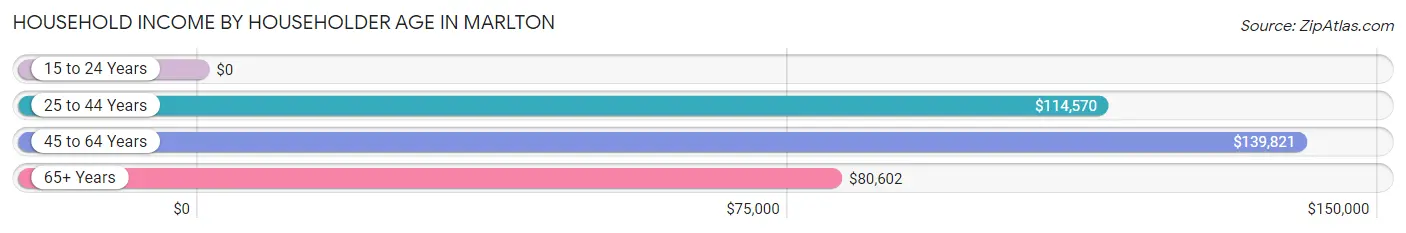
| Income Bracket | # Households | Median Income |
| 15 to 24 Years | 13 (0.3%) | $0 |
| 25 to 44 Years | 892 (23.5%) | $114,570 |
| 45 to 64 Years | 2,136 (56.4%) | $139,821 |
| 65+ Years | 748 (19.7%) | $80,602 |
| Total | 3,789 (100.0%) | $118,087 |
Poverty in Marlton
Income Below Poverty by Sex and Age in Marlton
With 4.0% poverty level for males and 3.2% for females among the residents of Marlton, 15 year old males and 75 year old and over females are the most vulnerable to poverty, with 13 males (41.9%) and 48 females (14.2%) in their respective age groups living below the poverty level.
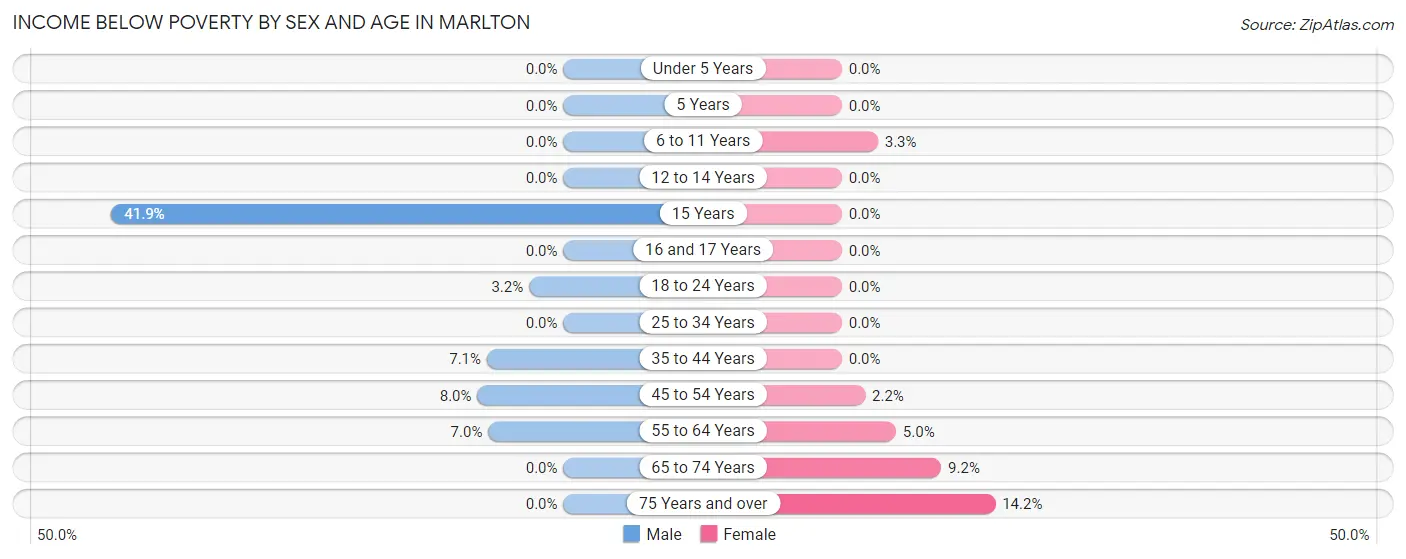
| Age Bracket | Male | Female |
| Under 5 Years | 0 (0.0%) | 0 (0.0%) |
| 5 Years | 0 (0.0%) | 0 (0.0%) |
| 6 to 11 Years | 0 (0.0%) | 13 (3.3%) |
| 12 to 14 Years | 0 (0.0%) | 0 (0.0%) |
| 15 Years | 13 (41.9%) | 0 (0.0%) |
| 16 and 17 Years | 0 (0.0%) | 0 (0.0%) |
| 18 to 24 Years | 15 (3.2%) | 0 (0.0%) |
| 25 to 34 Years | 0 (0.0%) | 0 (0.0%) |
| 35 to 44 Years | 45 (7.1%) | 0 (0.0%) |
| 45 to 54 Years | 61 (8.0%) | 24 (2.2%) |
| 55 to 64 Years | 50 (7.0%) | 44 (5.0%) |
| 65 to 74 Years | 0 (0.0%) | 47 (9.2%) |
| 75 Years and over | 0 (0.0%) | 48 (14.2%) |
| Total | 184 (4.0%) | 176 (3.2%) |
Income Above Poverty by Sex and Age in Marlton
According to the poverty statistics in Marlton, males aged under 5 years and females aged under 5 years are the age groups that are most secure financially, with 100.0% of males and 100.0% of females in these age groups living above the poverty line.
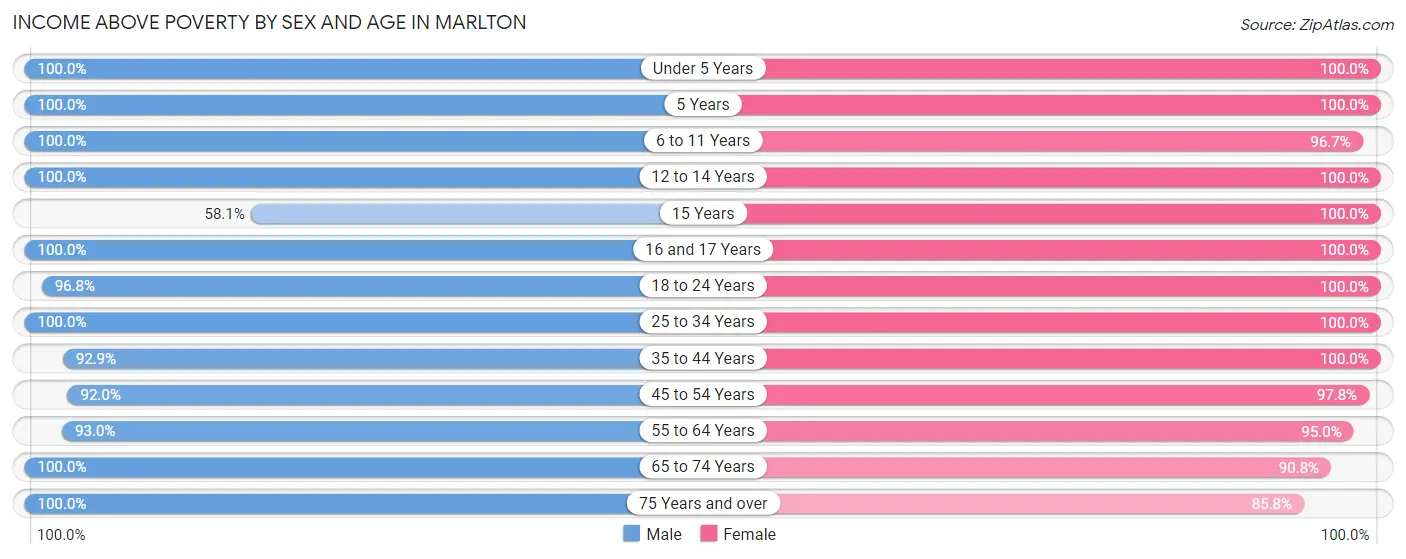
| Age Bracket | Male | Female |
| Under 5 Years | 311 (100.0%) | 197 (100.0%) |
| 5 Years | 51 (100.0%) | 37 (100.0%) |
| 6 to 11 Years | 228 (100.0%) | 376 (96.7%) |
| 12 to 14 Years | 127 (100.0%) | 332 (100.0%) |
| 15 Years | 18 (58.1%) | 76 (100.0%) |
| 16 and 17 Years | 221 (100.0%) | 168 (100.0%) |
| 18 to 24 Years | 456 (96.8%) | 312 (100.0%) |
| 25 to 34 Years | 516 (100.0%) | 630 (100.0%) |
| 35 to 44 Years | 589 (92.9%) | 593 (100.0%) |
| 45 to 54 Years | 703 (92.0%) | 1,087 (97.8%) |
| 55 to 64 Years | 667 (93.0%) | 832 (95.0%) |
| 65 to 74 Years | 309 (100.0%) | 463 (90.8%) |
| 75 Years and over | 203 (100.0%) | 289 (85.8%) |
| Total | 4,399 (96.0%) | 5,392 (96.8%) |
Income Below Poverty Among Married-Couple Families in Marlton
The poverty statistics for married-couple families in Marlton show that 0.8% or 13 of the total 1,664 families live below the poverty line. Families with 1 or 2 children have the highest poverty rate of 2.1%, comprising of 13 families. On the other hand, families with no children have the lowest poverty rate of 0.0%, which includes 0 families.
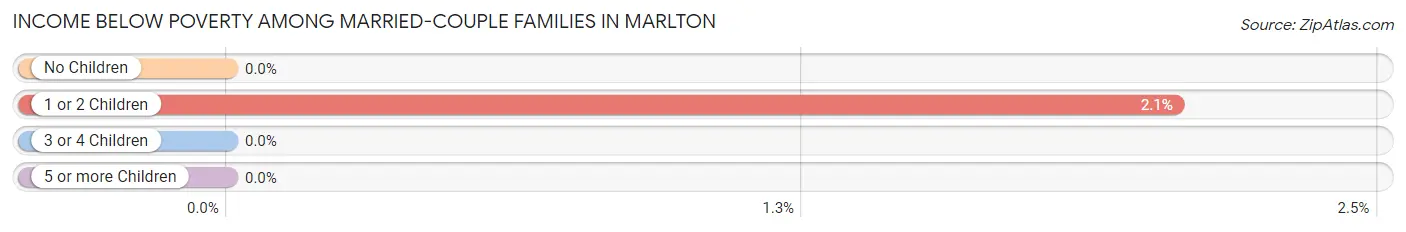
| Children | Above Poverty | Below Poverty |
| No Children | 868 (100.0%) | 0 (0.0%) |
| 1 or 2 Children | 617 (97.9%) | 13 (2.1%) |
| 3 or 4 Children | 146 (100.0%) | 0 (0.0%) |
| 5 or more Children | 20 (100.0%) | 0 (0.0%) |
| Total | 1,651 (99.2%) | 13 (0.8%) |
Income Below Poverty Among Single-Parent Households in Marlton
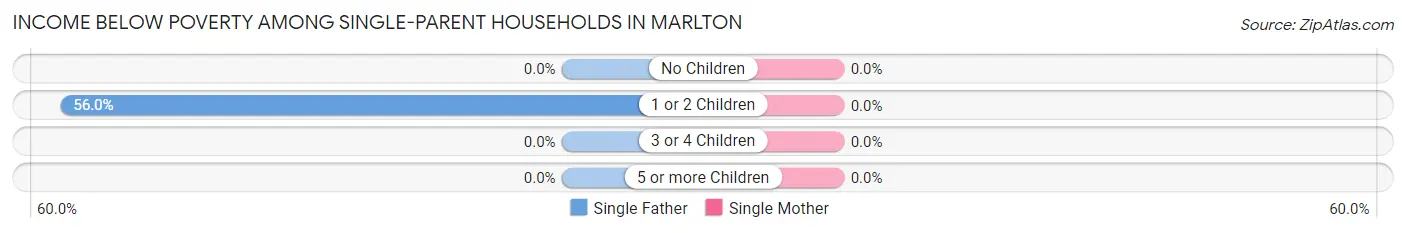
| Children | Single Father | Single Mother |
| No Children | 0 (0.0%) | 0 (0.0%) |
| 1 or 2 Children | 14 (56.0%) | 0 (0.0%) |
| 3 or 4 Children | 0 (0.0%) | 0 (0.0%) |
| 5 or more Children | 0 (0.0%) | 0 (0.0%) |
| Total | 14 (11.5%) | 0 (0.0%) |
Income Below Poverty Among Married-Couple vs Single-Parent Households in Marlton
The poverty data for Marlton shows that 13 of the married-couple family households (0.8%) and 14 of the single-parent households (1.5%) are living below the poverty level. Within the married-couple family households, those with 1 or 2 children have the highest poverty rate, with 13 households (2.1%) falling below the poverty line. Among the single-parent households, those with 1 or 2 children have the highest poverty rate, with 14 household (2.6%) living below poverty.
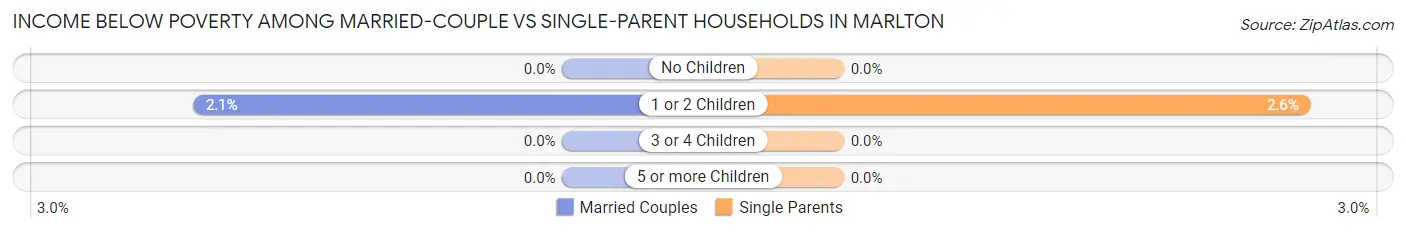
| Children | Married-Couple Families | Single-Parent Households |
| No Children | 0 (0.0%) | 0 (0.0%) |
| 1 or 2 Children | 13 (2.1%) | 14 (2.6%) |
| 3 or 4 Children | 0 (0.0%) | 0 (0.0%) |
| 5 or more Children | 0 (0.0%) | 0 (0.0%) |
| Total | 13 (0.8%) | 14 (1.5%) |
Race in Marlton
The most populous races in Marlton are Black / African American (8,400 | 82.6%), White / Caucasian (1,187 | 11.7%), and Two or more Races (438 | 4.3%).
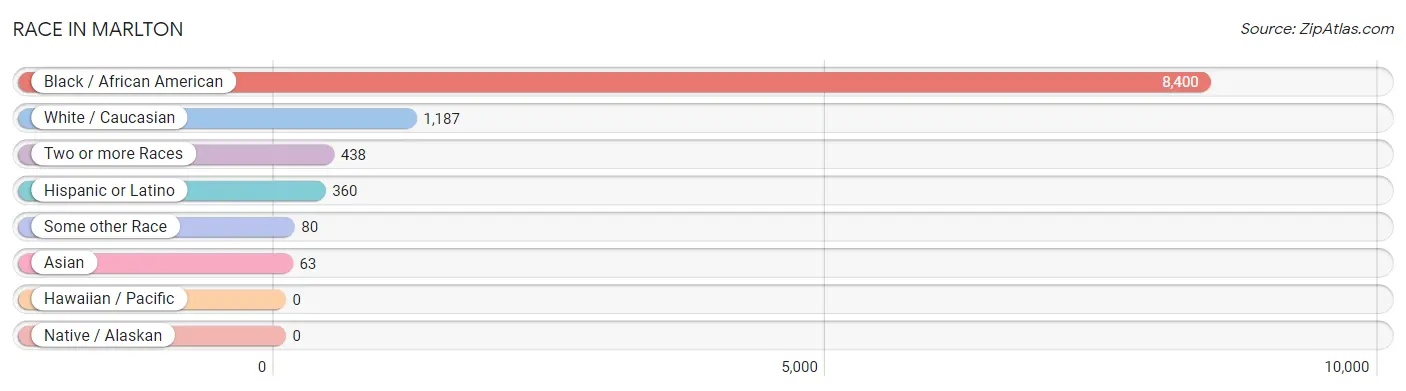
| Race | # Population | % Population |
| Asian | 63 | 0.6% |
| Black / African American | 8,400 | 82.6% |
| Hawaiian / Pacific | 0 | 0.0% |
| Hispanic or Latino | 360 | 3.5% |
| Native / Alaskan | 0 | 0.0% |
| White / Caucasian | 1,187 | 11.7% |
| Two or more Races | 438 | 4.3% |
| Some other Race | 80 | 0.8% |
| Total | 10,168 | 100.0% |
Ancestry in Marlton
The most populous ancestries reported in Marlton are Subsaharan African (486 | 4.8%), German (281 | 2.8%), Irish (276 | 2.7%), African (248 | 2.4%), and Puerto Rican (207 | 2.0%), together accounting for 14.7% of all Marlton residents.
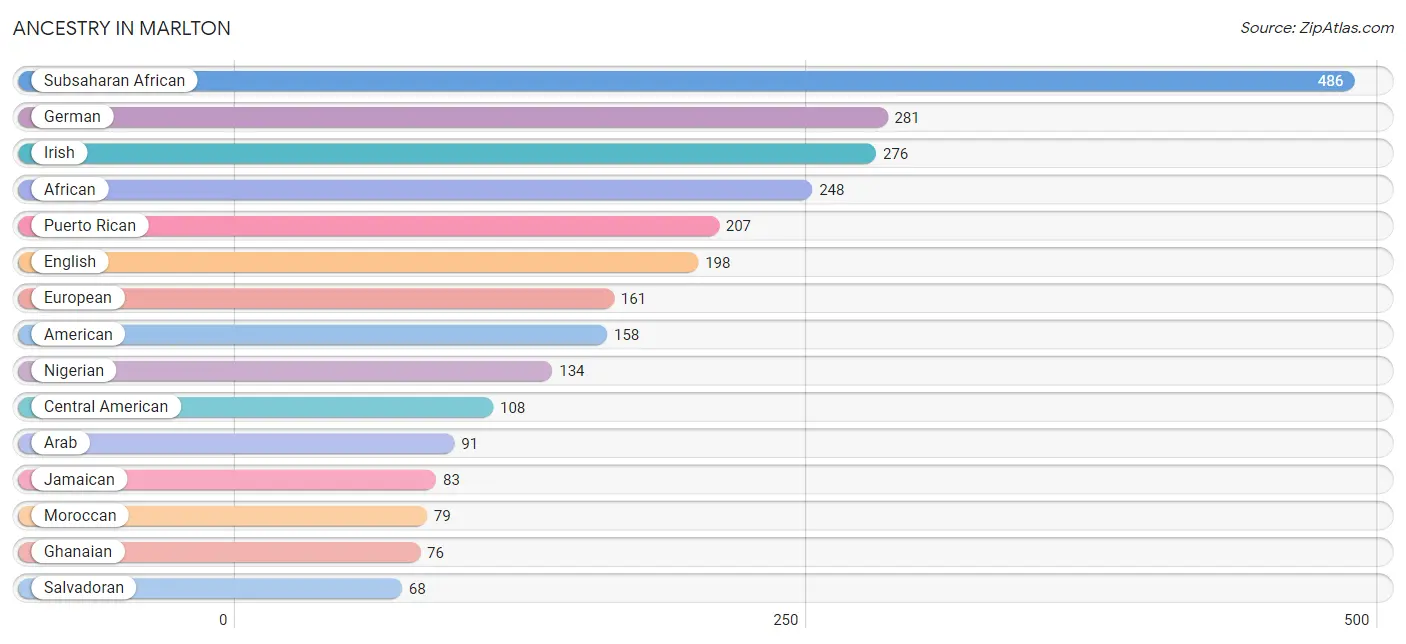
| Ancestry | # Population | % Population |
| African | 248 | 2.4% |
| American | 158 | 1.5% |
| Arab | 91 | 0.9% |
| Austrian | 9 | 0.1% |
| British West Indian | 11 | 0.1% |
| Central American | 108 | 1.1% |
| Cuban | 11 | 0.1% |
| Danish | 7 | 0.1% |
| Dominican | 1 | 0.0% |
| Dutch | 49 | 0.5% |
| English | 198 | 1.9% |
| European | 161 | 1.6% |
| Filipino | 2 | 0.0% |
| French | 15 | 0.2% |
| French Canadian | 5 | 0.1% |
| German | 281 | 2.8% |
| Ghanaian | 76 | 0.7% |
| Guyanese | 9 | 0.1% |
| Haitian | 34 | 0.3% |
| Iranian | 16 | 0.2% |
| Irish | 276 | 2.7% |
| Italian | 52 | 0.5% |
| Jamaican | 83 | 0.8% |
| Korean | 27 | 0.3% |
| Mexican | 33 | 0.3% |
| Moroccan | 79 | 0.8% |
| Nicaraguan | 28 | 0.3% |
| Nigerian | 134 | 1.3% |
| Panamanian | 12 | 0.1% |
| Polish | 46 | 0.4% |
| Puerto Rican | 207 | 2.0% |
| Russian | 8 | 0.1% |
| Salvadoran | 68 | 0.7% |
| Scottish | 62 | 0.6% |
| Sri Lankan | 45 | 0.4% |
| Subsaharan African | 486 | 4.8% |
| Swedish | 7 | 0.1% |
| Thai | 14 | 0.1% |
| Trinidadian and Tobagonian | 48 | 0.5% | View All 39 Rows |
Immigrants in Marlton
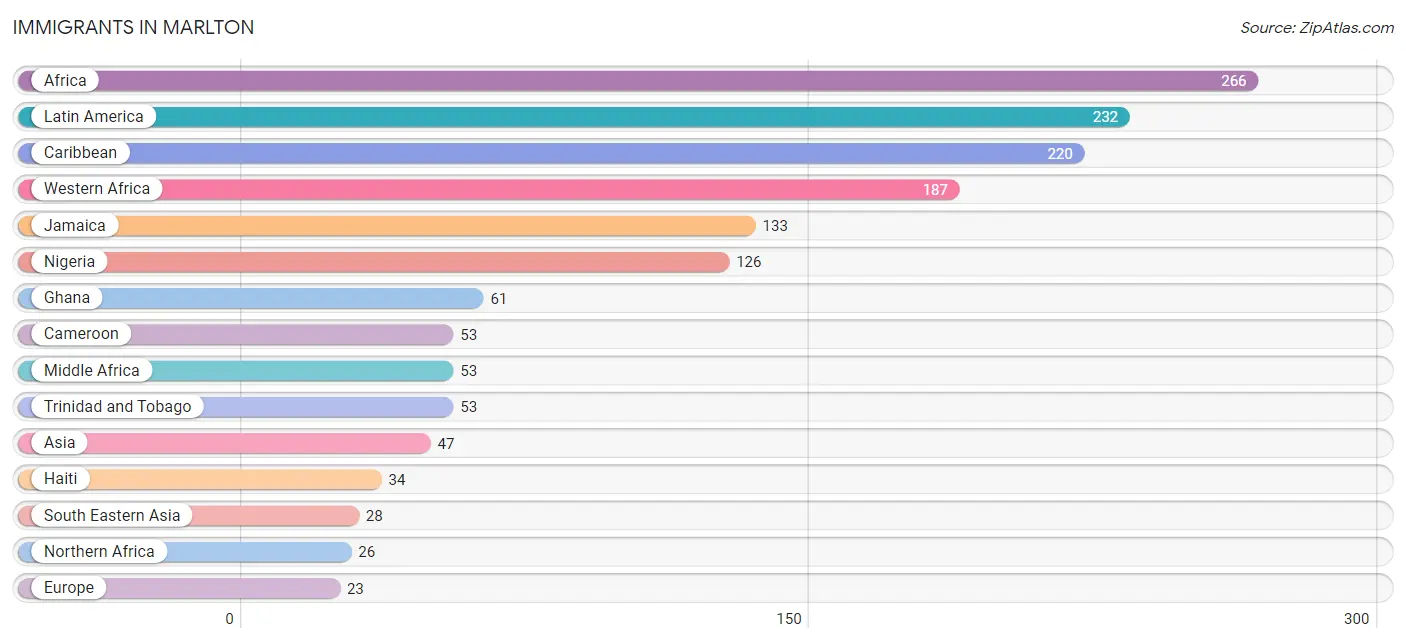
The most numerous immigrant groups reported in Marlton came from Africa (266 | 2.6%), Latin America (232 | 2.3%), Caribbean (220 | 2.2%), Western Africa (187 | 1.8%), and Jamaica (133 | 1.3%), together accounting for 10.2% of all Marlton residents.
| Immigration Origin | # Population | % Population |
| Africa | 266 | 2.6% |
| Asia | 47 | 0.5% |
| Austria | 9 | 0.1% |
| Cameroon | 53 | 0.5% |
| Canada | 12 | 0.1% |
| Caribbean | 220 | 2.2% |
| Central America | 12 | 0.1% |
| China | 2 | 0.0% |
| Eastern Asia | 2 | 0.0% |
| El Salvador | 12 | 0.1% |
| England | 5 | 0.1% |
| Europe | 23 | 0.2% |
| Germany | 9 | 0.1% |
| Ghana | 61 | 0.6% |
| Haiti | 34 | 0.3% |
| Iran | 9 | 0.1% |
| Jamaica | 133 | 1.3% |
| Latin America | 232 | 2.3% |
| Middle Africa | 53 | 0.5% |
| Morocco | 14 | 0.1% |
| Nigeria | 126 | 1.2% |
| Northern Africa | 26 | 0.3% |
| Northern Europe | 5 | 0.1% |
| Pakistan | 8 | 0.1% |
| Philippines | 19 | 0.2% |
| South Central Asia | 17 | 0.2% |
| South Eastern Asia | 28 | 0.3% |
| Taiwan | 2 | 0.0% |
| Trinidad and Tobago | 53 | 0.5% |
| Vietnam | 9 | 0.1% |
| Western Africa | 187 | 1.8% |
| Western Europe | 18 | 0.2% | View All 32 Rows |
Sex and Age in Marlton
Sex and Age in Marlton
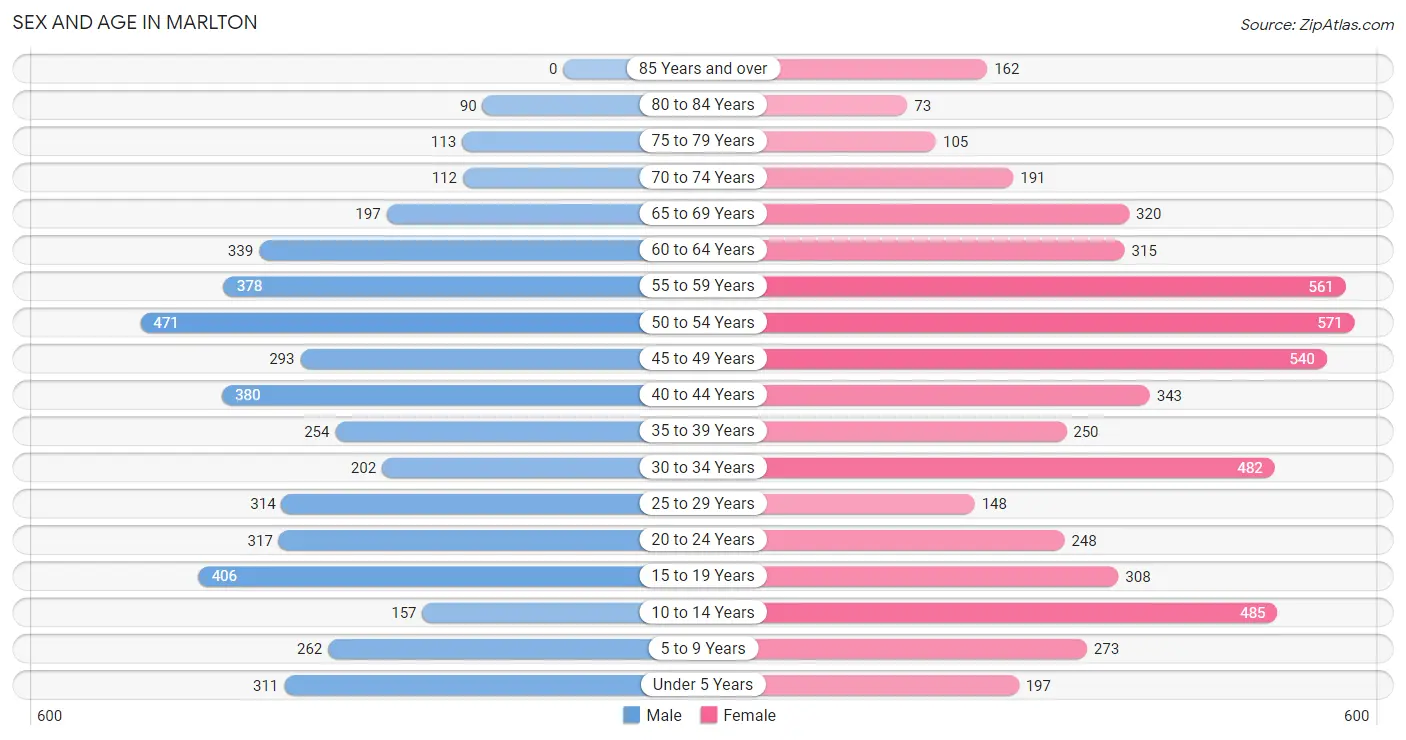
The most populous age groups in Marlton are 50 to 54 Years (471 | 10.2%) for men and 50 to 54 Years (571 | 10.2%) for women.
| Age Bracket | Male | Female |
| Under 5 Years | 311 (6.8%) | 197 (3.5%) |
| 5 to 9 Years | 262 (5.7%) | 273 (4.9%) |
| 10 to 14 Years | 157 (3.4%) | 485 (8.7%) |
| 15 to 19 Years | 406 (8.8%) | 308 (5.5%) |
| 20 to 24 Years | 317 (6.9%) | 248 (4.4%) |
| 25 to 29 Years | 314 (6.8%) | 148 (2.7%) |
| 30 to 34 Years | 202 (4.4%) | 482 (8.6%) |
| 35 to 39 Years | 254 (5.5%) | 250 (4.5%) |
| 40 to 44 Years | 380 (8.3%) | 343 (6.2%) |
| 45 to 49 Years | 293 (6.4%) | 540 (9.7%) |
| 50 to 54 Years | 471 (10.2%) | 571 (10.2%) |
| 55 to 59 Years | 378 (8.2%) | 561 (10.1%) |
| 60 to 64 Years | 339 (7.4%) | 315 (5.7%) |
| 65 to 69 Years | 197 (4.3%) | 320 (5.7%) |
| 70 to 74 Years | 112 (2.4%) | 191 (3.4%) |
| 75 to 79 Years | 113 (2.5%) | 105 (1.9%) |
| 80 to 84 Years | 90 (2.0%) | 73 (1.3%) |
| 85 Years and over | 0 (0.0%) | 162 (2.9%) |
| Total | 4,596 (100.0%) | 5,572 (100.0%) |
Families and Households in Marlton
Median Family Size in Marlton
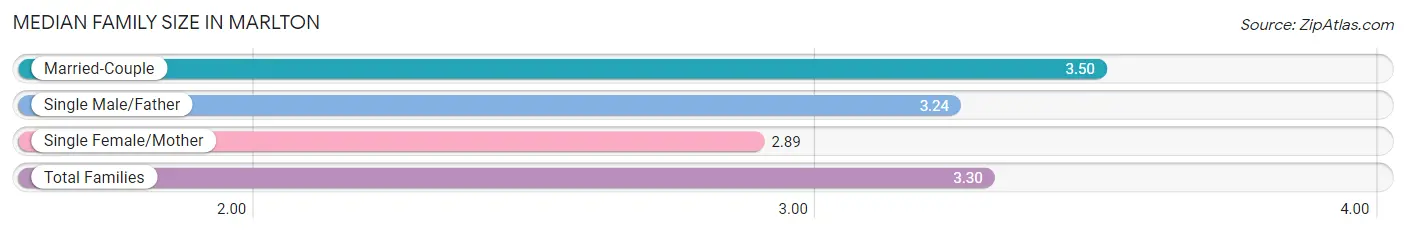
The median family size in Marlton is 3.30 persons per family, with married-couple families (1,664 | 63.7%) accounting for the largest median family size of 3.5 persons per family. On the other hand, single female/mother families (824 | 31.6%) represent the smallest median family size with 2.89 persons per family.
| Family Type | # Families | Family Size |
| Married-Couple | 1,664 (63.7%) | 3.50 |
| Single Male/Father | 122 (4.7%) | 3.24 |
| Single Female/Mother | 824 (31.6%) | 2.89 |
| Total Families | 2,610 (100.0%) | 3.30 |
Median Household Size in Marlton
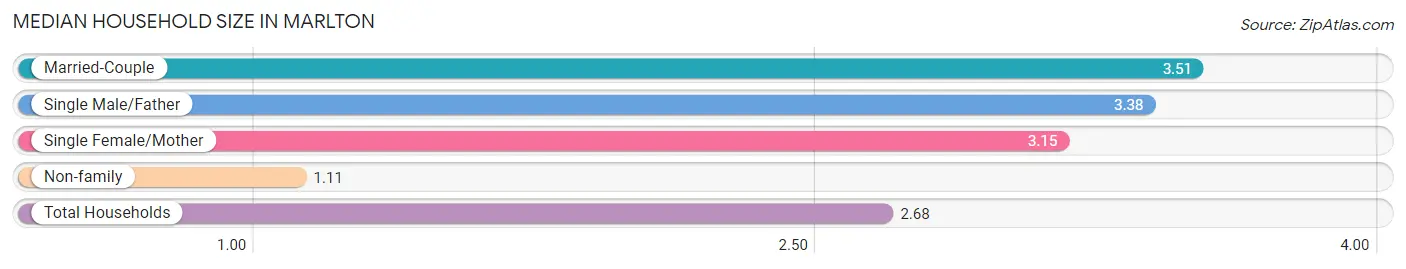
The median household size in Marlton is 2.68 persons per household, with married-couple households (1,664 | 43.9%) accounting for the largest median household size of 3.51 persons per household. non-family households (1,179 | 31.1%) represent the smallest median household size with 1.11 persons per household.
| Household Type | # Households | Household Size |
| Married-Couple | 1,664 (43.9%) | 3.51 |
| Single Male/Father | 122 (3.2%) | 3.38 |
| Single Female/Mother | 824 (21.7%) | 3.15 |
| Non-family | 1,179 (31.1%) | 1.11 |
| Total Households | 3,789 (100.0%) | 2.68 |
Household Size by Marriage Status in Marlton
Out of a total of 3,789 households in Marlton, 2,610 (68.9%) are family households, while 1,179 (31.1%) are nonfamily households. The most numerous type of family households are 2-person households, comprising 1,062, and the most common type of nonfamily households are 1-person households, comprising 1,063.
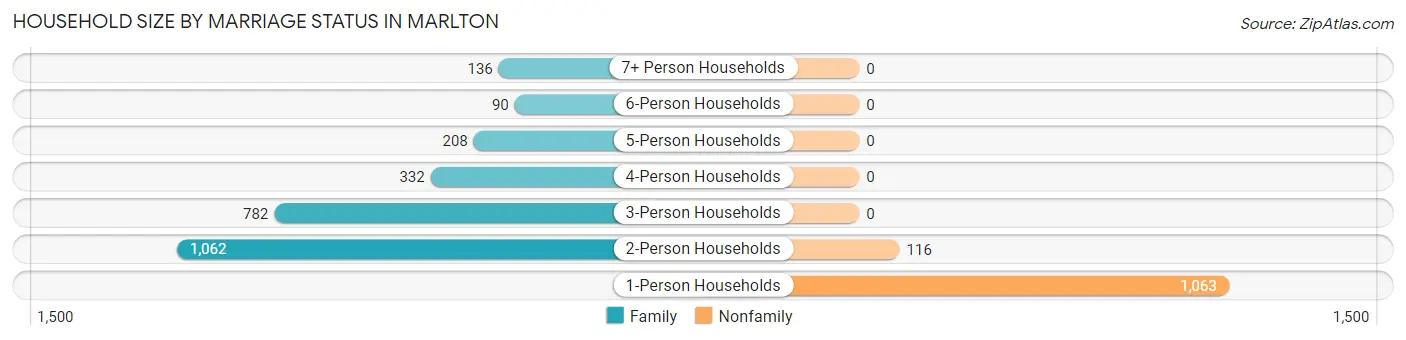
| Household Size | Family Households | Nonfamily Households |
| 1-Person Households | - | 1,063 (28.1%) |
| 2-Person Households | 1,062 (28.0%) | 116 (3.1%) |
| 3-Person Households | 782 (20.6%) | 0 (0.0%) |
| 4-Person Households | 332 (8.8%) | 0 (0.0%) |
| 5-Person Households | 208 (5.5%) | 0 (0.0%) |
| 6-Person Households | 90 (2.4%) | 0 (0.0%) |
| 7+ Person Households | 136 (3.6%) | 0 (0.0%) |
| Total | 2,610 (68.9%) | 1,179 (31.1%) |
Female Fertility in Marlton
Fertility by Age in Marlton
Average fertility rate in Marlton is 16.0 births per 1,000 women. Women in the age bracket of 35 to 50 years have the highest fertility rate with 21.0 births per 1,000 women. Women in the age bracket of 35 to 50 years acount for 66.7% of all women with births.
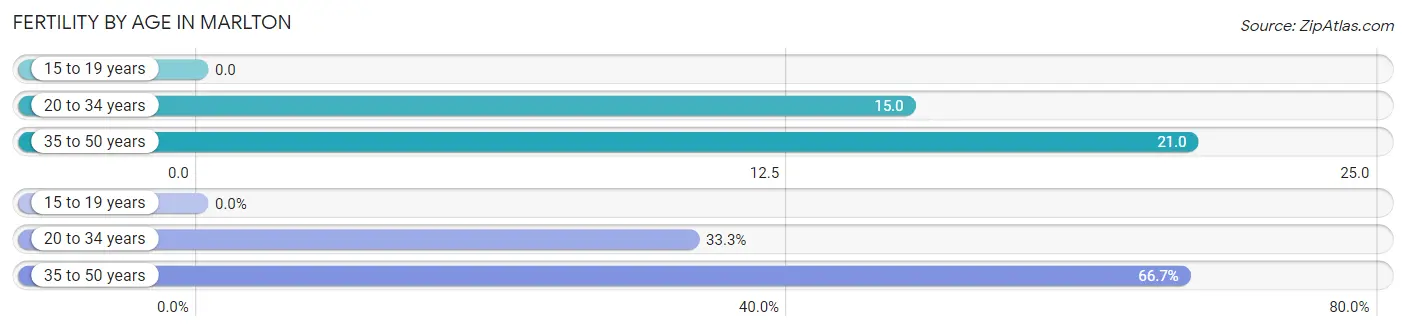
| Age Bracket | Women with Births | Births / 1,000 Women |
| 15 to 19 years | 0 (0.0%) | 0.0 |
| 20 to 34 years | 13 (33.3%) | 15.0 |
| 35 to 50 years | 26 (66.7%) | 21.0 |
| Total | 39 (100.0%) | 16.0 |
Fertility by Age by Marriage Status in Marlton
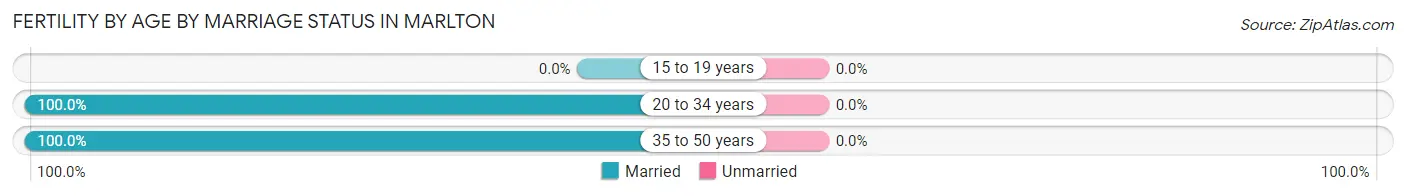
| Age Bracket | Married | Unmarried |
| 15 to 19 years | 0 (0.0%) | 0 (0.0%) |
| 20 to 34 years | 13 (100.0%) | 0 (0.0%) |
| 35 to 50 years | 26 (100.0%) | 0 (0.0%) |
| Total | 39 (100.0%) | 0 (0.0%) |
Fertility by Education in Marlton
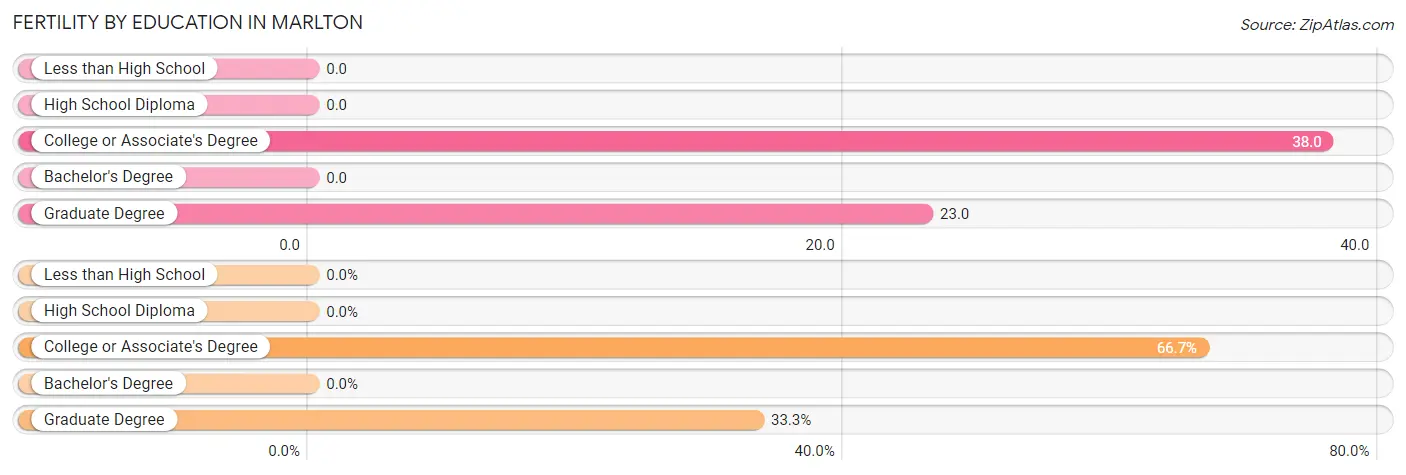
| Educational Attainment | Women with Births | Births / 1,000 Women |
| Less than High School | 0 (0.0%) | 0.0 |
| High School Diploma | 0 (0.0%) | 0.0 |
| College or Associate's Degree | 26 (66.7%) | 38.0 |
| Bachelor's Degree | 0 (0.0%) | 0.0 |
| Graduate Degree | 13 (33.3%) | 23.0 |
| Total | 39 (100.0%) | 16.0 |
Fertility by Education by Marriage Status in Marlton
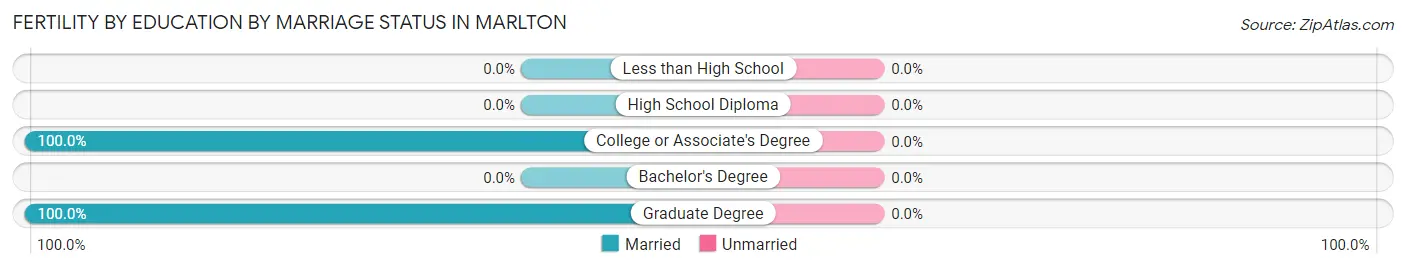
| Educational Attainment | Married | Unmarried |
| Less than High School | 0 (0.0%) | 0 (0.0%) |
| High School Diploma | 0 (0.0%) | 0 (0.0%) |
| College or Associate's Degree | 26 (100.0%) | 0 (0.0%) |
| Bachelor's Degree | 0 (0.0%) | 0 (0.0%) |
| Graduate Degree | 13 (100.0%) | 0 (0.0%) |
| Total | 39 (100.0%) | 0 (0.0%) |
Employment Characteristics in Marlton
Employment by Class of Employer in Marlton
Among the 5,858 employed individuals in Marlton, private company employees (2,822 | 48.2%), federal government employees (1,121 | 19.1%), and not-for-profit organizations (858 | 14.6%) make up the most common classes of employment.
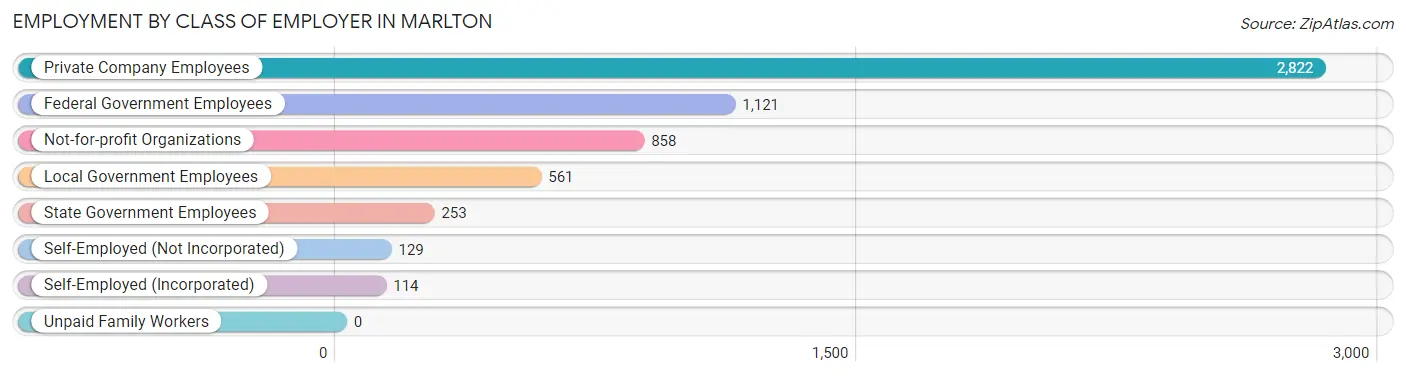
| Employer Class | # Employees | % Employees |
| Private Company Employees | 2,822 | 48.2% |
| Self-Employed (Incorporated) | 114 | 1.9% |
| Self-Employed (Not Incorporated) | 129 | 2.2% |
| Not-for-profit Organizations | 858 | 14.6% |
| Local Government Employees | 561 | 9.6% |
| State Government Employees | 253 | 4.3% |
| Federal Government Employees | 1,121 | 19.1% |
| Unpaid Family Workers | 0 | 0.0% |
| Total | 5,858 | 100.0% |
Employment Status by Age in Marlton
According to the labor force statistics for Marlton, out of the total population over 16 years of age (8,376), 74.1% or 6,207 individuals are in the labor force, with 4.2% or 261 of them unemployed. The age group with the highest labor force participation rate is 25 to 29 years, with 98.3% or 454 individuals in the labor force. Within the labor force, the 25 to 29 years age range has the highest percentage of unemployed individuals, with 23.3% or 106 of them being unemployed.
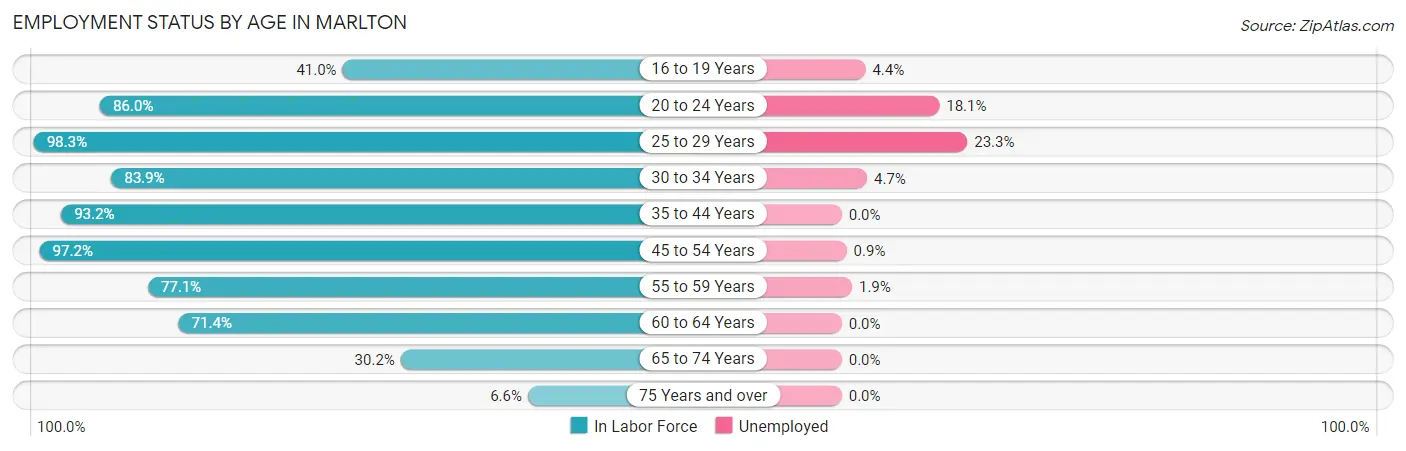
| Age Bracket | In Labor Force | Unemployed |
| 16 to 19 Years | 249 (41.0%) | 11 (4.4%) |
| 20 to 24 Years | 486 (86.0%) | 88 (18.1%) |
| 25 to 29 Years | 454 (98.3%) | 106 (23.3%) |
| 30 to 34 Years | 574 (83.9%) | 27 (4.7%) |
| 35 to 44 Years | 1,144 (93.2%) | 0 (0.0%) |
| 45 to 54 Years | 1,822 (97.2%) | 16 (0.9%) |
| 55 to 59 Years | 724 (77.1%) | 14 (1.9%) |
| 60 to 64 Years | 467 (71.4%) | 0 (0.0%) |
| 65 to 74 Years | 248 (30.2%) | 0 (0.0%) |
| 75 Years and over | 36 (6.6%) | 0 (0.0%) |
| Total | 6,207 (74.1%) | 261 (4.2%) |
Employment Status by Educational Attainment in Marlton
According to labor force statistics for Marlton, 88.8% of individuals (5,187) out of the total population between 25 and 64 years of age (5,841) are in the labor force, with 3.1% or 161 of them being unemployed. The group with the highest labor force participation rate are those with the educational attainment of bachelor's degree or higher, with 93.3% or 2,414 individuals in the labor force. Within the labor force, individuals with bachelor's degree or higher education have the highest percentage of unemployment, with 5.3% or 128 of them being unemployed.
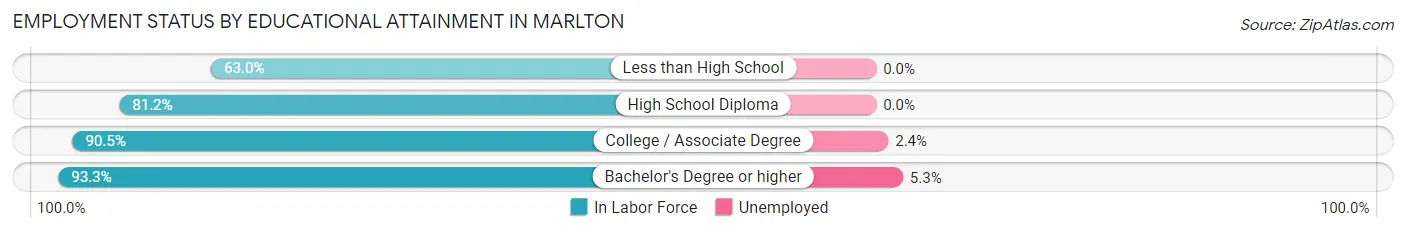
| Educational Attainment | In Labor Force | Unemployed |
| Less than High School | 85 (63.0%) | 0 (0.0%) |
| High School Diploma | 1,195 (81.2%) | 0 (0.0%) |
| College / Associate Degree | 1,491 (90.5%) | 40 (2.4%) |
| Bachelor's Degree or higher | 2,414 (93.3%) | 137 (5.3%) |
| Total | 5,187 (88.8%) | 181 (3.1%) |
Employment Occupations by Sex in Marlton
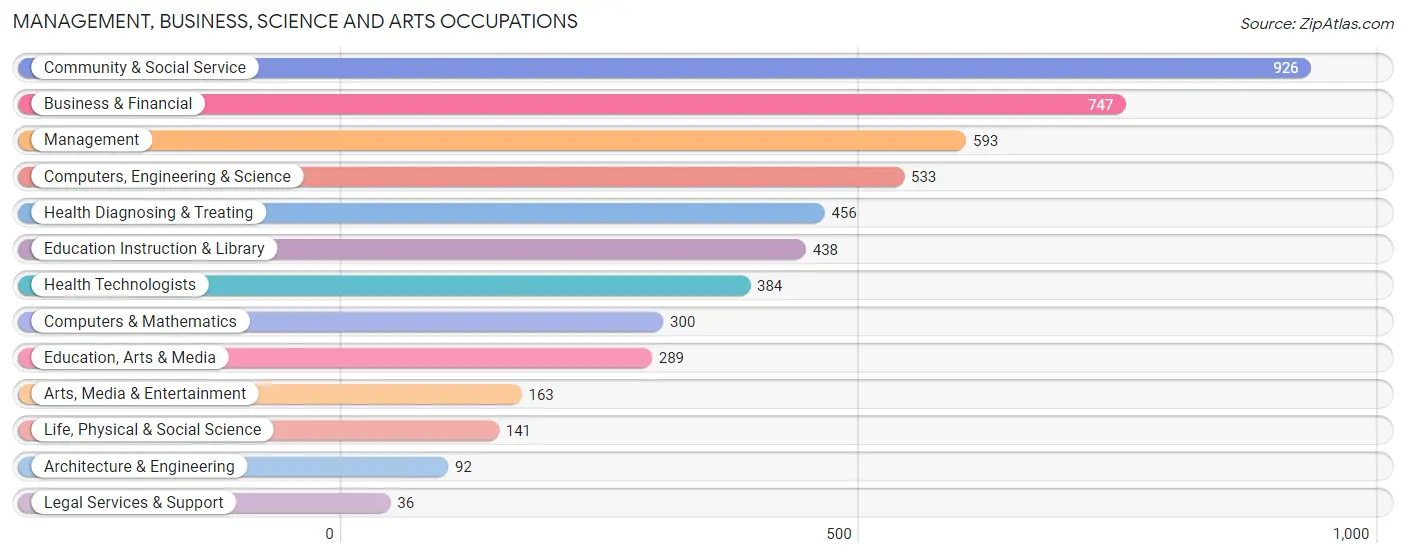
Management, Business, Science and Arts Occupations
The most common Management, Business, Science and Arts occupations in Marlton are Community & Social Service (926 | 15.6%), Business & Financial (747 | 12.6%), Management (593 | 10.0%), Computers, Engineering & Science (533 | 9.0%), and Health Diagnosing & Treating (456 | 7.7%).
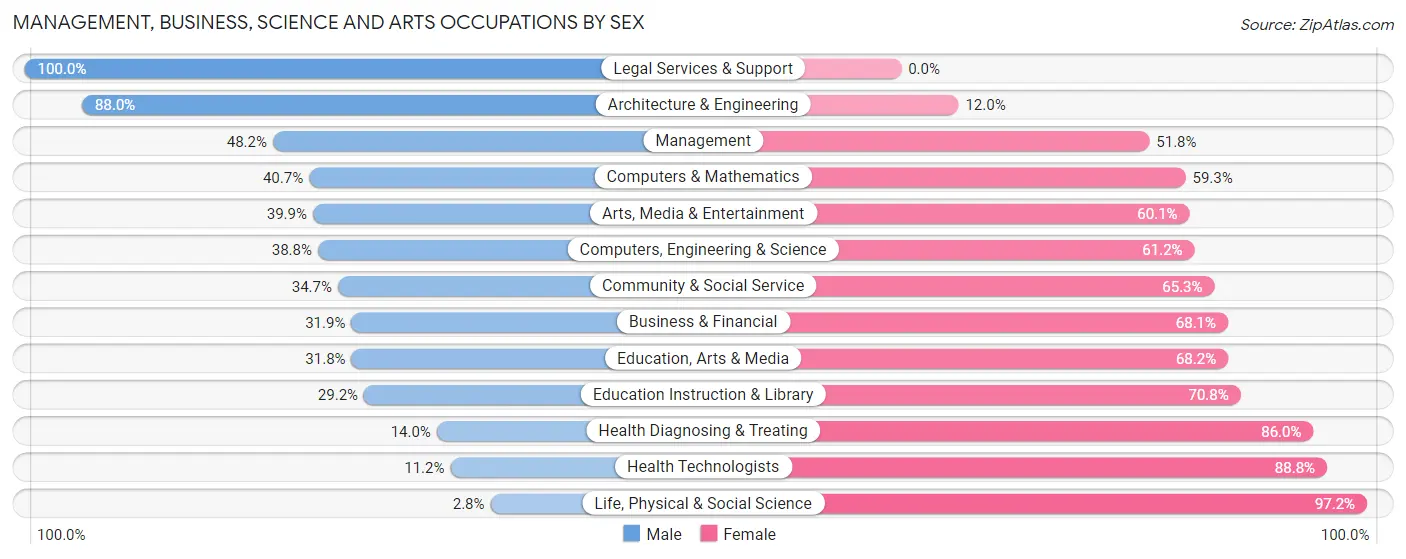
Management, Business, Science and Arts Occupations by Sex
Within the Management, Business, Science and Arts occupations in Marlton, the most male-oriented occupations are Legal Services & Support (100.0%), Architecture & Engineering (88.0%), and Management (48.2%), while the most female-oriented occupations are Life, Physical & Social Science (97.2%), Health Technologists (88.8%), and Health Diagnosing & Treating (86.0%).
| Occupation | Male | Female |
| Management | 286 (48.2%) | 307 (51.8%) |
| Business & Financial | 238 (31.9%) | 509 (68.1%) |
| Computers, Engineering & Science | 207 (38.8%) | 326 (61.2%) |
| Computers & Mathematics | 122 (40.7%) | 178 (59.3%) |
| Architecture & Engineering | 81 (88.0%) | 11 (12.0%) |
| Life, Physical & Social Science | 4 (2.8%) | 137 (97.2%) |
| Community & Social Service | 321 (34.7%) | 605 (65.3%) |
| Education, Arts & Media | 92 (31.8%) | 197 (68.2%) |
| Legal Services & Support | 36 (100.0%) | 0 (0.0%) |
| Education Instruction & Library | 128 (29.2%) | 310 (70.8%) |
| Arts, Media & Entertainment | 65 (39.9%) | 98 (60.1%) |
| Health Diagnosing & Treating | 64 (14.0%) | 392 (86.0%) |
| Health Technologists | 43 (11.2%) | 341 (88.8%) |
| Total (Category) | 1,116 (34.3%) | 2,139 (65.7%) |
| Total (Overall) | 2,727 (45.9%) | 3,209 (54.1%) |
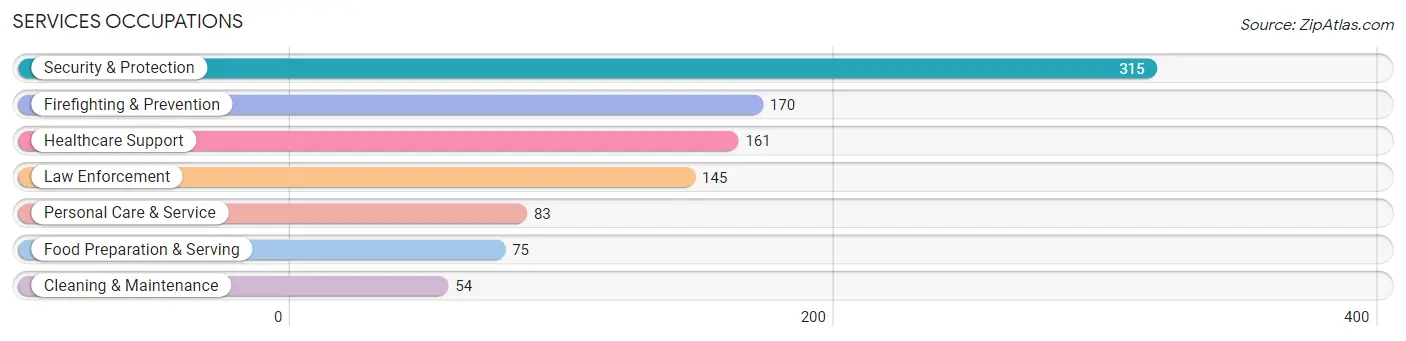
Services Occupations
The most common Services occupations in Marlton are Security & Protection (315 | 5.3%), Firefighting & Prevention (170 | 2.9%), Healthcare Support (161 | 2.7%), Law Enforcement (145 | 2.4%), and Personal Care & Service (83 | 1.4%).
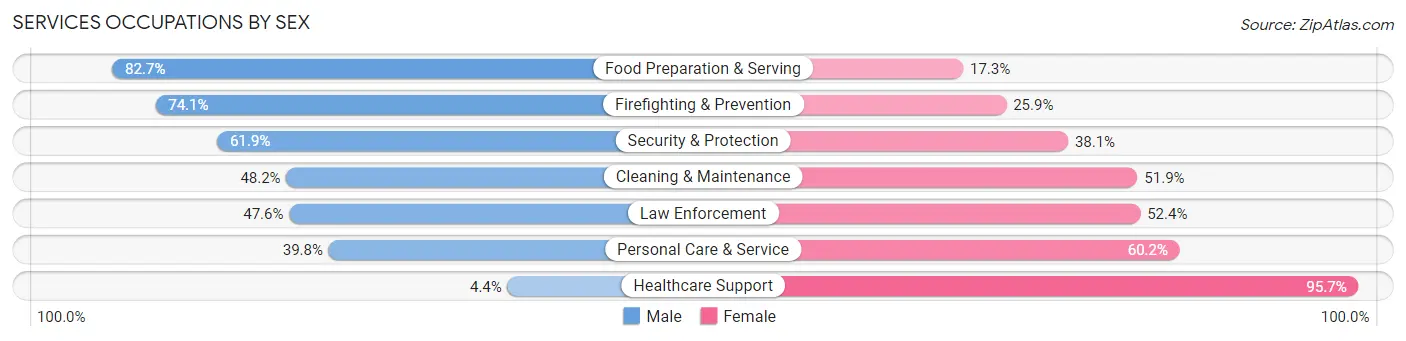
Services Occupations by Sex
Within the Services occupations in Marlton, the most male-oriented occupations are Food Preparation & Serving (82.7%), Firefighting & Prevention (74.1%), and Security & Protection (61.9%), while the most female-oriented occupations are Healthcare Support (95.7%), Personal Care & Service (60.2%), and Law Enforcement (52.4%).
| Occupation | Male | Female |
| Healthcare Support | 7 (4.3%) | 154 (95.7%) |
| Security & Protection | 195 (61.9%) | 120 (38.1%) |
| Firefighting & Prevention | 126 (74.1%) | 44 (25.9%) |
| Law Enforcement | 69 (47.6%) | 76 (52.4%) |
| Food Preparation & Serving | 62 (82.7%) | 13 (17.3%) |
| Cleaning & Maintenance | 26 (48.1%) | 28 (51.8%) |
| Personal Care & Service | 33 (39.8%) | 50 (60.2%) |
| Total (Category) | 323 (46.9%) | 365 (53.0%) |
| Total (Overall) | 2,727 (45.9%) | 3,209 (54.1%) |
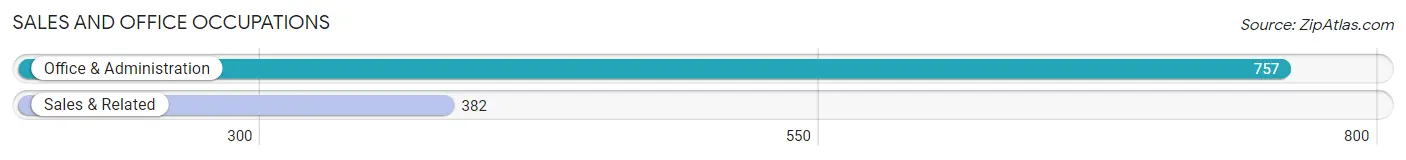
Sales and Office Occupations
The most common Sales and Office occupations in Marlton are Office & Administration (757 | 12.8%), and Sales & Related (382 | 6.4%).
Sales and Office Occupations by Sex
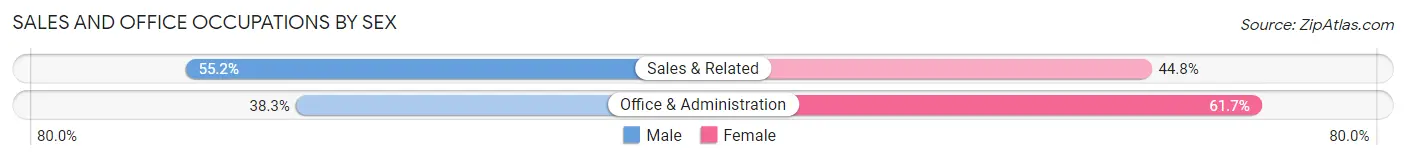
| Occupation | Male | Female |
| Sales & Related | 211 (55.2%) | 171 (44.8%) |
| Office & Administration | 290 (38.3%) | 467 (61.7%) |
| Total (Category) | 501 (44.0%) | 638 (56.0%) |
| Total (Overall) | 2,727 (45.9%) | 3,209 (54.1%) |
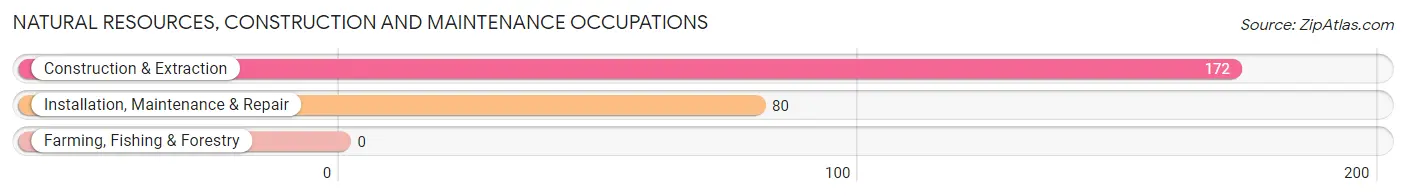
Natural Resources, Construction and Maintenance Occupations
The most common Natural Resources, Construction and Maintenance occupations in Marlton are Construction & Extraction (172 | 2.9%), and Installation, Maintenance & Repair (80 | 1.3%).
Natural Resources, Construction and Maintenance Occupations by Sex
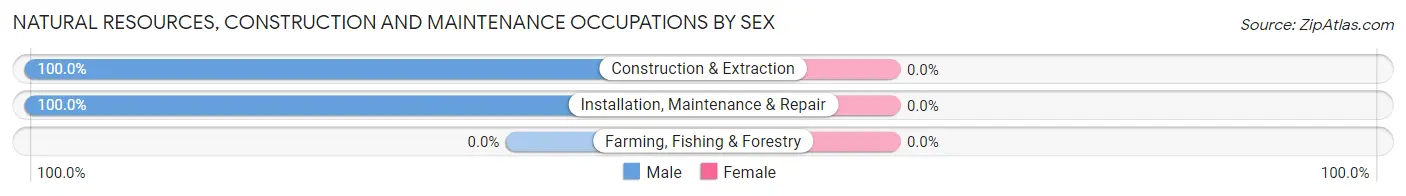
| Occupation | Male | Female |
| Farming, Fishing & Forestry | 0 (0.0%) | 0 (0.0%) |
| Construction & Extraction | 172 (100.0%) | 0 (0.0%) |
| Installation, Maintenance & Repair | 80 (100.0%) | 0 (0.0%) |
| Total (Category) | 252 (100.0%) | 0 (0.0%) |
| Total (Overall) | 2,727 (45.9%) | 3,209 (54.1%) |
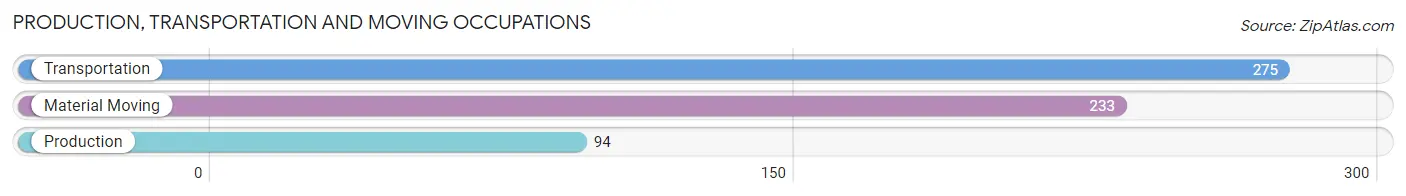
Production, Transportation and Moving Occupations
The most common Production, Transportation and Moving occupations in Marlton are Transportation (275 | 4.6%), Material Moving (233 | 3.9%), and Production (94 | 1.6%).
Production, Transportation and Moving Occupations by Sex
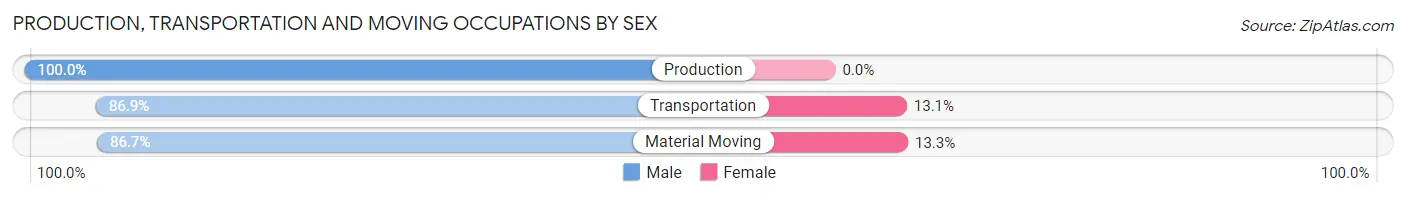
| Occupation | Male | Female |
| Production | 94 (100.0%) | 0 (0.0%) |
| Transportation | 239 (86.9%) | 36 (13.1%) |
| Material Moving | 202 (86.7%) | 31 (13.3%) |
| Total (Category) | 535 (88.9%) | 67 (11.1%) |
| Total (Overall) | 2,727 (45.9%) | 3,209 (54.1%) |
Employment Industries by Sex in Marlton
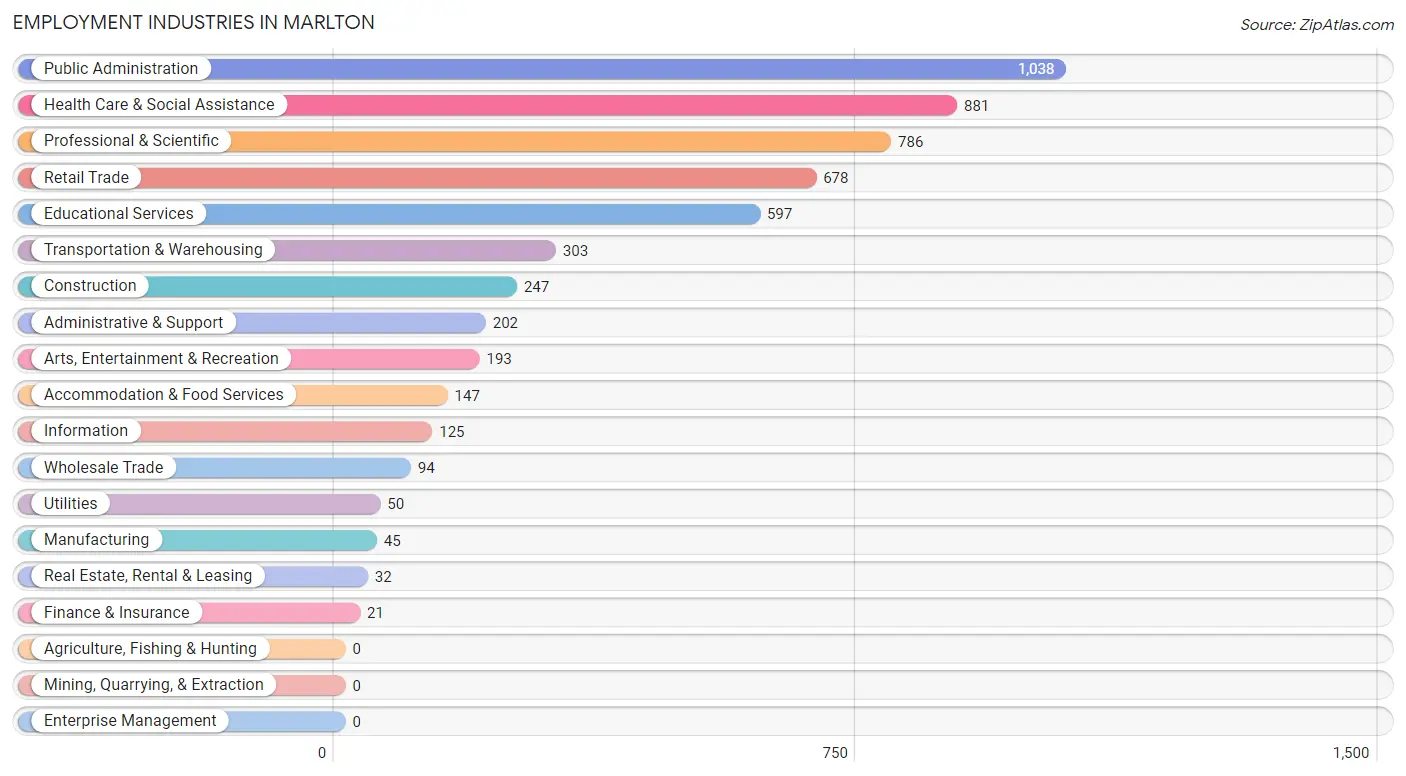
Employment Industries in Marlton
The major employment industries in Marlton include Public Administration (1,038 | 17.5%), Health Care & Social Assistance (881 | 14.8%), Professional & Scientific (786 | 13.2%), Retail Trade (678 | 11.4%), and Educational Services (597 | 10.1%).
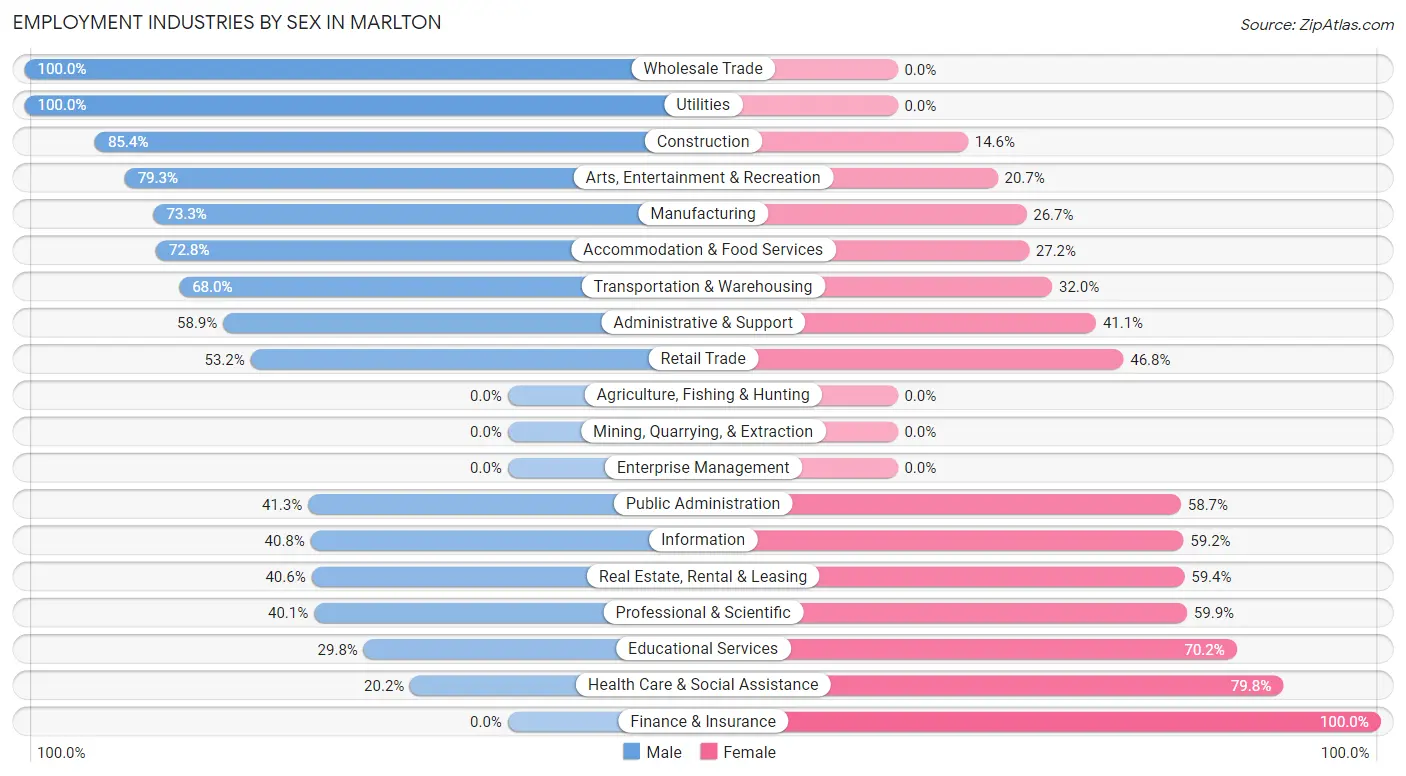
Employment Industries by Sex in Marlton
The Marlton industries that see more men than women are Wholesale Trade (100.0%), Utilities (100.0%), and Construction (85.4%), whereas the industries that tend to have a higher number of women are Finance & Insurance (100.0%), Health Care & Social Assistance (79.8%), and Educational Services (70.2%).
| Industry | Male | Female |
| Agriculture, Fishing & Hunting | 0 (0.0%) | 0 (0.0%) |
| Mining, Quarrying, & Extraction | 0 (0.0%) | 0 (0.0%) |
| Construction | 211 (85.4%) | 36 (14.6%) |
| Manufacturing | 33 (73.3%) | 12 (26.7%) |
| Wholesale Trade | 94 (100.0%) | 0 (0.0%) |
| Retail Trade | 361 (53.2%) | 317 (46.8%) |
| Transportation & Warehousing | 206 (68.0%) | 97 (32.0%) |
| Utilities | 50 (100.0%) | 0 (0.0%) |
| Information | 51 (40.8%) | 74 (59.2%) |
| Finance & Insurance | 0 (0.0%) | 21 (100.0%) |
| Real Estate, Rental & Leasing | 13 (40.6%) | 19 (59.4%) |
| Professional & Scientific | 315 (40.1%) | 471 (59.9%) |
| Enterprise Management | 0 (0.0%) | 0 (0.0%) |
| Administrative & Support | 119 (58.9%) | 83 (41.1%) |
| Educational Services | 178 (29.8%) | 419 (70.2%) |
| Health Care & Social Assistance | 178 (20.2%) | 703 (79.8%) |
| Arts, Entertainment & Recreation | 153 (79.3%) | 40 (20.7%) |
| Accommodation & Food Services | 107 (72.8%) | 40 (27.2%) |
| Public Administration | 429 (41.3%) | 609 (58.7%) |
| Total | 2,727 (45.9%) | 3,209 (54.1%) |
Education in Marlton
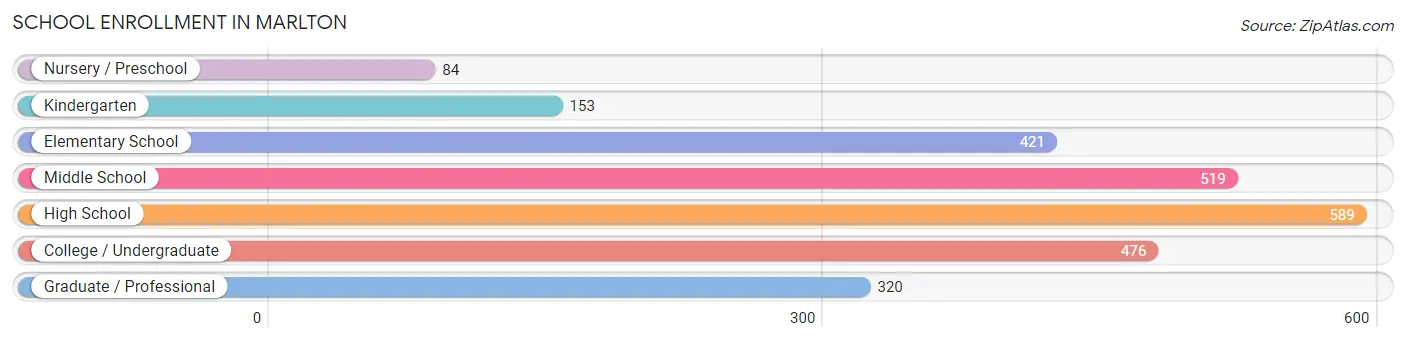
School Enrollment in Marlton
The most common levels of schooling among the 2,562 students in Marlton are high school (589 | 23.0%), middle school (519 | 20.3%), and college / undergraduate (476 | 18.6%).
| School Level | # Students | % Students |
| Nursery / Preschool | 84 | 3.3% |
| Kindergarten | 153 | 6.0% |
| Elementary School | 421 | 16.4% |
| Middle School | 519 | 20.3% |
| High School | 589 | 23.0% |
| College / Undergraduate | 476 | 18.6% |
| Graduate / Professional | 320 | 12.5% |
| Total | 2,562 | 100.0% |
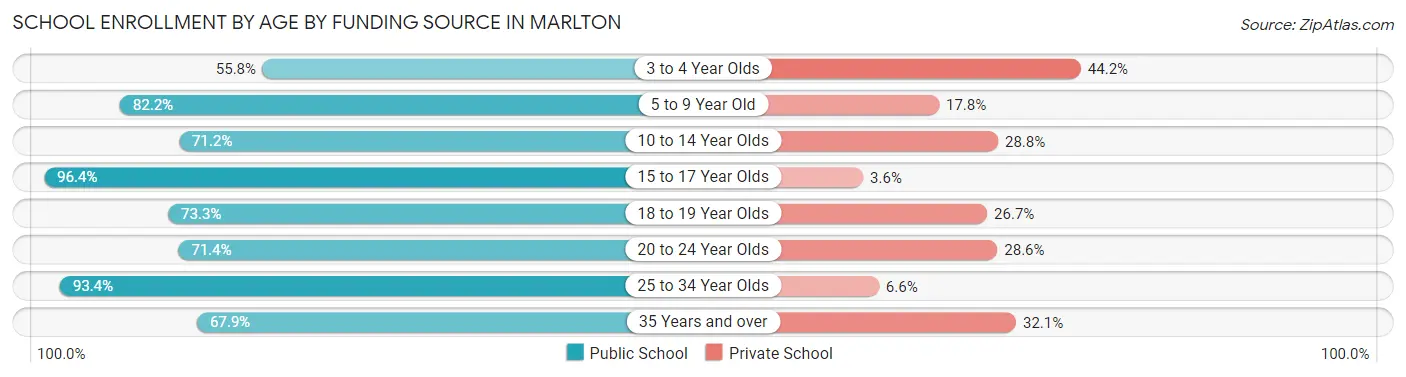
School Enrollment by Age by Funding Source in Marlton
Out of a total of 2,562 students who are enrolled in schools in Marlton, 548 (21.4%) attend a private institution, while the remaining 2,014 (78.6%) are enrolled in public schools. The age group of 3 to 4 year olds has the highest likelihood of being enrolled in private schools, with 38 (44.2% in the age bracket) enrolled. Conversely, the age group of 15 to 17 year olds has the lowest likelihood of being enrolled in a private school, with 478 (96.4% in the age bracket) attending a public institution.
| Age Bracket | Public School | Private School |
| 3 to 4 Year Olds | 48 (55.8%) | 38 (44.2%) |
| 5 to 9 Year Old | 440 (82.2%) | 95 (17.8%) |
| 10 to 14 Year Olds | 436 (71.2%) | 176 (28.8%) |
| 15 to 17 Year Olds | 478 (96.4%) | 18 (3.6%) |
| 18 to 19 Year Olds | 74 (73.3%) | 27 (26.7%) |
| 20 to 24 Year Olds | 182 (71.4%) | 73 (28.6%) |
| 25 to 34 Year Olds | 114 (93.4%) | 8 (6.6%) |
| 35 Years and over | 241 (67.9%) | 114 (32.1%) |
| Total | 2,014 (78.6%) | 548 (21.4%) |
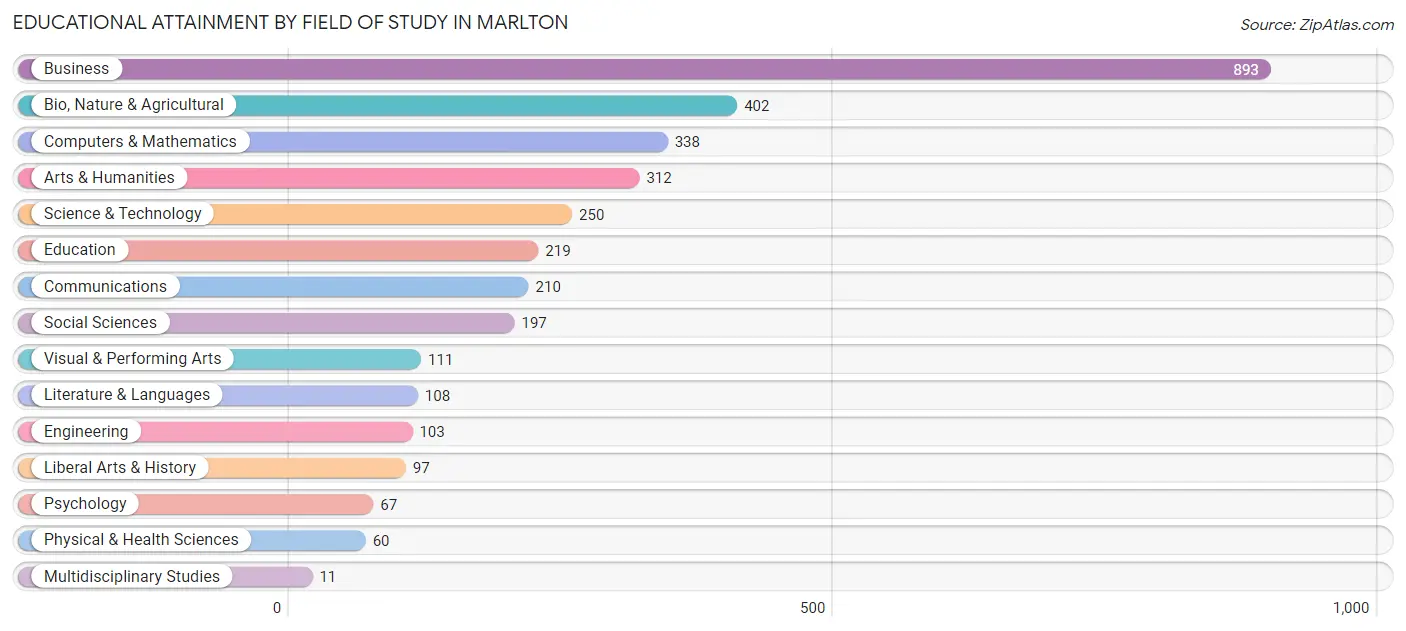
Educational Attainment by Field of Study in Marlton
Business (893 | 26.4%), bio, nature & agricultural (402 | 11.9%), computers & mathematics (338 | 10.0%), arts & humanities (312 | 9.2%), and science & technology (250 | 7.4%) are the most common fields of study among 3,378 individuals in Marlton who have obtained a bachelor's degree or higher.
| Field of Study | # Graduates | % Graduates |
| Computers & Mathematics | 338 | 10.0% |
| Bio, Nature & Agricultural | 402 | 11.9% |
| Physical & Health Sciences | 60 | 1.8% |
| Psychology | 67 | 2.0% |
| Social Sciences | 197 | 5.8% |
| Engineering | 103 | 3.0% |
| Multidisciplinary Studies | 11 | 0.3% |
| Science & Technology | 250 | 7.4% |
| Business | 893 | 26.4% |
| Education | 219 | 6.5% |
| Literature & Languages | 108 | 3.2% |
| Liberal Arts & History | 97 | 2.9% |
| Visual & Performing Arts | 111 | 3.3% |
| Communications | 210 | 6.2% |
| Arts & Humanities | 312 | 9.2% |
| Total | 3,378 | 100.0% |
Transportation & Commute in Marlton
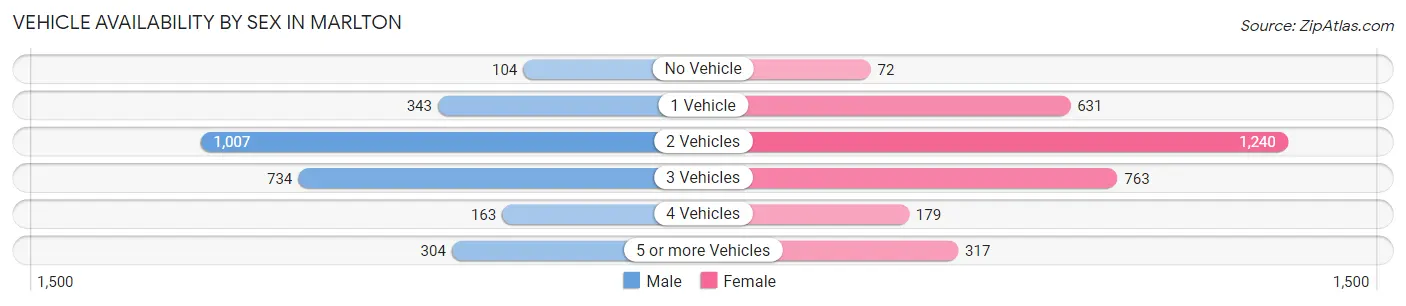
Vehicle Availability by Sex in Marlton
The most prevalent vehicle ownership categories in Marlton are males with 2 vehicles (1,007, accounting for 37.9%) and females with 2 vehicles (1,240, making up 31.5%).
| Vehicles Available | Male | Female |
| No Vehicle | 104 (3.9%) | 72 (2.2%) |
| 1 Vehicle | 343 (12.9%) | 631 (19.7%) |
| 2 Vehicles | 1,007 (37.9%) | 1,240 (38.7%) |
| 3 Vehicles | 734 (27.7%) | 763 (23.8%) |
| 4 Vehicles | 163 (6.1%) | 179 (5.6%) |
| 5 or more Vehicles | 304 (11.5%) | 317 (9.9%) |
| Total | 2,655 (100.0%) | 3,202 (100.0%) |
Commute Time in Marlton
The most frequently occuring commute durations in Marlton are 60 to 89 minutes (973 commuters, 20.2%), 45 to 59 minutes (712 commuters, 14.7%), and 30 to 34 minutes (620 commuters, 12.9%).
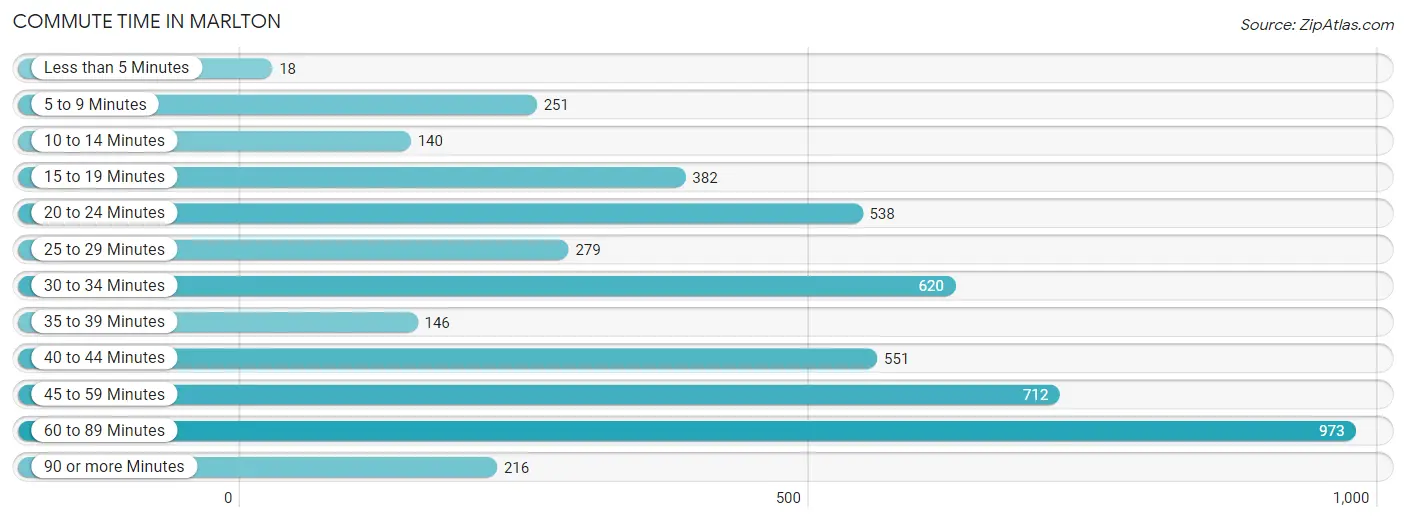
| Commute Time | # Commuters | % Commuters |
| Less than 5 Minutes | 18 | 0.4% |
| 5 to 9 Minutes | 251 | 5.2% |
| 10 to 14 Minutes | 140 | 2.9% |
| 15 to 19 Minutes | 382 | 7.9% |
| 20 to 24 Minutes | 538 | 11.2% |
| 25 to 29 Minutes | 279 | 5.8% |
| 30 to 34 Minutes | 620 | 12.9% |
| 35 to 39 Minutes | 146 | 3.0% |
| 40 to 44 Minutes | 551 | 11.4% |
| 45 to 59 Minutes | 712 | 14.7% |
| 60 to 89 Minutes | 973 | 20.2% |
| 90 or more Minutes | 216 | 4.5% |
Commute Time by Sex in Marlton
The most common commute times in Marlton are 30 to 34 minutes (389 commuters, 17.7%) for males and 60 to 89 minutes (621 commuters, 23.7%) for females.
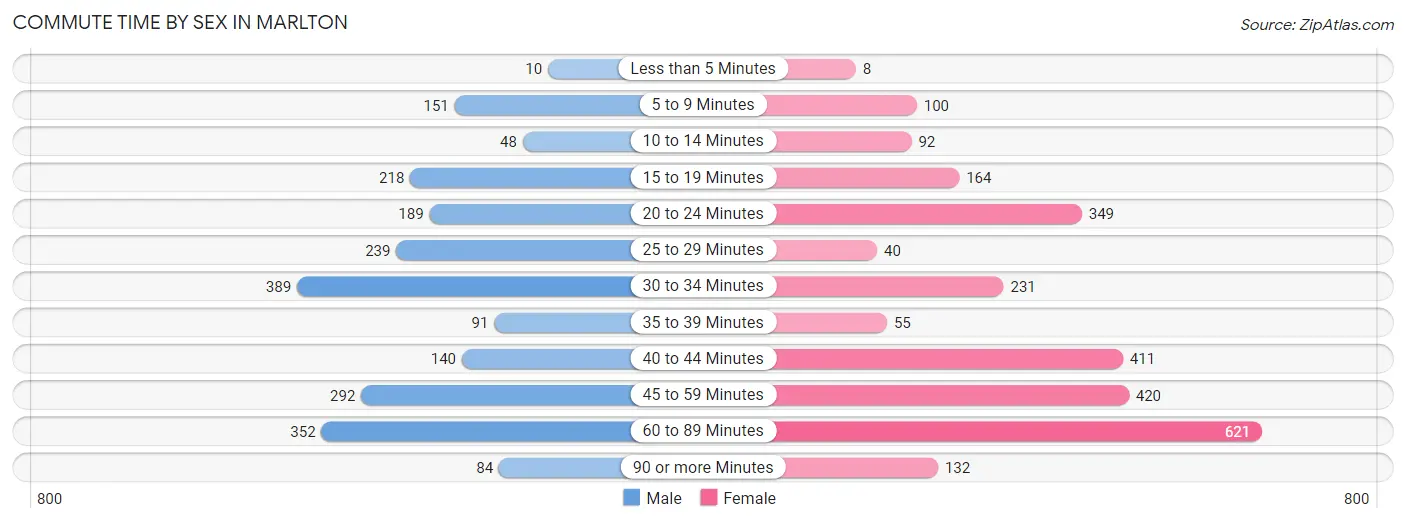
| Commute Time | Male | Female |
| Less than 5 Minutes | 10 (0.4%) | 8 (0.3%) |
| 5 to 9 Minutes | 151 (6.9%) | 100 (3.8%) |
| 10 to 14 Minutes | 48 (2.2%) | 92 (3.5%) |
| 15 to 19 Minutes | 218 (9.9%) | 164 (6.2%) |
| 20 to 24 Minutes | 189 (8.6%) | 349 (13.3%) |
| 25 to 29 Minutes | 239 (10.8%) | 40 (1.5%) |
| 30 to 34 Minutes | 389 (17.7%) | 231 (8.8%) |
| 35 to 39 Minutes | 91 (4.1%) | 55 (2.1%) |
| 40 to 44 Minutes | 140 (6.4%) | 411 (15.7%) |
| 45 to 59 Minutes | 292 (13.3%) | 420 (16.0%) |
| 60 to 89 Minutes | 352 (16.0%) | 621 (23.7%) |
| 90 or more Minutes | 84 (3.8%) | 132 (5.0%) |
Time of Departure to Work by Sex in Marlton
The most frequent times of departure to work in Marlton are 7:00 AM to 7:29 AM (303, 13.8%) for males and 7:00 AM to 7:29 AM (458, 17.5%) for females.
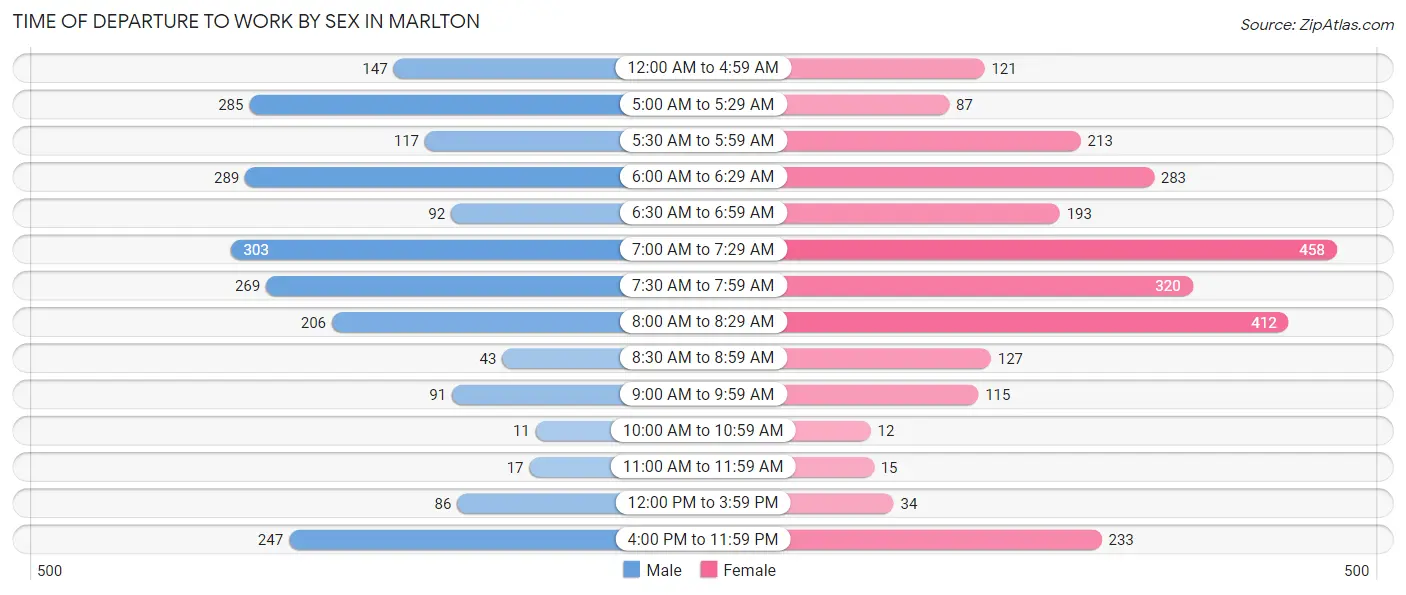
| Time of Departure | Male | Female |
| 12:00 AM to 4:59 AM | 147 (6.7%) | 121 (4.6%) |
| 5:00 AM to 5:29 AM | 285 (12.9%) | 87 (3.3%) |
| 5:30 AM to 5:59 AM | 117 (5.3%) | 213 (8.1%) |
| 6:00 AM to 6:29 AM | 289 (13.1%) | 283 (10.8%) |
| 6:30 AM to 6:59 AM | 92 (4.2%) | 193 (7.4%) |
| 7:00 AM to 7:29 AM | 303 (13.8%) | 458 (17.5%) |
| 7:30 AM to 7:59 AM | 269 (12.2%) | 320 (12.2%) |
| 8:00 AM to 8:29 AM | 206 (9.3%) | 412 (15.7%) |
| 8:30 AM to 8:59 AM | 43 (1.9%) | 127 (4.8%) |
| 9:00 AM to 9:59 AM | 91 (4.1%) | 115 (4.4%) |
| 10:00 AM to 10:59 AM | 11 (0.5%) | 12 (0.5%) |
| 11:00 AM to 11:59 AM | 17 (0.8%) | 15 (0.6%) |
| 12:00 PM to 3:59 PM | 86 (3.9%) | 34 (1.3%) |
| 4:00 PM to 11:59 PM | 247 (11.2%) | 233 (8.9%) |
| Total | 2,203 (100.0%) | 2,623 (100.0%) |
Housing Occupancy in Marlton
Occupancy by Ownership in Marlton
Of the total 3,789 dwellings in Marlton, owner-occupied units account for 3,284 (86.7%), while renter-occupied units make up 505 (13.3%).
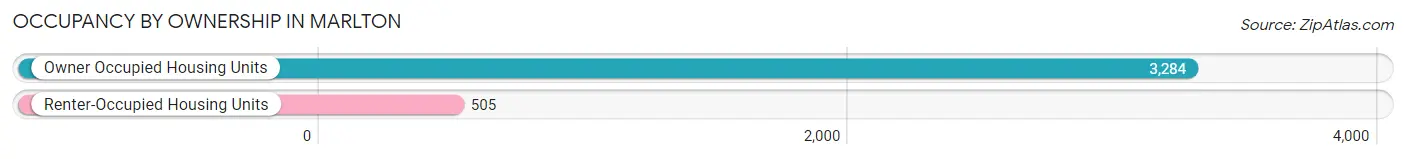
| Occupancy | # Housing Units | % Housing Units |
| Owner Occupied Housing Units | 3,284 | 86.7% |
| Renter-Occupied Housing Units | 505 | 13.3% |
| Total Occupied Housing Units | 3,789 | 100.0% |
Occupancy by Household Size in Marlton
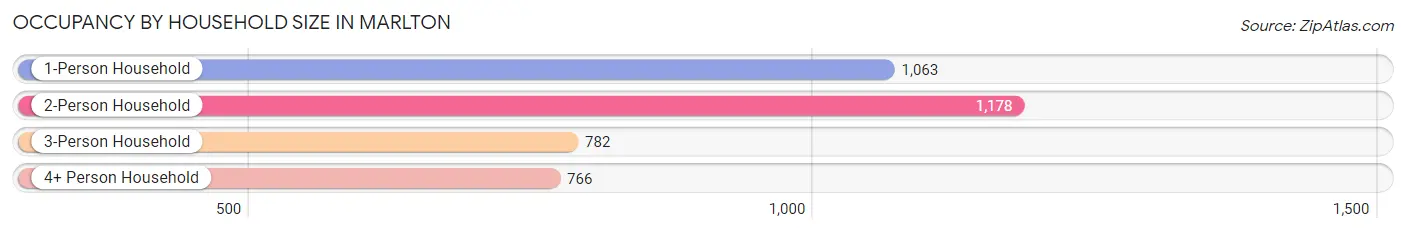
| Household Size | # Housing Units | % Housing Units |
| 1-Person Household | 1,063 | 28.1% |
| 2-Person Household | 1,178 | 31.1% |
| 3-Person Household | 782 | 20.6% |
| 4+ Person Household | 766 | 20.2% |
| Total Housing Units | 3,789 | 100.0% |
Occupancy by Ownership by Household Size in Marlton
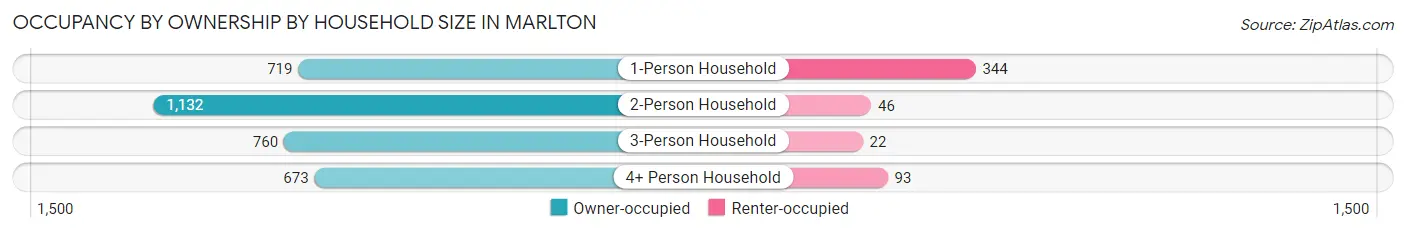
| Household Size | Owner-occupied | Renter-occupied |
| 1-Person Household | 719 (67.6%) | 344 (32.4%) |
| 2-Person Household | 1,132 (96.1%) | 46 (3.9%) |
| 3-Person Household | 760 (97.2%) | 22 (2.8%) |
| 4+ Person Household | 673 (87.9%) | 93 (12.1%) |
| Total Housing Units | 3,284 (86.7%) | 505 (13.3%) |
Occupancy by Educational Attainment in Marlton
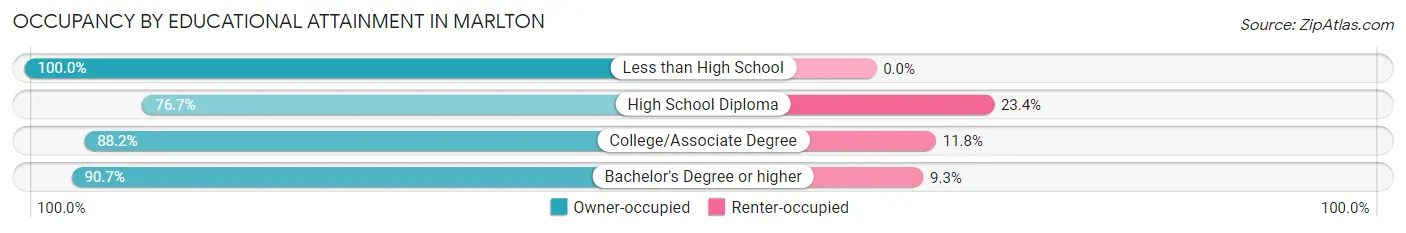
| Household Size | Owner-occupied | Renter-occupied |
| Less than High School | 30 (100.0%) | 0 (0.0%) |
| High School Diploma | 673 (76.6%) | 205 (23.4%) |
| College/Associate Degree | 1,118 (88.2%) | 150 (11.8%) |
| Bachelor's Degree or higher | 1,463 (90.7%) | 150 (9.3%) |
Occupancy by Age of Householder in Marlton
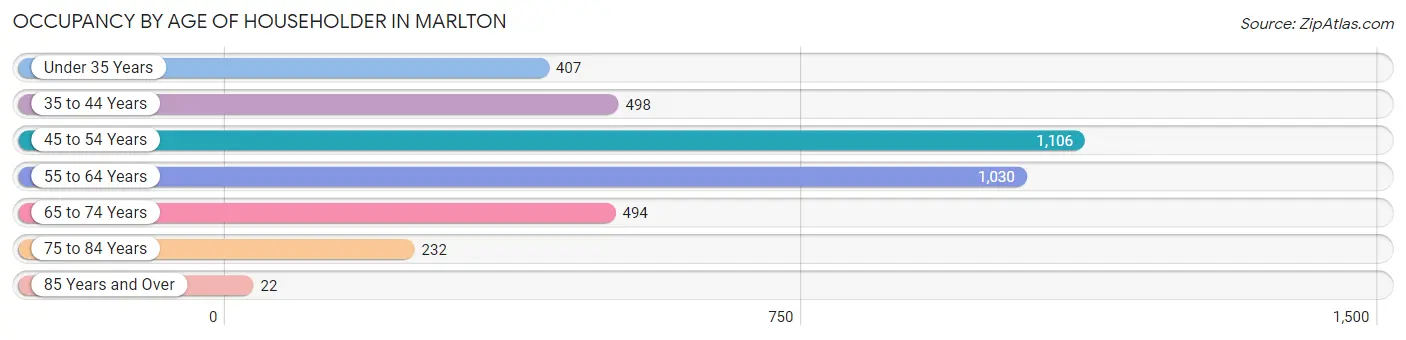
| Age Bracket | # Households | % Households |
| Under 35 Years | 407 | 10.7% |
| 35 to 44 Years | 498 | 13.1% |
| 45 to 54 Years | 1,106 | 29.2% |
| 55 to 64 Years | 1,030 | 27.2% |
| 65 to 74 Years | 494 | 13.0% |
| 75 to 84 Years | 232 | 6.1% |
| 85 Years and Over | 22 | 0.6% |
| Total | 3,789 | 100.0% |
Housing Finances in Marlton
Median Income by Occupancy in Marlton
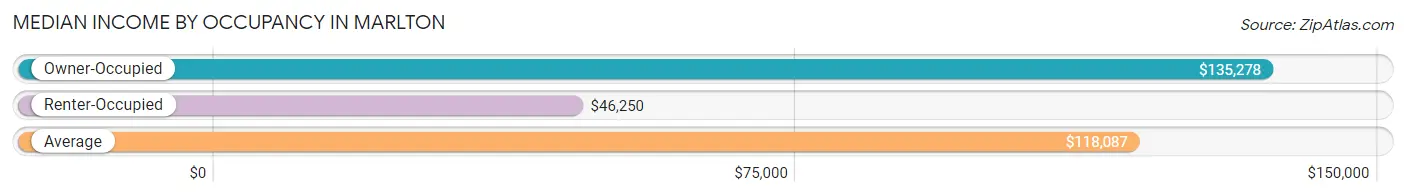
| Occupancy Type | # Households | Median Income |
| Owner-Occupied | 3,284 (86.7%) | $135,278 |
| Renter-Occupied | 505 (13.3%) | $46,250 |
| Average | 3,789 (100.0%) | $118,087 |
Occupancy by Householder Income Bracket in Marlton
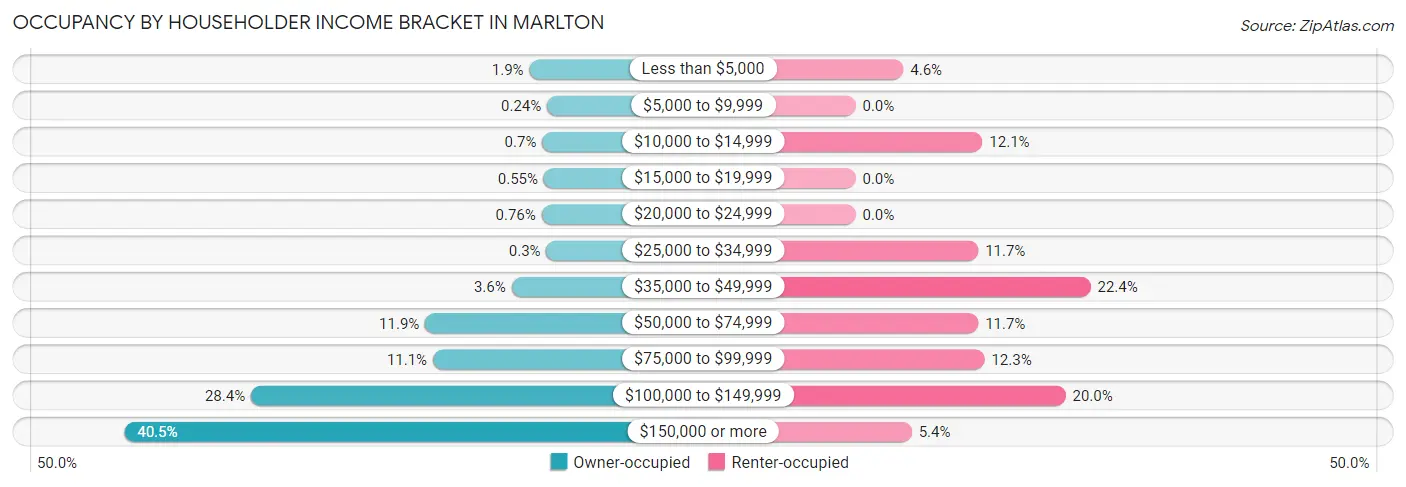
| Income Bracket | Owner-occupied | Renter-occupied |
| Less than $5,000 | 63 (1.9%) | 23 (4.5%) |
| $5,000 to $9,999 | 8 (0.2%) | 0 (0.0%) |
| $10,000 to $14,999 | 23 (0.7%) | 61 (12.1%) |
| $15,000 to $19,999 | 18 (0.5%) | 0 (0.0%) |
| $20,000 to $24,999 | 25 (0.8%) | 0 (0.0%) |
| $25,000 to $34,999 | 10 (0.3%) | 59 (11.7%) |
| $35,000 to $49,999 | 119 (3.6%) | 113 (22.4%) |
| $50,000 to $74,999 | 389 (11.8%) | 59 (11.7%) |
| $75,000 to $99,999 | 365 (11.1%) | 62 (12.3%) |
| $100,000 to $149,999 | 934 (28.4%) | 101 (20.0%) |
| $150,000 or more | 1,330 (40.5%) | 27 (5.3%) |
| Total | 3,284 (100.0%) | 505 (100.0%) |
Monthly Housing Cost Tiers in Marlton
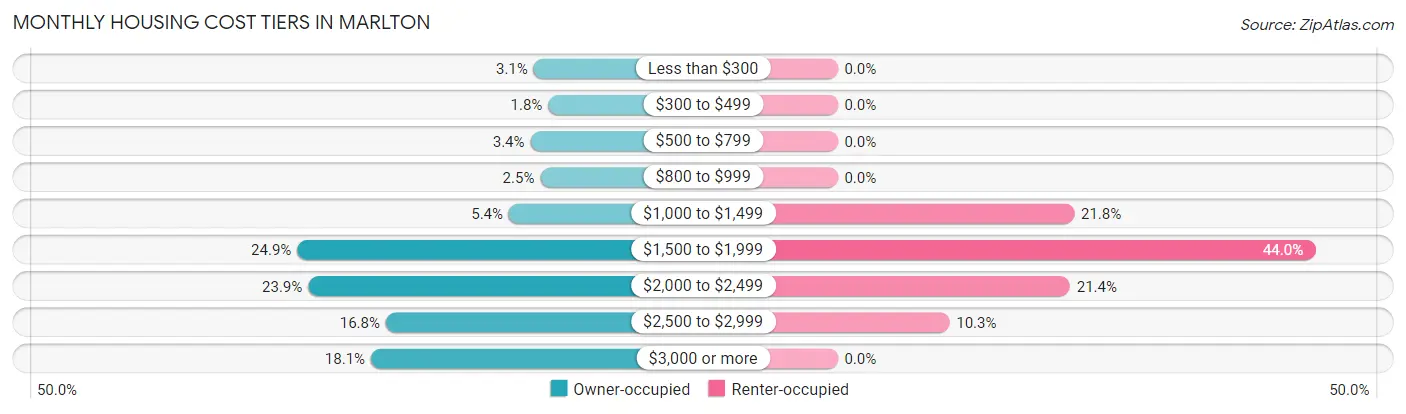
| Monthly Cost | Owner-occupied | Renter-occupied |
| Less than $300 | 103 (3.1%) | 0 (0.0%) |
| $300 to $499 | 59 (1.8%) | 0 (0.0%) |
| $500 to $799 | 113 (3.4%) | 0 (0.0%) |
| $800 to $999 | 83 (2.5%) | 0 (0.0%) |
| $1,000 to $1,499 | 178 (5.4%) | 110 (21.8%) |
| $1,500 to $1,999 | 818 (24.9%) | 222 (44.0%) |
| $2,000 to $2,499 | 785 (23.9%) | 108 (21.4%) |
| $2,500 to $2,999 | 550 (16.8%) | 52 (10.3%) |
| $3,000 or more | 595 (18.1%) | 0 (0.0%) |
| Total | 3,284 (100.0%) | 505 (100.0%) |
Physical Housing Characteristics in Marlton
Housing Structures in Marlton
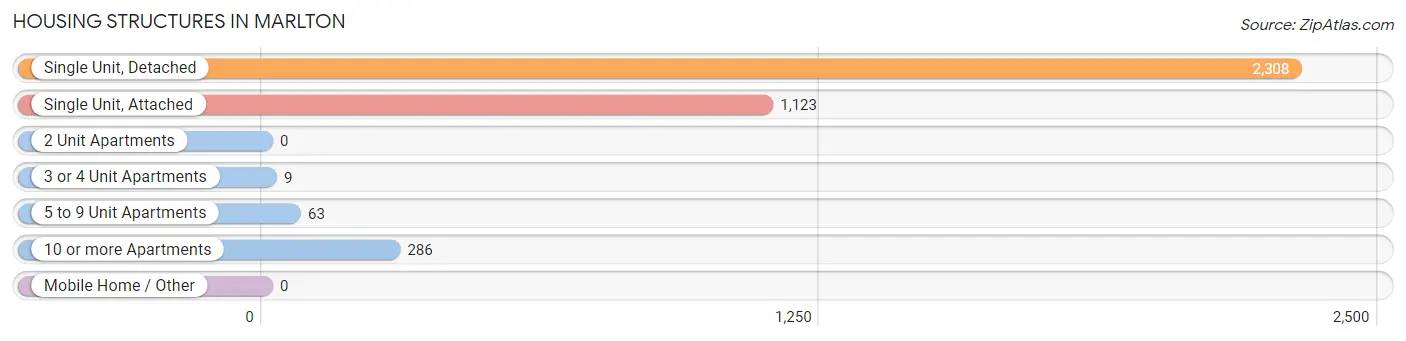
| Structure Type | # Housing Units | % Housing Units |
| Single Unit, Detached | 2,308 | 60.9% |
| Single Unit, Attached | 1,123 | 29.6% |
| 2 Unit Apartments | 0 | 0.0% |
| 3 or 4 Unit Apartments | 9 | 0.2% |
| 5 to 9 Unit Apartments | 63 | 1.7% |
| 10 or more Apartments | 286 | 7.5% |
| Mobile Home / Other | 0 | 0.0% |
| Total | 3,789 | 100.0% |
Housing Structures by Occupancy in Marlton
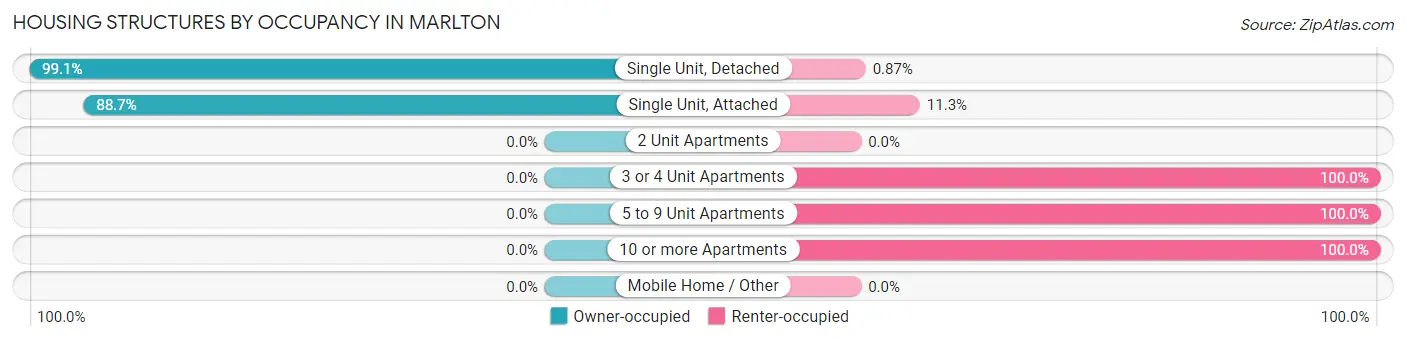
| Structure Type | Owner-occupied | Renter-occupied |
| Single Unit, Detached | 2,288 (99.1%) | 20 (0.9%) |
| Single Unit, Attached | 996 (88.7%) | 127 (11.3%) |
| 2 Unit Apartments | 0 (0.0%) | 0 (0.0%) |
| 3 or 4 Unit Apartments | 0 (0.0%) | 9 (100.0%) |
| 5 to 9 Unit Apartments | 0 (0.0%) | 63 (100.0%) |
| 10 or more Apartments | 0 (0.0%) | 286 (100.0%) |
| Mobile Home / Other | 0 (0.0%) | 0 (0.0%) |
| Total | 3,284 (86.7%) | 505 (13.3%) |
Housing Structures by Number of Rooms in Marlton
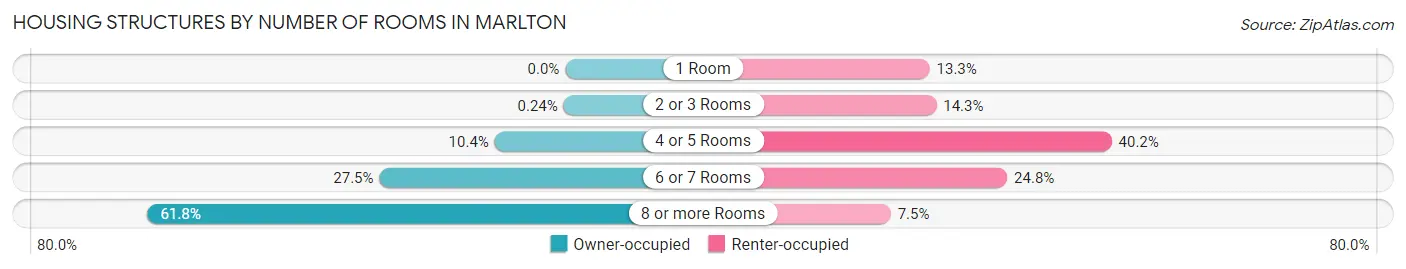
| Number of Rooms | Owner-occupied | Renter-occupied |
| 1 Room | 0 (0.0%) | 67 (13.3%) |
| 2 or 3 Rooms | 8 (0.2%) | 72 (14.3%) |
| 4 or 5 Rooms | 343 (10.4%) | 203 (40.2%) |
| 6 or 7 Rooms | 903 (27.5%) | 125 (24.7%) |
| 8 or more Rooms | 2,030 (61.8%) | 38 (7.5%) |
| Total | 3,284 (100.0%) | 505 (100.0%) |
Housing Structure by Heating Type in Marlton
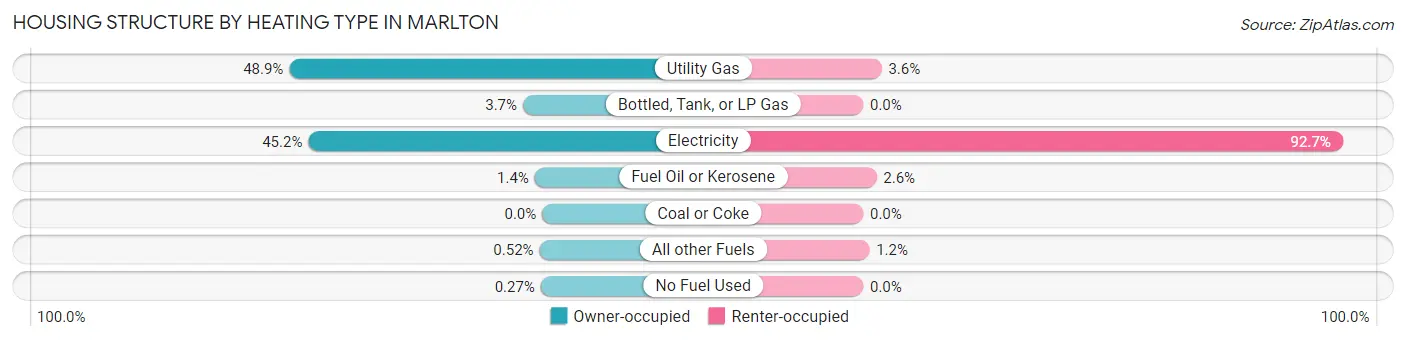
| Heating Type | Owner-occupied | Renter-occupied |
| Utility Gas | 1,605 (48.9%) | 18 (3.6%) |
| Bottled, Tank, or LP Gas | 122 (3.7%) | 0 (0.0%) |
| Electricity | 1,484 (45.2%) | 468 (92.7%) |
| Fuel Oil or Kerosene | 47 (1.4%) | 13 (2.6%) |
| Coal or Coke | 0 (0.0%) | 0 (0.0%) |
| All other Fuels | 17 (0.5%) | 6 (1.2%) |
| No Fuel Used | 9 (0.3%) | 0 (0.0%) |
| Total | 3,284 (100.0%) | 505 (100.0%) |
Household Vehicle Usage in Marlton
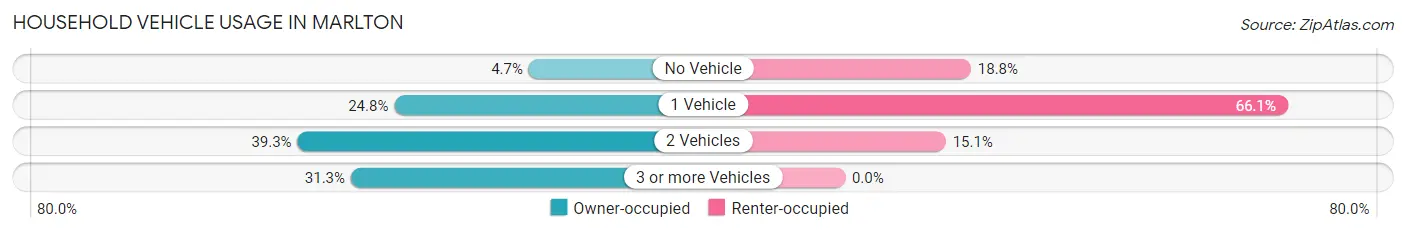
| Vehicles per Household | Owner-occupied | Renter-occupied |
| No Vehicle | 154 (4.7%) | 95 (18.8%) |
| 1 Vehicle | 814 (24.8%) | 334 (66.1%) |
| 2 Vehicles | 1,289 (39.3%) | 76 (15.0%) |
| 3 or more Vehicles | 1,027 (31.3%) | 0 (0.0%) |
| Total | 3,284 (100.0%) | 505 (100.0%) |
Real Estate & Mortgages in Marlton
Real Estate and Mortgage Overview in Marlton
| Characteristic | Without Mortgage | With Mortgage |
| Housing Units | 356 | 2,928 |
| Median Property Value | $312,700 | $383,300 |
| Median Household Income | $93,571 | $1,233 |
| Monthly Housing Costs | $681 | $595 |
| Real Estate Taxes | $4,081 | $118 |
Property Value by Mortgage Status in Marlton
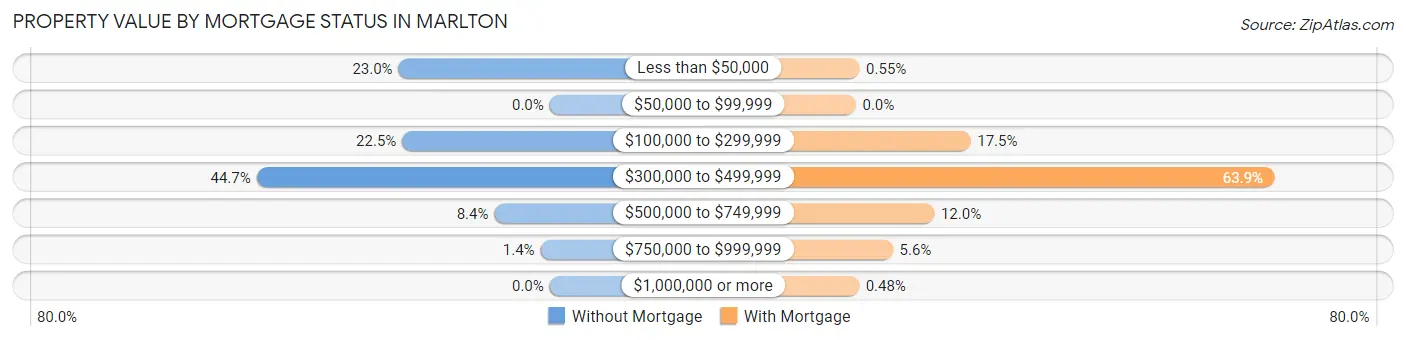
| Property Value | Without Mortgage | With Mortgage |
| Less than $50,000 | 82 (23.0%) | 16 (0.5%) |
| $50,000 to $99,999 | 0 (0.0%) | 0 (0.0%) |
| $100,000 to $299,999 | 80 (22.5%) | 512 (17.5%) |
| $300,000 to $499,999 | 159 (44.7%) | 1,871 (63.9%) |
| $500,000 to $749,999 | 30 (8.4%) | 350 (11.9%) |
| $750,000 to $999,999 | 5 (1.4%) | 165 (5.6%) |
| $1,000,000 or more | 0 (0.0%) | 14 (0.5%) |
| Total | 356 (100.0%) | 2,928 (100.0%) |
Household Income by Mortgage Status in Marlton
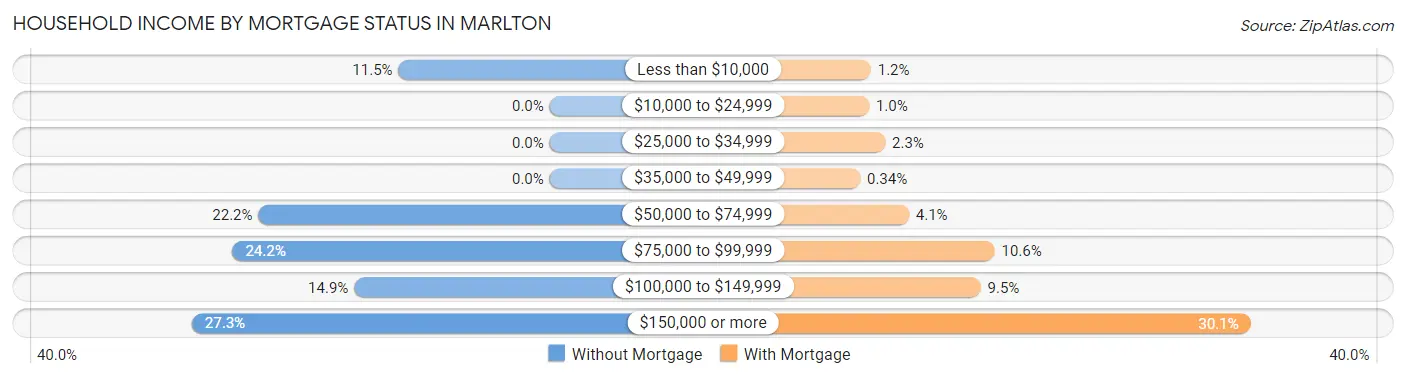
| Household Income | Without Mortgage | With Mortgage |
| Less than $10,000 | 41 (11.5%) | 34 (1.2%) |
| $10,000 to $24,999 | 0 (0.0%) | 30 (1.0%) |
| $25,000 to $34,999 | 0 (0.0%) | 66 (2.2%) |
| $35,000 to $49,999 | 0 (0.0%) | 10 (0.3%) |
| $50,000 to $74,999 | 79 (22.2%) | 119 (4.1%) |
| $75,000 to $99,999 | 86 (24.2%) | 310 (10.6%) |
| $100,000 to $149,999 | 53 (14.9%) | 279 (9.5%) |
| $150,000 or more | 97 (27.3%) | 881 (30.1%) |
| Total | 356 (100.0%) | 2,928 (100.0%) |
Property Value to Household Income Ratio in Marlton
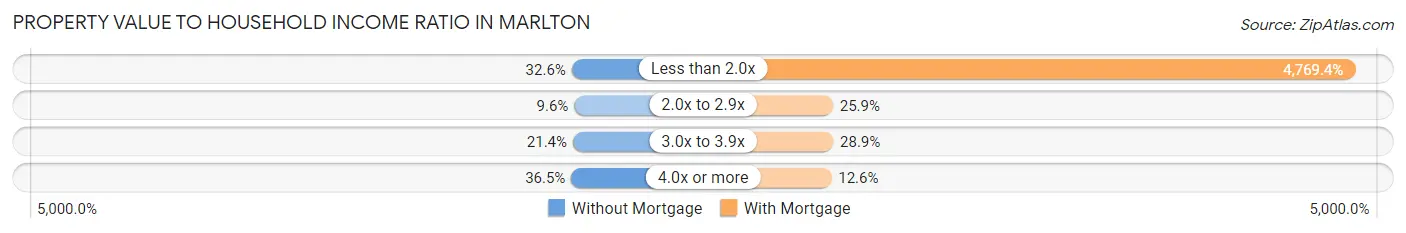
| Value-to-Income Ratio | Without Mortgage | With Mortgage |
| Less than 2.0x | 116 (32.6%) | 139,649 (4,769.4%) |
| 2.0x to 2.9x | 34 (9.6%) | 758 (25.9%) |
| 3.0x to 3.9x | 76 (21.3%) | 847 (28.9%) |
| 4.0x or more | 130 (36.5%) | 368 (12.6%) |
| Total | 356 (100.0%) | 2,928 (100.0%) |
Real Estate Taxes by Mortgage Status in Marlton
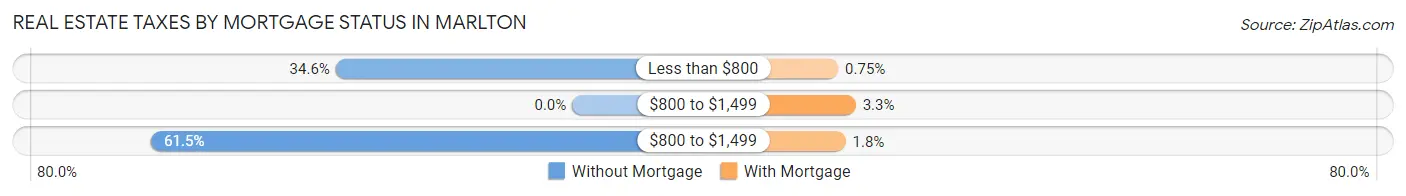
| Property Taxes | Without Mortgage | With Mortgage |
| Less than $800 | 123 (34.5%) | 22 (0.7%) |
| $800 to $1,499 | 0 (0.0%) | 97 (3.3%) |
| $800 to $1,499 | 219 (61.5%) | 54 (1.8%) |
| Total | 356 (100.0%) | 2,928 (100.0%) |
Health & Disability in Marlton
Health Insurance Coverage by Age in Marlton
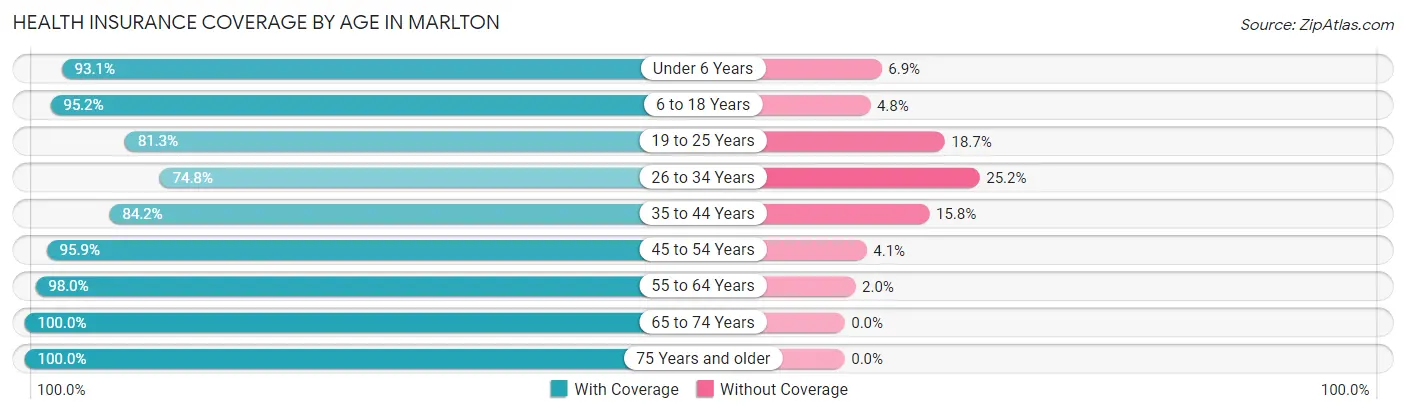
| Age Bracket | With Coverage | Without Coverage |
| Under 6 Years | 566 (93.1%) | 42 (6.9%) |
| 6 to 18 Years | 1,549 (95.2%) | 78 (4.8%) |
| 19 to 25 Years | 609 (81.3%) | 140 (18.7%) |
| 26 to 34 Years | 838 (74.8%) | 282 (25.2%) |
| 35 to 44 Years | 1,033 (84.2%) | 194 (15.8%) |
| 45 to 54 Years | 1,798 (95.9%) | 77 (4.1%) |
| 55 to 64 Years | 1,561 (98.0%) | 32 (2.0%) |
| 65 to 74 Years | 819 (100.0%) | 0 (0.0%) |
| 75 Years and older | 540 (100.0%) | 0 (0.0%) |
| Total | 9,313 (91.7%) | 845 (8.3%) |
Health Insurance Coverage by Citizenship Status in Marlton
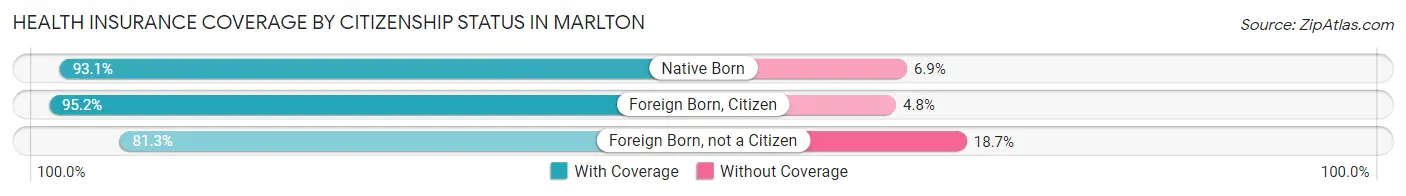
| Citizenship Status | With Coverage | Without Coverage |
| Native Born | 566 (93.1%) | 42 (6.9%) |
| Foreign Born, Citizen | 1,549 (95.2%) | 78 (4.8%) |
| Foreign Born, not a Citizen | 609 (81.3%) | 140 (18.7%) |
Health Insurance Coverage by Household Income in Marlton
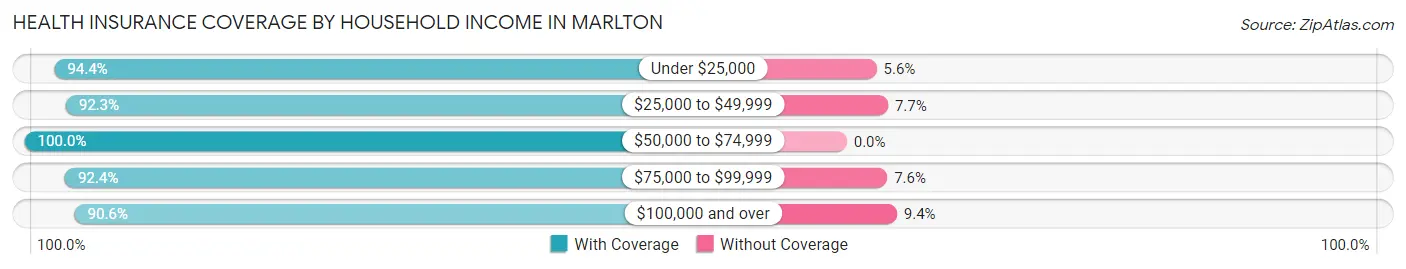
| Household Income | With Coverage | Without Coverage |
| Under $25,000 | 287 (94.4%) | 17 (5.6%) |
| $25,000 to $49,999 | 598 (92.3%) | 50 (7.7%) |
| $50,000 to $74,999 | 738 (100.0%) | 0 (0.0%) |
| $75,000 to $99,999 | 818 (92.4%) | 67 (7.6%) |
| $100,000 and over | 6,866 (90.6%) | 711 (9.4%) |
Public vs Private Health Insurance Coverage by Age in Marlton
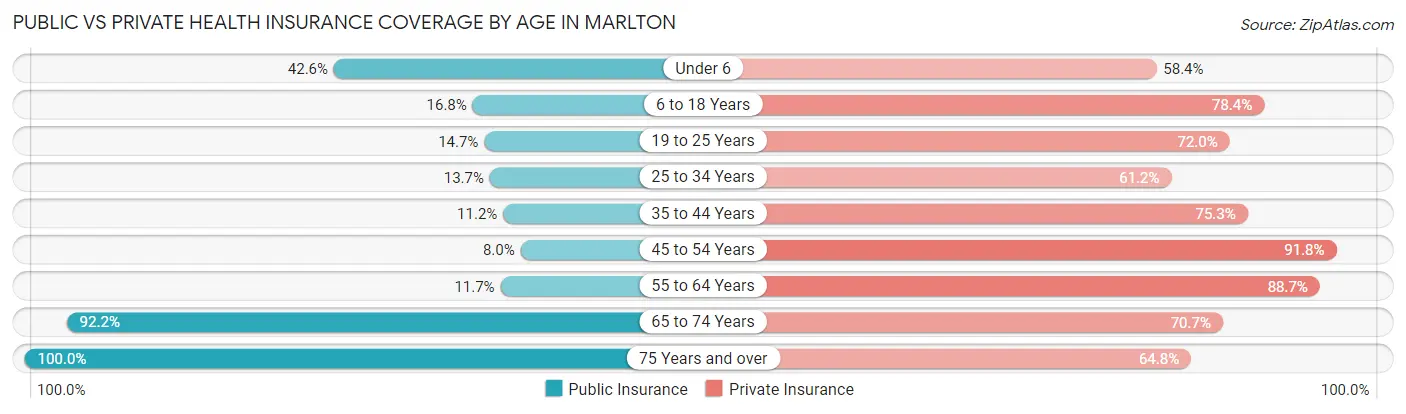
| Age Bracket | Public Insurance | Private Insurance |
| Under 6 | 259 (42.6%) | 355 (58.4%) |
| 6 to 18 Years | 274 (16.8%) | 1,275 (78.4%) |
| 19 to 25 Years | 110 (14.7%) | 539 (72.0%) |
| 25 to 34 Years | 153 (13.7%) | 685 (61.2%) |
| 35 to 44 Years | 137 (11.2%) | 924 (75.3%) |
| 45 to 54 Years | 149 (8.0%) | 1,721 (91.8%) |
| 55 to 64 Years | 186 (11.7%) | 1,413 (88.7%) |
| 65 to 74 Years | 755 (92.2%) | 579 (70.7%) |
| 75 Years and over | 540 (100.0%) | 350 (64.8%) |
| Total | 2,563 (25.2%) | 7,841 (77.2%) |
Disability Status by Sex by Age in Marlton
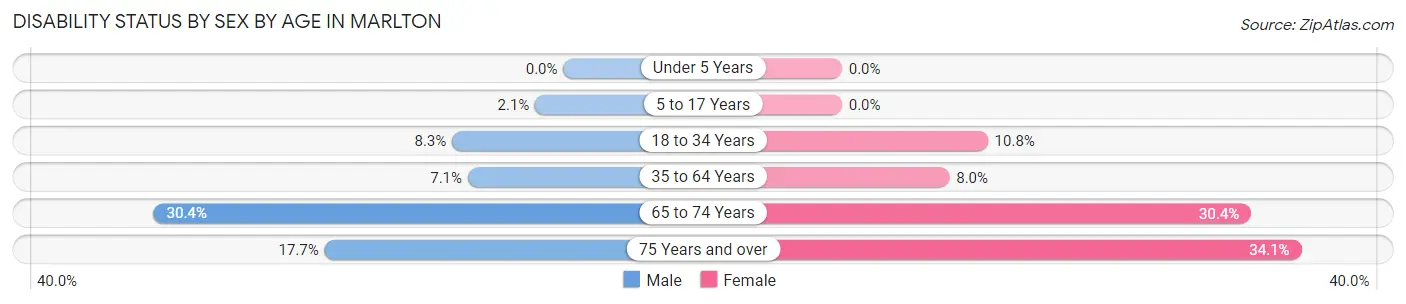
| Age Bracket | Male | Female |
| Under 5 Years | 0 (0.0%) | 0 (0.0%) |
| 5 to 17 Years | 14 (2.1%) | 0 (0.0%) |
| 18 to 34 Years | 81 (8.3%) | 102 (10.8%) |
| 35 to 64 Years | 150 (7.1%) | 206 (8.0%) |
| 65 to 74 Years | 94 (30.4%) | 155 (30.4%) |
| 75 Years and over | 36 (17.7%) | 115 (34.1%) |
Disability Class by Sex by Age in Marlton
Disability Class: Hearing Difficulty
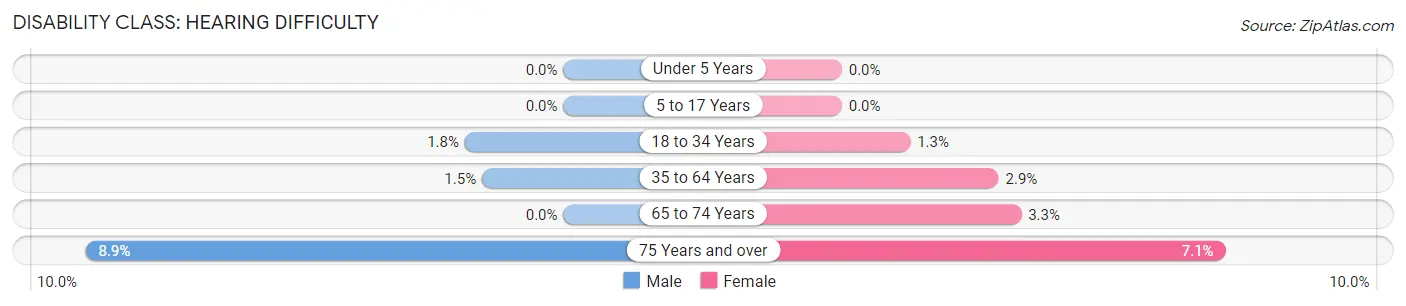
| Age Bracket | Male | Female |
| Under 5 Years | 0 (0.0%) | 0 (0.0%) |
| 5 to 17 Years | 0 (0.0%) | 0 (0.0%) |
| 18 to 34 Years | 18 (1.8%) | 12 (1.3%) |
| 35 to 64 Years | 32 (1.5%) | 75 (2.9%) |
| 65 to 74 Years | 0 (0.0%) | 17 (3.3%) |
| 75 Years and over | 18 (8.9%) | 24 (7.1%) |
Disability Class: Vision Difficulty
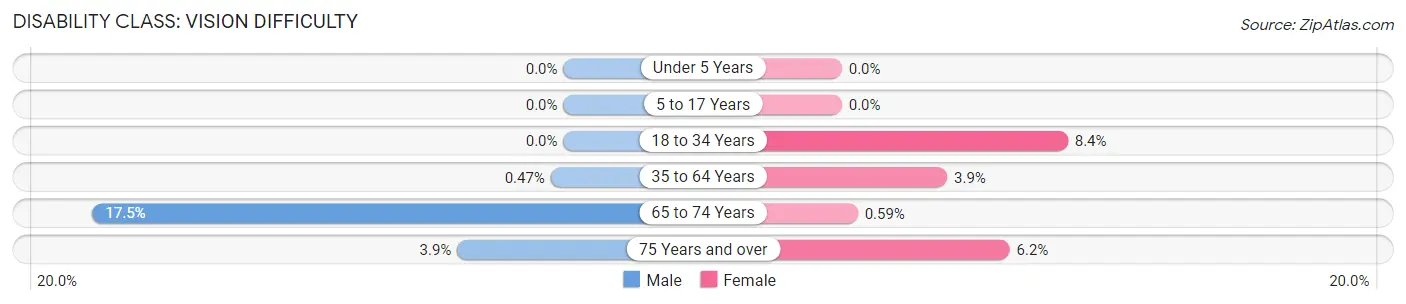
| Age Bracket | Male | Female |
| Under 5 Years | 0 (0.0%) | 0 (0.0%) |
| 5 to 17 Years | 0 (0.0%) | 0 (0.0%) |
| 18 to 34 Years | 0 (0.0%) | 79 (8.4%) |
| 35 to 64 Years | 10 (0.5%) | 101 (3.9%) |
| 65 to 74 Years | 54 (17.5%) | 3 (0.6%) |
| 75 Years and over | 8 (3.9%) | 21 (6.2%) |
Disability Class: Cognitive Difficulty
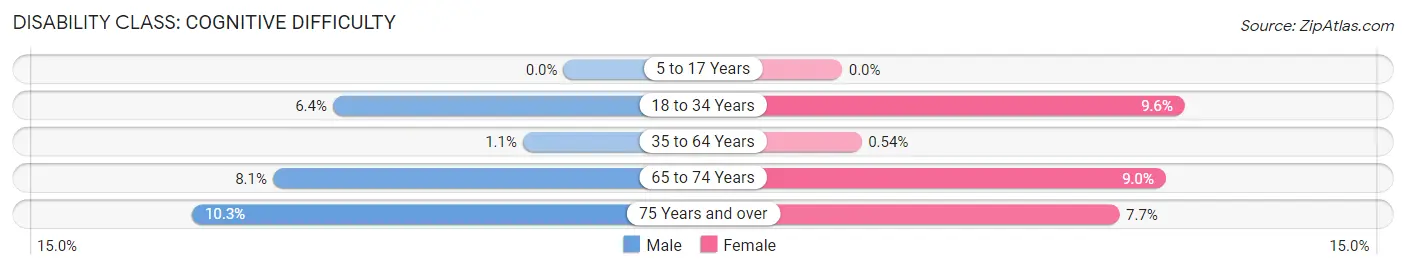
| Age Bracket | Male | Female |
| 5 to 17 Years | 0 (0.0%) | 0 (0.0%) |
| 18 to 34 Years | 63 (6.4%) | 90 (9.6%) |
| 35 to 64 Years | 24 (1.1%) | 14 (0.5%) |
| 65 to 74 Years | 25 (8.1%) | 46 (9.0%) |
| 75 Years and over | 21 (10.3%) | 26 (7.7%) |
Disability Class: Ambulatory Difficulty
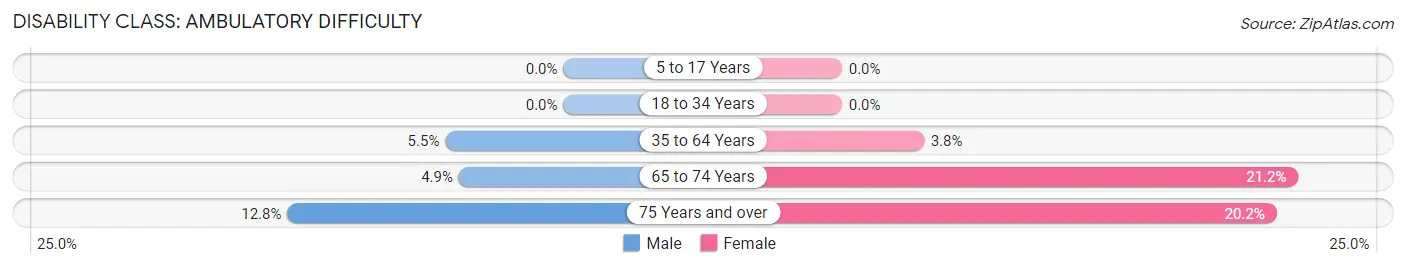
| Age Bracket | Male | Female |
| 5 to 17 Years | 0 (0.0%) | 0 (0.0%) |
| 18 to 34 Years | 0 (0.0%) | 0 (0.0%) |
| 35 to 64 Years | 116 (5.5%) | 98 (3.8%) |
| 65 to 74 Years | 15 (4.9%) | 108 (21.2%) |
| 75 Years and over | 26 (12.8%) | 68 (20.2%) |
Disability Class: Self-Care Difficulty
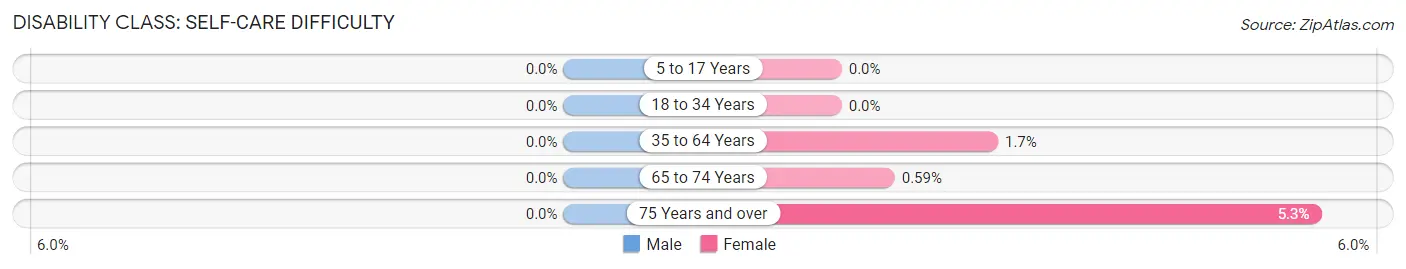
| Age Bracket | Male | Female |
| 5 to 17 Years | 0 (0.0%) | 0 (0.0%) |
| 18 to 34 Years | 0 (0.0%) | 0 (0.0%) |
| 35 to 64 Years | 0 (0.0%) | 45 (1.7%) |
| 65 to 74 Years | 0 (0.0%) | 3 (0.6%) |
| 75 Years and over | 0 (0.0%) | 18 (5.3%) |
Technology Access in Marlton
Computing Device Access in Marlton
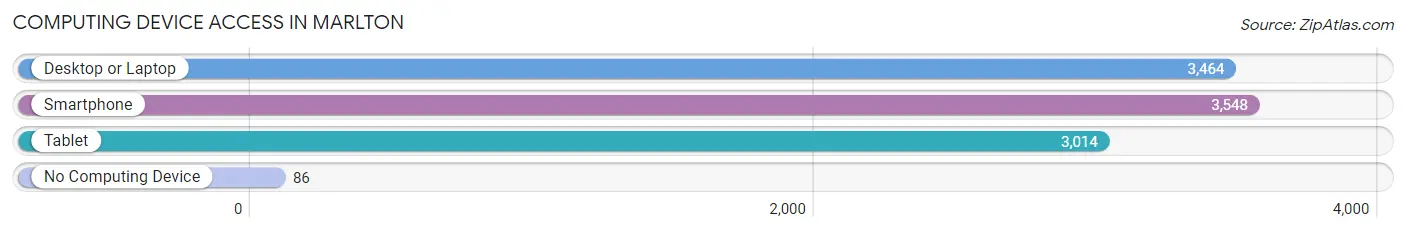
| Device Type | # Households | % Households |
| Desktop or Laptop | 3,464 | 91.4% |
| Smartphone | 3,548 | 93.6% |
| Tablet | 3,014 | 79.5% |
| No Computing Device | 86 | 2.3% |
| Total | 3,789 | 100.0% |
Internet Access in Marlton
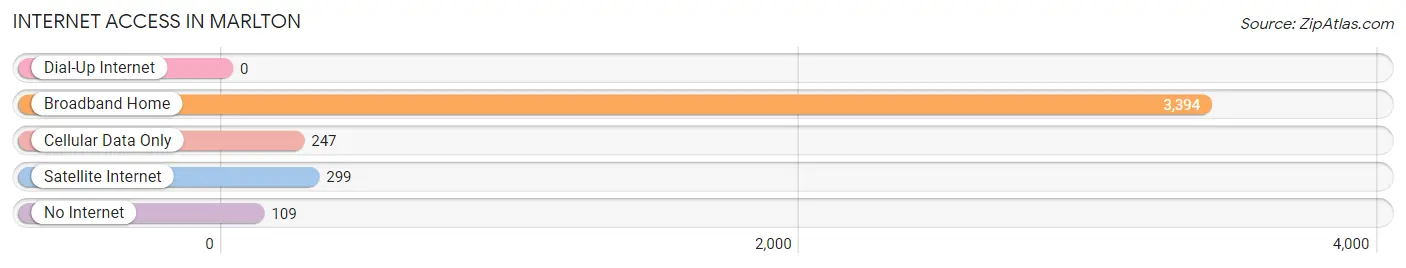
| Internet Type | # Households | % Households |
| Dial-Up Internet | 0 | 0.0% |
| Broadband Home | 3,394 | 89.6% |
| Cellular Data Only | 247 | 6.5% |
| Satellite Internet | 299 | 7.9% |
| No Internet | 109 | 2.9% |
| Total | 3,789 | 100.0% |
Marlton Summary
Marlton is an unincorporated community located in Prince George’s County, Maryland, United States. It is located approximately 20 miles east of Washington, D.C. and is part of the Washington metropolitan area. Marlton is a small, rural community with a population of approximately 2,000 people.
History
Marlton was first settled in the late 1700s by a group of Quakers from Pennsylvania. The community was named after the Marlton family, who were among the first settlers. The Marlton family owned a large tract of land in the area, which was used for farming and timber production. The community grew slowly over the years, and by the early 1900s, it had become a small farming community.
In the 1950s, Marlton began to experience rapid growth as the Washington metropolitan area expanded. The community was annexed by Prince George’s County in 1957, and the population increased significantly over the next few decades. Today, Marlton is a small, rural community with a population of approximately 2,000 people.
Geography
Marlton is located in Prince George’s County, Maryland, approximately 20 miles east of Washington, D.C. The community is situated on the western edge of the Patuxent River, which forms the border between Prince George’s County and Anne Arundel County. Marlton is bordered by the communities of Brandywine, Cheltenham, and Aquasco.
The terrain of Marlton is mostly flat, with some rolling hills. The area is heavily forested, with a mix of deciduous and evergreen trees. The climate is humid subtropical, with hot, humid summers and mild winters.
Economy
Marlton is a small, rural community with a limited economy. The primary industries in the area are agriculture and timber production. The community is home to several small farms, which produce a variety of crops, including corn, soybeans, and hay. The timber industry is also important to the local economy, with several sawmills located in the area.
In addition to agriculture and timber production, Marlton is home to several small businesses, including restaurants, convenience stores, and auto repair shops. The community is also home to a few small manufacturing companies, which produce a variety of products, including furniture and clothing.
Demographics
As of the 2010 census, Marlton had a population of 2,000 people. The racial makeup of the community was 79.2% White, 14.2% African American, 0.7% Native American, 0.7% Asian, and 4.9% from other races. The median household income was $50,000, and the median home value was $200,000.
Marlton is a small, rural community with a diverse population. The community is home to a variety of religious denominations, including Baptist, Methodist, and Catholic. The community is also home to a variety of cultural and recreational activities, including festivals, fairs, and outdoor activities.
Common Questions
What is Per Capita Income in Marlton?
Per Capita income in Marlton is $55,918.
What is the Median Family Income in Marlton?
Median Family Income in Marlton is $141,842.
What is the Median Household income in Marlton?
Median Household Income in Marlton is $118,087.
What is Income or Wage Gap in Marlton?
Income or Wage Gap in Marlton is 28.8%.
Women in Marlton earn 71.2 cents for every dollar earned by a man.
What is Inequality or Gini Index in Marlton?
Inequality or Gini Index in Marlton is 0.38.
What is the Total Population of Marlton?
Total Population of Marlton is 10,168.
What is the Total Male Population of Marlton?
Total Male Population of Marlton is 4,596.
What is the Total Female Population of Marlton?
Total Female Population of Marlton is 5,572.
What is the Ratio of Males per 100 Females in Marlton?
There are 82.48 Males per 100 Females in Marlton.
What is the Ratio of Females per 100 Males in Marlton?
There are 121.24 Females per 100 Males in Marlton.
What is the Median Population Age in Marlton?
Median Population Age in Marlton is 43.1 Years.
What is the Average Family Size in Marlton
Average Family Size in Marlton is 3.3 People.
What is the Average Household Size in Marlton
Average Household Size in Marlton is 2.7 People.
How Large is the Labor Force in Marlton?
There are 6,207 People in the Labor Forcein in Marlton.
What is the Percentage of People in the Labor Force in Marlton?
74.1% of People are in the Labor Force in Marlton.
What is the Unemployment Rate in Marlton?
Unemployment Rate in Marlton is 4.2%.