Shaft, MD Map & Demographics
Shaft Map
Shaft Overview
$59,750
PER CAPITA INCOME
$178,145
AVG FAMILY INCOME
5.5%
WAGE / INCOME GAP [ % ]
94.5¢/ $1
WAGE / INCOME GAP [ $ ]
0.49
INEQUALITY / GINI INDEX
281
TOTAL POPULATION
126
MALE POPULATION
155
FEMALE POPULATION
81.29
MALES / 100 FEMALES
123.02
FEMALES / 100 MALES
58.5
MEDIAN AGE
2.5
AVG FAMILY SIZE
2.1
AVG HOUSEHOLD SIZE
169
LABOR FORCE [ PEOPLE ]
65.3%
PERCENT IN LABOR FORCE
8.9%
UNEMPLOYMENT RATE
Income in Shaft
Income Overview in Shaft
| Characteristic | Number | Measure |
| Per Capita Income | 281 | $59,750 |
| Median Family Income | 88 | $178,145 |
| Mean Family Income | 88 | $172,997 |
| Median Household Income | 131 | $0 |
| Mean Household Income | 131 | $128,853 |
| Income Deficit | 88 | $0 |
| Wage / Income Gap (%) | 281 | 5.45% |
| Wage / Income Gap ($) | 281 | 94.55¢ per $1 |
| Gini / Inequality Index | 281 | 0.49 |
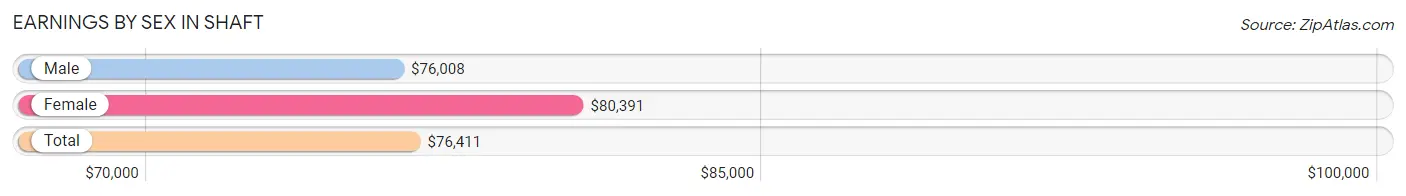
Earnings by Sex in Shaft
Average Earnings in Shaft are $76,411, $76,008 for men and $80,391 for women, a difference of 5.4%.
| Sex | Number | Average Earnings |
| Male | 79 (46.2%) | $76,008 |
| Female | 92 (53.8%) | $80,391 |
| Total | 171 (100.0%) | $76,411 |
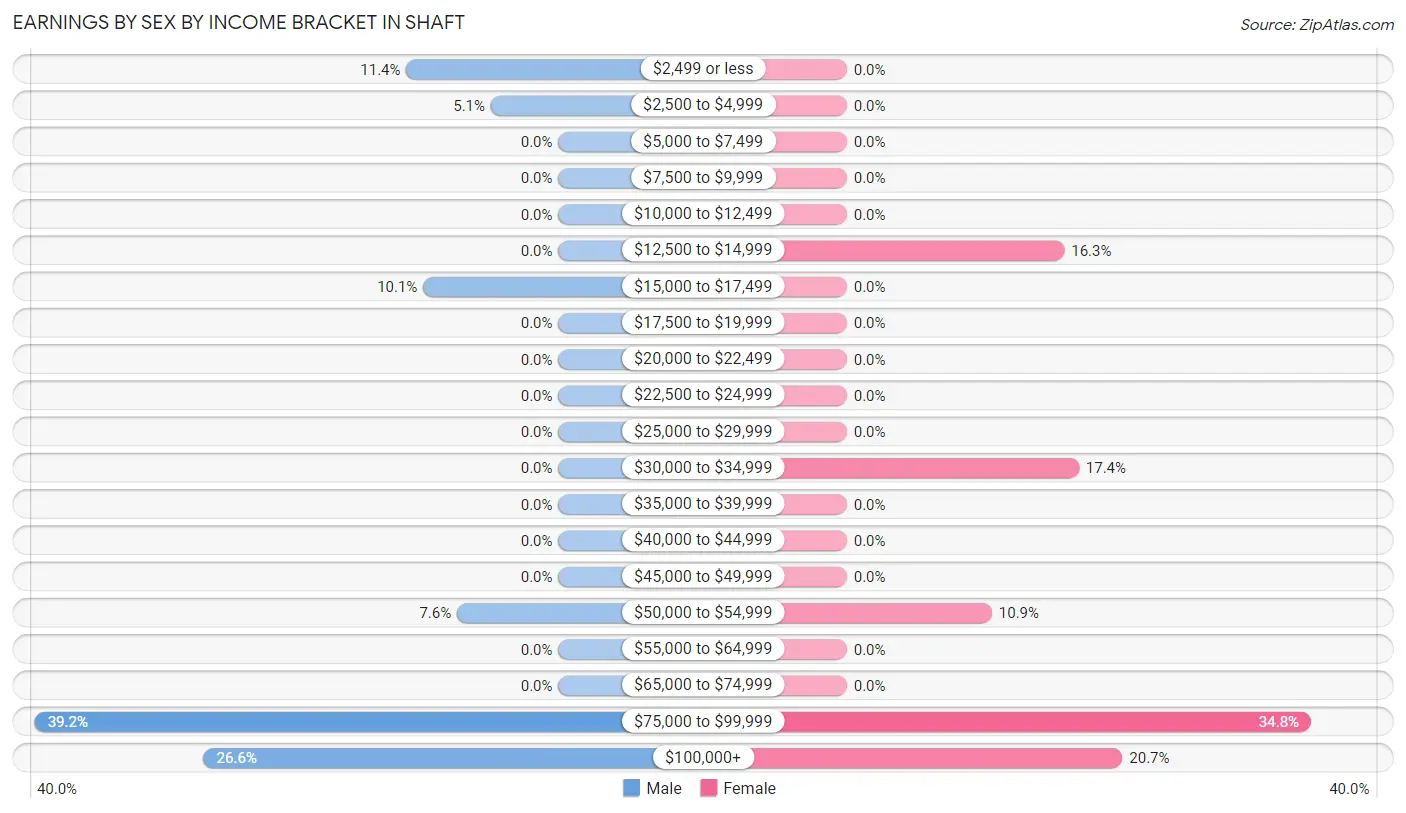
Earnings by Sex by Income Bracket in Shaft
The most common earnings brackets in Shaft are $75,000 to $99,999 for men (31 | 39.2%) and $75,000 to $99,999 for women (32 | 34.8%).
| Income | Male | Female |
| $2,499 or less | 9 (11.4%) | 0 (0.0%) |
| $2,500 to $4,999 | 4 (5.1%) | 0 (0.0%) |
| $5,000 to $7,499 | 0 (0.0%) | 0 (0.0%) |
| $7,500 to $9,999 | 0 (0.0%) | 0 (0.0%) |
| $10,000 to $12,499 | 0 (0.0%) | 0 (0.0%) |
| $12,500 to $14,999 | 0 (0.0%) | 15 (16.3%) |
| $15,000 to $17,499 | 8 (10.1%) | 0 (0.0%) |
| $17,500 to $19,999 | 0 (0.0%) | 0 (0.0%) |
| $20,000 to $22,499 | 0 (0.0%) | 0 (0.0%) |
| $22,500 to $24,999 | 0 (0.0%) | 0 (0.0%) |
| $25,000 to $29,999 | 0 (0.0%) | 0 (0.0%) |
| $30,000 to $34,999 | 0 (0.0%) | 16 (17.4%) |
| $35,000 to $39,999 | 0 (0.0%) | 0 (0.0%) |
| $40,000 to $44,999 | 0 (0.0%) | 0 (0.0%) |
| $45,000 to $49,999 | 0 (0.0%) | 0 (0.0%) |
| $50,000 to $54,999 | 6 (7.6%) | 10 (10.9%) |
| $55,000 to $64,999 | 0 (0.0%) | 0 (0.0%) |
| $65,000 to $74,999 | 0 (0.0%) | 0 (0.0%) |
| $75,000 to $99,999 | 31 (39.2%) | 32 (34.8%) |
| $100,000+ | 21 (26.6%) | 19 (20.6%) |
| Total | 79 (100.0%) | 92 (100.0%) |
Earnings by Sex by Educational Attainment in Shaft
| Educational Attainment | Male Income | Female Income |
| Less than High School | - | - |
| High School Diploma | - | - |
| College or Associate's Degree | - | - |
| Bachelor's Degree | - | - |
| Graduate Degree | - | - |
| Total | $76,008 | $80,664 |
Family Income in Shaft
Family Income Brackets in Shaft
According to the Shaft family income data, there are 31 families falling into the $150,000 to $199,999 income range, which is the most common income bracket and makes up 35.2% of all families.
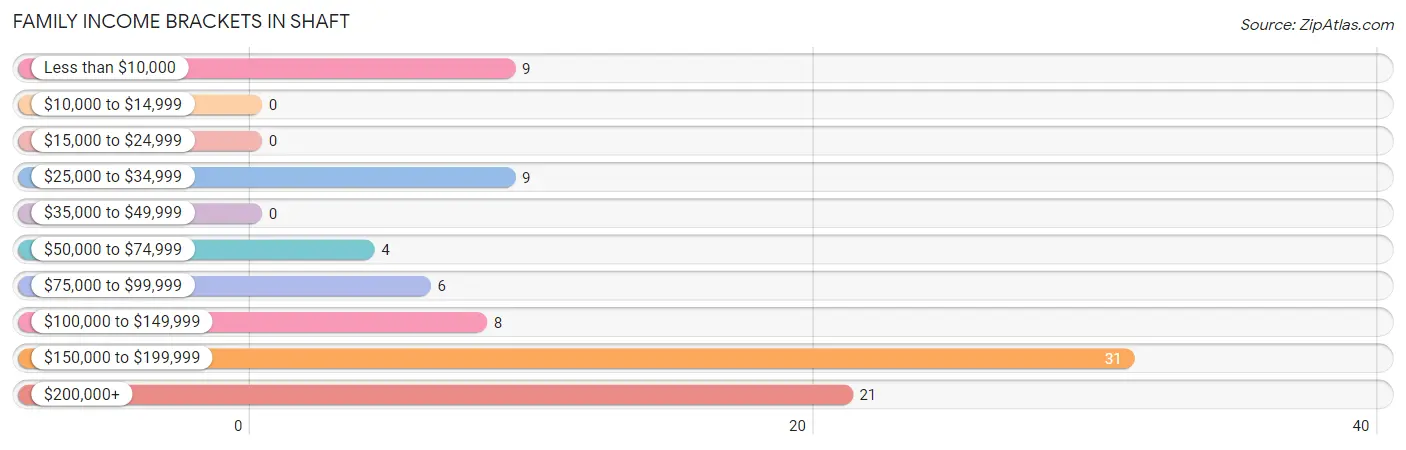
| Income Bracket | # Families | % Families |
| Less than $10,000 | 9 | 10.2% |
| $10,000 to $14,999 | 0 | 0.0% |
| $15,000 to $24,999 | 0 | 0.0% |
| $25,000 to $34,999 | 9 | 10.2% |
| $35,000 to $49,999 | 0 | 0.0% |
| $50,000 to $74,999 | 4 | 4.5% |
| $75,000 to $99,999 | 6 | 6.8% |
| $100,000 to $149,999 | 8 | 9.1% |
| $150,000 to $199,999 | 31 | 35.2% |
| $200,000+ | 21 | 23.9% |
Family Income by Famaliy Size in Shaft
2-person families (74 | 84.1%) account for the highest median family income in Shaft with $178,710 per family, while 2-person families (74 | 84.1%) have the highest median income of $89,355 per family member.
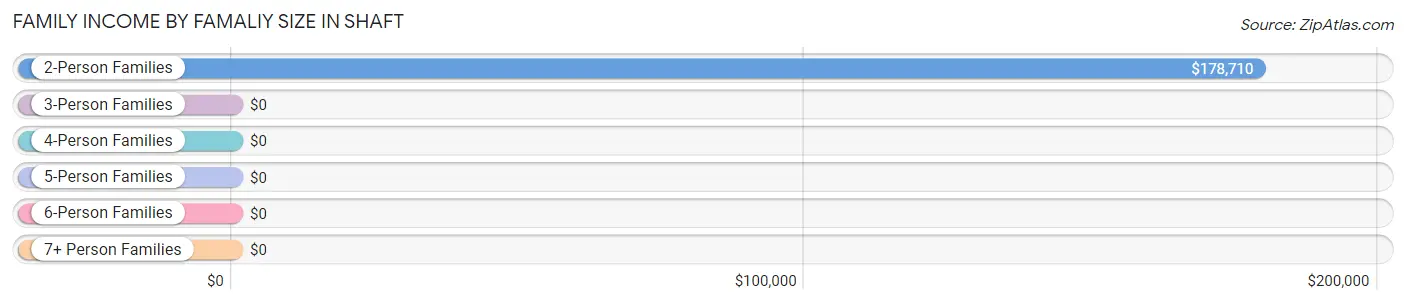
| Income Bracket | # Families | Median Income |
| 2-Person Families | 74 (84.1%) | $178,710 |
| 3-Person Families | 0 (0.0%) | $0 |
| 4-Person Families | 8 (9.1%) | $0 |
| 5-Person Families | 6 (6.8%) | $0 |
| 6-Person Families | 0 (0.0%) | $0 |
| 7+ Person Families | 0 (0.0%) | $0 |
| Total | 88 (100.0%) | $178,145 |
Family Income by Number of Earners in Shaft
| Number of Earners | # Families | Median Income |
| No Earners | 9 (10.2%) | $0 |
| 1 Earner | 21 (23.9%) | $0 |
| 2 Earners | 52 (59.1%) | $0 |
| 3+ Earners | 6 (6.8%) | $0 |
| Total | 88 (100.0%) | $178,145 |
Household Income in Shaft
Household Income Brackets in Shaft
With 31 households falling in the category, the $150,000 to $199,999 income range is the most frequent in Shaft, accounting for 23.7% of all households.
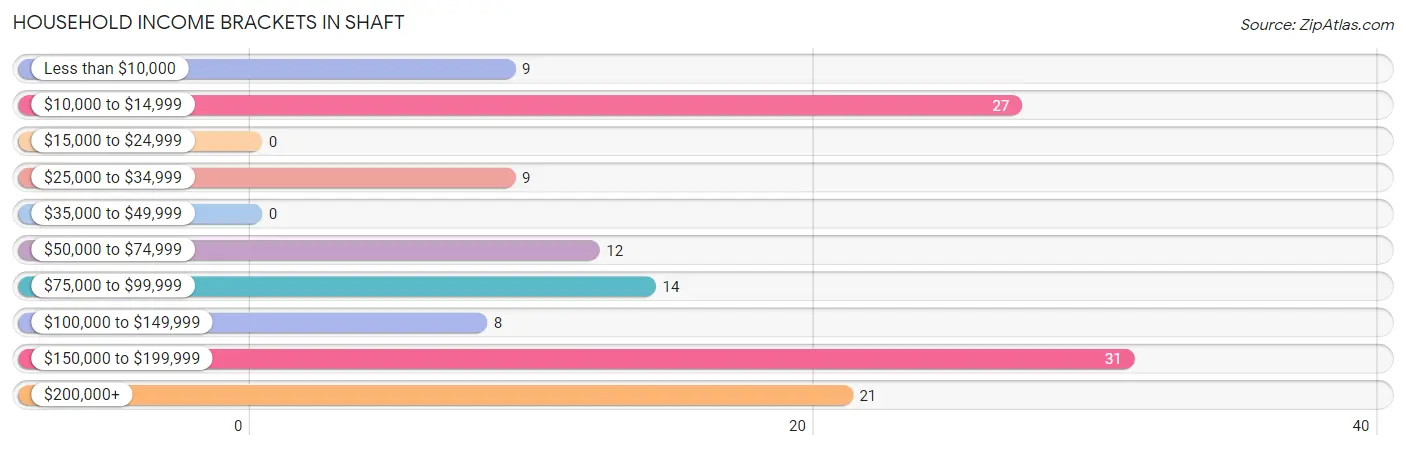
| Income Bracket | # Households | % Households |
| Less than $10,000 | 9 | 6.9% |
| $10,000 to $14,999 | 27 | 20.6% |
| $15,000 to $24,999 | 0 | 0.0% |
| $25,000 to $34,999 | 9 | 6.9% |
| $35,000 to $49,999 | 0 | 0.0% |
| $50,000 to $74,999 | 12 | 9.2% |
| $75,000 to $99,999 | 14 | 10.7% |
| $100,000 to $149,999 | 8 | 6.1% |
| $150,000 to $199,999 | 31 | 23.7% |
| $200,000+ | 21 | 16.0% |
Household Income by Householder Age in Shaft
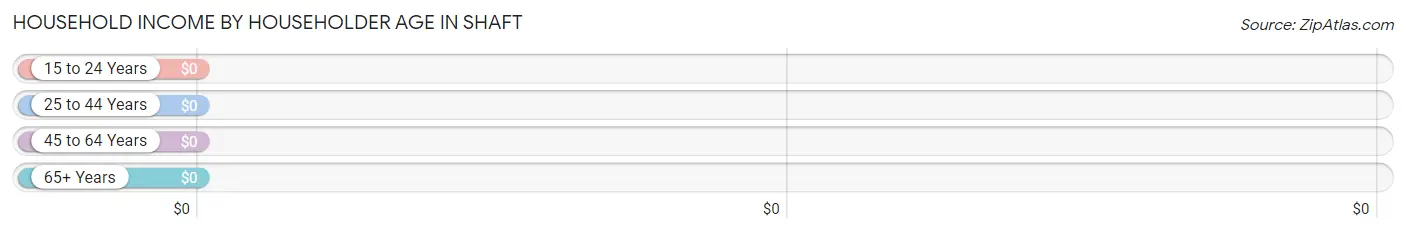
| Income Bracket | # Households | Median Income |
| 15 to 24 Years | 0 (0.0%) | $0 |
| 25 to 44 Years | 0 (0.0%) | $0 |
| 45 to 64 Years | 111 (84.7%) | $0 |
| 65+ Years | 20 (15.3%) | $0 |
| Total | 131 (100.0%) | $0 |
Poverty in Shaft
Income Below Poverty by Sex and Age in Shaft
With 7.1% poverty level for males and 21.9% for females among the residents of Shaft, 55 to 64 year old males and 55 to 64 year old females are the most vulnerable to poverty, with 9 males (10.7%) and 27 females (55.1%) in their respective age groups living below the poverty level.
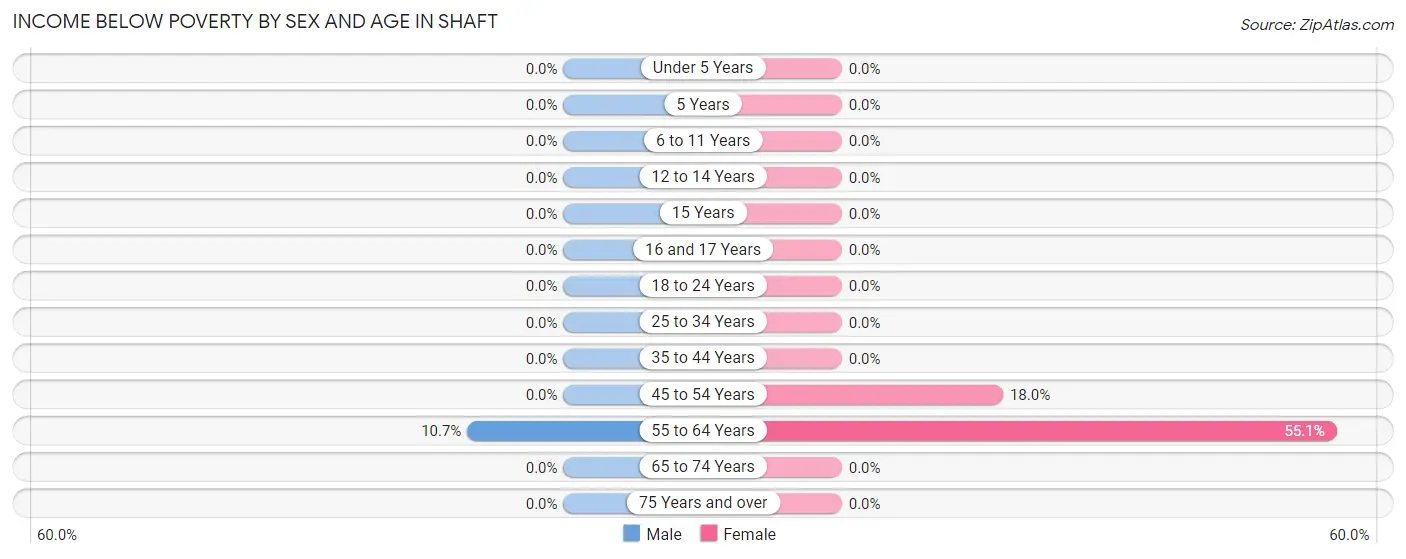
| Age Bracket | Male | Female |
| Under 5 Years | 0 (0.0%) | 0 (0.0%) |
| 5 Years | 0 (0.0%) | 0 (0.0%) |
| 6 to 11 Years | 0 (0.0%) | 0 (0.0%) |
| 12 to 14 Years | 0 (0.0%) | 0 (0.0%) |
| 15 Years | 0 (0.0%) | 0 (0.0%) |
| 16 and 17 Years | 0 (0.0%) | 0 (0.0%) |
| 18 to 24 Years | 0 (0.0%) | 0 (0.0%) |
| 25 to 34 Years | 0 (0.0%) | 0 (0.0%) |
| 35 to 44 Years | 0 (0.0%) | 0 (0.0%) |
| 45 to 54 Years | 0 (0.0%) | 7 (17.9%) |
| 55 to 64 Years | 9 (10.7%) | 27 (55.1%) |
| 65 to 74 Years | 0 (0.0%) | 0 (0.0%) |
| 75 Years and over | 0 (0.0%) | 0 (0.0%) |
| Total | 9 (7.1%) | 34 (21.9%) |
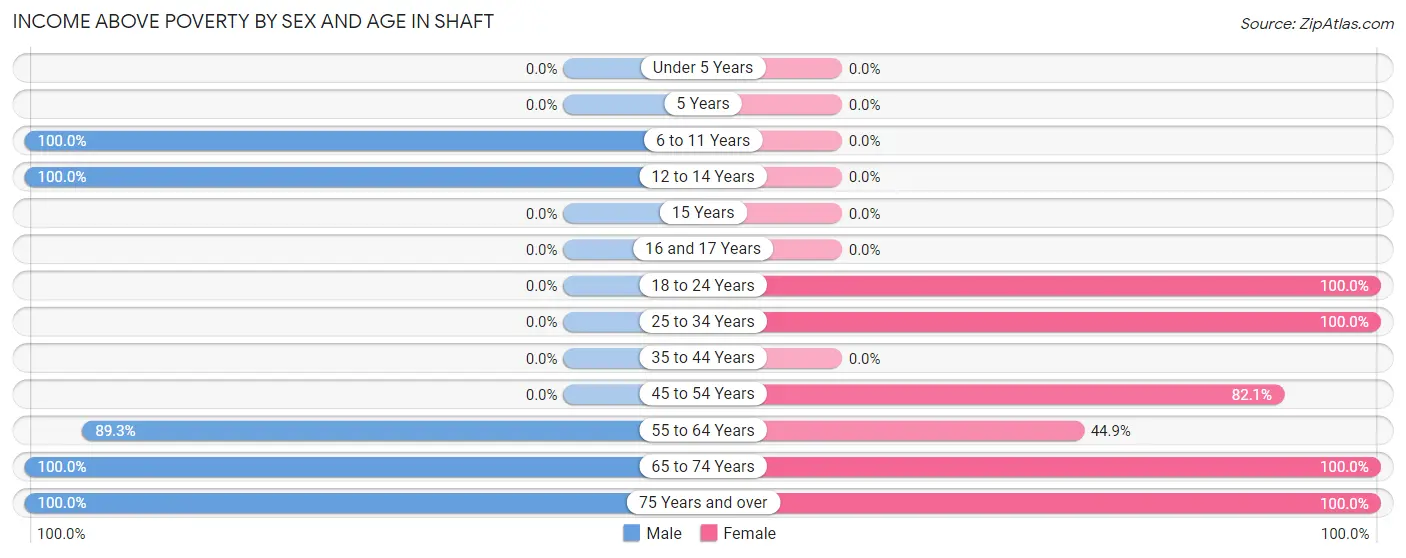
Income Above Poverty by Sex and Age in Shaft
According to the poverty statistics in Shaft, males aged 6 to 11 years and females aged 18 to 24 years are the age groups that are most secure financially, with 100.0% of males and 100.0% of females in these age groups living above the poverty line.
| Age Bracket | Male | Female |
| Under 5 Years | 0 (0.0%) | 0 (0.0%) |
| 5 Years | 0 (0.0%) | 0 (0.0%) |
| 6 to 11 Years | 8 (100.0%) | 0 (0.0%) |
| 12 to 14 Years | 14 (100.0%) | 0 (0.0%) |
| 15 Years | 0 (0.0%) | 0 (0.0%) |
| 16 and 17 Years | 0 (0.0%) | 0 (0.0%) |
| 18 to 24 Years | 0 (0.0%) | 7 (100.0%) |
| 25 to 34 Years | 0 (0.0%) | 18 (100.0%) |
| 35 to 44 Years | 0 (0.0%) | 0 (0.0%) |
| 45 to 54 Years | 0 (0.0%) | 32 (82.1%) |
| 55 to 64 Years | 75 (89.3%) | 22 (44.9%) |
| 65 to 74 Years | 8 (100.0%) | 29 (100.0%) |
| 75 Years and over | 12 (100.0%) | 13 (100.0%) |
| Total | 117 (92.9%) | 121 (78.1%) |
Income Below Poverty Among Married-Couple Families in Shaft
The poverty statistics for married-couple families in Shaft show that 10.2% or 9 of the total 88 families live below the poverty line. Families with no children have the highest poverty rate of 12.2%, comprising of 9 families. On the other hand, families with 1 or 2 children have the lowest poverty rate of 0.0%, which includes 0 families.
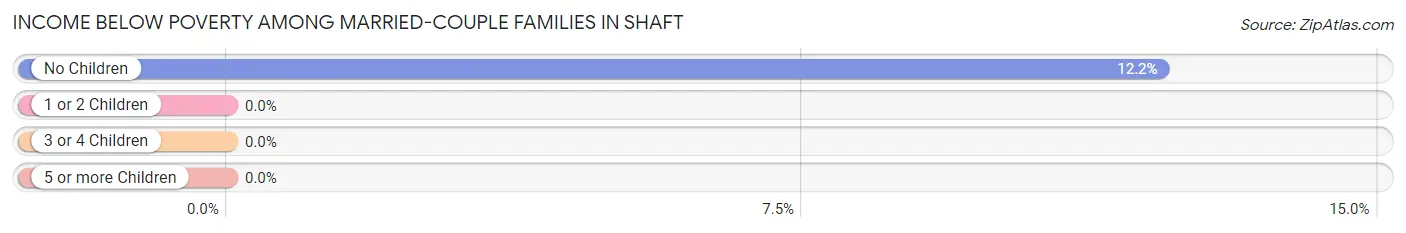
| Children | Above Poverty | Below Poverty |
| No Children | 65 (87.8%) | 9 (12.2%) |
| 1 or 2 Children | 14 (100.0%) | 0 (0.0%) |
| 3 or 4 Children | 0 (0.0%) | 0 (0.0%) |
| 5 or more Children | 0 (0.0%) | 0 (0.0%) |
| Total | 79 (89.8%) | 9 (10.2%) |
Income Below Poverty Among Single-Parent Households in Shaft
| Children | Single Father | Single Mother |
| No Children | 0 (0.0%) | 0 (0.0%) |
| 1 or 2 Children | 0 (0.0%) | 0 (0.0%) |
| 3 or 4 Children | 0 (0.0%) | 0 (0.0%) |
| 5 or more Children | 0 (0.0%) | 0 (0.0%) |
| Total | 0 (0.0%) | 0 (0.0%) |
Income Below Poverty Among Married-Couple vs Single-Parent Households in Shaft
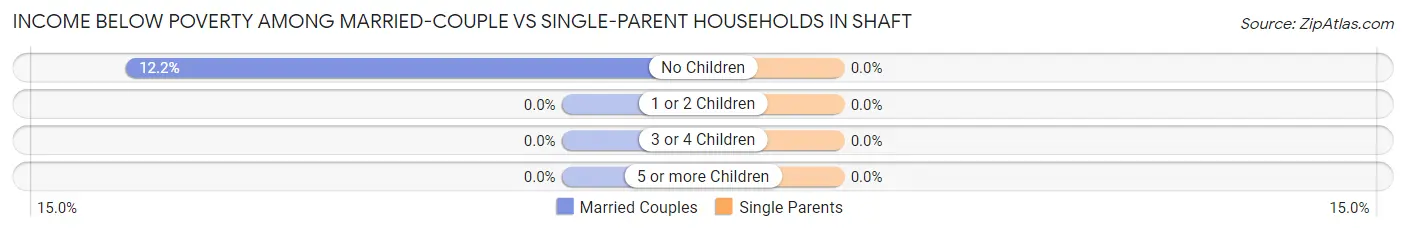
| Children | Married-Couple Families | Single-Parent Households |
| No Children | 9 (12.2%) | 0 (0.0%) |
| 1 or 2 Children | 0 (0.0%) | 0 (0.0%) |
| 3 or 4 Children | 0 (0.0%) | 0 (0.0%) |
| 5 or more Children | 0 (0.0%) | 0 (0.0%) |
| Total | 9 (10.2%) | 0 (0.0%) |
Race in Shaft
The most populous races in Shaft are , and White / Caucasian (281 | 100.0%).
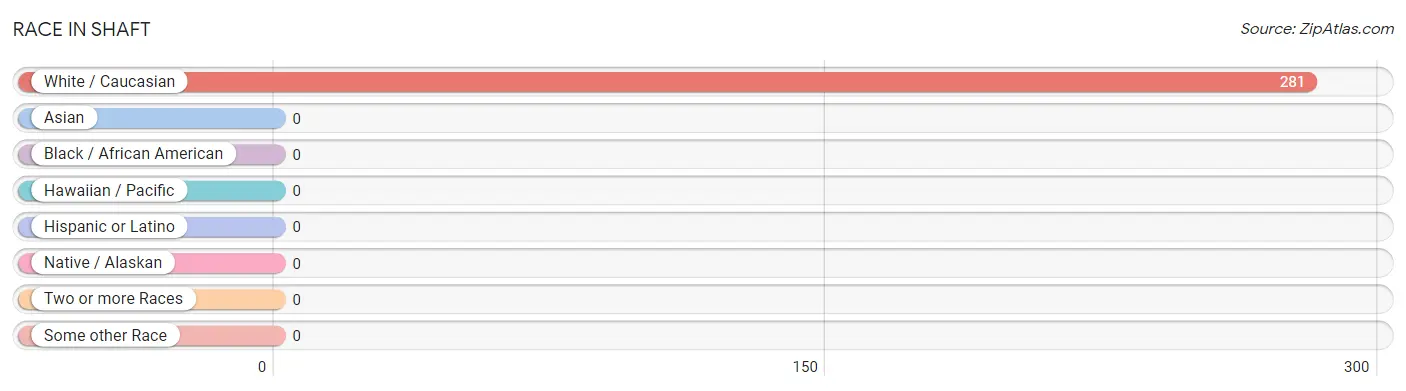
| Race | # Population | % Population |
| Asian | 0 | 0.0% |
| Black / African American | 0 | 0.0% |
| Hawaiian / Pacific | 0 | 0.0% |
| Hispanic or Latino | 0 | 0.0% |
| Native / Alaskan | 0 | 0.0% |
| White / Caucasian | 281 | 100.0% |
| Two or more Races | 0 | 0.0% |
| Some other Race | 0 | 0.0% |
| Total | 281 | 100.0% |
Ancestry in Shaft
The most populous ancestries reported in Shaft are German (80 | 28.5%), Irish (44 | 15.7%), Welsh (35 | 12.5%), English (28 | 10.0%), and American (9 | 3.2%), together accounting for 69.8% of all Shaft residents.
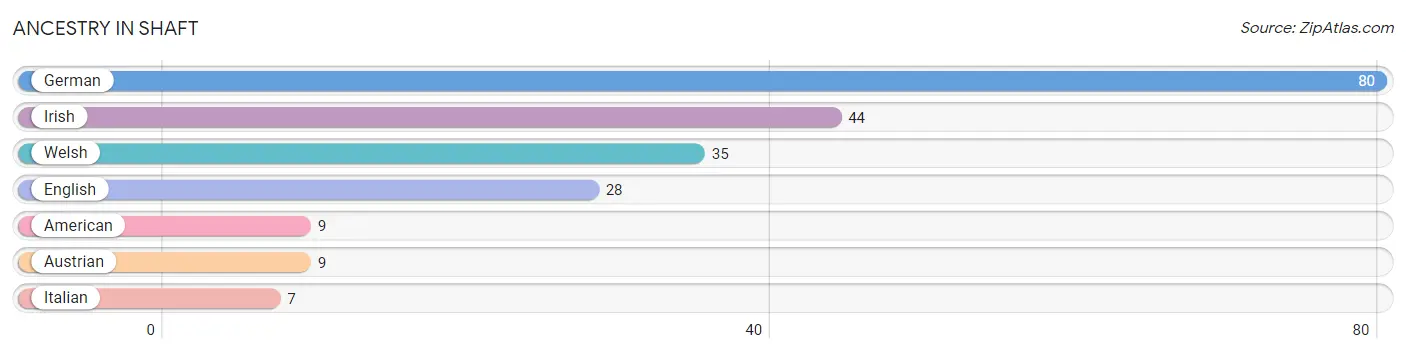
| Ancestry | # Population | % Population |
| American | 9 | 3.2% |
| Austrian | 9 | 3.2% |
| English | 28 | 10.0% |
| German | 80 | 28.5% |
| Irish | 44 | 15.7% |
| Italian | 7 | 2.5% |
| Welsh | 35 | 12.5% | View All 7 Rows |
Immigrants in Shaft

| Immigration Origin | # Population | % Population | View All 0 Rows |
Sex and Age in Shaft
Sex and Age in Shaft
The most populous age groups in Shaft are 60 to 64 Years (47 | 37.3%) for men and 55 to 59 Years (41 | 26.5%) for women.
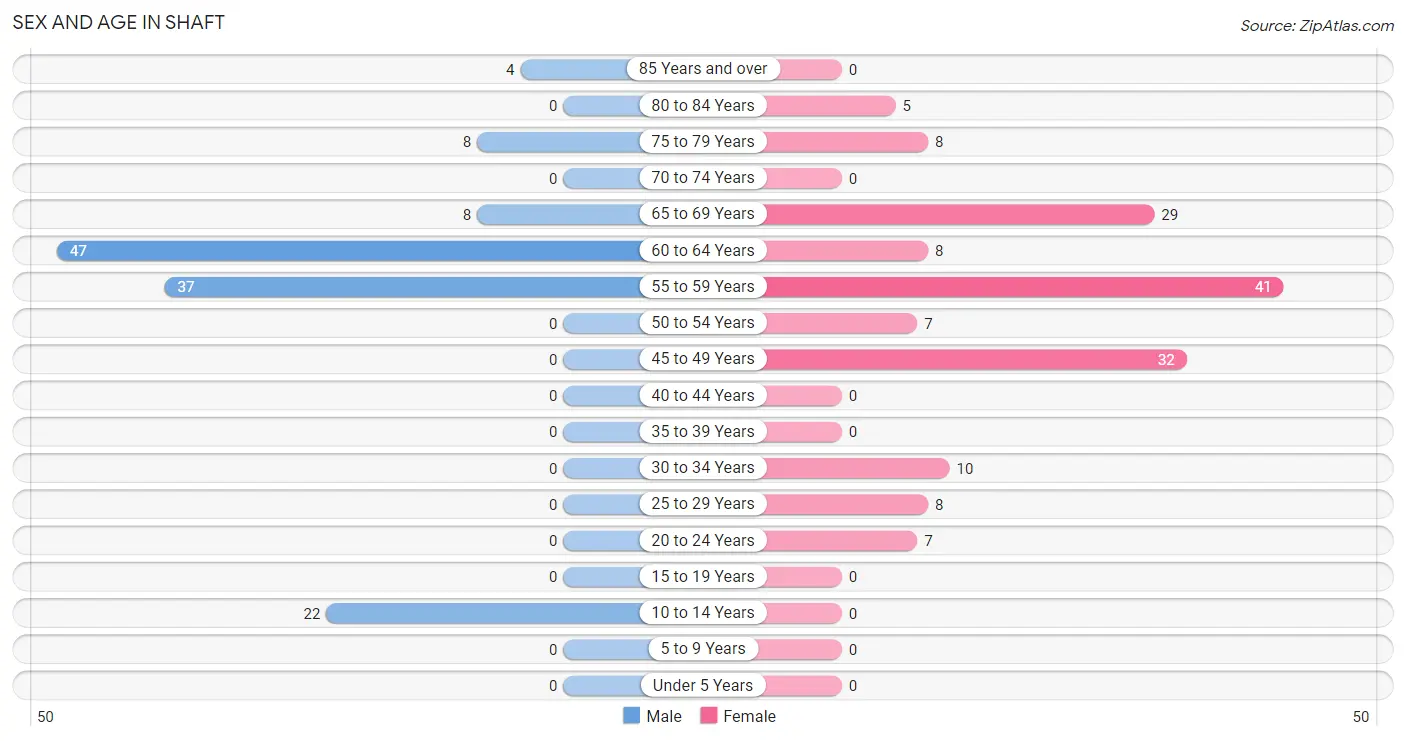
| Age Bracket | Male | Female |
| Under 5 Years | 0 (0.0%) | 0 (0.0%) |
| 5 to 9 Years | 0 (0.0%) | 0 (0.0%) |
| 10 to 14 Years | 22 (17.5%) | 0 (0.0%) |
| 15 to 19 Years | 0 (0.0%) | 0 (0.0%) |
| 20 to 24 Years | 0 (0.0%) | 7 (4.5%) |
| 25 to 29 Years | 0 (0.0%) | 8 (5.2%) |
| 30 to 34 Years | 0 (0.0%) | 10 (6.5%) |
| 35 to 39 Years | 0 (0.0%) | 0 (0.0%) |
| 40 to 44 Years | 0 (0.0%) | 0 (0.0%) |
| 45 to 49 Years | 0 (0.0%) | 32 (20.6%) |
| 50 to 54 Years | 0 (0.0%) | 7 (4.5%) |
| 55 to 59 Years | 37 (29.4%) | 41 (26.5%) |
| 60 to 64 Years | 47 (37.3%) | 8 (5.2%) |
| 65 to 69 Years | 8 (6.4%) | 29 (18.7%) |
| 70 to 74 Years | 0 (0.0%) | 0 (0.0%) |
| 75 to 79 Years | 8 (6.4%) | 8 (5.2%) |
| 80 to 84 Years | 0 (0.0%) | 5 (3.2%) |
| 85 Years and over | 4 (3.2%) | 0 (0.0%) |
| Total | 126 (100.0%) | 155 (100.0%) |
Families and Households in Shaft
Median Family Size in Shaft
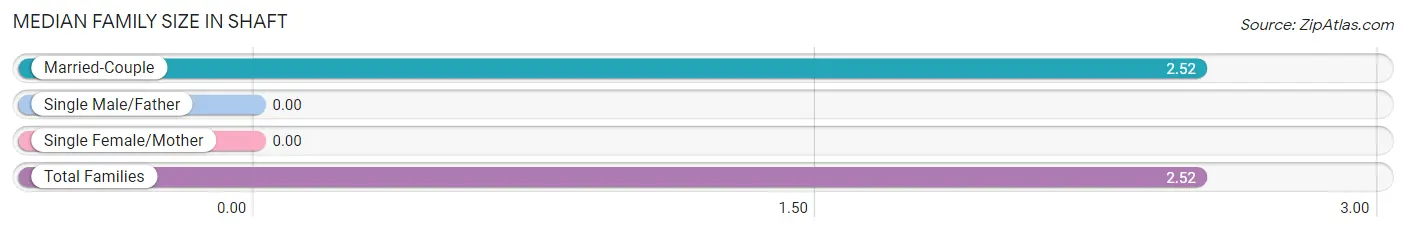
| Family Type | # Families | Family Size |
| Married-Couple | 88 (100.0%) | 2.52 |
| Single Male/Father | 0 (0.0%) | - |
| Single Female/Mother | 0 (0.0%) | - |
| Total Families | 88 (100.0%) | 2.52 |
Median Household Size in Shaft
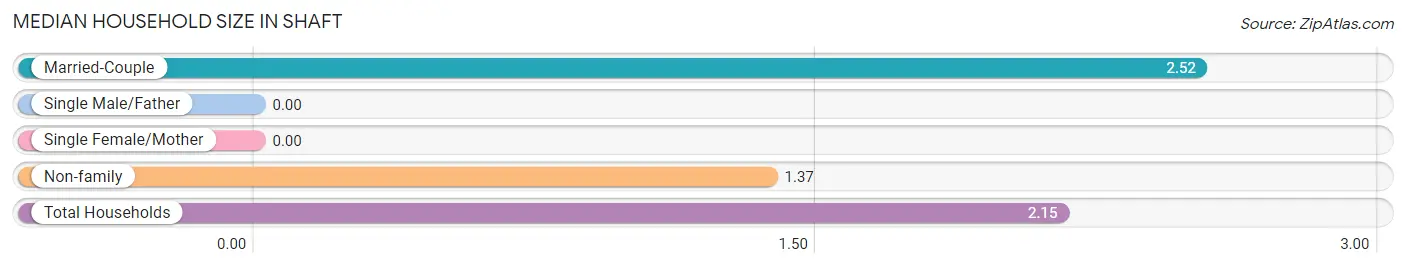
| Household Type | # Households | Household Size |
| Married-Couple | 88 (67.2%) | 2.52 |
| Single Male/Father | 0 (0.0%) | - |
| Single Female/Mother | 0 (0.0%) | - |
| Non-family | 43 (32.8%) | 1.37 |
| Total Households | 131 (100.0%) | 2.15 |
Household Size by Marriage Status in Shaft
Out of a total of 131 households in Shaft, 88 (67.2%) are family households, while 43 (32.8%) are nonfamily households. The most numerous type of family households are 2-person households, comprising 74, and the most common type of nonfamily households are 1-person households, comprising 27.
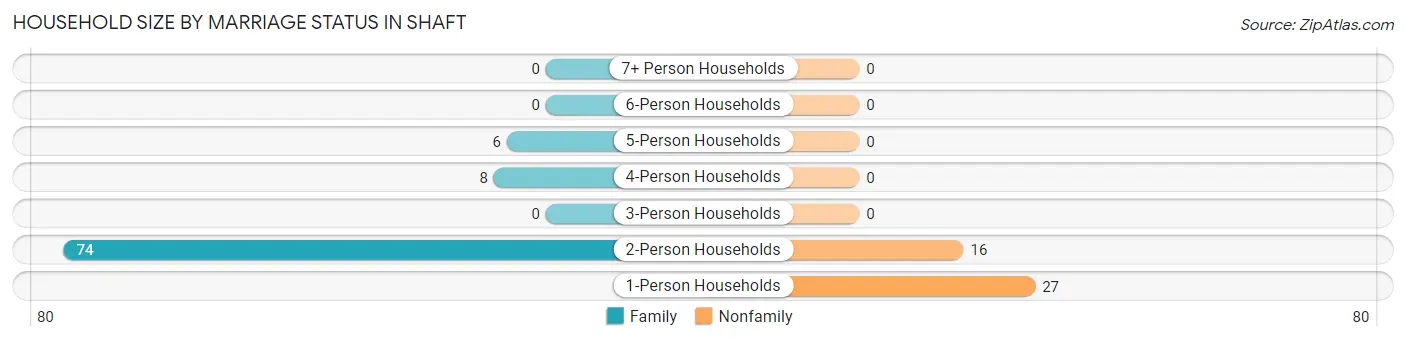
| Household Size | Family Households | Nonfamily Households |
| 1-Person Households | - | 27 (20.6%) |
| 2-Person Households | 74 (56.5%) | 16 (12.2%) |
| 3-Person Households | 0 (0.0%) | 0 (0.0%) |
| 4-Person Households | 8 (6.1%) | 0 (0.0%) |
| 5-Person Households | 6 (4.6%) | 0 (0.0%) |
| 6-Person Households | 0 (0.0%) | 0 (0.0%) |
| 7+ Person Households | 0 (0.0%) | 0 (0.0%) |
| Total | 88 (67.2%) | 43 (32.8%) |
Female Fertility in Shaft
Fertility by Age in Shaft
Average fertility rate in Shaft is 140.0 births per 1,000 women. Women in the age bracket of 20 to 34 years have the highest fertility rate with 320.0 births per 1,000 women. Women in the age bracket of 20 to 34 years acount for 100.0% of all women with births.
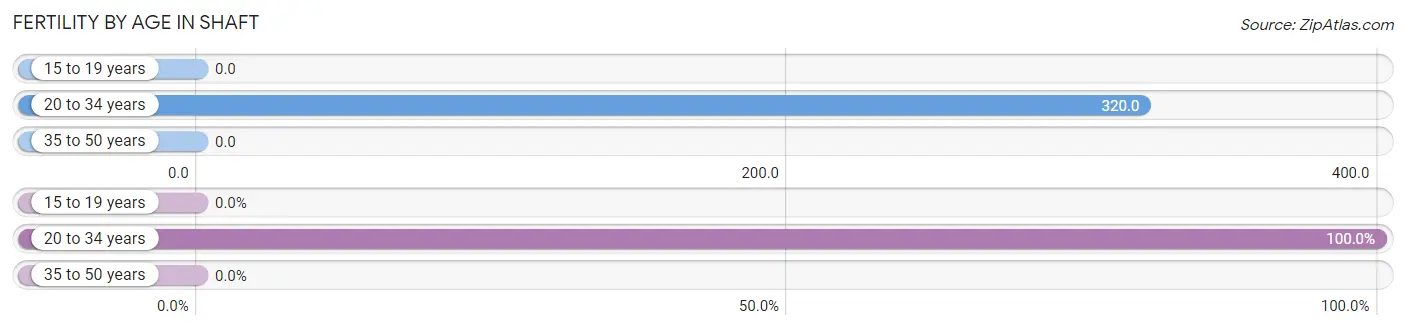
| Age Bracket | Women with Births | Births / 1,000 Women |
| 15 to 19 years | 0 (0.0%) | 0.0 |
| 20 to 34 years | 8 (100.0%) | 320.0 |
| 35 to 50 years | 0 (0.0%) | 0.0 |
| Total | 8 (100.0%) | 140.0 |
Fertility by Age by Marriage Status in Shaft
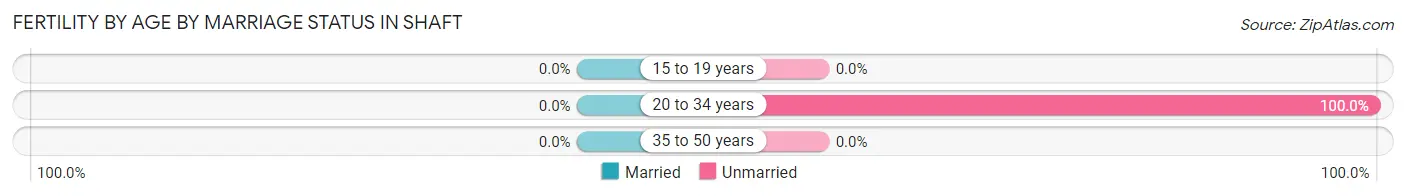
| Age Bracket | Married | Unmarried |
| 15 to 19 years | 0 (0.0%) | 0 (0.0%) |
| 20 to 34 years | 0 (0.0%) | 8 (100.0%) |
| 35 to 50 years | 0 (0.0%) | 0 (0.0%) |
| Total | 0 (0.0%) | 8 (100.0%) |
Fertility by Education in Shaft
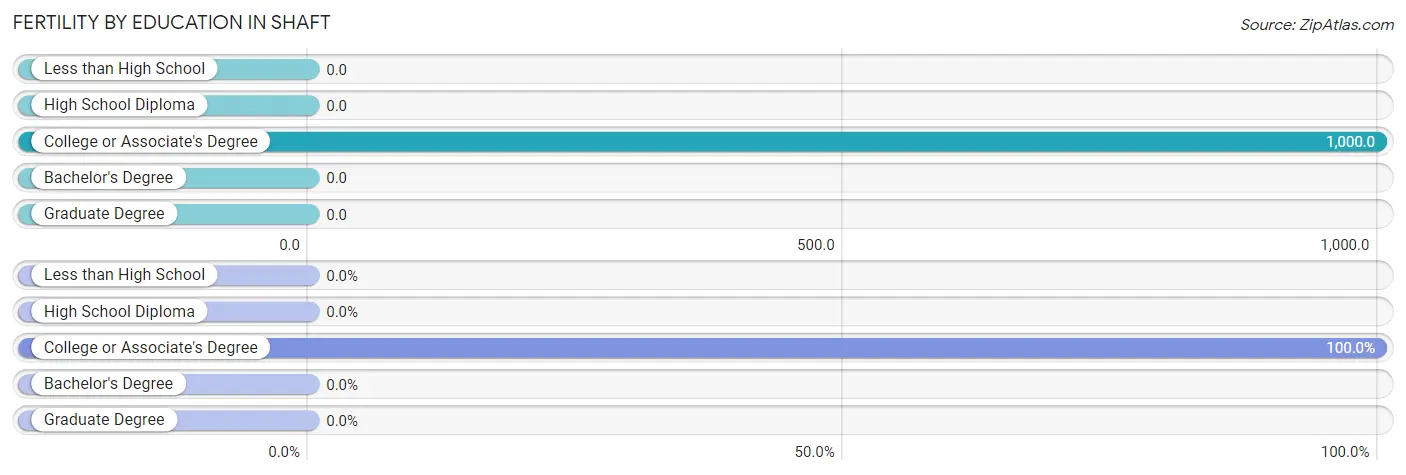
| Educational Attainment | Women with Births | Births / 1,000 Women |
| Less than High School | 0 (0.0%) | 0.0 |
| High School Diploma | 0 (0.0%) | 0.0 |
| College or Associate's Degree | 8 (100.0%) | 1,000.0 |
| Bachelor's Degree | 0 (0.0%) | 0.0 |
| Graduate Degree | 0 (0.0%) | 0.0 |
| Total | 8 (100.0%) | 140.0 |
Fertility by Education by Marriage Status in Shaft
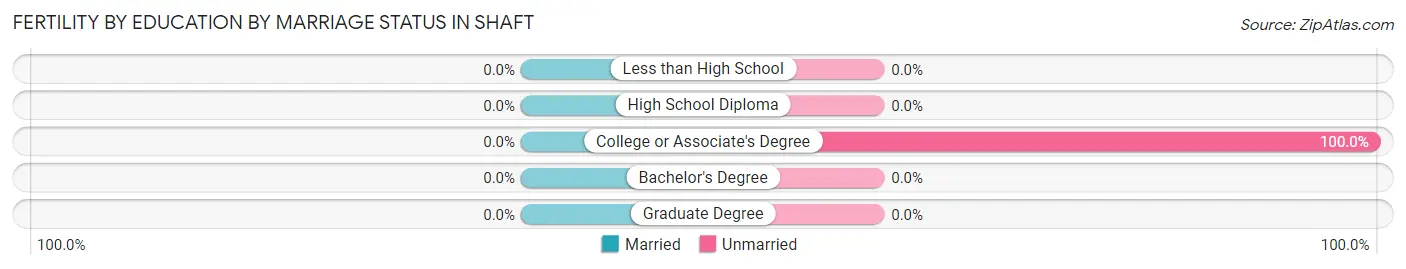
| Educational Attainment | Married | Unmarried |
| Less than High School | 0 (0.0%) | 0 (0.0%) |
| High School Diploma | 0 (0.0%) | 0 (0.0%) |
| College or Associate's Degree | 0 (0.0%) | 8 (100.0%) |
| Bachelor's Degree | 0 (0.0%) | 0 (0.0%) |
| Graduate Degree | 0 (0.0%) | 0 (0.0%) |
| Total | 0 (0.0%) | 8 (100.0%) |
Employment Characteristics in Shaft
Employment by Class of Employer in Shaft
Among the 154 employed individuals in Shaft, local government employees (55 | 35.7%), federal government employees (40 | 26.0%), and state government employees (32 | 20.8%) make up the most common classes of employment.
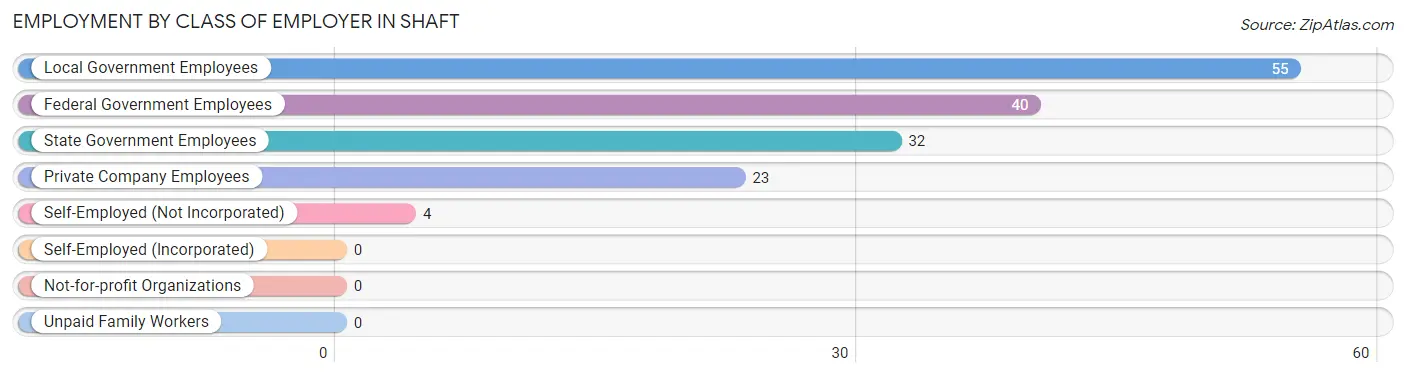
| Employer Class | # Employees | % Employees |
| Private Company Employees | 23 | 14.9% |
| Self-Employed (Incorporated) | 0 | 0.0% |
| Self-Employed (Not Incorporated) | 4 | 2.6% |
| Not-for-profit Organizations | 0 | 0.0% |
| Local Government Employees | 55 | 35.7% |
| State Government Employees | 32 | 20.8% |
| Federal Government Employees | 40 | 26.0% |
| Unpaid Family Workers | 0 | 0.0% |
| Total | 154 | 100.0% |
Employment Status by Age in Shaft
According to the labor force statistics for Shaft, out of the total population over 16 years of age (259), 65.3% or 169 individuals are in the labor force, with 8.9% or 15 of them unemployed. The age group with the highest labor force participation rate is 20 to 24 years, with 100.0% or 7 individuals in the labor force. Within the labor force, the 60 to 64 years age range has the highest percentage of unemployed individuals, with 23.7% or 9 of them being unemployed.
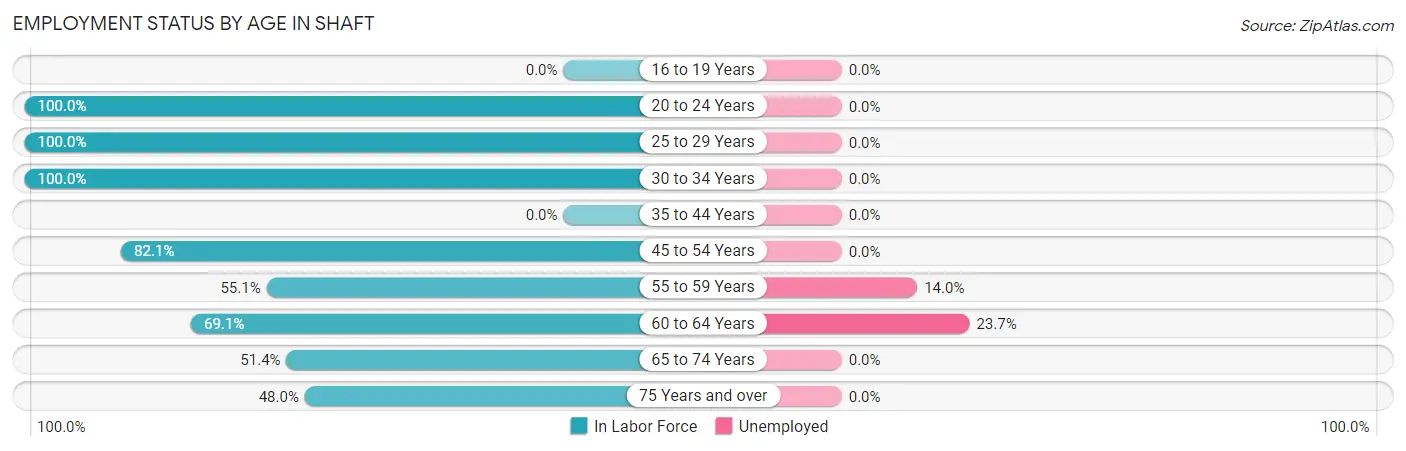
| Age Bracket | In Labor Force | Unemployed |
| 16 to 19 Years | 0 (0.0%) | 0 (0.0%) |
| 20 to 24 Years | 7 (100.0%) | 0 (0.0%) |
| 25 to 29 Years | 8 (100.0%) | 0 (0.0%) |
| 30 to 34 Years | 10 (100.0%) | 0 (0.0%) |
| 35 to 44 Years | 0 (0.0%) | 0 (0.0%) |
| 45 to 54 Years | 32 (82.1%) | 0 (0.0%) |
| 55 to 59 Years | 43 (55.1%) | 6 (14.0%) |
| 60 to 64 Years | 38 (69.1%) | 9 (23.7%) |
| 65 to 74 Years | 19 (51.4%) | 0 (0.0%) |
| 75 Years and over | 12 (48.0%) | 0 (0.0%) |
| Total | 169 (65.3%) | 15 (8.9%) |
Employment Status by Educational Attainment in Shaft
According to labor force statistics for Shaft, 68.9% of individuals (131) out of the total population between 25 and 64 years of age (190) are in the labor force, with 11.5% or 15 of them being unemployed. The group with the highest labor force participation rate are those with the educational attainment of bachelor's degree or higher, with 100.0% or 94 individuals in the labor force. Within the labor force, individuals with high school diploma education have the highest percentage of unemployment, with 65.2% or 15 of them being unemployed.
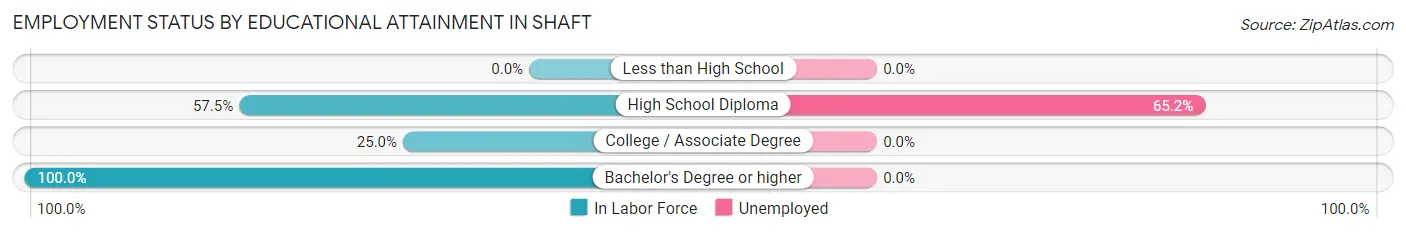
| Educational Attainment | In Labor Force | Unemployed |
| Less than High School | 0 (0.0%) | 0 (0.0%) |
| High School Diploma | 23 (57.5%) | 26 (65.2%) |
| College / Associate Degree | 14 (25.0%) | 0 (0.0%) |
| Bachelor's Degree or higher | 94 (100.0%) | 0 (0.0%) |
| Total | 131 (68.9%) | 22 (11.5%) |
Employment Occupations by Sex in Shaft
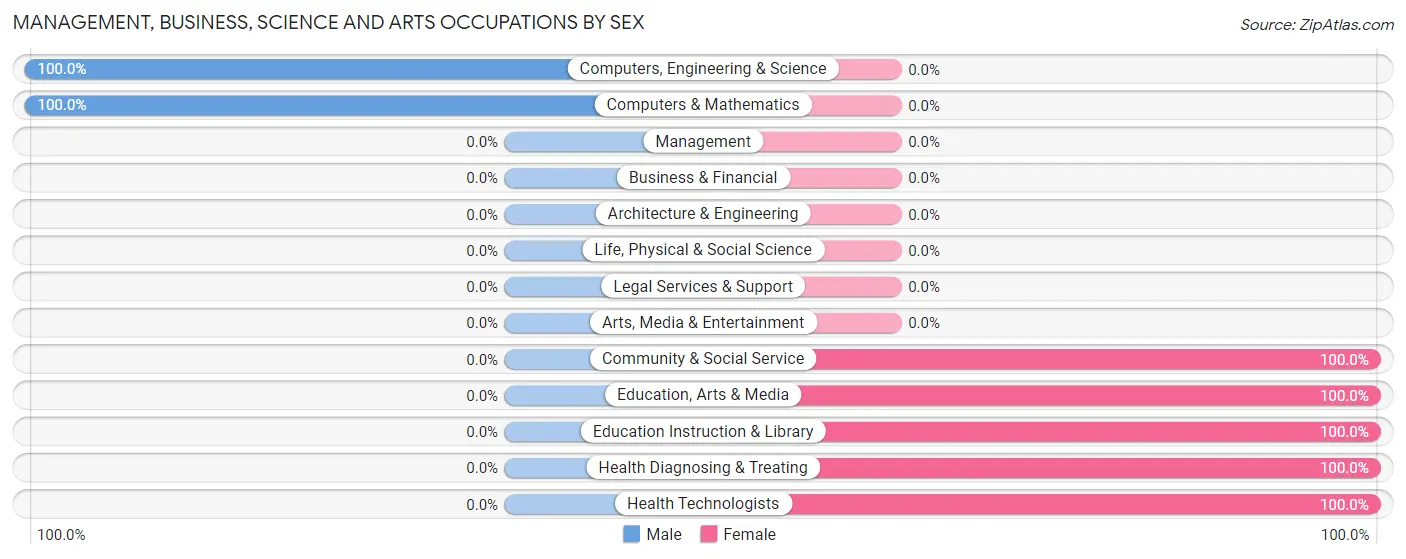
Management, Business, Science and Arts Occupations
The most common Management, Business, Science and Arts occupations in Shaft are Community & Social Service (50 | 32.5%), Education, Arts & Media (32 | 20.8%), Computers, Engineering & Science (21 | 13.6%), Computers & Mathematics (21 | 13.6%), and Health Diagnosing & Treating (19 | 12.3%).
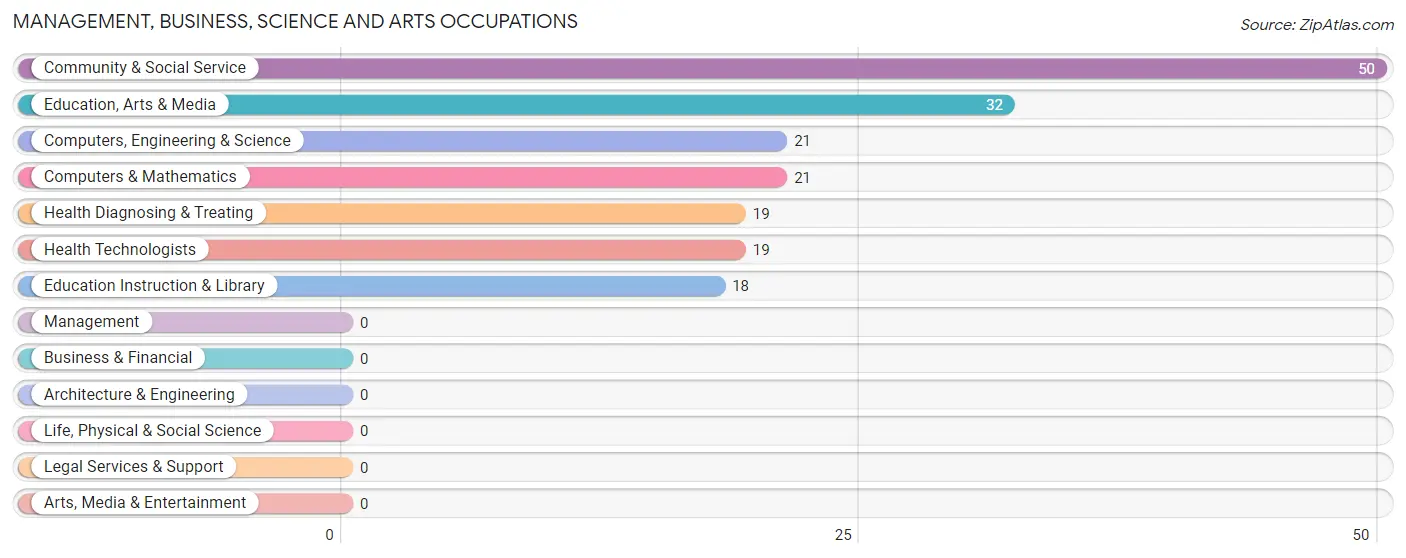
Management, Business, Science and Arts Occupations by Sex
Within the Management, Business, Science and Arts occupations in Shaft, the most male-oriented occupations are Computers, Engineering & Science (100.0%), and Computers & Mathematics (100.0%), while the most female-oriented occupations are Community & Social Service (100.0%), Education, Arts & Media (100.0%), and Education Instruction & Library (100.0%).
| Occupation | Male | Female |
| Management | 0 (0.0%) | 0 (0.0%) |
| Business & Financial | 0 (0.0%) | 0 (0.0%) |
| Computers, Engineering & Science | 21 (100.0%) | 0 (0.0%) |
| Computers & Mathematics | 21 (100.0%) | 0 (0.0%) |
| Architecture & Engineering | 0 (0.0%) | 0 (0.0%) |
| Life, Physical & Social Science | 0 (0.0%) | 0 (0.0%) |
| Community & Social Service | 0 (0.0%) | 50 (100.0%) |
| Education, Arts & Media | 0 (0.0%) | 32 (100.0%) |
| Legal Services & Support | 0 (0.0%) | 0 (0.0%) |
| Education Instruction & Library | 0 (0.0%) | 18 (100.0%) |
| Arts, Media & Entertainment | 0 (0.0%) | 0 (0.0%) |
| Health Diagnosing & Treating | 0 (0.0%) | 19 (100.0%) |
| Health Technologists | 0 (0.0%) | 19 (100.0%) |
| Total (Category) | 21 (23.3%) | 69 (76.7%) |
| Total (Overall) | 62 (40.3%) | 92 (59.7%) |
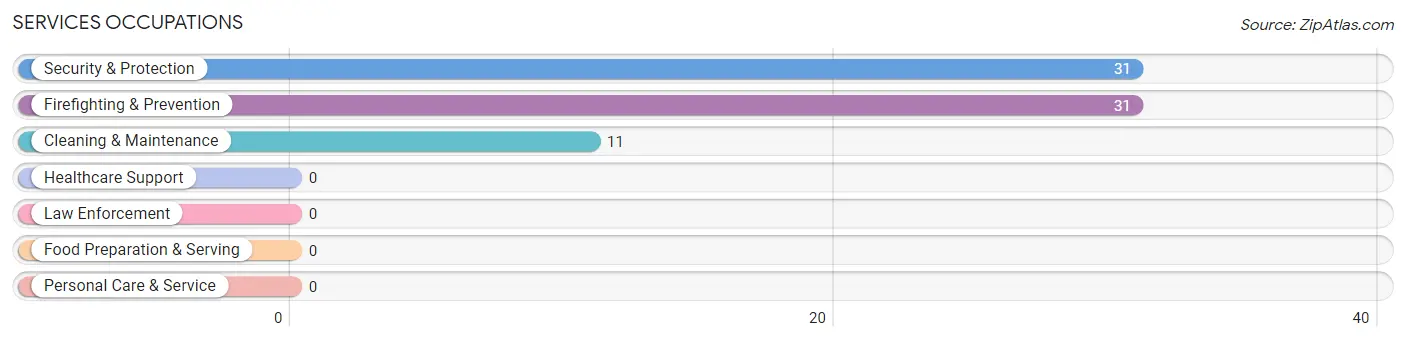
Services Occupations
The most common Services occupations in Shaft are Security & Protection (31 | 20.1%), Firefighting & Prevention (31 | 20.1%), and Cleaning & Maintenance (11 | 7.1%).
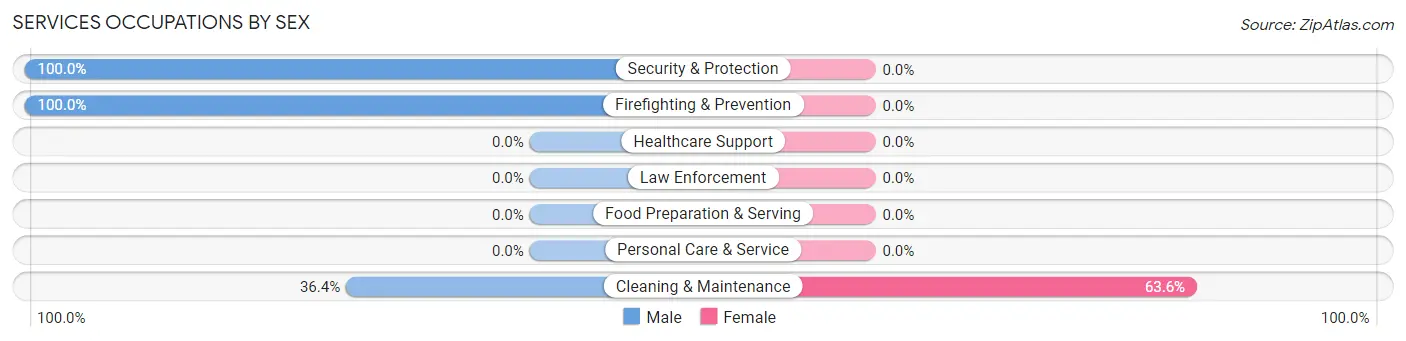
Services Occupations by Sex
| Occupation | Male | Female |
| Healthcare Support | 0 (0.0%) | 0 (0.0%) |
| Security & Protection | 31 (100.0%) | 0 (0.0%) |
| Firefighting & Prevention | 31 (100.0%) | 0 (0.0%) |
| Law Enforcement | 0 (0.0%) | 0 (0.0%) |
| Food Preparation & Serving | 0 (0.0%) | 0 (0.0%) |
| Cleaning & Maintenance | 4 (36.4%) | 7 (63.6%) |
| Personal Care & Service | 0 (0.0%) | 0 (0.0%) |
| Total (Category) | 35 (83.3%) | 7 (16.7%) |
| Total (Overall) | 62 (40.3%) | 92 (59.7%) |
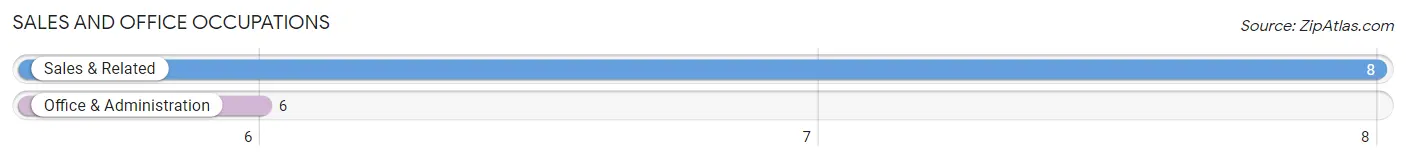
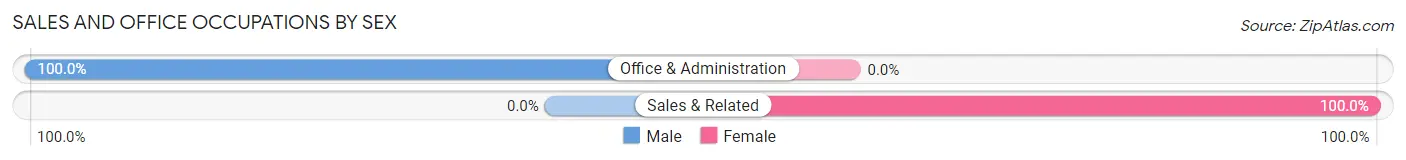
Sales and Office Occupations
The most common Sales and Office occupations in Shaft are Sales & Related (8 | 5.2%), and Office & Administration (6 | 3.9%).
Sales and Office Occupations by Sex
| Occupation | Male | Female |
| Sales & Related | 0 (0.0%) | 8 (100.0%) |
| Office & Administration | 6 (100.0%) | 0 (0.0%) |
| Total (Category) | 6 (42.9%) | 8 (57.1%) |
| Total (Overall) | 62 (40.3%) | 92 (59.7%) |
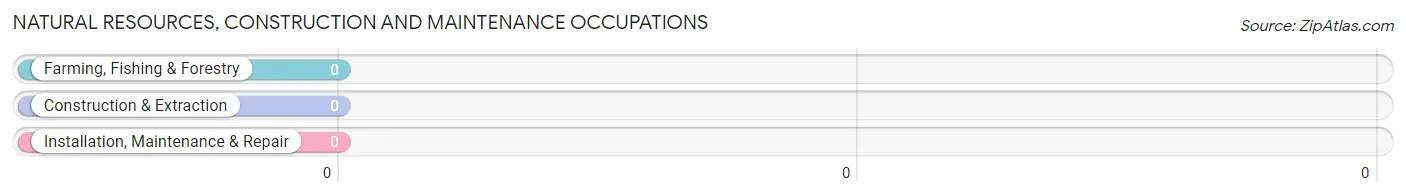
Natural Resources, Construction and Maintenance Occupations
Natural Resources, Construction and Maintenance Occupations by Sex
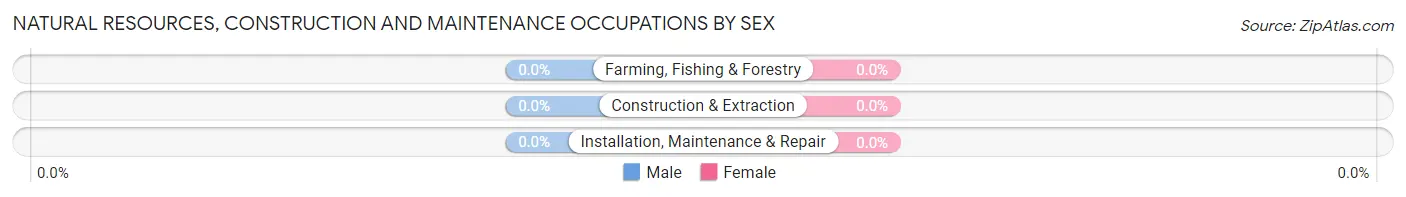
| Occupation | Male | Female |
| Farming, Fishing & Forestry | 0 (0.0%) | 0 (0.0%) |
| Construction & Extraction | 0 (0.0%) | 0 (0.0%) |
| Installation, Maintenance & Repair | 0 (0.0%) | 0 (0.0%) |
| Total (Category) | 0 (0.0%) | 0 (0.0%) |
| Total (Overall) | 62 (40.3%) | 92 (59.7%) |
Production, Transportation and Moving Occupations
The most common Production, Transportation and Moving occupations in Shaft are , and Production (8 | 5.2%).
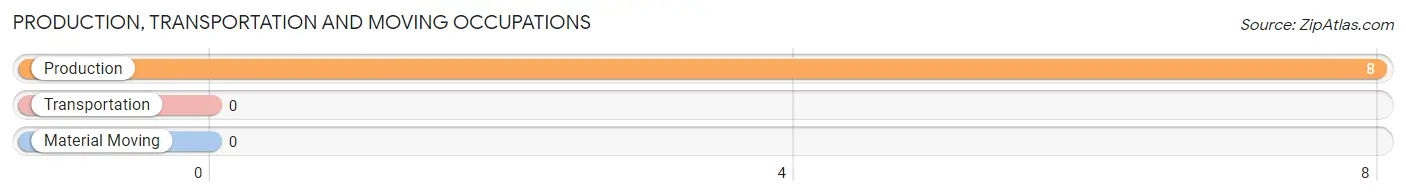
Production, Transportation and Moving Occupations by Sex
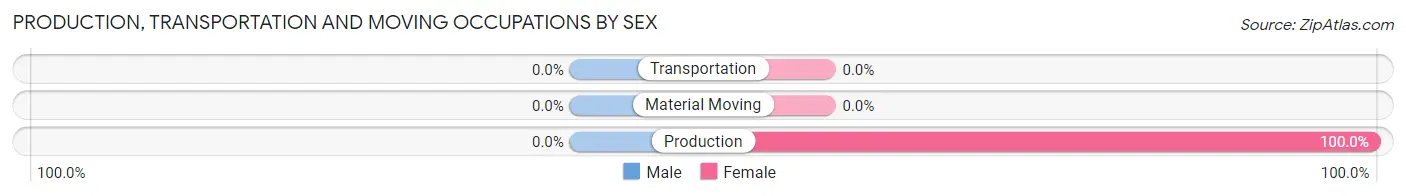
| Occupation | Male | Female |
| Production | 0 (0.0%) | 8 (100.0%) |
| Transportation | 0 (0.0%) | 0 (0.0%) |
| Material Moving | 0 (0.0%) | 0 (0.0%) |
| Total (Category) | 0 (0.0%) | 8 (100.0%) |
| Total (Overall) | 62 (40.3%) | 92 (59.7%) |
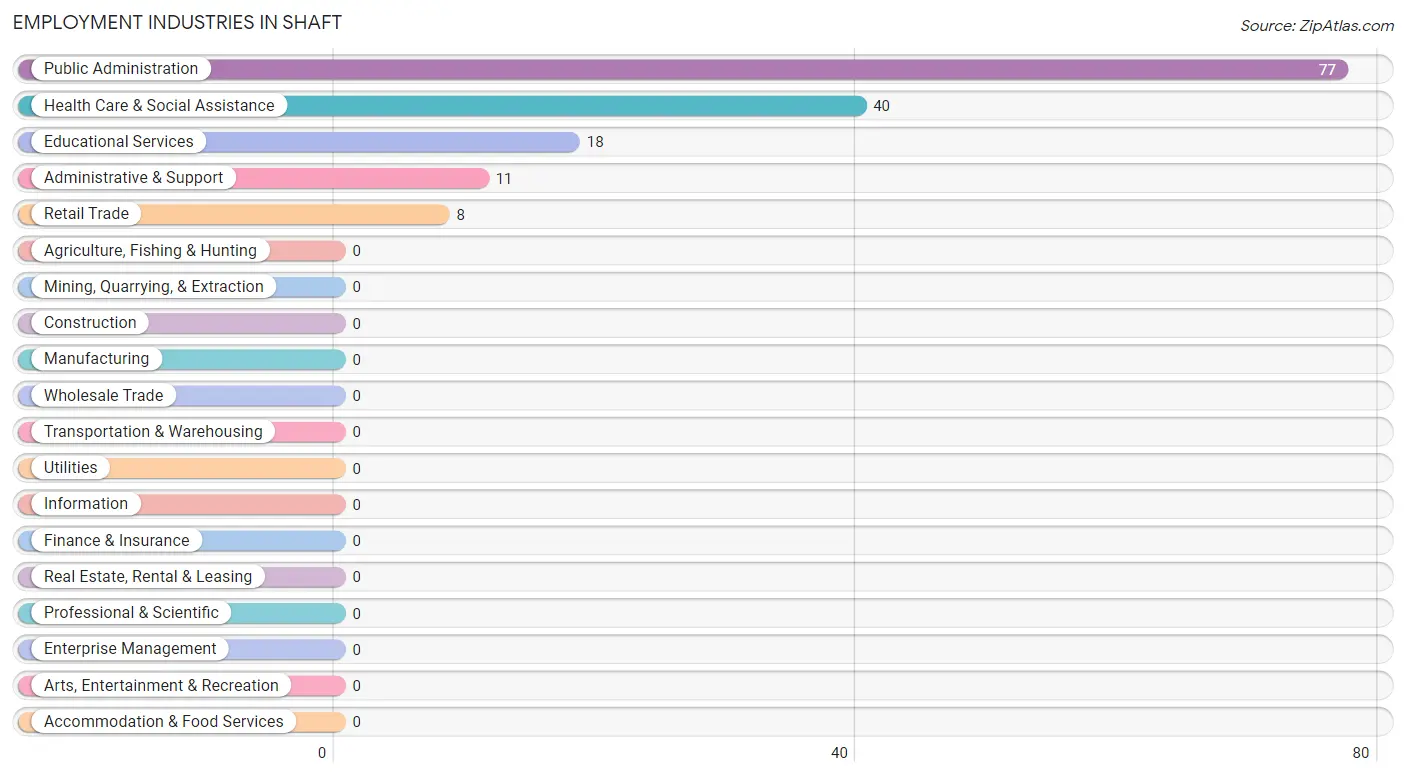
Employment Industries by Sex in Shaft
Employment Industries in Shaft
The major employment industries in Shaft include Public Administration (77 | 50.0%), Health Care & Social Assistance (40 | 26.0%), Educational Services (18 | 11.7%), Administrative & Support (11 | 7.1%), and Retail Trade (8 | 5.2%).
Employment Industries by Sex in Shaft
The Shaft industries that see more men than women are Public Administration (75.3%), and Administrative & Support (36.4%), whereas the industries that tend to have a higher number of women are Retail Trade (100.0%), Educational Services (100.0%), and Health Care & Social Assistance (100.0%).
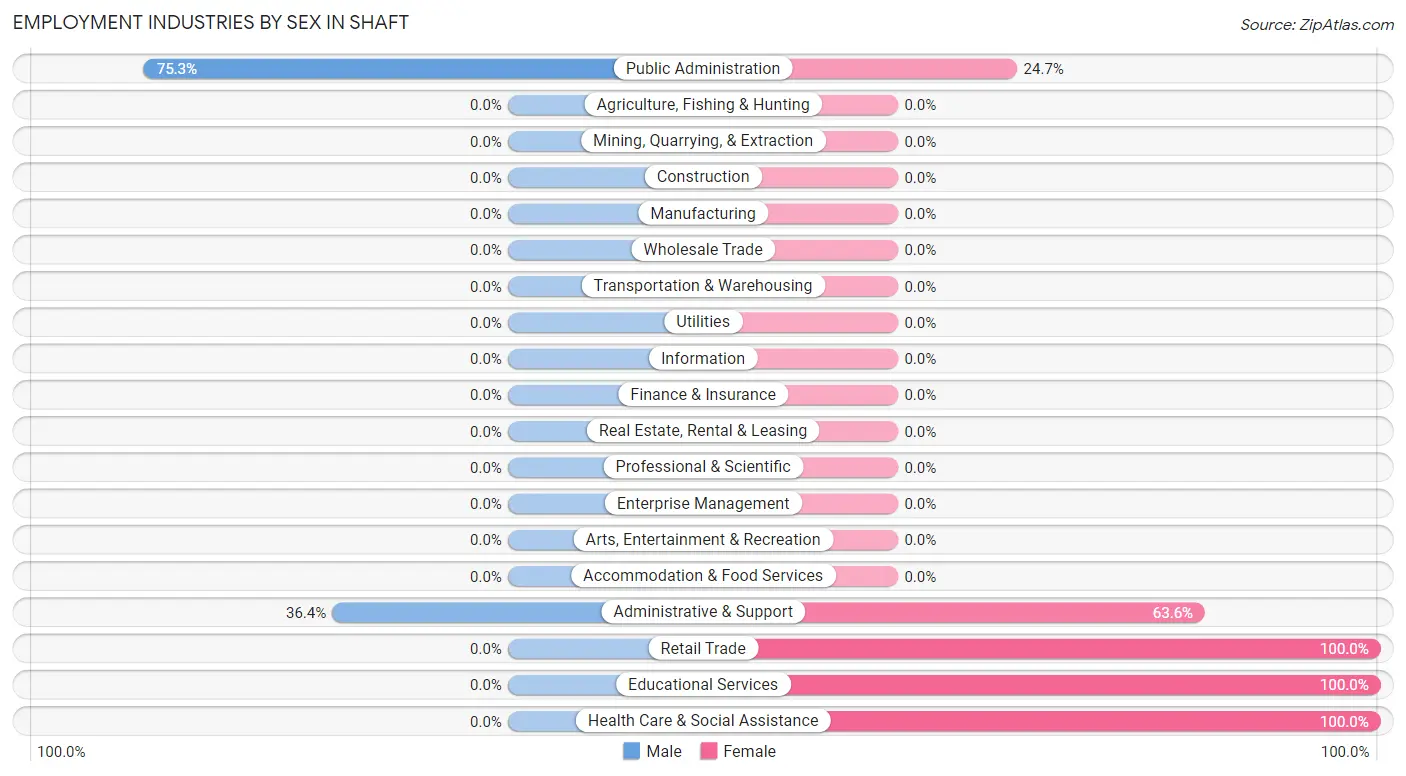
| Industry | Male | Female |
| Agriculture, Fishing & Hunting | 0 (0.0%) | 0 (0.0%) |
| Mining, Quarrying, & Extraction | 0 (0.0%) | 0 (0.0%) |
| Construction | 0 (0.0%) | 0 (0.0%) |
| Manufacturing | 0 (0.0%) | 0 (0.0%) |
| Wholesale Trade | 0 (0.0%) | 0 (0.0%) |
| Retail Trade | 0 (0.0%) | 8 (100.0%) |
| Transportation & Warehousing | 0 (0.0%) | 0 (0.0%) |
| Utilities | 0 (0.0%) | 0 (0.0%) |
| Information | 0 (0.0%) | 0 (0.0%) |
| Finance & Insurance | 0 (0.0%) | 0 (0.0%) |
| Real Estate, Rental & Leasing | 0 (0.0%) | 0 (0.0%) |
| Professional & Scientific | 0 (0.0%) | 0 (0.0%) |
| Enterprise Management | 0 (0.0%) | 0 (0.0%) |
| Administrative & Support | 4 (36.4%) | 7 (63.6%) |
| Educational Services | 0 (0.0%) | 18 (100.0%) |
| Health Care & Social Assistance | 0 (0.0%) | 40 (100.0%) |
| Arts, Entertainment & Recreation | 0 (0.0%) | 0 (0.0%) |
| Accommodation & Food Services | 0 (0.0%) | 0 (0.0%) |
| Public Administration | 58 (75.3%) | 19 (24.7%) |
| Total | 62 (40.3%) | 92 (59.7%) |
Education in Shaft
School Enrollment in Shaft
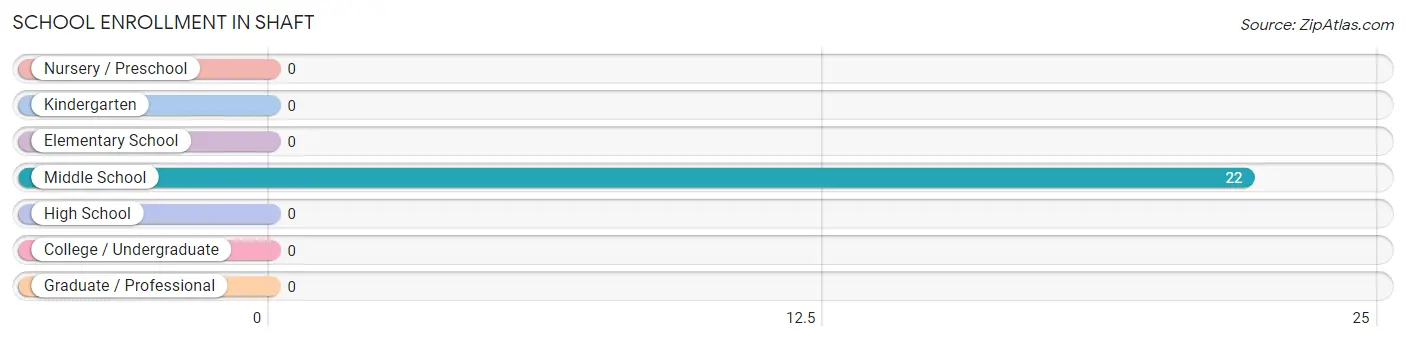
| School Level | # Students | % Students |
| Nursery / Preschool | 0 | 0.0% |
| Kindergarten | 0 | 0.0% |
| Elementary School | 0 | 0.0% |
| Middle School | 22 | 100.0% |
| High School | 0 | 0.0% |
| College / Undergraduate | 0 | 0.0% |
| Graduate / Professional | 0 | 0.0% |
| Total | 22 | 100.0% |
School Enrollment by Age by Funding Source in Shaft
Out of a total of 22 students who are enrolled in schools in Shaft, 14 (63.6%) attend a private institution, while the remaining 8 (36.4%) are enrolled in public schools. The age group of 10 to 14 year olds has the highest likelihood of being enrolled in private schools, with 14 (63.6% in the age bracket) enrolled. Conversely, the age group of 10 to 14 year olds has the lowest likelihood of being enrolled in a private school, with 8 (36.4% in the age bracket) attending a public institution.
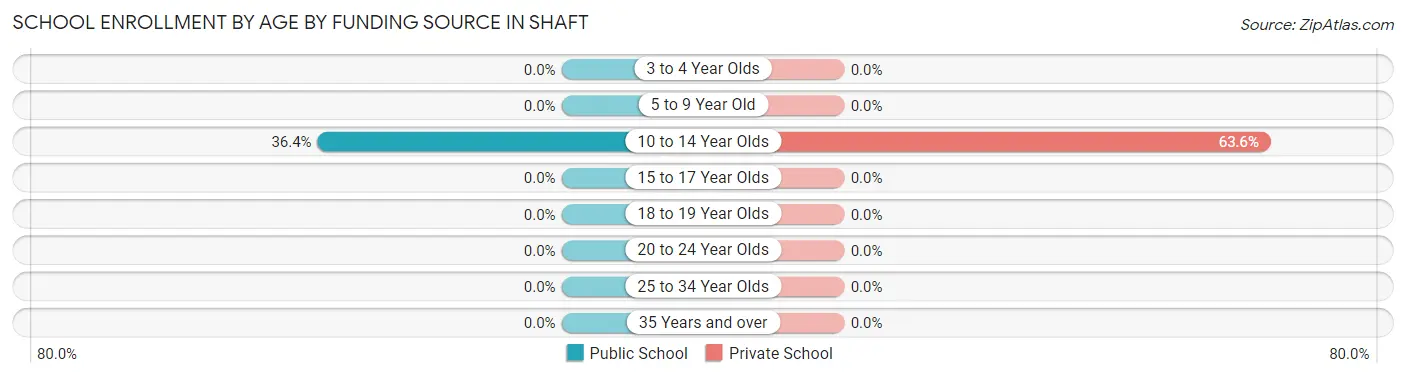
| Age Bracket | Public School | Private School |
| 3 to 4 Year Olds | 0 (0.0%) | 0 (0.0%) |
| 5 to 9 Year Old | 0 (0.0%) | 0 (0.0%) |
| 10 to 14 Year Olds | 8 (36.4%) | 14 (63.6%) |
| 15 to 17 Year Olds | 0 (0.0%) | 0 (0.0%) |
| 18 to 19 Year Olds | 0 (0.0%) | 0 (0.0%) |
| 20 to 24 Year Olds | 0 (0.0%) | 0 (0.0%) |
| 25 to 34 Year Olds | 0 (0.0%) | 0 (0.0%) |
| 35 Years and over | 0 (0.0%) | 0 (0.0%) |
| Total | 8 (36.4%) | 14 (63.6%) |
Educational Attainment by Field of Study in Shaft
Arts & humanities (32 | 19.8%), social sciences (31 | 19.1%), education (31 | 19.1%), physical & health sciences (21 | 13.0%), and science & technology (19 | 11.7%) are the most common fields of study among 162 individuals in Shaft who have obtained a bachelor's degree or higher.
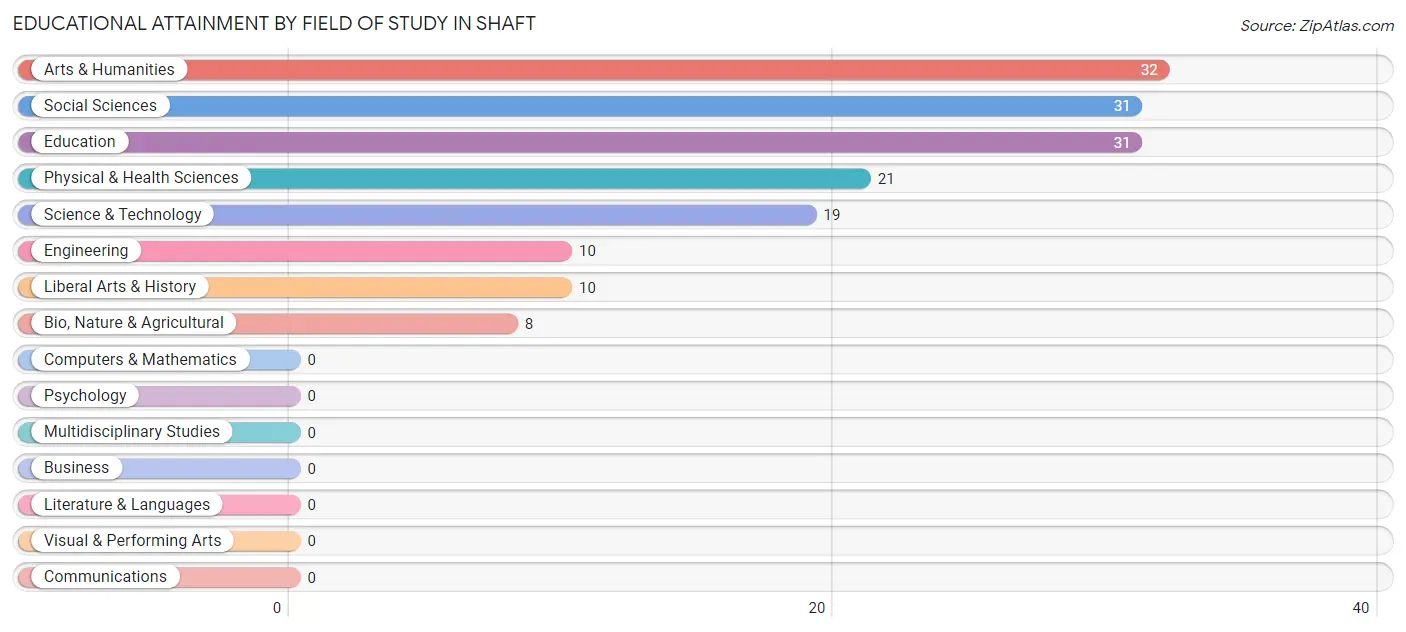
| Field of Study | # Graduates | % Graduates |
| Computers & Mathematics | 0 | 0.0% |
| Bio, Nature & Agricultural | 8 | 4.9% |
| Physical & Health Sciences | 21 | 13.0% |
| Psychology | 0 | 0.0% |
| Social Sciences | 31 | 19.1% |
| Engineering | 10 | 6.2% |
| Multidisciplinary Studies | 0 | 0.0% |
| Science & Technology | 19 | 11.7% |
| Business | 0 | 0.0% |
| Education | 31 | 19.1% |
| Literature & Languages | 0 | 0.0% |
| Liberal Arts & History | 10 | 6.2% |
| Visual & Performing Arts | 0 | 0.0% |
| Communications | 0 | 0.0% |
| Arts & Humanities | 32 | 19.8% |
| Total | 162 | 100.0% |
Transportation & Commute in Shaft
Vehicle Availability by Sex in Shaft
The most prevalent vehicle ownership categories in Shaft are males with 3 vehicles (31, accounting for 50.0%) and females with 3 vehicles (40, making up 33.7%).
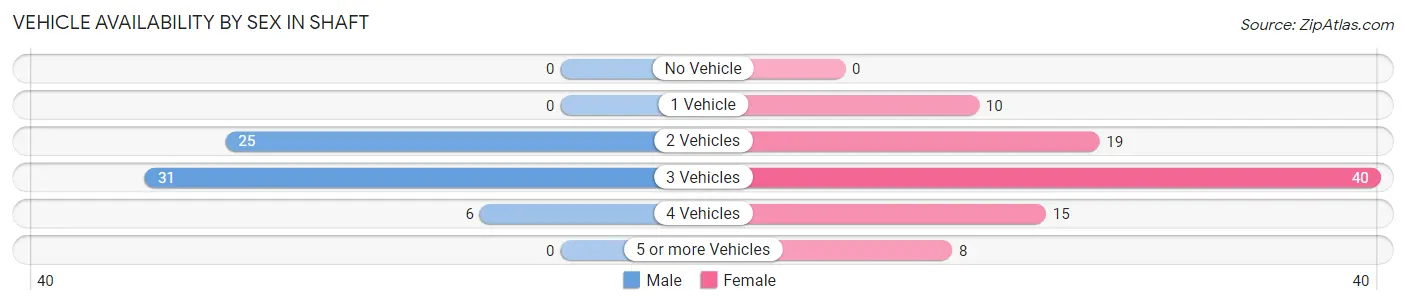
| Vehicles Available | Male | Female |
| No Vehicle | 0 (0.0%) | 0 (0.0%) |
| 1 Vehicle | 0 (0.0%) | 10 (10.9%) |
| 2 Vehicles | 25 (40.3%) | 19 (20.6%) |
| 3 Vehicles | 31 (50.0%) | 40 (43.5%) |
| 4 Vehicles | 6 (9.7%) | 15 (16.3%) |
| 5 or more Vehicles | 0 (0.0%) | 8 (8.7%) |
| Total | 62 (100.0%) | 92 (100.0%) |
Commute Time in Shaft
The most frequently occuring commute durations in Shaft are 20 to 24 minutes (50 commuters, 32.5%), 5 to 9 minutes (40 commuters, 26.0%), and 25 to 29 minutes (32 commuters, 20.8%).
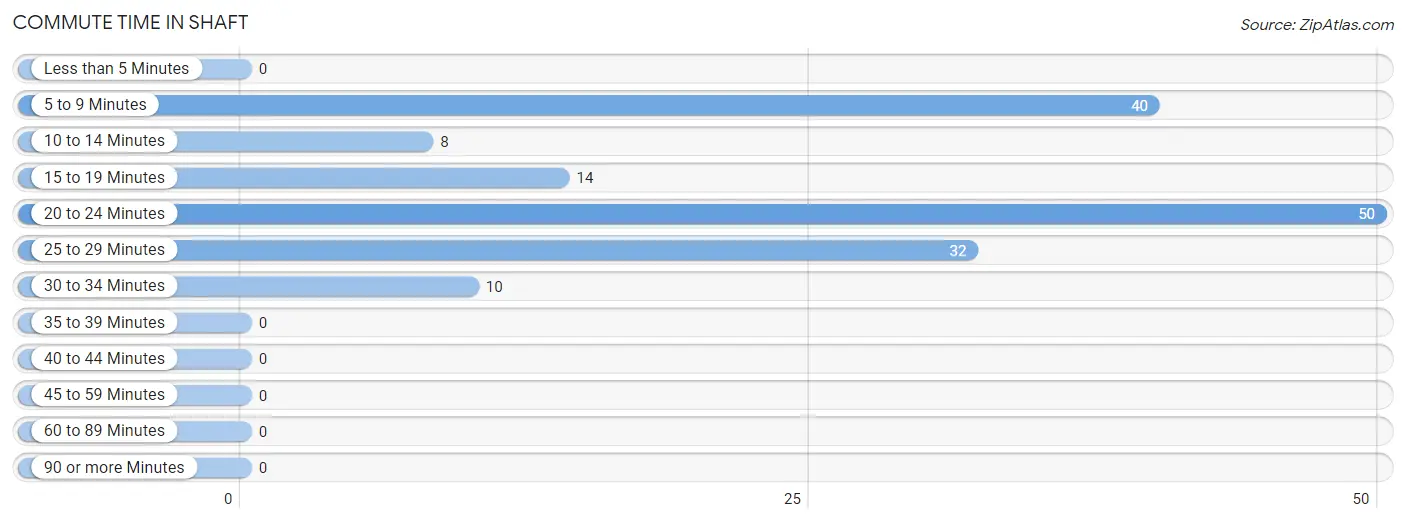
| Commute Time | # Commuters | % Commuters |
| Less than 5 Minutes | 0 | 0.0% |
| 5 to 9 Minutes | 40 | 26.0% |
| 10 to 14 Minutes | 8 | 5.2% |
| 15 to 19 Minutes | 14 | 9.1% |
| 20 to 24 Minutes | 50 | 32.5% |
| 25 to 29 Minutes | 32 | 20.8% |
| 30 to 34 Minutes | 10 | 6.5% |
| 35 to 39 Minutes | 0 | 0.0% |
| 40 to 44 Minutes | 0 | 0.0% |
| 45 to 59 Minutes | 0 | 0.0% |
| 60 to 89 Minutes | 0 | 0.0% |
| 90 or more Minutes | 0 | 0.0% |
Commute Time by Sex in Shaft
The most common commute times in Shaft are 20 to 24 minutes (35 commuters, 56.5%) for males and 25 to 29 minutes (32 commuters, 34.8%) for females.
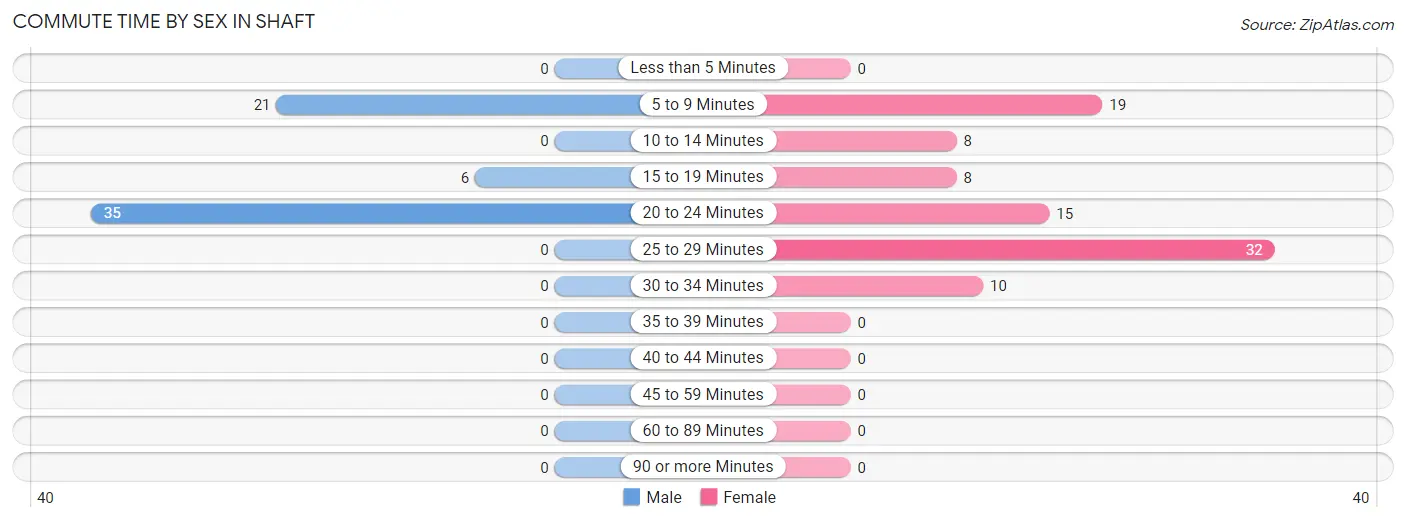
| Commute Time | Male | Female |
| Less than 5 Minutes | 0 (0.0%) | 0 (0.0%) |
| 5 to 9 Minutes | 21 (33.9%) | 19 (20.6%) |
| 10 to 14 Minutes | 0 (0.0%) | 8 (8.7%) |
| 15 to 19 Minutes | 6 (9.7%) | 8 (8.7%) |
| 20 to 24 Minutes | 35 (56.5%) | 15 (16.3%) |
| 25 to 29 Minutes | 0 (0.0%) | 32 (34.8%) |
| 30 to 34 Minutes | 0 (0.0%) | 10 (10.9%) |
| 35 to 39 Minutes | 0 (0.0%) | 0 (0.0%) |
| 40 to 44 Minutes | 0 (0.0%) | 0 (0.0%) |
| 45 to 59 Minutes | 0 (0.0%) | 0 (0.0%) |
| 60 to 89 Minutes | 0 (0.0%) | 0 (0.0%) |
| 90 or more Minutes | 0 (0.0%) | 0 (0.0%) |
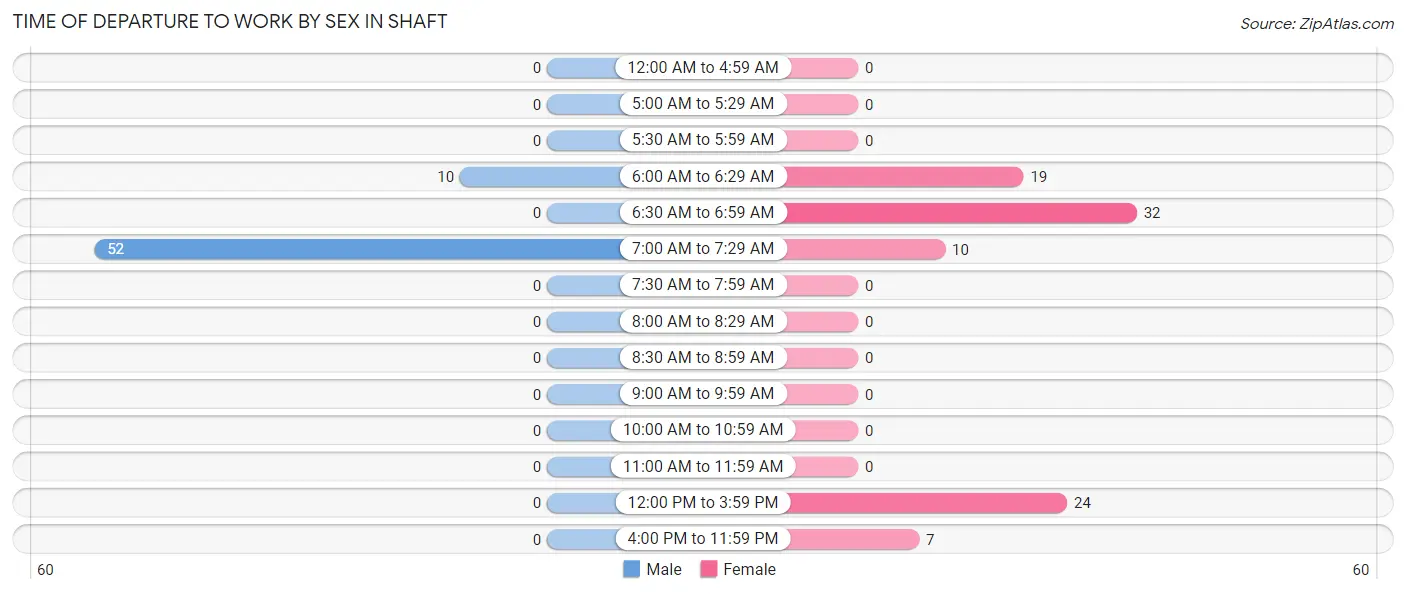
Time of Departure to Work by Sex in Shaft
The most frequent times of departure to work in Shaft are 7:00 AM to 7:29 AM (52, 83.9%) for males and 6:30 AM to 6:59 AM (32, 34.8%) for females.
| Time of Departure | Male | Female |
| 12:00 AM to 4:59 AM | 0 (0.0%) | 0 (0.0%) |
| 5:00 AM to 5:29 AM | 0 (0.0%) | 0 (0.0%) |
| 5:30 AM to 5:59 AM | 0 (0.0%) | 0 (0.0%) |
| 6:00 AM to 6:29 AM | 10 (16.1%) | 19 (20.6%) |
| 6:30 AM to 6:59 AM | 0 (0.0%) | 32 (34.8%) |
| 7:00 AM to 7:29 AM | 52 (83.9%) | 10 (10.9%) |
| 7:30 AM to 7:59 AM | 0 (0.0%) | 0 (0.0%) |
| 8:00 AM to 8:29 AM | 0 (0.0%) | 0 (0.0%) |
| 8:30 AM to 8:59 AM | 0 (0.0%) | 0 (0.0%) |
| 9:00 AM to 9:59 AM | 0 (0.0%) | 0 (0.0%) |
| 10:00 AM to 10:59 AM | 0 (0.0%) | 0 (0.0%) |
| 11:00 AM to 11:59 AM | 0 (0.0%) | 0 (0.0%) |
| 12:00 PM to 3:59 PM | 0 (0.0%) | 24 (26.1%) |
| 4:00 PM to 11:59 PM | 0 (0.0%) | 7 (7.6%) |
| Total | 62 (100.0%) | 92 (100.0%) |
Housing Occupancy in Shaft
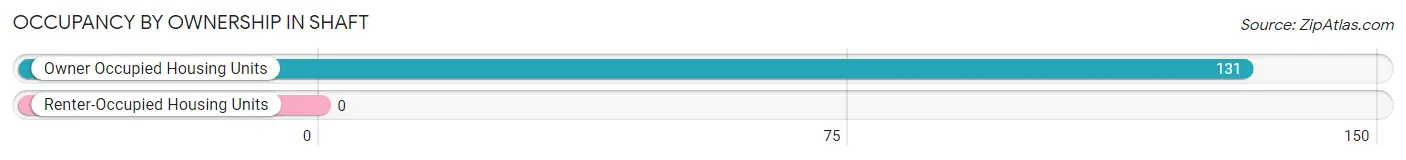
Occupancy by Ownership in Shaft
Of the total 131 dwellings in Shaft, owner-occupied units account for 131 (100.0%), while renter-occupied units make up 0 (0.0%).
| Occupancy | # Housing Units | % Housing Units |
| Owner Occupied Housing Units | 131 | 100.0% |
| Renter-Occupied Housing Units | 0 | 0.0% |
| Total Occupied Housing Units | 131 | 100.0% |
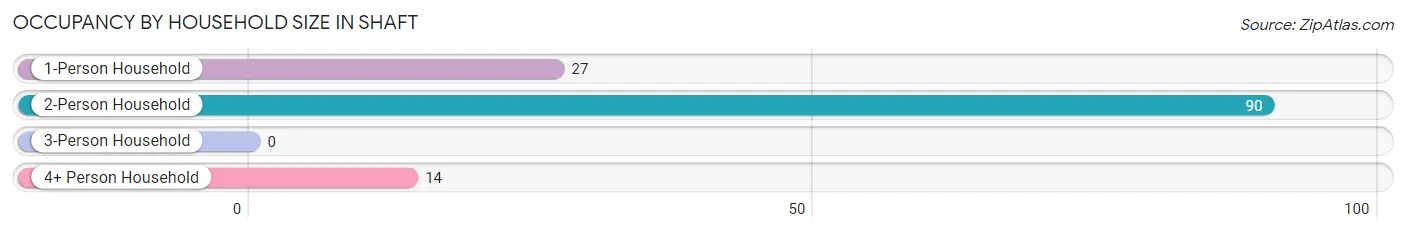
Occupancy by Household Size in Shaft
| Household Size | # Housing Units | % Housing Units |
| 1-Person Household | 27 | 20.6% |
| 2-Person Household | 90 | 68.7% |
| 3-Person Household | 0 | 0.0% |
| 4+ Person Household | 14 | 10.7% |
| Total Housing Units | 131 | 100.0% |
Occupancy by Ownership by Household Size in Shaft
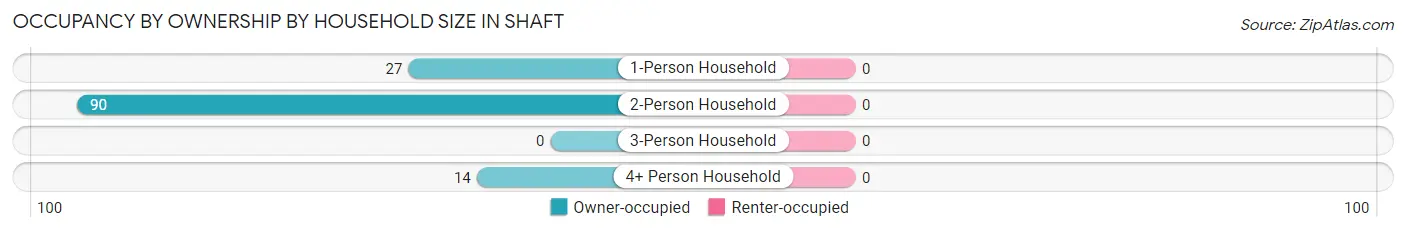
| Household Size | Owner-occupied | Renter-occupied |
| 1-Person Household | 27 (100.0%) | 0 (0.0%) |
| 2-Person Household | 90 (100.0%) | 0 (0.0%) |
| 3-Person Household | 0 (0.0%) | 0 (0.0%) |
| 4+ Person Household | 14 (100.0%) | 0 (0.0%) |
| Total Housing Units | 131 (100.0%) | 0 (0.0%) |
Occupancy by Educational Attainment in Shaft
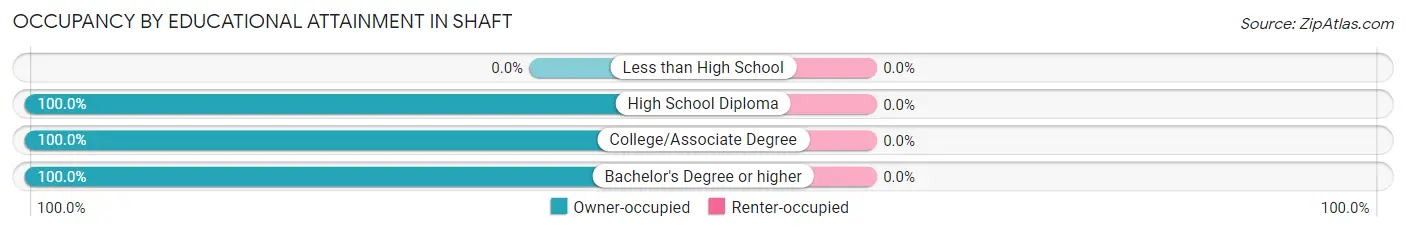
| Household Size | Owner-occupied | Renter-occupied |
| Less than High School | 0 (0.0%) | 0 (0.0%) |
| High School Diploma | 30 (100.0%) | 0 (0.0%) |
| College/Associate Degree | 41 (100.0%) | 0 (0.0%) |
| Bachelor's Degree or higher | 60 (100.0%) | 0 (0.0%) |
Occupancy by Age of Householder in Shaft
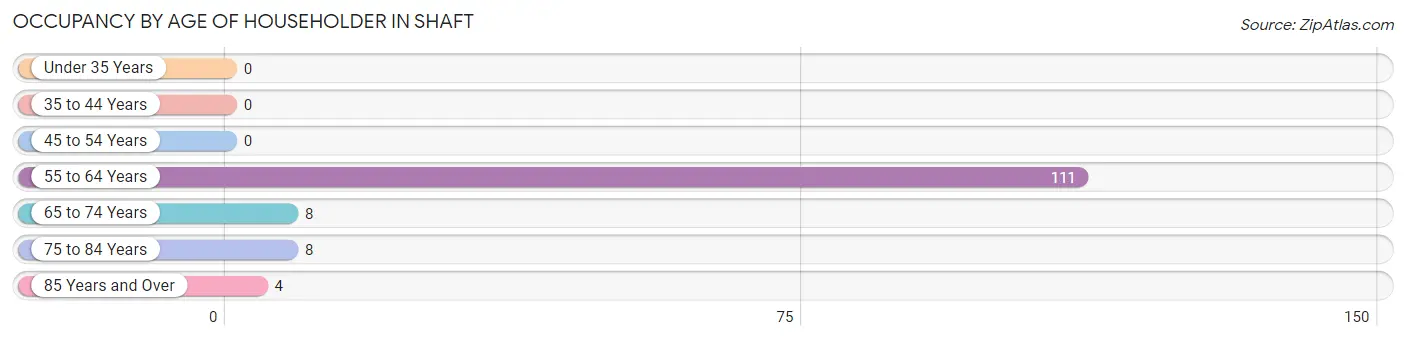
| Age Bracket | # Households | % Households |
| Under 35 Years | 0 | 0.0% |
| 35 to 44 Years | 0 | 0.0% |
| 45 to 54 Years | 0 | 0.0% |
| 55 to 64 Years | 111 | 84.7% |
| 65 to 74 Years | 8 | 6.1% |
| 75 to 84 Years | 8 | 6.1% |
| 85 Years and Over | 4 | 3.0% |
| Total | 131 | 100.0% |
Housing Finances in Shaft
Median Income by Occupancy in Shaft
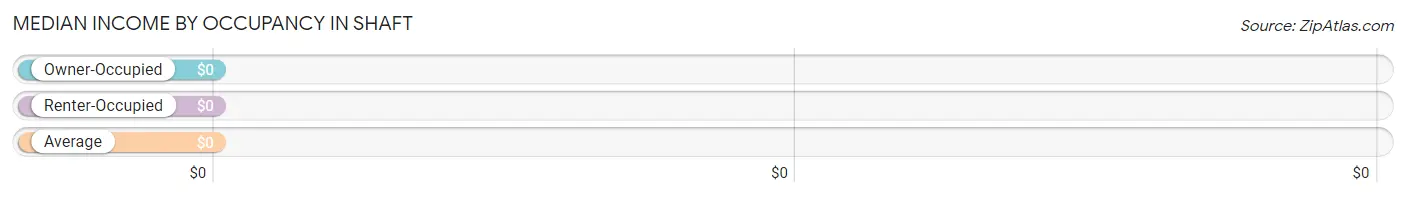
| Occupancy Type | # Households | Median Income |
| Owner-Occupied | 131 (100.0%) | $0 |
| Renter-Occupied | 0 (0.0%) | $0 |
| Average | 131 (100.0%) | $0 |
Occupancy by Householder Income Bracket in Shaft
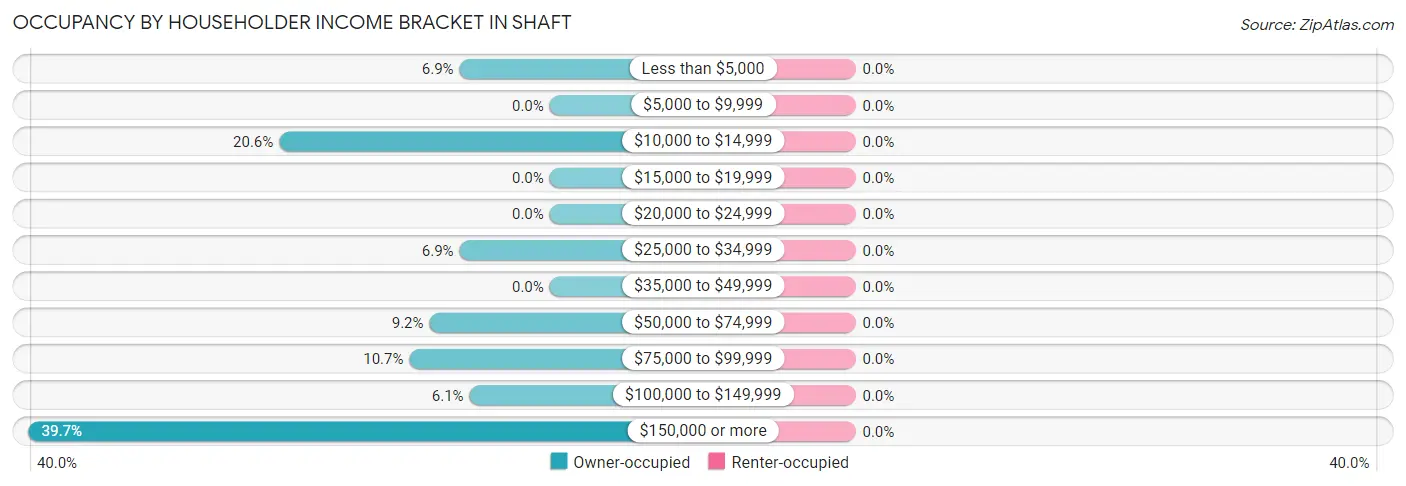
| Income Bracket | Owner-occupied | Renter-occupied |
| Less than $5,000 | 9 (6.9%) | 0 (0.0%) |
| $5,000 to $9,999 | 0 (0.0%) | 0 (0.0%) |
| $10,000 to $14,999 | 27 (20.6%) | 0 (0.0%) |
| $15,000 to $19,999 | 0 (0.0%) | 0 (0.0%) |
| $20,000 to $24,999 | 0 (0.0%) | 0 (0.0%) |
| $25,000 to $34,999 | 9 (6.9%) | 0 (0.0%) |
| $35,000 to $49,999 | 0 (0.0%) | 0 (0.0%) |
| $50,000 to $74,999 | 12 (9.2%) | 0 (0.0%) |
| $75,000 to $99,999 | 14 (10.7%) | 0 (0.0%) |
| $100,000 to $149,999 | 8 (6.1%) | 0 (0.0%) |
| $150,000 or more | 52 (39.7%) | 0 (0.0%) |
| Total | 131 (100.0%) | 0 (0.0%) |
Monthly Housing Cost Tiers in Shaft
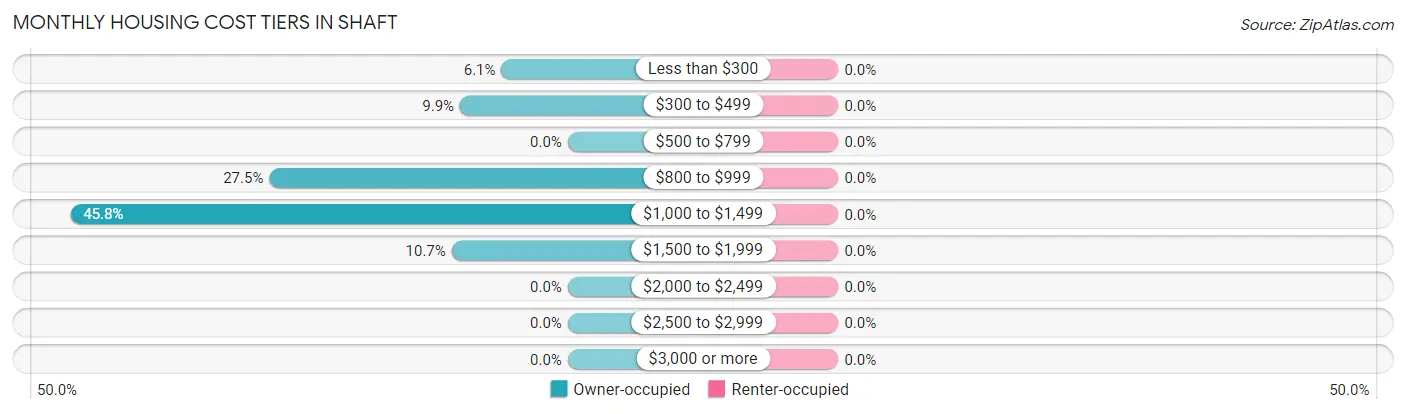
| Monthly Cost | Owner-occupied | Renter-occupied |
| Less than $300 | 8 (6.1%) | 0 (0.0%) |
| $300 to $499 | 13 (9.9%) | 0 (0.0%) |
| $500 to $799 | 0 (0.0%) | 0 (0.0%) |
| $800 to $999 | 36 (27.5%) | 0 (0.0%) |
| $1,000 to $1,499 | 60 (45.8%) | 0 (0.0%) |
| $1,500 to $1,999 | 14 (10.7%) | 0 (0.0%) |
| $2,000 to $2,499 | 0 (0.0%) | 0 (0.0%) |
| $2,500 to $2,999 | 0 (0.0%) | 0 (0.0%) |
| $3,000 or more | 0 (0.0%) | 0 (0.0%) |
| Total | 131 (100.0%) | 0 (0.0%) |
Physical Housing Characteristics in Shaft
Housing Structures in Shaft
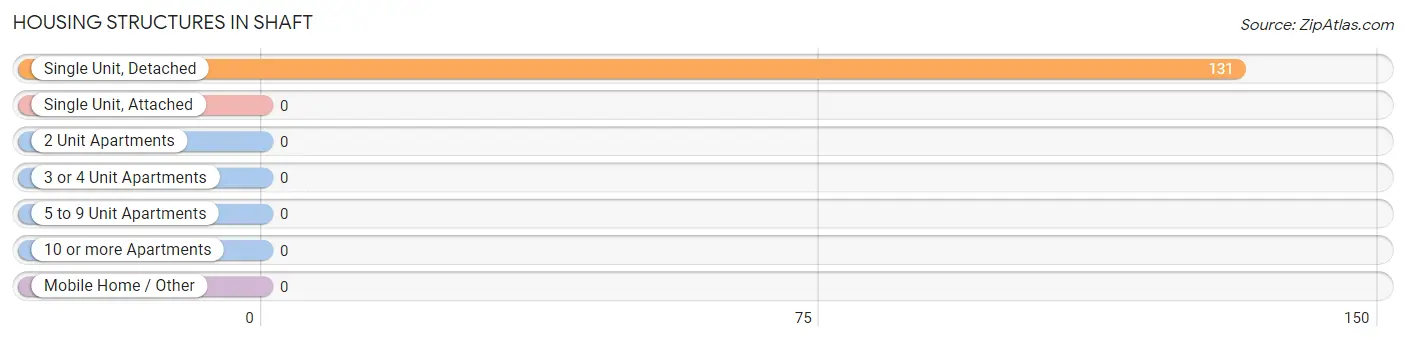
| Structure Type | # Housing Units | % Housing Units |
| Single Unit, Detached | 131 | 100.0% |
| Single Unit, Attached | 0 | 0.0% |
| 2 Unit Apartments | 0 | 0.0% |
| 3 or 4 Unit Apartments | 0 | 0.0% |
| 5 to 9 Unit Apartments | 0 | 0.0% |
| 10 or more Apartments | 0 | 0.0% |
| Mobile Home / Other | 0 | 0.0% |
| Total | 131 | 100.0% |
Housing Structures by Occupancy in Shaft
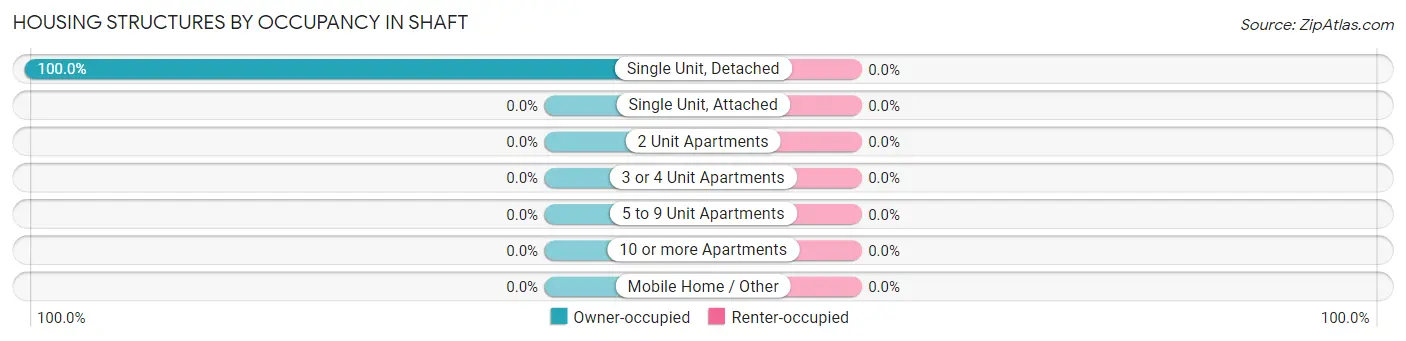
| Structure Type | Owner-occupied | Renter-occupied |
| Single Unit, Detached | 131 (100.0%) | 0 (0.0%) |
| Single Unit, Attached | 0 (0.0%) | 0 (0.0%) |
| 2 Unit Apartments | 0 (0.0%) | 0 (0.0%) |
| 3 or 4 Unit Apartments | 0 (0.0%) | 0 (0.0%) |
| 5 to 9 Unit Apartments | 0 (0.0%) | 0 (0.0%) |
| 10 or more Apartments | 0 (0.0%) | 0 (0.0%) |
| Mobile Home / Other | 0 (0.0%) | 0 (0.0%) |
| Total | 131 (100.0%) | 0 (0.0%) |
Housing Structures by Number of Rooms in Shaft
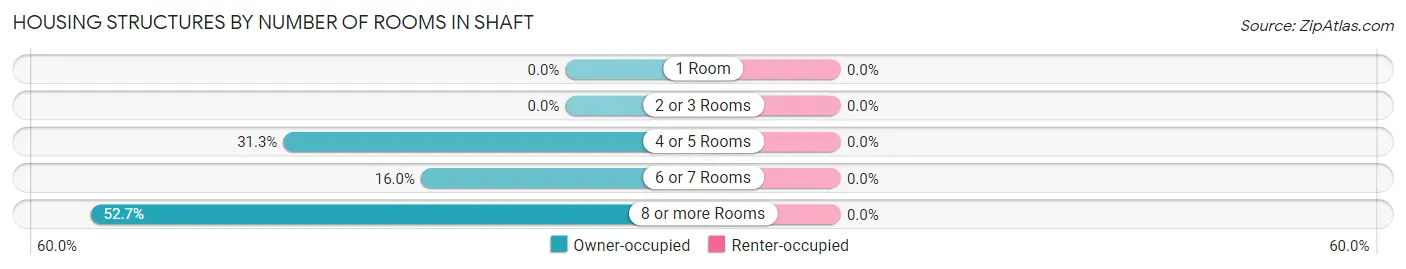
| Number of Rooms | Owner-occupied | Renter-occupied |
| 1 Room | 0 (0.0%) | 0 (0.0%) |
| 2 or 3 Rooms | 0 (0.0%) | 0 (0.0%) |
| 4 or 5 Rooms | 41 (31.3%) | 0 (0.0%) |
| 6 or 7 Rooms | 21 (16.0%) | 0 (0.0%) |
| 8 or more Rooms | 69 (52.7%) | 0 (0.0%) |
| Total | 131 (100.0%) | 0 (0.0%) |
Housing Structure by Heating Type in Shaft
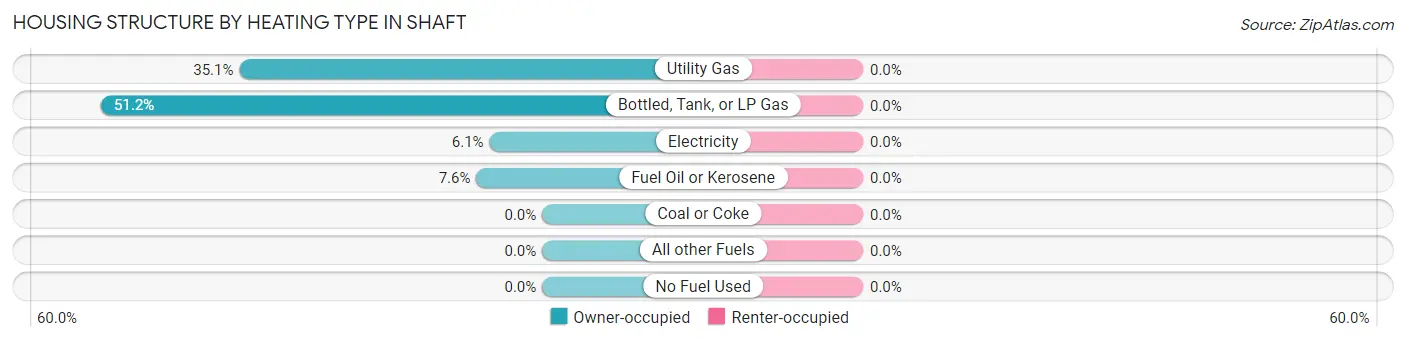
| Heating Type | Owner-occupied | Renter-occupied |
| Utility Gas | 46 (35.1%) | 0 (0.0%) |
| Bottled, Tank, or LP Gas | 67 (51.1%) | 0 (0.0%) |
| Electricity | 8 (6.1%) | 0 (0.0%) |
| Fuel Oil or Kerosene | 10 (7.6%) | 0 (0.0%) |
| Coal or Coke | 0 (0.0%) | 0 (0.0%) |
| All other Fuels | 0 (0.0%) | 0 (0.0%) |
| No Fuel Used | 0 (0.0%) | 0 (0.0%) |
| Total | 131 (100.0%) | 0 (0.0%) |
Household Vehicle Usage in Shaft
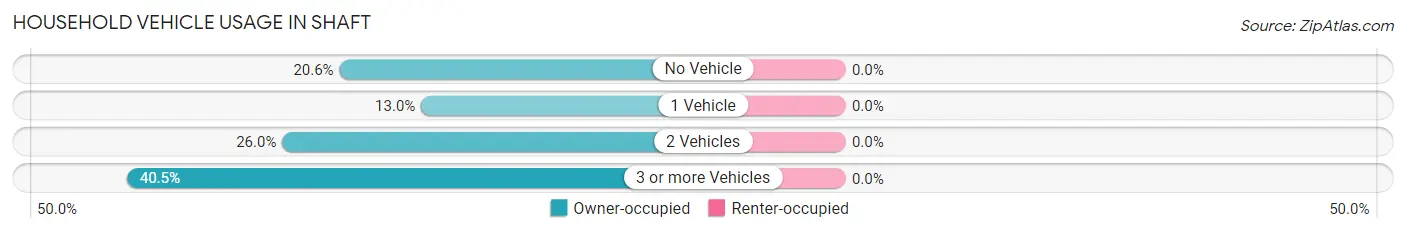
| Vehicles per Household | Owner-occupied | Renter-occupied |
| No Vehicle | 27 (20.6%) | 0 (0.0%) |
| 1 Vehicle | 17 (13.0%) | 0 (0.0%) |
| 2 Vehicles | 34 (26.0%) | 0 (0.0%) |
| 3 or more Vehicles | 53 (40.5%) | 0 (0.0%) |
| Total | 131 (100.0%) | 0 (0.0%) |
Real Estate & Mortgages in Shaft
Real Estate and Mortgage Overview in Shaft
| Characteristic | Without Mortgage | With Mortgage |
| Housing Units | 69 | 62 |
| Median Property Value | - | - |
| Median Household Income | - | - |
| Monthly Housing Costs | $950 | $0 |
| Real Estate Taxes | - | - |
Property Value by Mortgage Status in Shaft
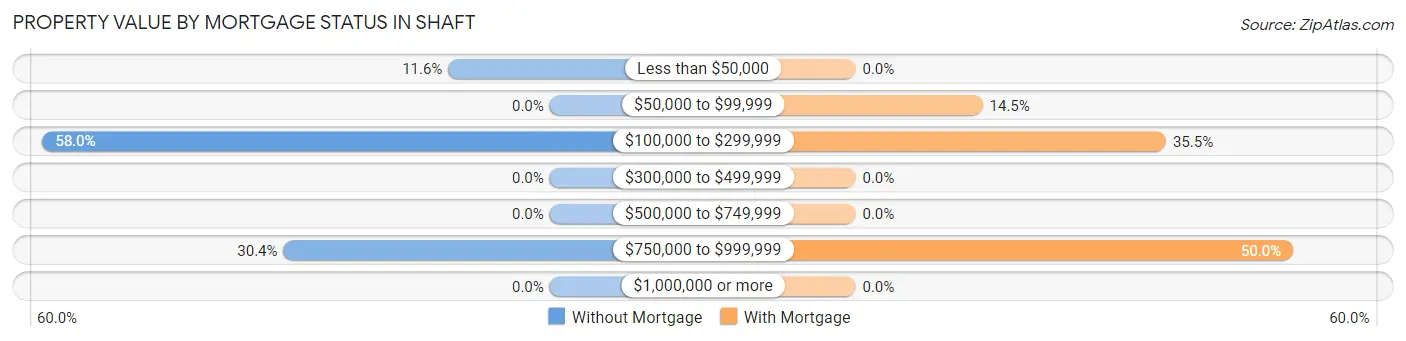
| Property Value | Without Mortgage | With Mortgage |
| Less than $50,000 | 8 (11.6%) | 0 (0.0%) |
| $50,000 to $99,999 | 0 (0.0%) | 9 (14.5%) |
| $100,000 to $299,999 | 40 (58.0%) | 22 (35.5%) |
| $300,000 to $499,999 | 0 (0.0%) | 0 (0.0%) |
| $500,000 to $749,999 | 0 (0.0%) | 0 (0.0%) |
| $750,000 to $999,999 | 21 (30.4%) | 31 (50.0%) |
| $1,000,000 or more | 0 (0.0%) | 0 (0.0%) |
| Total | 69 (100.0%) | 62 (100.0%) |
Household Income by Mortgage Status in Shaft
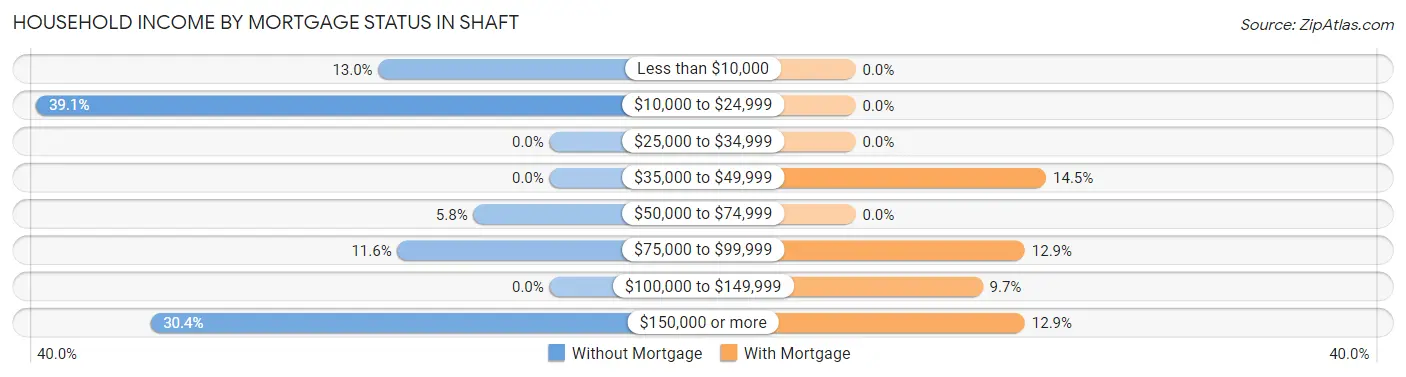
| Household Income | Without Mortgage | With Mortgage |
| Less than $10,000 | 9 (13.0%) | 0 (0.0%) |
| $10,000 to $24,999 | 27 (39.1%) | 0 (0.0%) |
| $25,000 to $34,999 | 0 (0.0%) | 0 (0.0%) |
| $35,000 to $49,999 | 0 (0.0%) | 9 (14.5%) |
| $50,000 to $74,999 | 4 (5.8%) | 0 (0.0%) |
| $75,000 to $99,999 | 8 (11.6%) | 8 (12.9%) |
| $100,000 to $149,999 | 0 (0.0%) | 6 (9.7%) |
| $150,000 or more | 21 (30.4%) | 8 (12.9%) |
| Total | 69 (100.0%) | 62 (100.0%) |
Property Value to Household Income Ratio in Shaft
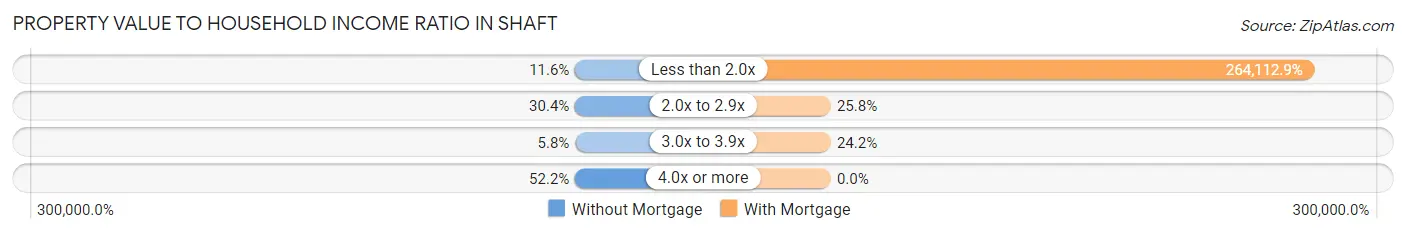
| Value-to-Income Ratio | Without Mortgage | With Mortgage |
| Less than 2.0x | 8 (11.6%) | 163,750 (264,112.9%) |
| 2.0x to 2.9x | 21 (30.4%) | 16 (25.8%) |
| 3.0x to 3.9x | 4 (5.8%) | 15 (24.2%) |
| 4.0x or more | 36 (52.2%) | 0 (0.0%) |
| Total | 69 (100.0%) | 62 (100.0%) |
Real Estate Taxes by Mortgage Status in Shaft
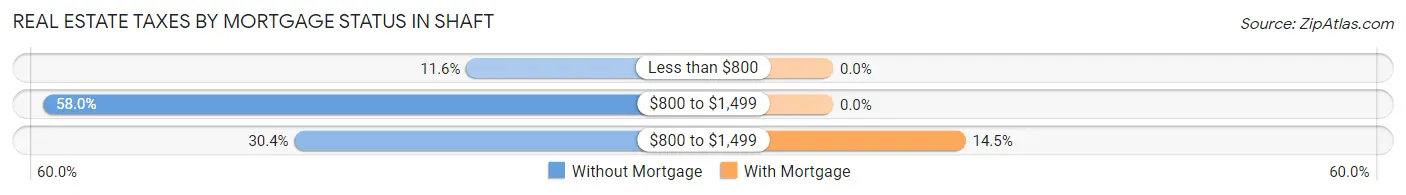
| Property Taxes | Without Mortgage | With Mortgage |
| Less than $800 | 8 (11.6%) | 0 (0.0%) |
| $800 to $1,499 | 40 (58.0%) | 0 (0.0%) |
| $800 to $1,499 | 21 (30.4%) | 9 (14.5%) |
| Total | 69 (100.0%) | 62 (100.0%) |
Health & Disability in Shaft
Health Insurance Coverage by Age in Shaft
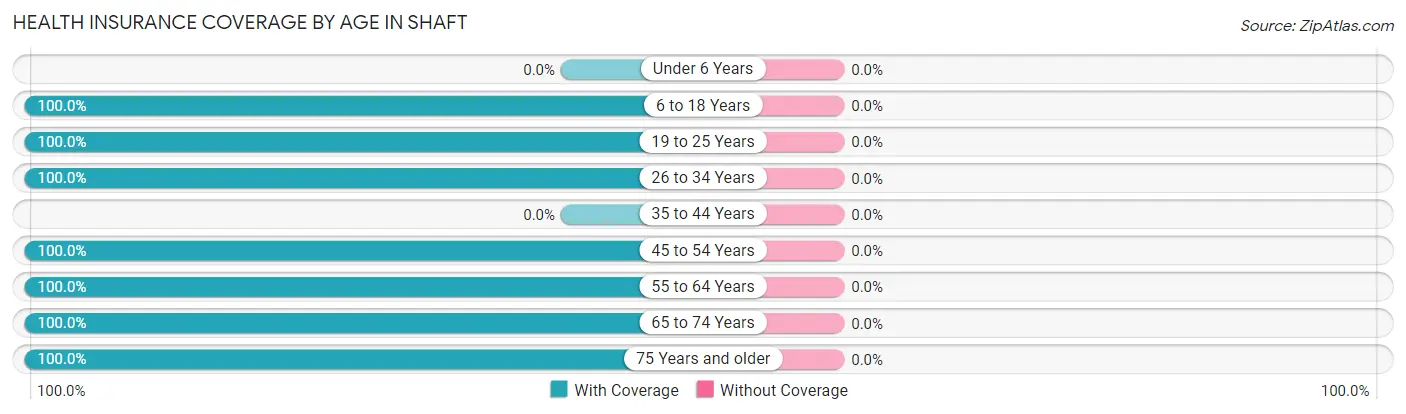
| Age Bracket | With Coverage | Without Coverage |
| Under 6 Years | 0 (0.0%) | 0 (0.0%) |
| 6 to 18 Years | 22 (100.0%) | 0 (0.0%) |
| 19 to 25 Years | 15 (100.0%) | 0 (0.0%) |
| 26 to 34 Years | 10 (100.0%) | 0 (0.0%) |
| 35 to 44 Years | 0 (0.0%) | 0 (0.0%) |
| 45 to 54 Years | 39 (100.0%) | 0 (0.0%) |
| 55 to 64 Years | 133 (100.0%) | 0 (0.0%) |
| 65 to 74 Years | 37 (100.0%) | 0 (0.0%) |
| 75 Years and older | 25 (100.0%) | 0 (0.0%) |
| Total | 281 (100.0%) | 0 (0.0%) |
Health Insurance Coverage by Citizenship Status in Shaft
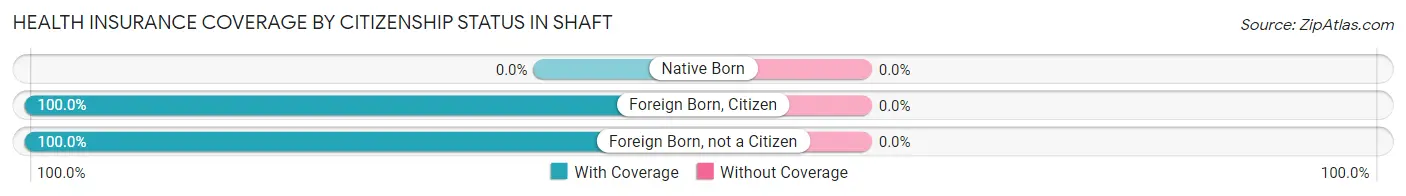
| Citizenship Status | With Coverage | Without Coverage |
| Native Born | 0 (0.0%) | 0 (0.0%) |
| Foreign Born, Citizen | 22 (100.0%) | 0 (0.0%) |
| Foreign Born, not a Citizen | 15 (100.0%) | 0 (0.0%) |
Health Insurance Coverage by Household Income in Shaft
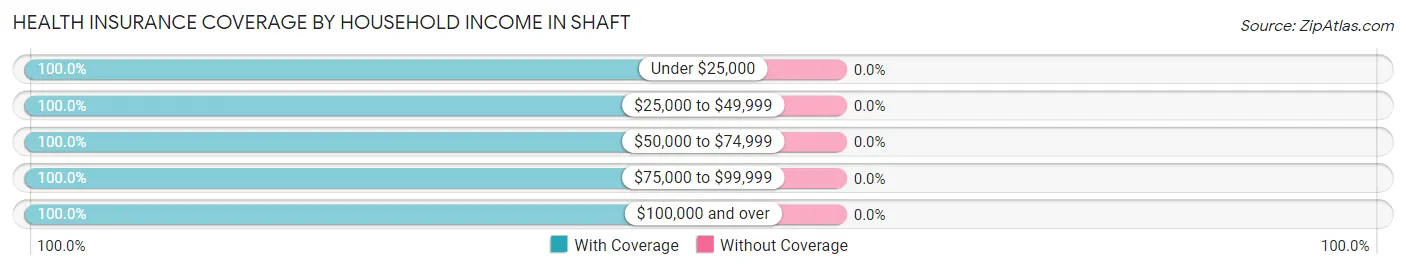
| Household Income | With Coverage | Without Coverage |
| Under $25,000 | 43 (100.0%) | 0 (0.0%) |
| $25,000 to $49,999 | 17 (100.0%) | 0 (0.0%) |
| $50,000 to $74,999 | 25 (100.0%) | 0 (0.0%) |
| $75,000 to $99,999 | 51 (100.0%) | 0 (0.0%) |
| $100,000 and over | 145 (100.0%) | 0 (0.0%) |
Public vs Private Health Insurance Coverage by Age in Shaft
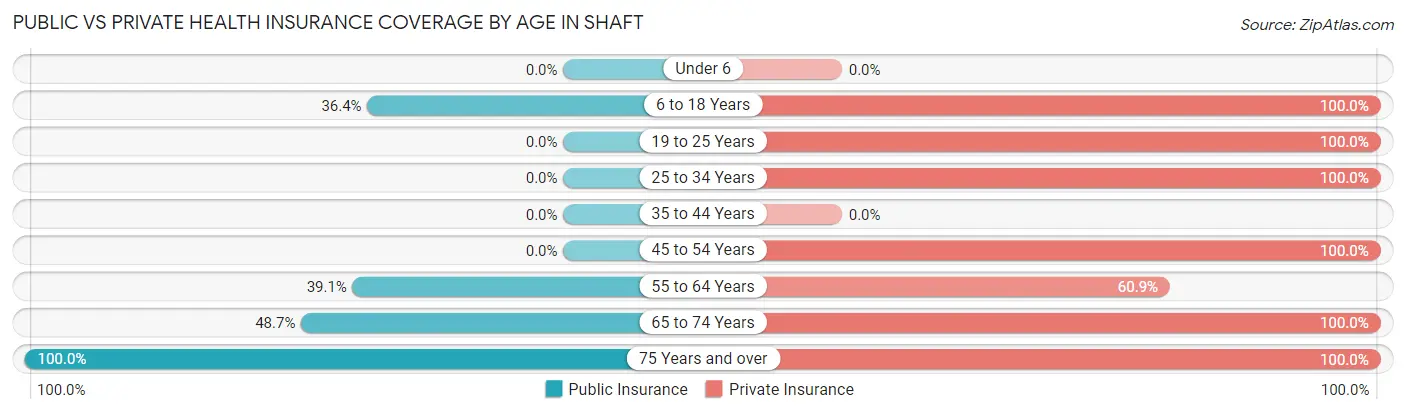
| Age Bracket | Public Insurance | Private Insurance |
| Under 6 | 0 (0.0%) | 0 (0.0%) |
| 6 to 18 Years | 8 (36.4%) | 22 (100.0%) |
| 19 to 25 Years | 0 (0.0%) | 15 (100.0%) |
| 25 to 34 Years | 0 (0.0%) | 10 (100.0%) |
| 35 to 44 Years | 0 (0.0%) | 0 (0.0%) |
| 45 to 54 Years | 0 (0.0%) | 39 (100.0%) |
| 55 to 64 Years | 52 (39.1%) | 81 (60.9%) |
| 65 to 74 Years | 18 (48.6%) | 37 (100.0%) |
| 75 Years and over | 25 (100.0%) | 25 (100.0%) |
| Total | 103 (36.6%) | 229 (81.5%) |
Disability Status by Sex by Age in Shaft
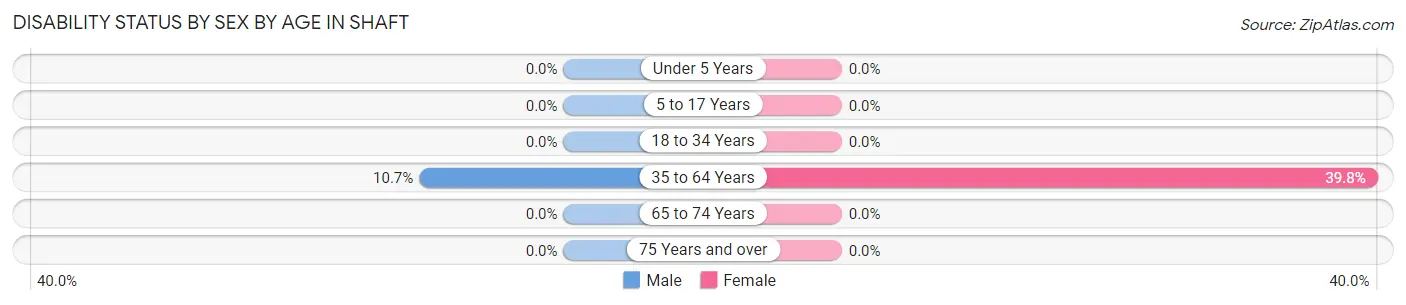
| Age Bracket | Male | Female |
| Under 5 Years | 0 (0.0%) | 0 (0.0%) |
| 5 to 17 Years | 0 (0.0%) | 0 (0.0%) |
| 18 to 34 Years | 0 (0.0%) | 0 (0.0%) |
| 35 to 64 Years | 9 (10.7%) | 35 (39.8%) |
| 65 to 74 Years | 0 (0.0%) | 0 (0.0%) |
| 75 Years and over | 0 (0.0%) | 0 (0.0%) |
Disability Class by Sex by Age in Shaft
Disability Class: Hearing Difficulty
| Age Bracket | Male | Female |
| Under 5 Years | 0 (0.0%) | 0 (0.0%) |
| 5 to 17 Years | 0 (0.0%) | 0 (0.0%) |
| 18 to 34 Years | 0 (0.0%) | 0 (0.0%) |
| 35 to 64 Years | 0 (0.0%) | 0 (0.0%) |
| 65 to 74 Years | 0 (0.0%) | 0 (0.0%) |
| 75 Years and over | 0 (0.0%) | 0 (0.0%) |
Disability Class: Vision Difficulty
| Age Bracket | Male | Female |
| Under 5 Years | 0 (0.0%) | 0 (0.0%) |
| 5 to 17 Years | 0 (0.0%) | 0 (0.0%) |
| 18 to 34 Years | 0 (0.0%) | 0 (0.0%) |
| 35 to 64 Years | 0 (0.0%) | 0 (0.0%) |
| 65 to 74 Years | 0 (0.0%) | 0 (0.0%) |
| 75 Years and over | 0 (0.0%) | 0 (0.0%) |
Disability Class: Cognitive Difficulty
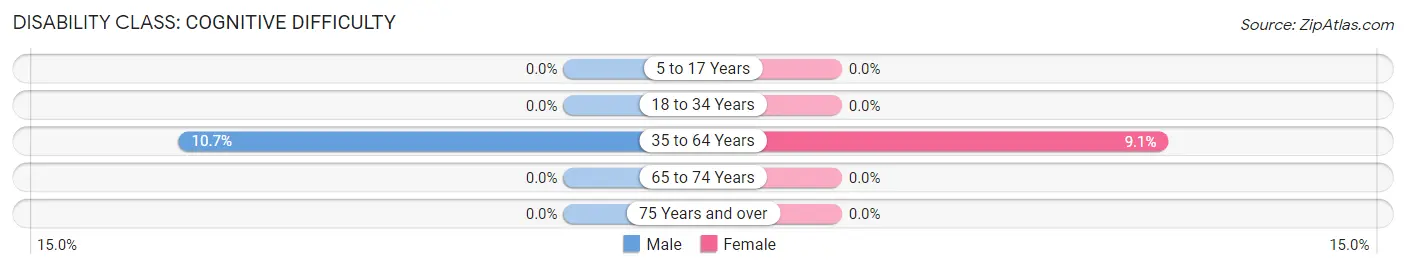
| Age Bracket | Male | Female |
| 5 to 17 Years | 0 (0.0%) | 0 (0.0%) |
| 18 to 34 Years | 0 (0.0%) | 0 (0.0%) |
| 35 to 64 Years | 9 (10.7%) | 8 (9.1%) |
| 65 to 74 Years | 0 (0.0%) | 0 (0.0%) |
| 75 Years and over | 0 (0.0%) | 0 (0.0%) |
Disability Class: Ambulatory Difficulty
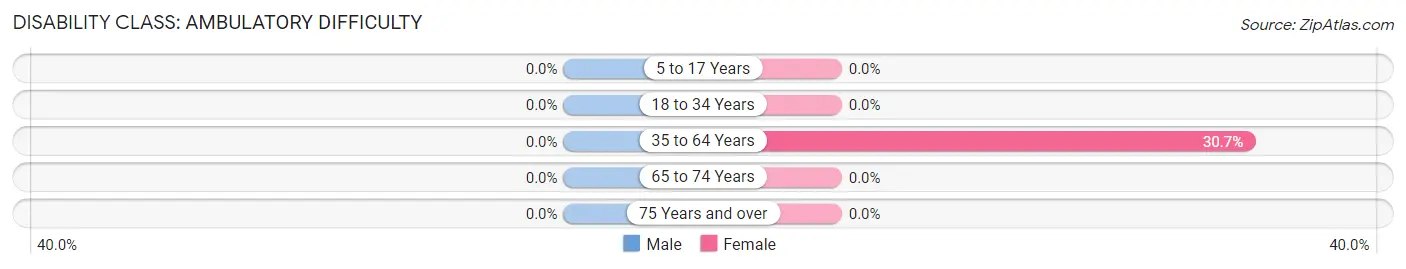
| Age Bracket | Male | Female |
| 5 to 17 Years | 0 (0.0%) | 0 (0.0%) |
| 18 to 34 Years | 0 (0.0%) | 0 (0.0%) |
| 35 to 64 Years | 0 (0.0%) | 27 (30.7%) |
| 65 to 74 Years | 0 (0.0%) | 0 (0.0%) |
| 75 Years and over | 0 (0.0%) | 0 (0.0%) |
Disability Class: Self-Care Difficulty
| Age Bracket | Male | Female |
| 5 to 17 Years | 0 (0.0%) | 0 (0.0%) |
| 18 to 34 Years | 0 (0.0%) | 0 (0.0%) |
| 35 to 64 Years | 0 (0.0%) | 0 (0.0%) |
| 65 to 74 Years | 0 (0.0%) | 0 (0.0%) |
| 75 Years and over | 0 (0.0%) | 0 (0.0%) |
Technology Access in Shaft
Computing Device Access in Shaft
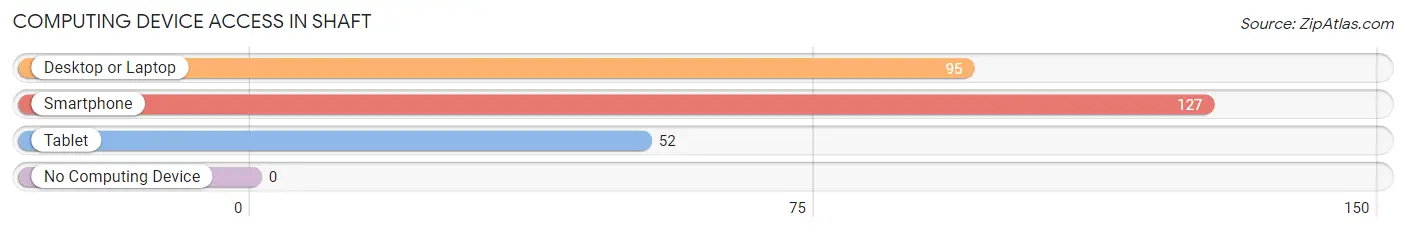
| Device Type | # Households | % Households |
| Desktop or Laptop | 95 | 72.5% |
| Smartphone | 127 | 97.0% |
| Tablet | 52 | 39.7% |
| No Computing Device | 0 | 0.0% |
| Total | 131 | 100.0% |
Internet Access in Shaft
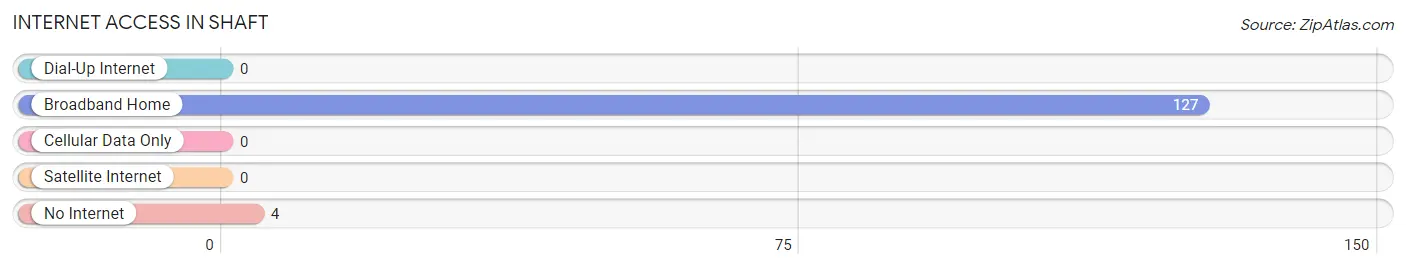
| Internet Type | # Households | % Households |
| Dial-Up Internet | 0 | 0.0% |
| Broadband Home | 127 | 97.0% |
| Cellular Data Only | 0 | 0.0% |
| Satellite Internet | 0 | 0.0% |
| No Internet | 4 | 3.0% |
| Total | 131 | 100.0% |
Shaft Summary
Shaft is a small unincorporated community located in Montgomery County, Maryland. It is situated in the northern part of the county, approximately 10 miles north of the county seat of Rockville. The community is bordered by the towns of Poolesville to the north, Germantown to the east, and Gaithersburg to the south.
History
The area that is now Shaft was first settled in the late 1700s by German and English immigrants. The community was originally known as “Shaft’s Crossroads”, named after the intersection of two major roads, Shaft Road and Germantown Road. The area was primarily agricultural, with small farms and orchards dotting the landscape.
In the early 1900s, the area began to experience rapid growth as the Washington, D.C. metropolitan area expanded. The community was incorporated as a town in 1952, and the name was officially changed to Shaft.
Geography
Shaft is located in the northern part of Montgomery County, approximately 10 miles north of the county seat of Rockville. The community is bordered by the towns of Poolesville to the north, Germantown to the east, and Gaithersburg to the south.
The terrain of Shaft is mostly flat, with some rolling hills in the northern part of the community. The area is heavily wooded, with a mix of deciduous and evergreen trees. The community is located in the Piedmont region of Maryland, and is part of the Chesapeake Bay watershed.
Economy
The economy of Shaft is largely based on the service industry. The community is home to a variety of restaurants, retail stores, and other businesses. The area also has a number of small manufacturing companies, as well as a few larger corporations.
The community is also home to a number of government agencies, including the National Institutes of Health, the National Institute of Standards and Technology, and the National Oceanic and Atmospheric Administration.
Demographics
As of the 2010 census, the population of Shaft was 8,845. The racial makeup of the community was 79.3% White, 11.2% African American, 4.2% Asian, and 4.3% Hispanic or Latino. The median household income was $90,845, and the median home value was $400,000.
The majority of the population is employed in the service industry, with a smaller percentage employed in manufacturing and government. The unemployment rate in Shaft is lower than the national average, at 4.2%.
Conclusion
Shaft is a small unincorporated community located in Montgomery County, Maryland. It is situated in the northern part of the county, approximately 10 miles north of the county seat of Rockville. The community is bordered by the towns of Poolesville to the north, Germantown to the east, and Gaithersburg to the south. The economy of Shaft is largely based on the service industry, with a variety of restaurants, retail stores, and other businesses. The population of Shaft is 8,845, with a median household income of $90,845 and a median home value of $400,000. The unemployment rate in Shaft is lower than the national average, at 4.2%.
Common Questions
What is Per Capita Income in Shaft?
Per Capita income in Shaft is $59,750.
What is the Median Family Income in Shaft?
Median Family Income in Shaft is $178,145.
What is Income or Wage Gap in Shaft?
Income or Wage Gap in Shaft is 5.5%.
Women in Shaft earn 94.5 cents for every dollar earned by a man.
What is Inequality or Gini Index in Shaft?
Inequality or Gini Index in Shaft is 0.49.
What is the Total Population of Shaft?
Total Population of Shaft is 281.
What is the Total Male Population of Shaft?
Total Male Population of Shaft is 126.
What is the Total Female Population of Shaft?
Total Female Population of Shaft is 155.
What is the Ratio of Males per 100 Females in Shaft?
There are 81.29 Males per 100 Females in Shaft.
What is the Ratio of Females per 100 Males in Shaft?
There are 123.02 Females per 100 Males in Shaft.
What is the Median Population Age in Shaft?
Median Population Age in Shaft is 58.5 Years.
What is the Average Family Size in Shaft
Average Family Size in Shaft is 2.5 People.
What is the Average Household Size in Shaft
Average Household Size in Shaft is 2.1 People.
How Large is the Labor Force in Shaft?
There are 169 People in the Labor Forcein in Shaft.
What is the Percentage of People in the Labor Force in Shaft?
65.3% of People are in the Labor Force in Shaft.
What is the Unemployment Rate in Shaft?
Unemployment Rate in Shaft is 8.9%.