Cities with the Highest Percentage of Households Heated by Coal or Coke in Maryland
RELATED REPORTS & OPTIONS
Coal / Coke Heating
Maryland
Compare Cities
Map of Cities with the Highest Percentage of Households Heated by Coal or Coke in Maryland
0.0%
30.0%
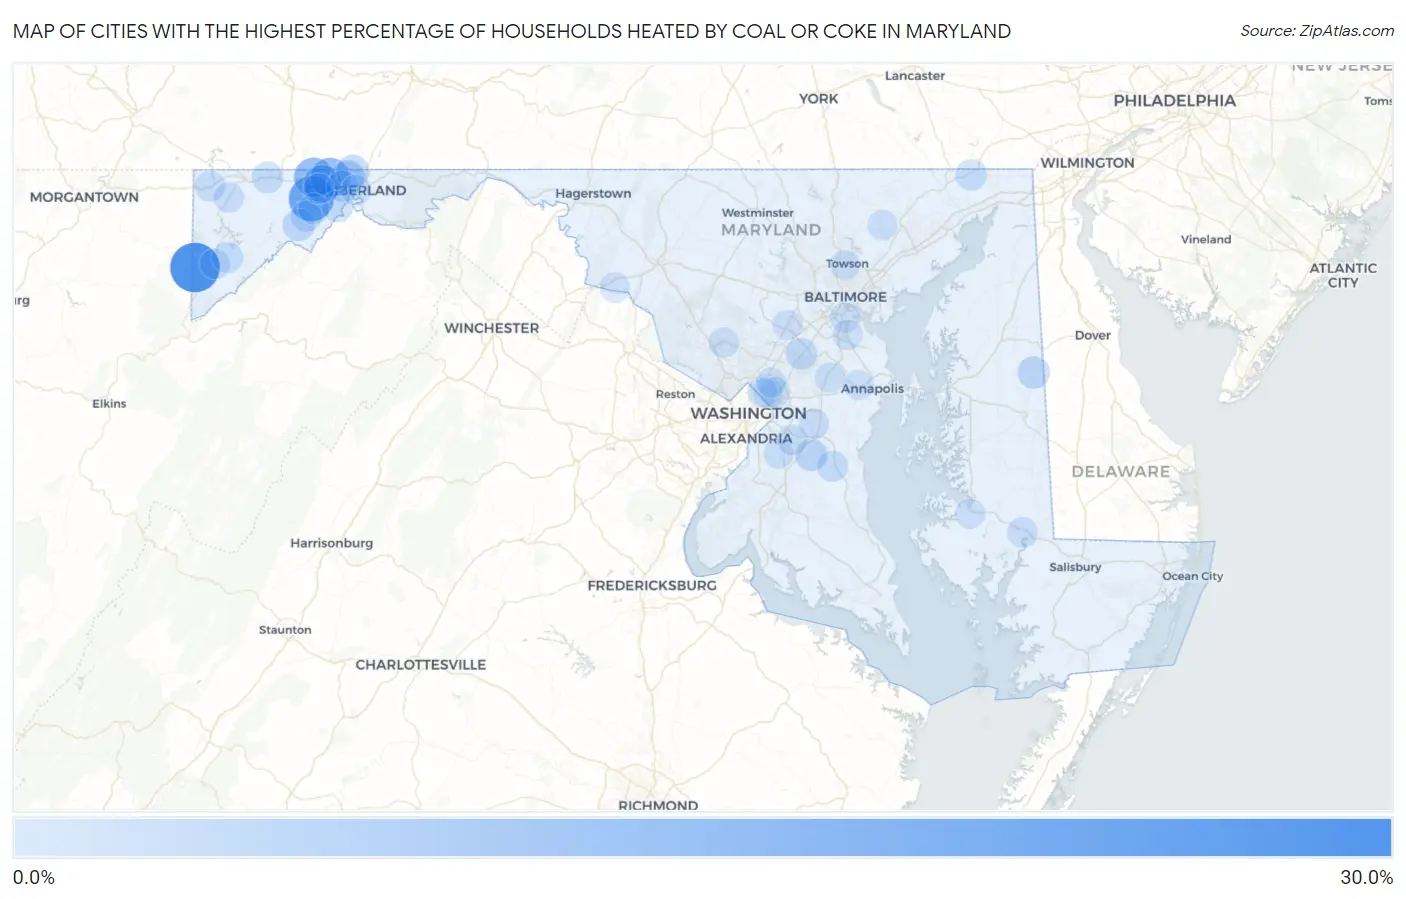
Cities with the Highest Percentage of Households Heated by Coal or Coke in Maryland
| City | Coal / Coke Heating | vs State | vs National | |
| 1. | Crellin | 26.4% | 0.10%(+26.3)#1 | 0.10%(+26.3)#28 |
| 2. | Carlos | 20.0% | 0.10%(+19.9)#2 | 0.10%(+19.9)#48 |
| 3. | Finzel | 12.7% | 0.10%(+12.6)#3 | 0.10%(+12.6)#129 |
| 4. | Mount Savage | 12.3% | 0.10%(+12.2)#4 | 0.10%(+12.2)#134 |
| 5. | Zihlman | 10.2% | 0.10%(+10.1)#5 | 0.10%(+10.1)#178 |
| 6. | Corriganville | 5.4% | 0.10%(+5.30)#6 | 0.10%(+5.30)#332 |
| 7. | Ellerslie | 3.4% | 0.10%(+3.30)#7 | 0.10%(+3.30)#453 |
| 8. | Croom | 2.9% | 0.10%(+2.80)#8 | 0.10%(+2.80)#490 |
| 9. | Goldsboro | 2.9% | 0.10%(+2.80)#9 | 0.10%(+2.80)#501 |
| 10. | Barton | 2.8% | 0.10%(+2.70)#10 | 0.10%(+2.70)#509 |
| 11. | La Vale | 2.1% | 0.10%(+2.00)#11 | 0.10%(+2.00)#593 |
| 12. | Maryland City | 2.0% | 0.10%(+1.90)#12 | 0.10%(+1.90)#611 |
| 13. | Cresaptown | 1.9% | 0.10%(+1.80)#13 | 0.10%(+1.80)#637 |
| 14. | Grantsville | 1.9% | 0.10%(+1.80)#14 | 0.10%(+1.80)#648 |
| 15. | Rising Sun | 1.5% | 0.10%(+1.40)#15 | 0.10%(+1.40)#735 |
| 16. | Lonaconing | 1.5% | 0.10%(+1.40)#16 | 0.10%(+1.40)#741 |
| 17. | Deer Park | 1.3% | 0.10%(+1.20)#17 | 0.10%(+1.20)#802 |
| 18. | Dunkirk | 1.2% | 0.10%(+1.10)#18 | 0.10%(+1.10)#811 |
| 19. | Midland | 1.2% | 0.10%(+1.10)#19 | 0.10%(+1.10)#823 |
| 20. | Friendsville | 0.90% | 0.10%(+0.800)#20 | 0.10%(+0.800)#916 |
| 21. | Green Valley | 0.80% | 0.10%(+0.700)#21 | 0.10%(+0.700)#924 |
| 22. | Vienna | 0.80% | 0.10%(+0.700)#22 | 0.10%(+0.700)#966 |
| 23. | Melwood | 0.70% | 0.10%(+0.600)#23 | 0.10%(+0.600)#985 |
| 24. | Mountain Lake Park | 0.70% | 0.10%(+0.600)#24 | 0.10%(+0.600)#998 |
| 25. | Frostburg | 0.60% | 0.10%(+0.500)#25 | 0.10%(+0.500)#1,035 |
| 26. | Hyattsville | 0.50% | 0.10%(+0.400)#26 | 0.10%(+0.400)#1,083 |
| 27. | Accident | 0.50% | 0.10%(+0.400)#27 | 0.10%(+0.400)#1,162 |
| 28. | Brock Hall | 0.40% | 0.10%(+0.300)#28 | 0.10%(+0.300)#1,174 |
| 29. | Crofton | 0.30% | 0.10%(+0.200)#29 | 0.10%(+0.200)#1,223 |
| 30. | Cumberland | 0.30% | 0.10%(+0.200)#30 | 0.10%(+0.200)#1,231 |
| 31. | Redland | 0.30% | 0.10%(+0.200)#31 | 0.10%(+0.200)#1,235 |
| 32. | Brooklyn Park | 0.30% | 0.10%(+0.200)#32 | 0.10%(+0.200)#1,242 |
| 33. | Cambridge | 0.30% | 0.10%(+0.200)#33 | 0.10%(+0.200)#1,249 |
| 34. | Fallston | 0.30% | 0.10%(+0.200)#34 | 0.10%(+0.200)#1,254 |
| 35. | Brunswick | 0.30% | 0.10%(+0.200)#35 | 0.10%(+0.200)#1,273 |
| 36. | Riverdale Park | 0.30% | 0.10%(+0.200)#36 | 0.10%(+0.200)#1,274 |
| 37. | Clinton | 0.20% | 0.10%(+0.100)#37 | 0.10%(+0.100)#1,320 |
| 38. | Chillum | 0.20% | 0.10%(+0.100)#38 | 0.10%(+0.100)#1,324 |
| 39. | Parole | 0.20% | 0.10%(+0.100)#39 | 0.10%(+0.100)#1,349 |
| 40. | Columbia | 0.10% | 0.10%(=0.000)#40 | 0.10%(=0.000)#1,408 |
| 41. | Glen Burnie | 0.10% | 0.10%(=0.000)#41 | 0.10%(=0.000)#1,430 |
| 42. | Towson | 0.10% | 0.10%(=0.000)#42 | 0.10%(=0.000)#1,452 |
| 43. | College Park | 0.10% | 0.10%(=0.000)#43 | 0.10%(=0.000)#1,501 |
Common Questions
What are the Top 10 Cities with the Highest Percentage of Households Heated by Coal or Coke in Maryland?
Top 10 Cities with the Highest Percentage of Households Heated by Coal or Coke in Maryland are:
#1
26.4%
#2
20.0%
#3
12.7%
#4
12.3%
#5
10.2%
#6
5.4%
#7
3.4%
#8
2.9%
#9
2.9%
#10
2.8%
What city has the Highest Percentage of Households Heated by Coal or Coke in Maryland?
Crellin has the Highest Percentage of Households Heated by Coal or Coke in Maryland with 26.4%.
What is the Percentage of Households Heated by Coal or Coke in the State of Maryland?
Percentage of Households Heated by Coal or Coke in Maryland is 0.10%.
What is the Percentage of Households Heated by Coal or Coke in the United States?
Percentage of Households Heated by Coal or Coke in the United States is 0.10%.