Potomac Park, MD Map & Demographics
Potomac Park Map
Potomac Park Overview
$31,570
PER CAPITA INCOME
$51,731
AVG FAMILY INCOME
$47,857
AVG HOUSEHOLD INCOME
50.1%
WAGE / INCOME GAP [ % ]
49.9¢/ $1
WAGE / INCOME GAP [ $ ]
0.39
INEQUALITY / GINI INDEX
976
TOTAL POPULATION
495
MALE POPULATION
481
FEMALE POPULATION
102.91
MALES / 100 FEMALES
97.17
FEMALES / 100 MALES
44.6
MEDIAN AGE
2.5
AVG FAMILY SIZE
2.2
AVG HOUSEHOLD SIZE
466
LABOR FORCE [ PEOPLE ]
57.7%
PERCENT IN LABOR FORCE
5.8%
UNEMPLOYMENT RATE
Income in Potomac Park
Income Overview in Potomac Park
Per Capita Income in Potomac Park is $31,570, while median incomes of families and households are $51,731 and $47,857 respectively.
| Characteristic | Number | Measure |
| Per Capita Income | 976 | $31,570 |
| Median Family Income | 308 | $51,731 |
| Mean Family Income | 308 | $77,187 |
| Median Household Income | 438 | $47,857 |
| Mean Household Income | 438 | $67,062 |
| Income Deficit | 308 | $0 |
| Wage / Income Gap (%) | 976 | 50.09% |
| Wage / Income Gap ($) | 976 | 49.91¢ per $1 |
| Gini / Inequality Index | 976 | 0.39 |
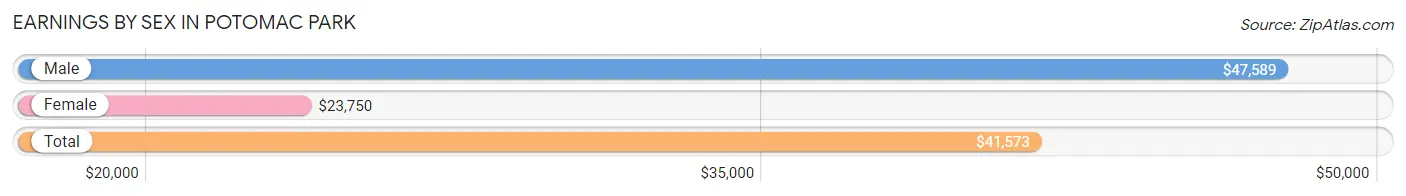
Earnings by Sex in Potomac Park
Average Earnings in Potomac Park are $41,573, $47,589 for men and $23,750 for women, a difference of 50.1%.
| Sex | Number | Average Earnings |
| Male | 303 (64.1%) | $47,589 |
| Female | 170 (35.9%) | $23,750 |
| Total | 473 (100.0%) | $41,573 |
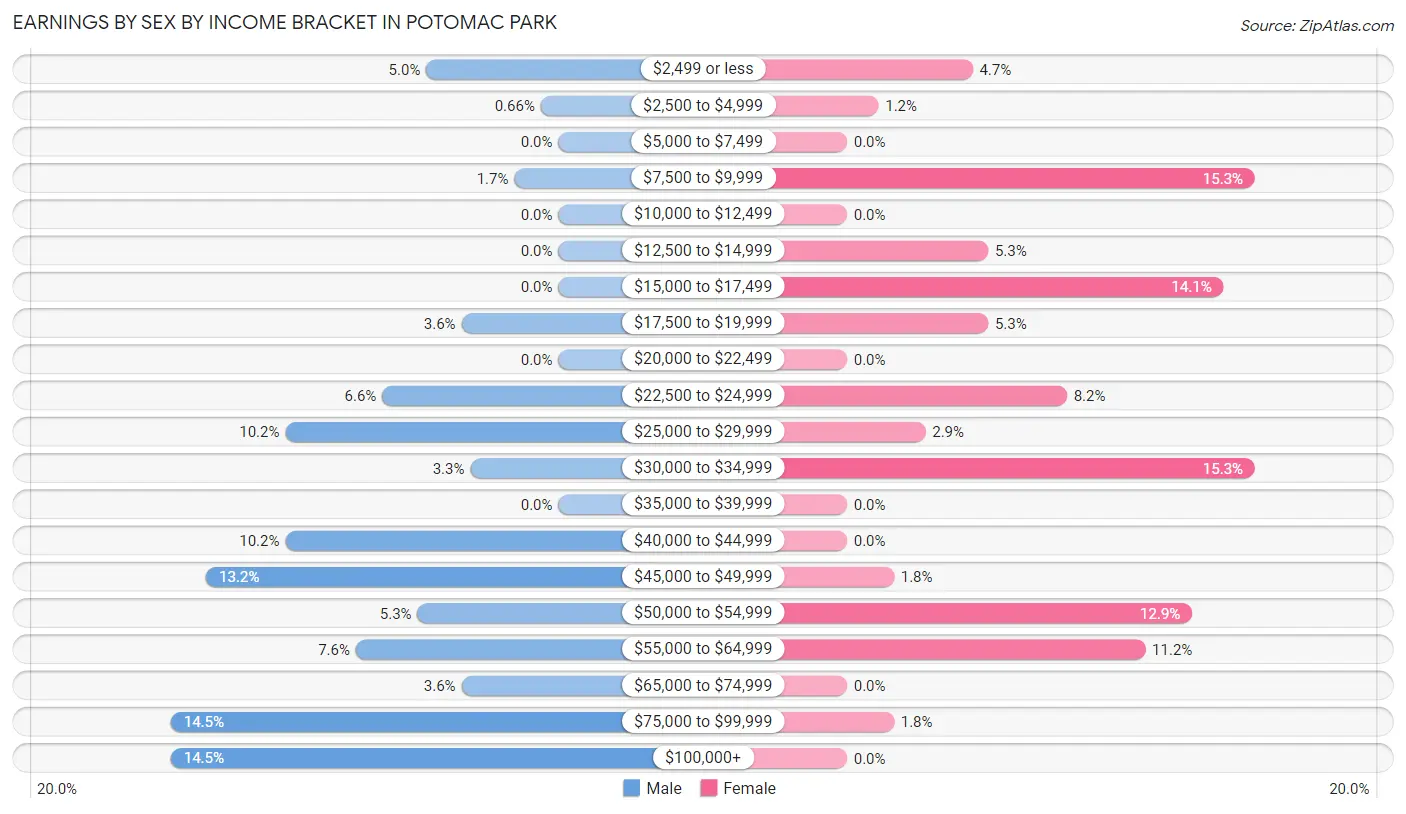
Earnings by Sex by Income Bracket in Potomac Park
The most common earnings brackets in Potomac Park are $75,000 to $99,999 for men (44 | 14.5%) and $7,500 to $9,999 for women (26 | 15.3%).
| Income | Male | Female |
| $2,499 or less | 15 (5.0%) | 8 (4.7%) |
| $2,500 to $4,999 | 2 (0.7%) | 2 (1.2%) |
| $5,000 to $7,499 | 0 (0.0%) | 0 (0.0%) |
| $7,500 to $9,999 | 5 (1.7%) | 26 (15.3%) |
| $10,000 to $12,499 | 0 (0.0%) | 0 (0.0%) |
| $12,500 to $14,999 | 0 (0.0%) | 9 (5.3%) |
| $15,000 to $17,499 | 0 (0.0%) | 24 (14.1%) |
| $17,500 to $19,999 | 11 (3.6%) | 9 (5.3%) |
| $20,000 to $22,499 | 0 (0.0%) | 0 (0.0%) |
| $22,500 to $24,999 | 20 (6.6%) | 14 (8.2%) |
| $25,000 to $29,999 | 31 (10.2%) | 5 (2.9%) |
| $30,000 to $34,999 | 10 (3.3%) | 26 (15.3%) |
| $35,000 to $39,999 | 0 (0.0%) | 0 (0.0%) |
| $40,000 to $44,999 | 31 (10.2%) | 0 (0.0%) |
| $45,000 to $49,999 | 40 (13.2%) | 3 (1.8%) |
| $50,000 to $54,999 | 16 (5.3%) | 22 (12.9%) |
| $55,000 to $64,999 | 23 (7.6%) | 19 (11.2%) |
| $65,000 to $74,999 | 11 (3.6%) | 0 (0.0%) |
| $75,000 to $99,999 | 44 (14.5%) | 3 (1.8%) |
| $100,000+ | 44 (14.5%) | 0 (0.0%) |
| Total | 303 (100.0%) | 170 (100.0%) |
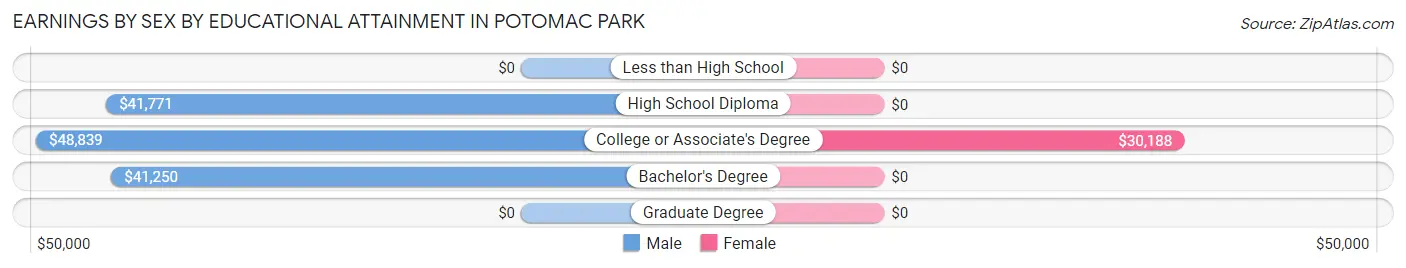
Earnings by Sex by Educational Attainment in Potomac Park
Average earnings in Potomac Park are $47,768 for men and $30,500 for women, a difference of 36.1%. Men with an educational attainment of college or associate's degree enjoy the highest average annual earnings of $48,839, while those with bachelor's degree education earn the least with $41,250. Women with an educational attainment of college or associate's degree earn the most with the average annual earnings of $30,188, while those with college or associate's degree education have the smallest earnings of $30,188.
| Educational Attainment | Male Income | Female Income |
| Less than High School | - | - |
| High School Diploma | $41,771 | $0 |
| College or Associate's Degree | $48,839 | $30,188 |
| Bachelor's Degree | $41,250 | $0 |
| Graduate Degree | - | - |
| Total | $47,768 | $30,500 |
Family Income in Potomac Park
Family Income Brackets in Potomac Park
According to the Potomac Park family income data, there are 66 families falling into the $35,000 to $49,999 income range, which is the most common income bracket and makes up 21.4% of all families. Conversely, the $10,000 to $14,999 income bracket is the least frequent group with only 6 families (1.9%) belonging to this category.
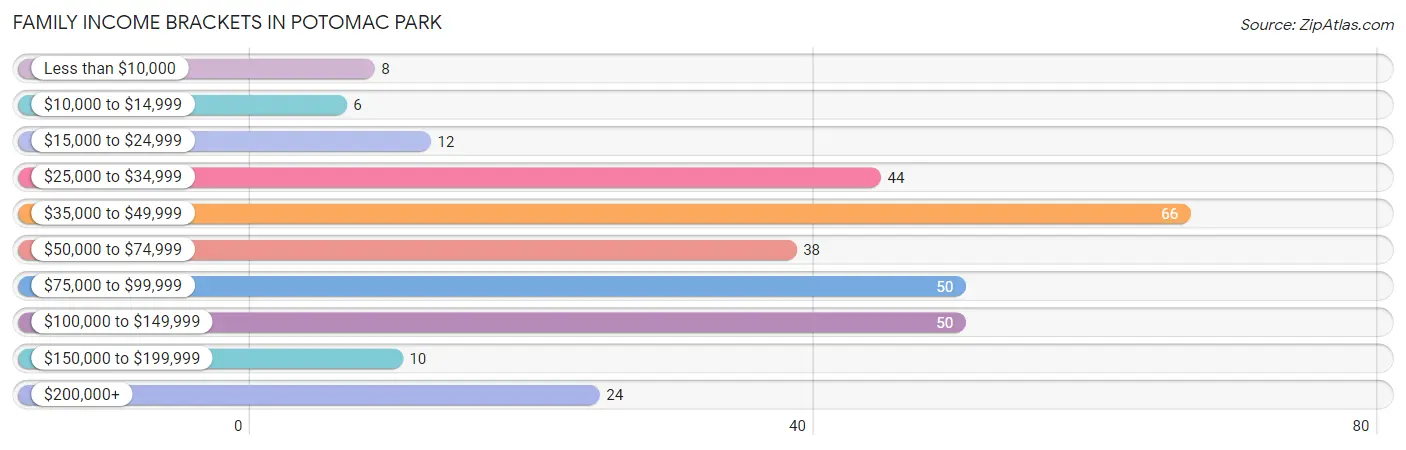
| Income Bracket | # Families | % Families |
| Less than $10,000 | 8 | 2.6% |
| $10,000 to $14,999 | 6 | 1.9% |
| $15,000 to $24,999 | 12 | 3.9% |
| $25,000 to $34,999 | 44 | 14.3% |
| $35,000 to $49,999 | 66 | 21.4% |
| $50,000 to $74,999 | 38 | 12.3% |
| $75,000 to $99,999 | 50 | 16.2% |
| $100,000 to $149,999 | 50 | 16.2% |
| $150,000 to $199,999 | 10 | 3.2% |
| $200,000+ | 24 | 7.8% |
Family Income by Famaliy Size in Potomac Park
4-person families (47 | 15.3%) account for the highest median family income in Potomac Park with $95,486 per family, while 3-person families (48 | 15.6%) have the highest median income of $25,530 per family member.
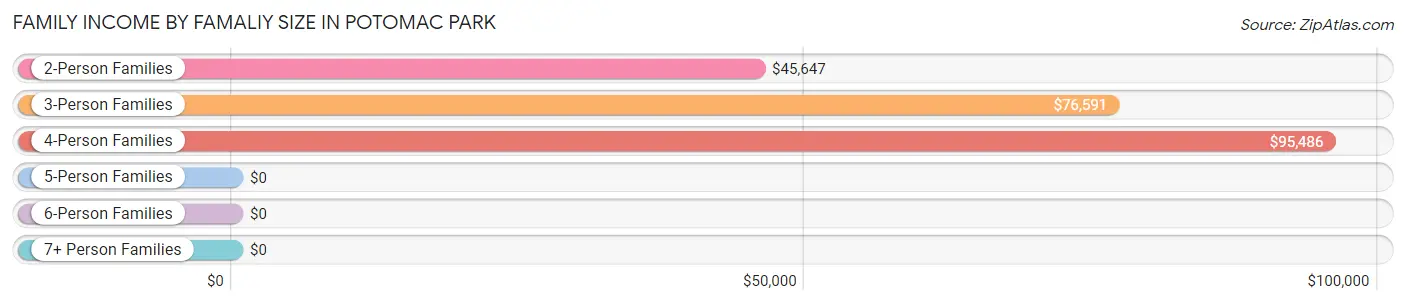
| Income Bracket | # Families | Median Income |
| 2-Person Families | 213 (69.2%) | $45,647 |
| 3-Person Families | 48 (15.6%) | $76,591 |
| 4-Person Families | 47 (15.3%) | $95,486 |
| 5-Person Families | 0 (0.0%) | $0 |
| 6-Person Families | 0 (0.0%) | $0 |
| 7+ Person Families | 0 (0.0%) | $0 |
| Total | 308 (100.0%) | $51,731 |
Family Income by Number of Earners in Potomac Park
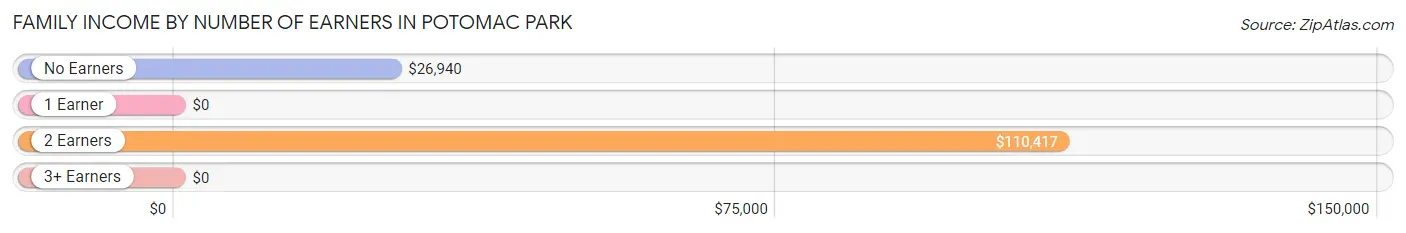
| Number of Earners | # Families | Median Income |
| No Earners | 81 (26.3%) | $26,940 |
| 1 Earner | 110 (35.7%) | $0 |
| 2 Earners | 101 (32.8%) | $110,417 |
| 3+ Earners | 16 (5.2%) | $0 |
| Total | 308 (100.0%) | $51,731 |
Household Income in Potomac Park
Household Income Brackets in Potomac Park
With 85 households falling in the category, the $35,000 to $49,999 income range is the most frequent in Potomac Park, accounting for 19.4% of all households. In contrast, only 5 households (1.1%) fall into the less than $10,000 income bracket, making it the least populous group.
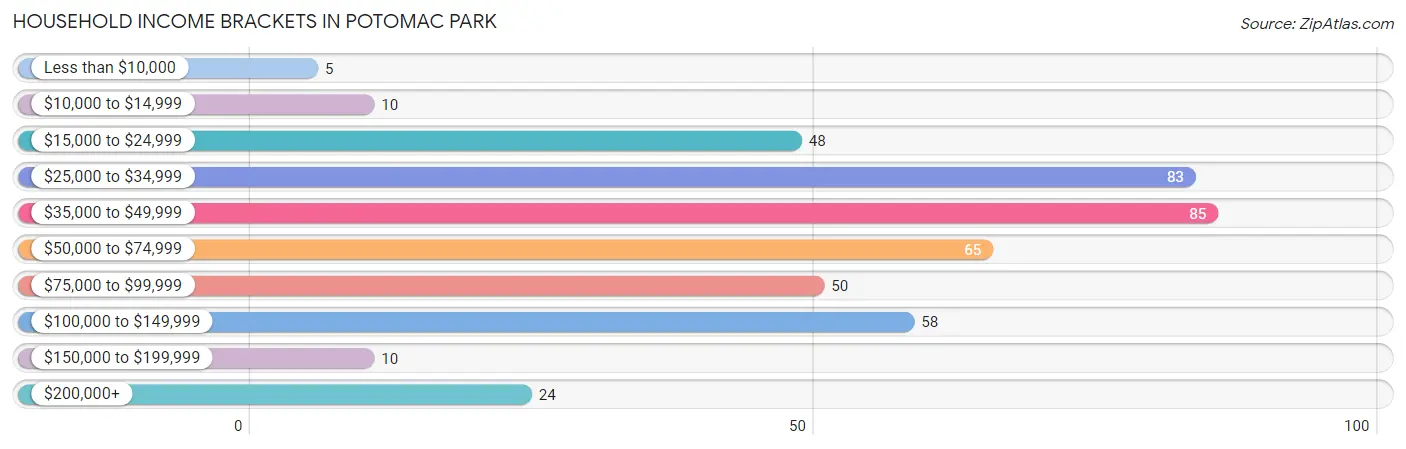
| Income Bracket | # Households | % Households |
| Less than $10,000 | 5 | 1.1% |
| $10,000 to $14,999 | 10 | 2.3% |
| $15,000 to $24,999 | 48 | 11.0% |
| $25,000 to $34,999 | 83 | 18.9% |
| $35,000 to $49,999 | 85 | 19.4% |
| $50,000 to $74,999 | 65 | 14.8% |
| $75,000 to $99,999 | 50 | 11.4% |
| $100,000 to $149,999 | 58 | 13.2% |
| $150,000 to $199,999 | 10 | 2.3% |
| $200,000+ | 24 | 5.5% |
Household Income by Householder Age in Potomac Park
The median household income in Potomac Park is $47,857, with the highest median household income of $75,568 found in the 25 to 44 years age bracket for the primary householder. A total of 138 households (31.5%) fall into this category. Meanwhile, the 15 to 24 years age bracket for the primary householder has the lowest median household income of $0, with 23 households (5.2%) in this group.
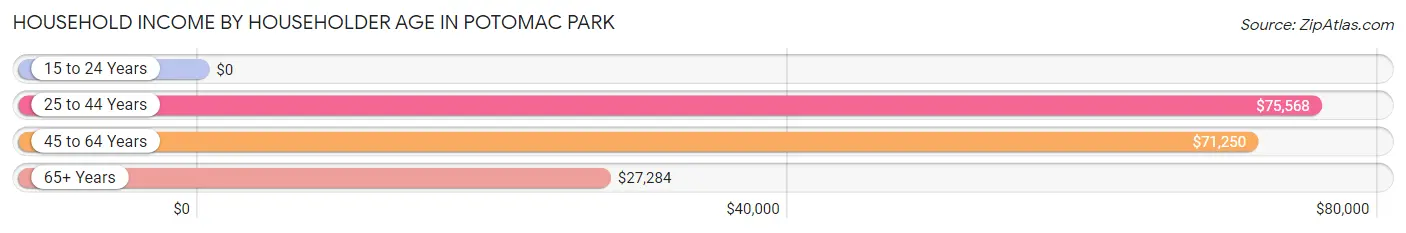
| Income Bracket | # Households | Median Income |
| 15 to 24 Years | 23 (5.2%) | $0 |
| 25 to 44 Years | 138 (31.5%) | $75,568 |
| 45 to 64 Years | 110 (25.1%) | $71,250 |
| 65+ Years | 167 (38.1%) | $27,284 |
| Total | 438 (100.0%) | $47,857 |
Poverty in Potomac Park
Income Below Poverty by Sex and Age in Potomac Park
With 5.2% poverty level for males and 17.1% for females among the residents of Potomac Park, under 5 year old males and 15 year old females are the most vulnerable to poverty, with 6 males (31.6%) and 38 females (100.0%) in their respective age groups living below the poverty level.
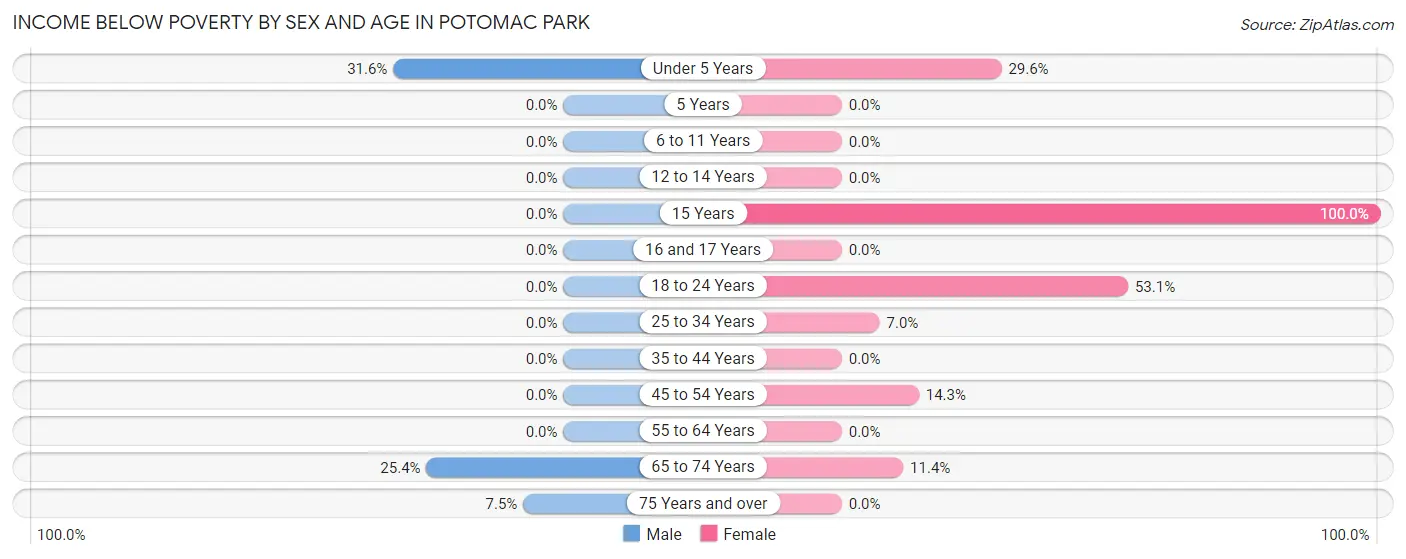
| Age Bracket | Male | Female |
| Under 5 Years | 6 (31.6%) | 8 (29.6%) |
| 5 Years | 0 (0.0%) | 0 (0.0%) |
| 6 to 11 Years | 0 (0.0%) | 0 (0.0%) |
| 12 to 14 Years | 0 (0.0%) | 0 (0.0%) |
| 15 Years | 0 (0.0%) | 38 (100.0%) |
| 16 and 17 Years | 0 (0.0%) | 0 (0.0%) |
| 18 to 24 Years | 0 (0.0%) | 17 (53.1%) |
| 25 to 34 Years | 0 (0.0%) | 4 (7.0%) |
| 35 to 44 Years | 0 (0.0%) | 0 (0.0%) |
| 45 to 54 Years | 0 (0.0%) | 6 (14.3%) |
| 55 to 64 Years | 0 (0.0%) | 0 (0.0%) |
| 65 to 74 Years | 15 (25.4%) | 9 (11.4%) |
| 75 Years and over | 5 (7.5%) | 0 (0.0%) |
| Total | 26 (5.2%) | 82 (17.1%) |
Income Above Poverty by Sex and Age in Potomac Park
According to the poverty statistics in Potomac Park, males aged 6 to 11 years and females aged 6 to 11 years are the age groups that are most secure financially, with 100.0% of males and 100.0% of females in these age groups living above the poverty line.
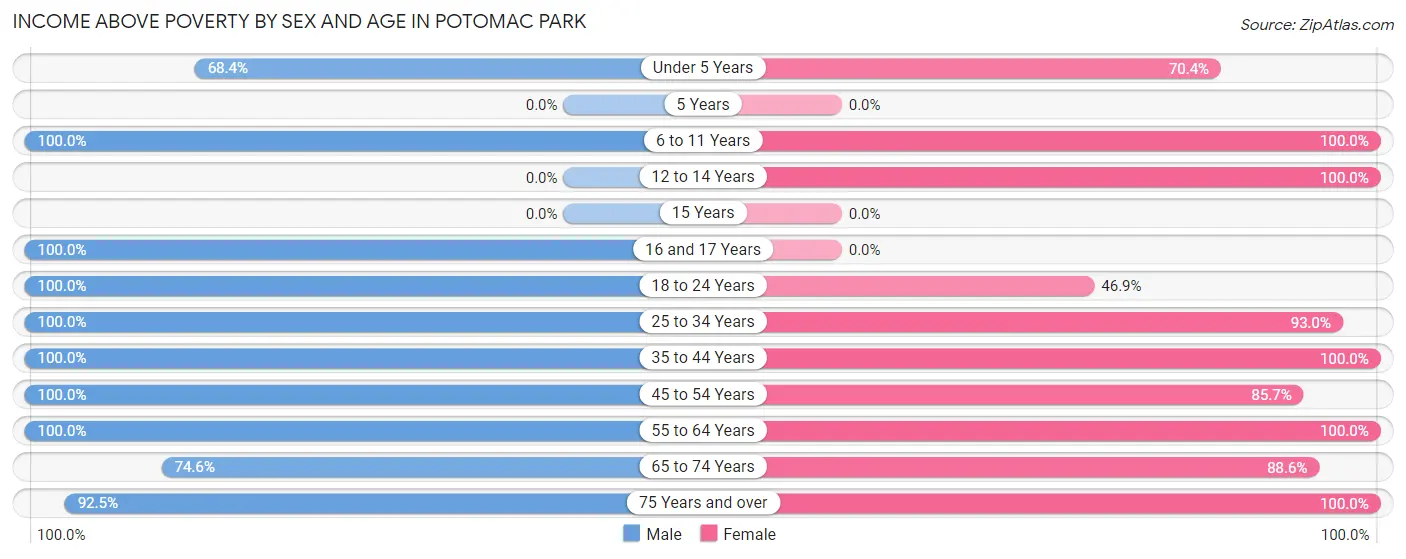
| Age Bracket | Male | Female |
| Under 5 Years | 13 (68.4%) | 19 (70.4%) |
| 5 Years | 0 (0.0%) | 0 (0.0%) |
| 6 to 11 Years | 37 (100.0%) | 18 (100.0%) |
| 12 to 14 Years | 0 (0.0%) | 30 (100.0%) |
| 15 Years | 0 (0.0%) | 0 (0.0%) |
| 16 and 17 Years | 15 (100.0%) | 0 (0.0%) |
| 18 to 24 Years | 17 (100.0%) | 15 (46.9%) |
| 25 to 34 Years | 120 (100.0%) | 53 (93.0%) |
| 35 to 44 Years | 51 (100.0%) | 42 (100.0%) |
| 45 to 54 Years | 81 (100.0%) | 36 (85.7%) |
| 55 to 64 Years | 29 (100.0%) | 44 (100.0%) |
| 65 to 74 Years | 44 (74.6%) | 70 (88.6%) |
| 75 Years and over | 62 (92.5%) | 72 (100.0%) |
| Total | 469 (94.8%) | 399 (83.0%) |
Income Below Poverty Among Married-Couple Families in Potomac Park
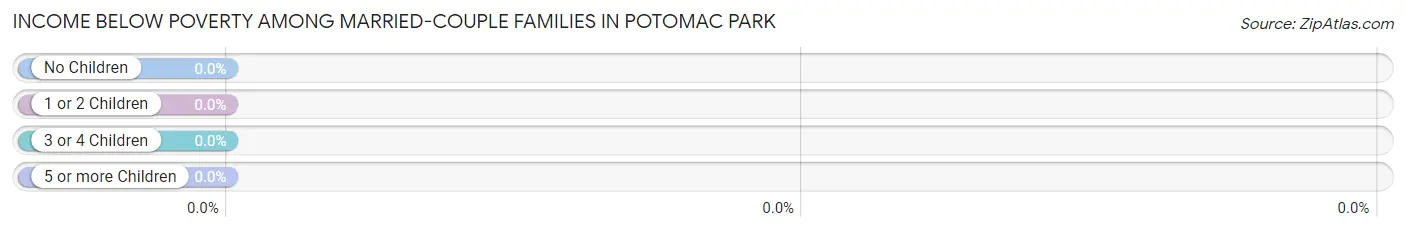
| Children | Above Poverty | Below Poverty |
| No Children | 178 (100.0%) | 0 (0.0%) |
| 1 or 2 Children | 71 (100.0%) | 0 (0.0%) |
| 3 or 4 Children | 0 (0.0%) | 0 (0.0%) |
| 5 or more Children | 0 (0.0%) | 0 (0.0%) |
| Total | 249 (100.0%) | 0 (0.0%) |
Income Below Poverty Among Single-Parent Households in Potomac Park
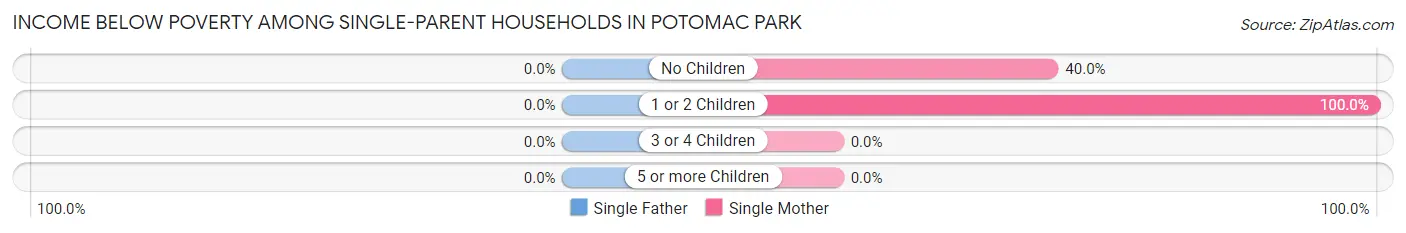
| Children | Single Father | Single Mother |
| No Children | 0 (0.0%) | 6 (40.0%) |
| 1 or 2 Children | 0 (0.0%) | 8 (100.0%) |
| 3 or 4 Children | 0 (0.0%) | 0 (0.0%) |
| 5 or more Children | 0 (0.0%) | 0 (0.0%) |
| Total | 0 (0.0%) | 14 (60.9%) |
Income Below Poverty Among Married-Couple vs Single-Parent Households in Potomac Park
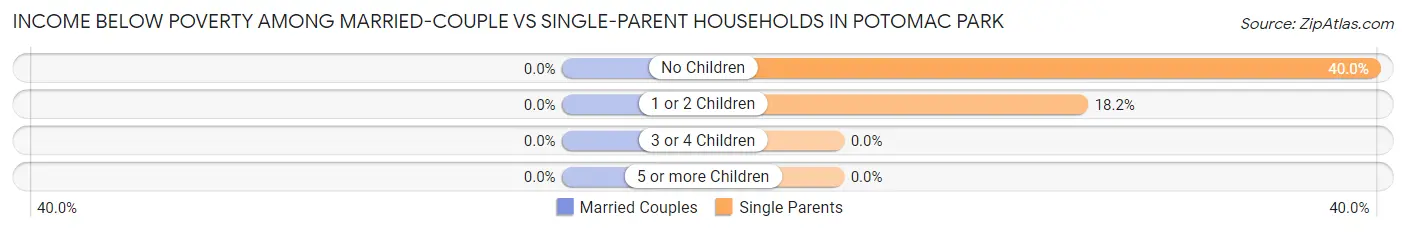
| Children | Married-Couple Families | Single-Parent Households |
| No Children | 0 (0.0%) | 6 (40.0%) |
| 1 or 2 Children | 0 (0.0%) | 8 (18.2%) |
| 3 or 4 Children | 0 (0.0%) | 0 (0.0%) |
| 5 or more Children | 0 (0.0%) | 0 (0.0%) |
| Total | 0 (0.0%) | 14 (23.7%) |
Race in Potomac Park
The most populous races in Potomac Park are White / Caucasian (901 | 92.3%), Two or more Races (64 | 6.6%), and Asian (4 | 0.4%).
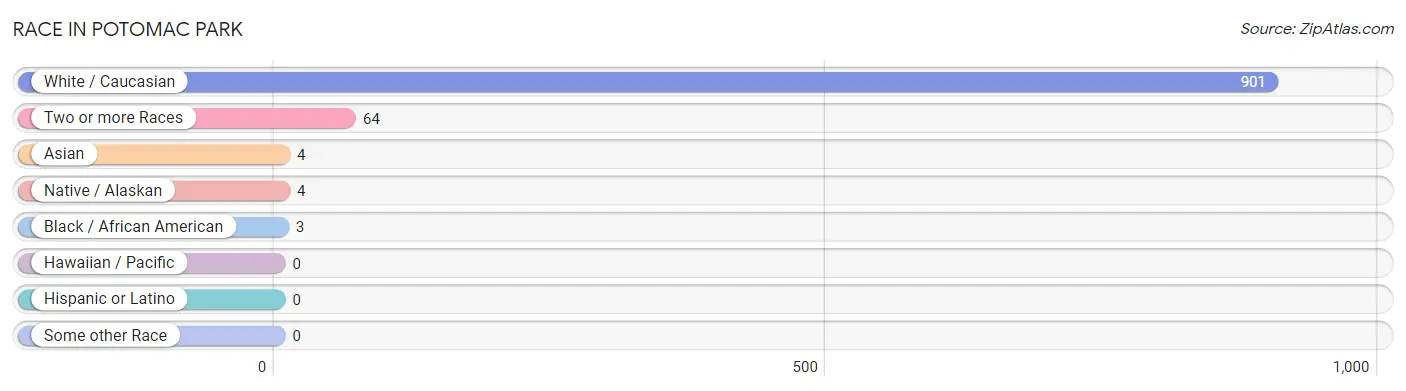
| Race | # Population | % Population |
| Asian | 4 | 0.4% |
| Black / African American | 3 | 0.3% |
| Hawaiian / Pacific | 0 | 0.0% |
| Hispanic or Latino | 0 | 0.0% |
| Native / Alaskan | 4 | 0.4% |
| White / Caucasian | 901 | 92.3% |
| Two or more Races | 64 | 6.6% |
| Some other Race | 0 | 0.0% |
| Total | 976 | 100.0% |
Ancestry in Potomac Park
The most populous ancestries reported in Potomac Park are German (177 | 18.1%), English (134 | 13.7%), Irish (97 | 9.9%), American (61 | 6.2%), and Italian (35 | 3.6%), together accounting for 51.6% of all Potomac Park residents.
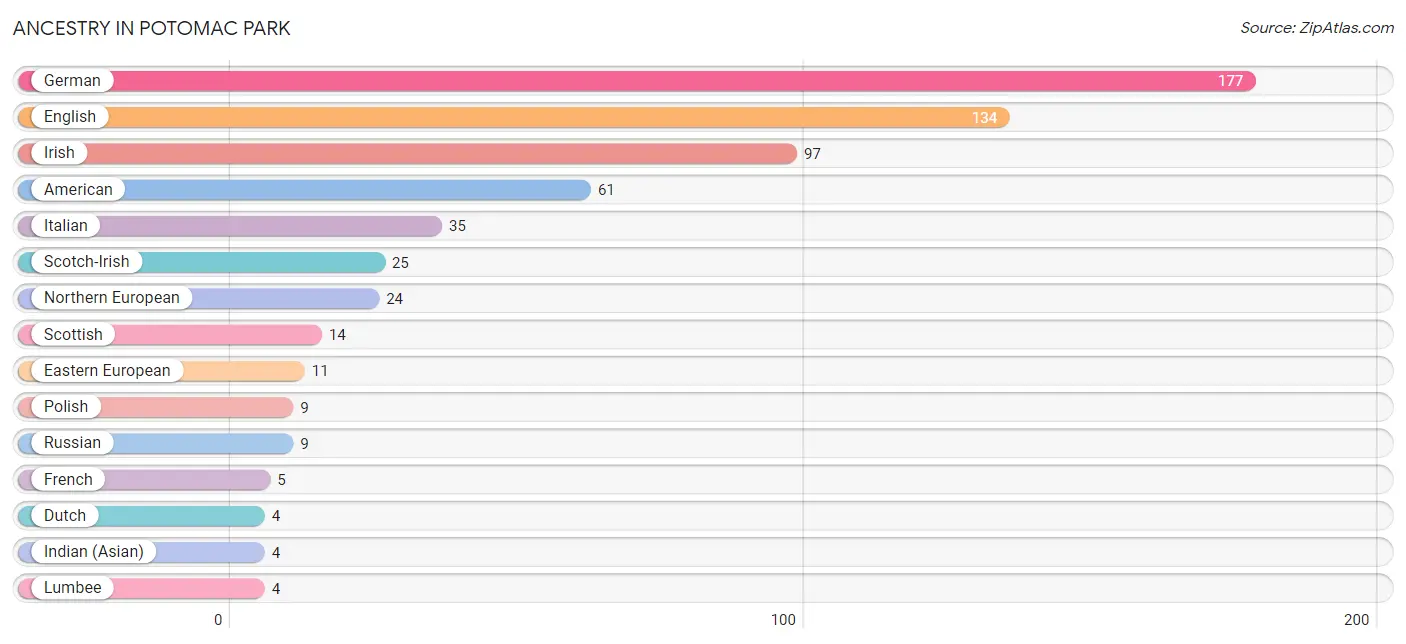
| Ancestry | # Population | % Population |
| American | 61 | 6.2% |
| Dutch | 4 | 0.4% |
| Eastern European | 11 | 1.1% |
| English | 134 | 13.7% |
| European | 3 | 0.3% |
| French | 5 | 0.5% |
| German | 177 | 18.1% |
| Indian (Asian) | 4 | 0.4% |
| Irish | 97 | 9.9% |
| Italian | 35 | 3.6% |
| Lumbee | 4 | 0.4% |
| Northern European | 24 | 2.5% |
| Polish | 9 | 0.9% |
| Russian | 9 | 0.9% |
| Scotch-Irish | 25 | 2.6% |
| Scottish | 14 | 1.4% | View All 16 Rows |
Immigrants in Potomac Park
The most numerous immigrant groups reported in Potomac Park came from Europe (5 | 0.5%), Germany (5 | 0.5%), Western Europe (5 | 0.5%), Asia (4 | 0.4%), and China (4 | 0.4%), together accounting for 2.4% of all Potomac Park residents.
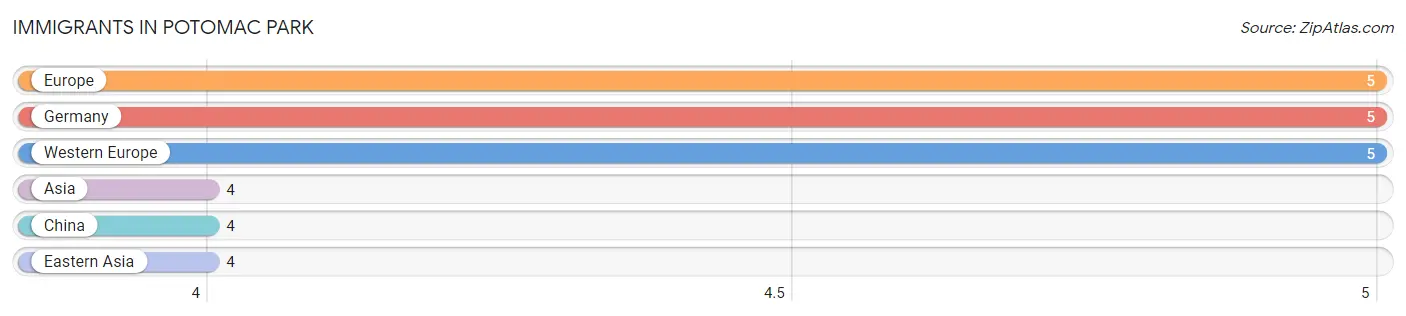
| Immigration Origin | # Population | % Population |
| Asia | 4 | 0.4% |
| China | 4 | 0.4% |
| Eastern Asia | 4 | 0.4% |
| Europe | 5 | 0.5% |
| Germany | 5 | 0.5% |
| Western Europe | 5 | 0.5% | View All 6 Rows |
Sex and Age in Potomac Park
Sex and Age in Potomac Park
The most populous age groups in Potomac Park are 25 to 29 Years (66 | 13.3%) for men and 10 to 14 Years (48 | 10.0%) for women.
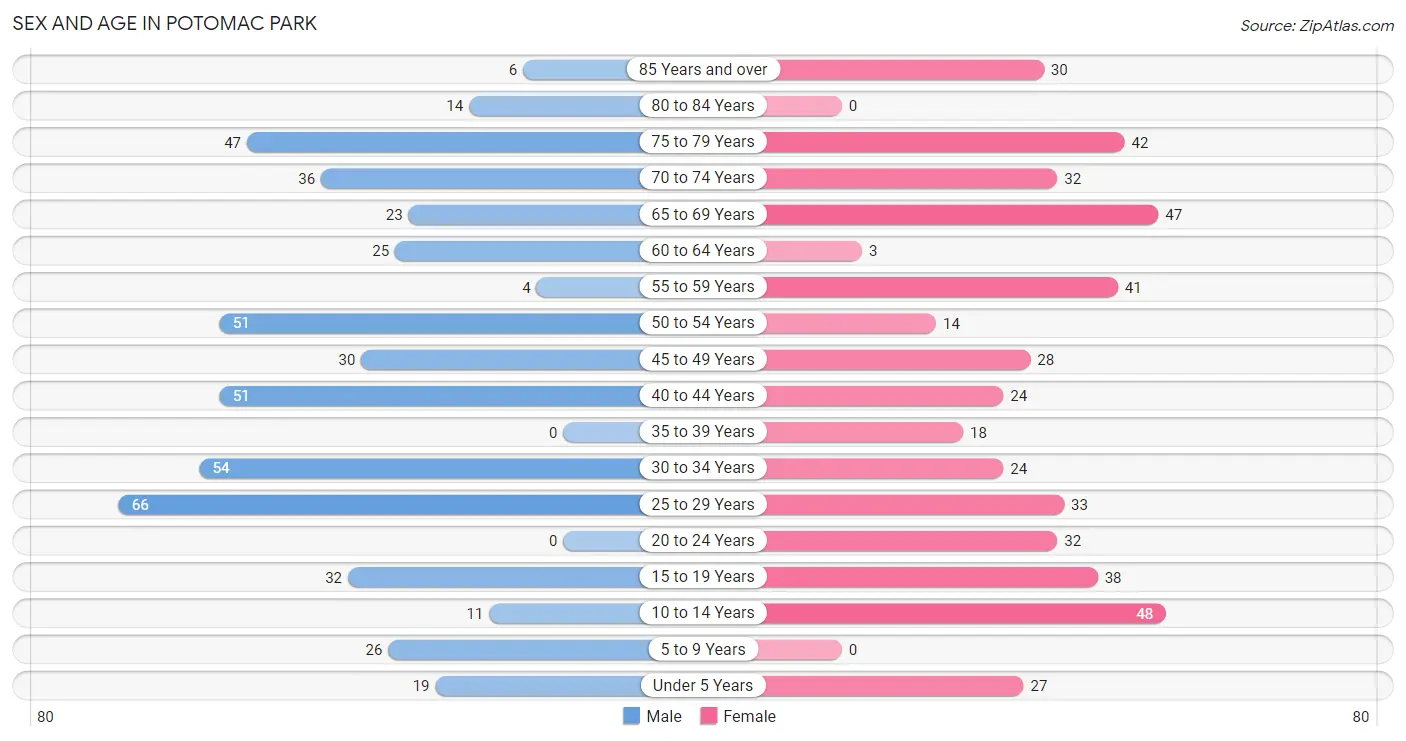
| Age Bracket | Male | Female |
| Under 5 Years | 19 (3.8%) | 27 (5.6%) |
| 5 to 9 Years | 26 (5.2%) | 0 (0.0%) |
| 10 to 14 Years | 11 (2.2%) | 48 (10.0%) |
| 15 to 19 Years | 32 (6.5%) | 38 (7.9%) |
| 20 to 24 Years | 0 (0.0%) | 32 (6.7%) |
| 25 to 29 Years | 66 (13.3%) | 33 (6.9%) |
| 30 to 34 Years | 54 (10.9%) | 24 (5.0%) |
| 35 to 39 Years | 0 (0.0%) | 18 (3.7%) |
| 40 to 44 Years | 51 (10.3%) | 24 (5.0%) |
| 45 to 49 Years | 30 (6.1%) | 28 (5.8%) |
| 50 to 54 Years | 51 (10.3%) | 14 (2.9%) |
| 55 to 59 Years | 4 (0.8%) | 41 (8.5%) |
| 60 to 64 Years | 25 (5.1%) | 3 (0.6%) |
| 65 to 69 Years | 23 (4.6%) | 47 (9.8%) |
| 70 to 74 Years | 36 (7.3%) | 32 (6.7%) |
| 75 to 79 Years | 47 (9.5%) | 42 (8.7%) |
| 80 to 84 Years | 14 (2.8%) | 0 (0.0%) |
| 85 Years and over | 6 (1.2%) | 30 (6.2%) |
| Total | 495 (100.0%) | 481 (100.0%) |
Families and Households in Potomac Park
Median Family Size in Potomac Park
The median family size in Potomac Park is 2.53 persons per family, with married-couple families (249 | 80.8%) accounting for the largest median family size of 2.65 persons per family. On the other hand, single male/father families (36 | 11.7%) represent the smallest median family size with 1.83 persons per family.
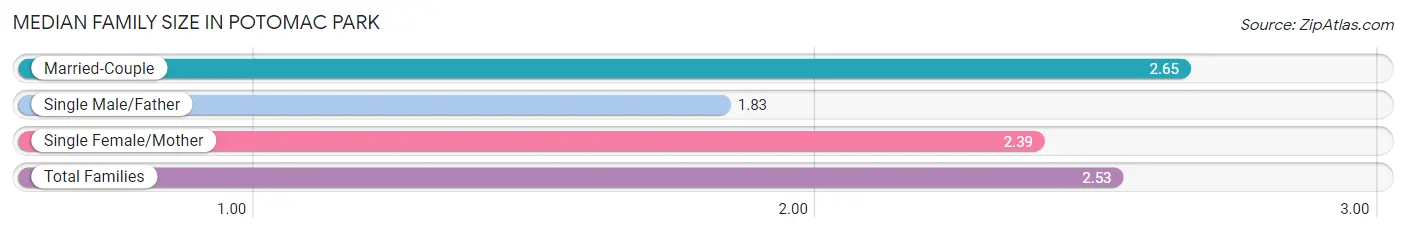
| Family Type | # Families | Family Size |
| Married-Couple | 249 (80.8%) | 2.65 |
| Single Male/Father | 36 (11.7%) | 1.83 |
| Single Female/Mother | 23 (7.5%) | 2.39 |
| Total Families | 308 (100.0%) | 2.53 |
Median Household Size in Potomac Park
The median household size in Potomac Park is 2.23 persons per household, with single female/mother households (23 | 5.2%) accounting for the largest median household size of 2.91 persons per household. non-family households (130 | 29.7%) represent the smallest median household size with 1.09 persons per household.
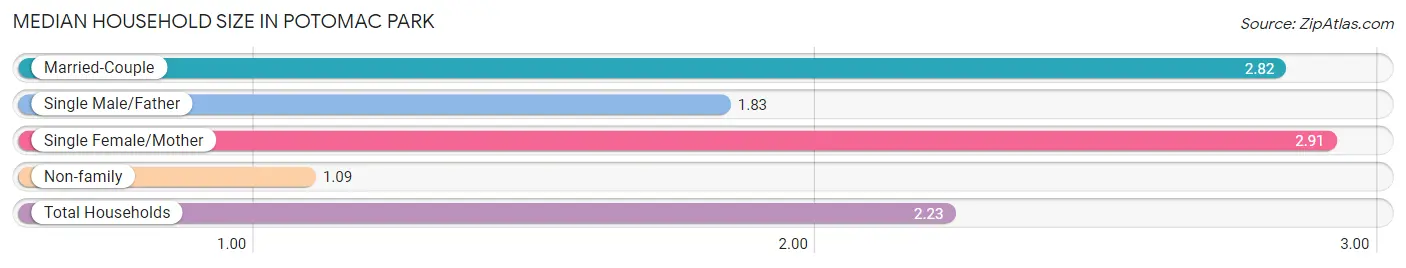
| Household Type | # Households | Household Size |
| Married-Couple | 249 (56.9%) | 2.82 |
| Single Male/Father | 36 (8.2%) | 1.83 |
| Single Female/Mother | 23 (5.2%) | 2.91 |
| Non-family | 130 (29.7%) | 1.09 |
| Total Households | 438 (100.0%) | 2.23 |
Household Size by Marriage Status in Potomac Park
Out of a total of 438 households in Potomac Park, 308 (70.3%) are family households, while 130 (29.7%) are nonfamily households. The most numerous type of family households are 2-person households, comprising 180, and the most common type of nonfamily households are 1-person households, comprising 117.
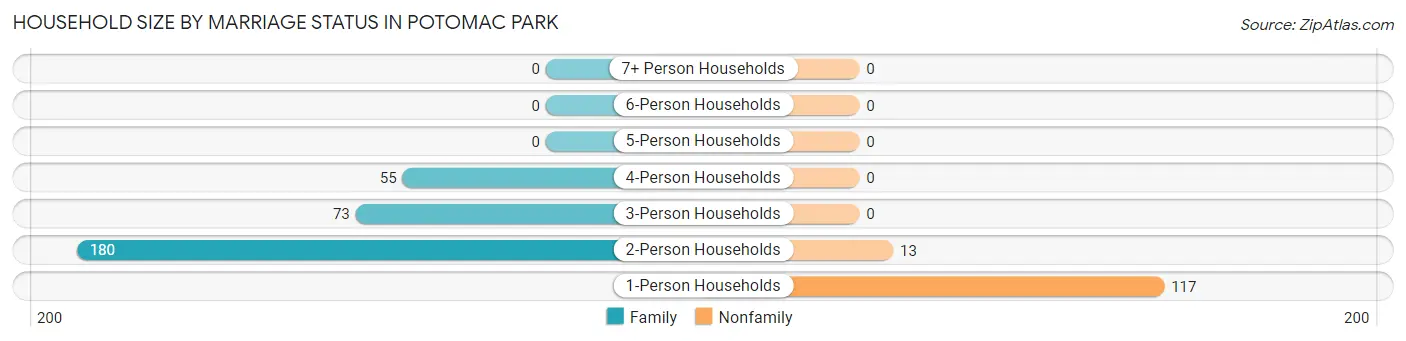
| Household Size | Family Households | Nonfamily Households |
| 1-Person Households | - | 117 (26.7%) |
| 2-Person Households | 180 (41.1%) | 13 (3.0%) |
| 3-Person Households | 73 (16.7%) | 0 (0.0%) |
| 4-Person Households | 55 (12.6%) | 0 (0.0%) |
| 5-Person Households | 0 (0.0%) | 0 (0.0%) |
| 6-Person Households | 0 (0.0%) | 0 (0.0%) |
| 7+ Person Households | 0 (0.0%) | 0 (0.0%) |
| Total | 308 (70.3%) | 130 (29.7%) |
Female Fertility in Potomac Park
Fertility by Age in Potomac Park
Average fertility rate in Potomac Park is 71.0 births per 1,000 women. Women in the age bracket of 20 to 34 years have the highest fertility rate with 157.0 births per 1,000 women. Women in the age bracket of 20 to 34 years acount for 100.0% of all women with births.
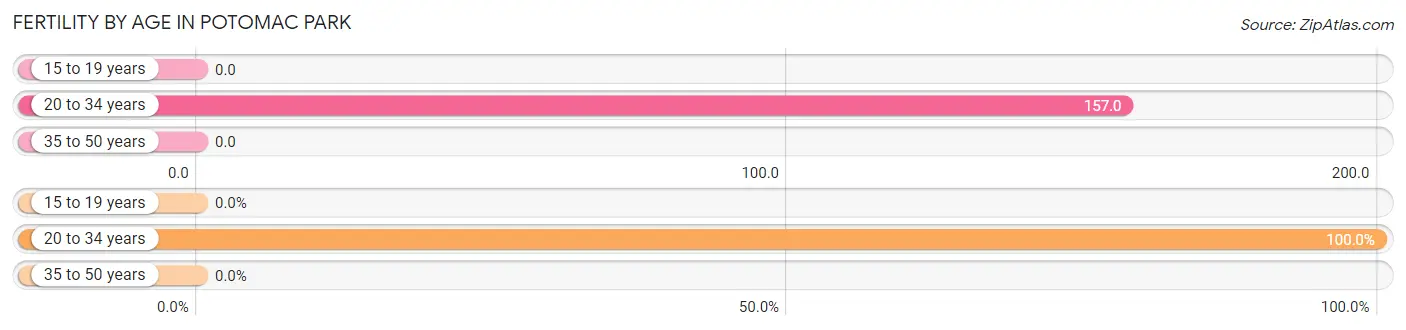
| Age Bracket | Women with Births | Births / 1,000 Women |
| 15 to 19 years | 0 (0.0%) | 0.0 |
| 20 to 34 years | 14 (100.0%) | 157.0 |
| 35 to 50 years | 0 (0.0%) | 0.0 |
| Total | 14 (100.0%) | 71.0 |
Fertility by Age by Marriage Status in Potomac Park
42.9% of women with births (14) in Potomac Park are married. The highest percentage of unmarried women with births falls into 20 to 34 years age bracket with 57.1% of them unmarried at the time of birth, while the lowest percentage of unmarried women with births belong to 20 to 34 years age bracket with 57.1% of them unmarried.
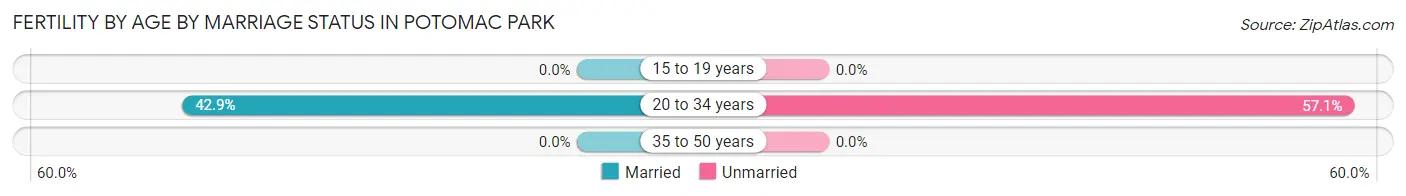
| Age Bracket | Married | Unmarried |
| 15 to 19 years | 0 (0.0%) | 0 (0.0%) |
| 20 to 34 years | 6 (42.9%) | 8 (57.1%) |
| 35 to 50 years | 0 (0.0%) | 0 (0.0%) |
| Total | 6 (42.9%) | 8 (57.1%) |
Fertility by Education in Potomac Park
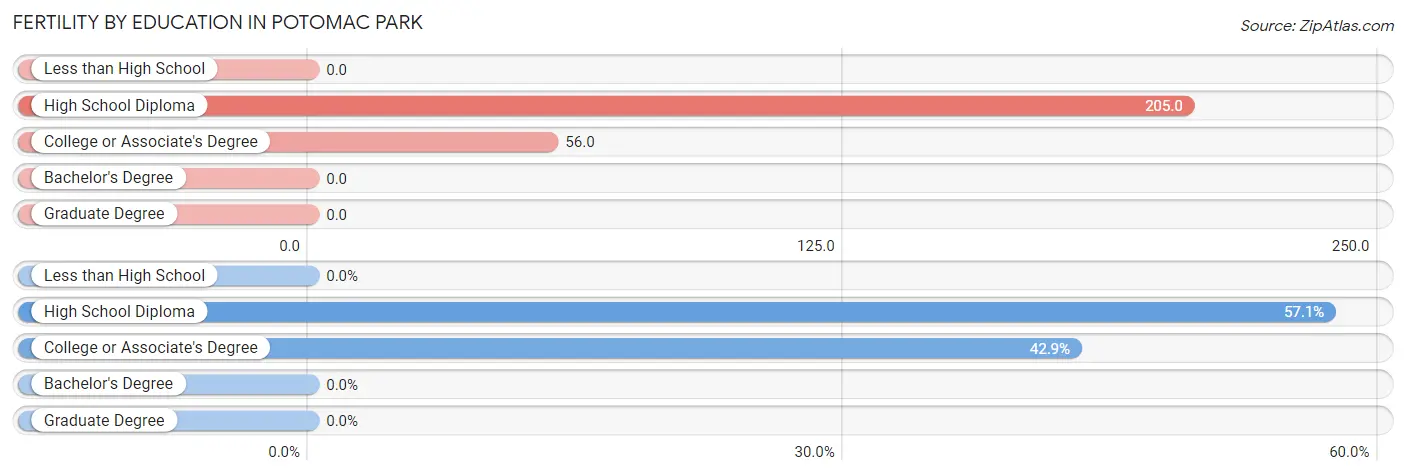
| Educational Attainment | Women with Births | Births / 1,000 Women |
| Less than High School | 0 (0.0%) | 0.0 |
| High School Diploma | 8 (57.1%) | 205.0 |
| College or Associate's Degree | 6 (42.9%) | 56.0 |
| Bachelor's Degree | 0 (0.0%) | 0.0 |
| Graduate Degree | 0 (0.0%) | 0.0 |
| Total | 14 (100.0%) | 71.0 |
Fertility by Education by Marriage Status in Potomac Park
57.1% of women with births in Potomac Park are unmarried. Women with the educational attainment of college or associate's degree are most likely to be married with 100.0% of them married at childbirth, while women with the educational attainment of high school diploma are least likely to be married with 100.0% of them unmarried at childbirth.
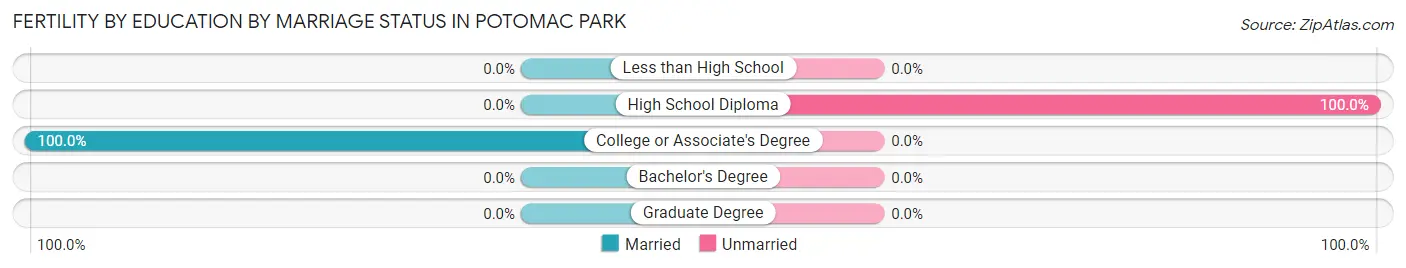
| Educational Attainment | Married | Unmarried |
| Less than High School | 0 (0.0%) | 0 (0.0%) |
| High School Diploma | 0 (0.0%) | 8 (100.0%) |
| College or Associate's Degree | 6 (100.0%) | 0 (0.0%) |
| Bachelor's Degree | 0 (0.0%) | 0 (0.0%) |
| Graduate Degree | 0 (0.0%) | 0 (0.0%) |
| Total | 6 (42.9%) | 8 (57.1%) |
Employment Characteristics in Potomac Park
Employment by Class of Employer in Potomac Park
Among the 433 employed individuals in Potomac Park, private company employees (300 | 69.3%), local government employees (56 | 12.9%), and not-for-profit organizations (32 | 7.4%) make up the most common classes of employment.
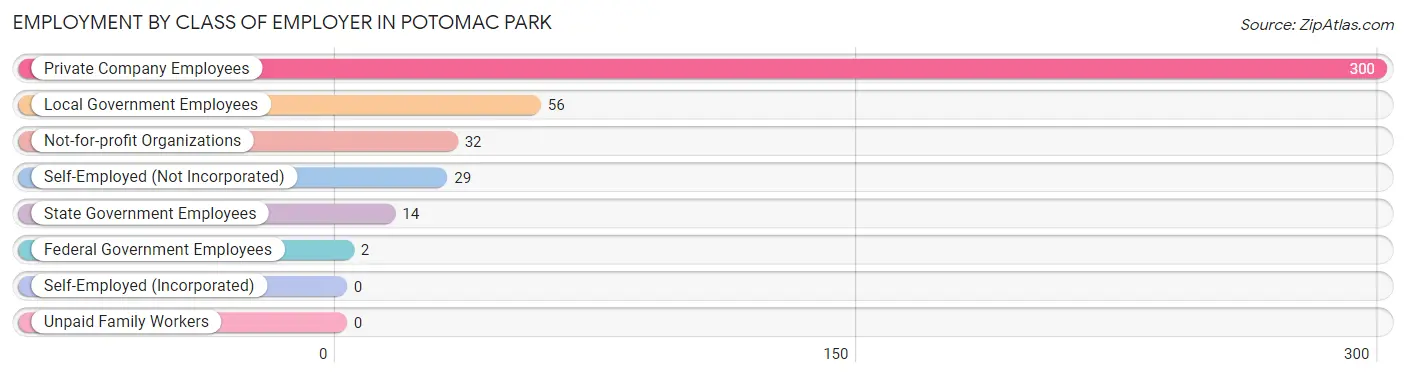
| Employer Class | # Employees | % Employees |
| Private Company Employees | 300 | 69.3% |
| Self-Employed (Incorporated) | 0 | 0.0% |
| Self-Employed (Not Incorporated) | 29 | 6.7% |
| Not-for-profit Organizations | 32 | 7.4% |
| Local Government Employees | 56 | 12.9% |
| State Government Employees | 14 | 3.2% |
| Federal Government Employees | 2 | 0.5% |
| Unpaid Family Workers | 0 | 0.0% |
| Total | 433 | 100.0% |
Employment Status by Age in Potomac Park
According to the labor force statistics for Potomac Park, out of the total population over 16 years of age (807), 57.7% or 466 individuals are in the labor force, with 5.8% or 27 of them unemployed. The age group with the highest labor force participation rate is 20 to 24 years, with 100.0% or 32 individuals in the labor force. Within the labor force, the 35 to 44 years age range has the highest percentage of unemployed individuals, with 36.0% or 27 of them being unemployed.
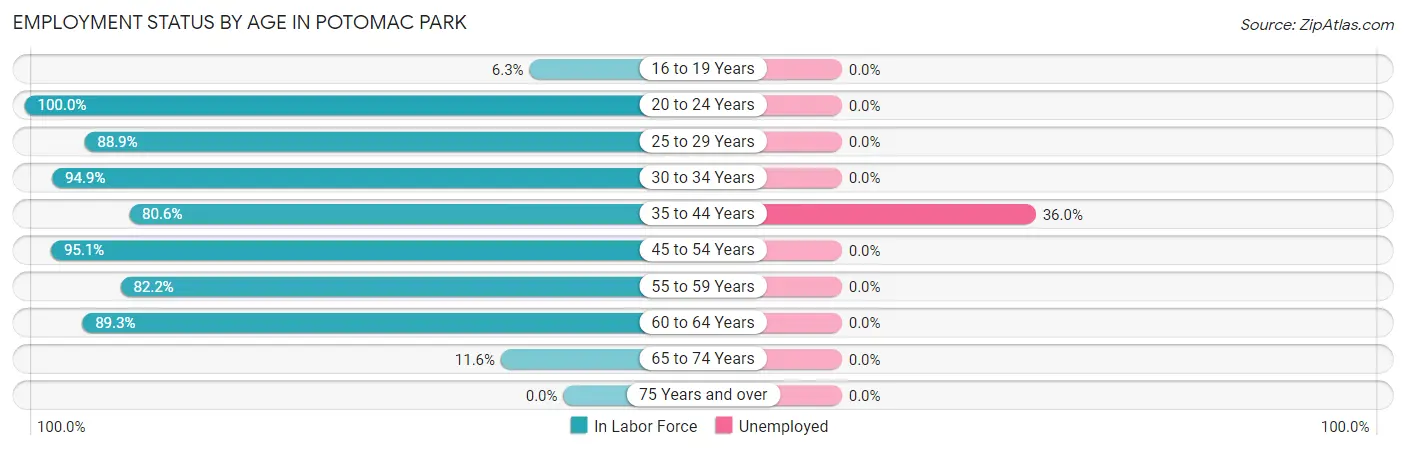
| Age Bracket | In Labor Force | Unemployed |
| 16 to 19 Years | 2 (6.3%) | 0 (0.0%) |
| 20 to 24 Years | 32 (100.0%) | 0 (0.0%) |
| 25 to 29 Years | 88 (88.9%) | 0 (0.0%) |
| 30 to 34 Years | 74 (94.9%) | 0 (0.0%) |
| 35 to 44 Years | 75 (80.6%) | 27 (36.0%) |
| 45 to 54 Years | 117 (95.1%) | 0 (0.0%) |
| 55 to 59 Years | 37 (82.2%) | 0 (0.0%) |
| 60 to 64 Years | 25 (89.3%) | 0 (0.0%) |
| 65 to 74 Years | 16 (11.6%) | 0 (0.0%) |
| 75 Years and over | 0 (0.0%) | 0 (0.0%) |
| Total | 466 (57.7%) | 27 (5.8%) |
Employment Status by Educational Attainment in Potomac Park
According to labor force statistics for Potomac Park, 89.3% of individuals (416) out of the total population between 25 and 64 years of age (466) are in the labor force, with 6.5% or 27 of them being unemployed. The group with the highest labor force participation rate are those with the educational attainment of college / associate degree, with 90.6% or 203 individuals in the labor force. Within the labor force, individuals with high school diploma education have the highest percentage of unemployment, with 15.3% or 27 of them being unemployed.
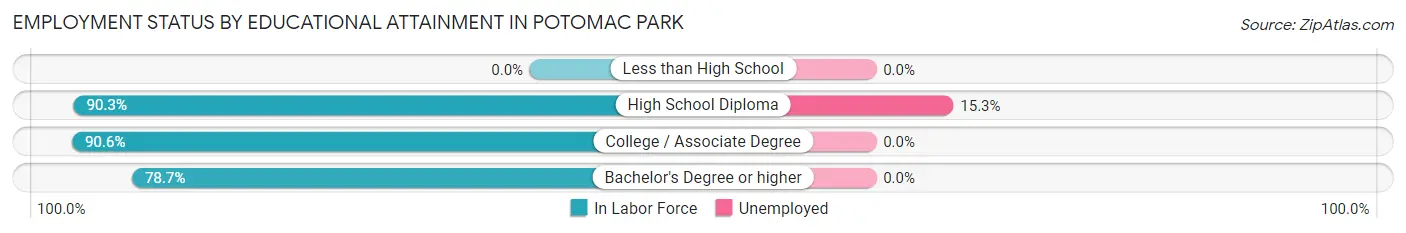
| Educational Attainment | In Labor Force | Unemployed |
| Less than High School | 0 (0.0%) | 0 (0.0%) |
| High School Diploma | 176 (90.3%) | 30 (15.3%) |
| College / Associate Degree | 203 (90.6%) | 0 (0.0%) |
| Bachelor's Degree or higher | 37 (78.7%) | 0 (0.0%) |
| Total | 416 (89.3%) | 30 (6.5%) |
Employment Occupations by Sex in Potomac Park
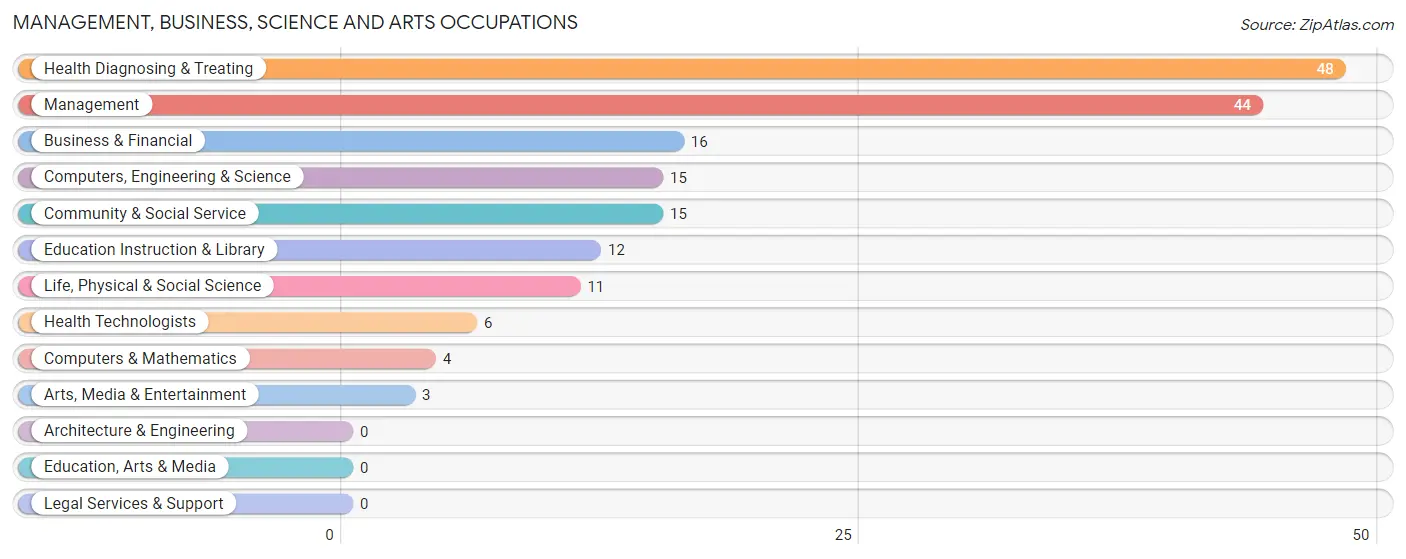
Management, Business, Science and Arts Occupations
The most common Management, Business, Science and Arts occupations in Potomac Park are Health Diagnosing & Treating (48 | 10.9%), Management (44 | 10.0%), Business & Financial (16 | 3.6%), Computers, Engineering & Science (15 | 3.4%), and Community & Social Service (15 | 3.4%).
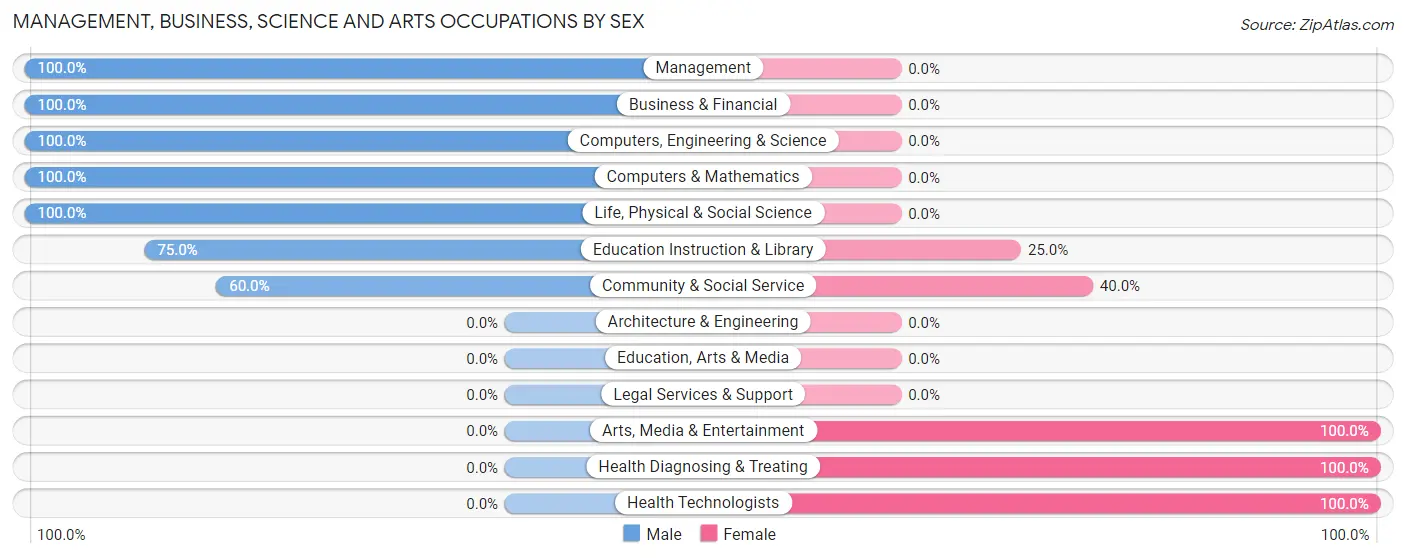
Management, Business, Science and Arts Occupations by Sex
Within the Management, Business, Science and Arts occupations in Potomac Park, the most male-oriented occupations are Management (100.0%), Business & Financial (100.0%), and Computers, Engineering & Science (100.0%), while the most female-oriented occupations are Arts, Media & Entertainment (100.0%), Health Diagnosing & Treating (100.0%), and Health Technologists (100.0%).
| Occupation | Male | Female |
| Management | 44 (100.0%) | 0 (0.0%) |
| Business & Financial | 16 (100.0%) | 0 (0.0%) |
| Computers, Engineering & Science | 15 (100.0%) | 0 (0.0%) |
| Computers & Mathematics | 4 (100.0%) | 0 (0.0%) |
| Architecture & Engineering | 0 (0.0%) | 0 (0.0%) |
| Life, Physical & Social Science | 11 (100.0%) | 0 (0.0%) |
| Community & Social Service | 9 (60.0%) | 6 (40.0%) |
| Education, Arts & Media | 0 (0.0%) | 0 (0.0%) |
| Legal Services & Support | 0 (0.0%) | 0 (0.0%) |
| Education Instruction & Library | 9 (75.0%) | 3 (25.0%) |
| Arts, Media & Entertainment | 0 (0.0%) | 3 (100.0%) |
| Health Diagnosing & Treating | 0 (0.0%) | 48 (100.0%) |
| Health Technologists | 0 (0.0%) | 6 (100.0%) |
| Total (Category) | 84 (60.9%) | 54 (39.1%) |
| Total (Overall) | 269 (61.3%) | 170 (38.7%) |
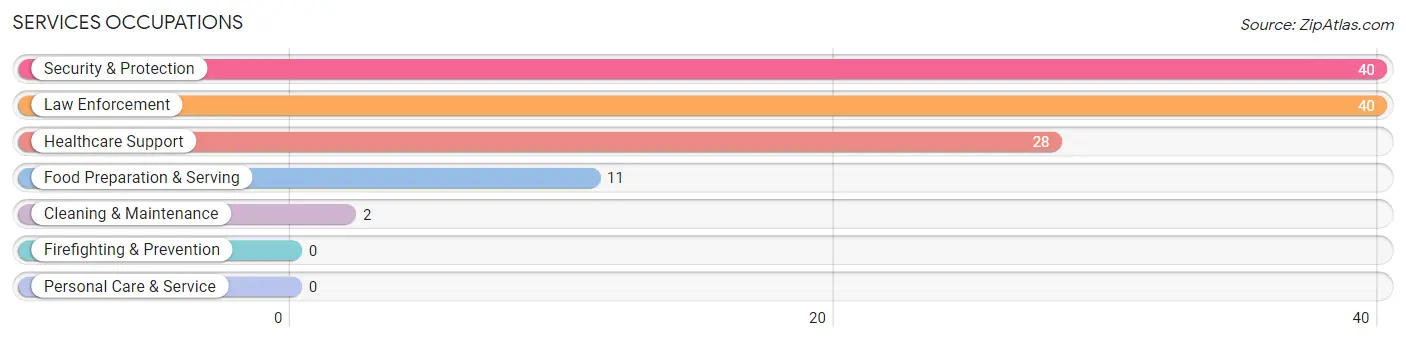
Services Occupations
The most common Services occupations in Potomac Park are Security & Protection (40 | 9.1%), Law Enforcement (40 | 9.1%), Healthcare Support (28 | 6.4%), Food Preparation & Serving (11 | 2.5%), and Cleaning & Maintenance (2 | 0.5%).
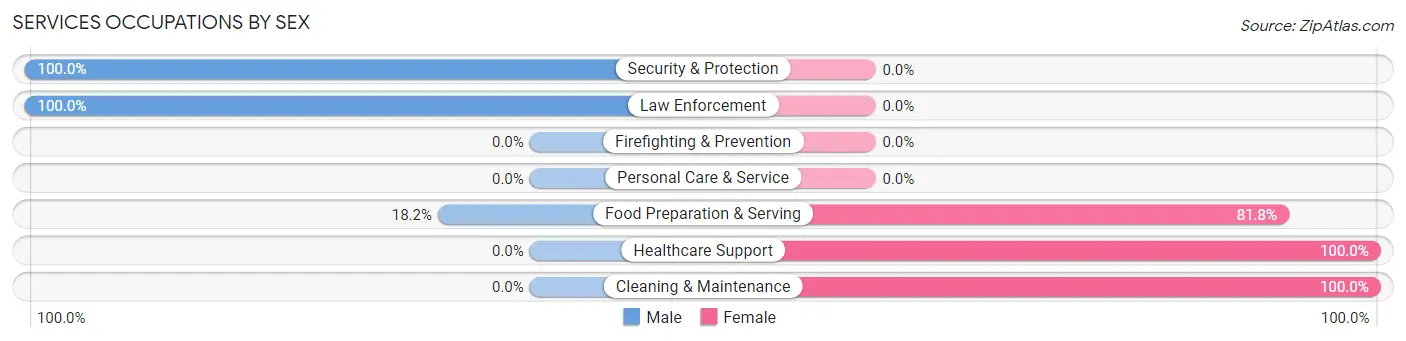
Services Occupations by Sex
Within the Services occupations in Potomac Park, the most male-oriented occupations are Security & Protection (100.0%), Law Enforcement (100.0%), and Food Preparation & Serving (18.2%), while the most female-oriented occupations are Healthcare Support (100.0%), Cleaning & Maintenance (100.0%), and Food Preparation & Serving (81.8%).
| Occupation | Male | Female |
| Healthcare Support | 0 (0.0%) | 28 (100.0%) |
| Security & Protection | 40 (100.0%) | 0 (0.0%) |
| Firefighting & Prevention | 0 (0.0%) | 0 (0.0%) |
| Law Enforcement | 40 (100.0%) | 0 (0.0%) |
| Food Preparation & Serving | 2 (18.2%) | 9 (81.8%) |
| Cleaning & Maintenance | 0 (0.0%) | 2 (100.0%) |
| Personal Care & Service | 0 (0.0%) | 0 (0.0%) |
| Total (Category) | 42 (51.8%) | 39 (48.1%) |
| Total (Overall) | 269 (61.3%) | 170 (38.7%) |
Sales and Office Occupations
The most common Sales and Office occupations in Potomac Park are Office & Administration (76 | 17.3%), and Sales & Related (6 | 1.4%).
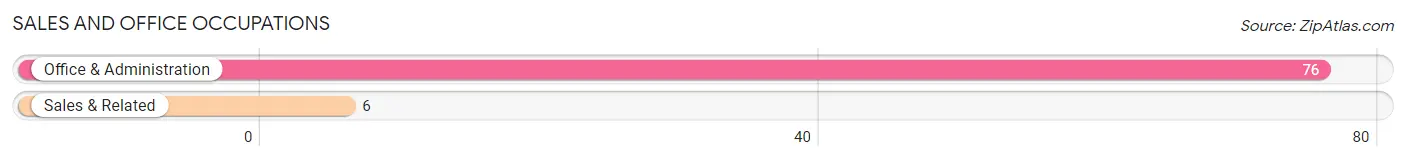
Sales and Office Occupations by Sex
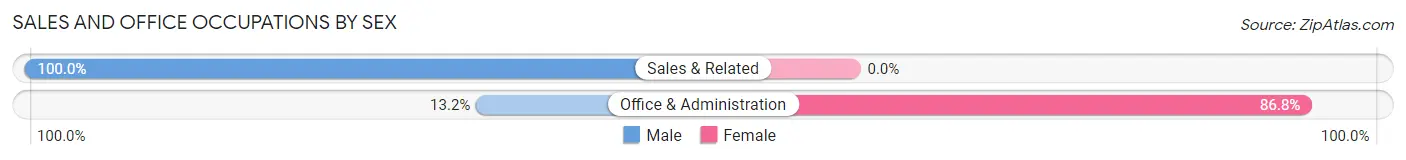
| Occupation | Male | Female |
| Sales & Related | 6 (100.0%) | 0 (0.0%) |
| Office & Administration | 10 (13.2%) | 66 (86.8%) |
| Total (Category) | 16 (19.5%) | 66 (80.5%) |
| Total (Overall) | 269 (61.3%) | 170 (38.7%) |
Natural Resources, Construction and Maintenance Occupations
The most common Natural Resources, Construction and Maintenance occupations in Potomac Park are , and Construction & Extraction (25 | 5.7%).
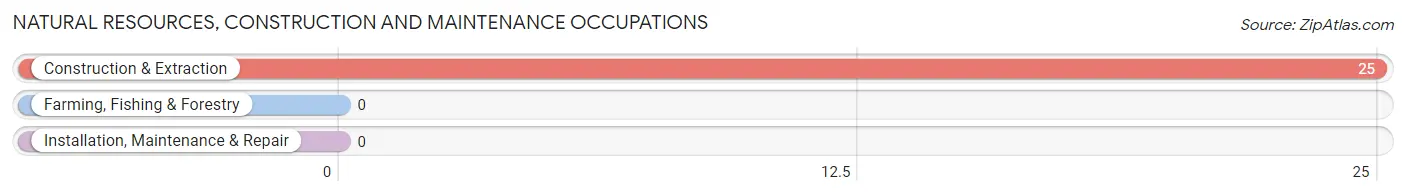
Natural Resources, Construction and Maintenance Occupations by Sex
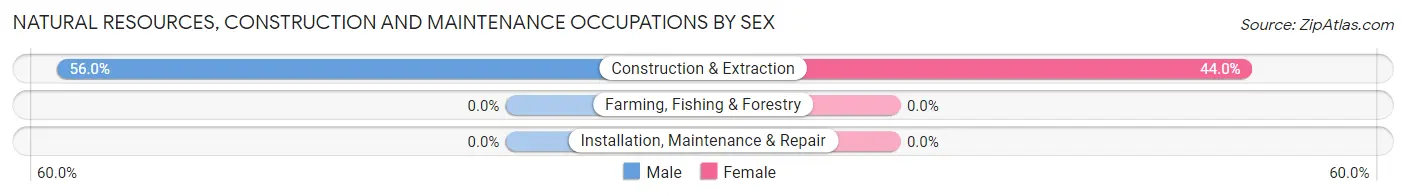
| Occupation | Male | Female |
| Farming, Fishing & Forestry | 0 (0.0%) | 0 (0.0%) |
| Construction & Extraction | 14 (56.0%) | 11 (44.0%) |
| Installation, Maintenance & Repair | 0 (0.0%) | 0 (0.0%) |
| Total (Category) | 14 (56.0%) | 11 (44.0%) |
| Total (Overall) | 269 (61.3%) | 170 (38.7%) |
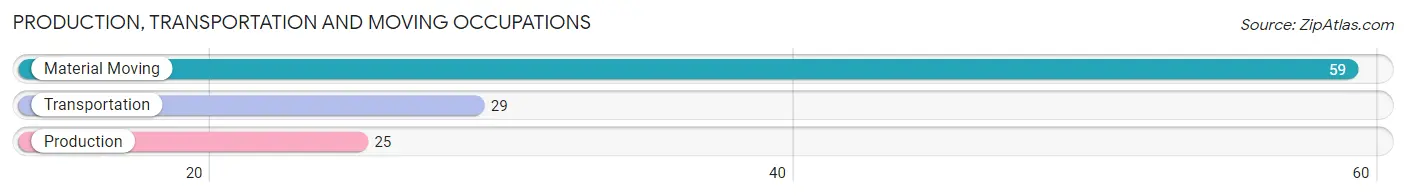
Production, Transportation and Moving Occupations
The most common Production, Transportation and Moving occupations in Potomac Park are Material Moving (59 | 13.4%), Transportation (29 | 6.6%), and Production (25 | 5.7%).
Production, Transportation and Moving Occupations by Sex
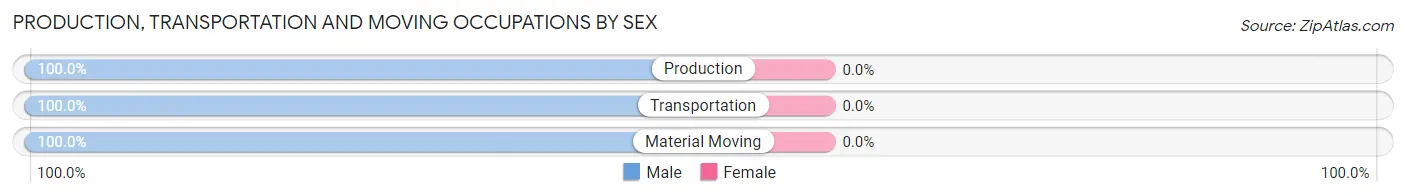
| Occupation | Male | Female |
| Production | 25 (100.0%) | 0 (0.0%) |
| Transportation | 29 (100.0%) | 0 (0.0%) |
| Material Moving | 59 (100.0%) | 0 (0.0%) |
| Total (Category) | 113 (100.0%) | 0 (0.0%) |
| Total (Overall) | 269 (61.3%) | 170 (38.7%) |
Employment Industries by Sex in Potomac Park
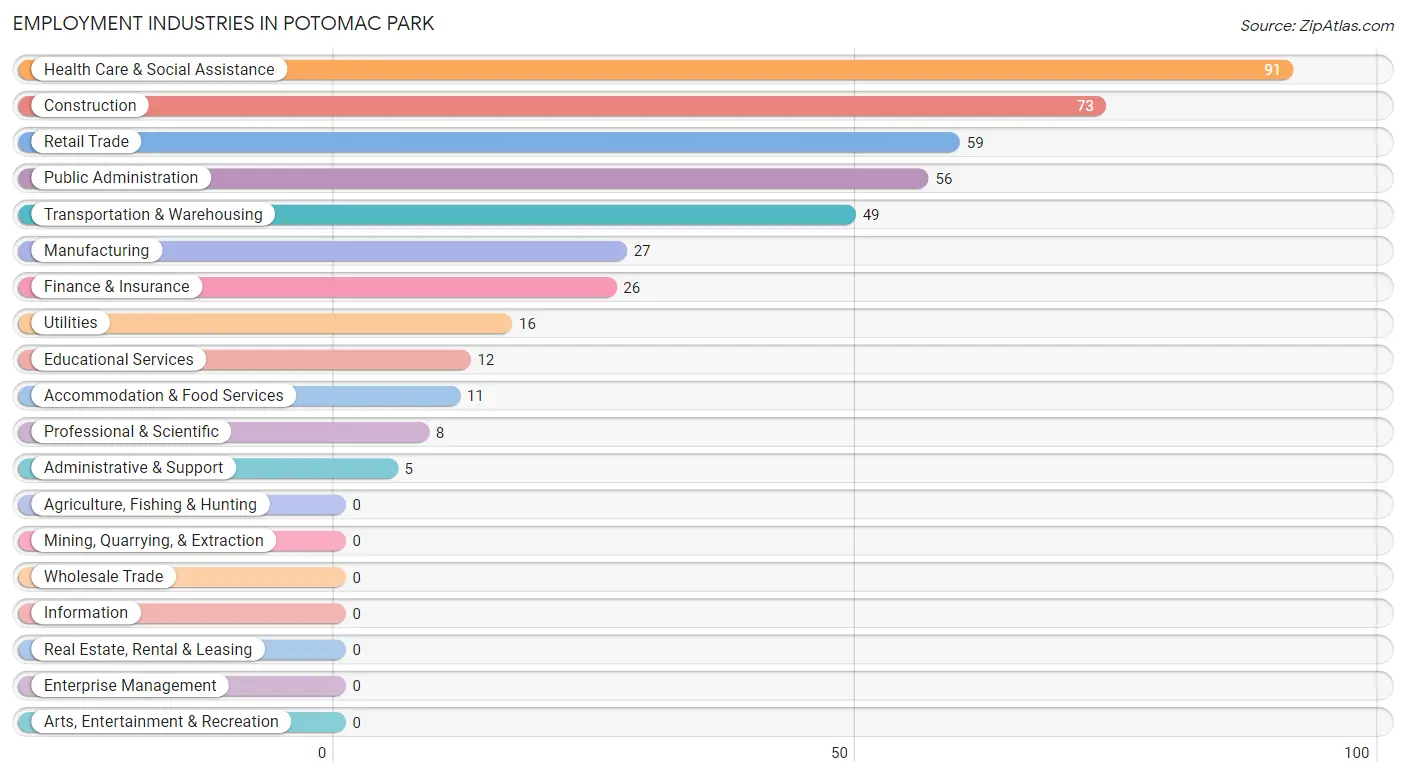
Employment Industries in Potomac Park
The major employment industries in Potomac Park include Health Care & Social Assistance (91 | 20.7%), Construction (73 | 16.6%), Retail Trade (59 | 13.4%), Public Administration (56 | 12.8%), and Transportation & Warehousing (49 | 11.2%).
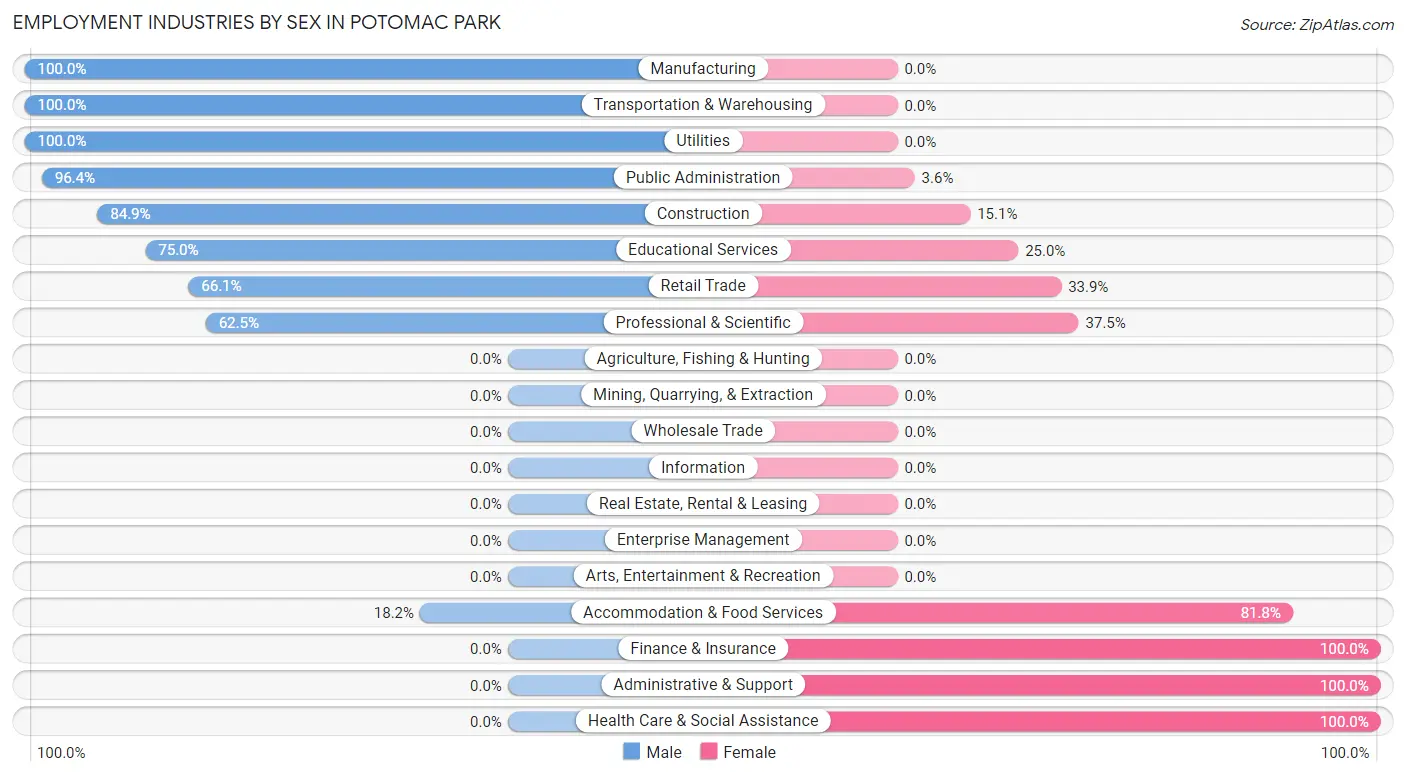
Employment Industries by Sex in Potomac Park
The Potomac Park industries that see more men than women are Manufacturing (100.0%), Transportation & Warehousing (100.0%), and Utilities (100.0%), whereas the industries that tend to have a higher number of women are Finance & Insurance (100.0%), Administrative & Support (100.0%), and Health Care & Social Assistance (100.0%).
| Industry | Male | Female |
| Agriculture, Fishing & Hunting | 0 (0.0%) | 0 (0.0%) |
| Mining, Quarrying, & Extraction | 0 (0.0%) | 0 (0.0%) |
| Construction | 62 (84.9%) | 11 (15.1%) |
| Manufacturing | 27 (100.0%) | 0 (0.0%) |
| Wholesale Trade | 0 (0.0%) | 0 (0.0%) |
| Retail Trade | 39 (66.1%) | 20 (33.9%) |
| Transportation & Warehousing | 49 (100.0%) | 0 (0.0%) |
| Utilities | 16 (100.0%) | 0 (0.0%) |
| Information | 0 (0.0%) | 0 (0.0%) |
| Finance & Insurance | 0 (0.0%) | 26 (100.0%) |
| Real Estate, Rental & Leasing | 0 (0.0%) | 0 (0.0%) |
| Professional & Scientific | 5 (62.5%) | 3 (37.5%) |
| Enterprise Management | 0 (0.0%) | 0 (0.0%) |
| Administrative & Support | 0 (0.0%) | 5 (100.0%) |
| Educational Services | 9 (75.0%) | 3 (25.0%) |
| Health Care & Social Assistance | 0 (0.0%) | 91 (100.0%) |
| Arts, Entertainment & Recreation | 0 (0.0%) | 0 (0.0%) |
| Accommodation & Food Services | 2 (18.2%) | 9 (81.8%) |
| Public Administration | 54 (96.4%) | 2 (3.6%) |
| Total | 269 (61.3%) | 170 (38.7%) |
Education in Potomac Park
School Enrollment in Potomac Park
The most common levels of schooling among the 187 students in Potomac Park are high school (83 | 44.4%), college / undergraduate (41 | 21.9%), and elementary school (26 | 13.9%).
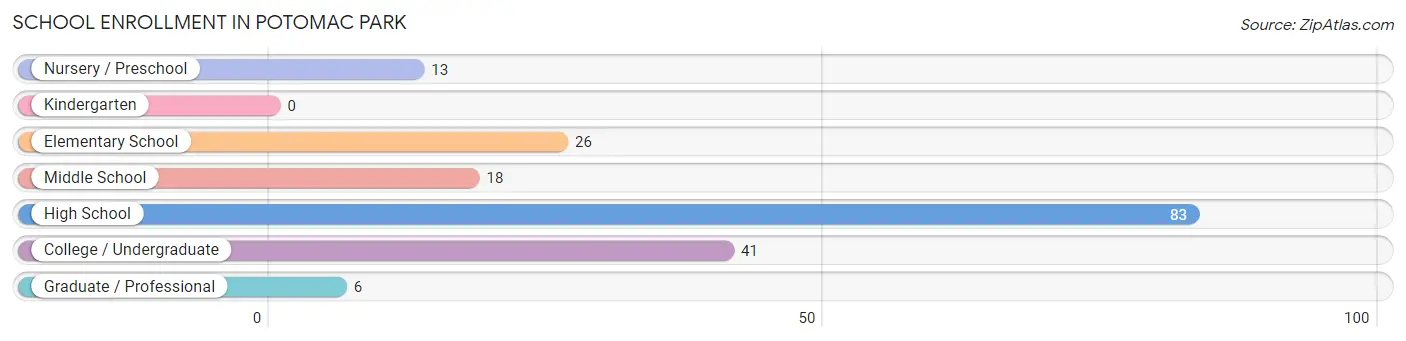
| School Level | # Students | % Students |
| Nursery / Preschool | 13 | 7.0% |
| Kindergarten | 0 | 0.0% |
| Elementary School | 26 | 13.9% |
| Middle School | 18 | 9.6% |
| High School | 83 | 44.4% |
| College / Undergraduate | 41 | 21.9% |
| Graduate / Professional | 6 | 3.2% |
| Total | 187 | 100.0% |
School Enrollment by Age by Funding Source in Potomac Park
Out of a total of 187 students who are enrolled in schools in Potomac Park, 31 (16.6%) attend a private institution, while the remaining 156 (83.4%) are enrolled in public schools. The age group of 3 to 4 year olds has the highest likelihood of being enrolled in private schools, with 13 (100.0% in the age bracket) enrolled. Conversely, the age group of 5 to 9 year old has the lowest likelihood of being enrolled in a private school, with 26 (100.0% in the age bracket) attending a public institution.
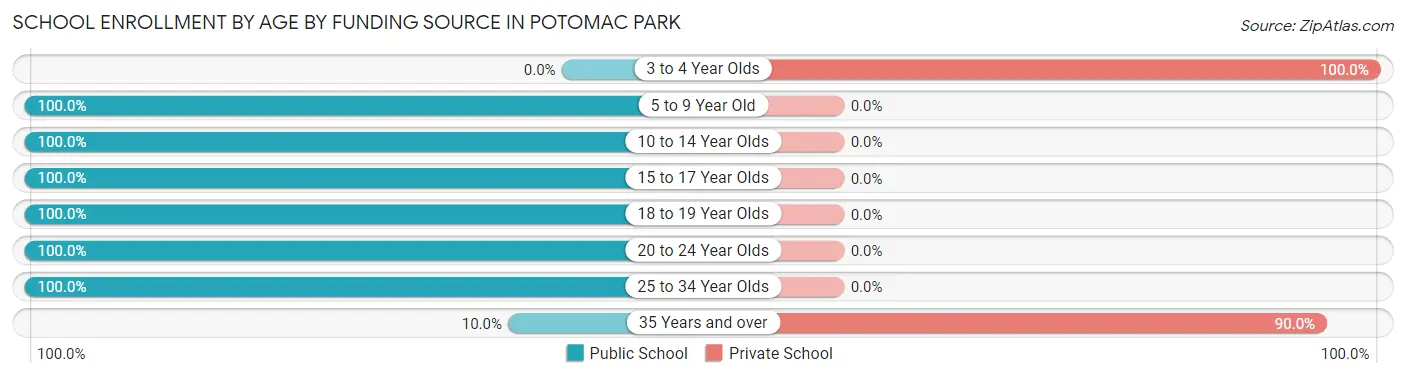
| Age Bracket | Public School | Private School |
| 3 to 4 Year Olds | 0 (0.0%) | 13 (100.0%) |
| 5 to 9 Year Old | 26 (100.0%) | 0 (0.0%) |
| 10 to 14 Year Olds | 48 (100.0%) | 0 (0.0%) |
| 15 to 17 Year Olds | 53 (100.0%) | 0 (0.0%) |
| 18 to 19 Year Olds | 17 (100.0%) | 0 (0.0%) |
| 20 to 24 Year Olds | 6 (100.0%) | 0 (0.0%) |
| 25 to 34 Year Olds | 4 (100.0%) | 0 (0.0%) |
| 35 Years and over | 2 (10.0%) | 18 (90.0%) |
| Total | 156 (83.4%) | 31 (16.6%) |
Educational Attainment by Field of Study in Potomac Park
Social sciences (16 | 31.4%), business (11 | 21.6%), education (7 | 13.7%), literature & languages (6 | 11.8%), and physical & health sciences (5 | 9.8%) are the most common fields of study among 51 individuals in Potomac Park who have obtained a bachelor's degree or higher.
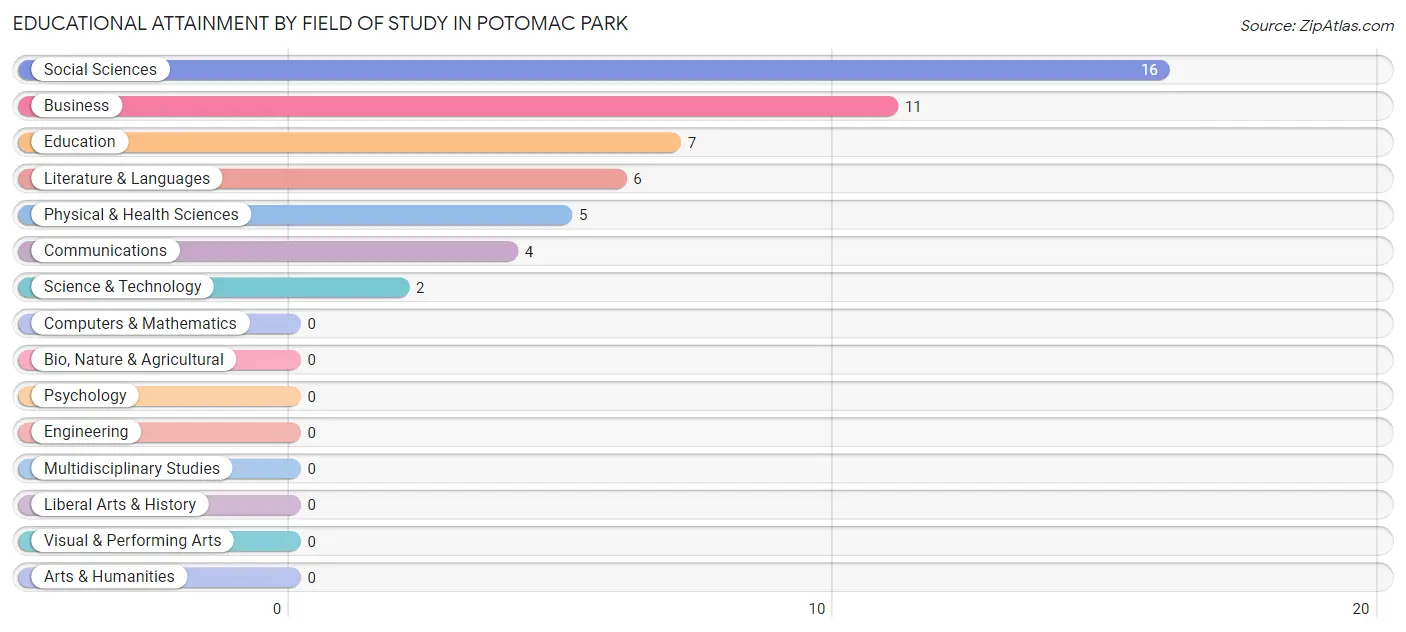
| Field of Study | # Graduates | % Graduates |
| Computers & Mathematics | 0 | 0.0% |
| Bio, Nature & Agricultural | 0 | 0.0% |
| Physical & Health Sciences | 5 | 9.8% |
| Psychology | 0 | 0.0% |
| Social Sciences | 16 | 31.4% |
| Engineering | 0 | 0.0% |
| Multidisciplinary Studies | 0 | 0.0% |
| Science & Technology | 2 | 3.9% |
| Business | 11 | 21.6% |
| Education | 7 | 13.7% |
| Literature & Languages | 6 | 11.8% |
| Liberal Arts & History | 0 | 0.0% |
| Visual & Performing Arts | 0 | 0.0% |
| Communications | 4 | 7.8% |
| Arts & Humanities | 0 | 0.0% |
| Total | 51 | 100.0% |
Transportation & Commute in Potomac Park
Vehicle Availability by Sex in Potomac Park
The most prevalent vehicle ownership categories in Potomac Park are males with 2 vehicles (123, accounting for 45.7%) and females with 2 vehicles (110, making up 75.0%).
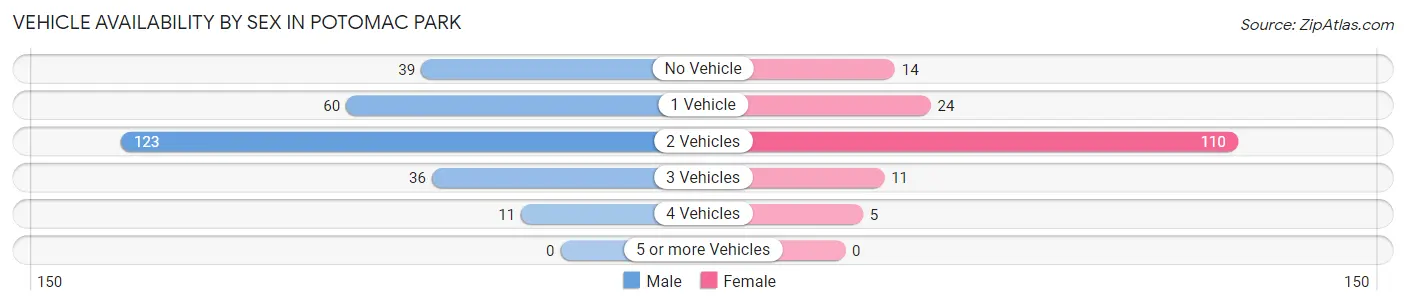
| Vehicles Available | Male | Female |
| No Vehicle | 39 (14.5%) | 14 (8.5%) |
| 1 Vehicle | 60 (22.3%) | 24 (14.6%) |
| 2 Vehicles | 123 (45.7%) | 110 (67.1%) |
| 3 Vehicles | 36 (13.4%) | 11 (6.7%) |
| 4 Vehicles | 11 (4.1%) | 5 (3.0%) |
| 5 or more Vehicles | 0 (0.0%) | 0 (0.0%) |
| Total | 269 (100.0%) | 164 (100.0%) |
Commute Time in Potomac Park
The most frequently occuring commute durations in Potomac Park are 15 to 19 minutes (172 commuters, 40.7%), 10 to 14 minutes (99 commuters, 23.4%), and 20 to 24 minutes (46 commuters, 10.9%).
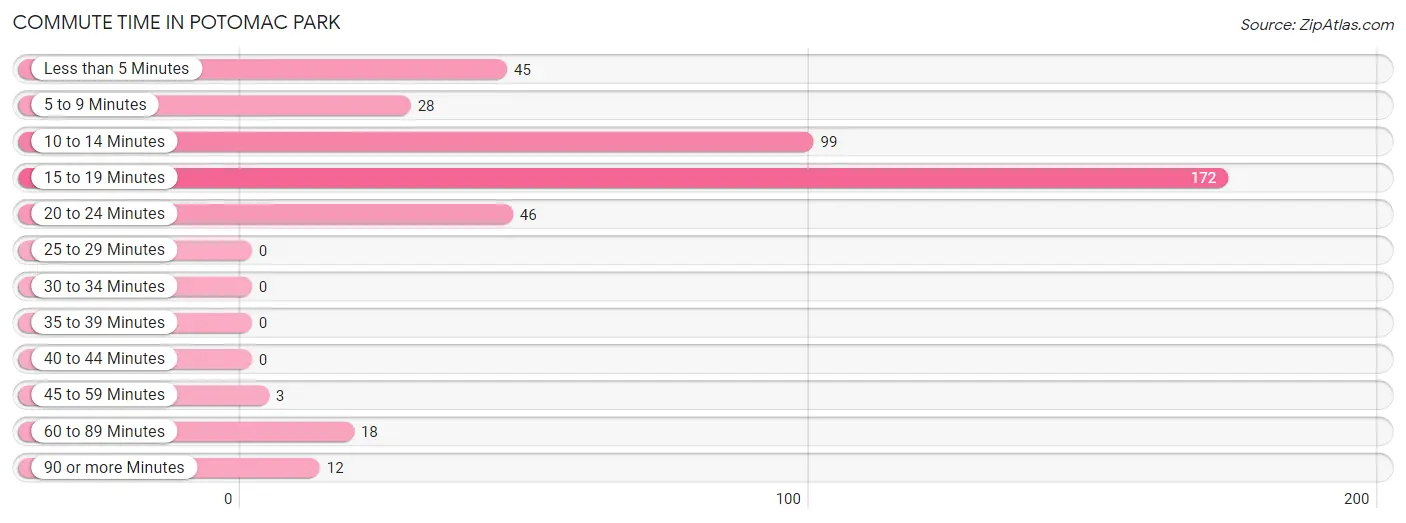
| Commute Time | # Commuters | % Commuters |
| Less than 5 Minutes | 45 | 10.6% |
| 5 to 9 Minutes | 28 | 6.6% |
| 10 to 14 Minutes | 99 | 23.4% |
| 15 to 19 Minutes | 172 | 40.7% |
| 20 to 24 Minutes | 46 | 10.9% |
| 25 to 29 Minutes | 0 | 0.0% |
| 30 to 34 Minutes | 0 | 0.0% |
| 35 to 39 Minutes | 0 | 0.0% |
| 40 to 44 Minutes | 0 | 0.0% |
| 45 to 59 Minutes | 3 | 0.7% |
| 60 to 89 Minutes | 18 | 4.3% |
| 90 or more Minutes | 12 | 2.8% |
Commute Time by Sex in Potomac Park
The most common commute times in Potomac Park are 15 to 19 minutes (109 commuters, 41.1%) for males and 15 to 19 minutes (63 commuters, 39.9%) for females.
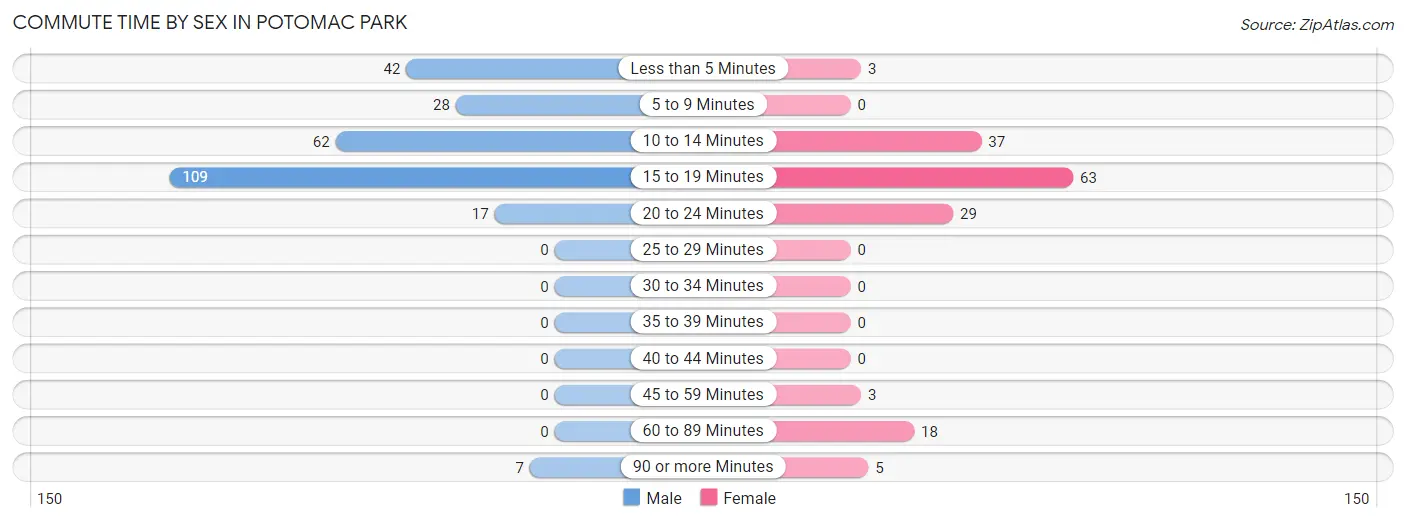
| Commute Time | Male | Female |
| Less than 5 Minutes | 42 (15.9%) | 3 (1.9%) |
| 5 to 9 Minutes | 28 (10.6%) | 0 (0.0%) |
| 10 to 14 Minutes | 62 (23.4%) | 37 (23.4%) |
| 15 to 19 Minutes | 109 (41.1%) | 63 (39.9%) |
| 20 to 24 Minutes | 17 (6.4%) | 29 (18.3%) |
| 25 to 29 Minutes | 0 (0.0%) | 0 (0.0%) |
| 30 to 34 Minutes | 0 (0.0%) | 0 (0.0%) |
| 35 to 39 Minutes | 0 (0.0%) | 0 (0.0%) |
| 40 to 44 Minutes | 0 (0.0%) | 0 (0.0%) |
| 45 to 59 Minutes | 0 (0.0%) | 3 (1.9%) |
| 60 to 89 Minutes | 0 (0.0%) | 18 (11.4%) |
| 90 or more Minutes | 7 (2.6%) | 5 (3.2%) |
Time of Departure to Work by Sex in Potomac Park
The most frequent times of departure to work in Potomac Park are 6:30 AM to 6:59 AM (51, 19.3%) for males and 8:30 AM to 8:59 AM (43, 27.2%) for females.
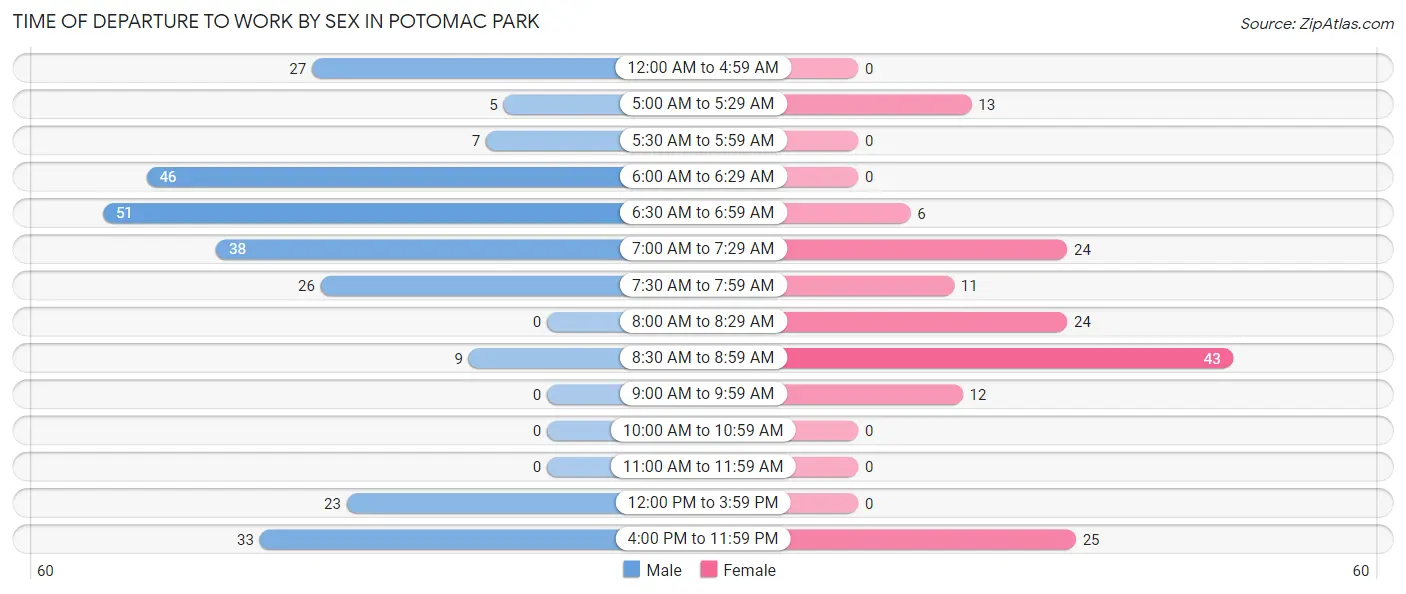
| Time of Departure | Male | Female |
| 12:00 AM to 4:59 AM | 27 (10.2%) | 0 (0.0%) |
| 5:00 AM to 5:29 AM | 5 (1.9%) | 13 (8.2%) |
| 5:30 AM to 5:59 AM | 7 (2.6%) | 0 (0.0%) |
| 6:00 AM to 6:29 AM | 46 (17.4%) | 0 (0.0%) |
| 6:30 AM to 6:59 AM | 51 (19.3%) | 6 (3.8%) |
| 7:00 AM to 7:29 AM | 38 (14.3%) | 24 (15.2%) |
| 7:30 AM to 7:59 AM | 26 (9.8%) | 11 (7.0%) |
| 8:00 AM to 8:29 AM | 0 (0.0%) | 24 (15.2%) |
| 8:30 AM to 8:59 AM | 9 (3.4%) | 43 (27.2%) |
| 9:00 AM to 9:59 AM | 0 (0.0%) | 12 (7.6%) |
| 10:00 AM to 10:59 AM | 0 (0.0%) | 0 (0.0%) |
| 11:00 AM to 11:59 AM | 0 (0.0%) | 0 (0.0%) |
| 12:00 PM to 3:59 PM | 23 (8.7%) | 0 (0.0%) |
| 4:00 PM to 11:59 PM | 33 (12.4%) | 25 (15.8%) |
| Total | 265 (100.0%) | 158 (100.0%) |
Housing Occupancy in Potomac Park
Occupancy by Ownership in Potomac Park
Of the total 438 dwellings in Potomac Park, owner-occupied units account for 394 (89.9%), while renter-occupied units make up 44 (10.1%).
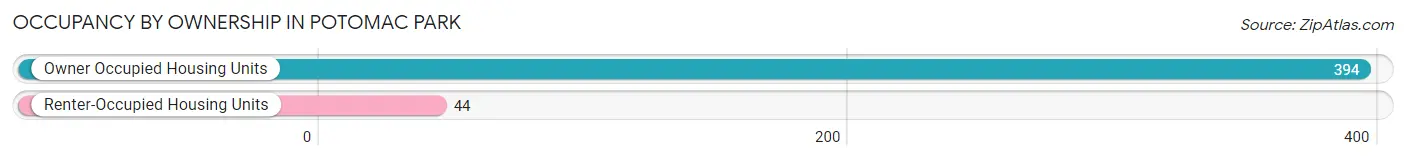
| Occupancy | # Housing Units | % Housing Units |
| Owner Occupied Housing Units | 394 | 89.9% |
| Renter-Occupied Housing Units | 44 | 10.1% |
| Total Occupied Housing Units | 438 | 100.0% |
Occupancy by Household Size in Potomac Park
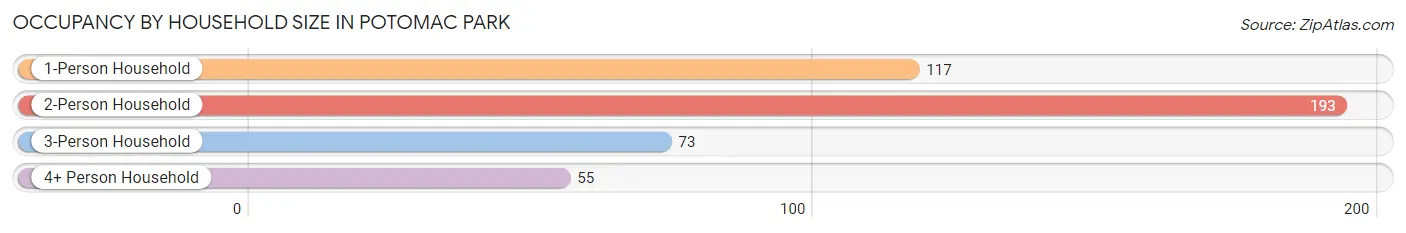
| Household Size | # Housing Units | % Housing Units |
| 1-Person Household | 117 | 26.7% |
| 2-Person Household | 193 | 44.1% |
| 3-Person Household | 73 | 16.7% |
| 4+ Person Household | 55 | 12.6% |
| Total Housing Units | 438 | 100.0% |
Occupancy by Ownership by Household Size in Potomac Park
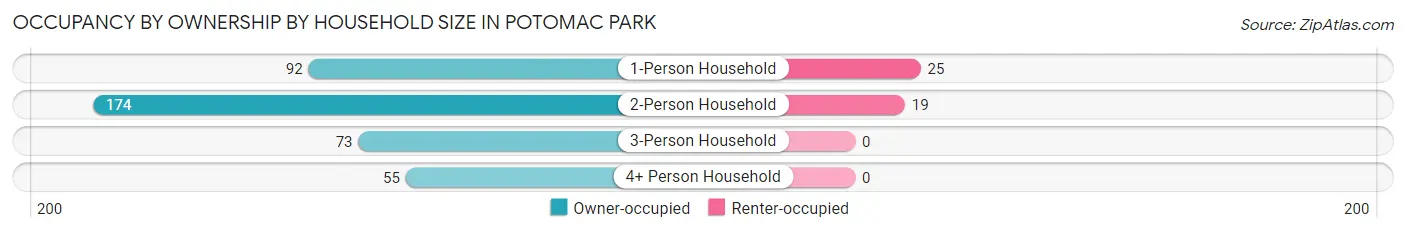
| Household Size | Owner-occupied | Renter-occupied |
| 1-Person Household | 92 (78.6%) | 25 (21.4%) |
| 2-Person Household | 174 (90.2%) | 19 (9.8%) |
| 3-Person Household | 73 (100.0%) | 0 (0.0%) |
| 4+ Person Household | 55 (100.0%) | 0 (0.0%) |
| Total Housing Units | 394 (89.9%) | 44 (10.1%) |
Occupancy by Educational Attainment in Potomac Park
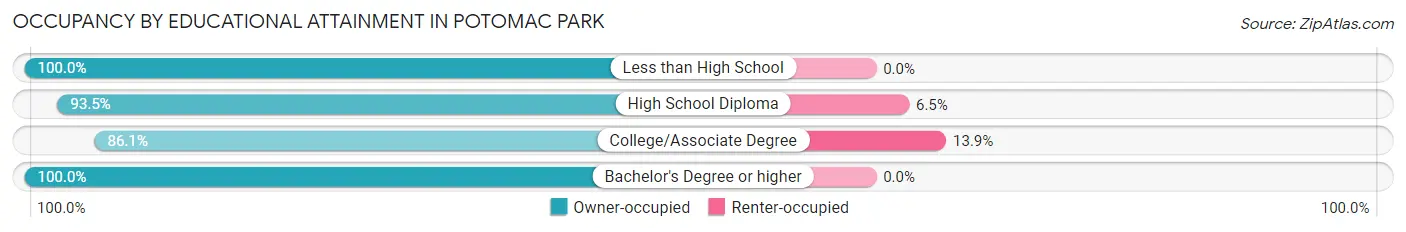
| Household Size | Owner-occupied | Renter-occupied |
| Less than High School | 5 (100.0%) | 0 (0.0%) |
| High School Diploma | 158 (93.5%) | 11 (6.5%) |
| College/Associate Degree | 205 (86.1%) | 33 (13.9%) |
| Bachelor's Degree or higher | 26 (100.0%) | 0 (0.0%) |
Occupancy by Age of Householder in Potomac Park
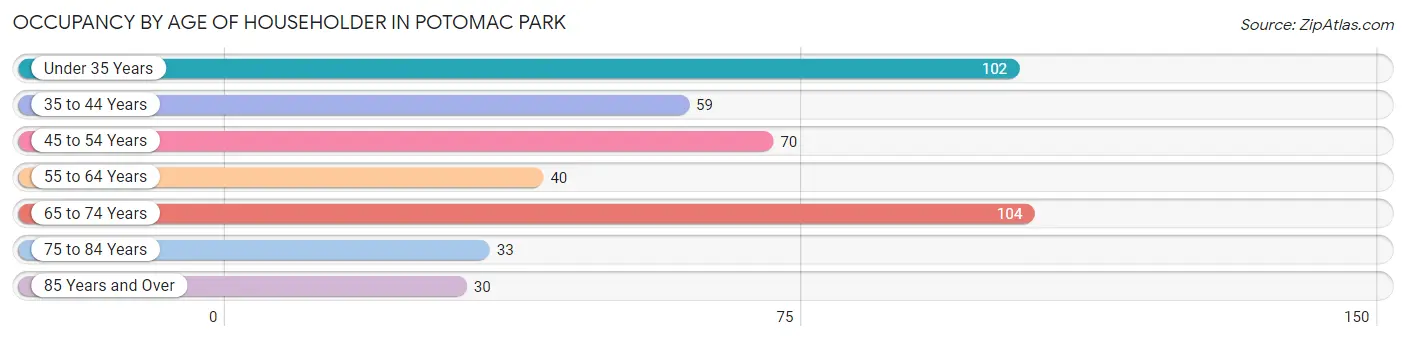
| Age Bracket | # Households | % Households |
| Under 35 Years | 102 | 23.3% |
| 35 to 44 Years | 59 | 13.5% |
| 45 to 54 Years | 70 | 16.0% |
| 55 to 64 Years | 40 | 9.1% |
| 65 to 74 Years | 104 | 23.7% |
| 75 to 84 Years | 33 | 7.5% |
| 85 Years and Over | 30 | 6.9% |
| Total | 438 | 100.0% |
Housing Finances in Potomac Park
Median Income by Occupancy in Potomac Park
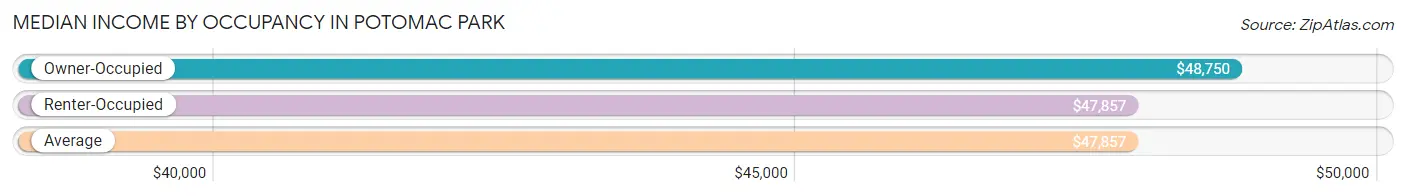
| Occupancy Type | # Households | Median Income |
| Owner-Occupied | 394 (89.9%) | $48,750 |
| Renter-Occupied | 44 (10.1%) | $47,857 |
| Average | 438 (100.0%) | $47,857 |
Occupancy by Householder Income Bracket in Potomac Park
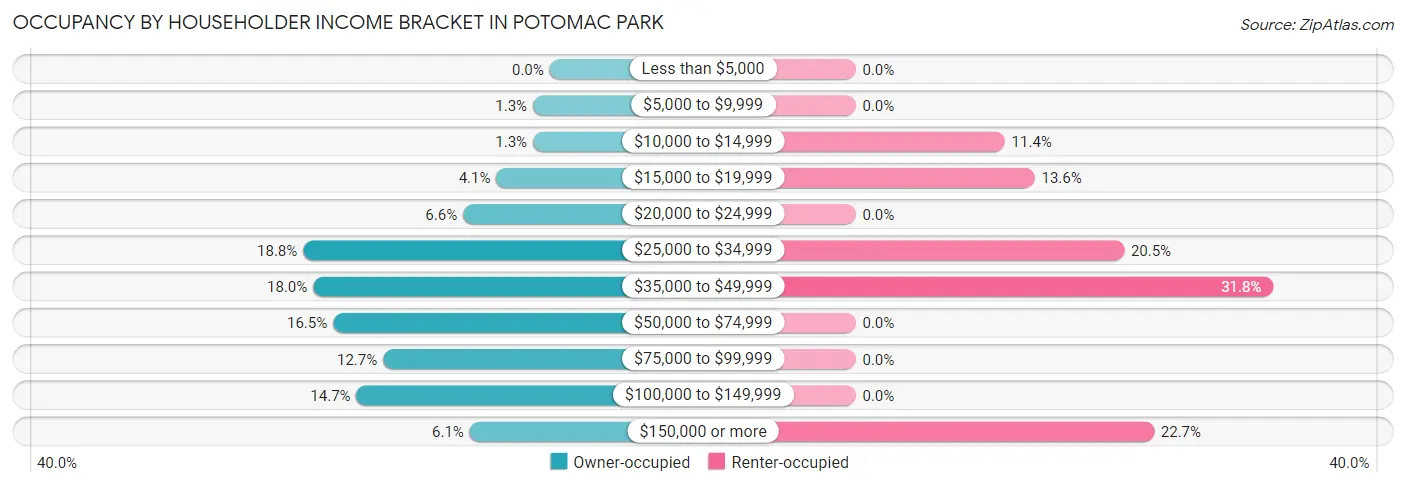
| Income Bracket | Owner-occupied | Renter-occupied |
| Less than $5,000 | 0 (0.0%) | 0 (0.0%) |
| $5,000 to $9,999 | 5 (1.3%) | 0 (0.0%) |
| $10,000 to $14,999 | 5 (1.3%) | 5 (11.4%) |
| $15,000 to $19,999 | 16 (4.1%) | 6 (13.6%) |
| $20,000 to $24,999 | 26 (6.6%) | 0 (0.0%) |
| $25,000 to $34,999 | 74 (18.8%) | 9 (20.4%) |
| $35,000 to $49,999 | 71 (18.0%) | 14 (31.8%) |
| $50,000 to $74,999 | 65 (16.5%) | 0 (0.0%) |
| $75,000 to $99,999 | 50 (12.7%) | 0 (0.0%) |
| $100,000 to $149,999 | 58 (14.7%) | 0 (0.0%) |
| $150,000 or more | 24 (6.1%) | 10 (22.7%) |
| Total | 394 (100.0%) | 44 (100.0%) |
Monthly Housing Cost Tiers in Potomac Park
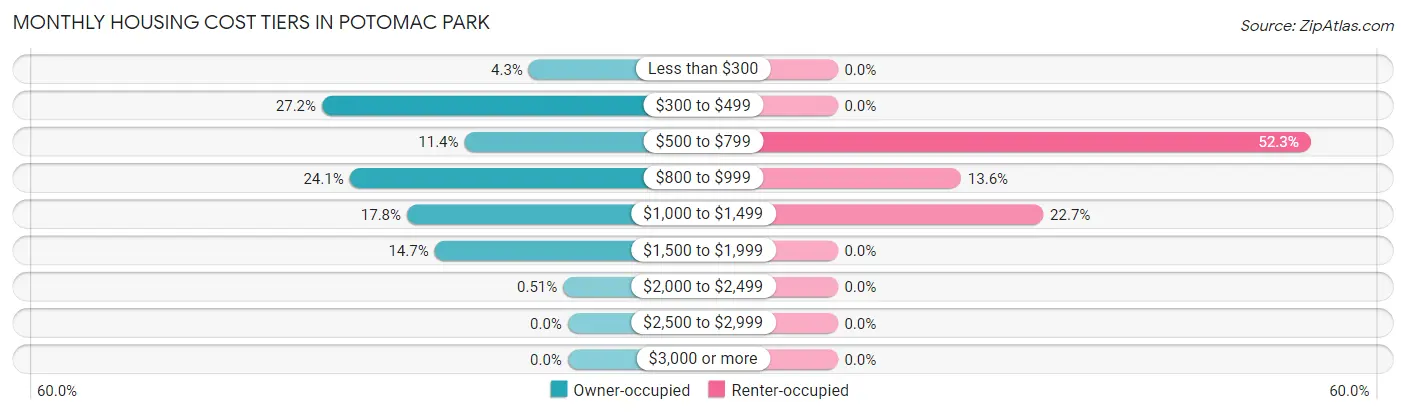
| Monthly Cost | Owner-occupied | Renter-occupied |
| Less than $300 | 17 (4.3%) | 0 (0.0%) |
| $300 to $499 | 107 (27.2%) | 0 (0.0%) |
| $500 to $799 | 45 (11.4%) | 23 (52.3%) |
| $800 to $999 | 95 (24.1%) | 6 (13.6%) |
| $1,000 to $1,499 | 70 (17.8%) | 10 (22.7%) |
| $1,500 to $1,999 | 58 (14.7%) | 0 (0.0%) |
| $2,000 to $2,499 | 2 (0.5%) | 0 (0.0%) |
| $2,500 to $2,999 | 0 (0.0%) | 0 (0.0%) |
| $3,000 or more | 0 (0.0%) | 0 (0.0%) |
| Total | 394 (100.0%) | 44 (100.0%) |
Physical Housing Characteristics in Potomac Park
Housing Structures in Potomac Park
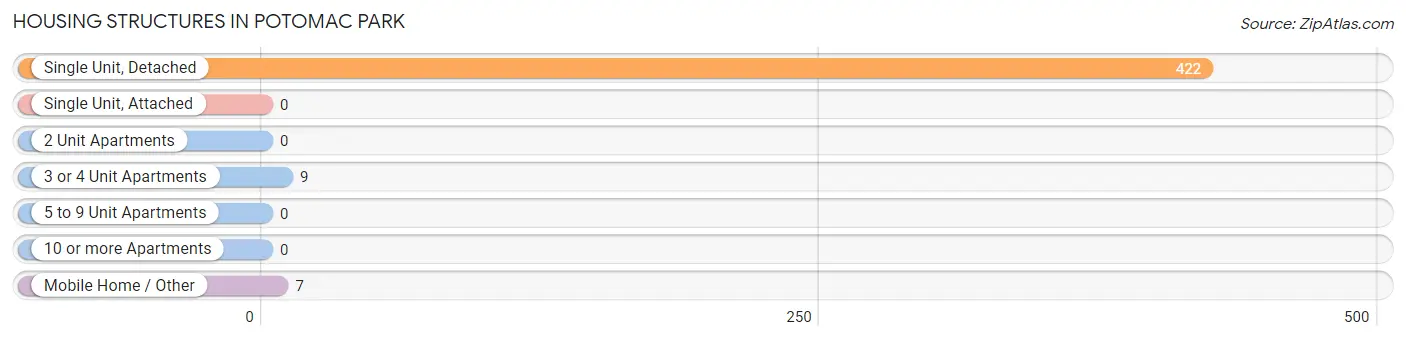
| Structure Type | # Housing Units | % Housing Units |
| Single Unit, Detached | 422 | 96.4% |
| Single Unit, Attached | 0 | 0.0% |
| 2 Unit Apartments | 0 | 0.0% |
| 3 or 4 Unit Apartments | 9 | 2.1% |
| 5 to 9 Unit Apartments | 0 | 0.0% |
| 10 or more Apartments | 0 | 0.0% |
| Mobile Home / Other | 7 | 1.6% |
| Total | 438 | 100.0% |
Housing Structures by Occupancy in Potomac Park
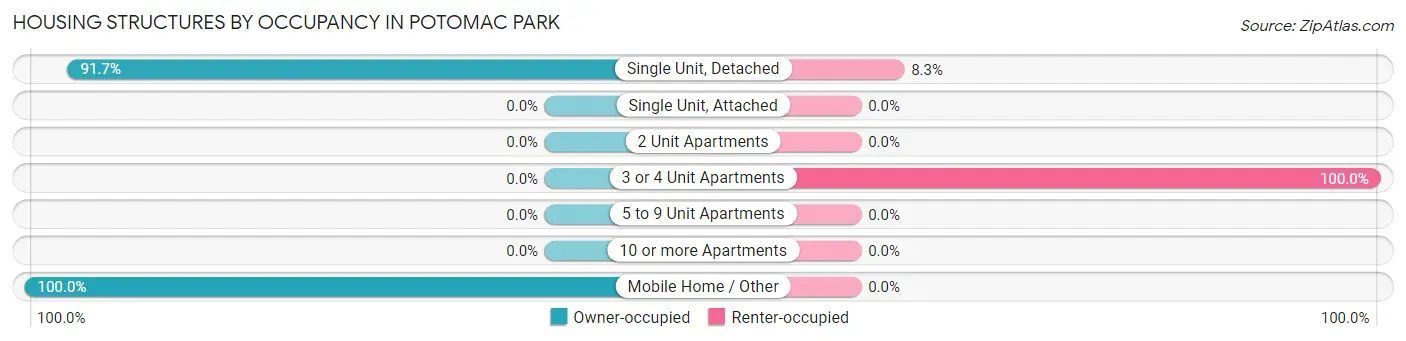
| Structure Type | Owner-occupied | Renter-occupied |
| Single Unit, Detached | 387 (91.7%) | 35 (8.3%) |
| Single Unit, Attached | 0 (0.0%) | 0 (0.0%) |
| 2 Unit Apartments | 0 (0.0%) | 0 (0.0%) |
| 3 or 4 Unit Apartments | 0 (0.0%) | 9 (100.0%) |
| 5 to 9 Unit Apartments | 0 (0.0%) | 0 (0.0%) |
| 10 or more Apartments | 0 (0.0%) | 0 (0.0%) |
| Mobile Home / Other | 7 (100.0%) | 0 (0.0%) |
| Total | 394 (89.9%) | 44 (10.1%) |
Housing Structures by Number of Rooms in Potomac Park
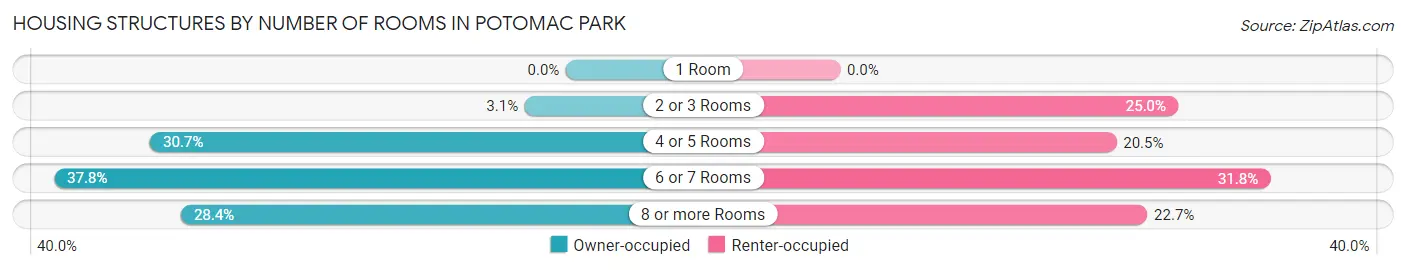
| Number of Rooms | Owner-occupied | Renter-occupied |
| 1 Room | 0 (0.0%) | 0 (0.0%) |
| 2 or 3 Rooms | 12 (3.0%) | 11 (25.0%) |
| 4 or 5 Rooms | 121 (30.7%) | 9 (20.4%) |
| 6 or 7 Rooms | 149 (37.8%) | 14 (31.8%) |
| 8 or more Rooms | 112 (28.4%) | 10 (22.7%) |
| Total | 394 (100.0%) | 44 (100.0%) |
Housing Structure by Heating Type in Potomac Park
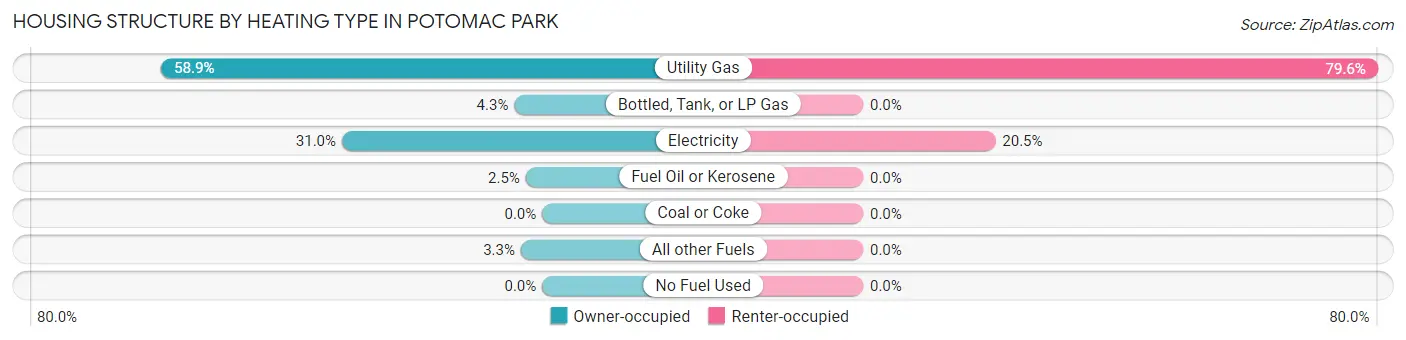
| Heating Type | Owner-occupied | Renter-occupied |
| Utility Gas | 232 (58.9%) | 35 (79.5%) |
| Bottled, Tank, or LP Gas | 17 (4.3%) | 0 (0.0%) |
| Electricity | 122 (31.0%) | 9 (20.4%) |
| Fuel Oil or Kerosene | 10 (2.5%) | 0 (0.0%) |
| Coal or Coke | 0 (0.0%) | 0 (0.0%) |
| All other Fuels | 13 (3.3%) | 0 (0.0%) |
| No Fuel Used | 0 (0.0%) | 0 (0.0%) |
| Total | 394 (100.0%) | 44 (100.0%) |
Household Vehicle Usage in Potomac Park
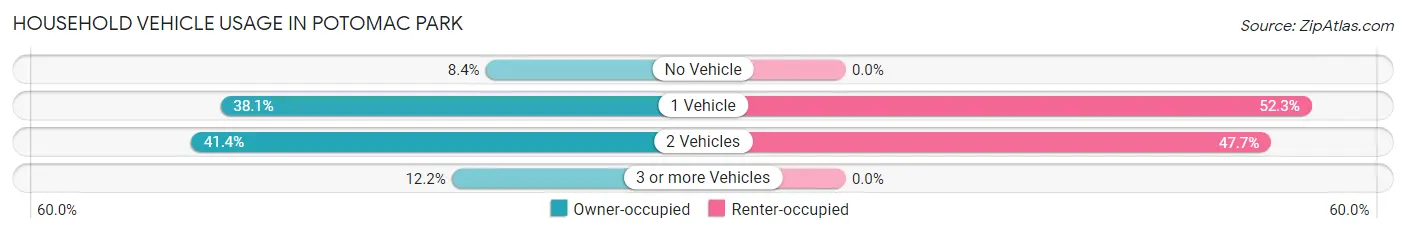
| Vehicles per Household | Owner-occupied | Renter-occupied |
| No Vehicle | 33 (8.4%) | 0 (0.0%) |
| 1 Vehicle | 150 (38.1%) | 23 (52.3%) |
| 2 Vehicles | 163 (41.4%) | 21 (47.7%) |
| 3 or more Vehicles | 48 (12.2%) | 0 (0.0%) |
| Total | 394 (100.0%) | 44 (100.0%) |
Real Estate & Mortgages in Potomac Park
Real Estate and Mortgage Overview in Potomac Park
| Characteristic | Without Mortgage | With Mortgage |
| Housing Units | 153 | 241 |
| Median Property Value | $112,500 | $127,700 |
| Median Household Income | $43,203 | $24 |
| Monthly Housing Costs | $429 | $0 |
| Real Estate Taxes | $1,232 | $31 |
Property Value by Mortgage Status in Potomac Park
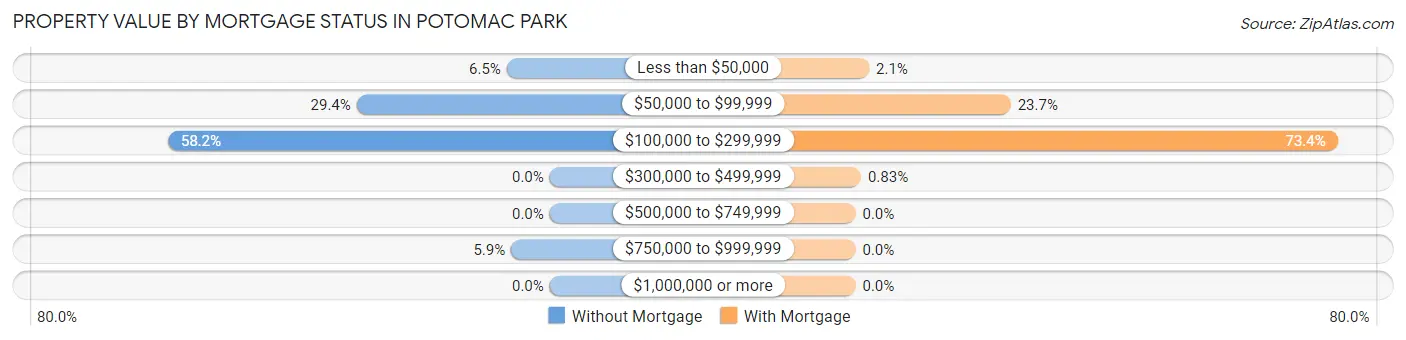
| Property Value | Without Mortgage | With Mortgage |
| Less than $50,000 | 10 (6.5%) | 5 (2.1%) |
| $50,000 to $99,999 | 45 (29.4%) | 57 (23.6%) |
| $100,000 to $299,999 | 89 (58.2%) | 177 (73.4%) |
| $300,000 to $499,999 | 0 (0.0%) | 2 (0.8%) |
| $500,000 to $749,999 | 0 (0.0%) | 0 (0.0%) |
| $750,000 to $999,999 | 9 (5.9%) | 0 (0.0%) |
| $1,000,000 or more | 0 (0.0%) | 0 (0.0%) |
| Total | 153 (100.0%) | 241 (100.0%) |
Household Income by Mortgage Status in Potomac Park
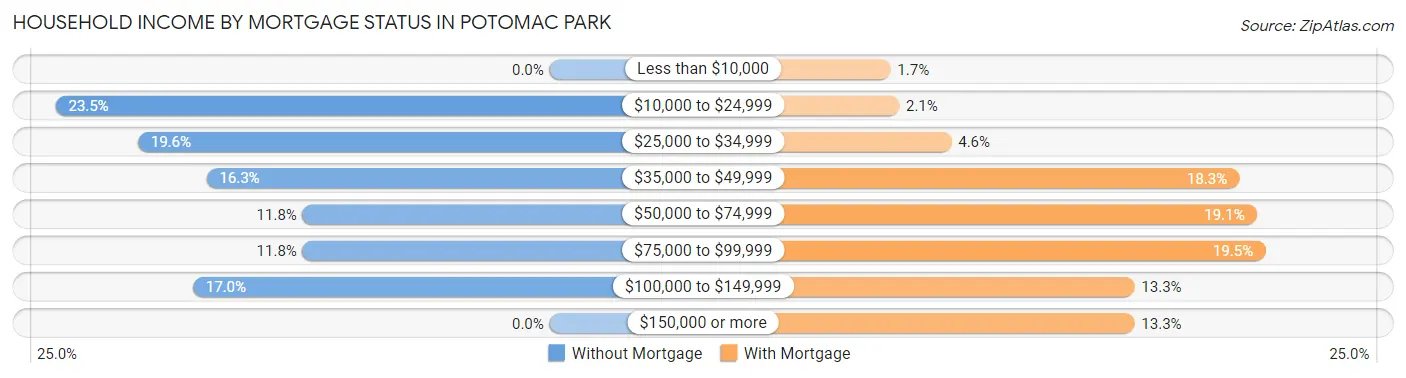
| Household Income | Without Mortgage | With Mortgage |
| Less than $10,000 | 0 (0.0%) | 4 (1.7%) |
| $10,000 to $24,999 | 36 (23.5%) | 5 (2.1%) |
| $25,000 to $34,999 | 30 (19.6%) | 11 (4.6%) |
| $35,000 to $49,999 | 25 (16.3%) | 44 (18.3%) |
| $50,000 to $74,999 | 18 (11.8%) | 46 (19.1%) |
| $75,000 to $99,999 | 18 (11.8%) | 47 (19.5%) |
| $100,000 to $149,999 | 26 (17.0%) | 32 (13.3%) |
| $150,000 or more | 0 (0.0%) | 32 (13.3%) |
| Total | 153 (100.0%) | 241 (100.0%) |
Property Value to Household Income Ratio in Potomac Park
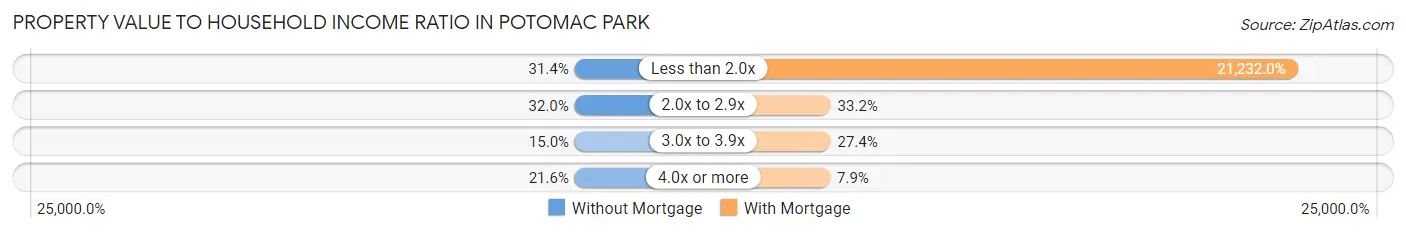
| Value-to-Income Ratio | Without Mortgage | With Mortgage |
| Less than 2.0x | 48 (31.4%) | 51,169 (21,232.0%) |
| 2.0x to 2.9x | 49 (32.0%) | 80 (33.2%) |
| 3.0x to 3.9x | 23 (15.0%) | 66 (27.4%) |
| 4.0x or more | 33 (21.6%) | 19 (7.9%) |
| Total | 153 (100.0%) | 241 (100.0%) |
Real Estate Taxes by Mortgage Status in Potomac Park
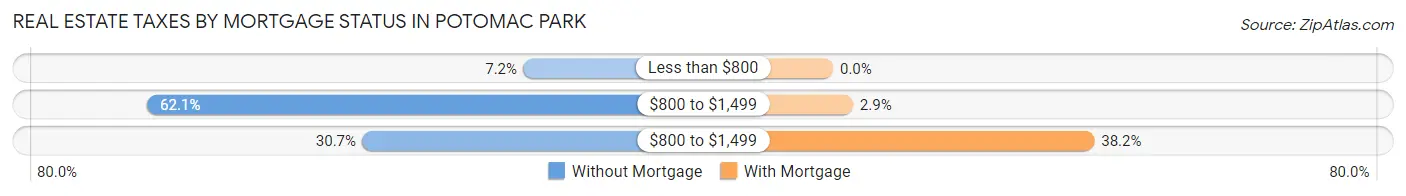
| Property Taxes | Without Mortgage | With Mortgage |
| Less than $800 | 11 (7.2%) | 0 (0.0%) |
| $800 to $1,499 | 95 (62.1%) | 7 (2.9%) |
| $800 to $1,499 | 47 (30.7%) | 92 (38.2%) |
| Total | 153 (100.0%) | 241 (100.0%) |
Health & Disability in Potomac Park
Health Insurance Coverage by Age in Potomac Park
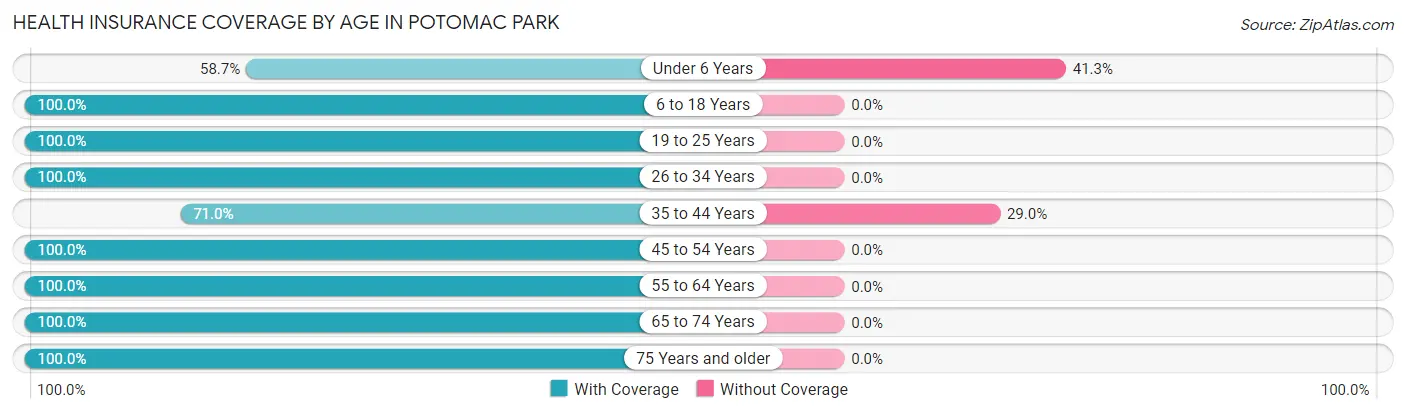
| Age Bracket | With Coverage | Without Coverage |
| Under 6 Years | 27 (58.7%) | 19 (41.3%) |
| 6 to 18 Years | 138 (100.0%) | 0 (0.0%) |
| 19 to 25 Years | 56 (100.0%) | 0 (0.0%) |
| 26 to 34 Years | 170 (100.0%) | 0 (0.0%) |
| 35 to 44 Years | 66 (71.0%) | 27 (29.0%) |
| 45 to 54 Years | 123 (100.0%) | 0 (0.0%) |
| 55 to 64 Years | 73 (100.0%) | 0 (0.0%) |
| 65 to 74 Years | 138 (100.0%) | 0 (0.0%) |
| 75 Years and older | 139 (100.0%) | 0 (0.0%) |
| Total | 930 (95.3%) | 46 (4.7%) |
Health Insurance Coverage by Citizenship Status in Potomac Park
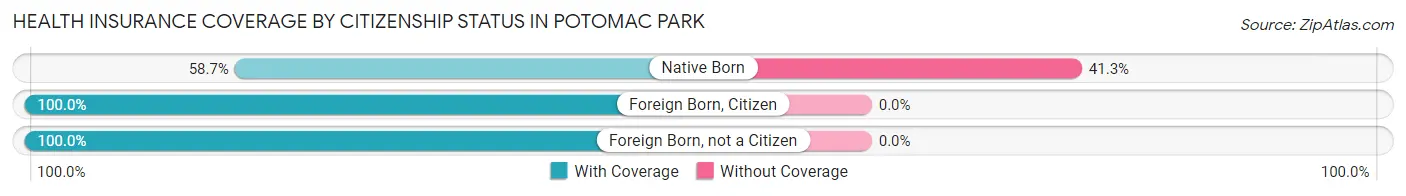
| Citizenship Status | With Coverage | Without Coverage |
| Native Born | 27 (58.7%) | 19 (41.3%) |
| Foreign Born, Citizen | 138 (100.0%) | 0 (0.0%) |
| Foreign Born, not a Citizen | 56 (100.0%) | 0 (0.0%) |
Health Insurance Coverage by Household Income in Potomac Park
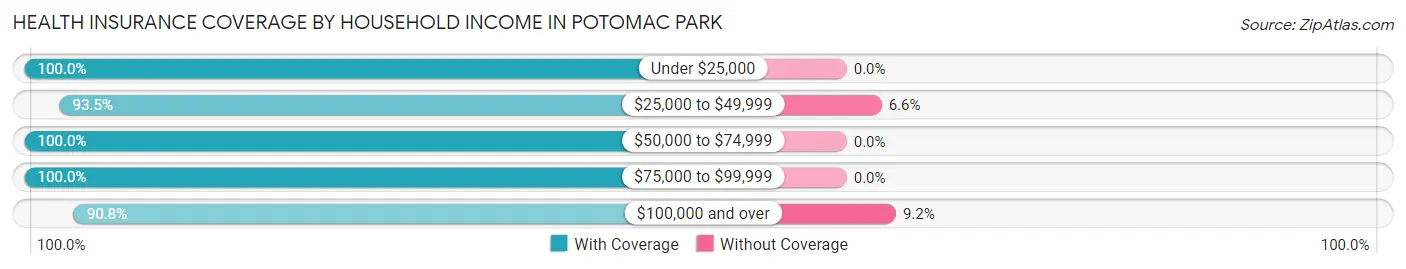
| Household Income | With Coverage | Without Coverage |
| Under $25,000 | 87 (100.0%) | 0 (0.0%) |
| $25,000 to $49,999 | 271 (93.4%) | 19 (6.6%) |
| $50,000 to $74,999 | 160 (100.0%) | 0 (0.0%) |
| $75,000 to $99,999 | 146 (100.0%) | 0 (0.0%) |
| $100,000 and over | 266 (90.8%) | 27 (9.2%) |
Public vs Private Health Insurance Coverage by Age in Potomac Park
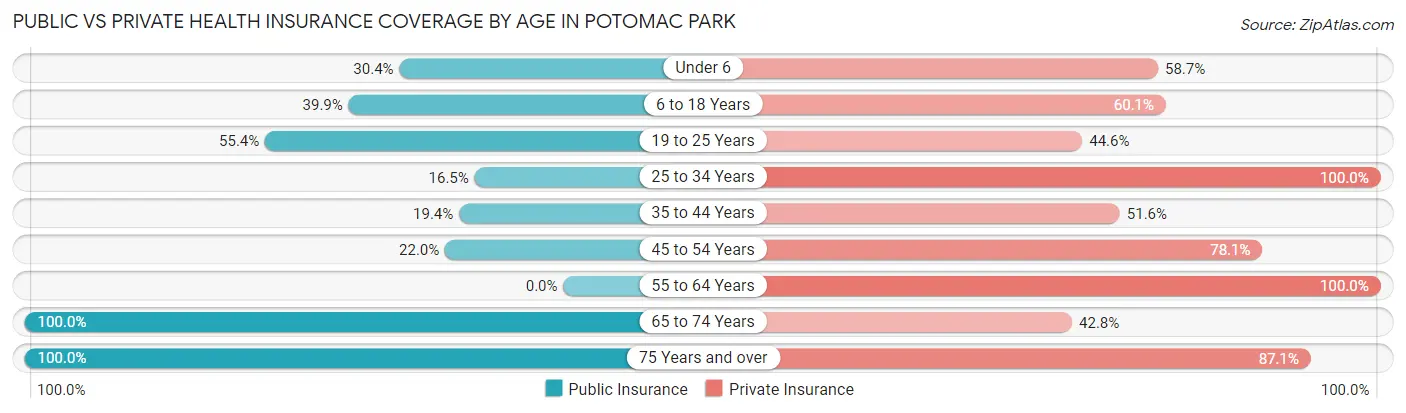
| Age Bracket | Public Insurance | Private Insurance |
| Under 6 | 14 (30.4%) | 27 (58.7%) |
| 6 to 18 Years | 55 (39.9%) | 83 (60.1%) |
| 19 to 25 Years | 31 (55.4%) | 25 (44.6%) |
| 25 to 34 Years | 28 (16.5%) | 170 (100.0%) |
| 35 to 44 Years | 18 (19.4%) | 48 (51.6%) |
| 45 to 54 Years | 27 (22.0%) | 96 (78.0%) |
| 55 to 64 Years | 0 (0.0%) | 73 (100.0%) |
| 65 to 74 Years | 138 (100.0%) | 59 (42.7%) |
| 75 Years and over | 139 (100.0%) | 121 (87.1%) |
| Total | 450 (46.1%) | 702 (71.9%) |
Disability Status by Sex by Age in Potomac Park
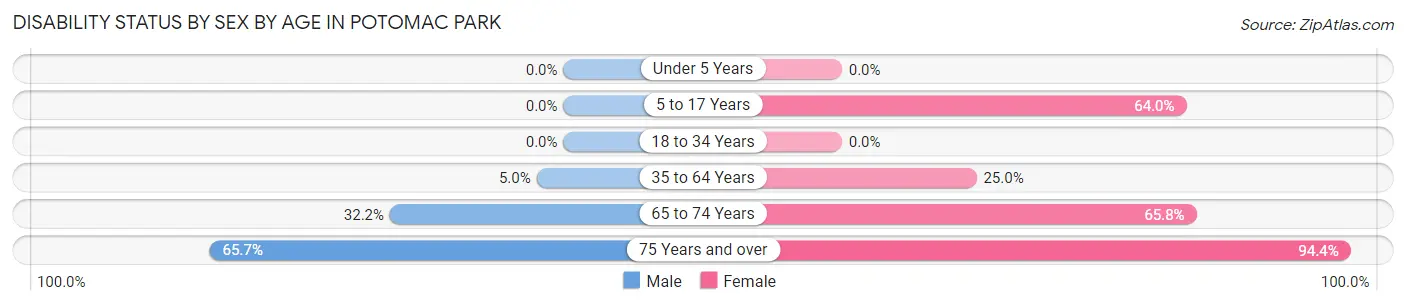
| Age Bracket | Male | Female |
| Under 5 Years | 0 (0.0%) | 0 (0.0%) |
| 5 to 17 Years | 0 (0.0%) | 55 (63.9%) |
| 18 to 34 Years | 0 (0.0%) | 0 (0.0%) |
| 35 to 64 Years | 8 (5.0%) | 32 (25.0%) |
| 65 to 74 Years | 19 (32.2%) | 52 (65.8%) |
| 75 Years and over | 44 (65.7%) | 68 (94.4%) |
Disability Class by Sex by Age in Potomac Park
Disability Class: Hearing Difficulty
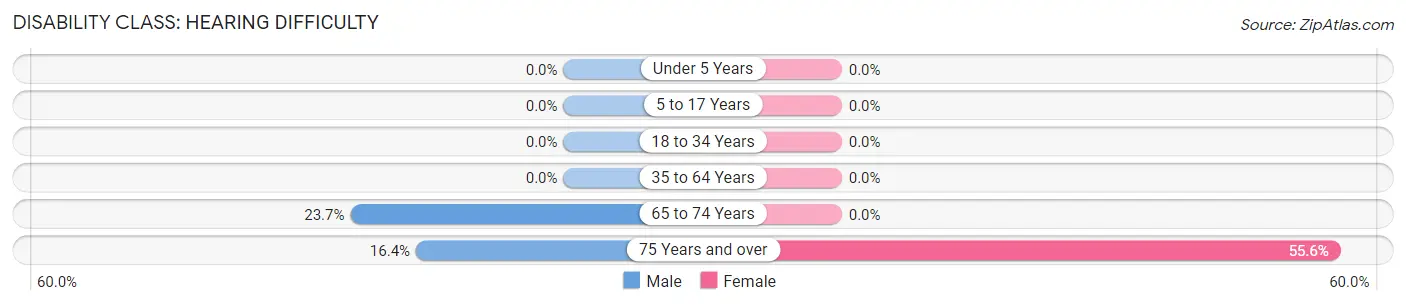
| Age Bracket | Male | Female |
| Under 5 Years | 0 (0.0%) | 0 (0.0%) |
| 5 to 17 Years | 0 (0.0%) | 0 (0.0%) |
| 18 to 34 Years | 0 (0.0%) | 0 (0.0%) |
| 35 to 64 Years | 0 (0.0%) | 0 (0.0%) |
| 65 to 74 Years | 14 (23.7%) | 0 (0.0%) |
| 75 Years and over | 11 (16.4%) | 40 (55.6%) |
Disability Class: Vision Difficulty
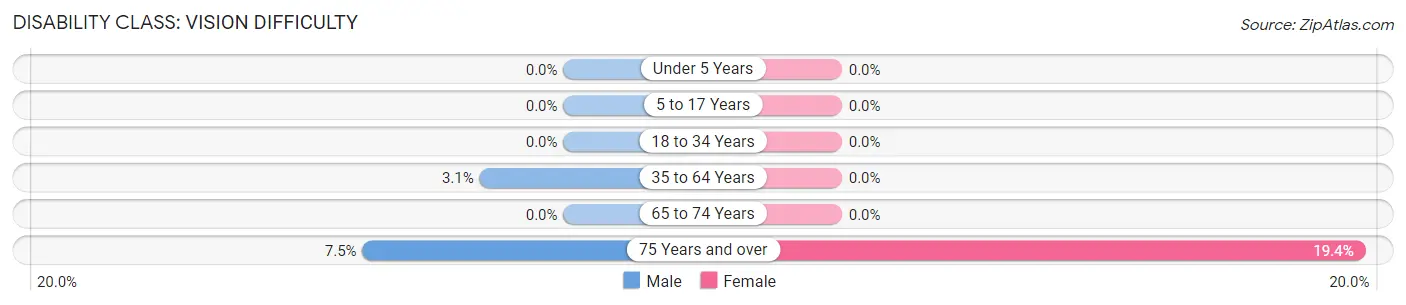
| Age Bracket | Male | Female |
| Under 5 Years | 0 (0.0%) | 0 (0.0%) |
| 5 to 17 Years | 0 (0.0%) | 0 (0.0%) |
| 18 to 34 Years | 0 (0.0%) | 0 (0.0%) |
| 35 to 64 Years | 5 (3.1%) | 0 (0.0%) |
| 65 to 74 Years | 0 (0.0%) | 0 (0.0%) |
| 75 Years and over | 5 (7.5%) | 14 (19.4%) |
Disability Class: Cognitive Difficulty
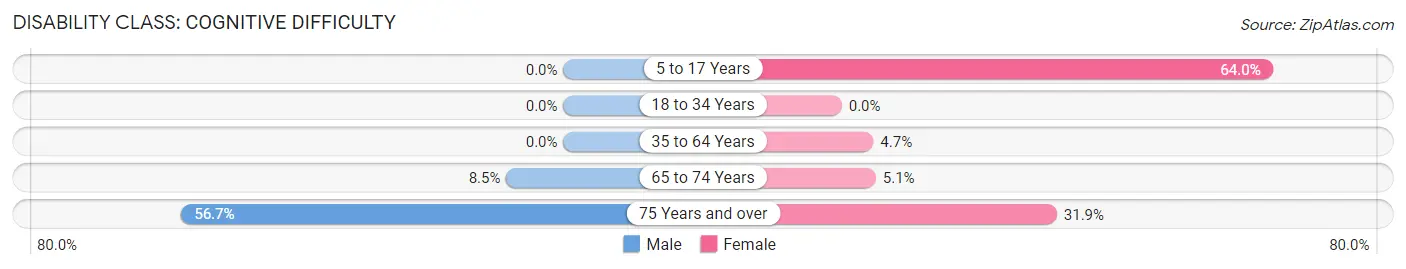
| Age Bracket | Male | Female |
| 5 to 17 Years | 0 (0.0%) | 55 (63.9%) |
| 18 to 34 Years | 0 (0.0%) | 0 (0.0%) |
| 35 to 64 Years | 0 (0.0%) | 6 (4.7%) |
| 65 to 74 Years | 5 (8.5%) | 4 (5.1%) |
| 75 Years and over | 38 (56.7%) | 23 (31.9%) |
Disability Class: Ambulatory Difficulty
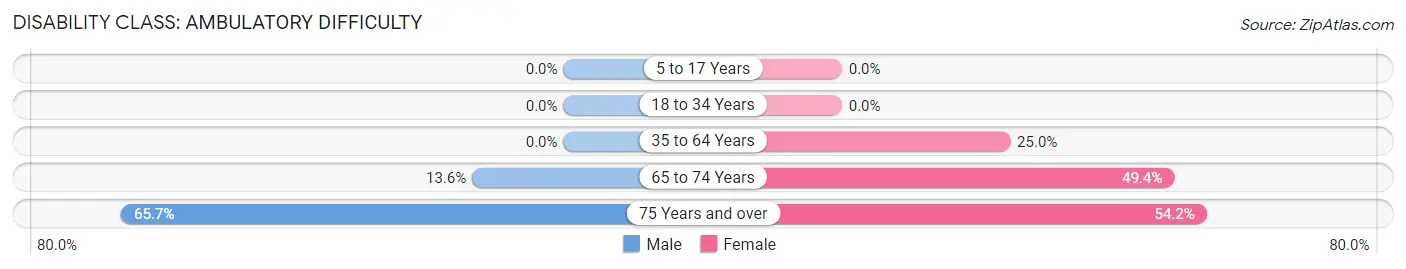
| Age Bracket | Male | Female |
| 5 to 17 Years | 0 (0.0%) | 0 (0.0%) |
| 18 to 34 Years | 0 (0.0%) | 0 (0.0%) |
| 35 to 64 Years | 0 (0.0%) | 32 (25.0%) |
| 65 to 74 Years | 8 (13.6%) | 39 (49.4%) |
| 75 Years and over | 44 (65.7%) | 39 (54.2%) |
Disability Class: Self-Care Difficulty
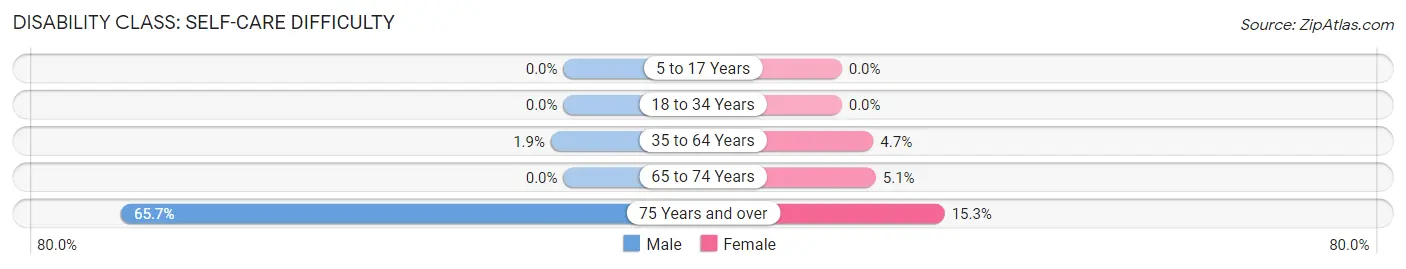
| Age Bracket | Male | Female |
| 5 to 17 Years | 0 (0.0%) | 0 (0.0%) |
| 18 to 34 Years | 0 (0.0%) | 0 (0.0%) |
| 35 to 64 Years | 3 (1.9%) | 6 (4.7%) |
| 65 to 74 Years | 0 (0.0%) | 4 (5.1%) |
| 75 Years and over | 44 (65.7%) | 11 (15.3%) |
Technology Access in Potomac Park
Computing Device Access in Potomac Park
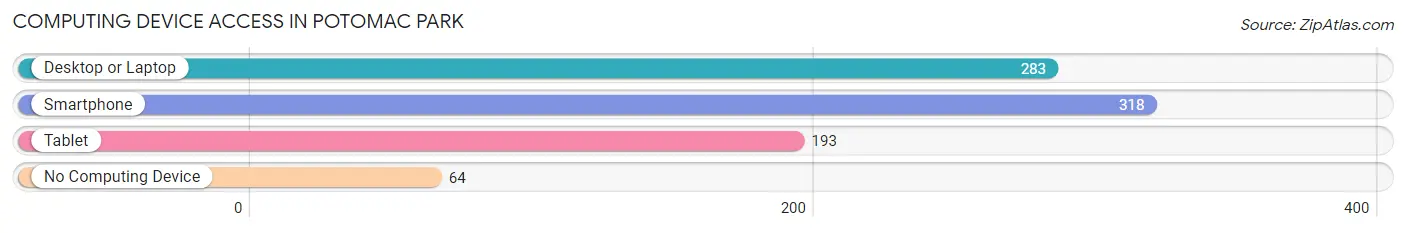
| Device Type | # Households | % Households |
| Desktop or Laptop | 283 | 64.6% |
| Smartphone | 318 | 72.6% |
| Tablet | 193 | 44.1% |
| No Computing Device | 64 | 14.6% |
| Total | 438 | 100.0% |
Internet Access in Potomac Park
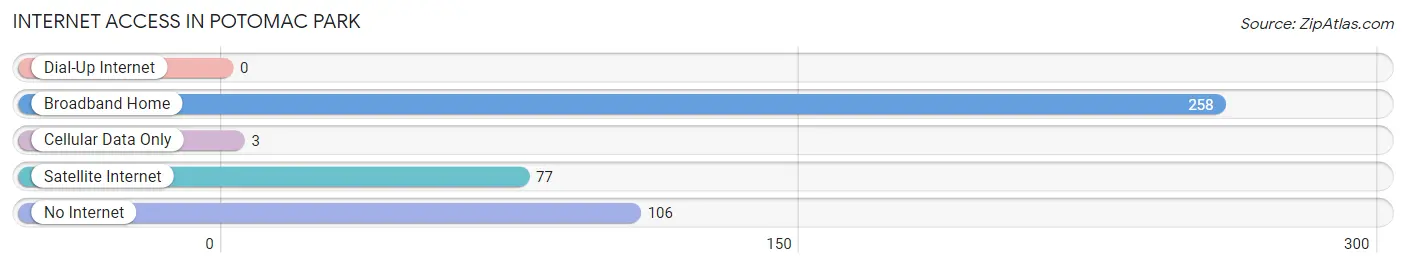
| Internet Type | # Households | % Households |
| Dial-Up Internet | 0 | 0.0% |
| Broadband Home | 258 | 58.9% |
| Cellular Data Only | 3 | 0.7% |
| Satellite Internet | 77 | 17.6% |
| No Internet | 106 | 24.2% |
| Total | 438 | 100.0% |
Potomac Park Summary
Potomac Park is a park located in Washington, D.C., United States, along the Potomac River. It is part of the National Mall and is managed by the National Park Service. The park is located between the Lincoln Memorial and the Jefferson Memorial, and is bordered by the Potomac River to the west and the Tidal Basin to the east.
History
Potomac Park was originally part of the Potomac River, which was used by Native Americans for fishing and transportation. In the late 1700s, the area was used as a military encampment by the United States Army. In 1882, the area was designated as a public park and was named Potomac Park.
In the early 1900s, the park was used for recreational activities such as boating, fishing, and swimming. In the 1930s, the park was expanded to include a number of monuments and memorials, including the Lincoln Memorial, the Jefferson Memorial, and the Franklin Delano Roosevelt Memorial.
In the 1950s, the park was further developed with the addition of a number of recreational facilities, including tennis courts, basketball courts, and a playground. In the 1960s, the park was used as a staging area for the March on Washington for Jobs and Freedom.
Geography
Potomac Park is located in Washington, D.C., United States, along the Potomac River. The park is bordered by the Potomac River to the west and the Tidal Basin to the east. The park is located between the Lincoln Memorial and the Jefferson Memorial.
The park is approximately 1.5 miles long and 0.5 miles wide. The park is mostly flat, with some areas of rolling hills. The park is covered with grass and trees, and is home to a variety of wildlife, including birds, squirrels, and rabbits.
Economy
Potomac Park is a popular tourist destination, attracting millions of visitors each year. The park is home to a number of monuments and memorials, which are popular attractions for visitors. The park also hosts a variety of events, including concerts, festivals, and sporting events.
The park is also home to a number of businesses, including restaurants, hotels, and souvenir shops. These businesses provide employment opportunities for local residents and contribute to the local economy.
Demographics
According to the 2010 U.S. Census, the population of Potomac Park was 1,845. The population is predominantly white (83.3%), followed by African American (10.2%), Asian (3.2%), and Hispanic or Latino (2.7%). The median household income is $50,945, and the median age is 37.
Conclusion
Potomac Park is a popular park located in Washington, D.C., United States, along the Potomac River. The park is managed by the National Park Service and is home to a number of monuments and memorials, as well as recreational facilities and businesses. The park is a popular tourist destination, attracting millions of visitors each year, and is home to a diverse population.
Common Questions
What is Per Capita Income in Potomac Park?
Per Capita income in Potomac Park is $31,570.
What is the Median Family Income in Potomac Park?
Median Family Income in Potomac Park is $51,731.
What is the Median Household income in Potomac Park?
Median Household Income in Potomac Park is $47,857.
What is Income or Wage Gap in Potomac Park?
Income or Wage Gap in Potomac Park is 50.1%.
Women in Potomac Park earn 49.9 cents for every dollar earned by a man.
What is Inequality or Gini Index in Potomac Park?
Inequality or Gini Index in Potomac Park is 0.39.
What is the Total Population of Potomac Park?
Total Population of Potomac Park is 976.
What is the Total Male Population of Potomac Park?
Total Male Population of Potomac Park is 495.
What is the Total Female Population of Potomac Park?
Total Female Population of Potomac Park is 481.
What is the Ratio of Males per 100 Females in Potomac Park?
There are 102.91 Males per 100 Females in Potomac Park.
What is the Ratio of Females per 100 Males in Potomac Park?
There are 97.17 Females per 100 Males in Potomac Park.
What is the Median Population Age in Potomac Park?
Median Population Age in Potomac Park is 44.6 Years.
What is the Average Family Size in Potomac Park
Average Family Size in Potomac Park is 2.5 People.
What is the Average Household Size in Potomac Park
Average Household Size in Potomac Park is 2.2 People.
How Large is the Labor Force in Potomac Park?
There are 466 People in the Labor Forcein in Potomac Park.
What is the Percentage of People in the Labor Force in Potomac Park?
57.7% of People are in the Labor Force in Potomac Park.
What is the Unemployment Rate in Potomac Park?
Unemployment Rate in Potomac Park is 5.8%.