Cities with the Highest Unemployment Rate Among Females in Maryland
RELATED REPORTS & OPTIONS
Highest Unemployment | Female
Maryland
Compare Cities
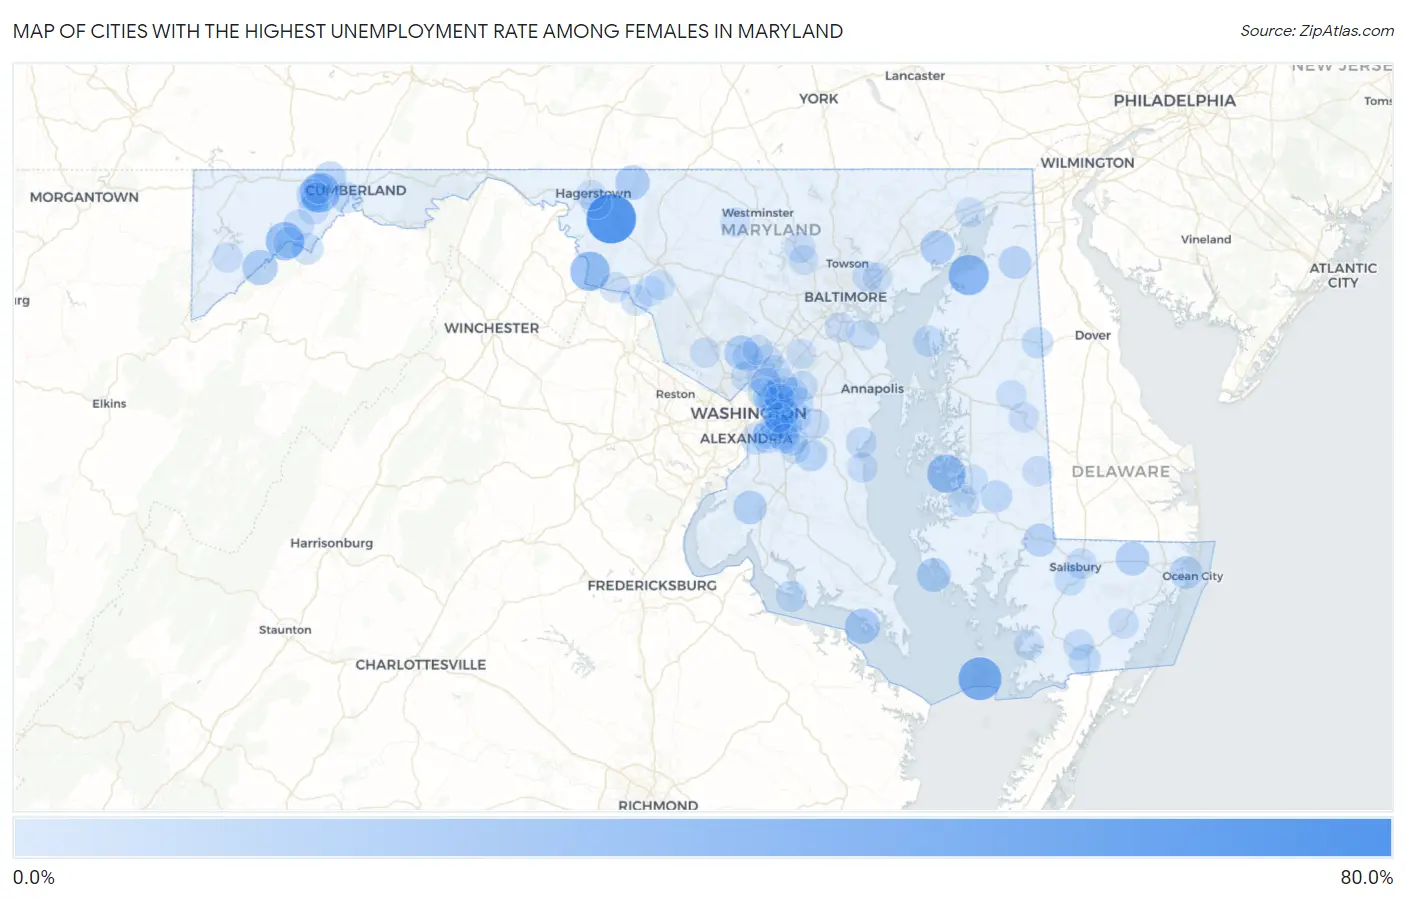
Map of Cities with the Highest Unemployment Rate Among Females in Maryland
0.0%
80.0%
Cities with the Highest Unemployment Rate Among Females in Maryland
| City | Female Unemployment | vs State | vs National | |
| 1. | Lisbon | 75.0% | 4.8%(+70.2)#1 | 4.9%(+70.1)#88 |
| 2. | San Mar | 70.0% | 4.8%(+65.2)#2 | 4.9%(+65.1)#104 |
| 3. | Smith Island | 48.3% | 4.8%(+43.5)#3 | 4.9%(+43.4)#247 |
| 4. | Betterton | 39.4% | 4.8%(+34.6)#4 | 4.9%(+34.5)#368 |
| 5. | Grahamtown | 38.0% | 4.8%(+33.2)#5 | 4.9%(+33.1)#390 |
| 6. | Dargan | 36.4% | 4.8%(+31.6)#6 | 4.9%(+31.5)#425 |
| 7. | Bloomington | 33.3% | 4.8%(+28.5)#7 | 4.9%(+28.4)#506 |
| 8. | Oxford | 32.8% | 4.8%(+28.0)#8 | 4.9%(+27.9)#531 |
| 9. | Seat Pleasant | 26.9% | 4.8%(+22.1)#9 | 4.9%(+22.0)#784 |
| 10. | Ten Mile Creek | 24.8% | 4.8%(+20.0)#10 | 4.9%(+19.9)#914 |
| 11. | Tall Timbers | 23.4% | 4.8%(+18.6)#11 | 4.9%(+18.5)#1,012 |
| 12. | Kitzmiller | 23.3% | 4.8%(+18.5)#12 | 4.9%(+18.4)#1,027 |
| 13. | Perryman | 20.5% | 4.8%(+15.7)#13 | 4.9%(+15.6)#1,270 |
| 14. | Edgemont | 20.3% | 4.8%(+15.5)#14 | 4.9%(+15.4)#1,281 |
| 15. | Leisure World | 19.7% | 4.8%(+14.9)#15 | 4.9%(+14.8)#1,349 |
| 16. | Fishing Creek | 19.4% | 4.8%(+14.6)#16 | 4.9%(+14.5)#1,395 |
| 17. | Pomfret | 18.4% | 4.8%(+13.6)#17 | 4.9%(+13.5)#1,500 |
| 18. | Willards | 17.9% | 4.8%(+13.1)#18 | 4.9%(+13.0)#1,564 |
| 19. | Mardela Springs | 16.1% | 4.8%(+11.3)#19 | 4.9%(+11.2)#1,866 |
| 20. | Cecilton | 15.5% | 4.8%(+10.7)#20 | 4.9%(+10.6)#1,996 |
| 21. | West Ocean City | 15.4% | 4.8%(+10.6)#21 | 4.9%(+10.5)#2,005 |
| 22. | Croom | 15.0% | 4.8%(+10.2)#22 | 4.9%(+10.1)#2,110 |
| 23. | Morningside | 14.5% | 4.8%(+9.70)#23 | 4.9%(+9.60)#2,239 |
| 24. | Woodlawn Cdp Prince George S County | 14.4% | 4.8%(+9.60)#24 | 4.9%(+9.50)#2,254 |
| 25. | District Heights | 14.4% | 4.8%(+9.60)#25 | 4.9%(+9.50)#2,255 |
| 26. | Mount Savage | 13.8% | 4.8%(+9.00)#26 | 4.9%(+8.90)#2,433 |
| 27. | Midlothian | 13.6% | 4.8%(+8.80)#27 | 4.9%(+8.70)#2,483 |
| 28. | Bladensburg | 13.4% | 4.8%(+8.60)#28 | 4.9%(+8.50)#2,517 |
| 29. | Temple Hills | 12.9% | 4.8%(+8.10)#29 | 4.9%(+8.00)#2,657 |
| 30. | Secretary | 12.6% | 4.8%(+7.80)#30 | 4.9%(+7.70)#2,774 |
| 31. | Burnt Mills | 12.4% | 4.8%(+7.60)#31 | 4.9%(+7.50)#2,846 |
| 32. | North Brentwood | 12.1% | 4.8%(+7.30)#32 | 4.9%(+7.20)#2,979 |
| 33. | Mccoole | 12.1% | 4.8%(+7.30)#33 | 4.9%(+7.20)#2,988 |
| 34. | Forest Heights | 11.8% | 4.8%(+7.00)#34 | 4.9%(+6.90)#3,085 |
| 35. | Pocomoke City | 11.7% | 4.8%(+6.90)#35 | 4.9%(+6.80)#3,133 |
| 36. | Algonquin | 11.7% | 4.8%(+6.90)#36 | 4.9%(+6.80)#3,157 |
| 37. | Rock Hall | 11.4% | 4.8%(+6.60)#37 | 4.9%(+6.50)#3,265 |
| 38. | Bowling Green | 11.2% | 4.8%(+6.40)#38 | 4.9%(+6.30)#3,358 |
| 39. | Templeville | 11.1% | 4.8%(+6.30)#39 | 4.9%(+6.20)#3,412 |
| 40. | Luke | 11.1% | 4.8%(+6.30)#40 | 4.9%(+6.20)#3,424 |
| 41. | New Carrollton | 10.9% | 4.8%(+6.10)#41 | 4.9%(+6.00)#3,478 |
| 42. | Peppermill Village | 10.9% | 4.8%(+6.10)#42 | 4.9%(+6.00)#3,485 |
| 43. | Cobb Island | 10.7% | 4.8%(+5.90)#43 | 4.9%(+5.80)#3,610 |
| 44. | Fruitland | 10.6% | 4.8%(+5.80)#44 | 4.9%(+5.70)#3,643 |
| 45. | Midland | 10.6% | 4.8%(+5.80)#45 | 4.9%(+5.70)#3,666 |
| 46. | Melwood | 10.2% | 4.8%(+5.40)#46 | 4.9%(+5.30)#3,872 |
| 47. | Salisbury | 9.7% | 4.8%(+4.90)#47 | 4.9%(+4.80)#4,151 |
| 48. | Reisterstown | 9.7% | 4.8%(+4.90)#48 | 4.9%(+4.80)#4,152 |
| 49. | Deale | 9.7% | 4.8%(+4.90)#49 | 4.9%(+4.80)#4,167 |
| 50. | Point Of Rocks | 9.7% | 4.8%(+4.90)#50 | 4.9%(+4.80)#4,182 |
| 51. | West Pocomoke | 9.6% | 4.8%(+4.80)#51 | 4.9%(+4.70)#4,265 |
| 52. | Brock Hall | 9.5% | 4.8%(+4.70)#52 | 4.9%(+4.60)#4,283 |
| 53. | Brunswick | 9.5% | 4.8%(+4.70)#53 | 4.9%(+4.60)#4,291 |
| 54. | Barton | 9.5% | 4.8%(+4.70)#54 | 4.9%(+4.60)#4,322 |
| 55. | Romancoke | 9.4% | 4.8%(+4.60)#55 | 4.9%(+4.50)#4,388 |
| 56. | Marlow Heights | 9.2% | 4.8%(+4.40)#56 | 4.9%(+4.30)#4,513 |
| 57. | Hillandale | 9.2% | 4.8%(+4.40)#57 | 4.9%(+4.30)#4,519 |
| 58. | Colmar Manor | 9.2% | 4.8%(+4.40)#58 | 4.9%(+4.30)#4,540 |
| 59. | Riviera Beach | 9.1% | 4.8%(+4.30)#59 | 4.9%(+4.20)#4,573 |
| 60. | Glenn Dale | 9.0% | 4.8%(+4.20)#60 | 4.9%(+4.10)#4,649 |
| 61. | Fairland | 8.9% | 4.8%(+4.10)#61 | 4.9%(+4.00)#4,717 |
| 62. | Forest Glen | 8.9% | 4.8%(+4.10)#62 | 4.9%(+4.00)#4,726 |
| 63. | Largo | 8.8% | 4.8%(+4.00)#63 | 4.9%(+3.90)#4,803 |
| 64. | East Riverdale | 8.7% | 4.8%(+3.90)#64 | 4.9%(+3.80)#4,879 |
| 65. | Federalsburg | 8.6% | 4.8%(+3.80)#65 | 4.9%(+3.70)#4,965 |
| 66. | Trappe | 8.5% | 4.8%(+3.70)#66 | 4.9%(+3.60)#5,074 |
| 67. | Deer Park | 8.5% | 4.8%(+3.70)#67 | 4.9%(+3.60)#5,098 |
| 68. | Shaft | 8.5% | 4.8%(+3.70)#68 | 4.9%(+3.60)#5,102 |
| 69. | Overlea | 8.4% | 4.8%(+3.60)#69 | 4.9%(+3.50)#5,122 |
| 70. | Snow Hill | 8.4% | 4.8%(+3.60)#70 | 4.9%(+3.50)#5,149 |
| 71. | Ferndale | 8.2% | 4.8%(+3.40)#71 | 4.9%(+3.30)#5,267 |
| 72. | North Beach | 8.2% | 4.8%(+3.40)#72 | 4.9%(+3.30)#5,303 |
| 73. | North Potomac | 8.0% | 4.8%(+3.20)#73 | 4.9%(+3.10)#5,455 |
| 74. | Mitchellville | 8.0% | 4.8%(+3.20)#74 | 4.9%(+3.10)#5,461 |
| 75. | Lanham | 8.0% | 4.8%(+3.20)#75 | 4.9%(+3.10)#5,463 |
| 76. | Layhill | 8.0% | 4.8%(+3.20)#76 | 4.9%(+3.10)#5,476 |
| 77. | Denton | 8.0% | 4.8%(+3.20)#77 | 4.9%(+3.10)#5,478 |
| 78. | Cloverly | 7.8% | 4.8%(+3.00)#78 | 4.9%(+2.90)#5,664 |
| 79. | Funkstown | 7.8% | 4.8%(+3.00)#79 | 4.9%(+2.90)#5,718 |
| 80. | Hagerstown | 7.6% | 4.8%(+2.80)#80 | 4.9%(+2.70)#5,877 |
| 81. | Greenbelt | 7.6% | 4.8%(+2.80)#81 | 4.9%(+2.70)#5,881 |
| 82. | Beltsville | 7.6% | 4.8%(+2.80)#82 | 4.9%(+2.70)#5,884 |
| 83. | Adelphi | 7.6% | 4.8%(+2.80)#83 | 4.9%(+2.70)#5,886 |
| 84. | Frostburg | 7.6% | 4.8%(+2.80)#84 | 4.9%(+2.70)#5,903 |
| 85. | Chillum | 7.5% | 4.8%(+2.70)#85 | 4.9%(+2.60)#5,984 |
| 86. | Landover Hills | 7.5% | 4.8%(+2.70)#86 | 4.9%(+2.60)#6,030 |
| 87. | Adamstown | 7.4% | 4.8%(+2.60)#87 | 4.9%(+2.50)#6,121 |
| 88. | New Windsor | 7.4% | 4.8%(+2.60)#88 | 4.9%(+2.50)#6,143 |
| 89. | Buckeystown | 7.4% | 4.8%(+2.60)#89 | 4.9%(+2.50)#6,145 |
| 90. | Maryland City | 7.3% | 4.8%(+2.50)#90 | 4.9%(+2.40)#6,188 |
| 91. | Forestville | 7.3% | 4.8%(+2.50)#91 | 4.9%(+2.40)#6,200 |
| 92. | Rosaryville | 7.2% | 4.8%(+2.40)#92 | 4.9%(+2.30)#6,314 |
| 93. | Perryville | 7.2% | 4.8%(+2.40)#93 | 4.9%(+2.30)#6,332 |
| 94. | Ridgely | 7.2% | 4.8%(+2.40)#94 | 4.9%(+2.30)#6,356 |
| 95. | Owings Mills | 7.1% | 4.8%(+2.30)#95 | 4.9%(+2.20)#6,394 |
| 96. | Suitland | 7.1% | 4.8%(+2.30)#96 | 4.9%(+2.20)#6,398 |
| 97. | Capitol Heights | 7.1% | 4.8%(+2.30)#97 | 4.9%(+2.20)#6,428 |
| 98. | Andrews Afb | 7.1% | 4.8%(+2.30)#98 | 4.9%(+2.20)#6,431 |
| 99. | Fairmount | 7.1% | 4.8%(+2.30)#99 | 4.9%(+2.20)#6,490 |
| 100. | Rossville | 7.0% | 4.8%(+2.20)#100 | 4.9%(+2.10)#6,539 |
Common Questions
What are the Top 10 Cities with the Highest Unemployment Rate Among Females in Maryland?
Top 10 Cities with the Highest Unemployment Rate Among Females in Maryland are:
#1
70.0%
#2
48.3%
#3
39.4%
#4
38.0%
#5
36.4%
#6
33.3%
#7
32.8%
#8
26.9%
#9
23.4%
#10
23.3%
What city has the Highest Unemployment Rate Among Females in Maryland?
San Mar has the Highest Unemployment Rate Among Females in Maryland with 70.0%.
What is the Unemployment Rate Among Females in the State of Maryland?
Unemployment Rate Among Females in Maryland is 4.8%.
What is the Unemployment Rate Among Females in the United States?
Unemployment Rate Among Females in the United States is 4.9%.