Girdletree, MD Map & Demographics
Girdletree Map
Girdletree Overview
$61,684
PER CAPITA INCOME
0.31
INEQUALITY / GINI INDEX
122
TOTAL POPULATION
47
MALE POPULATION
75
FEMALE POPULATION
62.67
MALES / 100 FEMALES
159.57
FEMALES / 100 MALES
57.4
MEDIAN AGE
2.9
AVG FAMILY SIZE
1.8
AVG HOUSEHOLD SIZE
67
LABOR FORCE [ PEOPLE ]
54.9%
PERCENT IN LABOR FORCE
Girdletree Zip Codes
Girdletree Area Codes
Income in Girdletree
Income Overview in Girdletree
| Characteristic | Number | Measure |
| Per Capita Income | 122 | $61,684 |
| Median Family Income | 28 | $0 |
| Mean Family Income | 28 | $97,650 |
| Median Household Income | 69 | $0 |
| Mean Household Income | 69 | $106,930 |
| Income Deficit | 28 | $0 |
| Wage / Income Gap (%) | 122 | 0.00% |
| Wage / Income Gap ($) | 122 | 100.00¢ per $1 |
| Gini / Inequality Index | 122 | 0.31 |
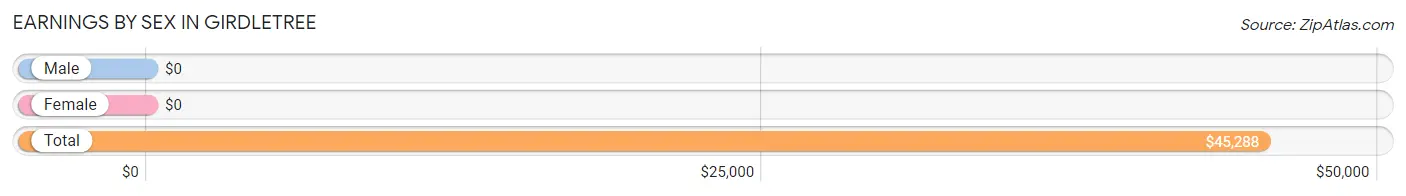
Earnings by Sex in Girdletree
| Sex | Number | Average Earnings |
| Male | 47 (70.2%) | $0 |
| Female | 20 (29.8%) | $0 |
| Total | 67 (100.0%) | $45,288 |
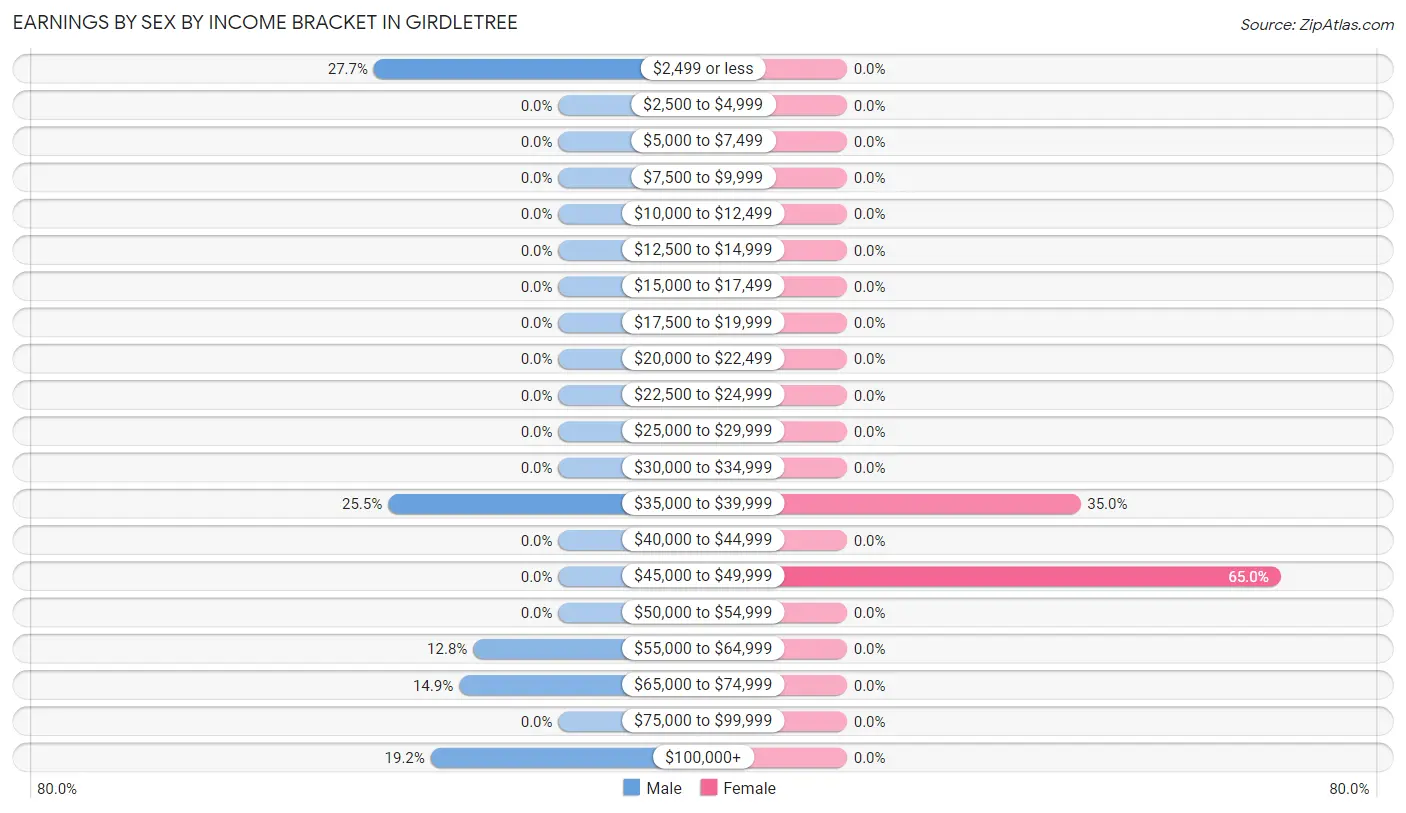
Earnings by Sex by Income Bracket in Girdletree
The most common earnings brackets in Girdletree are $2,499 or less for men (13 | 27.7%) and $45,000 to $49,999 for women (13 | 65.0%).
| Income | Male | Female |
| $2,499 or less | 13 (27.7%) | 0 (0.0%) |
| $2,500 to $4,999 | 0 (0.0%) | 0 (0.0%) |
| $5,000 to $7,499 | 0 (0.0%) | 0 (0.0%) |
| $7,500 to $9,999 | 0 (0.0%) | 0 (0.0%) |
| $10,000 to $12,499 | 0 (0.0%) | 0 (0.0%) |
| $12,500 to $14,999 | 0 (0.0%) | 0 (0.0%) |
| $15,000 to $17,499 | 0 (0.0%) | 0 (0.0%) |
| $17,500 to $19,999 | 0 (0.0%) | 0 (0.0%) |
| $20,000 to $22,499 | 0 (0.0%) | 0 (0.0%) |
| $22,500 to $24,999 | 0 (0.0%) | 0 (0.0%) |
| $25,000 to $29,999 | 0 (0.0%) | 0 (0.0%) |
| $30,000 to $34,999 | 0 (0.0%) | 0 (0.0%) |
| $35,000 to $39,999 | 12 (25.5%) | 7 (35.0%) |
| $40,000 to $44,999 | 0 (0.0%) | 0 (0.0%) |
| $45,000 to $49,999 | 0 (0.0%) | 13 (65.0%) |
| $50,000 to $54,999 | 0 (0.0%) | 0 (0.0%) |
| $55,000 to $64,999 | 6 (12.8%) | 0 (0.0%) |
| $65,000 to $74,999 | 7 (14.9%) | 0 (0.0%) |
| $75,000 to $99,999 | 0 (0.0%) | 0 (0.0%) |
| $100,000+ | 9 (19.2%) | 0 (0.0%) |
| Total | 47 (100.0%) | 20 (100.0%) |
Earnings by Sex by Educational Attainment in Girdletree
| Educational Attainment | Male Income | Female Income |
| Less than High School | - | - |
| High School Diploma | - | - |
| College or Associate's Degree | - | - |
| Bachelor's Degree | - | - |
| Graduate Degree | - | - |
| Total | - | - |
Family Income in Girdletree
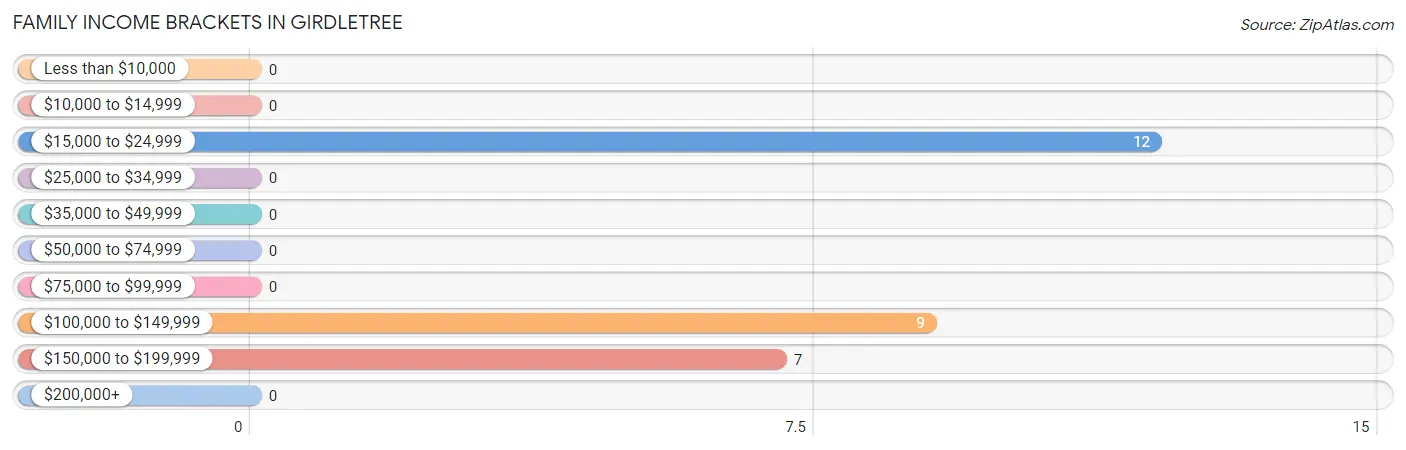
Family Income Brackets in Girdletree
According to the Girdletree family income data, there are 12 families falling into the $15,000 to $24,999 income range, which is the most common income bracket and makes up 42.9% of all families.
| Income Bracket | # Families | % Families |
| Less than $10,000 | 0 | 0.0% |
| $10,000 to $14,999 | 0 | 0.0% |
| $15,000 to $24,999 | 12 | 42.9% |
| $25,000 to $34,999 | 0 | 0.0% |
| $35,000 to $49,999 | 0 | 0.0% |
| $50,000 to $74,999 | 0 | 0.0% |
| $75,000 to $99,999 | 0 | 0.0% |
| $100,000 to $149,999 | 9 | 32.1% |
| $150,000 to $199,999 | 7 | 25.0% |
| $200,000+ | 0 | 0.0% |
Family Income by Famaliy Size in Girdletree
| Income Bracket | # Families | Median Income |
| 2-Person Families | 9 (32.1%) | $0 |
| 3-Person Families | 19 (67.9%) | $0 |
| 4-Person Families | 0 (0.0%) | $0 |
| 5-Person Families | 0 (0.0%) | $0 |
| 6-Person Families | 0 (0.0%) | $0 |
| 7+ Person Families | 0 (0.0%) | $0 |
| Total | 28 (100.0%) | $0 |
Family Income by Number of Earners in Girdletree
| Number of Earners | # Families | Median Income |
| No Earners | 0 (0.0%) | $0 |
| 1 Earner | 12 (42.9%) | $0 |
| 2 Earners | 9 (32.1%) | $0 |
| 3+ Earners | 7 (25.0%) | $0 |
| Total | 28 (100.0%) | $0 |
Household Income in Girdletree
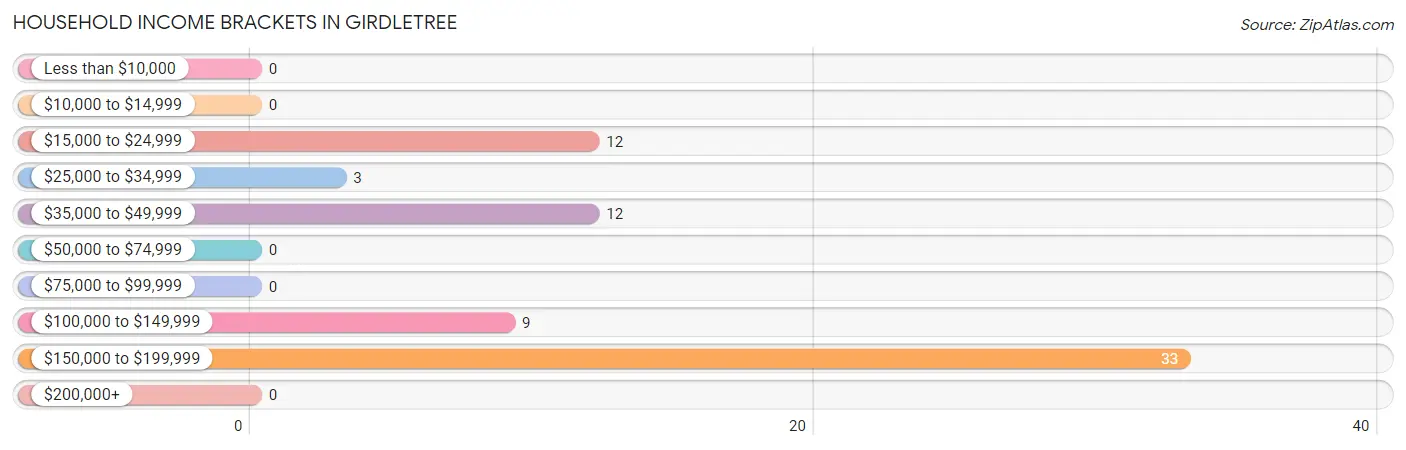
Household Income Brackets in Girdletree
With 33 households falling in the category, the $150,000 to $199,999 income range is the most frequent in Girdletree, accounting for 47.8% of all households.
| Income Bracket | # Households | % Households |
| Less than $10,000 | 0 | 0.0% |
| $10,000 to $14,999 | 0 | 0.0% |
| $15,000 to $24,999 | 12 | 17.4% |
| $25,000 to $34,999 | 3 | 4.3% |
| $35,000 to $49,999 | 12 | 17.4% |
| $50,000 to $74,999 | 0 | 0.0% |
| $75,000 to $99,999 | 0 | 0.0% |
| $100,000 to $149,999 | 9 | 13.0% |
| $150,000 to $199,999 | 33 | 47.8% |
| $200,000+ | 0 | 0.0% |
Household Income by Householder Age in Girdletree
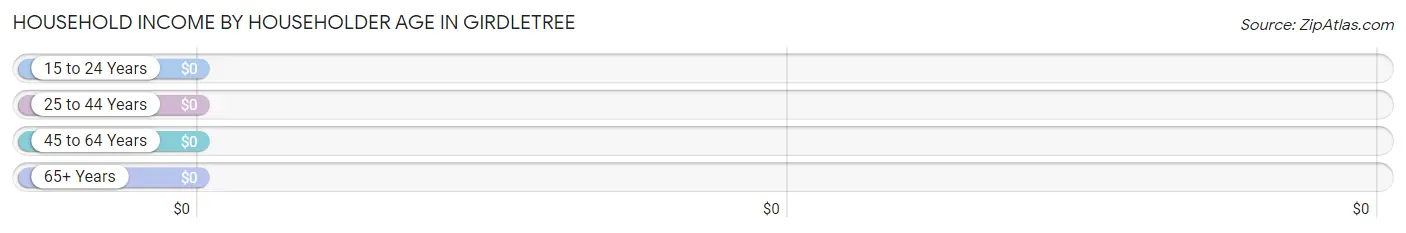
| Income Bracket | # Households | Median Income |
| 15 to 24 Years | 0 (0.0%) | $0 |
| 25 to 44 Years | 9 (13.0%) | $0 |
| 45 to 64 Years | 19 (27.5%) | $0 |
| 65+ Years | 41 (59.4%) | $0 |
| Total | 69 (100.0%) | $0 |
Poverty in Girdletree
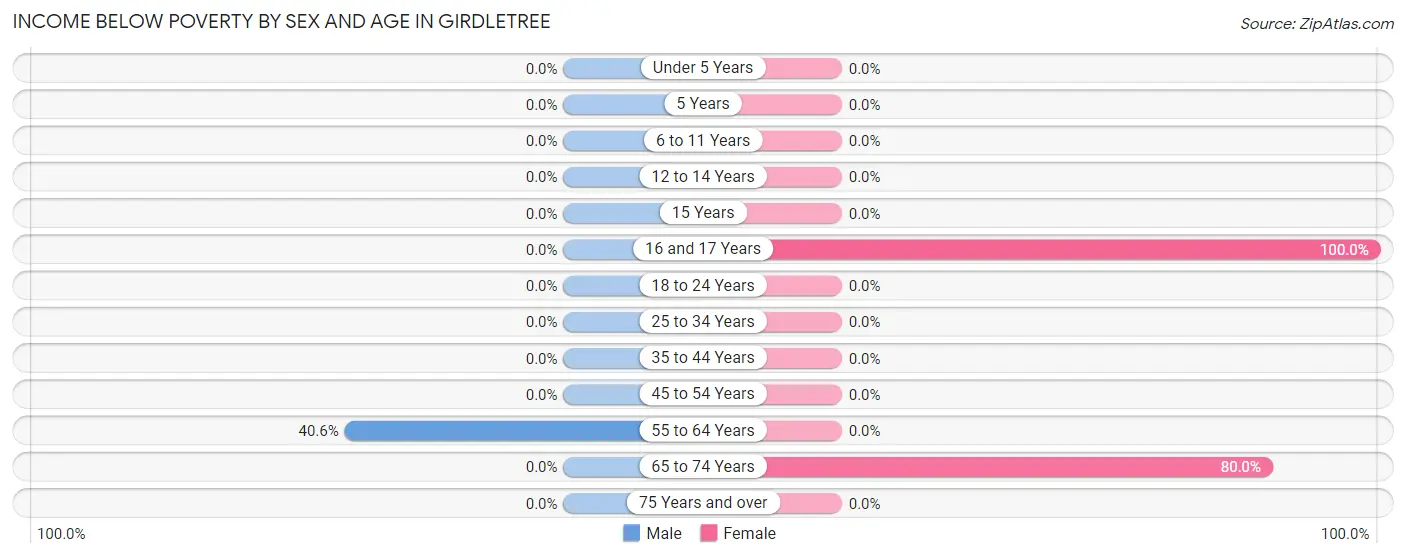
Income Below Poverty by Sex and Age in Girdletree
With 27.7% poverty level for males and 34.7% for females among the residents of Girdletree, 55 to 64 year old males and 16 and 17 year old females are the most vulnerable to poverty, with 13 males (40.6%) and 14 females (100.0%) in their respective age groups living below the poverty level.
| Age Bracket | Male | Female |
| Under 5 Years | 0 (0.0%) | 0 (0.0%) |
| 5 Years | 0 (0.0%) | 0 (0.0%) |
| 6 to 11 Years | 0 (0.0%) | 0 (0.0%) |
| 12 to 14 Years | 0 (0.0%) | 0 (0.0%) |
| 15 Years | 0 (0.0%) | 0 (0.0%) |
| 16 and 17 Years | 0 (0.0%) | 14 (100.0%) |
| 18 to 24 Years | 0 (0.0%) | 0 (0.0%) |
| 25 to 34 Years | 0 (0.0%) | 0 (0.0%) |
| 35 to 44 Years | 0 (0.0%) | 0 (0.0%) |
| 45 to 54 Years | 0 (0.0%) | 0 (0.0%) |
| 55 to 64 Years | 13 (40.6%) | 0 (0.0%) |
| 65 to 74 Years | 0 (0.0%) | 12 (80.0%) |
| 75 Years and over | 0 (0.0%) | 0 (0.0%) |
| Total | 13 (27.7%) | 26 (34.7%) |
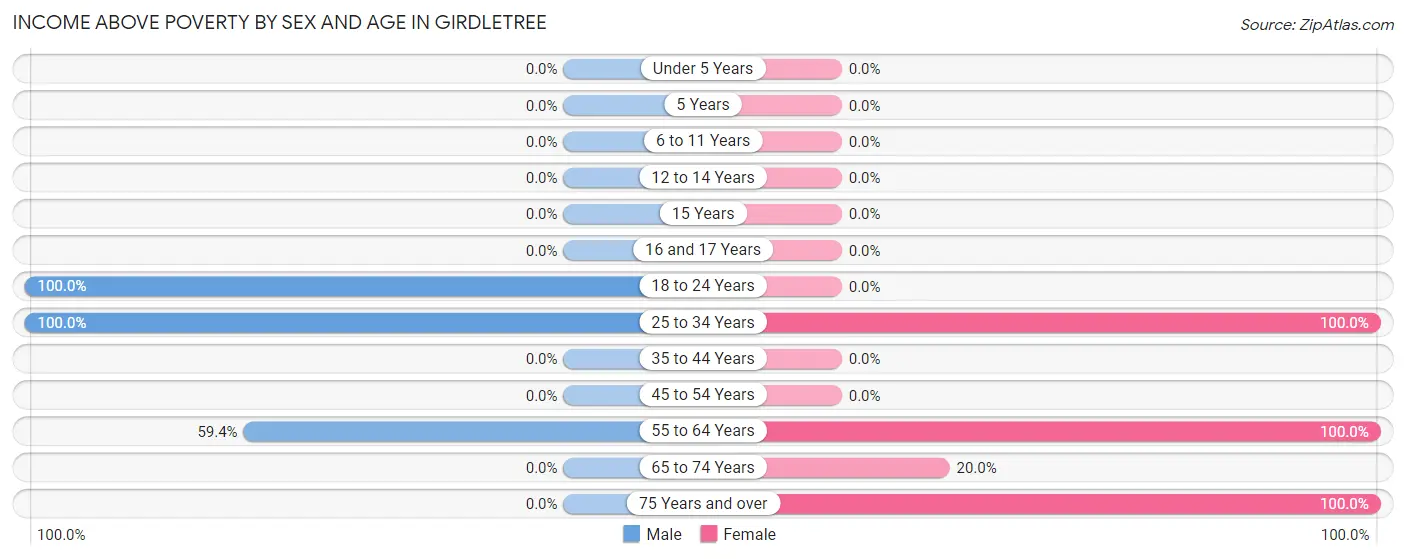
Income Above Poverty by Sex and Age in Girdletree
According to the poverty statistics in Girdletree, males aged 18 to 24 years and females aged 25 to 34 years are the age groups that are most secure financially, with 100.0% of males and 100.0% of females in these age groups living above the poverty line.
| Age Bracket | Male | Female |
| Under 5 Years | 0 (0.0%) | 0 (0.0%) |
| 5 Years | 0 (0.0%) | 0 (0.0%) |
| 6 to 11 Years | 0 (0.0%) | 0 (0.0%) |
| 12 to 14 Years | 0 (0.0%) | 0 (0.0%) |
| 15 Years | 0 (0.0%) | 0 (0.0%) |
| 16 and 17 Years | 0 (0.0%) | 0 (0.0%) |
| 18 to 24 Years | 6 (100.0%) | 0 (0.0%) |
| 25 to 34 Years | 9 (100.0%) | 13 (100.0%) |
| 35 to 44 Years | 0 (0.0%) | 0 (0.0%) |
| 45 to 54 Years | 0 (0.0%) | 0 (0.0%) |
| 55 to 64 Years | 19 (59.4%) | 7 (100.0%) |
| 65 to 74 Years | 0 (0.0%) | 3 (20.0%) |
| 75 Years and over | 0 (0.0%) | 26 (100.0%) |
| Total | 34 (72.3%) | 49 (65.3%) |
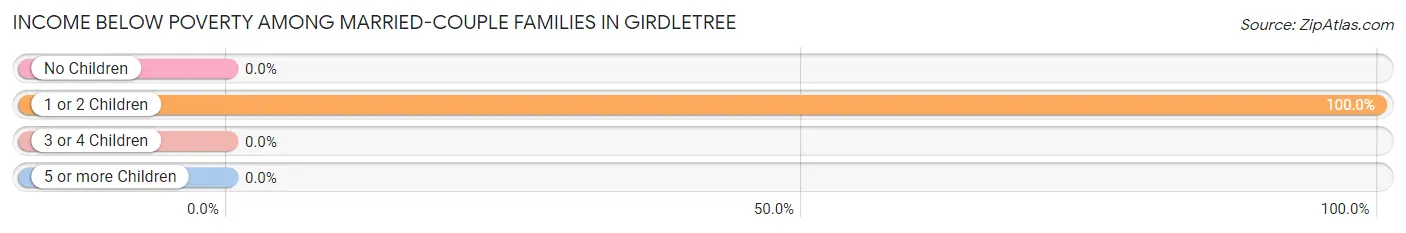
Income Below Poverty Among Married-Couple Families in Girdletree
The poverty statistics for married-couple families in Girdletree show that 42.9% or 12 of the total 28 families live below the poverty line. Families with 1 or 2 children have the highest poverty rate of 100.0%, comprising of 12 families. On the other hand, families with no children have the lowest poverty rate of 0.0%, which includes 0 families.
| Children | Above Poverty | Below Poverty |
| No Children | 16 (100.0%) | 0 (0.0%) |
| 1 or 2 Children | 0 (0.0%) | 12 (100.0%) |
| 3 or 4 Children | 0 (0.0%) | 0 (0.0%) |
| 5 or more Children | 0 (0.0%) | 0 (0.0%) |
| Total | 16 (57.1%) | 12 (42.9%) |
Income Below Poverty Among Single-Parent Households in Girdletree
| Children | Single Father | Single Mother |
| No Children | 0 (0.0%) | 0 (0.0%) |
| 1 or 2 Children | 0 (0.0%) | 0 (0.0%) |
| 3 or 4 Children | 0 (0.0%) | 0 (0.0%) |
| 5 or more Children | 0 (0.0%) | 0 (0.0%) |
| Total | 0 (0.0%) | 0 (0.0%) |
Income Below Poverty Among Married-Couple vs Single-Parent Households in Girdletree
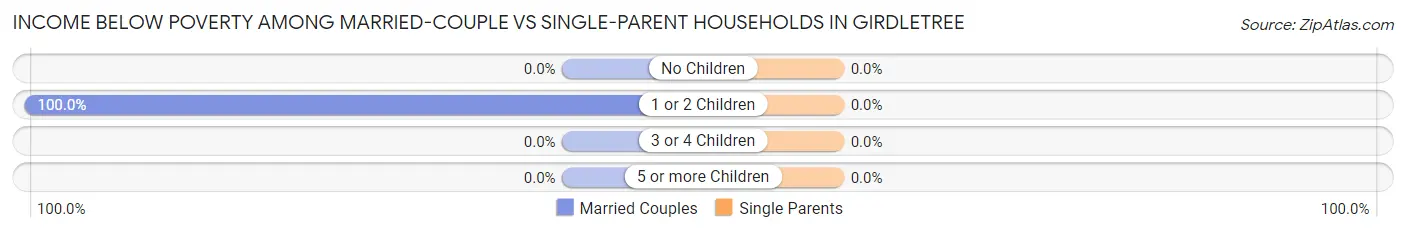
| Children | Married-Couple Families | Single-Parent Households |
| No Children | 0 (0.0%) | 0 (0.0%) |
| 1 or 2 Children | 12 (100.0%) | 0 (0.0%) |
| 3 or 4 Children | 0 (0.0%) | 0 (0.0%) |
| 5 or more Children | 0 (0.0%) | 0 (0.0%) |
| Total | 12 (42.9%) | 0 (0.0%) |
Race in Girdletree
The most populous races in Girdletree are White / Caucasian (109 | 89.3%), and Asian (13 | 10.7%).
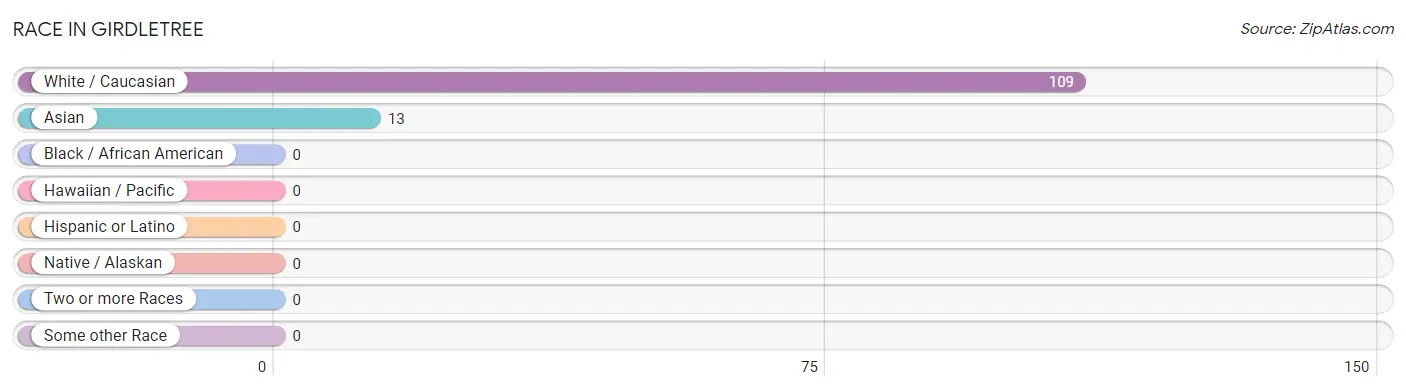
| Race | # Population | % Population |
| Asian | 13 | 10.7% |
| Black / African American | 0 | 0.0% |
| Hawaiian / Pacific | 0 | 0.0% |
| Hispanic or Latino | 0 | 0.0% |
| Native / Alaskan | 0 | 0.0% |
| White / Caucasian | 109 | 89.3% |
| Two or more Races | 0 | 0.0% |
| Some other Race | 0 | 0.0% |
| Total | 122 | 100.0% |
Ancestry in Girdletree
The most populous ancestries reported in Girdletree are American (57 | 46.7%), English (33 | 27.1%), Scotch-Irish (26 | 21.3%), Sri Lankan (13 | 10.7%), and German (10 | 8.2%), together accounting for 113.9% of all Girdletree residents.
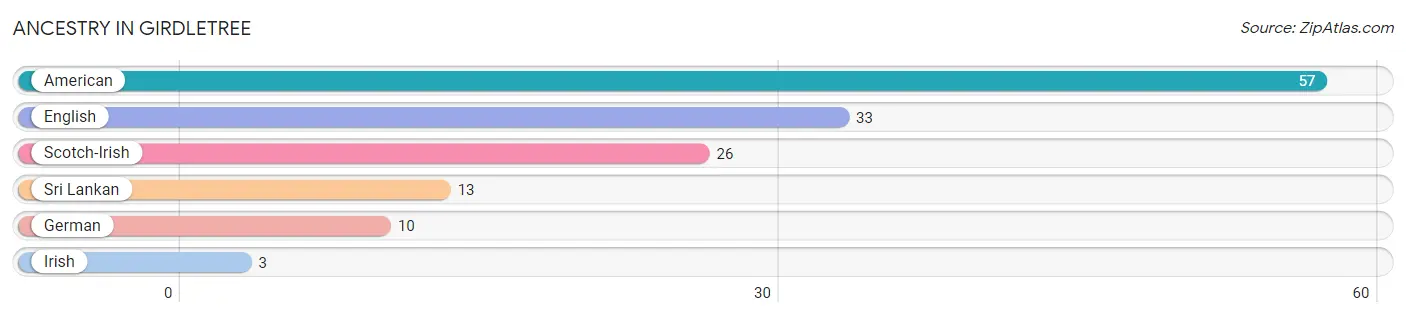
| Ancestry | # Population | % Population |
| American | 57 | 46.7% |
| English | 33 | 27.1% |
| German | 10 | 8.2% |
| Irish | 3 | 2.5% |
| Scotch-Irish | 26 | 21.3% |
| Sri Lankan | 13 | 10.7% | View All 6 Rows |
Immigrants in Girdletree

| Immigration Origin | # Population | % Population | View All 0 Rows |
Sex and Age in Girdletree
Sex and Age in Girdletree
The most populous age groups in Girdletree are 55 to 59 Years (32 | 68.1%) for men and 80 to 84 Years (26 | 34.7%) for women.
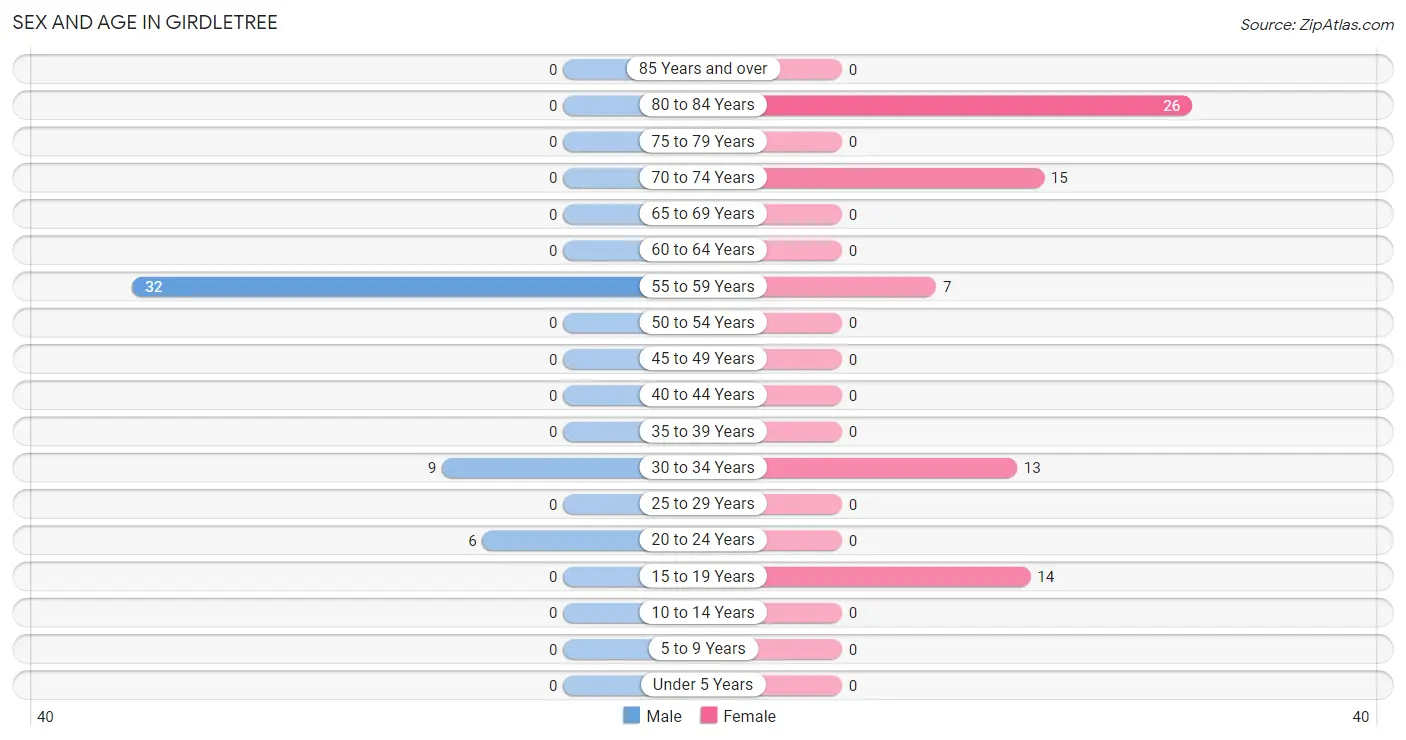
| Age Bracket | Male | Female |
| Under 5 Years | 0 (0.0%) | 0 (0.0%) |
| 5 to 9 Years | 0 (0.0%) | 0 (0.0%) |
| 10 to 14 Years | 0 (0.0%) | 0 (0.0%) |
| 15 to 19 Years | 0 (0.0%) | 14 (18.7%) |
| 20 to 24 Years | 6 (12.8%) | 0 (0.0%) |
| 25 to 29 Years | 0 (0.0%) | 0 (0.0%) |
| 30 to 34 Years | 9 (19.2%) | 13 (17.3%) |
| 35 to 39 Years | 0 (0.0%) | 0 (0.0%) |
| 40 to 44 Years | 0 (0.0%) | 0 (0.0%) |
| 45 to 49 Years | 0 (0.0%) | 0 (0.0%) |
| 50 to 54 Years | 0 (0.0%) | 0 (0.0%) |
| 55 to 59 Years | 32 (68.1%) | 7 (9.3%) |
| 60 to 64 Years | 0 (0.0%) | 0 (0.0%) |
| 65 to 69 Years | 0 (0.0%) | 0 (0.0%) |
| 70 to 74 Years | 0 (0.0%) | 15 (20.0%) |
| 75 to 79 Years | 0 (0.0%) | 0 (0.0%) |
| 80 to 84 Years | 0 (0.0%) | 26 (34.7%) |
| 85 Years and over | 0 (0.0%) | 0 (0.0%) |
| Total | 47 (100.0%) | 75 (100.0%) |
Families and Households in Girdletree
Median Family Size in Girdletree
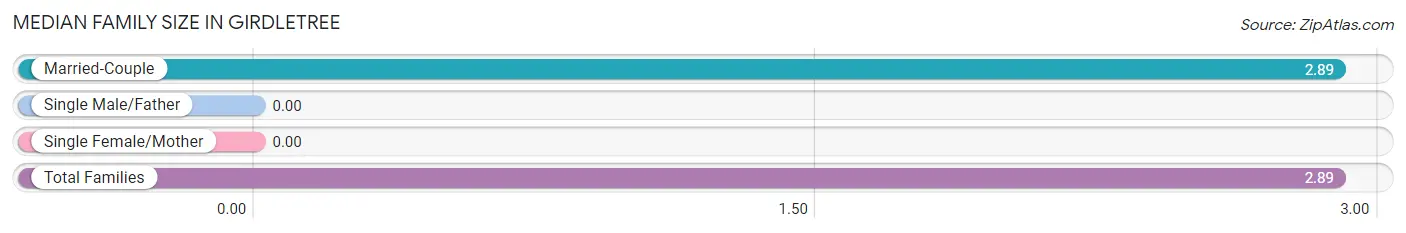
| Family Type | # Families | Family Size |
| Married-Couple | 28 (100.0%) | 2.89 |
| Single Male/Father | 0 (0.0%) | - |
| Single Female/Mother | 0 (0.0%) | - |
| Total Families | 28 (100.0%) | 2.89 |
Median Household Size in Girdletree
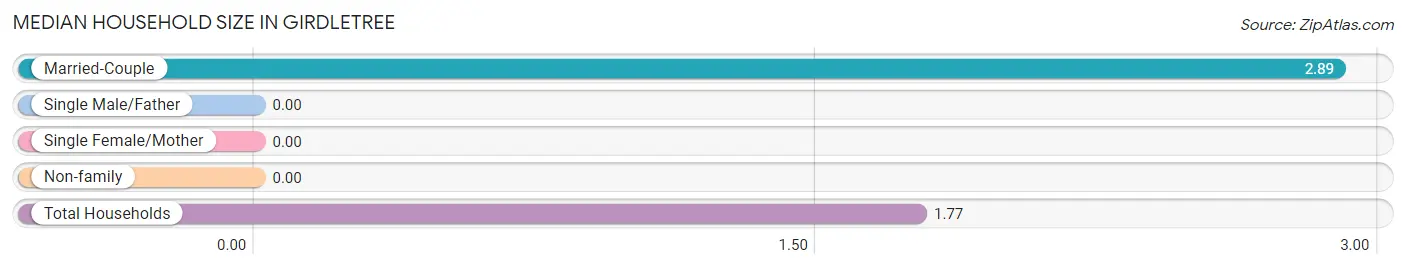
| Household Type | # Households | Household Size |
| Married-Couple | 28 (40.6%) | 2.89 |
| Single Male/Father | 0 (0.0%) | - |
| Single Female/Mother | 0 (0.0%) | - |
| Non-family | 41 (59.4%) | - |
| Total Households | 69 (100.0%) | 1.77 |
Household Size by Marriage Status in Girdletree
Out of a total of 69 households in Girdletree, 28 (40.6%) are family households, while 41 (59.4%) are nonfamily households. The most numerous type of family households are 3-person households, comprising 19, and the most common type of nonfamily households are 1-person households, comprising 41.
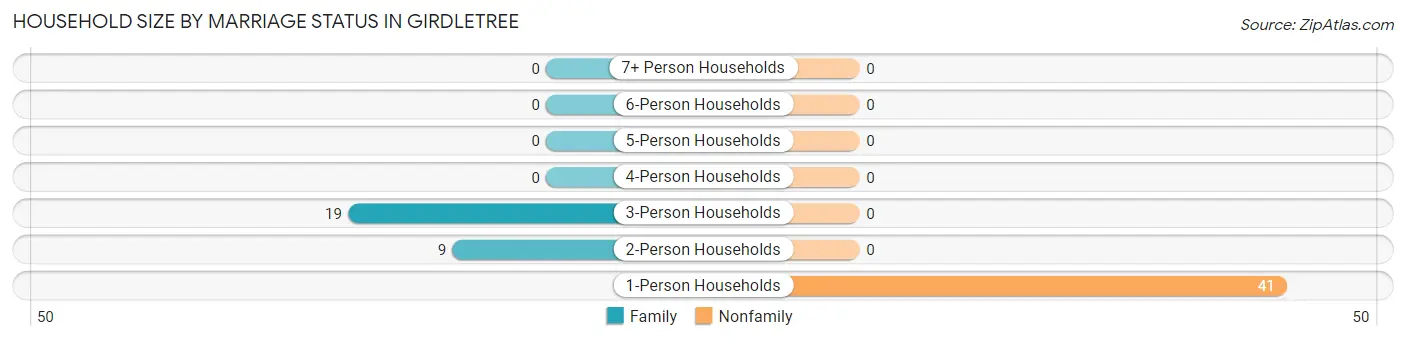
| Household Size | Family Households | Nonfamily Households |
| 1-Person Households | - | 41 (59.4%) |
| 2-Person Households | 9 (13.0%) | 0 (0.0%) |
| 3-Person Households | 19 (27.5%) | 0 (0.0%) |
| 4-Person Households | 0 (0.0%) | 0 (0.0%) |
| 5-Person Households | 0 (0.0%) | 0 (0.0%) |
| 6-Person Households | 0 (0.0%) | 0 (0.0%) |
| 7+ Person Households | 0 (0.0%) | 0 (0.0%) |
| Total | 28 (40.6%) | 41 (59.4%) |
Female Fertility in Girdletree
Fertility by Age in Girdletree
| Age Bracket | Women with Births | Births / 1,000 Women |
| 15 to 19 years | 0 (0.0%) | 0.0 |
| 20 to 34 years | 0 (0.0%) | 0.0 |
| 35 to 50 years | 0 (0.0%) | 0.0 |
| Total | 0 (0.0%) | 0.0 |
Fertility by Age by Marriage Status in Girdletree
| Age Bracket | Married | Unmarried |
| 15 to 19 years | 0 (0.0%) | 0 (0.0%) |
| 20 to 34 years | 0 (0.0%) | 0 (0.0%) |
| 35 to 50 years | 0 (0.0%) | 0 (0.0%) |
| Total | 0 (0.0%) | 0 (0.0%) |
Fertility by Education in Girdletree
| Educational Attainment | Women with Births | Births / 1,000 Women |
| Less than High School | 0 (0.0%) | 0.0 |
| High School Diploma | 0 (0.0%) | 0.0 |
| College or Associate's Degree | 0 (0.0%) | 0.0 |
| Bachelor's Degree | 0 (0.0%) | 0.0 |
| Graduate Degree | 0 (0.0%) | 0.0 |
| Total | 0 (0.0%) | 0.0 |
Fertility by Education by Marriage Status in Girdletree
| Educational Attainment | Married | Unmarried |
| Less than High School | 0 (0.0%) | 0 (0.0%) |
| High School Diploma | 0 (0.0%) | 0 (0.0%) |
| College or Associate's Degree | 0 (0.0%) | 0 (0.0%) |
| Bachelor's Degree | 0 (0.0%) | 0 (0.0%) |
| Graduate Degree | 0 (0.0%) | 0 (0.0%) |
| Total | 0 (0.0%) | 0 (0.0%) |
Employment Characteristics in Girdletree
Employment by Class of Employer in Girdletree
Among the 54 employed individuals in Girdletree, private company employees (25 | 46.3%), not-for-profit organizations (13 | 24.1%), and local government employees (9 | 16.7%) make up the most common classes of employment.
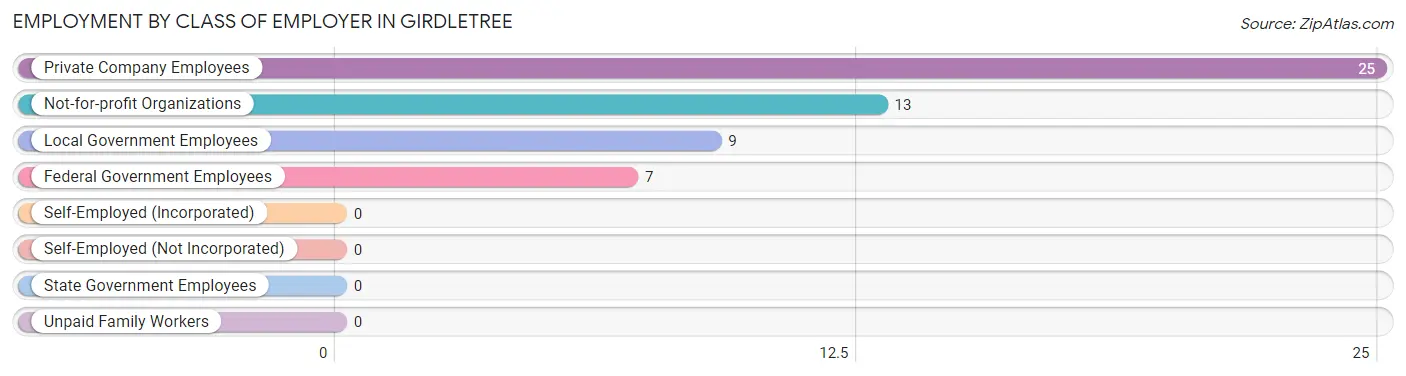
| Employer Class | # Employees | % Employees |
| Private Company Employees | 25 | 46.3% |
| Self-Employed (Incorporated) | 0 | 0.0% |
| Self-Employed (Not Incorporated) | 0 | 0.0% |
| Not-for-profit Organizations | 13 | 24.1% |
| Local Government Employees | 9 | 16.7% |
| State Government Employees | 0 | 0.0% |
| Federal Government Employees | 7 | 13.0% |
| Unpaid Family Workers | 0 | 0.0% |
| Total | 54 | 100.0% |
Employment Status by Age in Girdletree
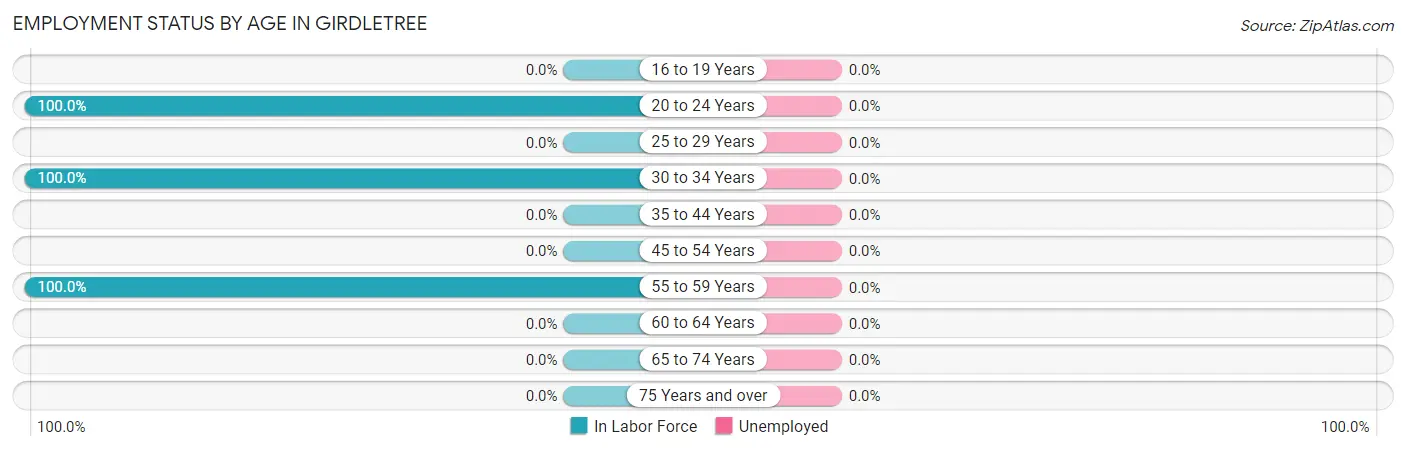
| Age Bracket | In Labor Force | Unemployed |
| 16 to 19 Years | 0 (0.0%) | 0 (0.0%) |
| 20 to 24 Years | 6 (100.0%) | 0 (0.0%) |
| 25 to 29 Years | 0 (0.0%) | 0 (0.0%) |
| 30 to 34 Years | 22 (100.0%) | 0 (0.0%) |
| 35 to 44 Years | 0 (0.0%) | 0 (0.0%) |
| 45 to 54 Years | 0 (0.0%) | 0 (0.0%) |
| 55 to 59 Years | 39 (100.0%) | 0 (0.0%) |
| 60 to 64 Years | 0 (0.0%) | 0 (0.0%) |
| 65 to 74 Years | 0 (0.0%) | 0 (0.0%) |
| 75 Years and over | 0 (0.0%) | 0 (0.0%) |
| Total | 67 (54.9%) | 0 (0.0%) |
Employment Status by Educational Attainment in Girdletree
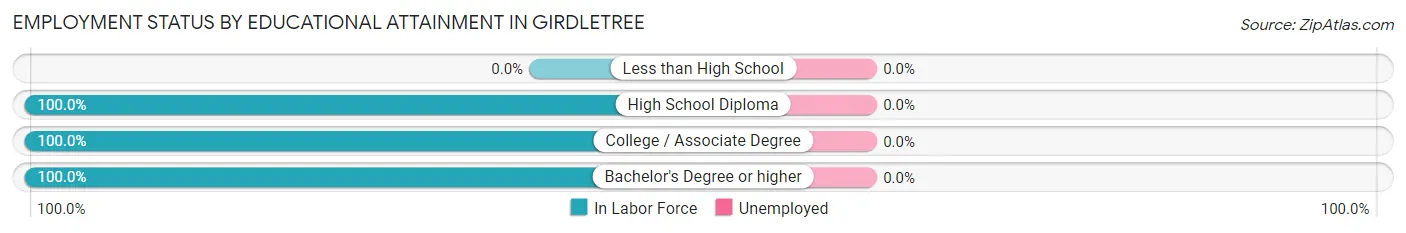
| Educational Attainment | In Labor Force | Unemployed |
| Less than High School | 0 (0.0%) | 0 (0.0%) |
| High School Diploma | 25 (100.0%) | 0 (0.0%) |
| College / Associate Degree | 29 (100.0%) | 0 (0.0%) |
| Bachelor's Degree or higher | 7 (100.0%) | 0 (0.0%) |
| Total | 61 (100.0%) | 0 (0.0%) |
Employment Occupations by Sex in Girdletree
Management, Business, Science and Arts Occupations
The most common Management, Business, Science and Arts occupations in Girdletree are Management (13 | 19.4%), Computers, Engineering & Science (6 | 9.0%), and Architecture & Engineering (6 | 9.0%).
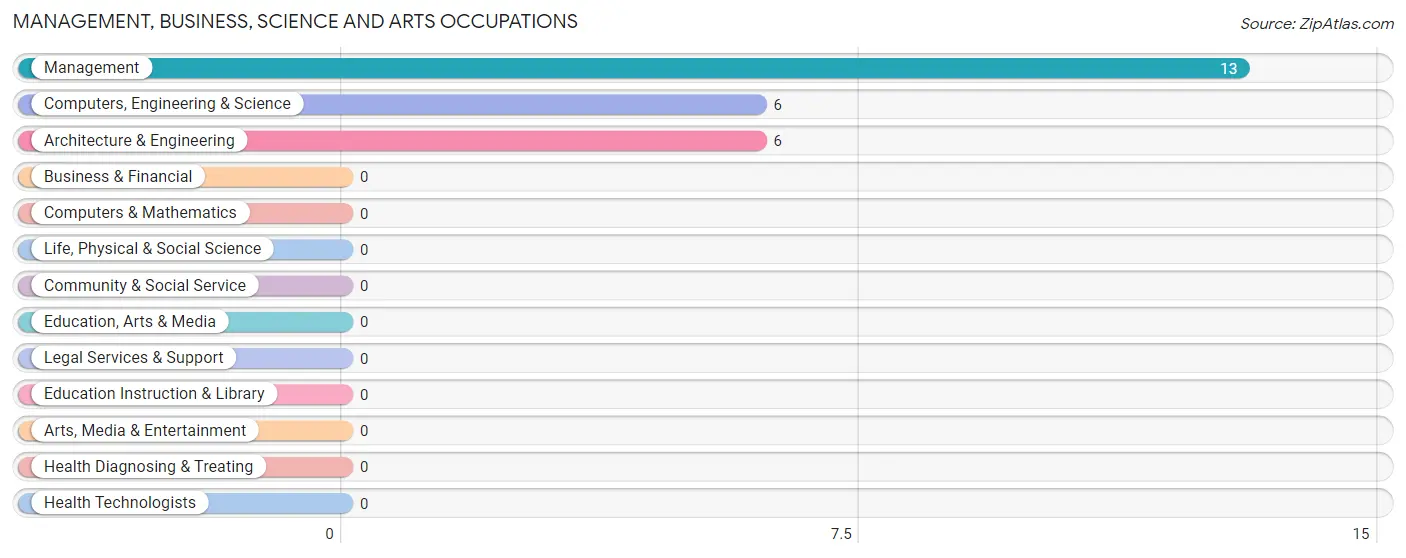
Management, Business, Science and Arts Occupations by Sex
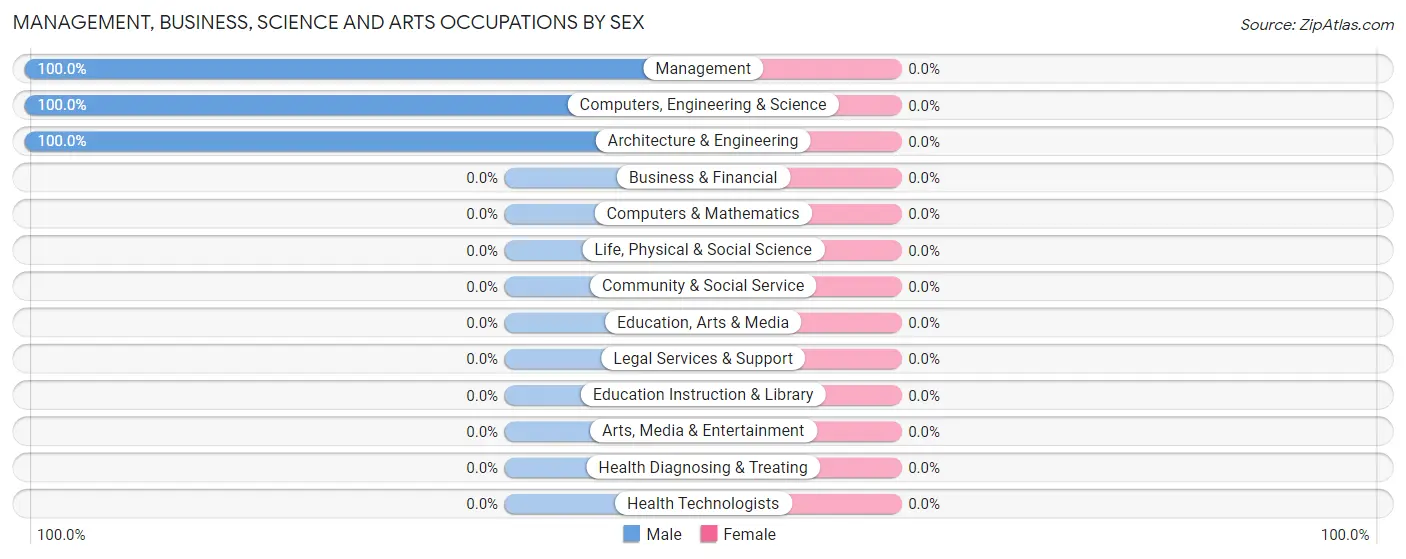
| Occupation | Male | Female |
| Management | 13 (100.0%) | 0 (0.0%) |
| Business & Financial | 0 (0.0%) | 0 (0.0%) |
| Computers, Engineering & Science | 6 (100.0%) | 0 (0.0%) |
| Computers & Mathematics | 0 (0.0%) | 0 (0.0%) |
| Architecture & Engineering | 6 (100.0%) | 0 (0.0%) |
| Life, Physical & Social Science | 0 (0.0%) | 0 (0.0%) |
| Community & Social Service | 0 (0.0%) | 0 (0.0%) |
| Education, Arts & Media | 0 (0.0%) | 0 (0.0%) |
| Legal Services & Support | 0 (0.0%) | 0 (0.0%) |
| Education Instruction & Library | 0 (0.0%) | 0 (0.0%) |
| Arts, Media & Entertainment | 0 (0.0%) | 0 (0.0%) |
| Health Diagnosing & Treating | 0 (0.0%) | 0 (0.0%) |
| Health Technologists | 0 (0.0%) | 0 (0.0%) |
| Total (Category) | 19 (100.0%) | 0 (0.0%) |
| Total (Overall) | 47 (70.2%) | 20 (29.8%) |
Services Occupations
The most common Services occupations in Girdletree are Security & Protection (9 | 13.4%), and Firefighting & Prevention (9 | 13.4%).
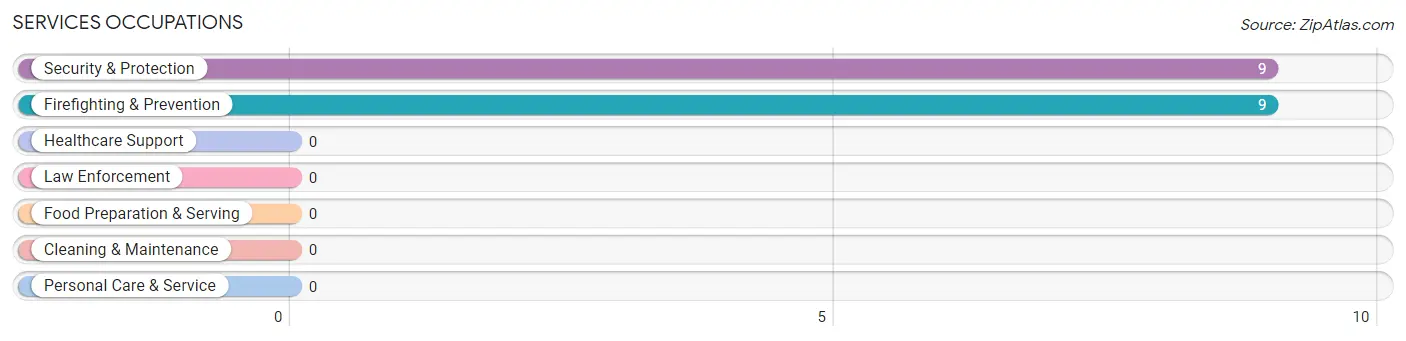
Services Occupations by Sex
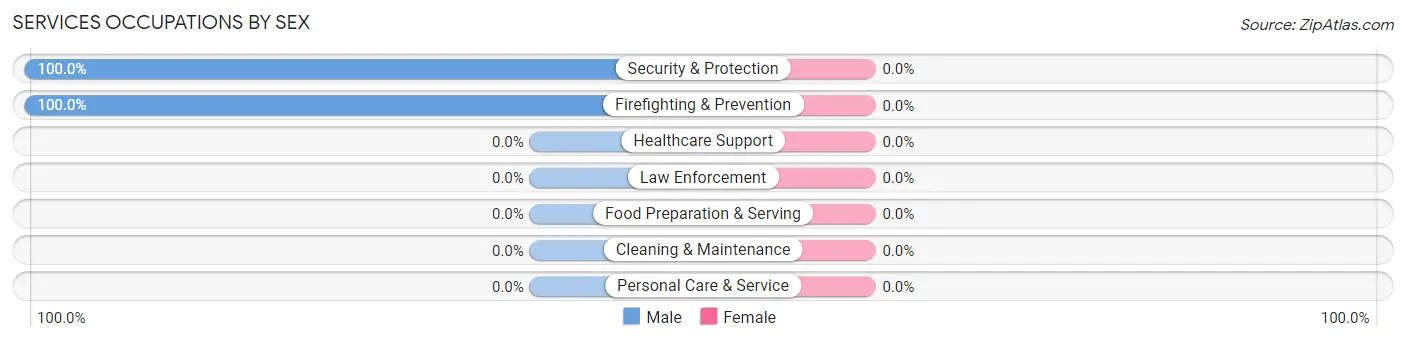
| Occupation | Male | Female |
| Healthcare Support | 0 (0.0%) | 0 (0.0%) |
| Security & Protection | 9 (100.0%) | 0 (0.0%) |
| Firefighting & Prevention | 9 (100.0%) | 0 (0.0%) |
| Law Enforcement | 0 (0.0%) | 0 (0.0%) |
| Food Preparation & Serving | 0 (0.0%) | 0 (0.0%) |
| Cleaning & Maintenance | 0 (0.0%) | 0 (0.0%) |
| Personal Care & Service | 0 (0.0%) | 0 (0.0%) |
| Total (Category) | 9 (100.0%) | 0 (0.0%) |
| Total (Overall) | 47 (70.2%) | 20 (29.8%) |
Sales and Office Occupations
The most common Sales and Office occupations in Girdletree are Office & Administration (20 | 29.8%), and Sales & Related (7 | 10.4%).
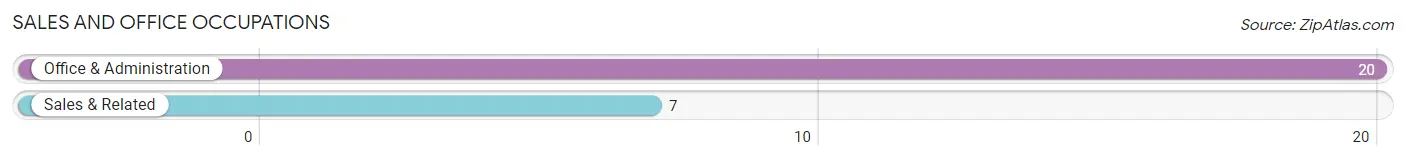
Sales and Office Occupations by Sex
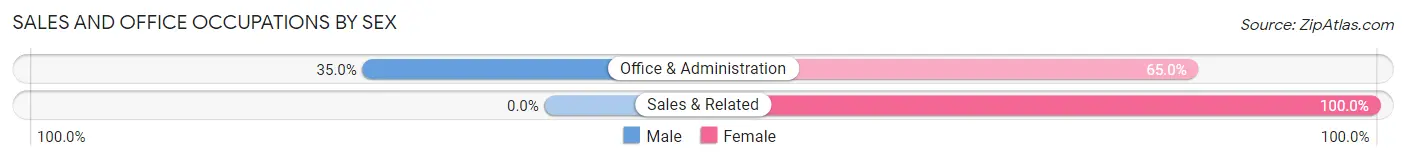
| Occupation | Male | Female |
| Sales & Related | 0 (0.0%) | 7 (100.0%) |
| Office & Administration | 7 (35.0%) | 13 (65.0%) |
| Total (Category) | 7 (25.9%) | 20 (74.1%) |
| Total (Overall) | 47 (70.2%) | 20 (29.8%) |
Natural Resources, Construction and Maintenance Occupations
The most common Natural Resources, Construction and Maintenance occupations in Girdletree are , and Installation, Maintenance & Repair (12 | 17.9%).
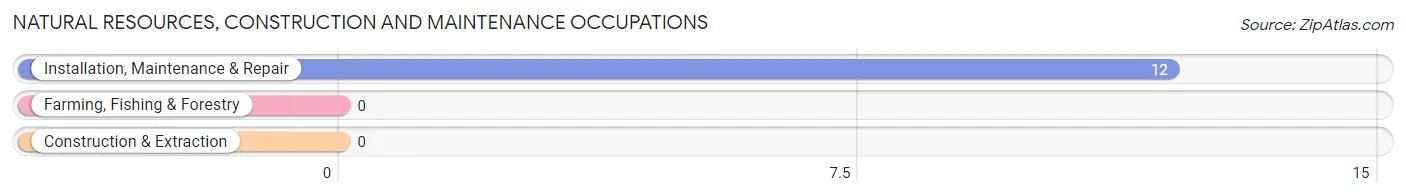
Natural Resources, Construction and Maintenance Occupations by Sex
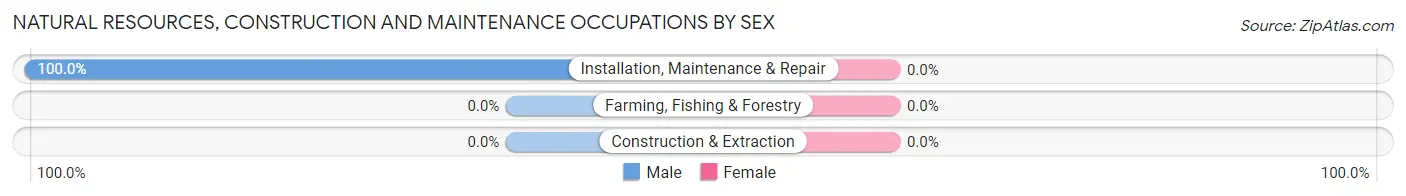
| Occupation | Male | Female |
| Farming, Fishing & Forestry | 0 (0.0%) | 0 (0.0%) |
| Construction & Extraction | 0 (0.0%) | 0 (0.0%) |
| Installation, Maintenance & Repair | 12 (100.0%) | 0 (0.0%) |
| Total (Category) | 12 (100.0%) | 0 (0.0%) |
| Total (Overall) | 47 (70.2%) | 20 (29.8%) |
Production, Transportation and Moving Occupations
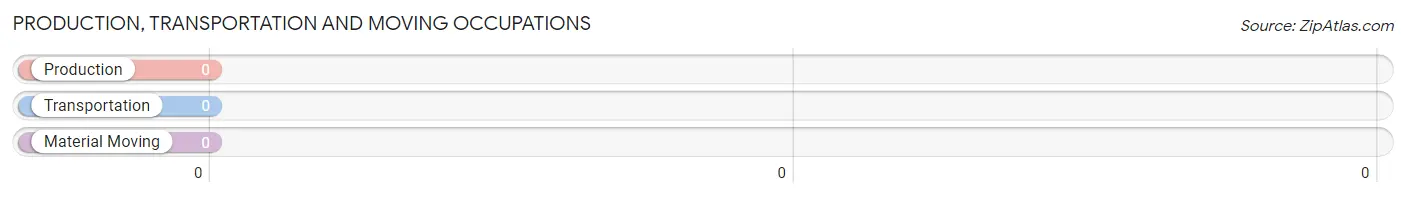
Production, Transportation and Moving Occupations by Sex
| Occupation | Male | Female |
| Production | 0 (0.0%) | 0 (0.0%) |
| Transportation | 0 (0.0%) | 0 (0.0%) |
| Material Moving | 0 (0.0%) | 0 (0.0%) |
| Total (Category) | 0 (0.0%) | 0 (0.0%) |
| Total (Overall) | 47 (70.2%) | 20 (29.8%) |
Employment Industries by Sex in Girdletree
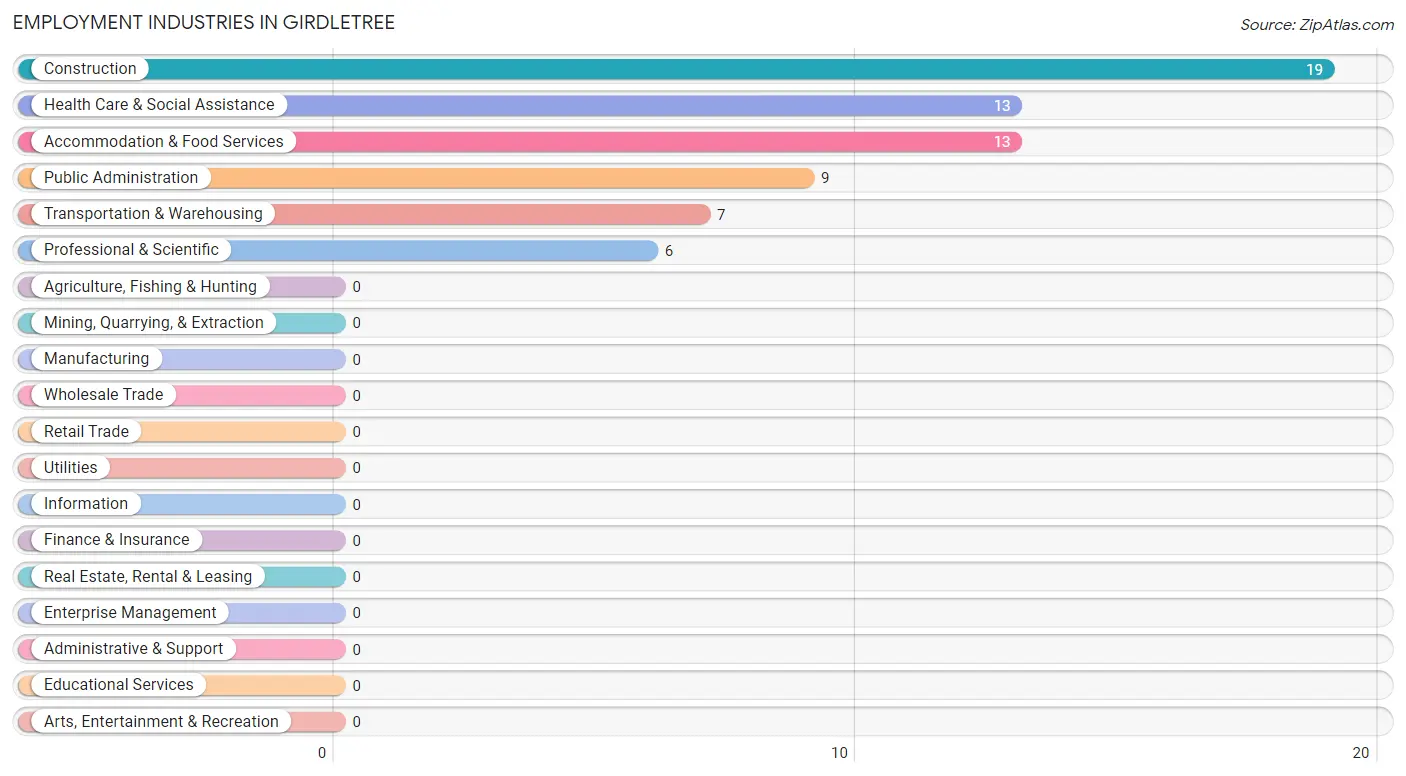
Employment Industries in Girdletree
The major employment industries in Girdletree include Construction (19 | 28.4%), Health Care & Social Assistance (13 | 19.4%), Accommodation & Food Services (13 | 19.4%), Public Administration (9 | 13.4%), and Transportation & Warehousing (7 | 10.4%).
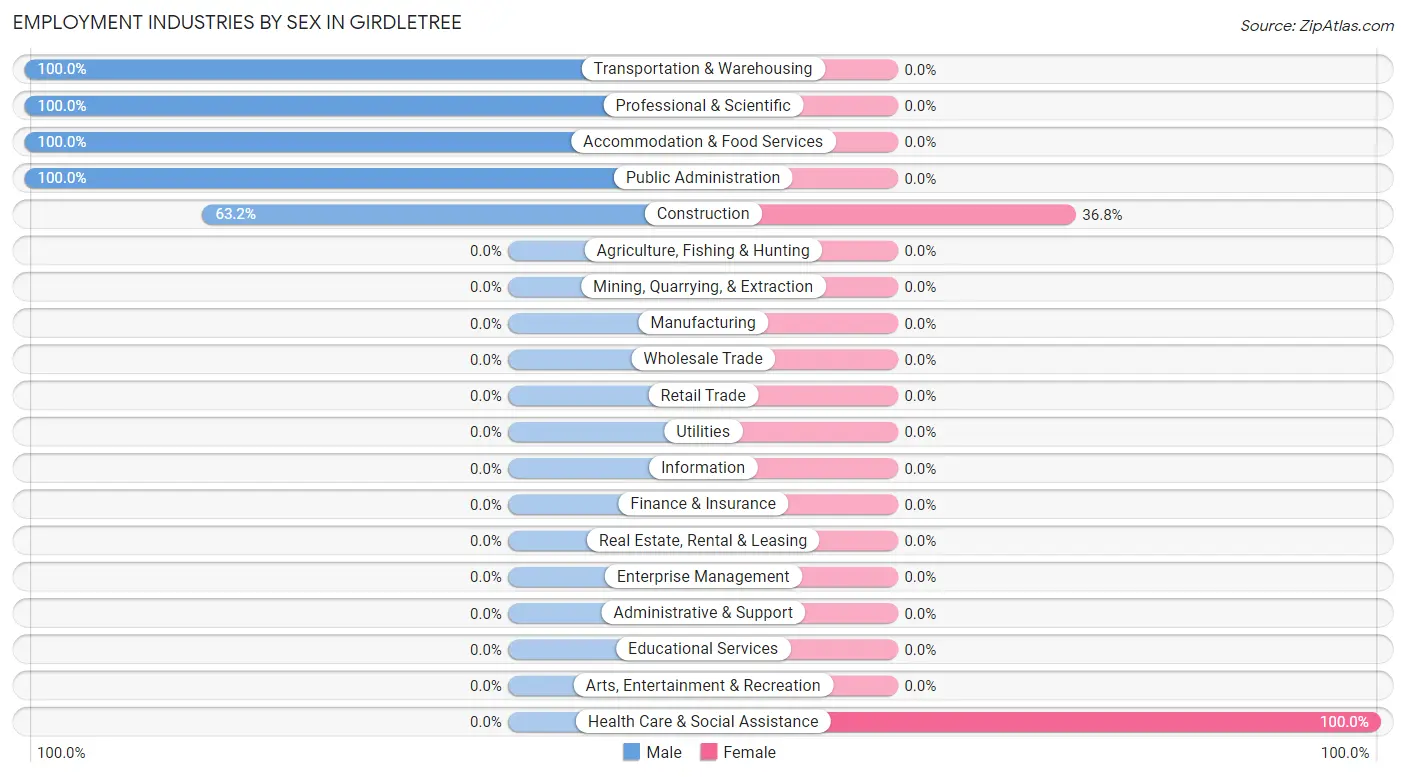
Employment Industries by Sex in Girdletree
The Girdletree industries that see more men than women are Transportation & Warehousing (100.0%), Professional & Scientific (100.0%), and Accommodation & Food Services (100.0%), whereas the industries that tend to have a higher number of women are Health Care & Social Assistance (100.0%), and Construction (36.8%).
| Industry | Male | Female |
| Agriculture, Fishing & Hunting | 0 (0.0%) | 0 (0.0%) |
| Mining, Quarrying, & Extraction | 0 (0.0%) | 0 (0.0%) |
| Construction | 12 (63.2%) | 7 (36.8%) |
| Manufacturing | 0 (0.0%) | 0 (0.0%) |
| Wholesale Trade | 0 (0.0%) | 0 (0.0%) |
| Retail Trade | 0 (0.0%) | 0 (0.0%) |
| Transportation & Warehousing | 7 (100.0%) | 0 (0.0%) |
| Utilities | 0 (0.0%) | 0 (0.0%) |
| Information | 0 (0.0%) | 0 (0.0%) |
| Finance & Insurance | 0 (0.0%) | 0 (0.0%) |
| Real Estate, Rental & Leasing | 0 (0.0%) | 0 (0.0%) |
| Professional & Scientific | 6 (100.0%) | 0 (0.0%) |
| Enterprise Management | 0 (0.0%) | 0 (0.0%) |
| Administrative & Support | 0 (0.0%) | 0 (0.0%) |
| Educational Services | 0 (0.0%) | 0 (0.0%) |
| Health Care & Social Assistance | 0 (0.0%) | 13 (100.0%) |
| Arts, Entertainment & Recreation | 0 (0.0%) | 0 (0.0%) |
| Accommodation & Food Services | 13 (100.0%) | 0 (0.0%) |
| Public Administration | 9 (100.0%) | 0 (0.0%) |
| Total | 47 (70.2%) | 20 (29.8%) |
Education in Girdletree
School Enrollment in Girdletree
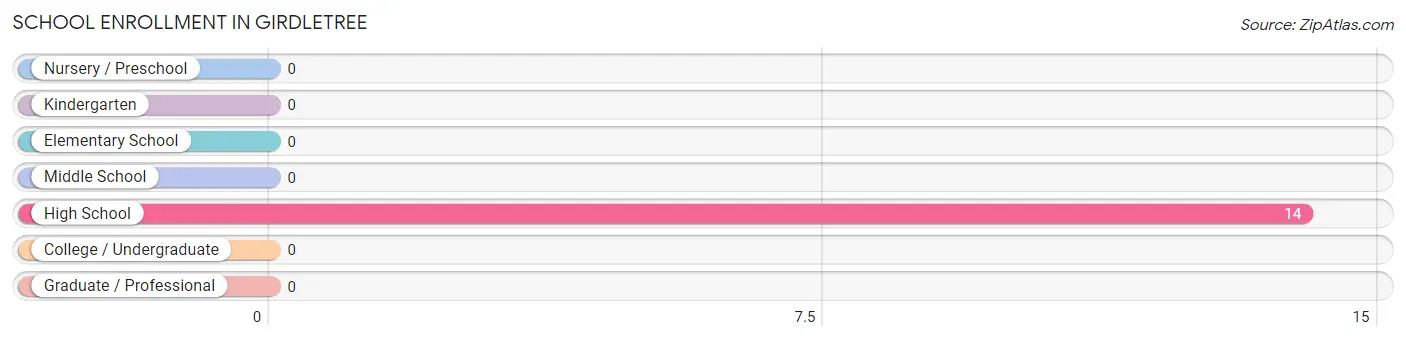
| School Level | # Students | % Students |
| Nursery / Preschool | 0 | 0.0% |
| Kindergarten | 0 | 0.0% |
| Elementary School | 0 | 0.0% |
| Middle School | 0 | 0.0% |
| High School | 14 | 100.0% |
| College / Undergraduate | 0 | 0.0% |
| Graduate / Professional | 0 | 0.0% |
| Total | 14 | 100.0% |
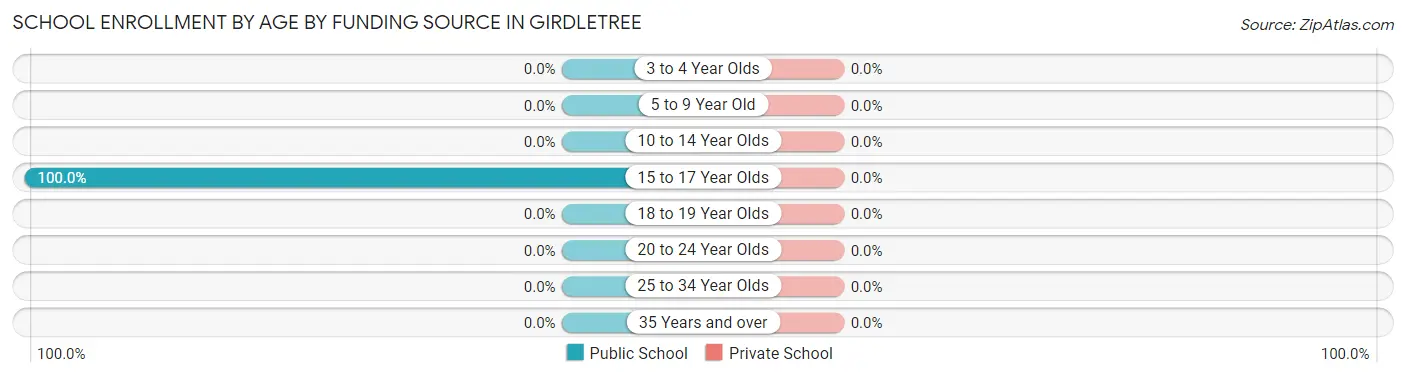
School Enrollment by Age by Funding Source in Girdletree
| Age Bracket | Public School | Private School |
| 3 to 4 Year Olds | 0 (0.0%) | 0 (0.0%) |
| 5 to 9 Year Old | 0 (0.0%) | 0 (0.0%) |
| 10 to 14 Year Olds | 0 (0.0%) | 0 (0.0%) |
| 15 to 17 Year Olds | 14 (100.0%) | 0 (0.0%) |
| 18 to 19 Year Olds | 0 (0.0%) | 0 (0.0%) |
| 20 to 24 Year Olds | 0 (0.0%) | 0 (0.0%) |
| 25 to 34 Year Olds | 0 (0.0%) | 0 (0.0%) |
| 35 Years and over | 0 (0.0%) | 0 (0.0%) |
| Total | 14 (100.0%) | 0 (0.0%) |
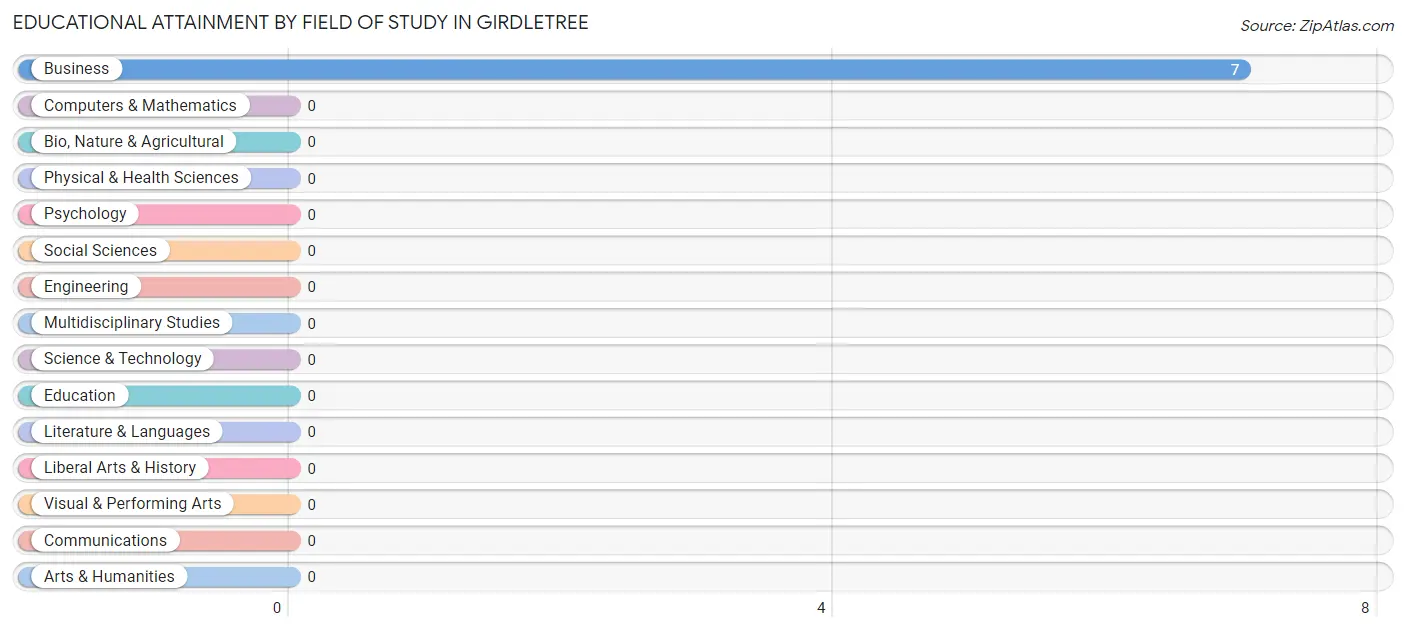
Educational Attainment by Field of Study in Girdletree
, and business (7 | 100.0%) are the most common fields of study among 7 individuals in Girdletree who have obtained a bachelor's degree or higher.
| Field of Study | # Graduates | % Graduates |
| Computers & Mathematics | 0 | 0.0% |
| Bio, Nature & Agricultural | 0 | 0.0% |
| Physical & Health Sciences | 0 | 0.0% |
| Psychology | 0 | 0.0% |
| Social Sciences | 0 | 0.0% |
| Engineering | 0 | 0.0% |
| Multidisciplinary Studies | 0 | 0.0% |
| Science & Technology | 0 | 0.0% |
| Business | 7 | 100.0% |
| Education | 0 | 0.0% |
| Literature & Languages | 0 | 0.0% |
| Liberal Arts & History | 0 | 0.0% |
| Visual & Performing Arts | 0 | 0.0% |
| Communications | 0 | 0.0% |
| Arts & Humanities | 0 | 0.0% |
| Total | 7 | 100.0% |
Transportation & Commute in Girdletree
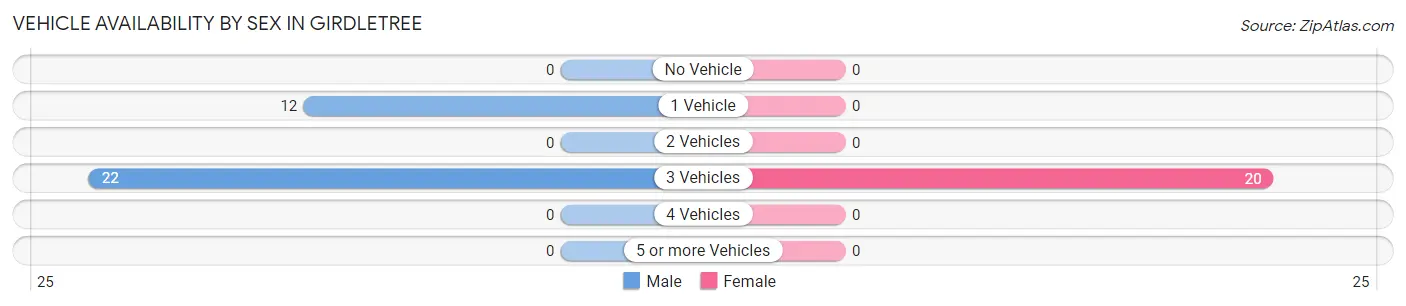
Vehicle Availability by Sex in Girdletree
The most prevalent vehicle ownership categories in Girdletree are males with 3 vehicles (22, accounting for 64.7%) and females with 3 vehicles (20, making up 110.0%).
| Vehicles Available | Male | Female |
| No Vehicle | 0 (0.0%) | 0 (0.0%) |
| 1 Vehicle | 12 (35.3%) | 0 (0.0%) |
| 2 Vehicles | 0 (0.0%) | 0 (0.0%) |
| 3 Vehicles | 22 (64.7%) | 20 (100.0%) |
| 4 Vehicles | 0 (0.0%) | 0 (0.0%) |
| 5 or more Vehicles | 0 (0.0%) | 0 (0.0%) |
| Total | 34 (100.0%) | 20 (100.0%) |
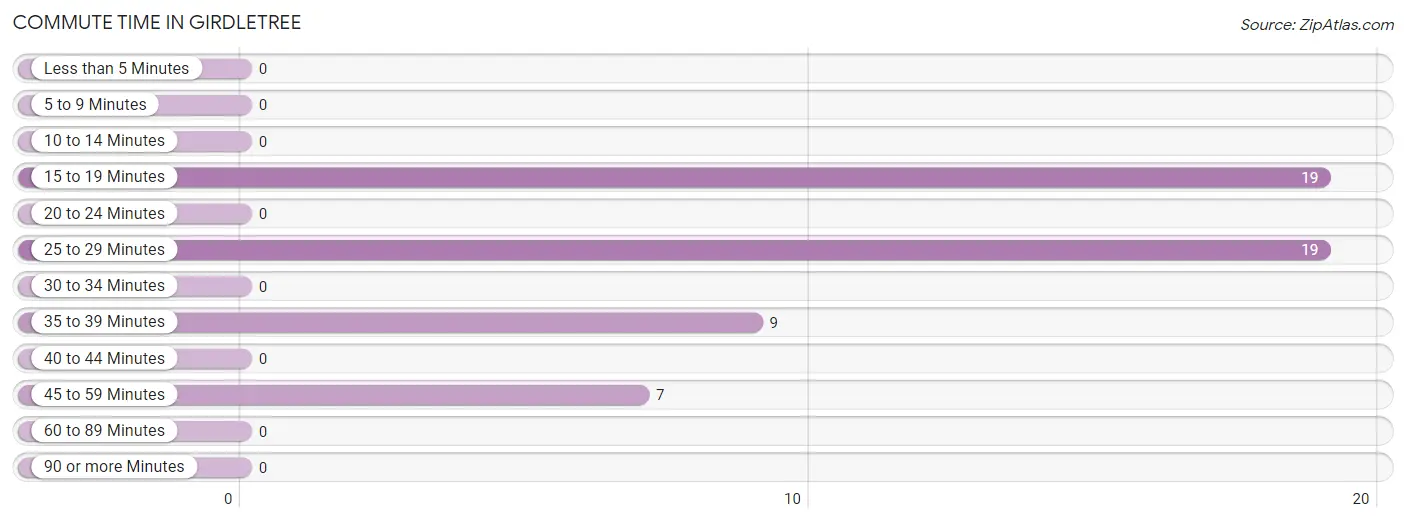
Commute Time in Girdletree
The most frequently occuring commute durations in Girdletree are 15 to 19 minutes (19 commuters, 35.2%), 25 to 29 minutes (19 commuters, 35.2%), and 35 to 39 minutes (9 commuters, 16.7%).
| Commute Time | # Commuters | % Commuters |
| Less than 5 Minutes | 0 | 0.0% |
| 5 to 9 Minutes | 0 | 0.0% |
| 10 to 14 Minutes | 0 | 0.0% |
| 15 to 19 Minutes | 19 | 35.2% |
| 20 to 24 Minutes | 0 | 0.0% |
| 25 to 29 Minutes | 19 | 35.2% |
| 30 to 34 Minutes | 0 | 0.0% |
| 35 to 39 Minutes | 9 | 16.7% |
| 40 to 44 Minutes | 0 | 0.0% |
| 45 to 59 Minutes | 7 | 13.0% |
| 60 to 89 Minutes | 0 | 0.0% |
| 90 or more Minutes | 0 | 0.0% |
Commute Time by Sex in Girdletree
The most common commute times in Girdletree are 15 to 19 minutes (19 commuters, 55.9%) for males and 25 to 29 minutes (13 commuters, 65.0%) for females.
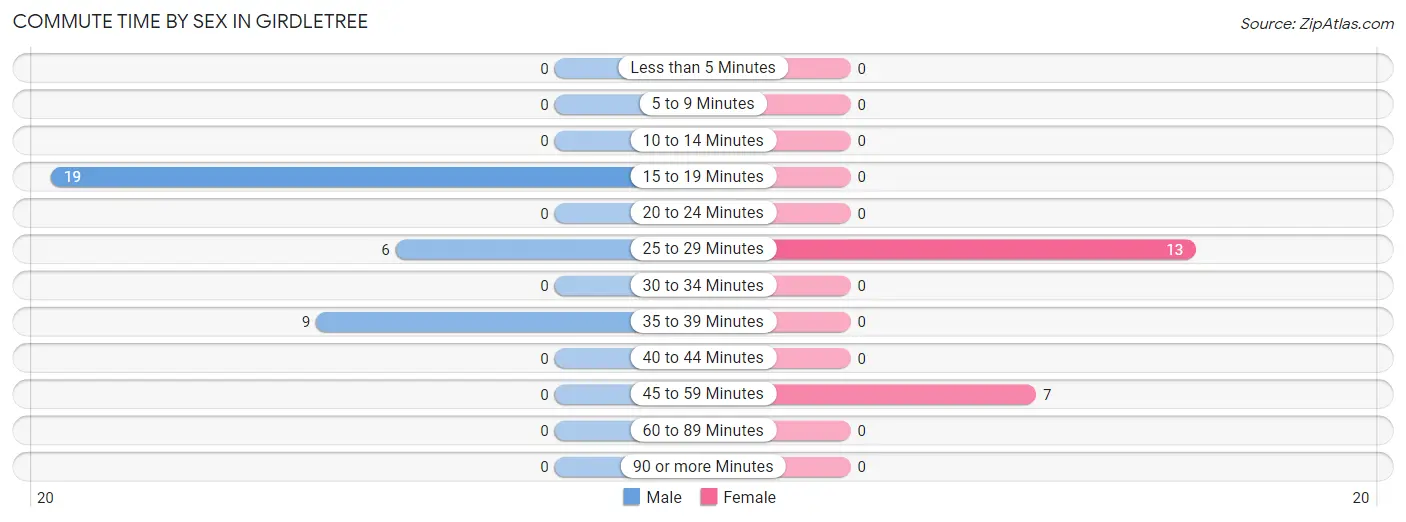
| Commute Time | Male | Female |
| Less than 5 Minutes | 0 (0.0%) | 0 (0.0%) |
| 5 to 9 Minutes | 0 (0.0%) | 0 (0.0%) |
| 10 to 14 Minutes | 0 (0.0%) | 0 (0.0%) |
| 15 to 19 Minutes | 19 (55.9%) | 0 (0.0%) |
| 20 to 24 Minutes | 0 (0.0%) | 0 (0.0%) |
| 25 to 29 Minutes | 6 (17.6%) | 13 (65.0%) |
| 30 to 34 Minutes | 0 (0.0%) | 0 (0.0%) |
| 35 to 39 Minutes | 9 (26.5%) | 0 (0.0%) |
| 40 to 44 Minutes | 0 (0.0%) | 0 (0.0%) |
| 45 to 59 Minutes | 0 (0.0%) | 7 (35.0%) |
| 60 to 89 Minutes | 0 (0.0%) | 0 (0.0%) |
| 90 or more Minutes | 0 (0.0%) | 0 (0.0%) |
Time of Departure to Work by Sex in Girdletree
The most frequent times of departure to work in Girdletree are 7:30 AM to 7:59 AM (19, 55.9%) for males and 7:30 AM to 7:59 AM (13, 65.0%) for females.
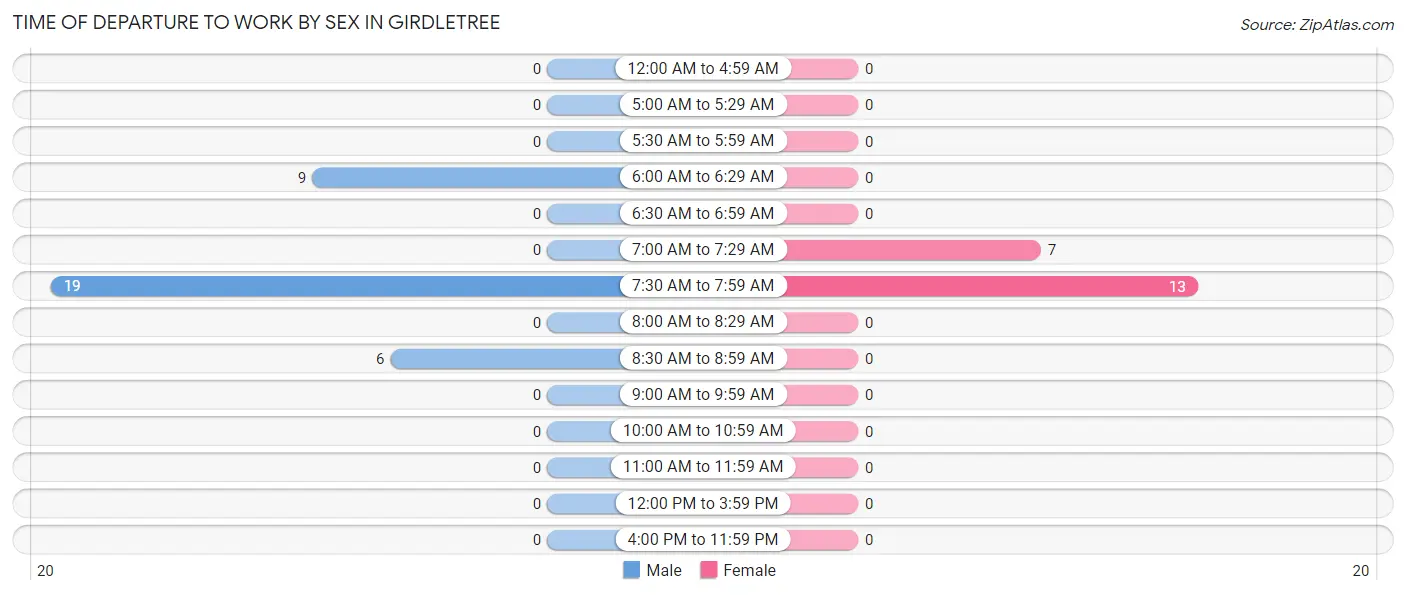
| Time of Departure | Male | Female |
| 12:00 AM to 4:59 AM | 0 (0.0%) | 0 (0.0%) |
| 5:00 AM to 5:29 AM | 0 (0.0%) | 0 (0.0%) |
| 5:30 AM to 5:59 AM | 0 (0.0%) | 0 (0.0%) |
| 6:00 AM to 6:29 AM | 9 (26.5%) | 0 (0.0%) |
| 6:30 AM to 6:59 AM | 0 (0.0%) | 0 (0.0%) |
| 7:00 AM to 7:29 AM | 0 (0.0%) | 7 (35.0%) |
| 7:30 AM to 7:59 AM | 19 (55.9%) | 13 (65.0%) |
| 8:00 AM to 8:29 AM | 0 (0.0%) | 0 (0.0%) |
| 8:30 AM to 8:59 AM | 6 (17.6%) | 0 (0.0%) |
| 9:00 AM to 9:59 AM | 0 (0.0%) | 0 (0.0%) |
| 10:00 AM to 10:59 AM | 0 (0.0%) | 0 (0.0%) |
| 11:00 AM to 11:59 AM | 0 (0.0%) | 0 (0.0%) |
| 12:00 PM to 3:59 PM | 0 (0.0%) | 0 (0.0%) |
| 4:00 PM to 11:59 PM | 0 (0.0%) | 0 (0.0%) |
| Total | 34 (100.0%) | 20 (100.0%) |
Housing Occupancy in Girdletree
Occupancy by Ownership in Girdletree
Of the total 69 dwellings in Girdletree, owner-occupied units account for 69 (100.0%), while renter-occupied units make up 0 (0.0%).
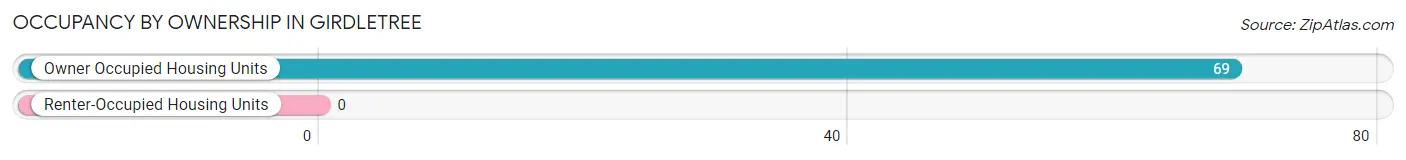
| Occupancy | # Housing Units | % Housing Units |
| Owner Occupied Housing Units | 69 | 100.0% |
| Renter-Occupied Housing Units | 0 | 0.0% |
| Total Occupied Housing Units | 69 | 100.0% |
Occupancy by Household Size in Girdletree
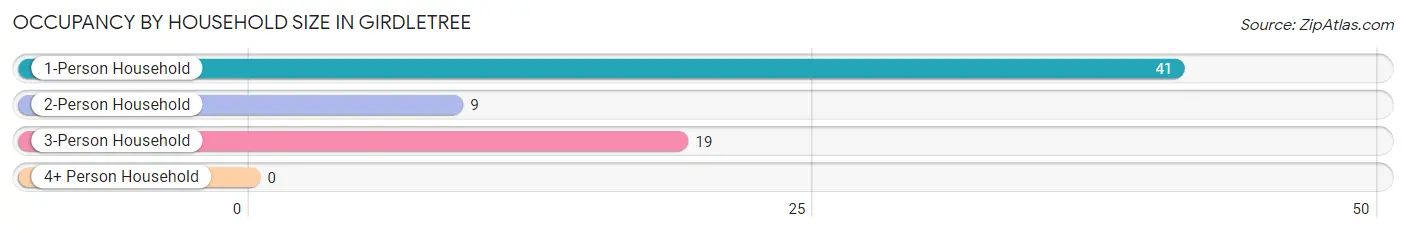
| Household Size | # Housing Units | % Housing Units |
| 1-Person Household | 41 | 59.4% |
| 2-Person Household | 9 | 13.0% |
| 3-Person Household | 19 | 27.5% |
| 4+ Person Household | 0 | 0.0% |
| Total Housing Units | 69 | 100.0% |
Occupancy by Ownership by Household Size in Girdletree
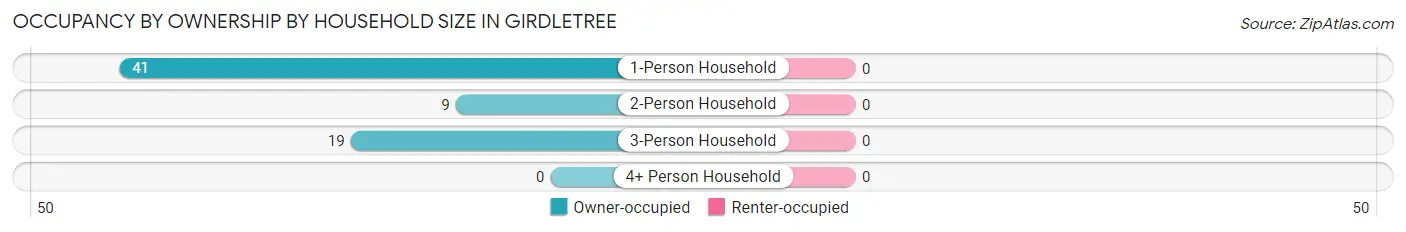
| Household Size | Owner-occupied | Renter-occupied |
| 1-Person Household | 41 (100.0%) | 0 (0.0%) |
| 2-Person Household | 9 (100.0%) | 0 (0.0%) |
| 3-Person Household | 19 (100.0%) | 0 (0.0%) |
| 4+ Person Household | 0 (0.0%) | 0 (0.0%) |
| Total Housing Units | 69 (100.0%) | 0 (0.0%) |
Occupancy by Educational Attainment in Girdletree
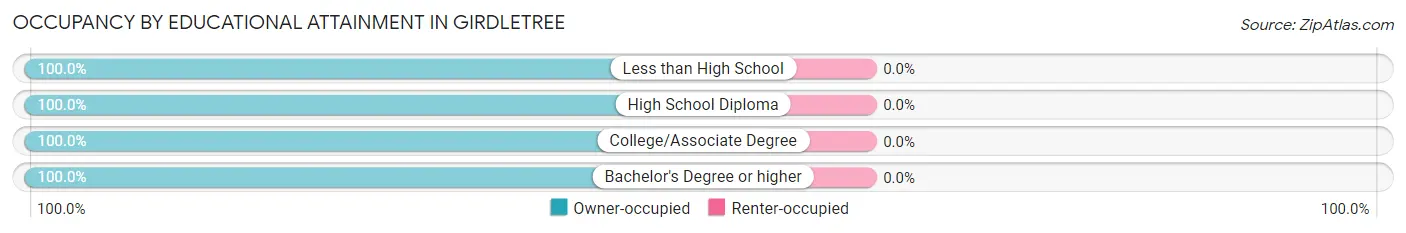
| Household Size | Owner-occupied | Renter-occupied |
| Less than High School | 12 (100.0%) | 0 (0.0%) |
| High School Diploma | 41 (100.0%) | 0 (0.0%) |
| College/Associate Degree | 9 (100.0%) | 0 (0.0%) |
| Bachelor's Degree or higher | 7 (100.0%) | 0 (0.0%) |
Occupancy by Age of Householder in Girdletree
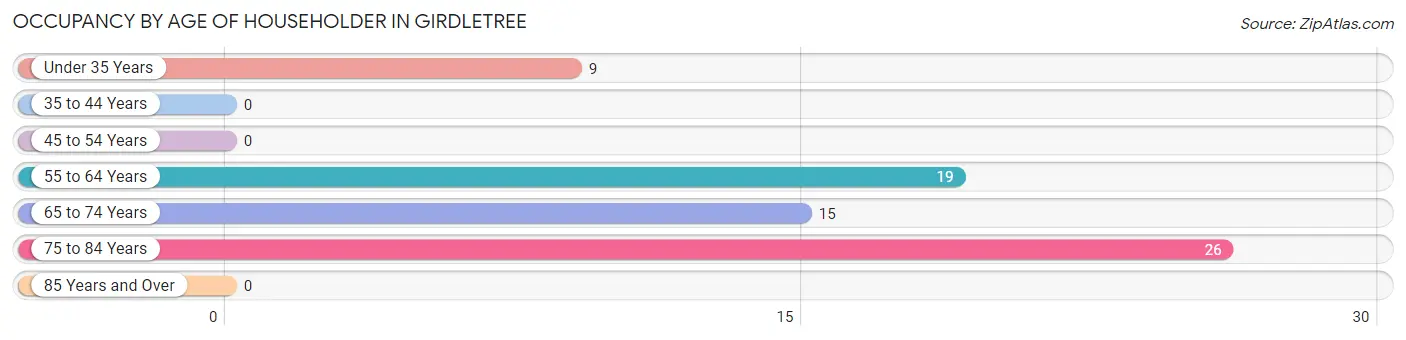
| Age Bracket | # Households | % Households |
| Under 35 Years | 9 | 13.0% |
| 35 to 44 Years | 0 | 0.0% |
| 45 to 54 Years | 0 | 0.0% |
| 55 to 64 Years | 19 | 27.5% |
| 65 to 74 Years | 15 | 21.7% |
| 75 to 84 Years | 26 | 37.7% |
| 85 Years and Over | 0 | 0.0% |
| Total | 69 | 100.0% |
Housing Finances in Girdletree
Median Income by Occupancy in Girdletree
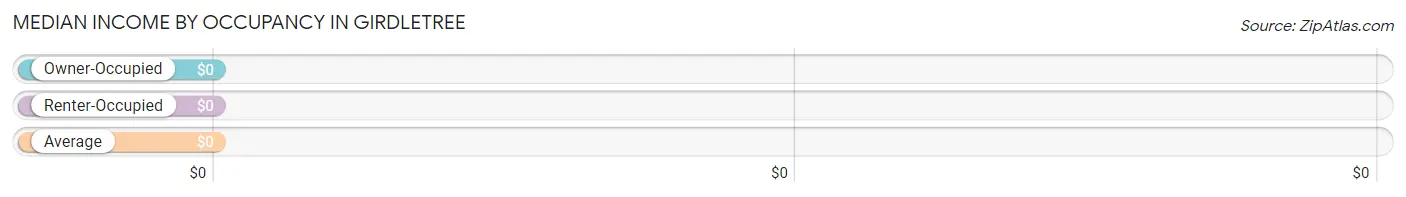
| Occupancy Type | # Households | Median Income |
| Owner-Occupied | 69 (100.0%) | $0 |
| Renter-Occupied | 0 (0.0%) | $0 |
| Average | 69 (100.0%) | $0 |
Occupancy by Householder Income Bracket in Girdletree
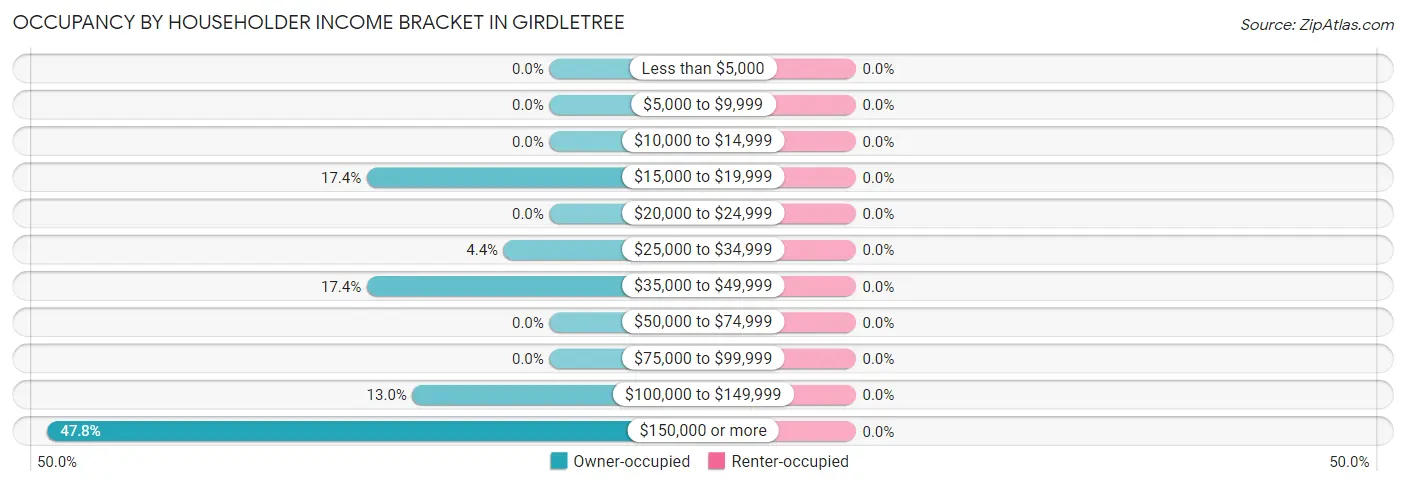
| Income Bracket | Owner-occupied | Renter-occupied |
| Less than $5,000 | 0 (0.0%) | 0 (0.0%) |
| $5,000 to $9,999 | 0 (0.0%) | 0 (0.0%) |
| $10,000 to $14,999 | 0 (0.0%) | 0 (0.0%) |
| $15,000 to $19,999 | 12 (17.4%) | 0 (0.0%) |
| $20,000 to $24,999 | 0 (0.0%) | 0 (0.0%) |
| $25,000 to $34,999 | 3 (4.3%) | 0 (0.0%) |
| $35,000 to $49,999 | 12 (17.4%) | 0 (0.0%) |
| $50,000 to $74,999 | 0 (0.0%) | 0 (0.0%) |
| $75,000 to $99,999 | 0 (0.0%) | 0 (0.0%) |
| $100,000 to $149,999 | 9 (13.0%) | 0 (0.0%) |
| $150,000 or more | 33 (47.8%) | 0 (0.0%) |
| Total | 69 (100.0%) | 0 (0.0%) |
Monthly Housing Cost Tiers in Girdletree
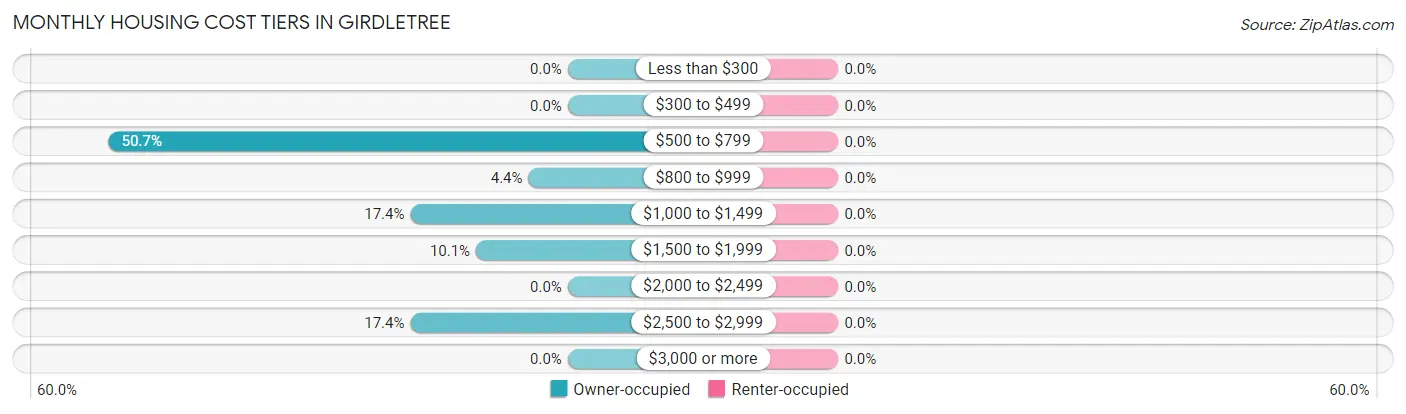
| Monthly Cost | Owner-occupied | Renter-occupied |
| Less than $300 | 0 (0.0%) | 0 (0.0%) |
| $300 to $499 | 0 (0.0%) | 0 (0.0%) |
| $500 to $799 | 35 (50.7%) | 0 (0.0%) |
| $800 to $999 | 3 (4.3%) | 0 (0.0%) |
| $1,000 to $1,499 | 12 (17.4%) | 0 (0.0%) |
| $1,500 to $1,999 | 7 (10.1%) | 0 (0.0%) |
| $2,000 to $2,499 | 0 (0.0%) | 0 (0.0%) |
| $2,500 to $2,999 | 12 (17.4%) | 0 (0.0%) |
| $3,000 or more | 0 (0.0%) | 0 (0.0%) |
| Total | 69 (100.0%) | 0 (0.0%) |
Physical Housing Characteristics in Girdletree
Housing Structures in Girdletree
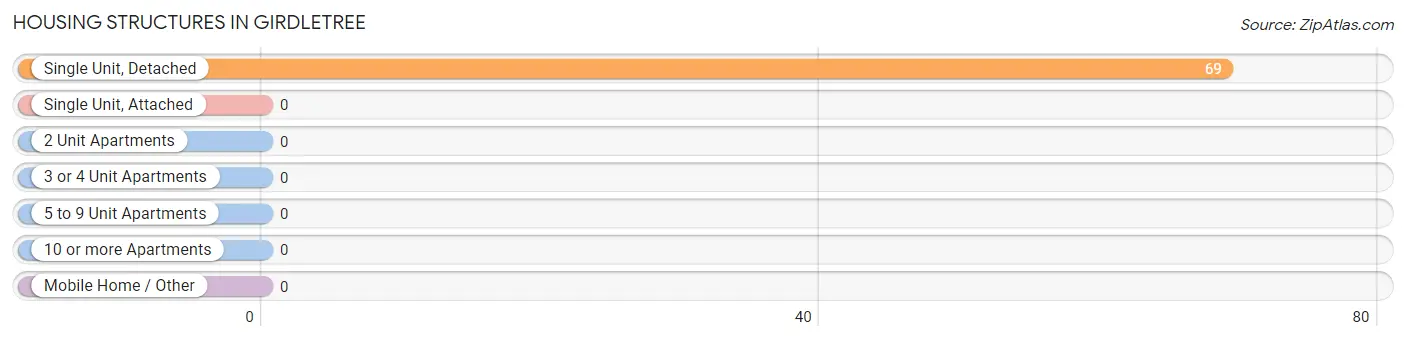
| Structure Type | # Housing Units | % Housing Units |
| Single Unit, Detached | 69 | 100.0% |
| Single Unit, Attached | 0 | 0.0% |
| 2 Unit Apartments | 0 | 0.0% |
| 3 or 4 Unit Apartments | 0 | 0.0% |
| 5 to 9 Unit Apartments | 0 | 0.0% |
| 10 or more Apartments | 0 | 0.0% |
| Mobile Home / Other | 0 | 0.0% |
| Total | 69 | 100.0% |
Housing Structures by Occupancy in Girdletree
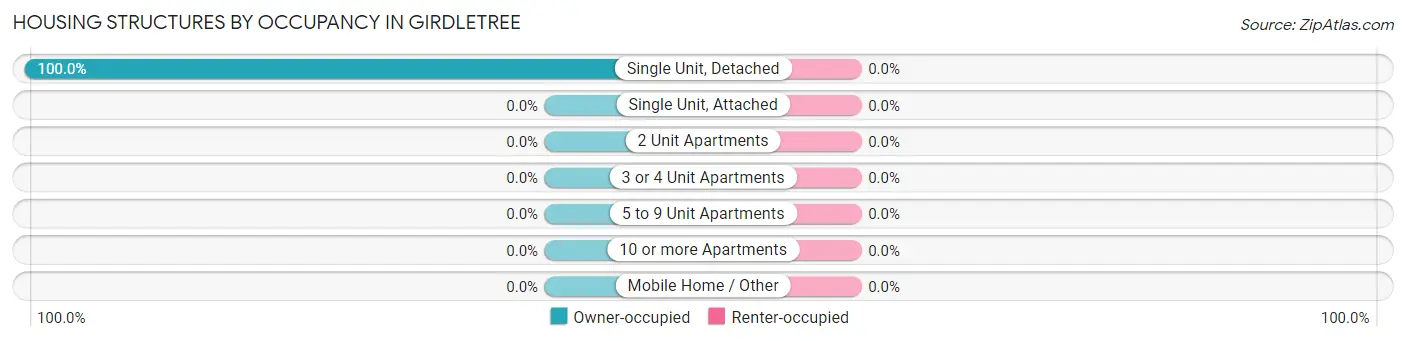
| Structure Type | Owner-occupied | Renter-occupied |
| Single Unit, Detached | 69 (100.0%) | 0 (0.0%) |
| Single Unit, Attached | 0 (0.0%) | 0 (0.0%) |
| 2 Unit Apartments | 0 (0.0%) | 0 (0.0%) |
| 3 or 4 Unit Apartments | 0 (0.0%) | 0 (0.0%) |
| 5 to 9 Unit Apartments | 0 (0.0%) | 0 (0.0%) |
| 10 or more Apartments | 0 (0.0%) | 0 (0.0%) |
| Mobile Home / Other | 0 (0.0%) | 0 (0.0%) |
| Total | 69 (100.0%) | 0 (0.0%) |
Housing Structures by Number of Rooms in Girdletree
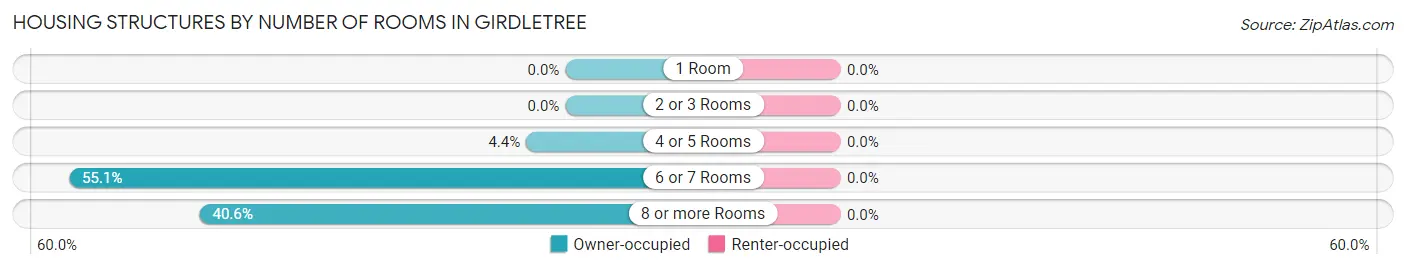
| Number of Rooms | Owner-occupied | Renter-occupied |
| 1 Room | 0 (0.0%) | 0 (0.0%) |
| 2 or 3 Rooms | 0 (0.0%) | 0 (0.0%) |
| 4 or 5 Rooms | 3 (4.3%) | 0 (0.0%) |
| 6 or 7 Rooms | 38 (55.1%) | 0 (0.0%) |
| 8 or more Rooms | 28 (40.6%) | 0 (0.0%) |
| Total | 69 (100.0%) | 0 (0.0%) |
Housing Structure by Heating Type in Girdletree
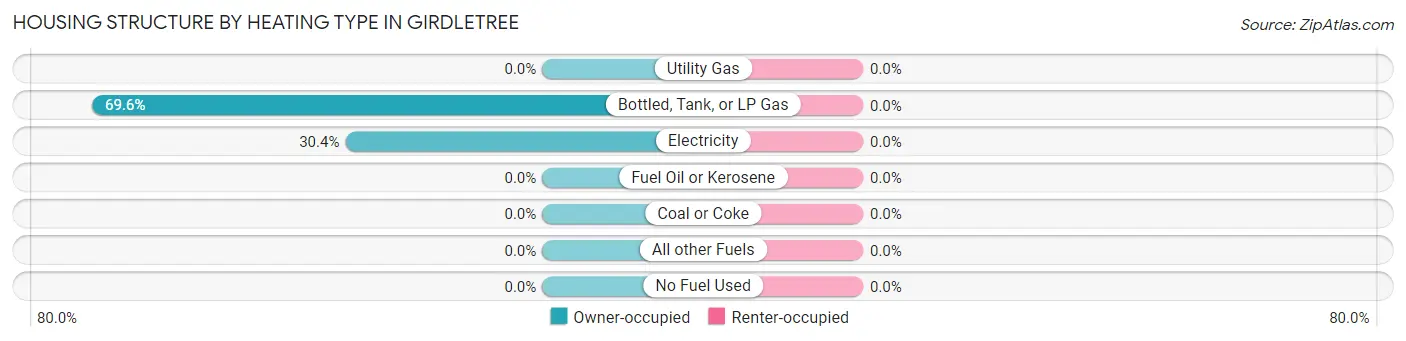
| Heating Type | Owner-occupied | Renter-occupied |
| Utility Gas | 0 (0.0%) | 0 (0.0%) |
| Bottled, Tank, or LP Gas | 48 (69.6%) | 0 (0.0%) |
| Electricity | 21 (30.4%) | 0 (0.0%) |
| Fuel Oil or Kerosene | 0 (0.0%) | 0 (0.0%) |
| Coal or Coke | 0 (0.0%) | 0 (0.0%) |
| All other Fuels | 0 (0.0%) | 0 (0.0%) |
| No Fuel Used | 0 (0.0%) | 0 (0.0%) |
| Total | 69 (100.0%) | 0 (0.0%) |
Household Vehicle Usage in Girdletree
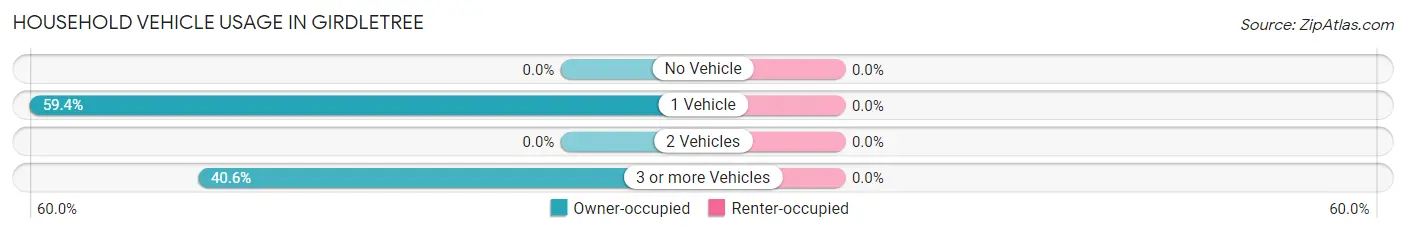
| Vehicles per Household | Owner-occupied | Renter-occupied |
| No Vehicle | 0 (0.0%) | 0 (0.0%) |
| 1 Vehicle | 41 (59.4%) | 0 (0.0%) |
| 2 Vehicles | 0 (0.0%) | 0 (0.0%) |
| 3 or more Vehicles | 28 (40.6%) | 0 (0.0%) |
| Total | 69 (100.0%) | 0 (0.0%) |
Real Estate & Mortgages in Girdletree
Real Estate and Mortgage Overview in Girdletree
| Characteristic | Without Mortgage | With Mortgage |
| Housing Units | 26 | 43 |
| Median Property Value | - | - |
| Median Household Income | - | - |
| Monthly Housing Costs | - | - |
| Real Estate Taxes | - | - |
Property Value by Mortgage Status in Girdletree
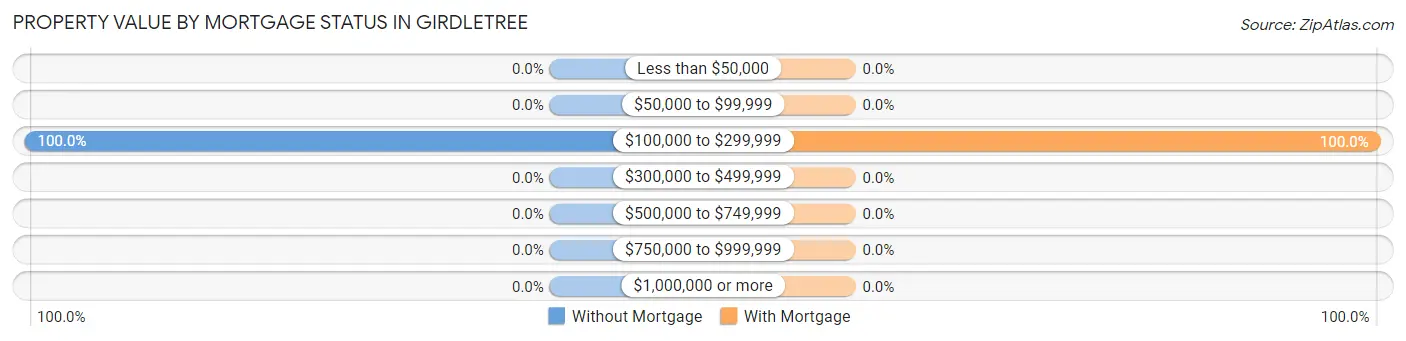
| Property Value | Without Mortgage | With Mortgage |
| Less than $50,000 | 0 (0.0%) | 0 (0.0%) |
| $50,000 to $99,999 | 0 (0.0%) | 0 (0.0%) |
| $100,000 to $299,999 | 26 (100.0%) | 43 (100.0%) |
| $300,000 to $499,999 | 0 (0.0%) | 0 (0.0%) |
| $500,000 to $749,999 | 0 (0.0%) | 0 (0.0%) |
| $750,000 to $999,999 | 0 (0.0%) | 0 (0.0%) |
| $1,000,000 or more | 0 (0.0%) | 0 (0.0%) |
| Total | 26 (100.0%) | 43 (100.0%) |
Household Income by Mortgage Status in Girdletree
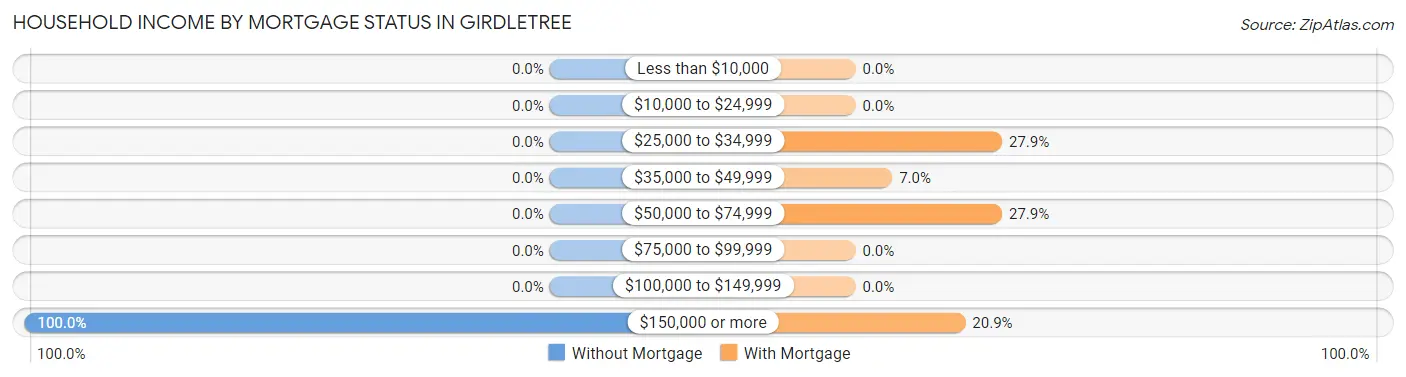
| Household Income | Without Mortgage | With Mortgage |
| Less than $10,000 | 0 (0.0%) | 0 (0.0%) |
| $10,000 to $24,999 | 0 (0.0%) | 0 (0.0%) |
| $25,000 to $34,999 | 0 (0.0%) | 12 (27.9%) |
| $35,000 to $49,999 | 0 (0.0%) | 3 (7.0%) |
| $50,000 to $74,999 | 0 (0.0%) | 12 (27.9%) |
| $75,000 to $99,999 | 0 (0.0%) | 0 (0.0%) |
| $100,000 to $149,999 | 0 (0.0%) | 0 (0.0%) |
| $150,000 or more | 26 (100.0%) | 9 (20.9%) |
| Total | 26 (100.0%) | 43 (100.0%) |
Property Value to Household Income Ratio in Girdletree
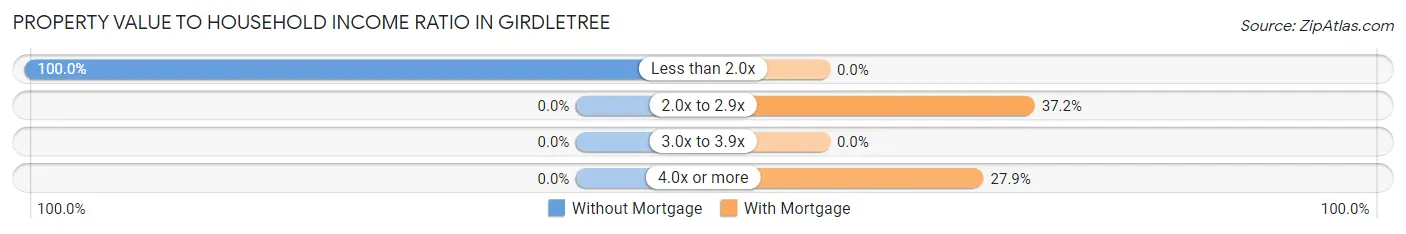
| Value-to-Income Ratio | Without Mortgage | With Mortgage |
| Less than 2.0x | 26 (100.0%) | 0 (0.0%) |
| 2.0x to 2.9x | 0 (0.0%) | 16 (37.2%) |
| 3.0x to 3.9x | 0 (0.0%) | 0 (0.0%) |
| 4.0x or more | 0 (0.0%) | 12 (27.9%) |
| Total | 26 (100.0%) | 43 (100.0%) |
Real Estate Taxes by Mortgage Status in Girdletree
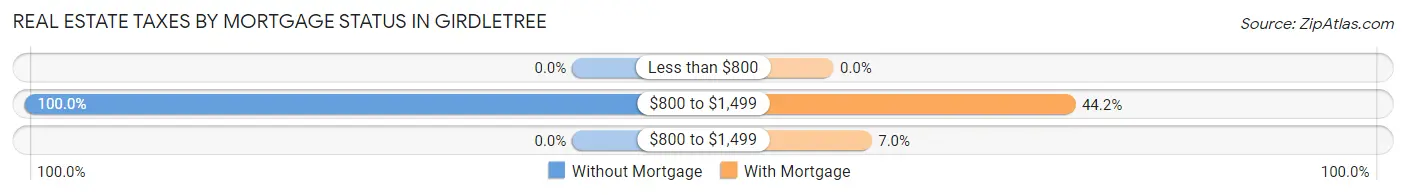
| Property Taxes | Without Mortgage | With Mortgage |
| Less than $800 | 0 (0.0%) | 0 (0.0%) |
| $800 to $1,499 | 26 (100.0%) | 19 (44.2%) |
| $800 to $1,499 | 0 (0.0%) | 3 (7.0%) |
| Total | 26 (100.0%) | 43 (100.0%) |
Health & Disability in Girdletree
Health Insurance Coverage by Age in Girdletree
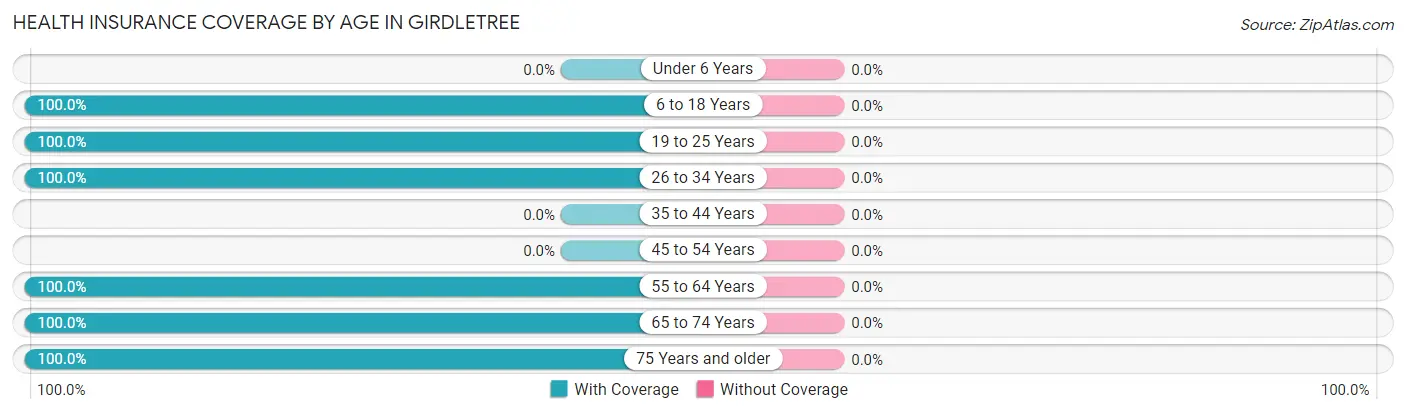
| Age Bracket | With Coverage | Without Coverage |
| Under 6 Years | 0 (0.0%) | 0 (0.0%) |
| 6 to 18 Years | 14 (100.0%) | 0 (0.0%) |
| 19 to 25 Years | 6 (100.0%) | 0 (0.0%) |
| 26 to 34 Years | 22 (100.0%) | 0 (0.0%) |
| 35 to 44 Years | 0 (0.0%) | 0 (0.0%) |
| 45 to 54 Years | 0 (0.0%) | 0 (0.0%) |
| 55 to 64 Years | 39 (100.0%) | 0 (0.0%) |
| 65 to 74 Years | 15 (100.0%) | 0 (0.0%) |
| 75 Years and older | 26 (100.0%) | 0 (0.0%) |
| Total | 122 (100.0%) | 0 (0.0%) |
Health Insurance Coverage by Citizenship Status in Girdletree
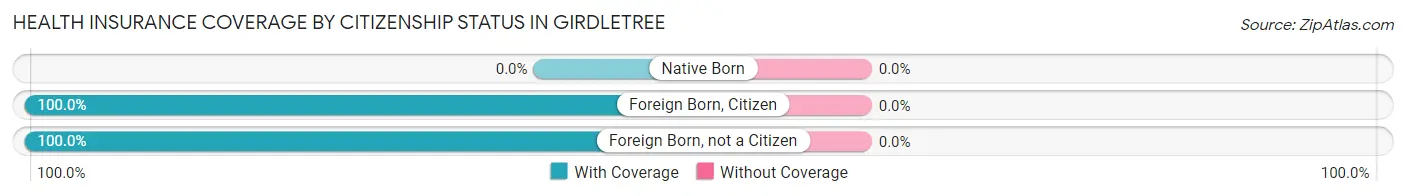
| Citizenship Status | With Coverage | Without Coverage |
| Native Born | 0 (0.0%) | 0 (0.0%) |
| Foreign Born, Citizen | 14 (100.0%) | 0 (0.0%) |
| Foreign Born, not a Citizen | 6 (100.0%) | 0 (0.0%) |
Health Insurance Coverage by Household Income in Girdletree
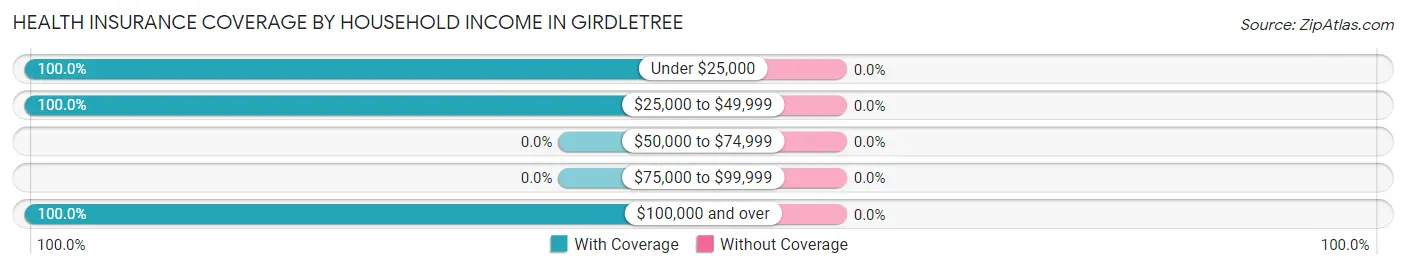
| Household Income | With Coverage | Without Coverage |
| Under $25,000 | 39 (100.0%) | 0 (0.0%) |
| $25,000 to $49,999 | 15 (100.0%) | 0 (0.0%) |
| $50,000 to $74,999 | 0 (0.0%) | 0 (0.0%) |
| $75,000 to $99,999 | 0 (0.0%) | 0 (0.0%) |
| $100,000 and over | 68 (100.0%) | 0 (0.0%) |
Public vs Private Health Insurance Coverage by Age in Girdletree
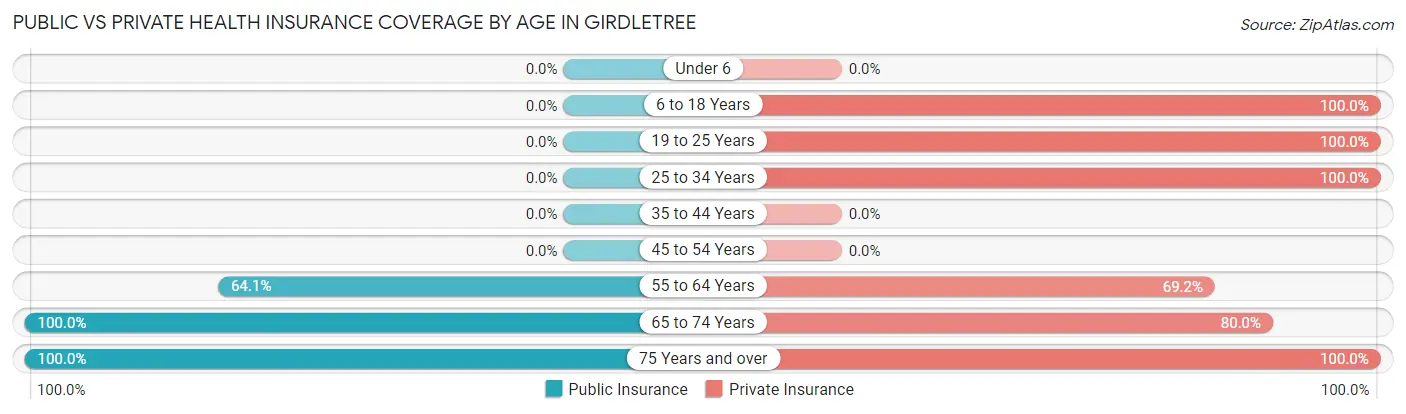
| Age Bracket | Public Insurance | Private Insurance |
| Under 6 | 0 (0.0%) | 0 (0.0%) |
| 6 to 18 Years | 0 (0.0%) | 14 (100.0%) |
| 19 to 25 Years | 0 (0.0%) | 6 (100.0%) |
| 25 to 34 Years | 0 (0.0%) | 22 (100.0%) |
| 35 to 44 Years | 0 (0.0%) | 0 (0.0%) |
| 45 to 54 Years | 0 (0.0%) | 0 (0.0%) |
| 55 to 64 Years | 25 (64.1%) | 27 (69.2%) |
| 65 to 74 Years | 15 (100.0%) | 12 (80.0%) |
| 75 Years and over | 26 (100.0%) | 26 (100.0%) |
| Total | 66 (54.1%) | 107 (87.7%) |
Disability Status by Sex by Age in Girdletree
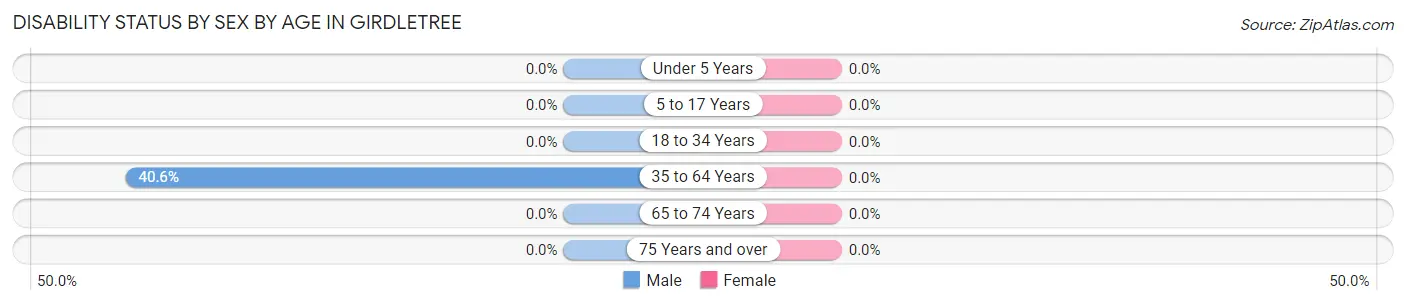
| Age Bracket | Male | Female |
| Under 5 Years | 0 (0.0%) | 0 (0.0%) |
| 5 to 17 Years | 0 (0.0%) | 0 (0.0%) |
| 18 to 34 Years | 0 (0.0%) | 0 (0.0%) |
| 35 to 64 Years | 13 (40.6%) | 0 (0.0%) |
| 65 to 74 Years | 0 (0.0%) | 0 (0.0%) |
| 75 Years and over | 0 (0.0%) | 0 (0.0%) |
Disability Class by Sex by Age in Girdletree
Disability Class: Hearing Difficulty
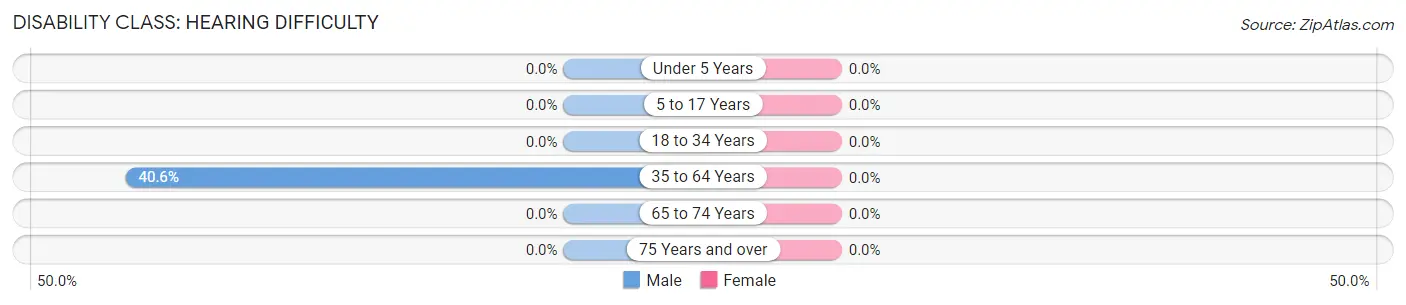
| Age Bracket | Male | Female |
| Under 5 Years | 0 (0.0%) | 0 (0.0%) |
| 5 to 17 Years | 0 (0.0%) | 0 (0.0%) |
| 18 to 34 Years | 0 (0.0%) | 0 (0.0%) |
| 35 to 64 Years | 13 (40.6%) | 0 (0.0%) |
| 65 to 74 Years | 0 (0.0%) | 0 (0.0%) |
| 75 Years and over | 0 (0.0%) | 0 (0.0%) |
Disability Class: Vision Difficulty
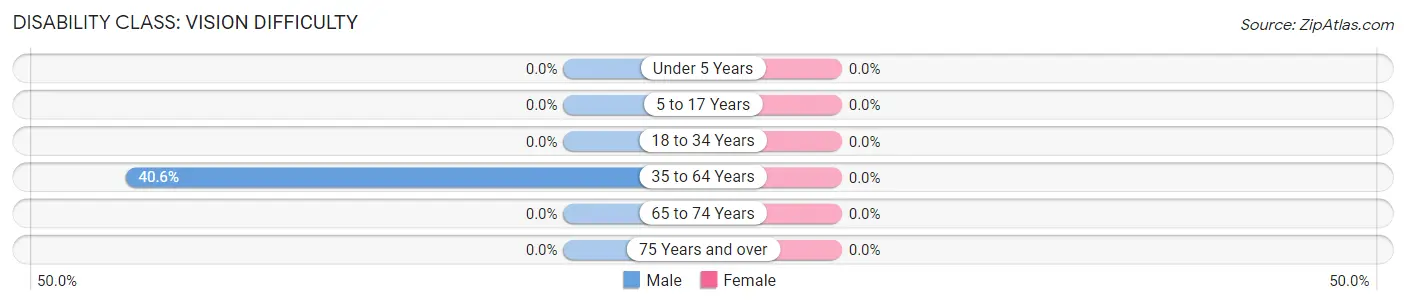
| Age Bracket | Male | Female |
| Under 5 Years | 0 (0.0%) | 0 (0.0%) |
| 5 to 17 Years | 0 (0.0%) | 0 (0.0%) |
| 18 to 34 Years | 0 (0.0%) | 0 (0.0%) |
| 35 to 64 Years | 13 (40.6%) | 0 (0.0%) |
| 65 to 74 Years | 0 (0.0%) | 0 (0.0%) |
| 75 Years and over | 0 (0.0%) | 0 (0.0%) |
Disability Class: Cognitive Difficulty
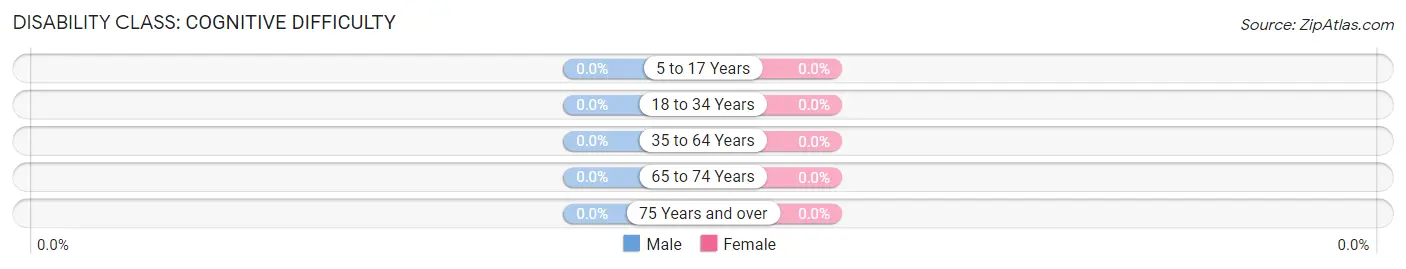
| Age Bracket | Male | Female |
| 5 to 17 Years | 0 (0.0%) | 0 (0.0%) |
| 18 to 34 Years | 0 (0.0%) | 0 (0.0%) |
| 35 to 64 Years | 0 (0.0%) | 0 (0.0%) |
| 65 to 74 Years | 0 (0.0%) | 0 (0.0%) |
| 75 Years and over | 0 (0.0%) | 0 (0.0%) |
Disability Class: Ambulatory Difficulty
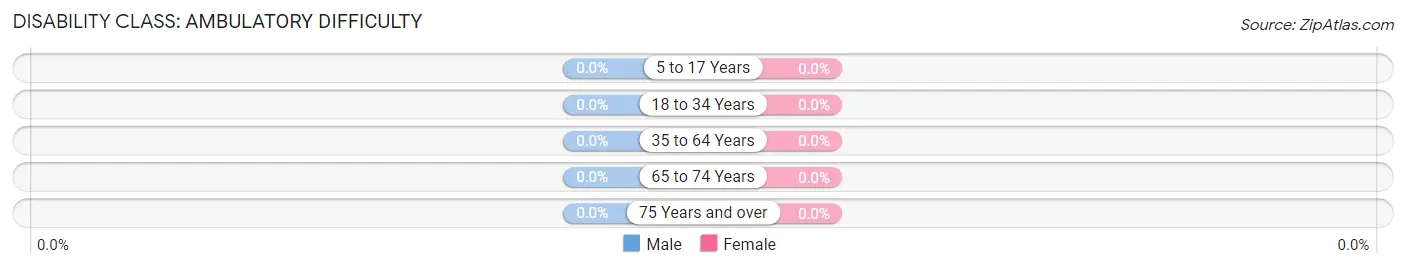
| Age Bracket | Male | Female |
| 5 to 17 Years | 0 (0.0%) | 0 (0.0%) |
| 18 to 34 Years | 0 (0.0%) | 0 (0.0%) |
| 35 to 64 Years | 0 (0.0%) | 0 (0.0%) |
| 65 to 74 Years | 0 (0.0%) | 0 (0.0%) |
| 75 Years and over | 0 (0.0%) | 0 (0.0%) |
Disability Class: Self-Care Difficulty

| Age Bracket | Male | Female |
| 5 to 17 Years | 0 (0.0%) | 0 (0.0%) |
| 18 to 34 Years | 0 (0.0%) | 0 (0.0%) |
| 35 to 64 Years | 0 (0.0%) | 0 (0.0%) |
| 65 to 74 Years | 0 (0.0%) | 0 (0.0%) |
| 75 Years and over | 0 (0.0%) | 0 (0.0%) |
Technology Access in Girdletree
Computing Device Access in Girdletree
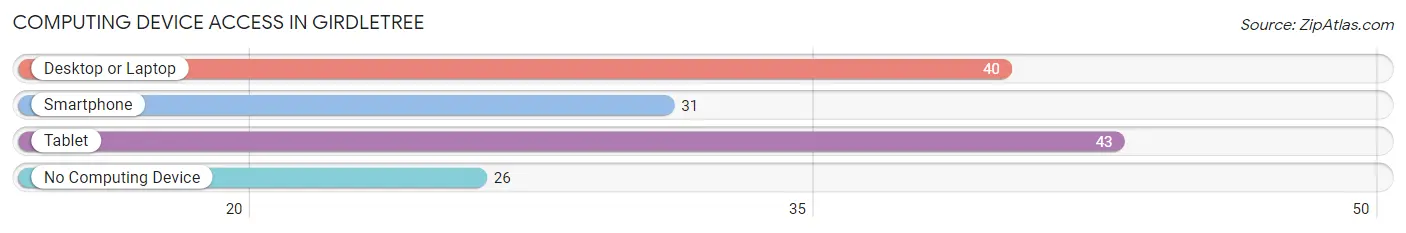
| Device Type | # Households | % Households |
| Desktop or Laptop | 40 | 58.0% |
| Smartphone | 31 | 44.9% |
| Tablet | 43 | 62.3% |
| No Computing Device | 26 | 37.7% |
| Total | 69 | 100.0% |
Internet Access in Girdletree

| Internet Type | # Households | % Households |
| Dial-Up Internet | 0 | 0.0% |
| Broadband Home | 31 | 44.9% |
| Cellular Data Only | 12 | 17.4% |
| Satellite Internet | 0 | 0.0% |
| No Internet | 26 | 37.7% |
| Total | 69 | 100.0% |
Girdletree Summary
Girdletree is a small unincorporated community located in Worcester County, Maryland. It is situated in the northern part of the county, near the border with Delaware. The population of Girdletree was estimated to be around 200 people in 2020.
History
Girdletree was first settled in the late 1700s by a group of German immigrants. The town was originally known as “Girdletree”, which is derived from the German word “Girdle”, meaning “a belt or girdle”. The town was officially incorporated in 1872.
Girdletree was a small farming community for many years, with the main crops being corn, wheat, and potatoes. In the early 1900s, the town began to grow and develop, with the construction of a post office, a general store, and a school.
In the 1950s, Girdletree began to experience a decline in population as many of the younger residents moved away to larger cities. This trend continued until the late 1990s, when the population began to slowly increase again.
Geography
Girdletree is located in the northern part of Worcester County, Maryland. It is situated near the border with Delaware, and is approximately 25 miles from the Atlantic Ocean. The town is located in a rural area, with the nearest major city being Salisbury, which is about 25 miles away.
The town is situated on a flat plain, with the nearest major body of water being the Pocomoke River, which is about 10 miles away. The climate in Girdletree is humid subtropical, with hot, humid summers and mild winters.
Economy
Girdletree’s economy is largely based on agriculture. The main crops grown in the area are corn, wheat, and potatoes. In addition, there are several small businesses in the town, including a general store, a post office, and a few restaurants.
The town also has a small tourism industry, with visitors coming to the area to enjoy the rural scenery and to visit the nearby Pocomoke River.
Demographics
As of the 2020 census, the population of Girdletree was estimated to be around 200 people. The racial makeup of the town was 97.5% White, 0.5% African American, 0.5% Native American, and 1.5% from other races. The median household income in Girdletree was $45,000, and the median home value was $150,000.
Girdletree is a small, rural community with a rich history and a strong sense of community. The town is a great place to live for those who enjoy the quiet, rural lifestyle.
Common Questions
What is Per Capita Income in Girdletree?
Per Capita income in Girdletree is $61,684.
What is Inequality or Gini Index in Girdletree?
Inequality or Gini Index in Girdletree is 0.31.
What is the Total Population of Girdletree?
Total Population of Girdletree is 122.
What is the Total Male Population of Girdletree?
Total Male Population of Girdletree is 47.
What is the Total Female Population of Girdletree?
Total Female Population of Girdletree is 75.
What is the Ratio of Males per 100 Females in Girdletree?
There are 62.67 Males per 100 Females in Girdletree.
What is the Ratio of Females per 100 Males in Girdletree?
There are 159.57 Females per 100 Males in Girdletree.
What is the Median Population Age in Girdletree?
Median Population Age in Girdletree is 57.4 Years.
What is the Average Family Size in Girdletree
Average Family Size in Girdletree is 2.9 People.
What is the Average Household Size in Girdletree
Average Household Size in Girdletree is 1.8 People.
How Large is the Labor Force in Girdletree?
There are 67 People in the Labor Forcein in Girdletree.
What is the Percentage of People in the Labor Force in Girdletree?
54.9% of People are in the Labor Force in Girdletree.