Suitland, MD Map & Demographics
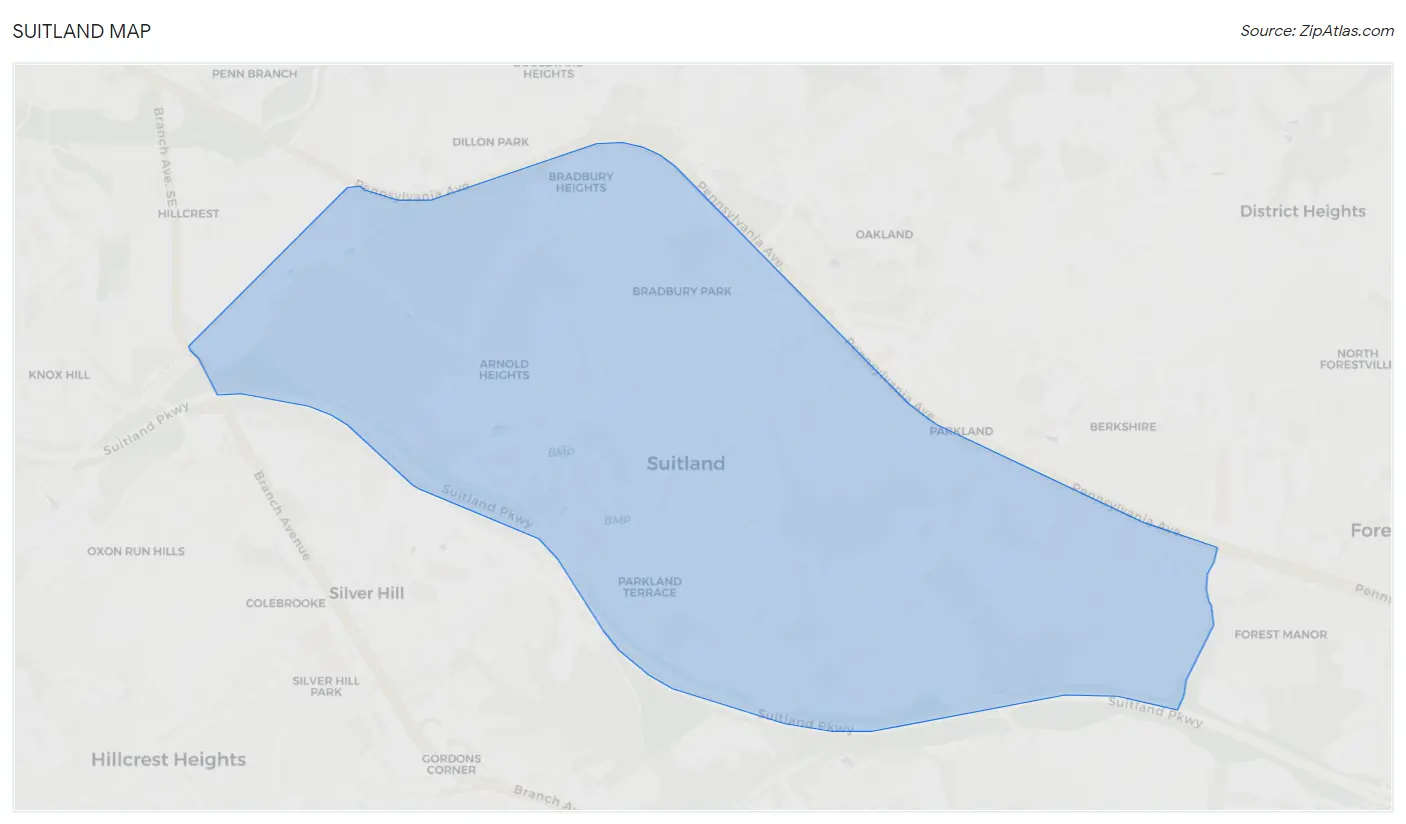
Suitland Map
Suitland Overview
$38,910
PER CAPITA INCOME
$86,204
AVG FAMILY INCOME
$72,347
AVG HOUSEHOLD INCOME
1.5%
WAGE / INCOME GAP [ % ]
98.5¢/ $1
WAGE / INCOME GAP [ $ ]
0.41
INEQUALITY / GINI INDEX
25,839
TOTAL POPULATION
12,186
MALE POPULATION
13,653
FEMALE POPULATION
89.26
MALES / 100 FEMALES
112.04
FEMALES / 100 MALES
38.1
MEDIAN AGE
3.1
AVG FAMILY SIZE
2.4
AVG HOUSEHOLD SIZE
14,959
LABOR FORCE [ PEOPLE ]
70.7%
PERCENT IN LABOR FORCE
7.3%
UNEMPLOYMENT RATE
Suitland Zip Codes
Income in Suitland
Income Overview in Suitland
Per Capita Income in Suitland is $38,910, while median incomes of families and households are $86,204 and $72,347 respectively.
| Characteristic | Number | Measure |
| Per Capita Income | 25,839 | $38,910 |
| Median Family Income | 6,325 | $86,204 |
| Mean Family Income | 6,325 | $104,370 |
| Median Household Income | 10,809 | $72,347 |
| Mean Household Income | 10,809 | $89,795 |
| Income Deficit | 6,325 | $0 |
| Wage / Income Gap (%) | 25,839 | 1.50% |
| Wage / Income Gap ($) | 25,839 | 98.50¢ per $1 |
| Gini / Inequality Index | 25,839 | 0.41 |
Earnings by Sex in Suitland
Average Earnings in Suitland are $48,542, $48,968 for men and $48,232 for women, a difference of 1.5%.
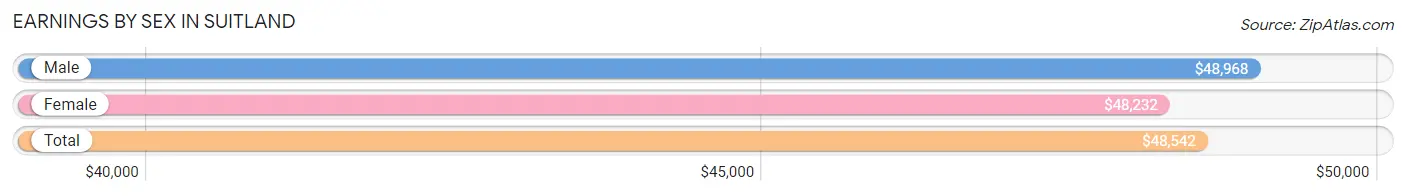
| Sex | Number | Average Earnings |
| Male | 7,179 (47.9%) | $48,968 |
| Female | 7,810 (52.1%) | $48,232 |
| Total | 14,989 (100.0%) | $48,542 |
Earnings by Sex by Income Bracket in Suitland
The most common earnings brackets in Suitland are $55,000 to $64,999 for men (1,062 | 14.8%) and $55,000 to $64,999 for women (1,001 | 12.8%).
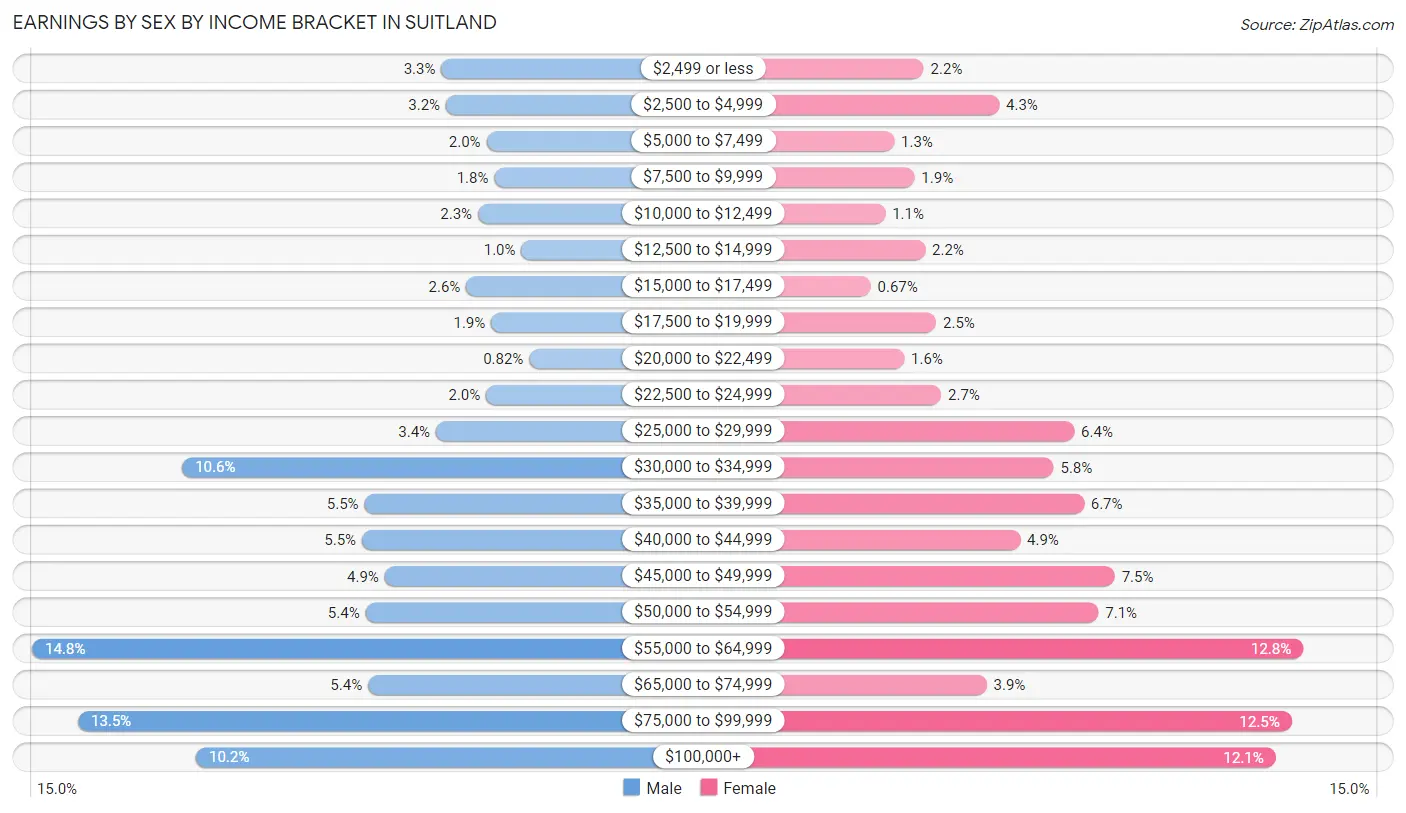
| Income | Male | Female |
| $2,499 or less | 236 (3.3%) | 169 (2.2%) |
| $2,500 to $4,999 | 227 (3.2%) | 334 (4.3%) |
| $5,000 to $7,499 | 145 (2.0%) | 104 (1.3%) |
| $7,500 to $9,999 | 129 (1.8%) | 148 (1.9%) |
| $10,000 to $12,499 | 162 (2.3%) | 84 (1.1%) |
| $12,500 to $14,999 | 75 (1.0%) | 172 (2.2%) |
| $15,000 to $17,499 | 186 (2.6%) | 52 (0.7%) |
| $17,500 to $19,999 | 136 (1.9%) | 196 (2.5%) |
| $20,000 to $22,499 | 59 (0.8%) | 126 (1.6%) |
| $22,500 to $24,999 | 146 (2.0%) | 207 (2.6%) |
| $25,000 to $29,999 | 247 (3.4%) | 499 (6.4%) |
| $30,000 to $34,999 | 759 (10.6%) | 454 (5.8%) |
| $35,000 to $39,999 | 391 (5.4%) | 520 (6.7%) |
| $40,000 to $44,999 | 396 (5.5%) | 380 (4.9%) |
| $45,000 to $49,999 | 350 (4.9%) | 588 (7.5%) |
| $50,000 to $54,999 | 389 (5.4%) | 552 (7.1%) |
| $55,000 to $64,999 | 1,062 (14.8%) | 1,001 (12.8%) |
| $65,000 to $74,999 | 384 (5.3%) | 307 (3.9%) |
| $75,000 to $99,999 | 969 (13.5%) | 976 (12.5%) |
| $100,000+ | 731 (10.2%) | 941 (12.0%) |
| Total | 7,179 (100.0%) | 7,810 (100.0%) |
Earnings by Sex by Educational Attainment in Suitland
Average earnings in Suitland are $52,953 for men and $51,822 for women, a difference of 2.1%. Men with an educational attainment of graduate degree enjoy the highest average annual earnings of $102,760, while those with less than high school education earn the least with $39,219. Women with an educational attainment of graduate degree earn the most with the average annual earnings of $81,329, while those with less than high school education have the smallest earnings of $32,500.
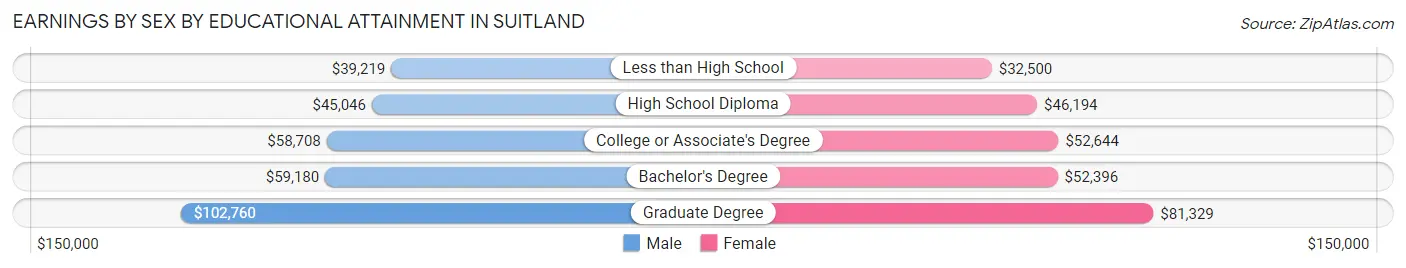
| Educational Attainment | Male Income | Female Income |
| Less than High School | $39,219 | $32,500 |
| High School Diploma | $45,046 | $46,194 |
| College or Associate's Degree | $58,708 | $52,644 |
| Bachelor's Degree | $59,180 | $52,396 |
| Graduate Degree | $102,760 | $81,329 |
| Total | $52,953 | $51,822 |
Family Income in Suitland
Family Income Brackets in Suitland
According to the Suitland family income data, there are 1,531 families falling into the $100,000 to $149,999 income range, which is the most common income bracket and makes up 24.2% of all families. Conversely, the $10,000 to $14,999 income bracket is the least frequent group with only 95 families (1.5%) belonging to this category.
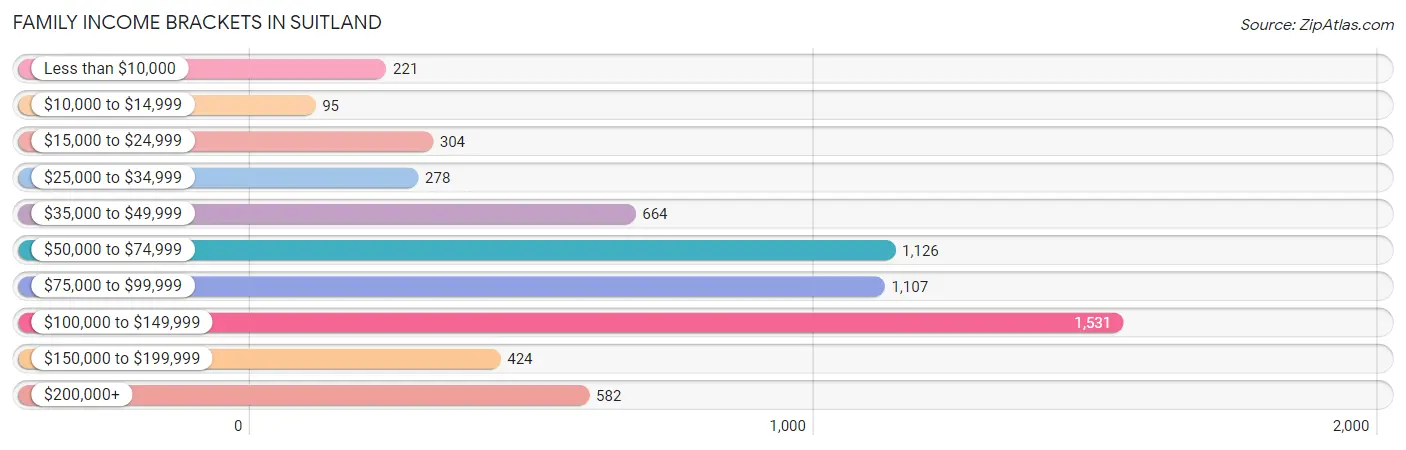
| Income Bracket | # Families | % Families |
| Less than $10,000 | 221 | 3.5% |
| $10,000 to $14,999 | 95 | 1.5% |
| $15,000 to $24,999 | 304 | 4.8% |
| $25,000 to $34,999 | 278 | 4.4% |
| $35,000 to $49,999 | 664 | 10.5% |
| $50,000 to $74,999 | 1,126 | 17.8% |
| $75,000 to $99,999 | 1,107 | 17.5% |
| $100,000 to $149,999 | 1,531 | 24.2% |
| $150,000 to $199,999 | 424 | 6.7% |
| $200,000+ | 582 | 9.2% |
Family Income by Famaliy Size in Suitland
5-person families (464 | 7.3%) account for the highest median family income in Suitland with $97,179 per family, while 2-person families (3,036 | 48.0%) have the highest median income of $38,168 per family member.
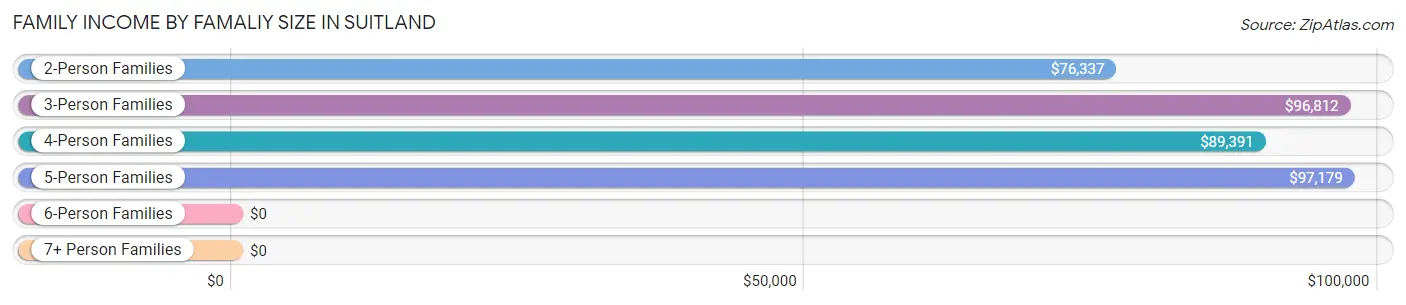
| Income Bracket | # Families | Median Income |
| 2-Person Families | 3,036 (48.0%) | $76,337 |
| 3-Person Families | 1,544 (24.4%) | $96,812 |
| 4-Person Families | 1,171 (18.5%) | $89,391 |
| 5-Person Families | 464 (7.3%) | $97,179 |
| 6-Person Families | 93 (1.5%) | $0 |
| 7+ Person Families | 17 (0.3%) | $0 |
| Total | 6,325 (100.0%) | $86,204 |
Family Income by Number of Earners in Suitland
The median family income in Suitland is $86,204, with families comprising 3+ earners (559) having the highest median family income of $140,026, while families with no earners (604) have the lowest median family income of $30,089, accounting for 8.8% and 9.6% of families, respectively.
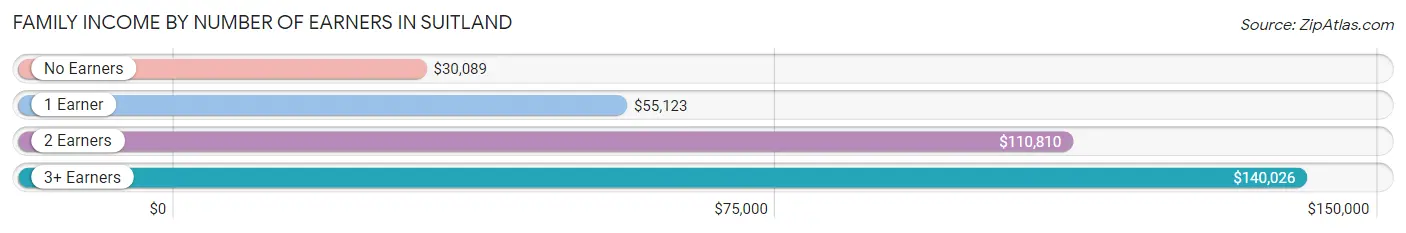
| Number of Earners | # Families | Median Income |
| No Earners | 604 (9.6%) | $30,089 |
| 1 Earner | 2,425 (38.3%) | $55,123 |
| 2 Earners | 2,737 (43.3%) | $110,810 |
| 3+ Earners | 559 (8.8%) | $140,026 |
| Total | 6,325 (100.0%) | $86,204 |
Household Income in Suitland
Household Income Brackets in Suitland
With 2,227 households falling in the category, the $50,000 to $74,999 income range is the most frequent in Suitland, accounting for 20.6% of all households. In contrast, only 324 households (3.0%) fall into the $10,000 to $14,999 income bracket, making it the least populous group.
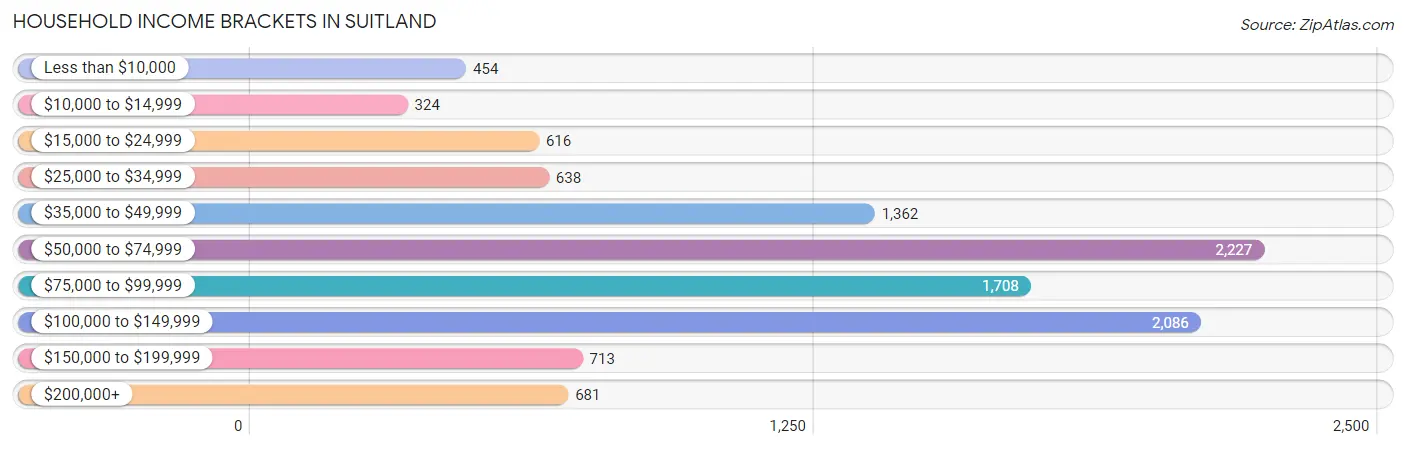
| Income Bracket | # Households | % Households |
| Less than $10,000 | 454 | 4.2% |
| $10,000 to $14,999 | 324 | 3.0% |
| $15,000 to $24,999 | 616 | 5.7% |
| $25,000 to $34,999 | 638 | 5.9% |
| $35,000 to $49,999 | 1,362 | 12.6% |
| $50,000 to $74,999 | 2,227 | 20.6% |
| $75,000 to $99,999 | 1,708 | 15.8% |
| $100,000 to $149,999 | 2,086 | 19.3% |
| $150,000 to $199,999 | 713 | 6.6% |
| $200,000+ | 681 | 6.3% |
Household Income by Householder Age in Suitland
The median household income in Suitland is $72,347, with the highest median household income of $80,560 found in the 45 to 64 years age bracket for the primary householder. A total of 4,593 households (42.5%) fall into this category. Meanwhile, the 15 to 24 years age bracket for the primary householder has the lowest median household income of $48,542, with 294 households (2.7%) in this group.
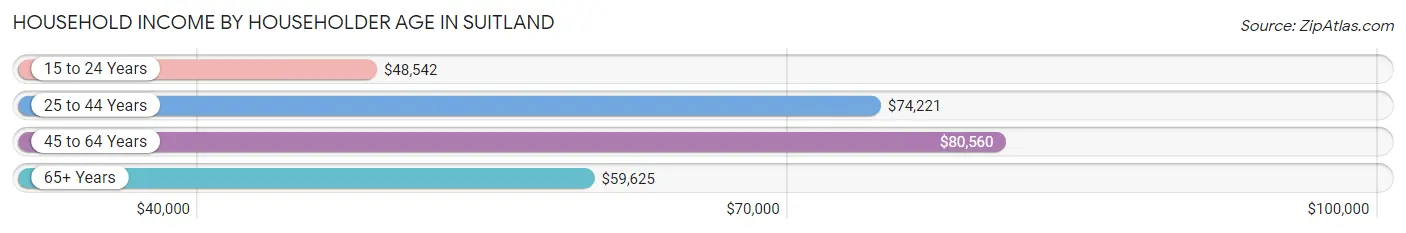
| Income Bracket | # Households | Median Income |
| 15 to 24 Years | 294 (2.7%) | $48,542 |
| 25 to 44 Years | 3,784 (35.0%) | $74,221 |
| 45 to 64 Years | 4,593 (42.5%) | $80,560 |
| 65+ Years | 2,138 (19.8%) | $59,625 |
| Total | 10,809 (100.0%) | $72,347 |
Poverty in Suitland
Income Below Poverty by Sex and Age in Suitland
With 9.4% poverty level for males and 12.0% for females among the residents of Suitland, 6 to 11 year old males and 5 year old females are the most vulnerable to poverty, with 274 males (28.4%) and 128 females (46.7%) in their respective age groups living below the poverty level.
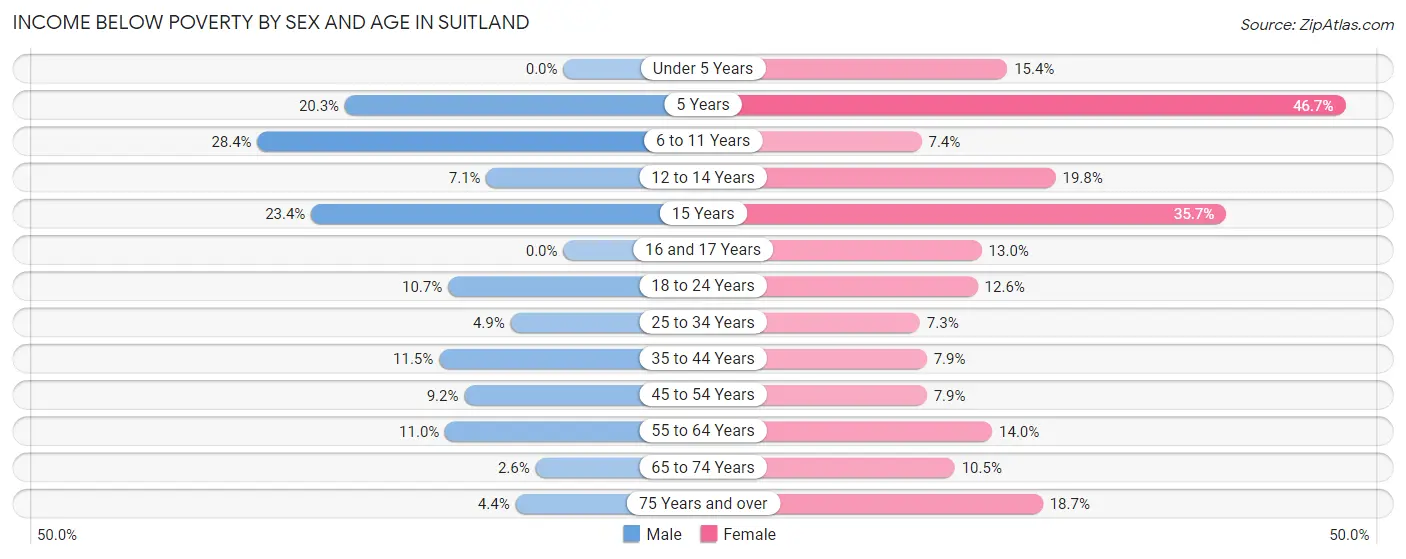
| Age Bracket | Male | Female |
| Under 5 Years | 0 (0.0%) | 105 (15.3%) |
| 5 Years | 15 (20.3%) | 128 (46.7%) |
| 6 to 11 Years | 274 (28.4%) | 47 (7.4%) |
| 12 to 14 Years | 22 (7.1%) | 99 (19.8%) |
| 15 Years | 44 (23.4%) | 51 (35.7%) |
| 16 and 17 Years | 0 (0.0%) | 34 (13.0%) |
| 18 to 24 Years | 70 (10.7%) | 161 (12.6%) |
| 25 to 34 Years | 121 (4.9%) | 173 (7.2%) |
| 35 to 44 Years | 198 (11.5%) | 122 (7.9%) |
| 45 to 54 Years | 132 (9.2%) | 135 (7.9%) |
| 55 to 64 Years | 219 (11.0%) | 328 (14.0%) |
| 65 to 74 Years | 19 (2.6%) | 122 (10.5%) |
| 75 Years and over | 25 (4.4%) | 124 (18.6%) |
| Total | 1,139 (9.4%) | 1,629 (12.0%) |
Income Above Poverty by Sex and Age in Suitland
According to the poverty statistics in Suitland, males aged under 5 years and females aged 25 to 34 years are the age groups that are most secure financially, with 100.0% of males and 92.7% of females in these age groups living above the poverty line.
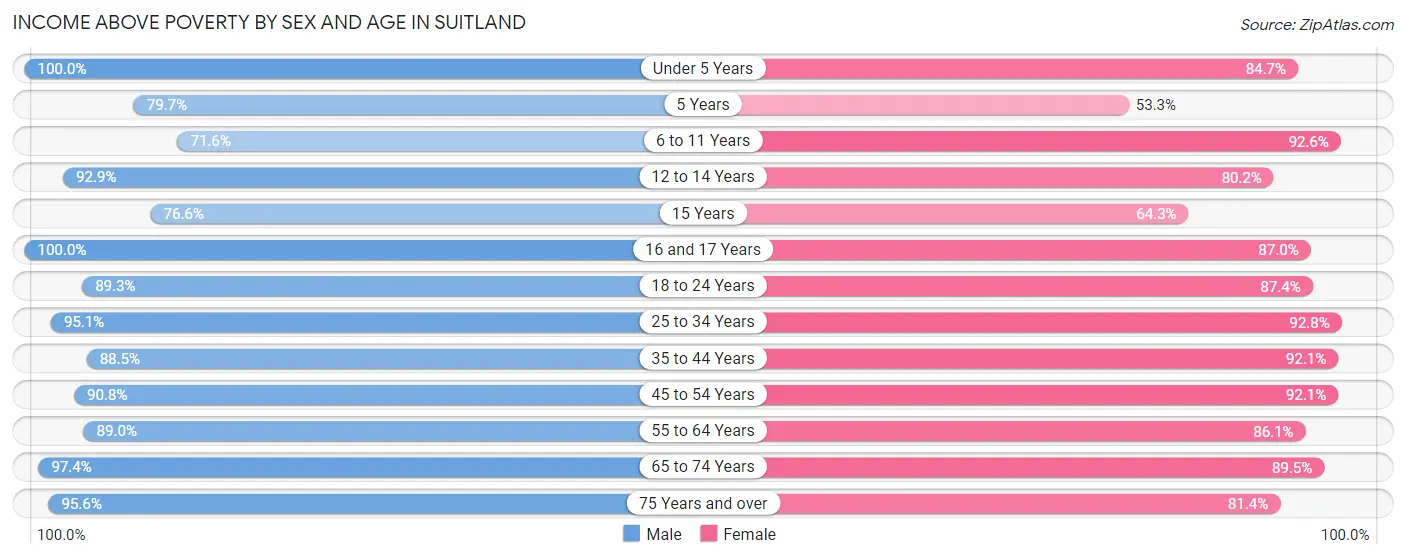
| Age Bracket | Male | Female |
| Under 5 Years | 802 (100.0%) | 579 (84.7%) |
| 5 Years | 59 (79.7%) | 146 (53.3%) |
| 6 to 11 Years | 691 (71.6%) | 588 (92.6%) |
| 12 to 14 Years | 286 (92.9%) | 400 (80.2%) |
| 15 Years | 144 (76.6%) | 92 (64.3%) |
| 16 and 17 Years | 204 (100.0%) | 228 (87.0%) |
| 18 to 24 Years | 584 (89.3%) | 1,116 (87.4%) |
| 25 to 34 Years | 2,348 (95.1%) | 2,213 (92.7%) |
| 35 to 44 Years | 1,519 (88.5%) | 1,427 (92.1%) |
| 45 to 54 Years | 1,305 (90.8%) | 1,579 (92.1%) |
| 55 to 64 Years | 1,777 (89.0%) | 2,023 (86.1%) |
| 65 to 74 Years | 717 (97.4%) | 1,042 (89.5%) |
| 75 Years and over | 538 (95.6%) | 541 (81.4%) |
| Total | 10,974 (90.6%) | 11,974 (88.0%) |
Income Below Poverty Among Married-Couple Families in Suitland
The poverty statistics for married-couple families in Suitland show that 4.5% or 119 of the total 2,634 families live below the poverty line. Families with 3 or 4 children have the highest poverty rate of 18.9%, comprising of 43 families. On the other hand, families with 1 or 2 children have the lowest poverty rate of 2.9%, which includes 26 families.
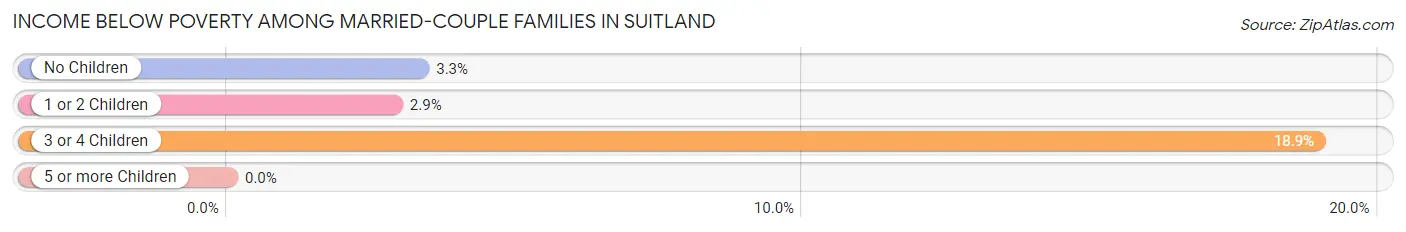
| Children | Above Poverty | Below Poverty |
| No Children | 1,450 (96.7%) | 50 (3.3%) |
| 1 or 2 Children | 881 (97.1%) | 26 (2.9%) |
| 3 or 4 Children | 184 (81.1%) | 43 (18.9%) |
| 5 or more Children | 0 (0.0%) | 0 (0.0%) |
| Total | 2,515 (95.5%) | 119 (4.5%) |
Income Below Poverty Among Single-Parent Households in Suitland
According to the poverty data in Suitland, 7.8% or 67 single-father households and 15.2% or 431 single-mother households are living below the poverty line. Among single-father households, those with 1 or 2 children have the highest poverty rate, with 67 households (37.4%) experiencing poverty. Likewise, among single-mother households, those with 5 or more children have the highest poverty rate, with 13 households (100.0%) falling below the poverty line.
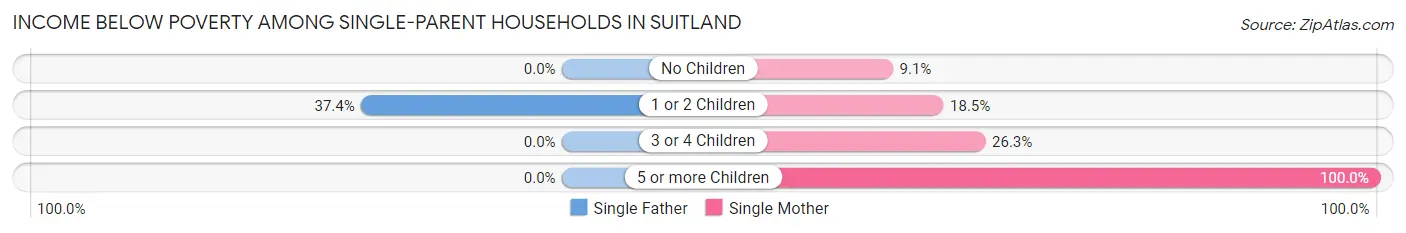
| Children | Single Father | Single Mother |
| No Children | 0 (0.0%) | 118 (9.1%) |
| 1 or 2 Children | 67 (37.4%) | 241 (18.5%) |
| 3 or 4 Children | 0 (0.0%) | 59 (26.3%) |
| 5 or more Children | 0 (0.0%) | 13 (100.0%) |
| Total | 67 (7.8%) | 431 (15.2%) |
Income Below Poverty Among Married-Couple vs Single-Parent Households in Suitland
The poverty data for Suitland shows that 119 of the married-couple family households (4.5%) and 498 of the single-parent households (13.5%) are living below the poverty level. Within the married-couple family households, those with 3 or 4 children have the highest poverty rate, with 43 households (18.9%) falling below the poverty line. Among the single-parent households, those with 5 or more children have the highest poverty rate, with 13 household (100.0%) living below poverty.
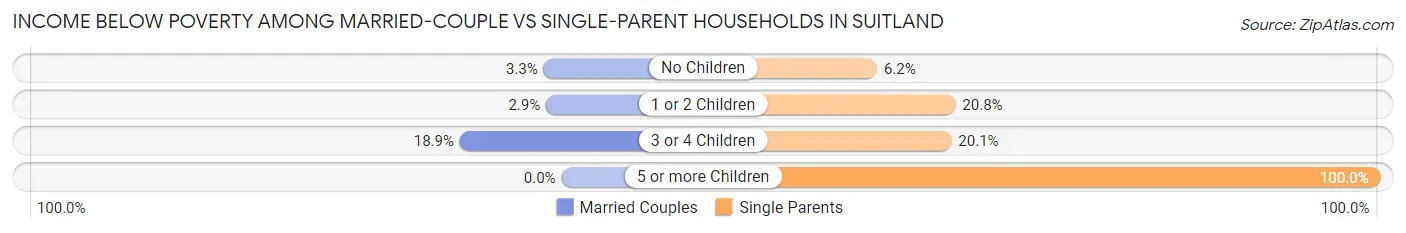
| Children | Married-Couple Families | Single-Parent Households |
| No Children | 50 (3.3%) | 118 (6.2%) |
| 1 or 2 Children | 26 (2.9%) | 308 (20.8%) |
| 3 or 4 Children | 43 (18.9%) | 59 (20.1%) |
| 5 or more Children | 0 (0.0%) | 13 (100.0%) |
| Total | 119 (4.5%) | 498 (13.5%) |
Race in Suitland
The most populous races in Suitland are Black / African American (23,120 | 89.5%), Hispanic or Latino (1,743 | 6.8%), and Two or more Races (1,235 | 4.8%).
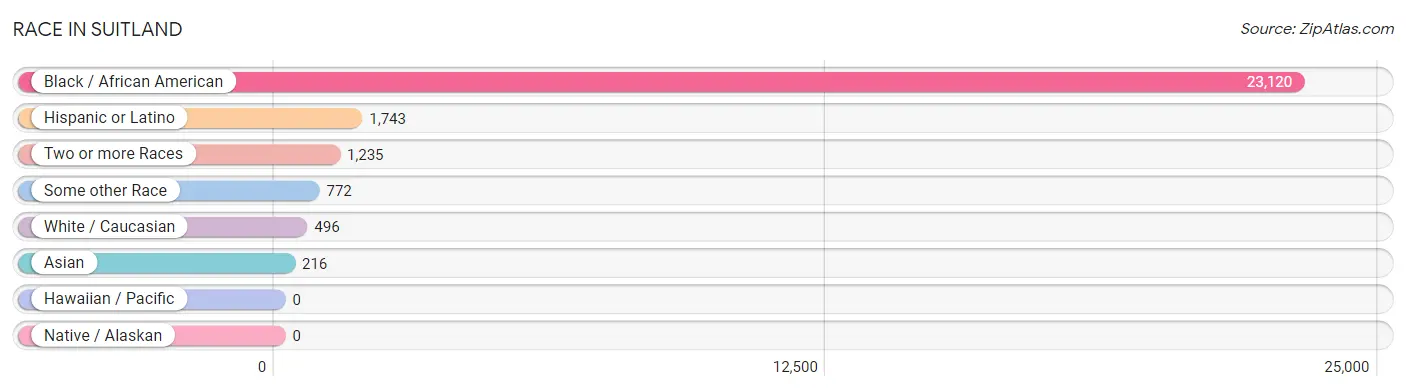
| Race | # Population | % Population |
| Asian | 216 | 0.8% |
| Black / African American | 23,120 | 89.5% |
| Hawaiian / Pacific | 0 | 0.0% |
| Hispanic or Latino | 1,743 | 6.8% |
| Native / Alaskan | 0 | 0.0% |
| White / Caucasian | 496 | 1.9% |
| Two or more Races | 1,235 | 4.8% |
| Some other Race | 772 | 3.0% |
| Total | 25,839 | 100.0% |
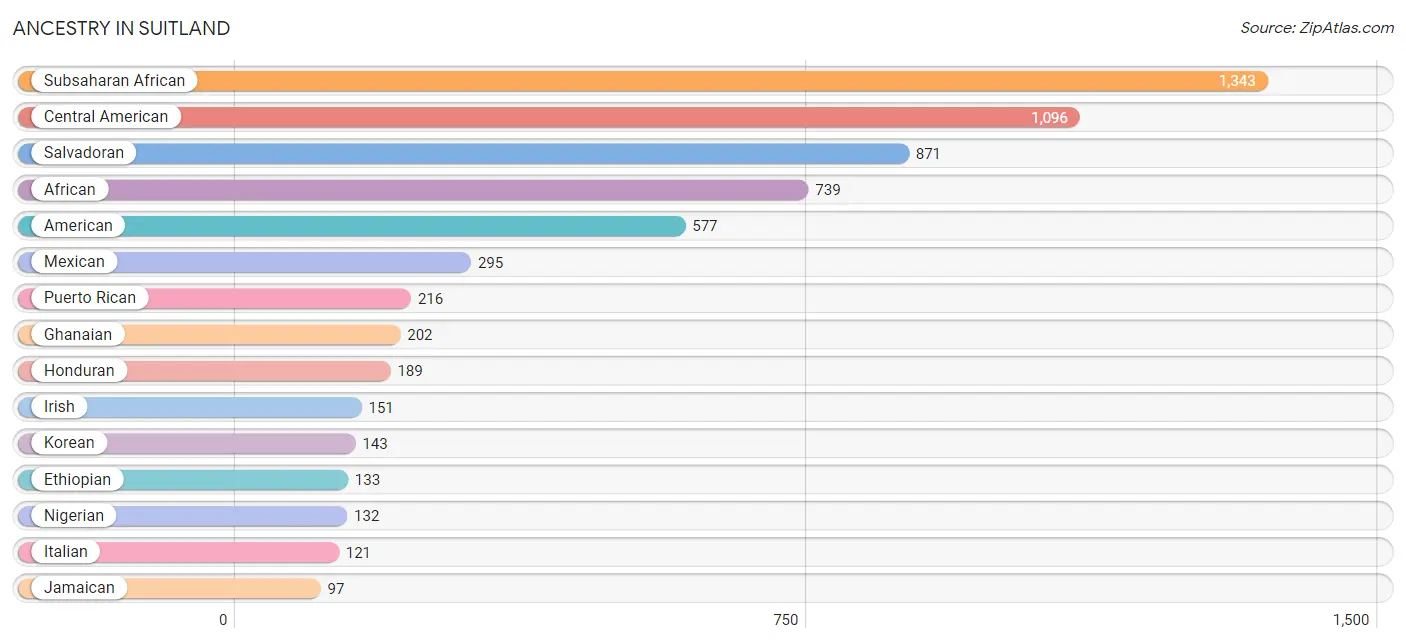
Ancestry in Suitland
The most populous ancestries reported in Suitland are Subsaharan African (1,343 | 5.2%), Central American (1,096 | 4.2%), Salvadoran (871 | 3.4%), African (739 | 2.9%), and American (577 | 2.2%), together accounting for 17.9% of all Suitland residents.
| Ancestry | # Population | % Population |
| African | 739 | 2.9% |
| American | 577 | 2.2% |
| Belgian | 1 | 0.0% |
| Bhutanese | 36 | 0.1% |
| Central American | 1,096 | 4.2% |
| Cherokee | 54 | 0.2% |
| Cuban | 29 | 0.1% |
| Dominican | 24 | 0.1% |
| English | 89 | 0.3% |
| Estonian | 43 | 0.2% |
| Ethiopian | 133 | 0.5% |
| European | 43 | 0.2% |
| French | 18 | 0.1% |
| German | 74 | 0.3% |
| Ghanaian | 202 | 0.8% |
| Guyanese | 83 | 0.3% |
| Haitian | 56 | 0.2% |
| Honduran | 189 | 0.7% |
| Indian (Asian) | 4 | 0.0% |
| Iranian | 24 | 0.1% |
| Irish | 151 | 0.6% |
| Italian | 121 | 0.5% |
| Jamaican | 97 | 0.4% |
| Korean | 143 | 0.5% |
| Mexican | 295 | 1.1% |
| Nigerian | 132 | 0.5% |
| Norwegian | 11 | 0.0% |
| Panamanian | 36 | 0.1% |
| Peruvian | 14 | 0.1% |
| Polish | 24 | 0.1% |
| Portuguese | 51 | 0.2% |
| Puerto Rican | 216 | 0.8% |
| Russian | 10 | 0.0% |
| Salvadoran | 871 | 3.4% |
| Samoan | 7 | 0.0% |
| Scottish | 11 | 0.0% |
| Slovak | 13 | 0.1% |
| South American | 29 | 0.1% |
| Subsaharan African | 1,343 | 5.2% |
| Thai | 68 | 0.3% |
| Trinidadian and Tobagonian | 28 | 0.1% |
| Venezuelan | 15 | 0.1% |
| Vietnamese | 22 | 0.1% |
| West Indian | 55 | 0.2% | View All 44 Rows |
Immigrants in Suitland
The most numerous immigrant groups reported in Suitland came from Latin America (1,122 | 4.3%), Central America (847 | 3.3%), Africa (844 | 3.3%), Western Africa (642 | 2.5%), and El Salvador (447 | 1.7%), together accounting for 15.1% of all Suitland residents.
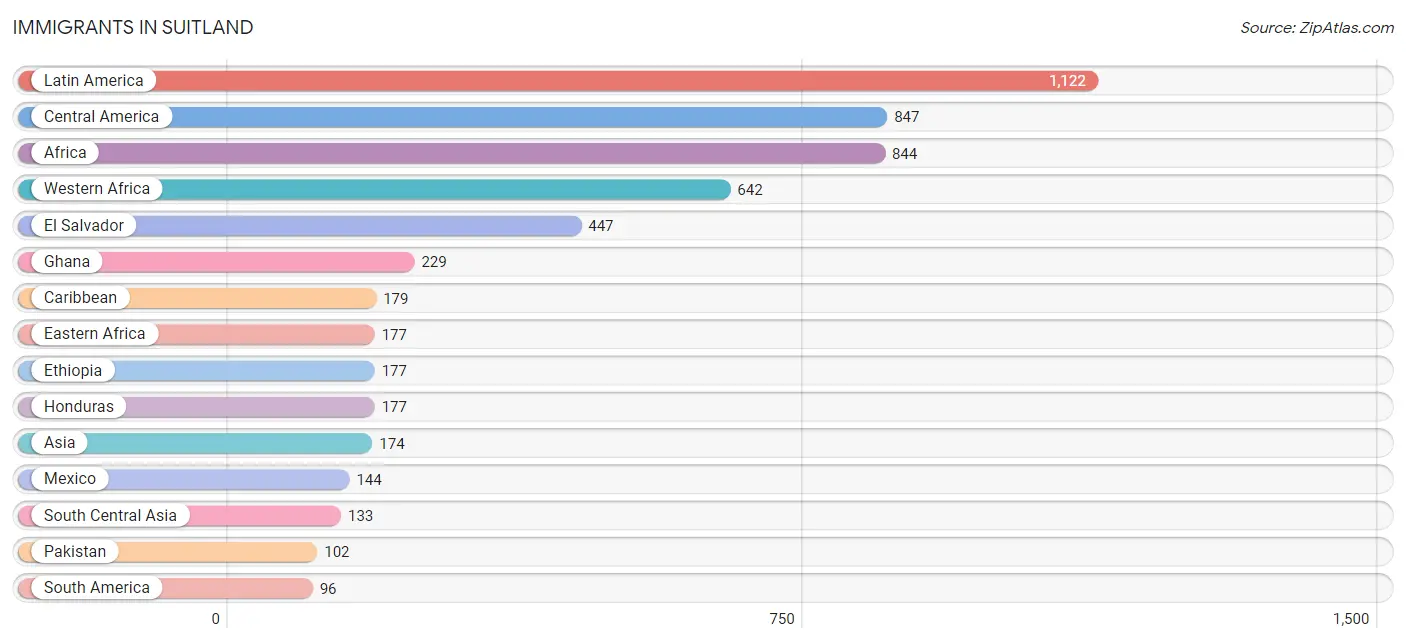
| Immigration Origin | # Population | % Population |
| Africa | 844 | 3.3% |
| Asia | 174 | 0.7% |
| Bangladesh | 22 | 0.1% |
| Barbados | 27 | 0.1% |
| Belgium | 1 | 0.0% |
| Caribbean | 179 | 0.7% |
| Central America | 847 | 3.3% |
| China | 4 | 0.0% |
| Dominican Republic | 24 | 0.1% |
| Eastern Africa | 177 | 0.7% |
| Eastern Asia | 4 | 0.0% |
| Eastern Europe | 1 | 0.0% |
| El Salvador | 447 | 1.7% |
| England | 78 | 0.3% |
| Ethiopia | 177 | 0.7% |
| Europe | 80 | 0.3% |
| Ghana | 229 | 0.9% |
| Guatemala | 71 | 0.3% |
| Guyana | 67 | 0.3% |
| Honduras | 177 | 0.7% |
| Iran | 9 | 0.0% |
| Jamaica | 54 | 0.2% |
| Latin America | 1,122 | 4.3% |
| Mexico | 144 | 0.6% |
| Northern Europe | 78 | 0.3% |
| Oceania | 13 | 0.1% |
| Pakistan | 102 | 0.4% |
| Panama | 8 | 0.0% |
| Peru | 14 | 0.1% |
| Philippines | 37 | 0.1% |
| Russia | 1 | 0.0% |
| Senegal | 81 | 0.3% |
| South America | 96 | 0.4% |
| South Central Asia | 133 | 0.5% |
| South Eastern Asia | 37 | 0.1% |
| Trinidad and Tobago | 23 | 0.1% |
| Venezuela | 15 | 0.1% |
| West Indies | 33 | 0.1% |
| Western Africa | 642 | 2.5% |
| Western Europe | 1 | 0.0% | View All 40 Rows |
Sex and Age in Suitland
Sex and Age in Suitland
The most populous age groups in Suitland are 30 to 34 Years (1,504 | 12.3%) for men and 25 to 29 Years (1,380 | 10.1%) for women.
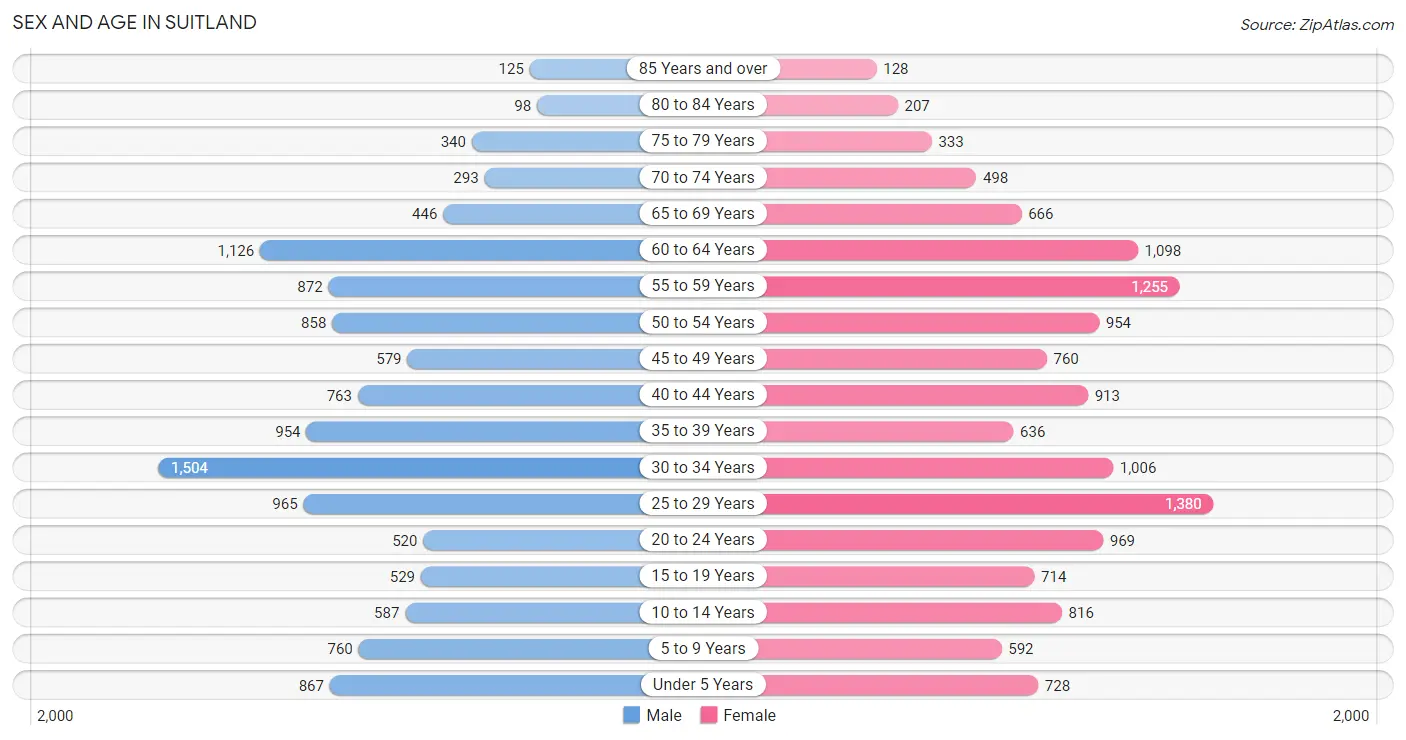
| Age Bracket | Male | Female |
| Under 5 Years | 867 (7.1%) | 728 (5.3%) |
| 5 to 9 Years | 760 (6.2%) | 592 (4.3%) |
| 10 to 14 Years | 587 (4.8%) | 816 (6.0%) |
| 15 to 19 Years | 529 (4.3%) | 714 (5.2%) |
| 20 to 24 Years | 520 (4.3%) | 969 (7.1%) |
| 25 to 29 Years | 965 (7.9%) | 1,380 (10.1%) |
| 30 to 34 Years | 1,504 (12.3%) | 1,006 (7.4%) |
| 35 to 39 Years | 954 (7.8%) | 636 (4.7%) |
| 40 to 44 Years | 763 (6.3%) | 913 (6.7%) |
| 45 to 49 Years | 579 (4.8%) | 760 (5.6%) |
| 50 to 54 Years | 858 (7.0%) | 954 (7.0%) |
| 55 to 59 Years | 872 (7.2%) | 1,255 (9.2%) |
| 60 to 64 Years | 1,126 (9.2%) | 1,098 (8.0%) |
| 65 to 69 Years | 446 (3.7%) | 666 (4.9%) |
| 70 to 74 Years | 293 (2.4%) | 498 (3.6%) |
| 75 to 79 Years | 340 (2.8%) | 333 (2.4%) |
| 80 to 84 Years | 98 (0.8%) | 207 (1.5%) |
| 85 Years and over | 125 (1.0%) | 128 (0.9%) |
| Total | 12,186 (100.0%) | 13,653 (100.0%) |
Families and Households in Suitland
Median Family Size in Suitland
The median family size in Suitland is 3.08 persons per family, with married-couple families (2,634 | 41.6%) accounting for the largest median family size of 3.19 persons per family. On the other hand, single male/father families (859 | 13.6%) represent the smallest median family size with 2.50 persons per family.
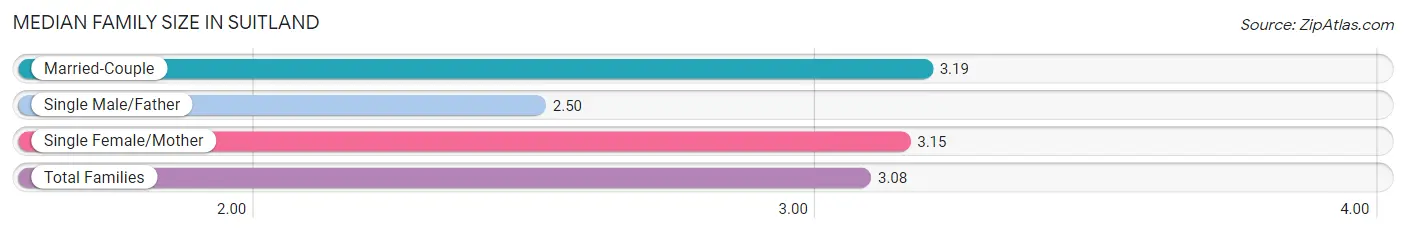
| Family Type | # Families | Family Size |
| Married-Couple | 2,634 (41.6%) | 3.19 |
| Single Male/Father | 859 (13.6%) | 2.50 |
| Single Female/Mother | 2,832 (44.8%) | 3.15 |
| Total Families | 6,325 (100.0%) | 3.08 |
Median Household Size in Suitland
The median household size in Suitland is 2.39 persons per household, with single female/mother households (2,832 | 26.2%) accounting for the largest median household size of 3.37 persons per household. non-family households (4,484 | 41.5%) represent the smallest median household size with 1.13 persons per household.
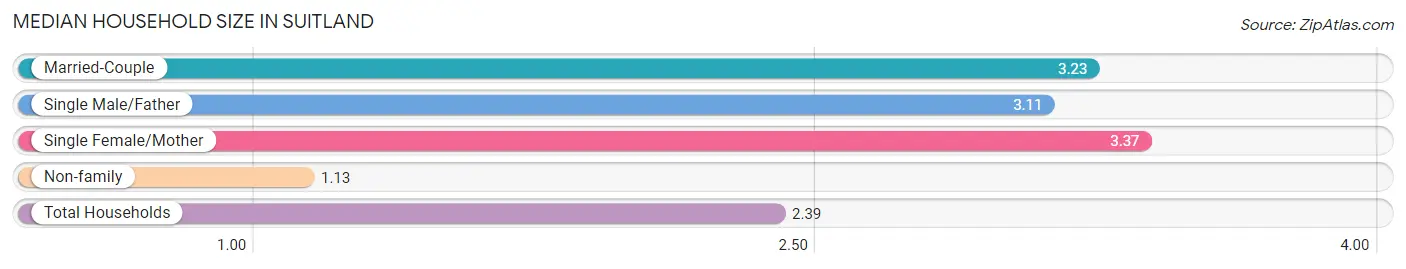
| Household Type | # Households | Household Size |
| Married-Couple | 2,634 (24.4%) | 3.23 |
| Single Male/Father | 859 (8.0%) | 3.11 |
| Single Female/Mother | 2,832 (26.2%) | 3.37 |
| Non-family | 4,484 (41.5%) | 1.13 |
| Total Households | 10,809 (100.0%) | 2.39 |
Household Size by Marriage Status in Suitland
Out of a total of 10,809 households in Suitland, 6,325 (58.5%) are family households, while 4,484 (41.5%) are nonfamily households. The most numerous type of family households are 2-person households, comprising 2,712, and the most common type of nonfamily households are 1-person households, comprising 3,987.
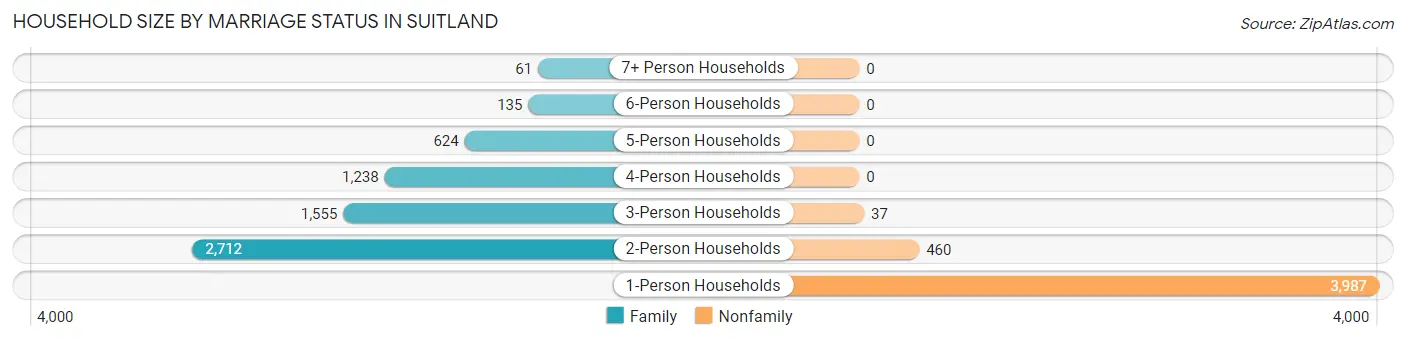
| Household Size | Family Households | Nonfamily Households |
| 1-Person Households | - | 3,987 (36.9%) |
| 2-Person Households | 2,712 (25.1%) | 460 (4.3%) |
| 3-Person Households | 1,555 (14.4%) | 37 (0.3%) |
| 4-Person Households | 1,238 (11.5%) | 0 (0.0%) |
| 5-Person Households | 624 (5.8%) | 0 (0.0%) |
| 6-Person Households | 135 (1.3%) | 0 (0.0%) |
| 7+ Person Households | 61 (0.6%) | 0 (0.0%) |
| Total | 6,325 (58.5%) | 4,484 (41.5%) |
Female Fertility in Suitland
Fertility by Age in Suitland
Average fertility rate in Suitland is 41.0 births per 1,000 women. Women in the age bracket of 20 to 34 years have the highest fertility rate with 71.0 births per 1,000 women. Women in the age bracket of 20 to 34 years acount for 88.5% of all women with births.
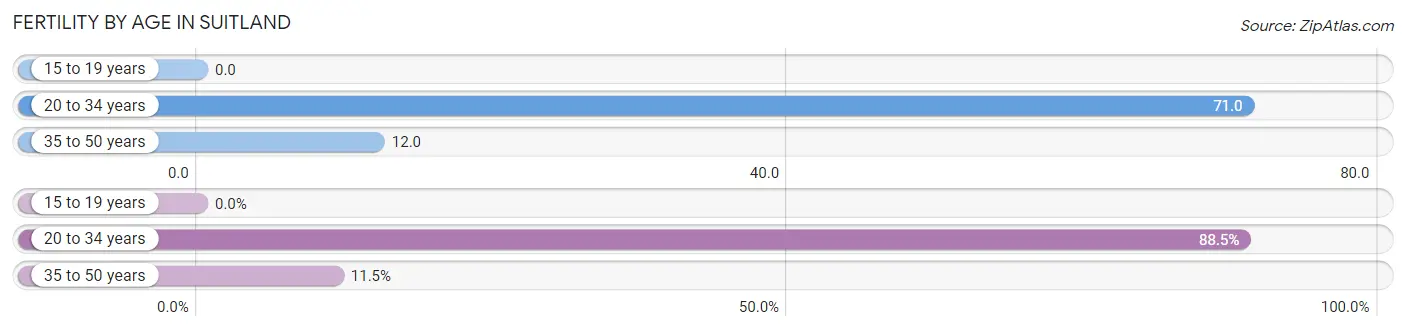
| Age Bracket | Women with Births | Births / 1,000 Women |
| 15 to 19 years | 0 (0.0%) | 0.0 |
| 20 to 34 years | 238 (88.5%) | 71.0 |
| 35 to 50 years | 31 (11.5%) | 12.0 |
| Total | 269 (100.0%) | 41.0 |
Fertility by Age by Marriage Status in Suitland
35.7% of women with births (269) in Suitland are married. The highest percentage of unmarried women with births falls into 20 to 34 years age bracket with 72.7% of them unmarried at the time of birth, while the lowest percentage of unmarried women with births belong to 35 to 50 years age bracket with 0.0% of them unmarried.
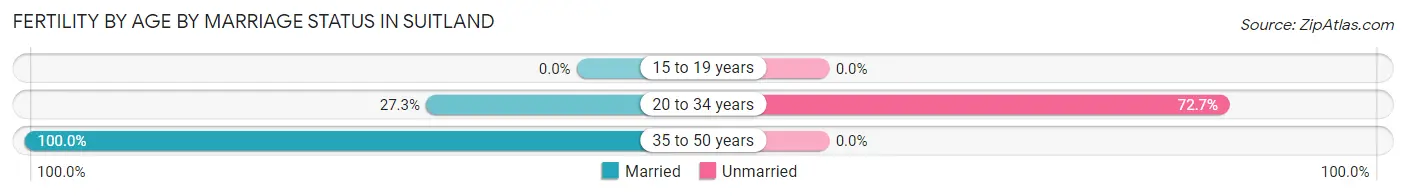
| Age Bracket | Married | Unmarried |
| 15 to 19 years | 0 (0.0%) | 0 (0.0%) |
| 20 to 34 years | 65 (27.3%) | 173 (72.7%) |
| 35 to 50 years | 31 (100.0%) | 0 (0.0%) |
| Total | 96 (35.7%) | 173 (64.3%) |
Fertility by Education in Suitland
Average fertility rate in Suitland is 41.0 births per 1,000 women. Women with the education attainment of graduate degree have the highest fertility rate of 105.0 births per 1,000 women, while women with the education attainment of less than high school have the lowest fertility at 16.0 births per 1,000 women. Women with the education attainment of high school diploma represent 32.7% of all women with births.
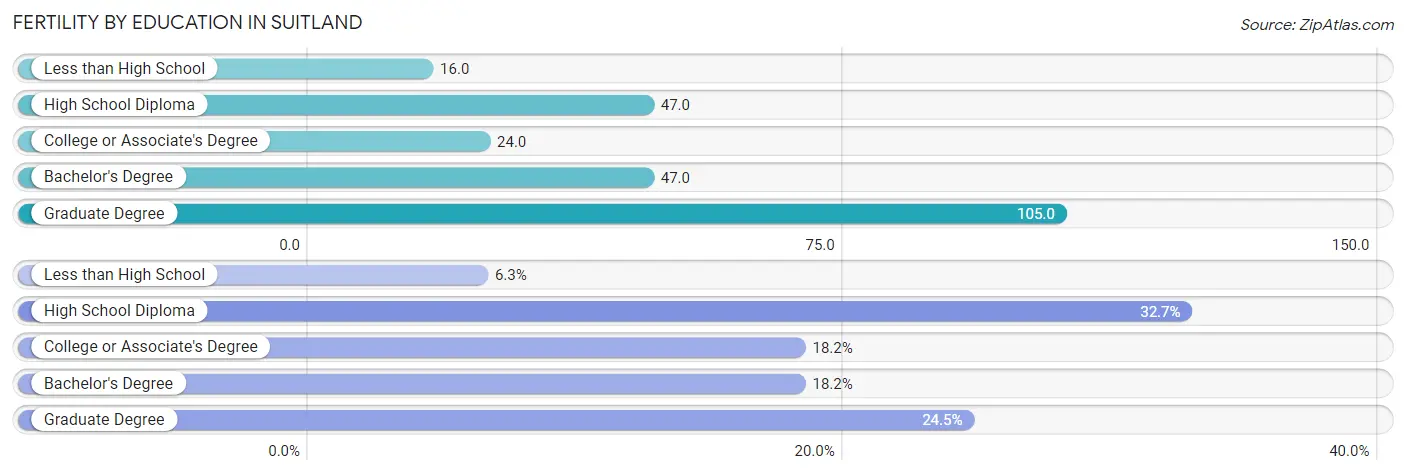
| Educational Attainment | Women with Births | Births / 1,000 Women |
| Less than High School | 17 (6.3%) | 16.0 |
| High School Diploma | 88 (32.7%) | 47.0 |
| College or Associate's Degree | 49 (18.2%) | 24.0 |
| Bachelor's Degree | 49 (18.2%) | 47.0 |
| Graduate Degree | 66 (24.5%) | 105.0 |
| Total | 269 (100.0%) | 41.0 |
Fertility by Education by Marriage Status in Suitland
64.3% of women with births in Suitland are unmarried. Women with the educational attainment of graduate degree are most likely to be married with 81.8% of them married at childbirth, while women with the educational attainment of less than high school are least likely to be married with 100.0% of them unmarried at childbirth.
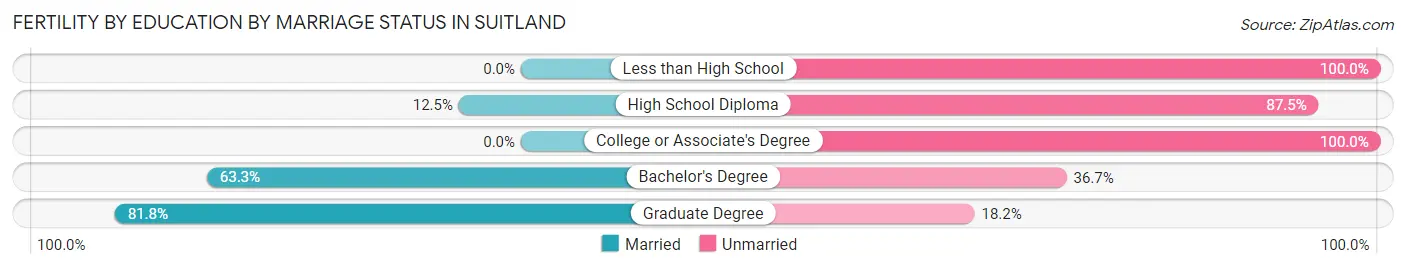
| Educational Attainment | Married | Unmarried |
| Less than High School | 0 (0.0%) | 17 (100.0%) |
| High School Diploma | 11 (12.5%) | 77 (87.5%) |
| College or Associate's Degree | 0 (0.0%) | 49 (100.0%) |
| Bachelor's Degree | 31 (63.3%) | 18 (36.7%) |
| Graduate Degree | 54 (81.8%) | 12 (18.2%) |
| Total | 96 (35.7%) | 173 (64.3%) |
Employment Characteristics in Suitland
Employment by Class of Employer in Suitland
Among the 13,626 employed individuals in Suitland, private company employees (7,839 | 57.5%), federal government employees (2,407 | 17.7%), and not-for-profit organizations (1,157 | 8.5%) make up the most common classes of employment.
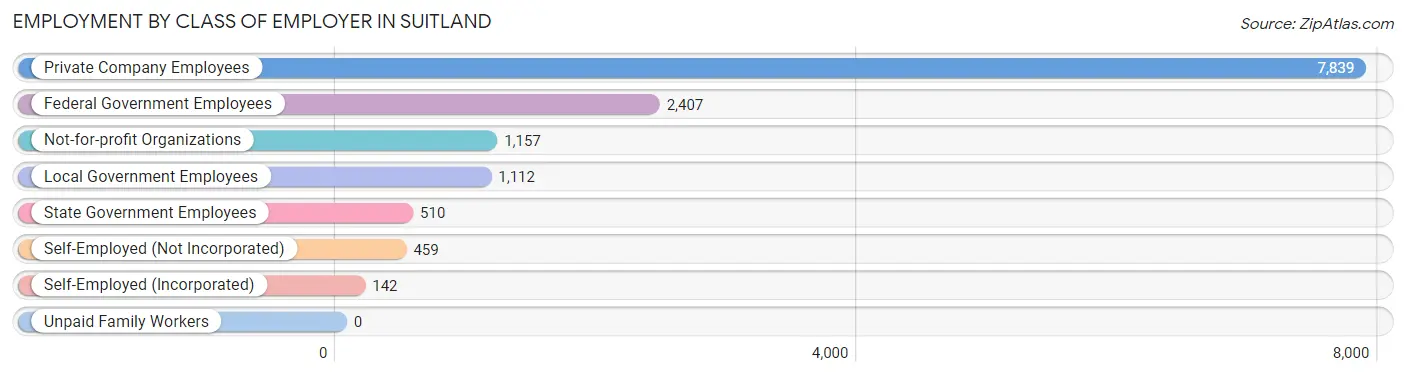
| Employer Class | # Employees | % Employees |
| Private Company Employees | 7,839 | 57.5% |
| Self-Employed (Incorporated) | 142 | 1.0% |
| Self-Employed (Not Incorporated) | 459 | 3.4% |
| Not-for-profit Organizations | 1,157 | 8.5% |
| Local Government Employees | 1,112 | 8.2% |
| State Government Employees | 510 | 3.7% |
| Federal Government Employees | 2,407 | 17.7% |
| Unpaid Family Workers | 0 | 0.0% |
| Total | 13,626 | 100.0% |
Employment Status by Age in Suitland
According to the labor force statistics for Suitland, out of the total population over 16 years of age (21,158), 70.7% or 14,959 individuals are in the labor force, with 7.3% or 1,092 of them unemployed. The age group with the highest labor force participation rate is 30 to 34 years, with 91.8% or 2,304 individuals in the labor force. Within the labor force, the 16 to 19 years age range has the highest percentage of unemployed individuals, with 40.9% or 94 of them being unemployed.
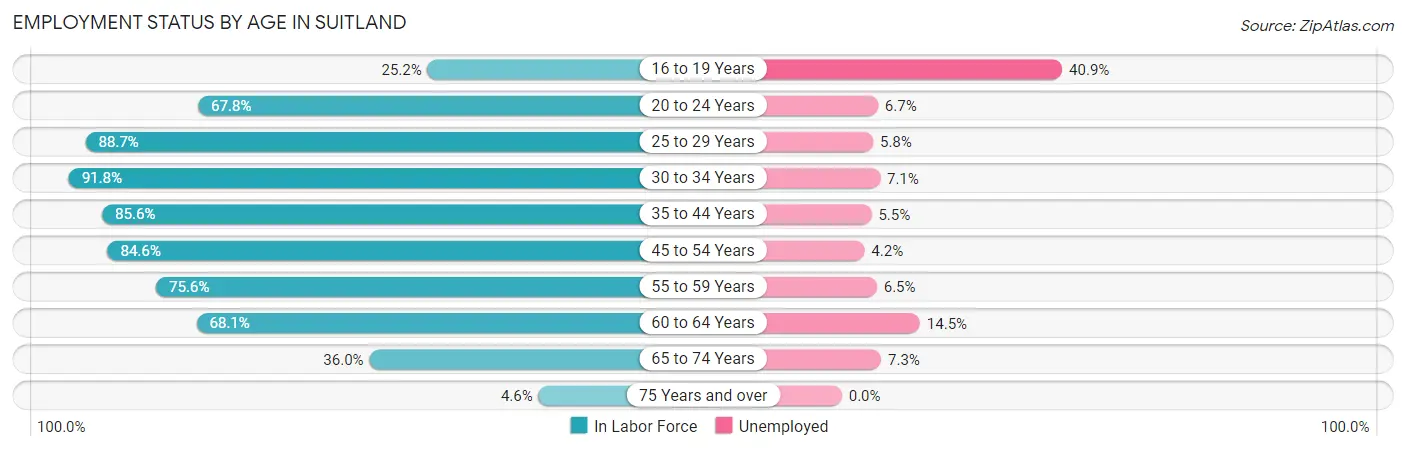
| Age Bracket | In Labor Force | Unemployed |
| 16 to 19 Years | 230 (25.2%) | 94 (40.9%) |
| 20 to 24 Years | 1,010 (67.8%) | 68 (6.7%) |
| 25 to 29 Years | 2,080 (88.7%) | 121 (5.8%) |
| 30 to 34 Years | 2,304 (91.8%) | 164 (7.1%) |
| 35 to 44 Years | 2,796 (85.6%) | 154 (5.5%) |
| 45 to 54 Years | 2,666 (84.6%) | 112 (4.2%) |
| 55 to 59 Years | 1,608 (75.6%) | 105 (6.5%) |
| 60 to 64 Years | 1,515 (68.1%) | 220 (14.5%) |
| 65 to 74 Years | 685 (36.0%) | 50 (7.3%) |
| 75 Years and over | 57 (4.6%) | 0 (0.0%) |
| Total | 14,959 (70.7%) | 1,092 (7.3%) |
Employment Status by Educational Attainment in Suitland
According to labor force statistics for Suitland, 83.0% of individuals (12,967) out of the total population between 25 and 64 years of age (15,623) are in the labor force, with 6.7% or 869 of them being unemployed. The group with the highest labor force participation rate are those with the educational attainment of bachelor's degree or higher, with 93.2% or 3,207 individuals in the labor force. Within the labor force, individuals with college / associate degree education have the highest percentage of unemployment, with 8.6% or 375 of them being unemployed.
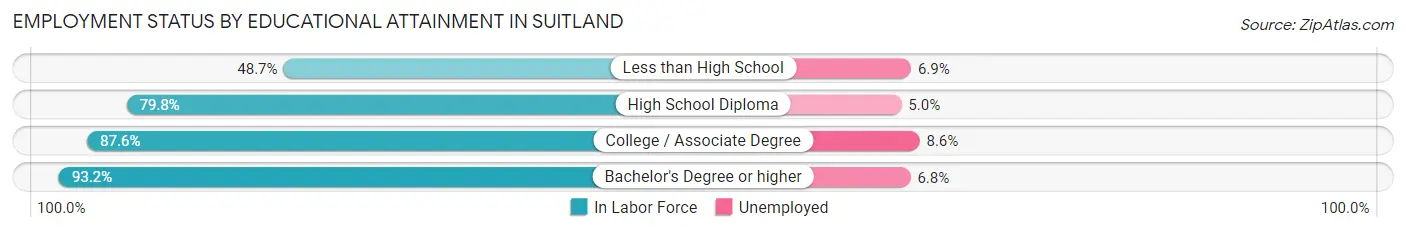
| Educational Attainment | In Labor Force | Unemployed |
| Less than High School | 552 (48.7%) | 78 (6.9%) |
| High School Diploma | 4,843 (79.8%) | 303 (5.0%) |
| College / Associate Degree | 4,362 (87.6%) | 428 (8.6%) |
| Bachelor's Degree or higher | 3,207 (93.2%) | 234 (6.8%) |
| Total | 12,967 (83.0%) | 1,047 (6.7%) |
Employment Occupations by Sex in Suitland
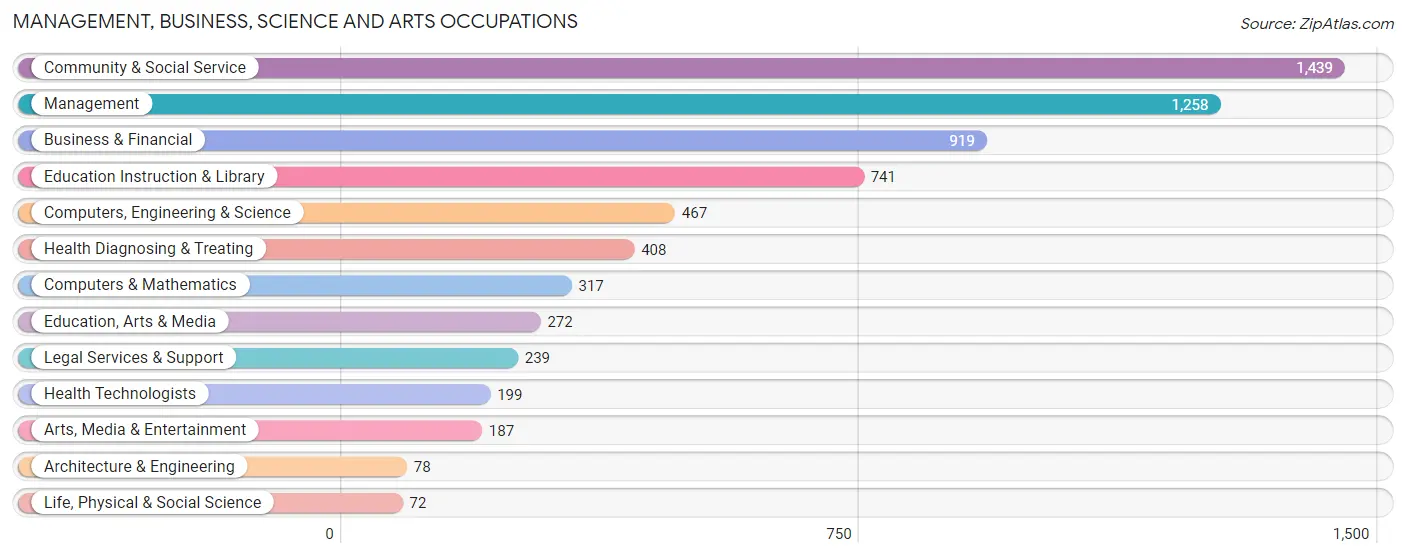
Management, Business, Science and Arts Occupations
The most common Management, Business, Science and Arts occupations in Suitland are Community & Social Service (1,439 | 10.4%), Management (1,258 | 9.1%), Business & Financial (919 | 6.6%), Education Instruction & Library (741 | 5.3%), and Computers, Engineering & Science (467 | 3.4%).
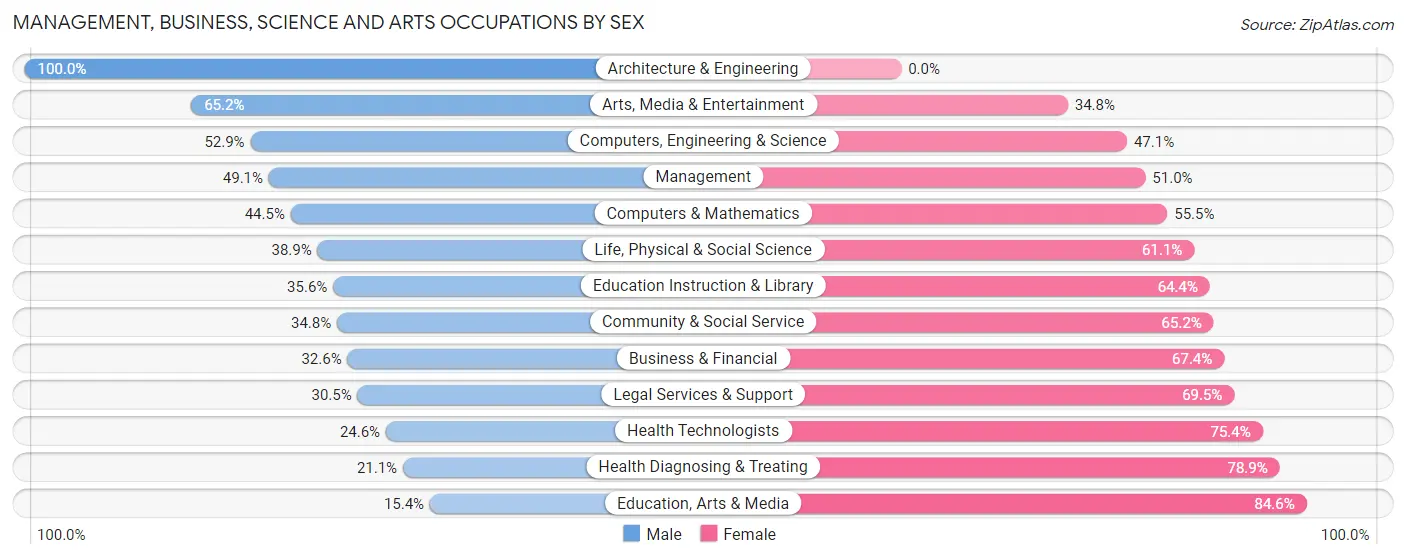
Management, Business, Science and Arts Occupations by Sex
Within the Management, Business, Science and Arts occupations in Suitland, the most male-oriented occupations are Architecture & Engineering (100.0%), Arts, Media & Entertainment (65.2%), and Computers, Engineering & Science (52.9%), while the most female-oriented occupations are Education, Arts & Media (84.6%), Health Diagnosing & Treating (78.9%), and Health Technologists (75.4%).
| Occupation | Male | Female |
| Management | 617 (49.0%) | 641 (50.9%) |
| Business & Financial | 300 (32.6%) | 619 (67.4%) |
| Computers, Engineering & Science | 247 (52.9%) | 220 (47.1%) |
| Computers & Mathematics | 141 (44.5%) | 176 (55.5%) |
| Architecture & Engineering | 78 (100.0%) | 0 (0.0%) |
| Life, Physical & Social Science | 28 (38.9%) | 44 (61.1%) |
| Community & Social Service | 501 (34.8%) | 938 (65.2%) |
| Education, Arts & Media | 42 (15.4%) | 230 (84.6%) |
| Legal Services & Support | 73 (30.5%) | 166 (69.5%) |
| Education Instruction & Library | 264 (35.6%) | 477 (64.4%) |
| Arts, Media & Entertainment | 122 (65.2%) | 65 (34.8%) |
| Health Diagnosing & Treating | 86 (21.1%) | 322 (78.9%) |
| Health Technologists | 49 (24.6%) | 150 (75.4%) |
| Total (Category) | 1,751 (39.0%) | 2,740 (61.0%) |
| Total (Overall) | 6,681 (48.2%) | 7,178 (51.8%) |
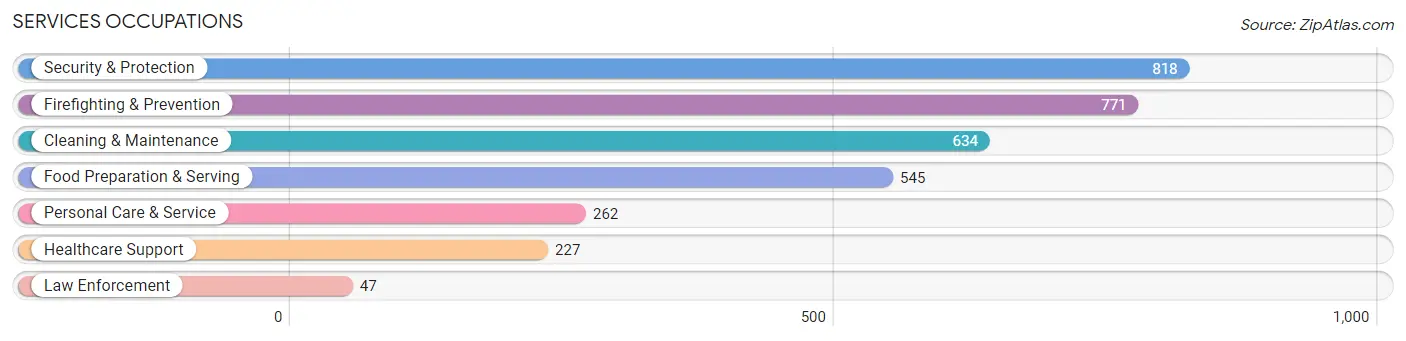
Services Occupations
The most common Services occupations in Suitland are Security & Protection (818 | 5.9%), Firefighting & Prevention (771 | 5.6%), Cleaning & Maintenance (634 | 4.6%), Food Preparation & Serving (545 | 3.9%), and Personal Care & Service (262 | 1.9%).
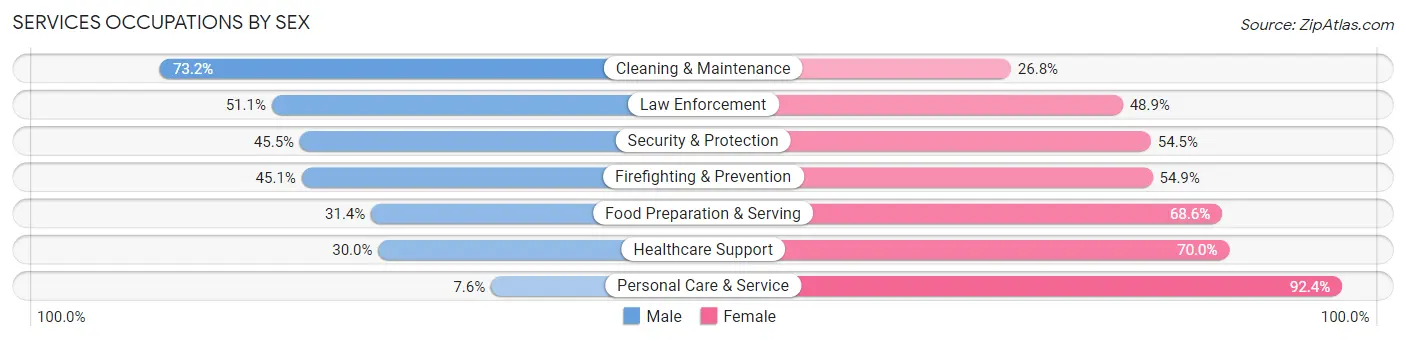
Services Occupations by Sex
Within the Services occupations in Suitland, the most male-oriented occupations are Cleaning & Maintenance (73.2%), Law Enforcement (51.1%), and Security & Protection (45.5%), while the most female-oriented occupations are Personal Care & Service (92.4%), Healthcare Support (70.0%), and Food Preparation & Serving (68.6%).
| Occupation | Male | Female |
| Healthcare Support | 68 (30.0%) | 159 (70.0%) |
| Security & Protection | 372 (45.5%) | 446 (54.5%) |
| Firefighting & Prevention | 348 (45.1%) | 423 (54.9%) |
| Law Enforcement | 24 (51.1%) | 23 (48.9%) |
| Food Preparation & Serving | 171 (31.4%) | 374 (68.6%) |
| Cleaning & Maintenance | 464 (73.2%) | 170 (26.8%) |
| Personal Care & Service | 20 (7.6%) | 242 (92.4%) |
| Total (Category) | 1,095 (44.1%) | 1,391 (55.9%) |
| Total (Overall) | 6,681 (48.2%) | 7,178 (51.8%) |
Sales and Office Occupations
The most common Sales and Office occupations in Suitland are Office & Administration (2,426 | 17.5%), and Sales & Related (1,400 | 10.1%).
Sales and Office Occupations by Sex
| Occupation | Male | Female |
| Sales & Related | 630 (45.0%) | 770 (55.0%) |
| Office & Administration | 727 (30.0%) | 1,699 (70.0%) |
| Total (Category) | 1,357 (35.5%) | 2,469 (64.5%) |
| Total (Overall) | 6,681 (48.2%) | 7,178 (51.8%) |
Natural Resources, Construction and Maintenance Occupations
The most common Natural Resources, Construction and Maintenance occupations in Suitland are Construction & Extraction (556 | 4.0%), and Installation, Maintenance & Repair (450 | 3.3%).
Natural Resources, Construction and Maintenance Occupations by Sex
| Occupation | Male | Female |
| Farming, Fishing & Forestry | 0 (0.0%) | 0 (0.0%) |
| Construction & Extraction | 497 (89.4%) | 59 (10.6%) |
| Installation, Maintenance & Repair | 424 (94.2%) | 26 (5.8%) |
| Total (Category) | 921 (91.5%) | 85 (8.5%) |
| Total (Overall) | 6,681 (48.2%) | 7,178 (51.8%) |
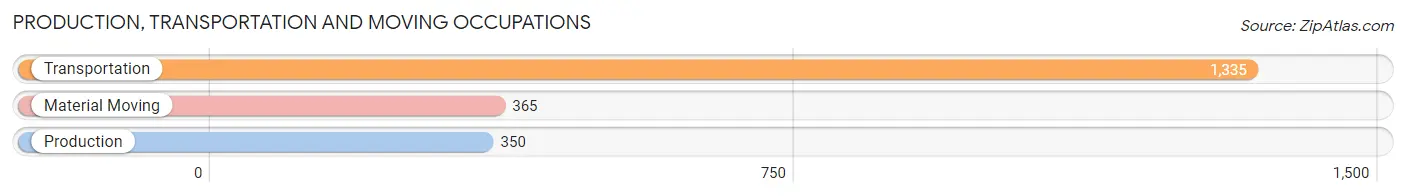
Production, Transportation and Moving Occupations
The most common Production, Transportation and Moving occupations in Suitland are Transportation (1,335 | 9.6%), Material Moving (365 | 2.6%), and Production (350 | 2.5%).
Production, Transportation and Moving Occupations by Sex
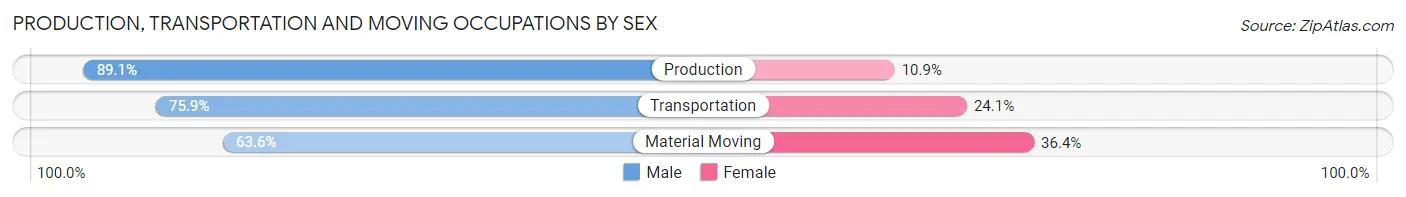
| Occupation | Male | Female |
| Production | 312 (89.1%) | 38 (10.9%) |
| Transportation | 1,013 (75.9%) | 322 (24.1%) |
| Material Moving | 232 (63.6%) | 133 (36.4%) |
| Total (Category) | 1,557 (75.9%) | 493 (24.0%) |
| Total (Overall) | 6,681 (48.2%) | 7,178 (51.8%) |
Employment Industries by Sex in Suitland
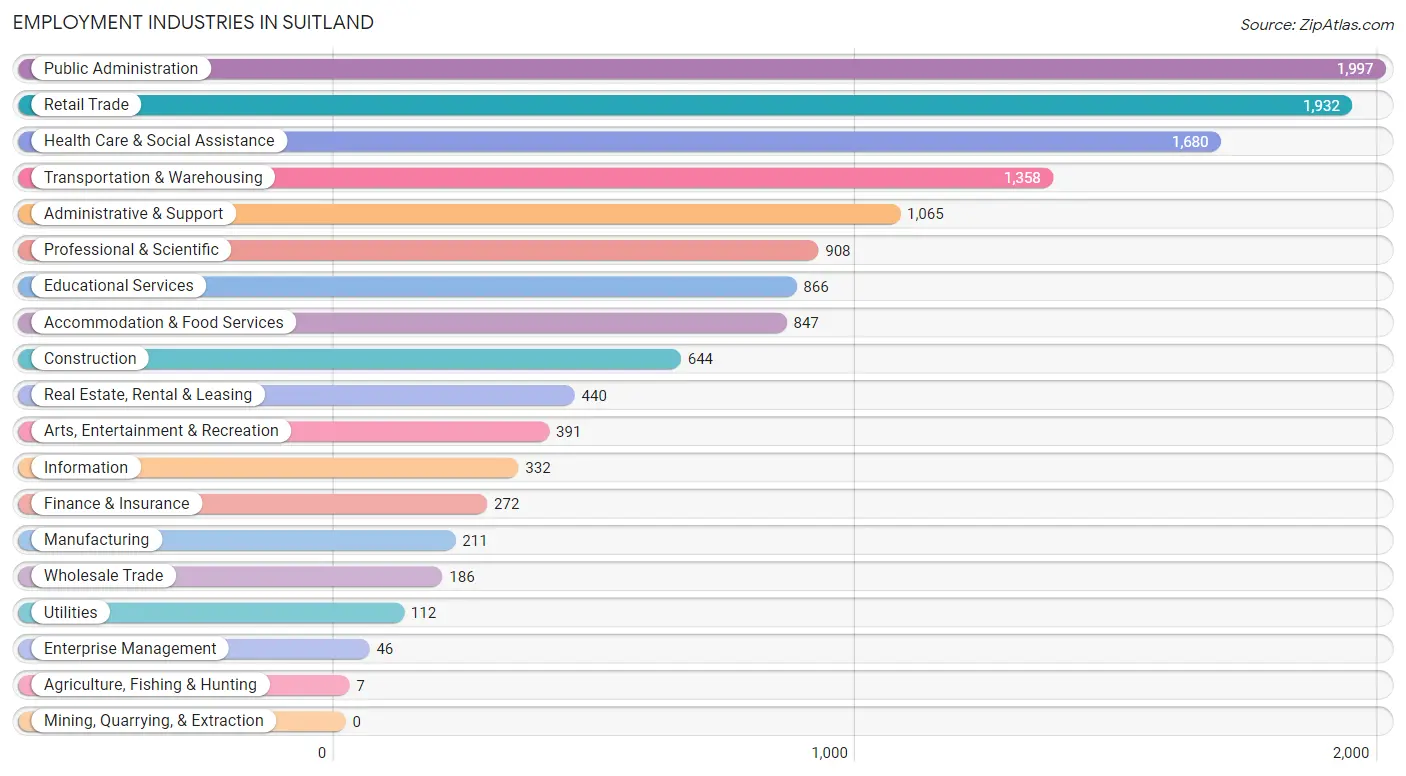
Employment Industries in Suitland
The major employment industries in Suitland include Public Administration (1,997 | 14.4%), Retail Trade (1,932 | 13.9%), Health Care & Social Assistance (1,680 | 12.1%), Transportation & Warehousing (1,358 | 9.8%), and Administrative & Support (1,065 | 7.7%).
Employment Industries by Sex in Suitland
The Suitland industries that see more men than women are Enterprise Management (100.0%), Wholesale Trade (94.1%), and Construction (82.5%), whereas the industries that tend to have a higher number of women are Agriculture, Fishing & Hunting (100.0%), Health Care & Social Assistance (75.8%), and Educational Services (69.6%).
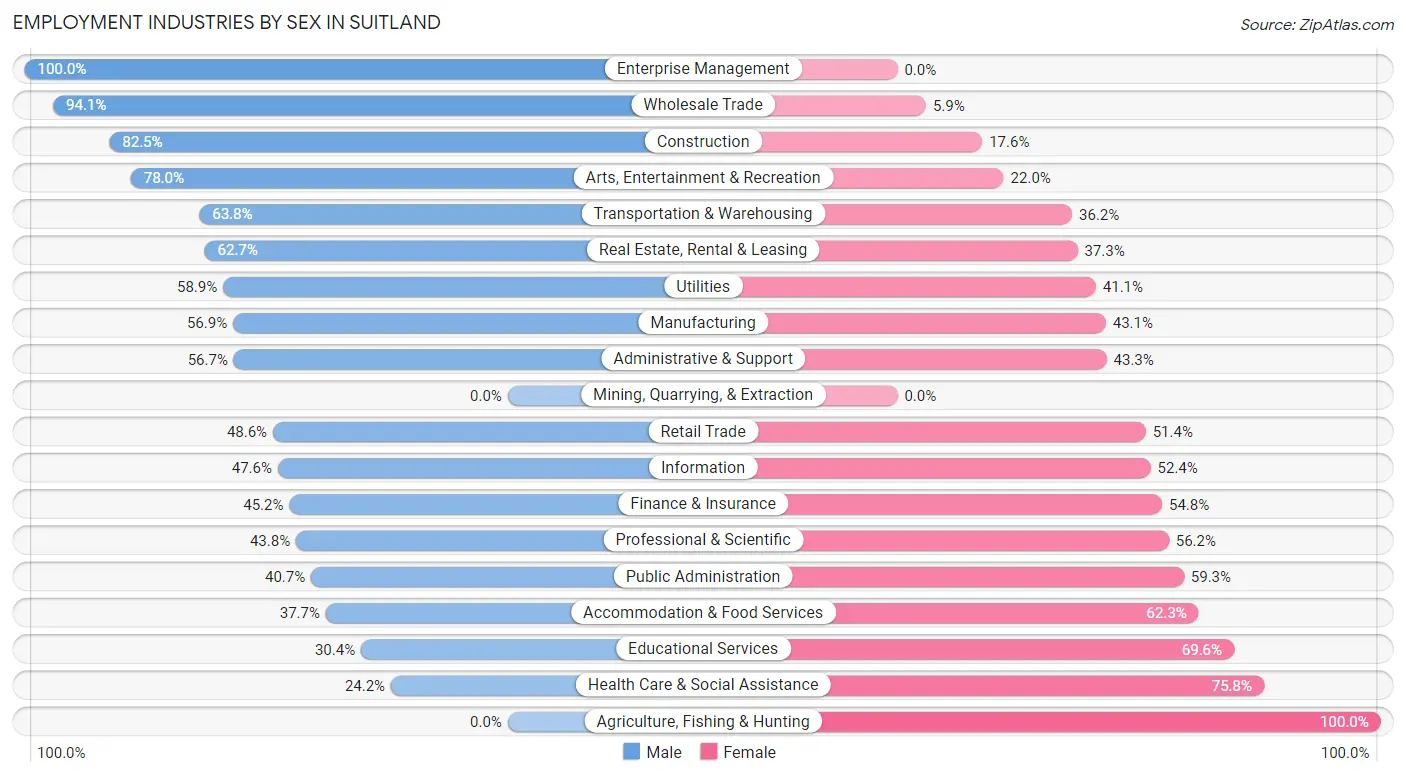
| Industry | Male | Female |
| Agriculture, Fishing & Hunting | 0 (0.0%) | 7 (100.0%) |
| Mining, Quarrying, & Extraction | 0 (0.0%) | 0 (0.0%) |
| Construction | 531 (82.5%) | 113 (17.5%) |
| Manufacturing | 120 (56.9%) | 91 (43.1%) |
| Wholesale Trade | 175 (94.1%) | 11 (5.9%) |
| Retail Trade | 939 (48.6%) | 993 (51.4%) |
| Transportation & Warehousing | 867 (63.8%) | 491 (36.2%) |
| Utilities | 66 (58.9%) | 46 (41.1%) |
| Information | 158 (47.6%) | 174 (52.4%) |
| Finance & Insurance | 123 (45.2%) | 149 (54.8%) |
| Real Estate, Rental & Leasing | 276 (62.7%) | 164 (37.3%) |
| Professional & Scientific | 398 (43.8%) | 510 (56.2%) |
| Enterprise Management | 46 (100.0%) | 0 (0.0%) |
| Administrative & Support | 604 (56.7%) | 461 (43.3%) |
| Educational Services | 263 (30.4%) | 603 (69.6%) |
| Health Care & Social Assistance | 406 (24.2%) | 1,274 (75.8%) |
| Arts, Entertainment & Recreation | 305 (78.0%) | 86 (22.0%) |
| Accommodation & Food Services | 319 (37.7%) | 528 (62.3%) |
| Public Administration | 813 (40.7%) | 1,184 (59.3%) |
| Total | 6,681 (48.2%) | 7,178 (51.8%) |
Education in Suitland
School Enrollment in Suitland
The most common levels of schooling among the 5,386 students in Suitland are middle school (1,215 | 22.6%), elementary school (1,082 | 20.1%), and college / undergraduate (1,056 | 19.6%).
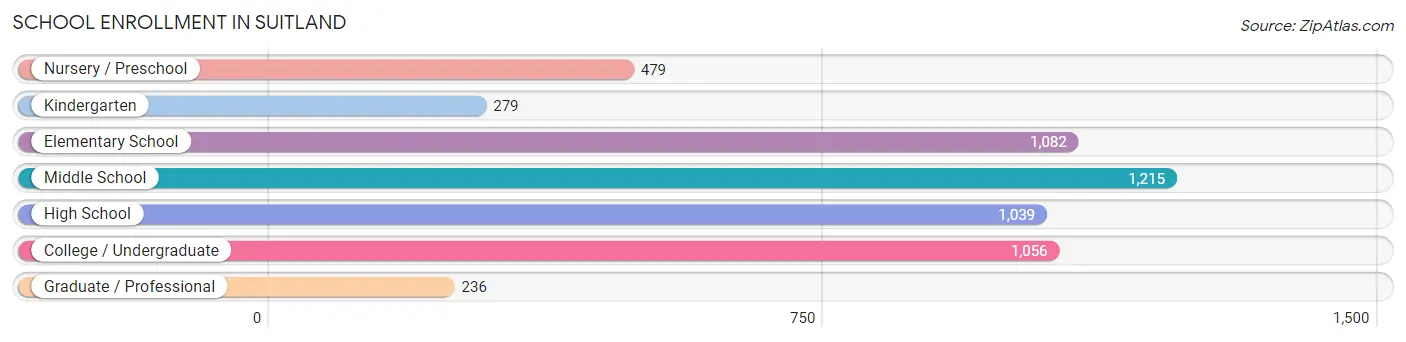
| School Level | # Students | % Students |
| Nursery / Preschool | 479 | 8.9% |
| Kindergarten | 279 | 5.2% |
| Elementary School | 1,082 | 20.1% |
| Middle School | 1,215 | 22.6% |
| High School | 1,039 | 19.3% |
| College / Undergraduate | 1,056 | 19.6% |
| Graduate / Professional | 236 | 4.4% |
| Total | 5,386 | 100.0% |
School Enrollment by Age by Funding Source in Suitland
Out of a total of 5,386 students who are enrolled in schools in Suitland, 560 (10.4%) attend a private institution, while the remaining 4,826 (89.6%) are enrolled in public schools. The age group of 35 years and over has the highest likelihood of being enrolled in private schools, with 109 (29.5% in the age bracket) enrolled. Conversely, the age group of 25 to 34 year olds has the lowest likelihood of being enrolled in a private school, with 481 (98.0% in the age bracket) attending a public institution.
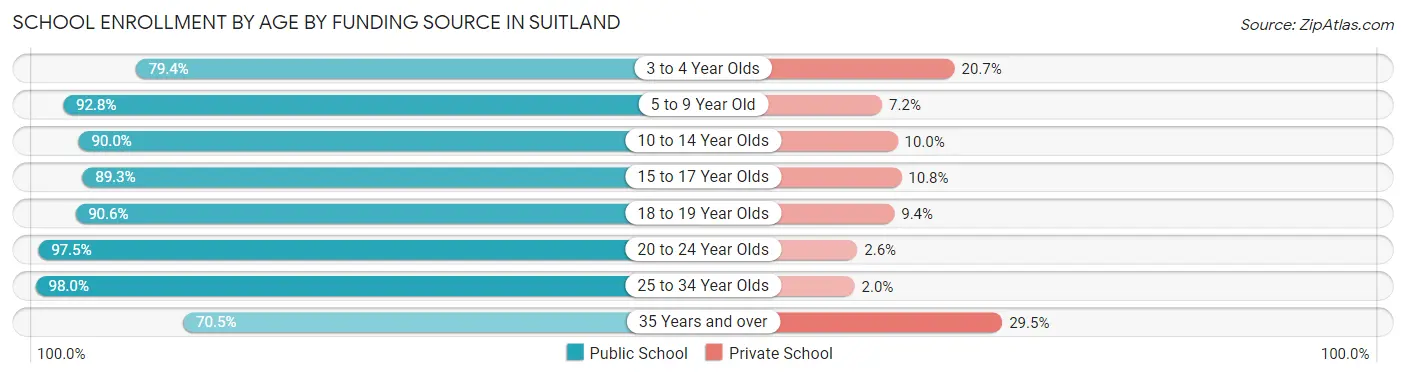
| Age Bracket | Public School | Private School |
| 3 to 4 Year Olds | 315 (79.3%) | 82 (20.6%) |
| 5 to 9 Year Old | 1,217 (92.8%) | 94 (7.2%) |
| 10 to 14 Year Olds | 1,254 (90.0%) | 140 (10.0%) |
| 15 to 17 Year Olds | 714 (89.2%) | 86 (10.7%) |
| 18 to 19 Year Olds | 317 (90.6%) | 33 (9.4%) |
| 20 to 24 Year Olds | 267 (97.5%) | 7 (2.5%) |
| 25 to 34 Year Olds | 481 (98.0%) | 10 (2.0%) |
| 35 Years and over | 260 (70.5%) | 109 (29.5%) |
| Total | 4,826 (89.6%) | 560 (10.4%) |
Educational Attainment by Field of Study in Suitland
Business (1,130 | 26.1%), arts & humanities (583 | 13.5%), psychology (367 | 8.5%), science & technology (367 | 8.5%), and education (358 | 8.3%) are the most common fields of study among 4,335 individuals in Suitland who have obtained a bachelor's degree or higher.
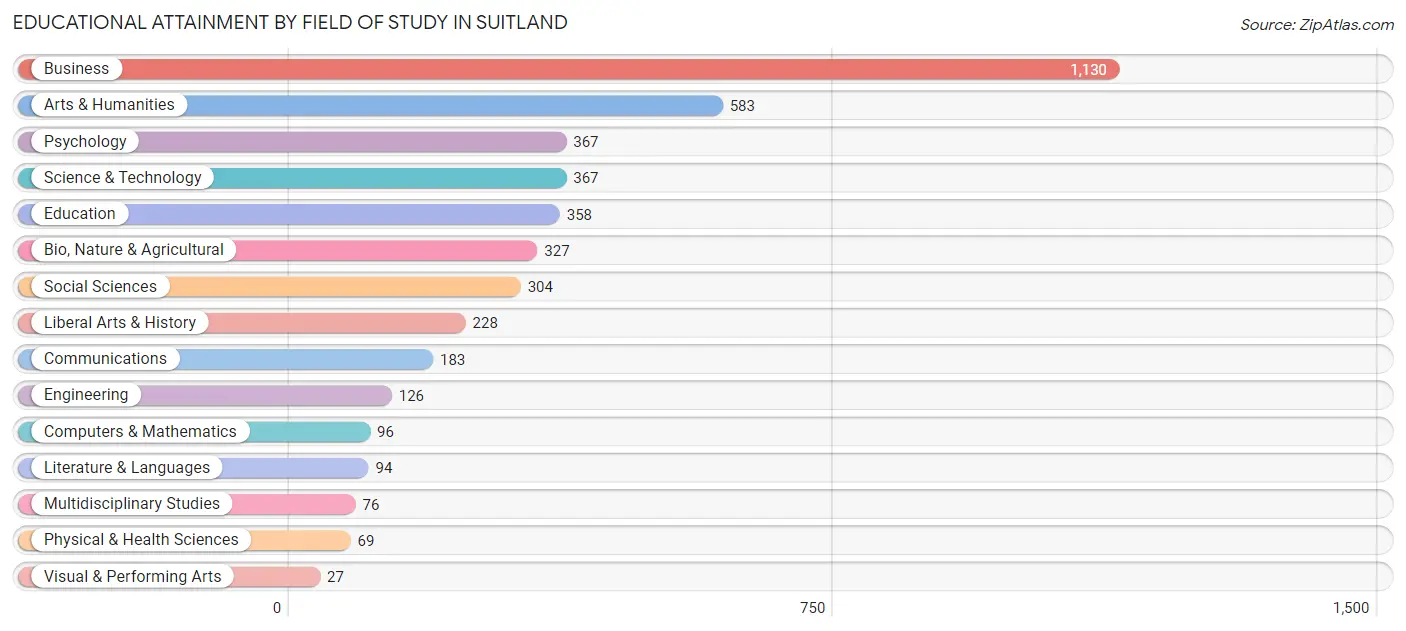
| Field of Study | # Graduates | % Graduates |
| Computers & Mathematics | 96 | 2.2% |
| Bio, Nature & Agricultural | 327 | 7.5% |
| Physical & Health Sciences | 69 | 1.6% |
| Psychology | 367 | 8.5% |
| Social Sciences | 304 | 7.0% |
| Engineering | 126 | 2.9% |
| Multidisciplinary Studies | 76 | 1.8% |
| Science & Technology | 367 | 8.5% |
| Business | 1,130 | 26.1% |
| Education | 358 | 8.3% |
| Literature & Languages | 94 | 2.2% |
| Liberal Arts & History | 228 | 5.3% |
| Visual & Performing Arts | 27 | 0.6% |
| Communications | 183 | 4.2% |
| Arts & Humanities | 583 | 13.5% |
| Total | 4,335 | 100.0% |
Transportation & Commute in Suitland
Vehicle Availability by Sex in Suitland
The most prevalent vehicle ownership categories in Suitland are males with 1 vehicle (2,736, accounting for 41.7%) and females with 1 vehicle (3,169, making up 38.7%).
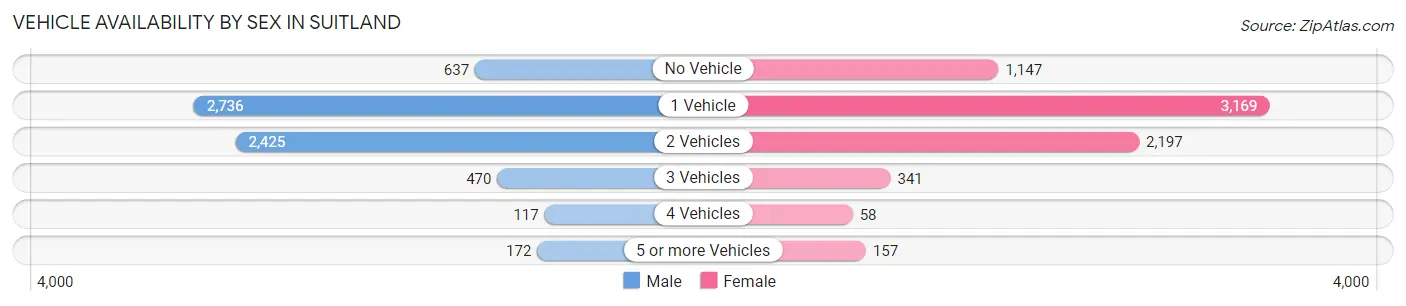
| Vehicles Available | Male | Female |
| No Vehicle | 637 (9.7%) | 1,147 (16.2%) |
| 1 Vehicle | 2,736 (41.7%) | 3,169 (44.8%) |
| 2 Vehicles | 2,425 (37.0%) | 2,197 (31.1%) |
| 3 Vehicles | 470 (7.2%) | 341 (4.8%) |
| 4 Vehicles | 117 (1.8%) | 58 (0.8%) |
| 5 or more Vehicles | 172 (2.6%) | 157 (2.2%) |
| Total | 6,557 (100.0%) | 7,069 (100.0%) |
Commute Time in Suitland
The most frequently occuring commute durations in Suitland are 30 to 34 minutes (2,316 commuters, 19.6%), 45 to 59 minutes (1,975 commuters, 16.7%), and 20 to 24 minutes (1,446 commuters, 12.2%).
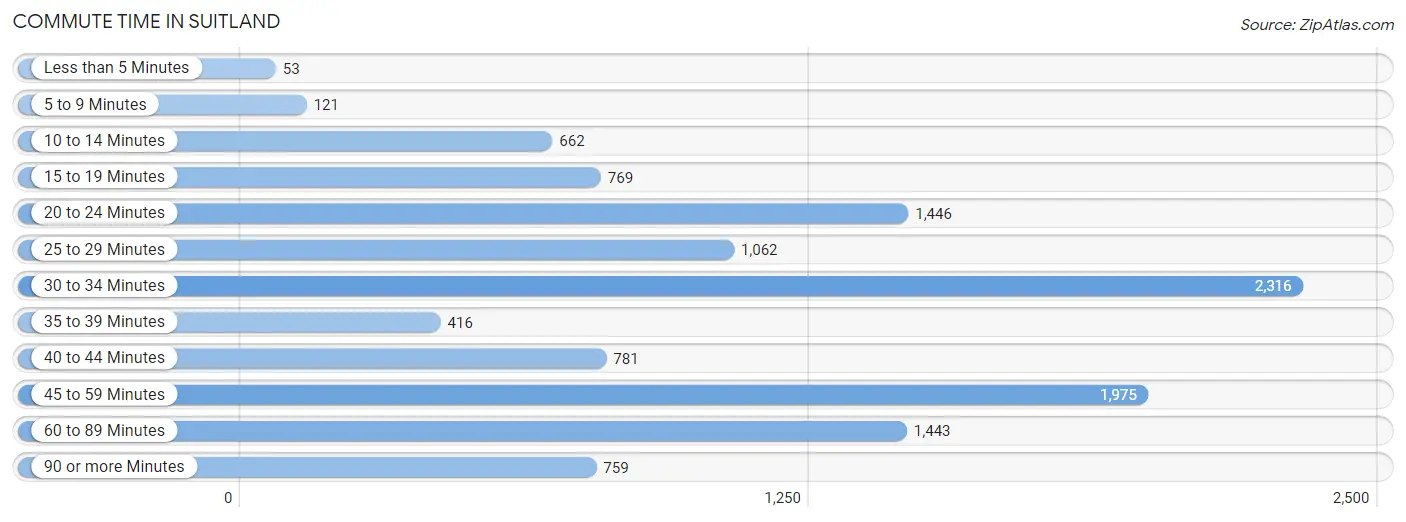
| Commute Time | # Commuters | % Commuters |
| Less than 5 Minutes | 53 | 0.4% |
| 5 to 9 Minutes | 121 | 1.0% |
| 10 to 14 Minutes | 662 | 5.6% |
| 15 to 19 Minutes | 769 | 6.5% |
| 20 to 24 Minutes | 1,446 | 12.2% |
| 25 to 29 Minutes | 1,062 | 9.0% |
| 30 to 34 Minutes | 2,316 | 19.6% |
| 35 to 39 Minutes | 416 | 3.5% |
| 40 to 44 Minutes | 781 | 6.6% |
| 45 to 59 Minutes | 1,975 | 16.7% |
| 60 to 89 Minutes | 1,443 | 12.2% |
| 90 or more Minutes | 759 | 6.4% |
Commute Time by Sex in Suitland
The most common commute times in Suitland are 30 to 34 minutes (1,279 commuters, 22.1%) for males and 30 to 34 minutes (1,037 commuters, 17.3%) for females.
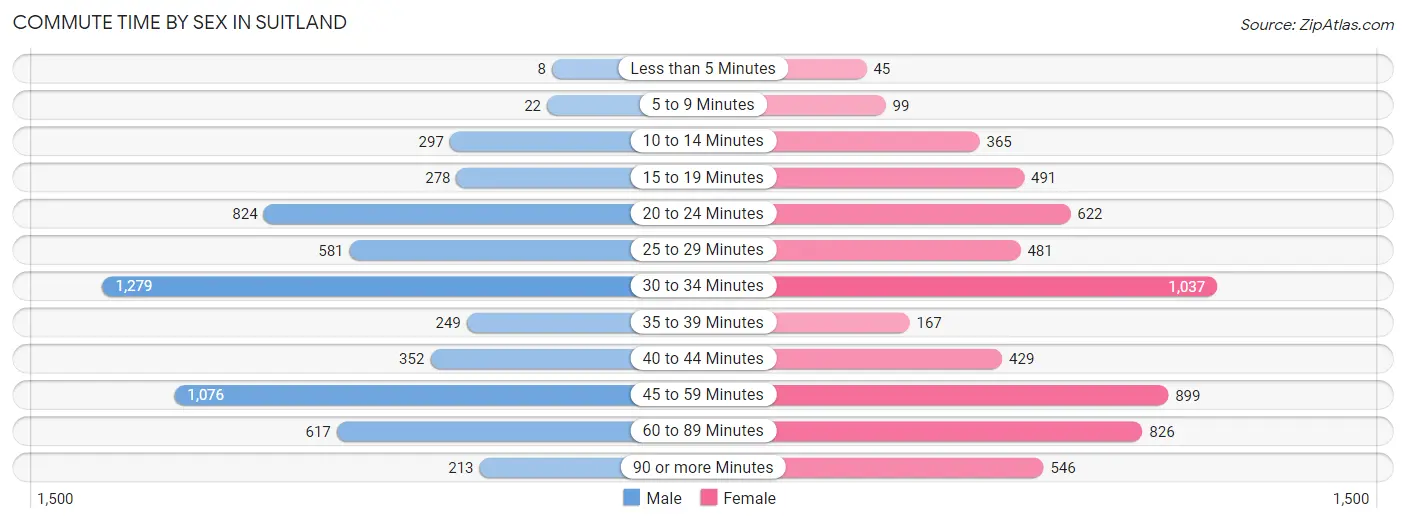
| Commute Time | Male | Female |
| Less than 5 Minutes | 8 (0.1%) | 45 (0.7%) |
| 5 to 9 Minutes | 22 (0.4%) | 99 (1.7%) |
| 10 to 14 Minutes | 297 (5.1%) | 365 (6.1%) |
| 15 to 19 Minutes | 278 (4.8%) | 491 (8.2%) |
| 20 to 24 Minutes | 824 (14.2%) | 622 (10.3%) |
| 25 to 29 Minutes | 581 (10.0%) | 481 (8.0%) |
| 30 to 34 Minutes | 1,279 (22.1%) | 1,037 (17.3%) |
| 35 to 39 Minutes | 249 (4.3%) | 167 (2.8%) |
| 40 to 44 Minutes | 352 (6.1%) | 429 (7.1%) |
| 45 to 59 Minutes | 1,076 (18.6%) | 899 (15.0%) |
| 60 to 89 Minutes | 617 (10.6%) | 826 (13.8%) |
| 90 or more Minutes | 213 (3.7%) | 546 (9.1%) |
Time of Departure to Work by Sex in Suitland
The most frequent times of departure to work in Suitland are 12:00 AM to 4:59 AM (774, 13.4%) for males and 8:00 AM to 8:29 AM (1,160, 19.3%) for females.
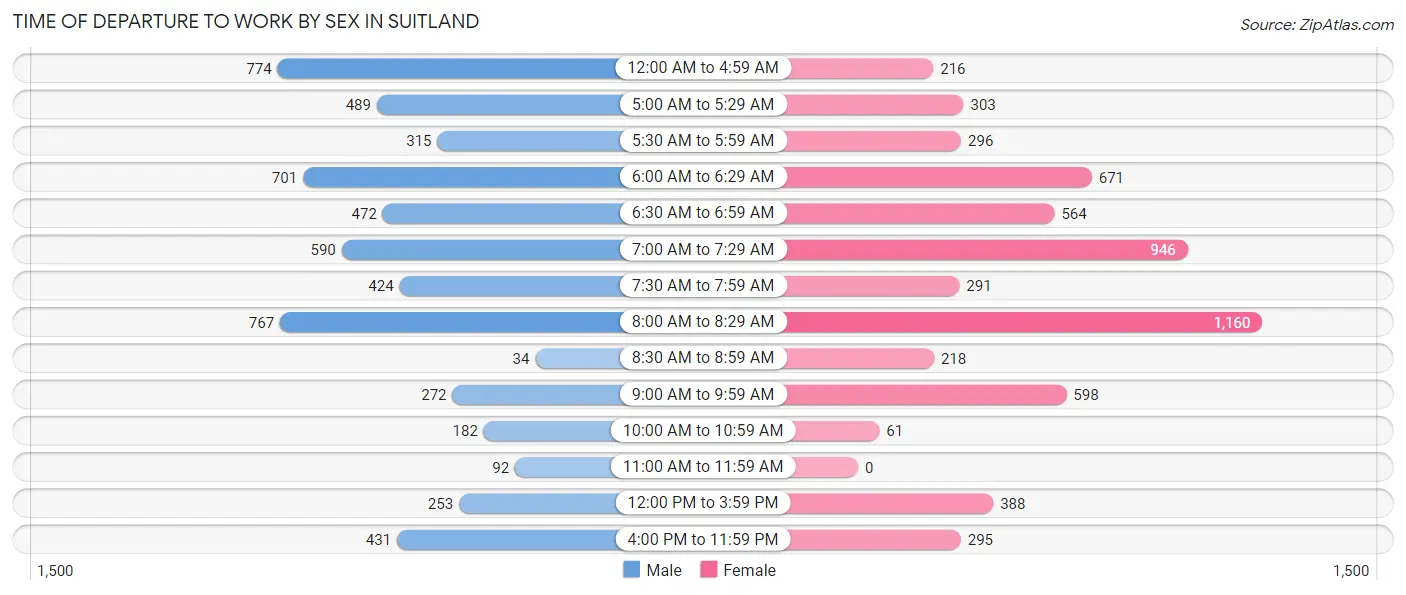
| Time of Departure | Male | Female |
| 12:00 AM to 4:59 AM | 774 (13.4%) | 216 (3.6%) |
| 5:00 AM to 5:29 AM | 489 (8.4%) | 303 (5.0%) |
| 5:30 AM to 5:59 AM | 315 (5.4%) | 296 (4.9%) |
| 6:00 AM to 6:29 AM | 701 (12.1%) | 671 (11.2%) |
| 6:30 AM to 6:59 AM | 472 (8.1%) | 564 (9.4%) |
| 7:00 AM to 7:29 AM | 590 (10.2%) | 946 (15.8%) |
| 7:30 AM to 7:59 AM | 424 (7.3%) | 291 (4.8%) |
| 8:00 AM to 8:29 AM | 767 (13.2%) | 1,160 (19.3%) |
| 8:30 AM to 8:59 AM | 34 (0.6%) | 218 (3.6%) |
| 9:00 AM to 9:59 AM | 272 (4.7%) | 598 (10.0%) |
| 10:00 AM to 10:59 AM | 182 (3.1%) | 61 (1.0%) |
| 11:00 AM to 11:59 AM | 92 (1.6%) | 0 (0.0%) |
| 12:00 PM to 3:59 PM | 253 (4.4%) | 388 (6.5%) |
| 4:00 PM to 11:59 PM | 431 (7.4%) | 295 (4.9%) |
| Total | 5,796 (100.0%) | 6,007 (100.0%) |
Housing Occupancy in Suitland
Occupancy by Ownership in Suitland
Of the total 10,809 dwellings in Suitland, owner-occupied units account for 3,878 (35.9%), while renter-occupied units make up 6,931 (64.1%).
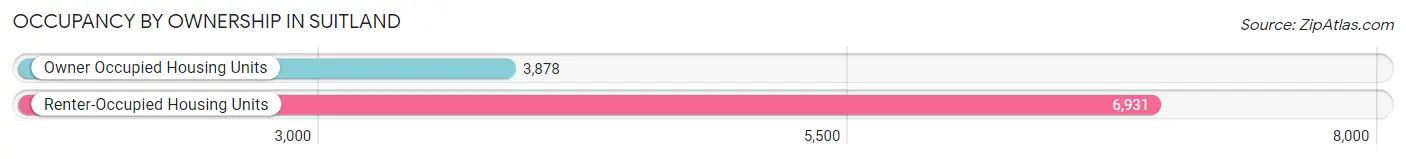
| Occupancy | # Housing Units | % Housing Units |
| Owner Occupied Housing Units | 3,878 | 35.9% |
| Renter-Occupied Housing Units | 6,931 | 64.1% |
| Total Occupied Housing Units | 10,809 | 100.0% |
Occupancy by Household Size in Suitland
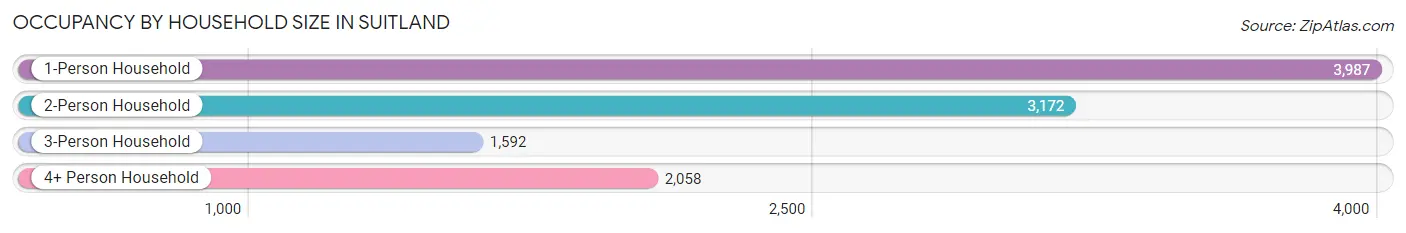
| Household Size | # Housing Units | % Housing Units |
| 1-Person Household | 3,987 | 36.9% |
| 2-Person Household | 3,172 | 29.3% |
| 3-Person Household | 1,592 | 14.7% |
| 4+ Person Household | 2,058 | 19.0% |
| Total Housing Units | 10,809 | 100.0% |
Occupancy by Ownership by Household Size in Suitland
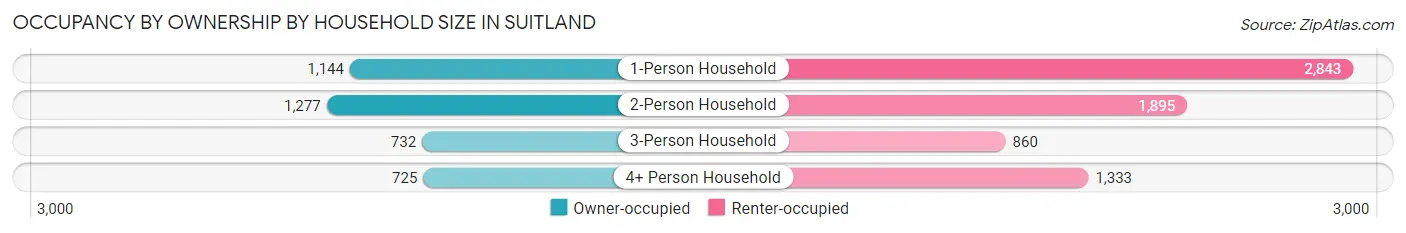
| Household Size | Owner-occupied | Renter-occupied |
| 1-Person Household | 1,144 (28.7%) | 2,843 (71.3%) |
| 2-Person Household | 1,277 (40.3%) | 1,895 (59.7%) |
| 3-Person Household | 732 (46.0%) | 860 (54.0%) |
| 4+ Person Household | 725 (35.2%) | 1,333 (64.8%) |
| Total Housing Units | 3,878 (35.9%) | 6,931 (64.1%) |
Occupancy by Educational Attainment in Suitland
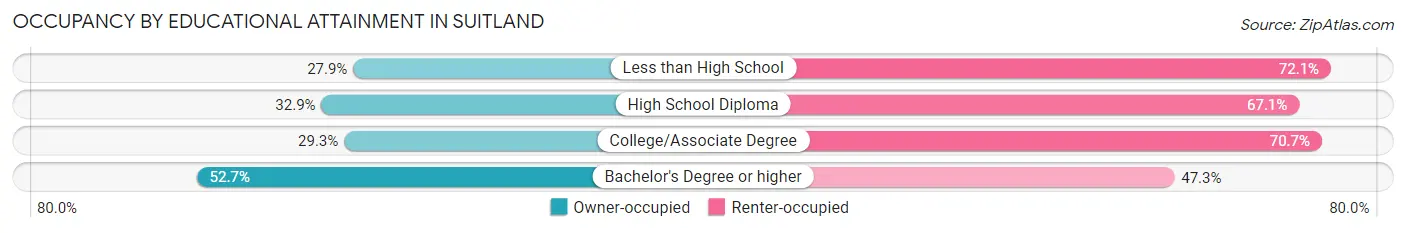
| Household Size | Owner-occupied | Renter-occupied |
| Less than High School | 247 (27.9%) | 639 (72.1%) |
| High School Diploma | 1,240 (32.9%) | 2,527 (67.1%) |
| College/Associate Degree | 1,070 (29.3%) | 2,580 (70.7%) |
| Bachelor's Degree or higher | 1,321 (52.7%) | 1,185 (47.3%) |
Occupancy by Age of Householder in Suitland
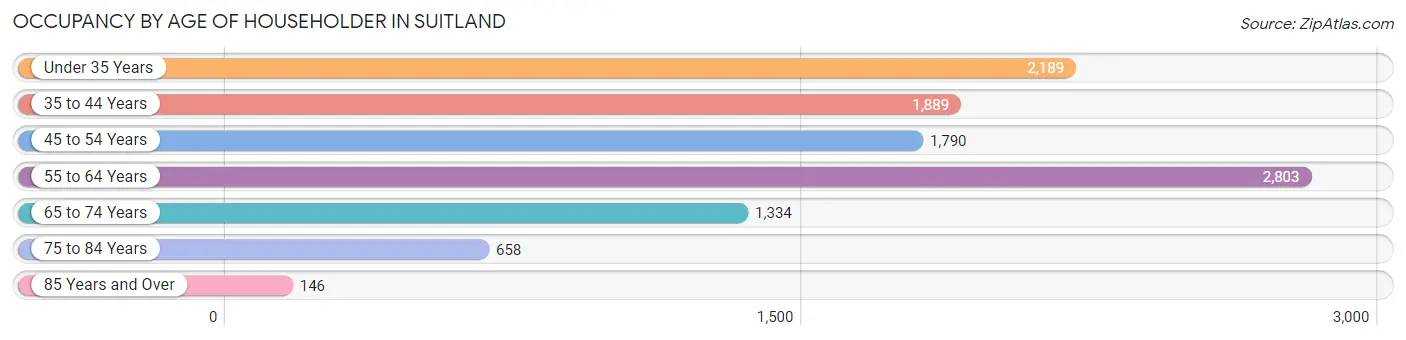
| Age Bracket | # Households | % Households |
| Under 35 Years | 2,189 | 20.3% |
| 35 to 44 Years | 1,889 | 17.5% |
| 45 to 54 Years | 1,790 | 16.6% |
| 55 to 64 Years | 2,803 | 25.9% |
| 65 to 74 Years | 1,334 | 12.3% |
| 75 to 84 Years | 658 | 6.1% |
| 85 Years and Over | 146 | 1.3% |
| Total | 10,809 | 100.0% |
Housing Finances in Suitland
Median Income by Occupancy in Suitland
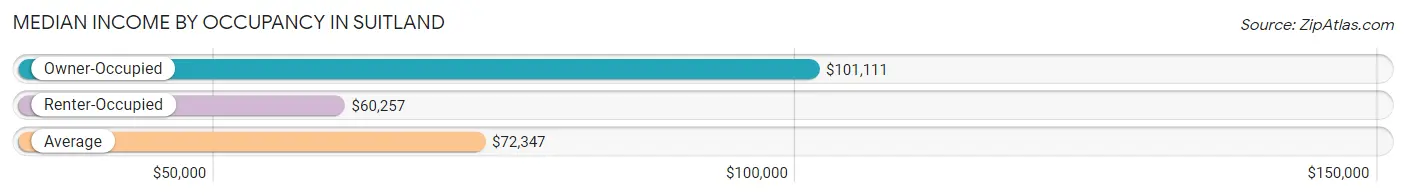
| Occupancy Type | # Households | Median Income |
| Owner-Occupied | 3,878 (35.9%) | $101,111 |
| Renter-Occupied | 6,931 (64.1%) | $60,257 |
| Average | 10,809 (100.0%) | $72,347 |
Occupancy by Householder Income Bracket in Suitland
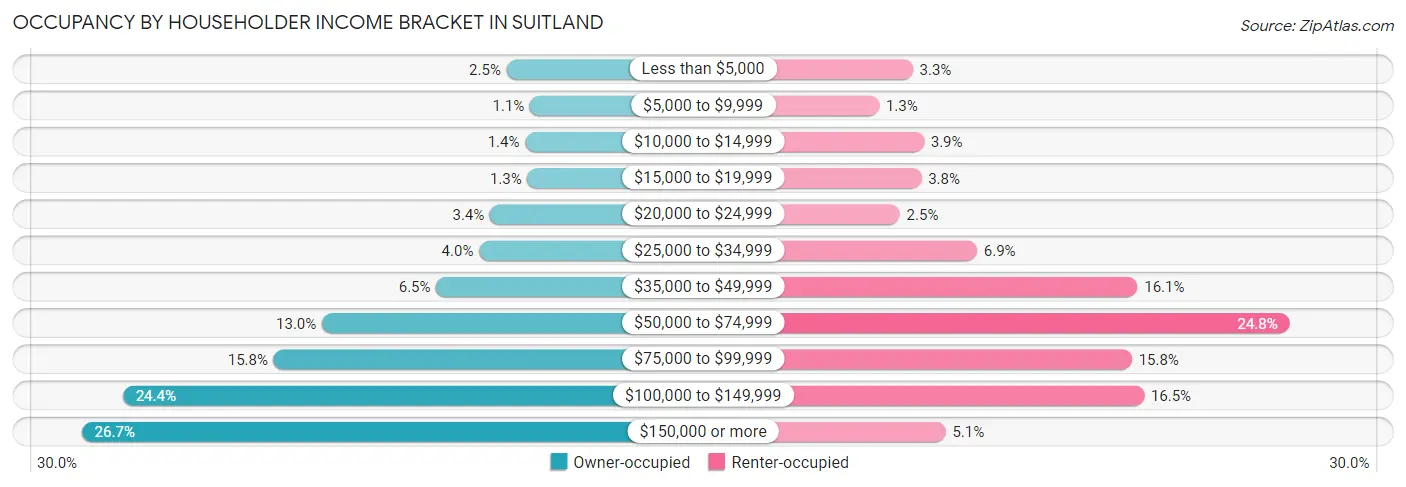
| Income Bracket | Owner-occupied | Renter-occupied |
| Less than $5,000 | 95 (2.5%) | 226 (3.3%) |
| $5,000 to $9,999 | 43 (1.1%) | 93 (1.3%) |
| $10,000 to $14,999 | 54 (1.4%) | 270 (3.9%) |
| $15,000 to $19,999 | 49 (1.3%) | 260 (3.7%) |
| $20,000 to $24,999 | 132 (3.4%) | 175 (2.5%) |
| $25,000 to $34,999 | 156 (4.0%) | 480 (6.9%) |
| $35,000 to $49,999 | 251 (6.5%) | 1,116 (16.1%) |
| $50,000 to $74,999 | 504 (13.0%) | 1,719 (24.8%) |
| $75,000 to $99,999 | 611 (15.8%) | 1,094 (15.8%) |
| $100,000 to $149,999 | 946 (24.4%) | 1,142 (16.5%) |
| $150,000 or more | 1,037 (26.7%) | 356 (5.1%) |
| Total | 3,878 (100.0%) | 6,931 (100.0%) |
Monthly Housing Cost Tiers in Suitland
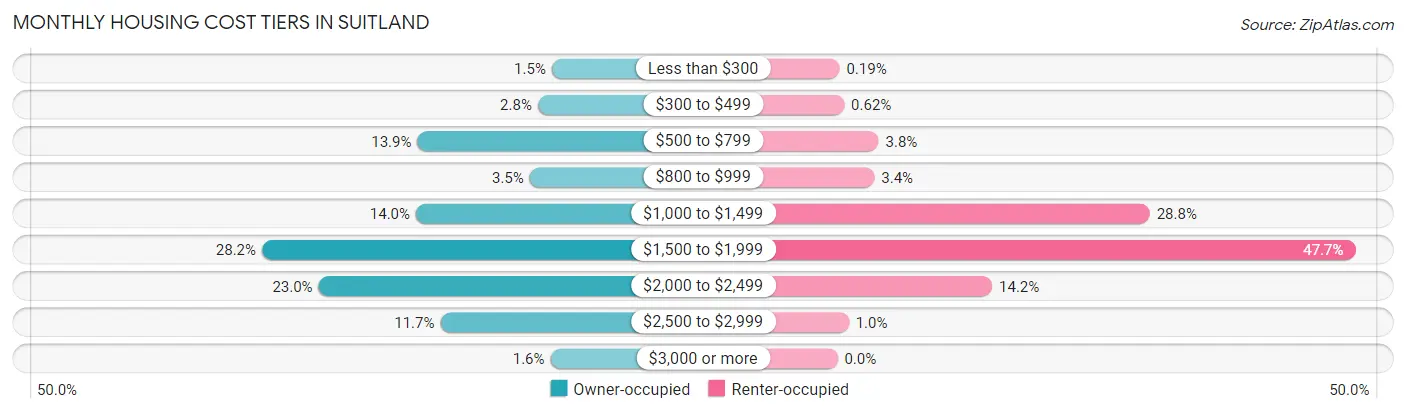
| Monthly Cost | Owner-occupied | Renter-occupied |
| Less than $300 | 57 (1.5%) | 13 (0.2%) |
| $300 to $499 | 107 (2.8%) | 43 (0.6%) |
| $500 to $799 | 537 (13.9%) | 263 (3.8%) |
| $800 to $999 | 136 (3.5%) | 236 (3.4%) |
| $1,000 to $1,499 | 542 (14.0%) | 1,993 (28.7%) |
| $1,500 to $1,999 | 1,092 (28.2%) | 3,305 (47.7%) |
| $2,000 to $2,499 | 890 (23.0%) | 987 (14.2%) |
| $2,500 to $2,999 | 455 (11.7%) | 72 (1.0%) |
| $3,000 or more | 62 (1.6%) | 0 (0.0%) |
| Total | 3,878 (100.0%) | 6,931 (100.0%) |
Physical Housing Characteristics in Suitland
Housing Structures in Suitland
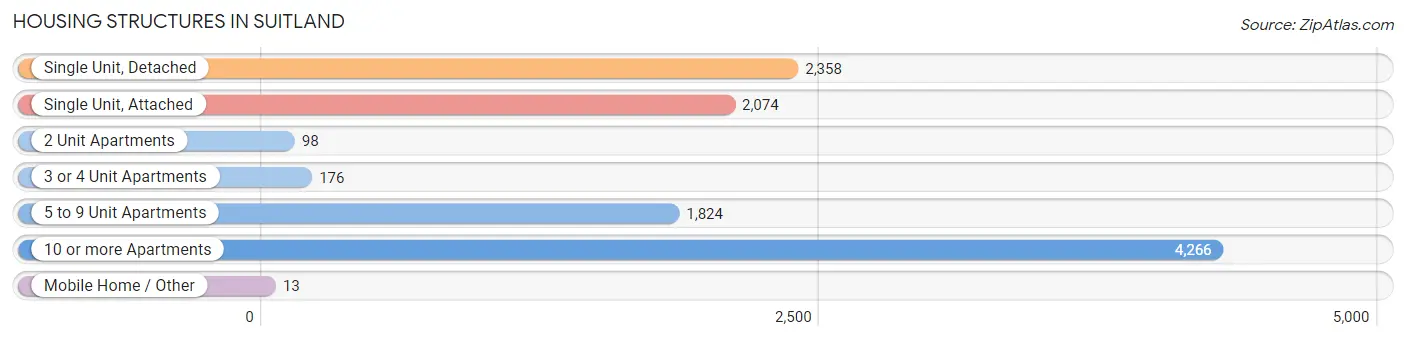
| Structure Type | # Housing Units | % Housing Units |
| Single Unit, Detached | 2,358 | 21.8% |
| Single Unit, Attached | 2,074 | 19.2% |
| 2 Unit Apartments | 98 | 0.9% |
| 3 or 4 Unit Apartments | 176 | 1.6% |
| 5 to 9 Unit Apartments | 1,824 | 16.9% |
| 10 or more Apartments | 4,266 | 39.5% |
| Mobile Home / Other | 13 | 0.1% |
| Total | 10,809 | 100.0% |
Housing Structures by Occupancy in Suitland
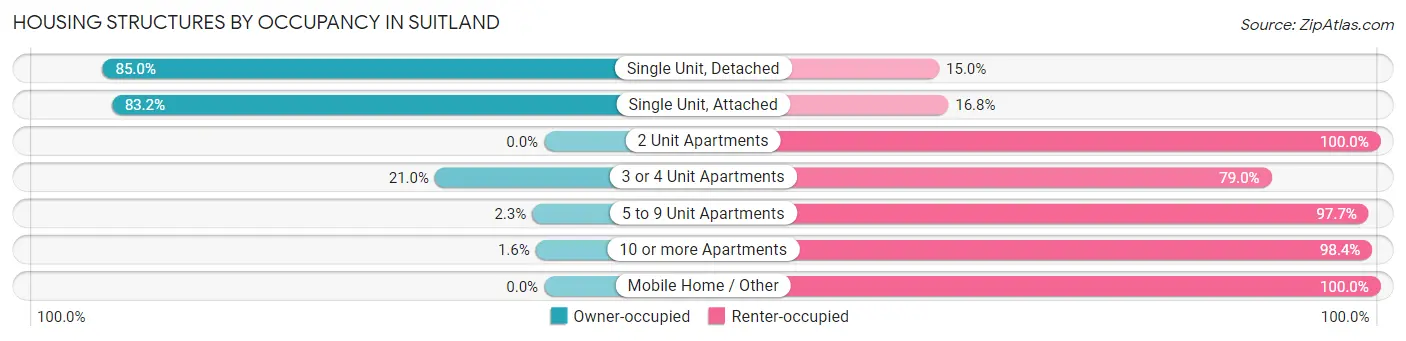
| Structure Type | Owner-occupied | Renter-occupied |
| Single Unit, Detached | 2,004 (85.0%) | 354 (15.0%) |
| Single Unit, Attached | 1,726 (83.2%) | 348 (16.8%) |
| 2 Unit Apartments | 0 (0.0%) | 98 (100.0%) |
| 3 or 4 Unit Apartments | 37 (21.0%) | 139 (79.0%) |
| 5 to 9 Unit Apartments | 42 (2.3%) | 1,782 (97.7%) |
| 10 or more Apartments | 69 (1.6%) | 4,197 (98.4%) |
| Mobile Home / Other | 0 (0.0%) | 13 (100.0%) |
| Total | 3,878 (35.9%) | 6,931 (64.1%) |
Housing Structures by Number of Rooms in Suitland
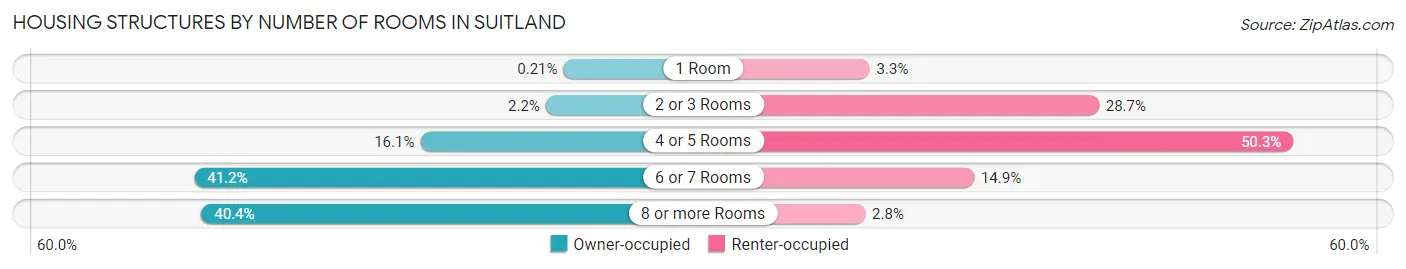
| Number of Rooms | Owner-occupied | Renter-occupied |
| 1 Room | 8 (0.2%) | 229 (3.3%) |
| 2 or 3 Rooms | 84 (2.2%) | 1,991 (28.7%) |
| 4 or 5 Rooms | 624 (16.1%) | 3,486 (50.3%) |
| 6 or 7 Rooms | 1,596 (41.2%) | 1,031 (14.9%) |
| 8 or more Rooms | 1,566 (40.4%) | 194 (2.8%) |
| Total | 3,878 (100.0%) | 6,931 (100.0%) |
Housing Structure by Heating Type in Suitland
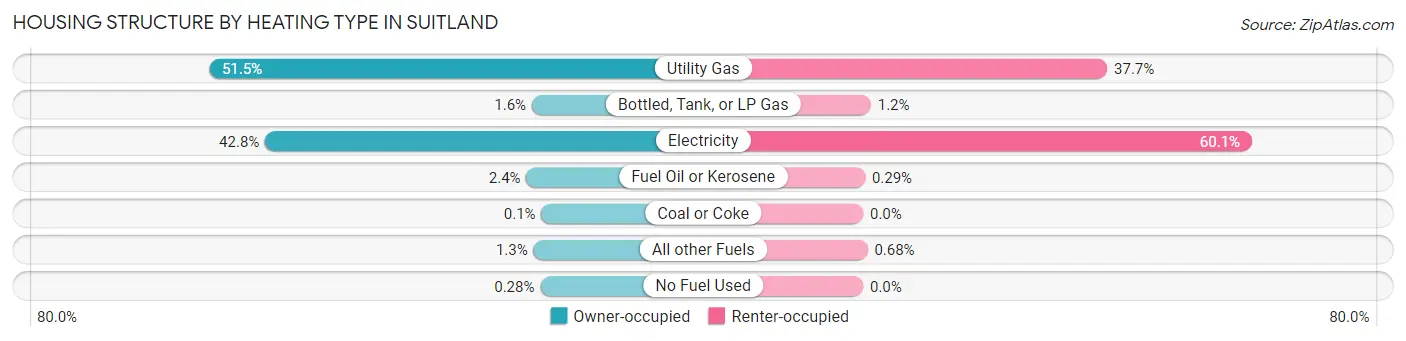
| Heating Type | Owner-occupied | Renter-occupied |
| Utility Gas | 1,997 (51.5%) | 2,615 (37.7%) |
| Bottled, Tank, or LP Gas | 61 (1.6%) | 83 (1.2%) |
| Electricity | 1,660 (42.8%) | 4,166 (60.1%) |
| Fuel Oil or Kerosene | 94 (2.4%) | 20 (0.3%) |
| Coal or Coke | 4 (0.1%) | 0 (0.0%) |
| All other Fuels | 51 (1.3%) | 47 (0.7%) |
| No Fuel Used | 11 (0.3%) | 0 (0.0%) |
| Total | 3,878 (100.0%) | 6,931 (100.0%) |
Household Vehicle Usage in Suitland
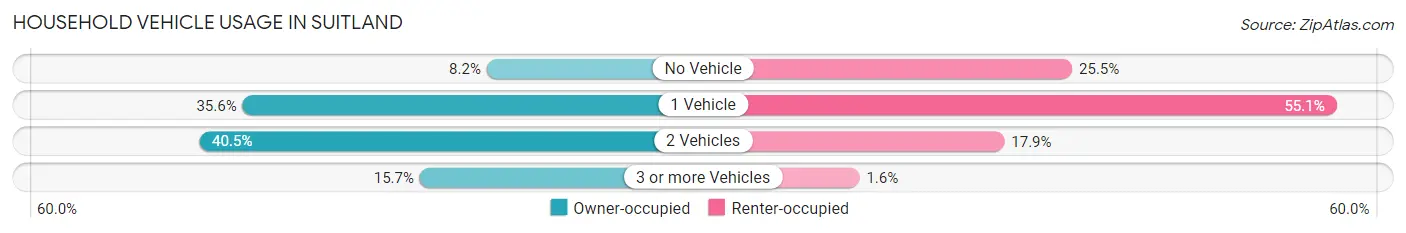
| Vehicles per Household | Owner-occupied | Renter-occupied |
| No Vehicle | 319 (8.2%) | 1,764 (25.5%) |
| 1 Vehicle | 1,380 (35.6%) | 3,816 (55.1%) |
| 2 Vehicles | 1,569 (40.5%) | 1,238 (17.9%) |
| 3 or more Vehicles | 610 (15.7%) | 113 (1.6%) |
| Total | 3,878 (100.0%) | 6,931 (100.0%) |
Real Estate & Mortgages in Suitland
Real Estate and Mortgage Overview in Suitland
| Characteristic | Without Mortgage | With Mortgage |
| Housing Units | 764 | 3,114 |
| Median Property Value | $274,400 | $303,800 |
| Median Household Income | $74,167 | $836 |
| Monthly Housing Costs | $674 | $62 |
| Real Estate Taxes | $3,188 | $69 |
Property Value by Mortgage Status in Suitland
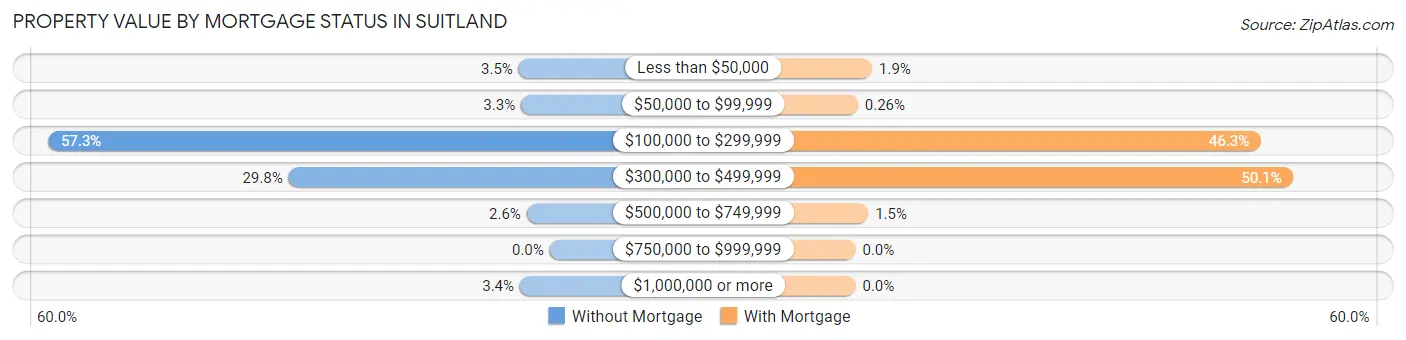
| Property Value | Without Mortgage | With Mortgage |
| Less than $50,000 | 27 (3.5%) | 59 (1.9%) |
| $50,000 to $99,999 | 25 (3.3%) | 8 (0.3%) |
| $100,000 to $299,999 | 438 (57.3%) | 1,443 (46.3%) |
| $300,000 to $499,999 | 228 (29.8%) | 1,559 (50.1%) |
| $500,000 to $749,999 | 20 (2.6%) | 45 (1.5%) |
| $750,000 to $999,999 | 0 (0.0%) | 0 (0.0%) |
| $1,000,000 or more | 26 (3.4%) | 0 (0.0%) |
| Total | 764 (100.0%) | 3,114 (100.0%) |
Household Income by Mortgage Status in Suitland
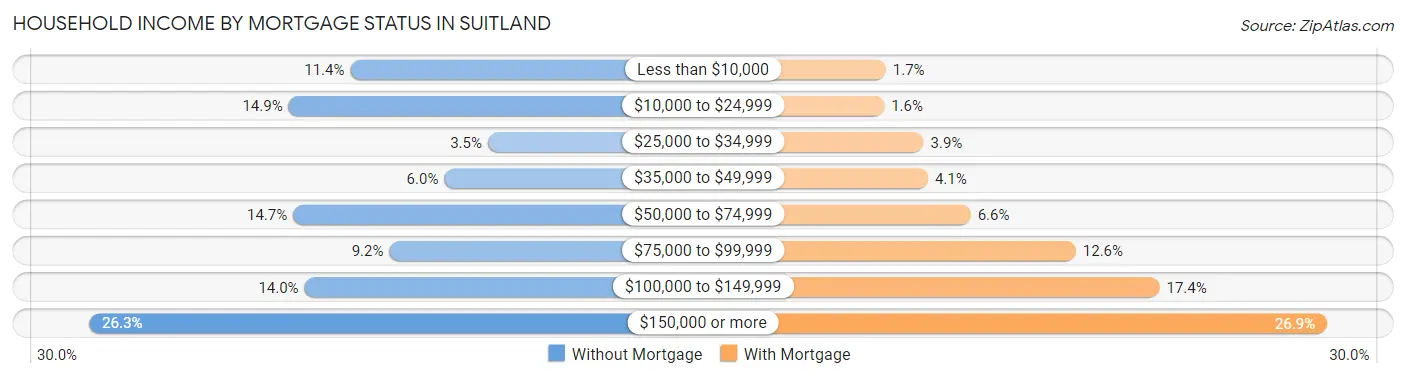
| Household Income | Without Mortgage | With Mortgage |
| Less than $10,000 | 87 (11.4%) | 54 (1.7%) |
| $10,000 to $24,999 | 114 (14.9%) | 51 (1.6%) |
| $25,000 to $34,999 | 27 (3.5%) | 121 (3.9%) |
| $35,000 to $49,999 | 46 (6.0%) | 129 (4.1%) |
| $50,000 to $74,999 | 112 (14.7%) | 205 (6.6%) |
| $75,000 to $99,999 | 70 (9.2%) | 392 (12.6%) |
| $100,000 to $149,999 | 107 (14.0%) | 541 (17.4%) |
| $150,000 or more | 201 (26.3%) | 839 (26.9%) |
| Total | 764 (100.0%) | 3,114 (100.0%) |
Property Value to Household Income Ratio in Suitland
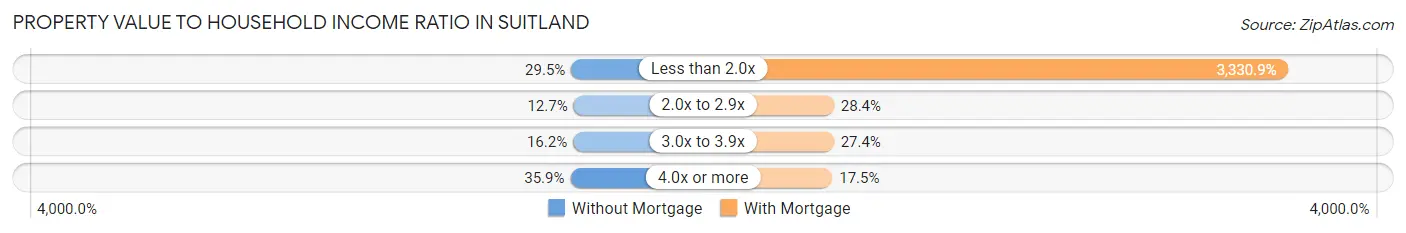
| Value-to-Income Ratio | Without Mortgage | With Mortgage |
| Less than 2.0x | 225 (29.4%) | 103,724 (3,330.9%) |
| 2.0x to 2.9x | 97 (12.7%) | 885 (28.4%) |
| 3.0x to 3.9x | 124 (16.2%) | 853 (27.4%) |
| 4.0x or more | 274 (35.9%) | 544 (17.5%) |
| Total | 764 (100.0%) | 3,114 (100.0%) |
Real Estate Taxes by Mortgage Status in Suitland
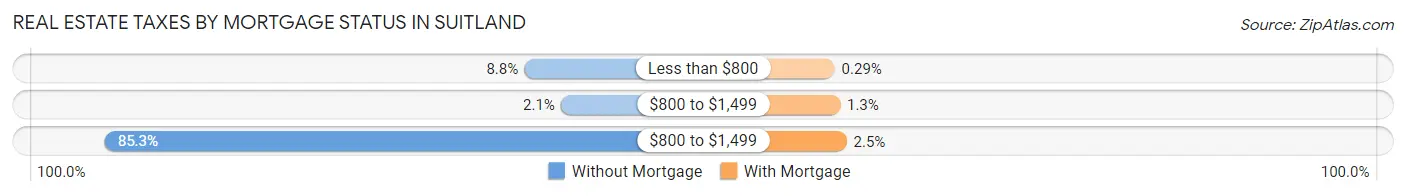
| Property Taxes | Without Mortgage | With Mortgage |
| Less than $800 | 67 (8.8%) | 9 (0.3%) |
| $800 to $1,499 | 16 (2.1%) | 40 (1.3%) |
| $800 to $1,499 | 652 (85.3%) | 77 (2.5%) |
| Total | 764 (100.0%) | 3,114 (100.0%) |
Health & Disability in Suitland
Health Insurance Coverage by Age in Suitland
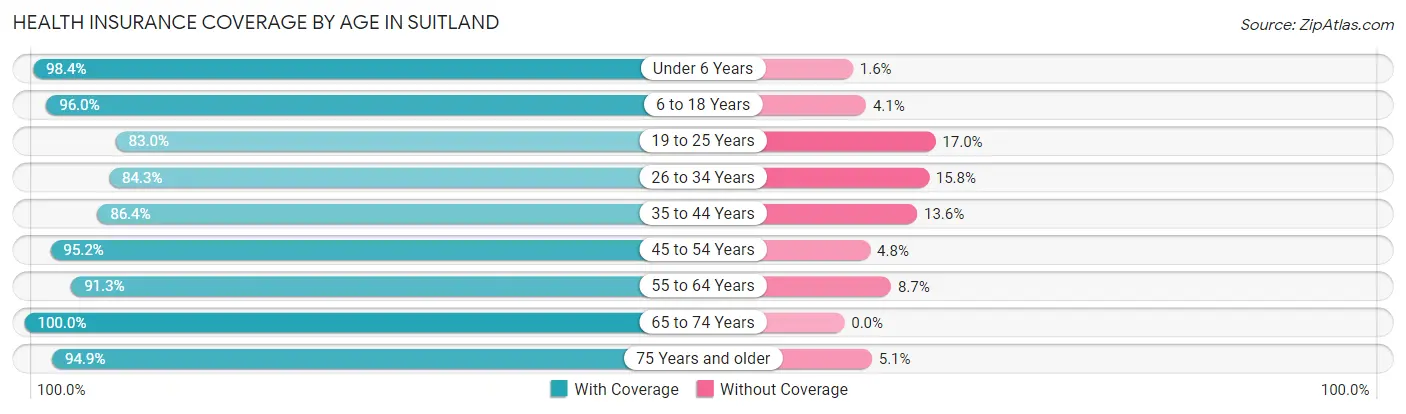
| Age Bracket | With Coverage | Without Coverage |
| Under 6 Years | 1,912 (98.4%) | 31 (1.6%) |
| 6 to 18 Years | 3,337 (96.0%) | 141 (4.1%) |
| 19 to 25 Years | 1,774 (83.0%) | 363 (17.0%) |
| 26 to 34 Years | 3,681 (84.3%) | 688 (15.8%) |
| 35 to 44 Years | 2,823 (86.4%) | 443 (13.6%) |
| 45 to 54 Years | 2,999 (95.2%) | 152 (4.8%) |
| 55 to 64 Years | 3,969 (91.3%) | 378 (8.7%) |
| 65 to 74 Years | 1,900 (100.0%) | 0 (0.0%) |
| 75 Years and older | 1,165 (94.9%) | 63 (5.1%) |
| Total | 23,560 (91.2%) | 2,259 (8.7%) |
Health Insurance Coverage by Citizenship Status in Suitland
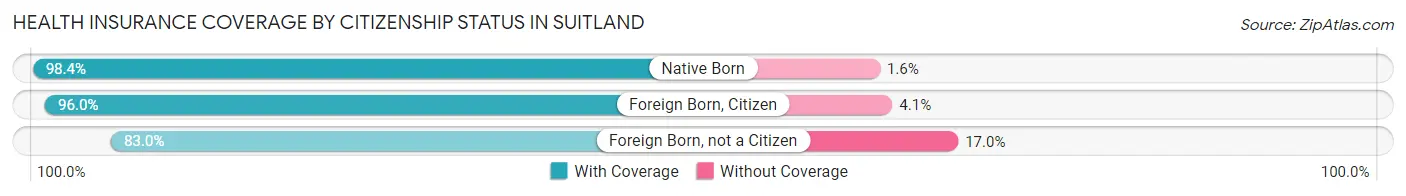
| Citizenship Status | With Coverage | Without Coverage |
| Native Born | 1,912 (98.4%) | 31 (1.6%) |
| Foreign Born, Citizen | 3,337 (96.0%) | 141 (4.1%) |
| Foreign Born, not a Citizen | 1,774 (83.0%) | 363 (17.0%) |
Health Insurance Coverage by Household Income in Suitland
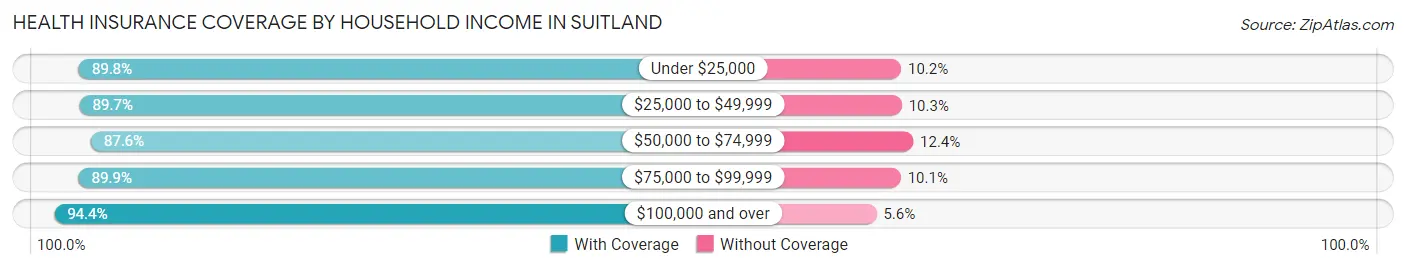
| Household Income | With Coverage | Without Coverage |
| Under $25,000 | 1,997 (89.8%) | 226 (10.2%) |
| $25,000 to $49,999 | 3,287 (89.7%) | 377 (10.3%) |
| $50,000 to $74,999 | 4,698 (87.6%) | 666 (12.4%) |
| $75,000 to $99,999 | 3,575 (89.9%) | 402 (10.1%) |
| $100,000 and over | 9,993 (94.4%) | 588 (5.6%) |
Public vs Private Health Insurance Coverage by Age in Suitland
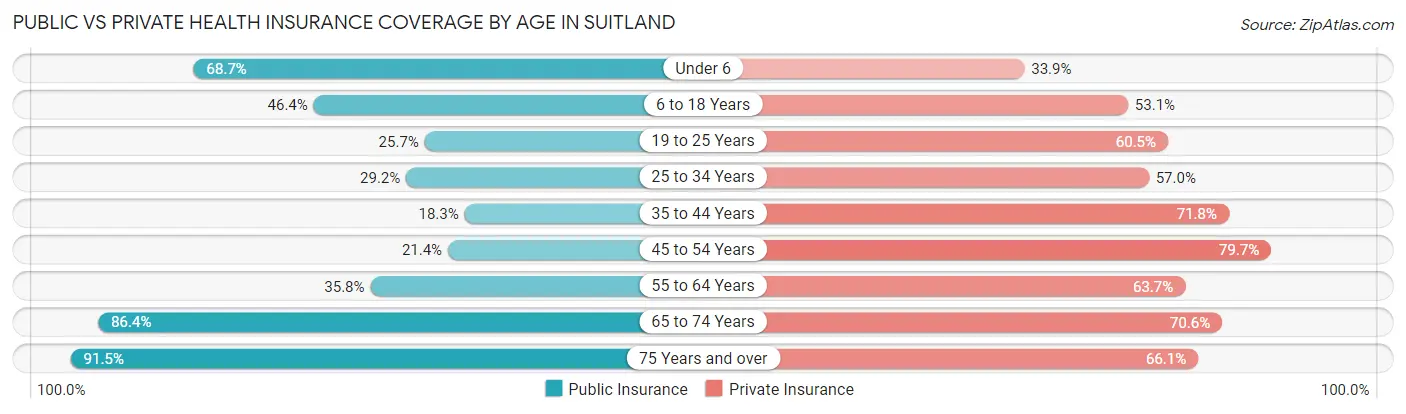
| Age Bracket | Public Insurance | Private Insurance |
| Under 6 | 1,334 (68.7%) | 658 (33.9%) |
| 6 to 18 Years | 1,612 (46.4%) | 1,847 (53.1%) |
| 19 to 25 Years | 550 (25.7%) | 1,293 (60.5%) |
| 25 to 34 Years | 1,275 (29.2%) | 2,489 (57.0%) |
| 35 to 44 Years | 599 (18.3%) | 2,346 (71.8%) |
| 45 to 54 Years | 675 (21.4%) | 2,511 (79.7%) |
| 55 to 64 Years | 1,557 (35.8%) | 2,769 (63.7%) |
| 65 to 74 Years | 1,641 (86.4%) | 1,341 (70.6%) |
| 75 Years and over | 1,123 (91.4%) | 812 (66.1%) |
| Total | 10,366 (40.2%) | 16,066 (62.2%) |
Disability Status by Sex by Age in Suitland
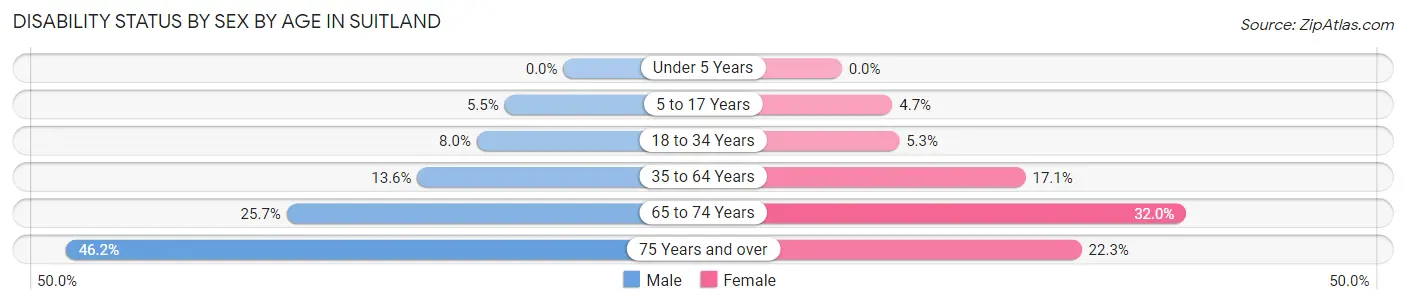
| Age Bracket | Male | Female |
| Under 5 Years | 0 (0.0%) | 0 (0.0%) |
| 5 to 17 Years | 95 (5.5%) | 85 (4.7%) |
| 18 to 34 Years | 251 (8.0%) | 195 (5.3%) |
| 35 to 64 Years | 698 (13.6%) | 957 (17.1%) |
| 65 to 74 Years | 189 (25.7%) | 372 (32.0%) |
| 75 Years and over | 260 (46.2%) | 148 (22.3%) |
Disability Class by Sex by Age in Suitland
Disability Class: Hearing Difficulty
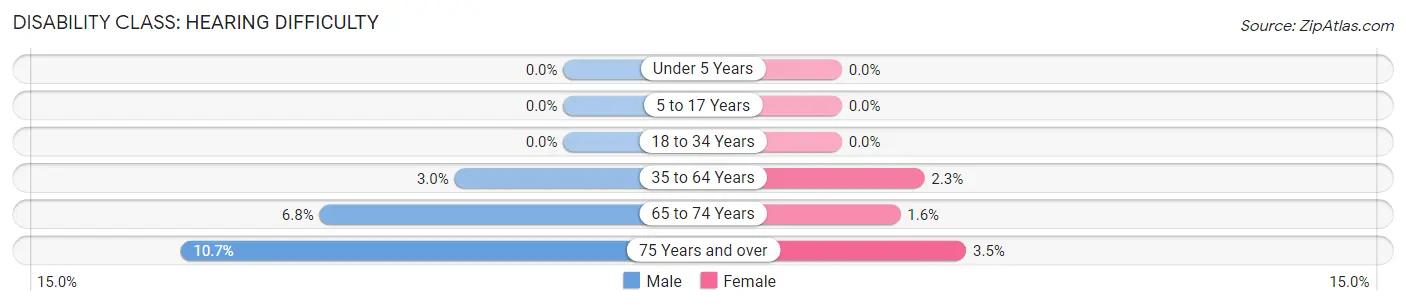
| Age Bracket | Male | Female |
| Under 5 Years | 0 (0.0%) | 0 (0.0%) |
| 5 to 17 Years | 0 (0.0%) | 0 (0.0%) |
| 18 to 34 Years | 0 (0.0%) | 0 (0.0%) |
| 35 to 64 Years | 156 (3.0%) | 129 (2.3%) |
| 65 to 74 Years | 50 (6.8%) | 19 (1.6%) |
| 75 Years and over | 60 (10.7%) | 23 (3.5%) |
Disability Class: Vision Difficulty
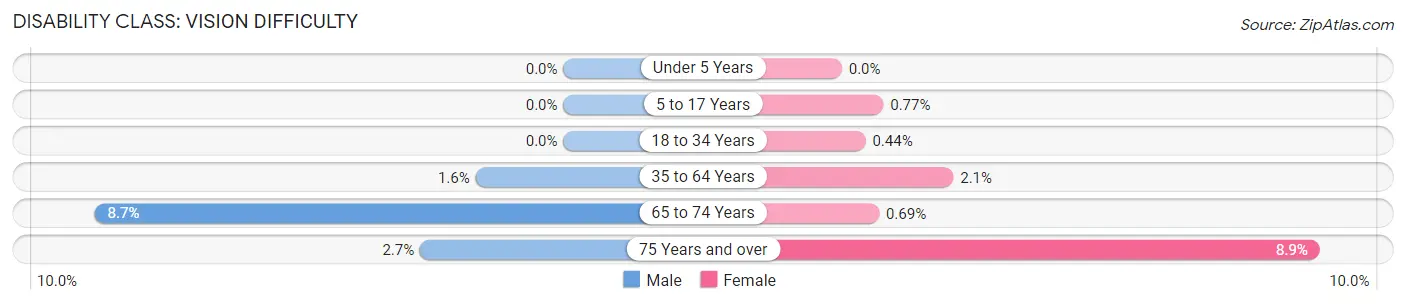
| Age Bracket | Male | Female |
| Under 5 Years | 0 (0.0%) | 0 (0.0%) |
| 5 to 17 Years | 0 (0.0%) | 14 (0.8%) |
| 18 to 34 Years | 0 (0.0%) | 16 (0.4%) |
| 35 to 64 Years | 84 (1.6%) | 116 (2.1%) |
| 65 to 74 Years | 64 (8.7%) | 8 (0.7%) |
| 75 Years and over | 15 (2.7%) | 59 (8.9%) |
Disability Class: Cognitive Difficulty
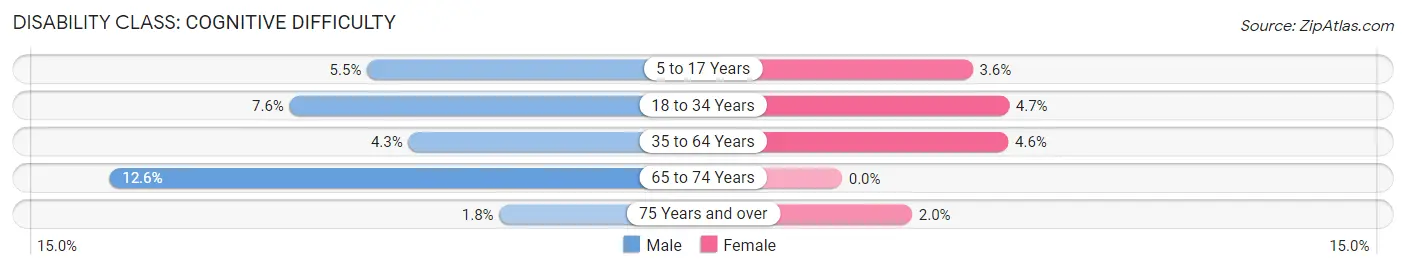
| Age Bracket | Male | Female |
| 5 to 17 Years | 95 (5.5%) | 66 (3.6%) |
| 18 to 34 Years | 238 (7.6%) | 170 (4.6%) |
| 35 to 64 Years | 222 (4.3%) | 260 (4.6%) |
| 65 to 74 Years | 93 (12.6%) | 0 (0.0%) |
| 75 Years and over | 10 (1.8%) | 13 (1.9%) |
Disability Class: Ambulatory Difficulty
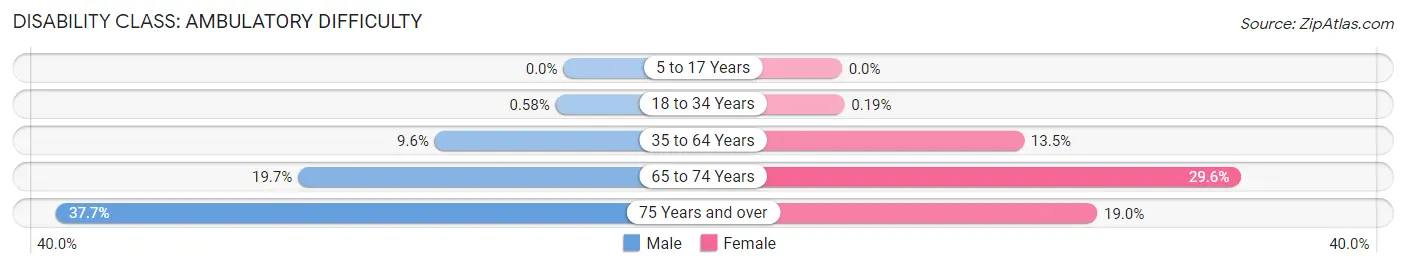
| Age Bracket | Male | Female |
| 5 to 17 Years | 0 (0.0%) | 0 (0.0%) |
| 18 to 34 Years | 18 (0.6%) | 7 (0.2%) |
| 35 to 64 Years | 492 (9.6%) | 759 (13.5%) |
| 65 to 74 Years | 145 (19.7%) | 345 (29.6%) |
| 75 Years and over | 212 (37.7%) | 126 (19.0%) |
Disability Class: Self-Care Difficulty
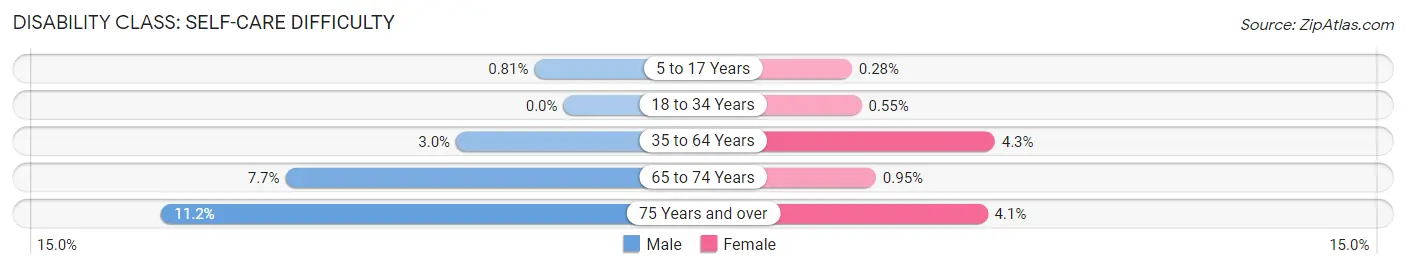
| Age Bracket | Male | Female |
| 5 to 17 Years | 14 (0.8%) | 5 (0.3%) |
| 18 to 34 Years | 0 (0.0%) | 20 (0.5%) |
| 35 to 64 Years | 154 (3.0%) | 239 (4.3%) |
| 65 to 74 Years | 57 (7.7%) | 11 (0.9%) |
| 75 Years and over | 63 (11.2%) | 27 (4.1%) |
Technology Access in Suitland
Computing Device Access in Suitland
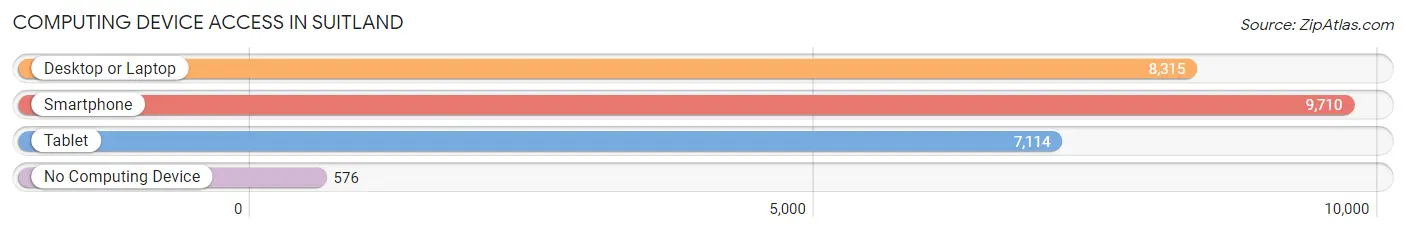
| Device Type | # Households | % Households |
| Desktop or Laptop | 8,315 | 76.9% |
| Smartphone | 9,710 | 89.8% |
| Tablet | 7,114 | 65.8% |
| No Computing Device | 576 | 5.3% |
| Total | 10,809 | 100.0% |
Internet Access in Suitland
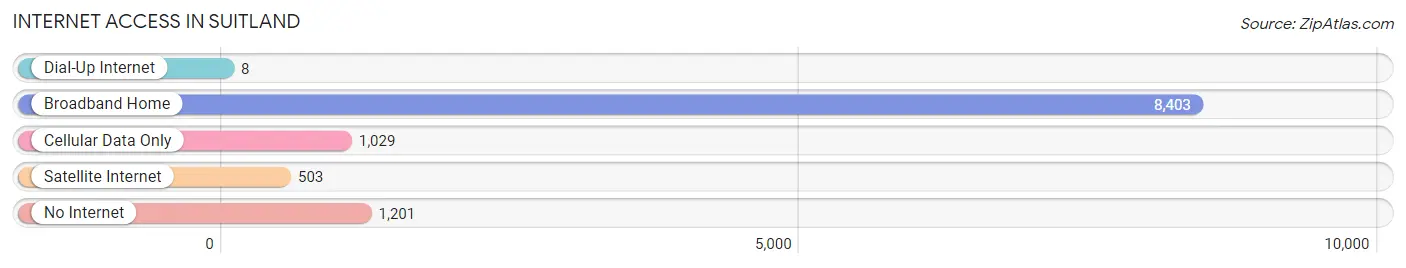
| Internet Type | # Households | % Households |
| Dial-Up Internet | 8 | 0.1% |
| Broadband Home | 8,403 | 77.7% |
| Cellular Data Only | 1,029 | 9.5% |
| Satellite Internet | 503 | 4.6% |
| No Internet | 1,201 | 11.1% |
| Total | 10,809 | 100.0% |
Suitland Summary
Suitland is a census-designated place (CDP) located in Prince George’s County, Maryland, United States. The population was 25,825 at the 2000 census. Suitland is located just south of Washington, D.C. and is part of the Washington metropolitan area.
History
Suitland was first settled in the early 19th century by freed slaves. The area was named after 19th century landowner and businessman Senator Samuel Taylor Suit, who owned and operated a nearby grist mill and general store. The area remained largely rural until the early 20th century, when it began to be developed as a residential suburb of Washington, D.C. In the 1930s, the federal government purchased much of the land in the area for the construction of the Suitland Federal Center, which included the headquarters of the U.S. Census Bureau and the National Archives and Records Administration.
Geography
Suitland is located at 38°51'17" North, 76°55'45" West (38.854722, -76.929167). According to the United States Census Bureau, the CDP has a total area of 5.2 square miles (13.4 km2), all of it land.
Economy
Suitland is home to the Suitland Federal Center, a large federal government complex that houses the headquarters of the U.S. Census Bureau and the National Archives and Records Administration. The area is also home to several other federal government agencies, including the National Oceanic and Atmospheric Administration, the National Geospatial-Intelligence Agency, and the U.S. Department of Agriculture.
Demographics
As of the census of 2000, there were 25,825 people, 8,845 households, and 6,068 families residing in the CDP. The population density was 4,945.3 people per square mile (1,907.2/km2). There were 9,541 housing units at an average density of 1,837.3/sq mi (709.7/km2). The racial makeup of the CDP was 28.2% White, 57.2% African American, 0.3% Native American, 4.3% Asian, 0.1% Pacific Islander, 6.3% from other races, and 3.6% from two or more races. Hispanic or Latino of any race were 11.3% of the population.
There were 8,845 households, out of which 33.2% had children under the age of 18 living with them, 41.2% were married couples living together, 20.2% had a female householder with no husband present, and 32.7% were non-families. 25.7% of all households were made up of individuals, and 6.2% had someone living alone who was 65 years of age or older. The average household size was 2.90 and the average family size was 3.48.
In the CDP, the population was spread out, with 26.2% under the age of 18, 9.2% from 18 to 24, 32.2% from 25 to 44, 22.7% from 45 to 64, and 9.7% who were 65 years of age or older. The median age was 34 years. For every 100 females, there were 91.2 males. For every 100 females age 18 and over, there were 86.7 males.
The median income for a household in the CDP was $45,853, and the median income for a family was $50,890. Males had a median income of $35,945 versus $30,845 for females. The per capita income for the CDP was $19,845. About 8.2% of families and 10.3% of the population were below the poverty line, including 13.2% of those under age 18 and 8.2% of those age 65 or over.
Common Questions
What is Per Capita Income in Suitland?
Per Capita income in Suitland is $38,910.
What is the Median Family Income in Suitland?
Median Family Income in Suitland is $86,204.
What is the Median Household income in Suitland?
Median Household Income in Suitland is $72,347.
What is Income or Wage Gap in Suitland?
Income or Wage Gap in Suitland is 1.5%.
Women in Suitland earn 98.5 cents for every dollar earned by a man.
What is Inequality or Gini Index in Suitland?
Inequality or Gini Index in Suitland is 0.41.
What is the Total Population of Suitland?
Total Population of Suitland is 25,839.
What is the Total Male Population of Suitland?
Total Male Population of Suitland is 12,186.
What is the Total Female Population of Suitland?
Total Female Population of Suitland is 13,653.
What is the Ratio of Males per 100 Females in Suitland?
There are 89.26 Males per 100 Females in Suitland.
What is the Ratio of Females per 100 Males in Suitland?
There are 112.04 Females per 100 Males in Suitland.
What is the Median Population Age in Suitland?
Median Population Age in Suitland is 38.1 Years.
What is the Average Family Size in Suitland
Average Family Size in Suitland is 3.1 People.
What is the Average Household Size in Suitland
Average Household Size in Suitland is 2.4 People.
How Large is the Labor Force in Suitland?
There are 14,959 People in the Labor Forcein in Suitland.
What is the Percentage of People in the Labor Force in Suitland?
70.7% of People are in the Labor Force in Suitland.
What is the Unemployment Rate in Suitland?
Unemployment Rate in Suitland is 7.3%.