Lake Arbor, MD Map & Demographics
Lake Arbor Map
Lake Arbor Overview
$57,753
PER CAPITA INCOME
$135,872
AVG FAMILY INCOME
$118,518
AVG HOUSEHOLD INCOME
27.5%
WAGE / INCOME GAP [ % ]
72.5¢/ $1
WAGE / INCOME GAP [ $ ]
0.35
INEQUALITY / GINI INDEX
14,901
TOTAL POPULATION
6,900
MALE POPULATION
8,001
FEMALE POPULATION
86.24
MALES / 100 FEMALES
115.96
FEMALES / 100 MALES
43.7
MEDIAN AGE
3.1
AVG FAMILY SIZE
2.4
AVG HOUSEHOLD SIZE
9,104
LABOR FORCE [ PEOPLE ]
73.4%
PERCENT IN LABOR FORCE
5.1%
UNEMPLOYMENT RATE
Income in Lake Arbor
Income Overview in Lake Arbor
Per Capita Income in Lake Arbor is $57,753, while median incomes of families and households are $135,872 and $118,518 respectively.
| Characteristic | Number | Measure |
| Per Capita Income | 14,901 | $57,753 |
| Median Family Income | 3,593 | $135,872 |
| Mean Family Income | 3,593 | $156,065 |
| Median Household Income | 6,180 | $118,518 |
| Mean Household Income | 6,180 | $135,245 |
| Income Deficit | 3,593 | $0 |
| Wage / Income Gap (%) | 14,901 | 27.53% |
| Wage / Income Gap ($) | 14,901 | 72.47¢ per $1 |
| Gini / Inequality Index | 14,901 | 0.35 |
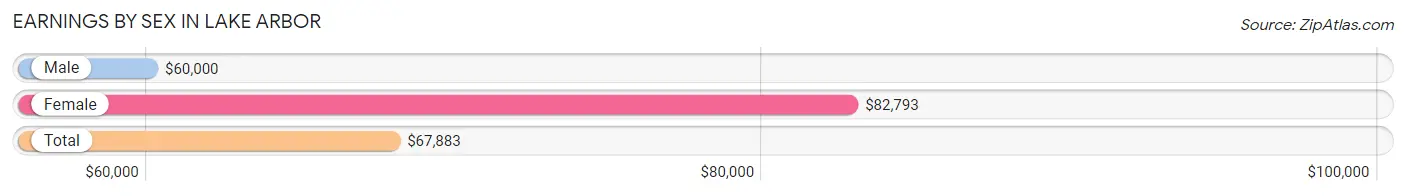
Earnings by Sex in Lake Arbor
Average Earnings in Lake Arbor are $67,883, $60,000 for men and $82,793 for women, a difference of 27.5%.
| Sex | Number | Average Earnings |
| Male | 4,416 (47.8%) | $60,000 |
| Female | 4,825 (52.2%) | $82,793 |
| Total | 9,241 (100.0%) | $67,883 |
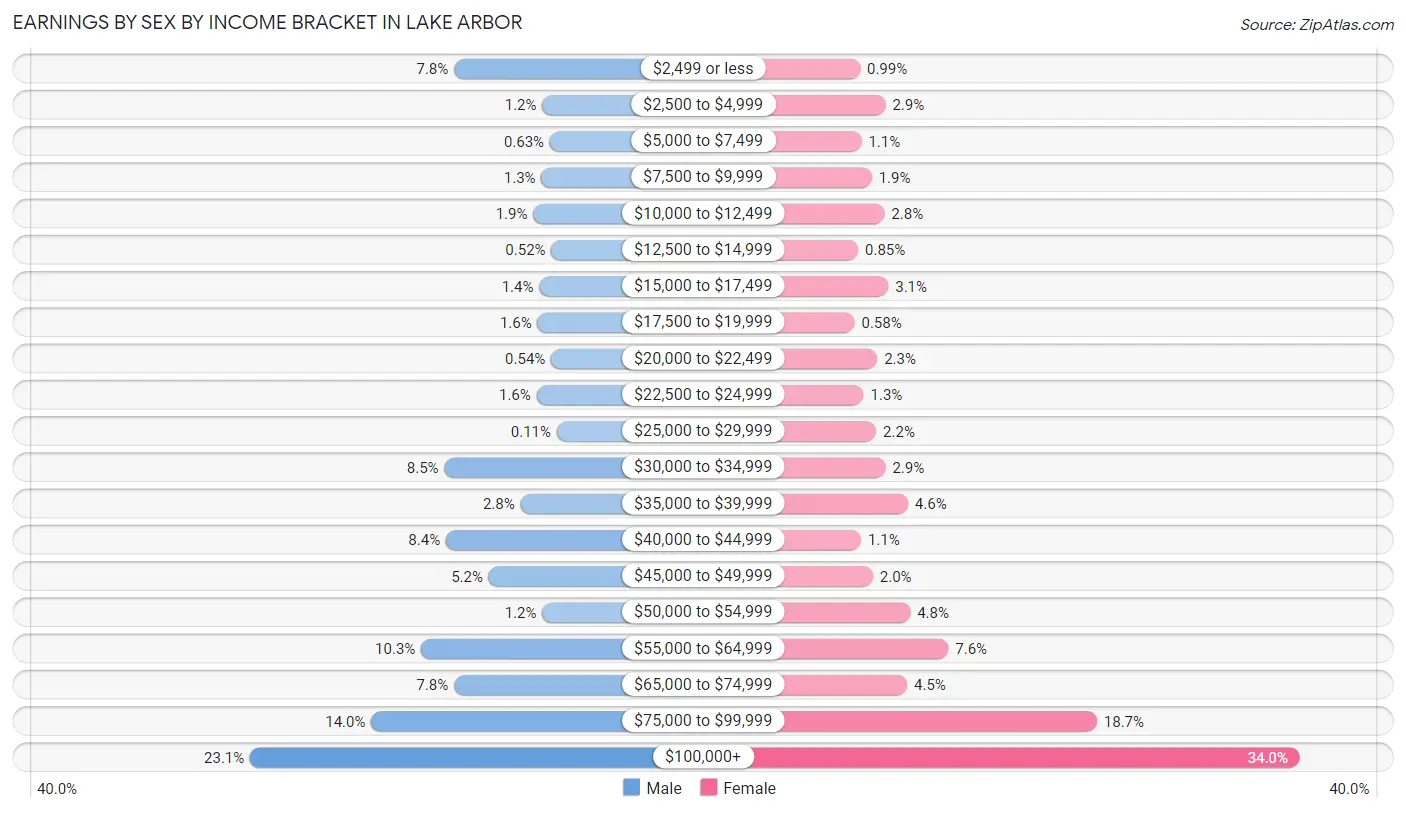
Earnings by Sex by Income Bracket in Lake Arbor
The most common earnings brackets in Lake Arbor are $100,000+ for men (1,020 | 23.1%) and $100,000+ for women (1,638 | 34.0%).
| Income | Male | Female |
| $2,499 or less | 345 (7.8%) | 48 (1.0%) |
| $2,500 to $4,999 | 53 (1.2%) | 140 (2.9%) |
| $5,000 to $7,499 | 28 (0.6%) | 53 (1.1%) |
| $7,500 to $9,999 | 56 (1.3%) | 90 (1.9%) |
| $10,000 to $12,499 | 83 (1.9%) | 136 (2.8%) |
| $12,500 to $14,999 | 23 (0.5%) | 41 (0.9%) |
| $15,000 to $17,499 | 63 (1.4%) | 150 (3.1%) |
| $17,500 to $19,999 | 69 (1.6%) | 28 (0.6%) |
| $20,000 to $22,499 | 24 (0.5%) | 110 (2.3%) |
| $22,500 to $24,999 | 72 (1.6%) | 61 (1.3%) |
| $25,000 to $29,999 | 5 (0.1%) | 106 (2.2%) |
| $30,000 to $34,999 | 377 (8.5%) | 140 (2.9%) |
| $35,000 to $39,999 | 125 (2.8%) | 221 (4.6%) |
| $40,000 to $44,999 | 372 (8.4%) | 51 (1.1%) |
| $45,000 to $49,999 | 230 (5.2%) | 94 (1.9%) |
| $50,000 to $54,999 | 53 (1.2%) | 229 (4.8%) |
| $55,000 to $64,999 | 454 (10.3%) | 367 (7.6%) |
| $65,000 to $74,999 | 345 (7.8%) | 218 (4.5%) |
| $75,000 to $99,999 | 619 (14.0%) | 904 (18.7%) |
| $100,000+ | 1,020 (23.1%) | 1,638 (34.0%) |
| Total | 4,416 (100.0%) | 4,825 (100.0%) |
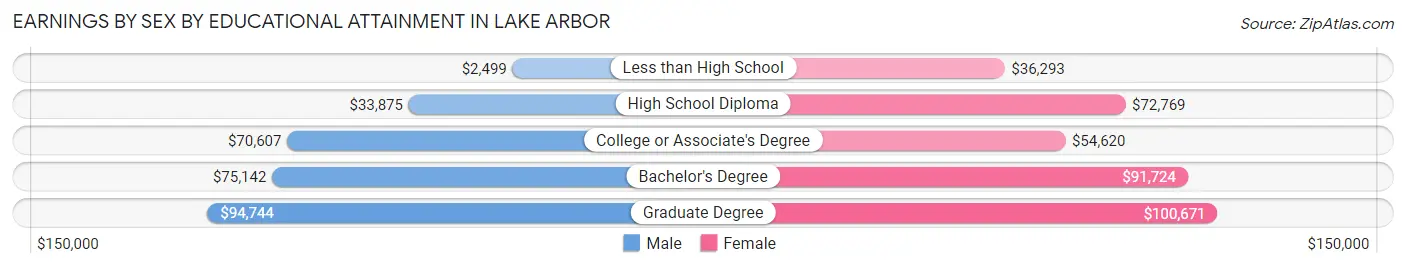
Earnings by Sex by Educational Attainment in Lake Arbor
Average earnings in Lake Arbor are $61,988 for men and $87,107 for women, a difference of 28.8%. Men with an educational attainment of graduate degree enjoy the highest average annual earnings of $94,744, while those with less than high school education earn the least with $2,499. Women with an educational attainment of graduate degree earn the most with the average annual earnings of $100,671, while those with less than high school education have the smallest earnings of $36,293.
| Educational Attainment | Male Income | Female Income |
| Less than High School | $2,499 | $36,293 |
| High School Diploma | $33,875 | $72,769 |
| College or Associate's Degree | $70,607 | $54,620 |
| Bachelor's Degree | $75,142 | $91,724 |
| Graduate Degree | $94,744 | $100,671 |
| Total | $61,988 | $87,107 |
Family Income in Lake Arbor
Family Income Brackets in Lake Arbor
According to the Lake Arbor family income data, there are 977 families falling into the $100,000 to $149,999 income range, which is the most common income bracket and makes up 27.2% of all families.
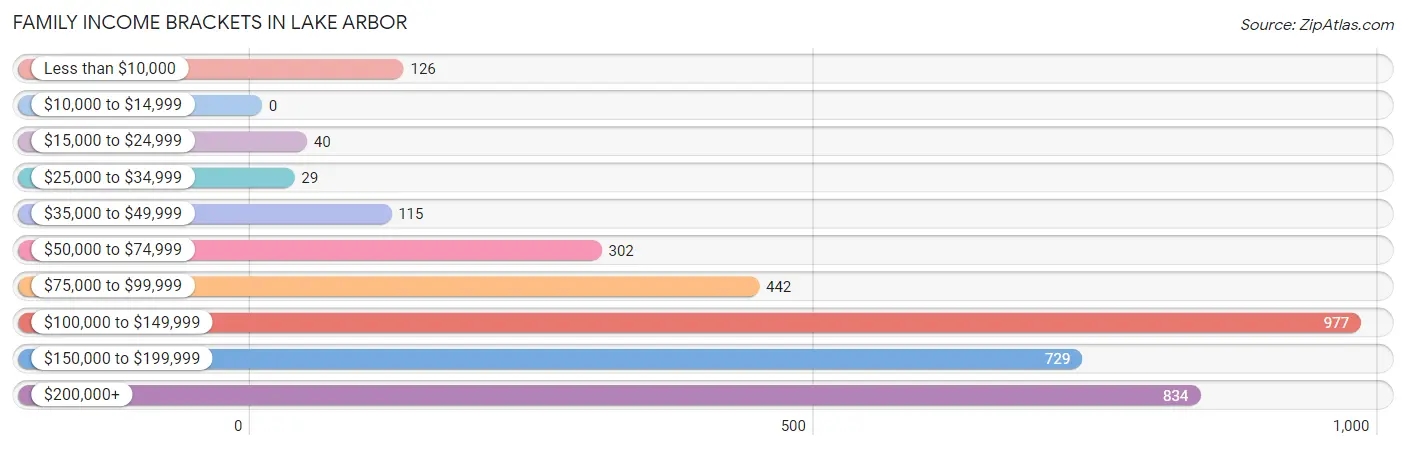
| Income Bracket | # Families | % Families |
| Less than $10,000 | 126 | 3.5% |
| $10,000 to $14,999 | 0 | 0.0% |
| $15,000 to $24,999 | 40 | 1.1% |
| $25,000 to $34,999 | 29 | 0.8% |
| $35,000 to $49,999 | 115 | 3.2% |
| $50,000 to $74,999 | 302 | 8.4% |
| $75,000 to $99,999 | 442 | 12.3% |
| $100,000 to $149,999 | 977 | 27.2% |
| $150,000 to $199,999 | 729 | 20.3% |
| $200,000+ | 834 | 23.2% |
Family Income by Famaliy Size in Lake Arbor
6-person families (111 | 3.1%) account for the highest median family income in Lake Arbor with $250,001 per family, while 2-person families (1,908 | 53.1%) have the highest median income of $56,366 per family member.
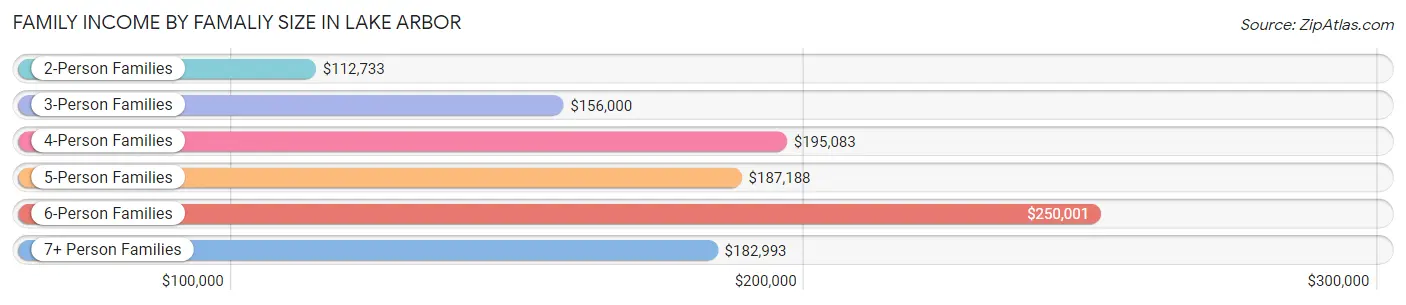
| Income Bracket | # Families | Median Income |
| 2-Person Families | 1,908 (53.1%) | $112,733 |
| 3-Person Families | 796 (22.2%) | $156,000 |
| 4-Person Families | 420 (11.7%) | $195,083 |
| 5-Person Families | 279 (7.8%) | $187,188 |
| 6-Person Families | 111 (3.1%) | $250,001 |
| 7+ Person Families | 79 (2.2%) | $182,993 |
| Total | 3,593 (100.0%) | $135,872 |
Family Income by Number of Earners in Lake Arbor
The median family income in Lake Arbor is $135,872, with families comprising 3+ earners (604) having the highest median family income of $241,830, while families with 1 earner (1,165) have the lowest median family income of $100,264, accounting for 16.8% and 32.4% of families, respectively.
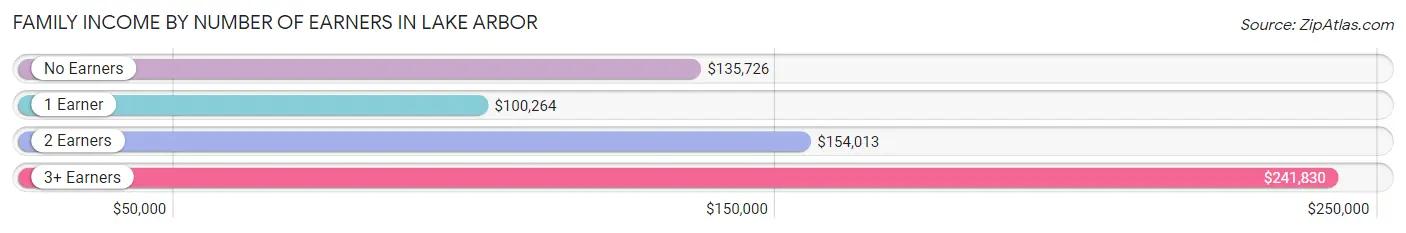
| Number of Earners | # Families | Median Income |
| No Earners | 355 (9.9%) | $135,726 |
| 1 Earner | 1,165 (32.4%) | $100,264 |
| 2 Earners | 1,469 (40.9%) | $154,013 |
| 3+ Earners | 604 (16.8%) | $241,830 |
| Total | 3,593 (100.0%) | $135,872 |
Household Income in Lake Arbor
Household Income Brackets in Lake Arbor
With 1,669 households falling in the category, the $100,000 to $149,999 income range is the most frequent in Lake Arbor, accounting for 27.0% of all households. In contrast, only 62 households (1.0%) fall into the $10,000 to $14,999 income bracket, making it the least populous group.
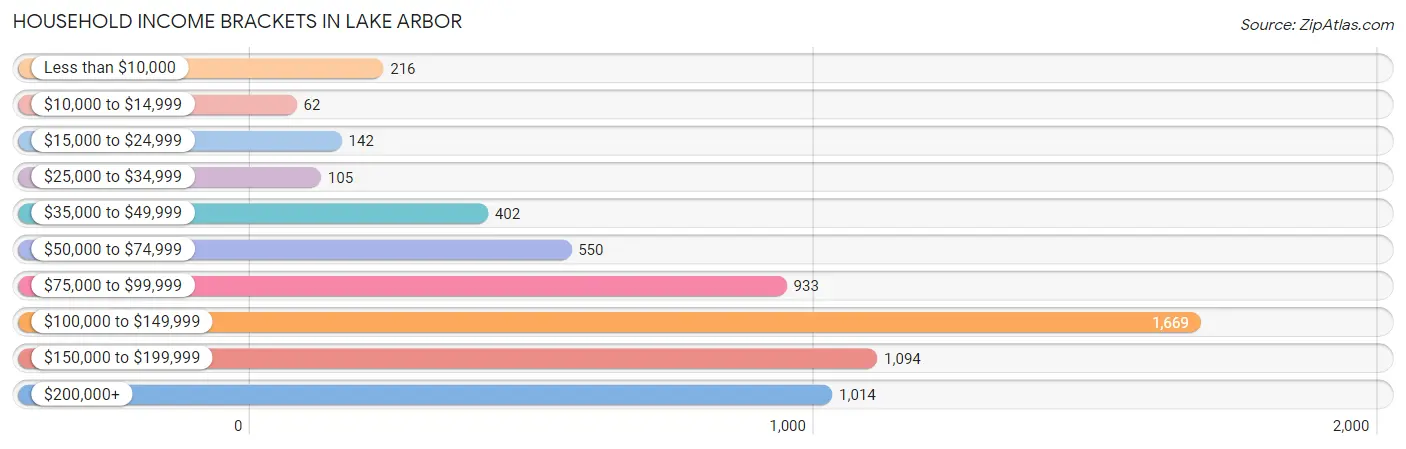
| Income Bracket | # Households | % Households |
| Less than $10,000 | 216 | 3.5% |
| $10,000 to $14,999 | 62 | 1.0% |
| $15,000 to $24,999 | 142 | 2.3% |
| $25,000 to $34,999 | 105 | 1.7% |
| $35,000 to $49,999 | 402 | 6.5% |
| $50,000 to $74,999 | 550 | 8.9% |
| $75,000 to $99,999 | 933 | 15.1% |
| $100,000 to $149,999 | 1,669 | 27.0% |
| $150,000 to $199,999 | 1,094 | 17.7% |
| $200,000+ | 1,014 | 16.4% |
Household Income by Householder Age in Lake Arbor
The median household income in Lake Arbor is $118,518, with the highest median household income of $143,000 found in the 45 to 64 years age bracket for the primary householder. A total of 2,664 households (43.1%) fall into this category. Meanwhile, the 15 to 24 years age bracket for the primary householder has the lowest median household income of $0, with 18 households (0.3%) in this group.
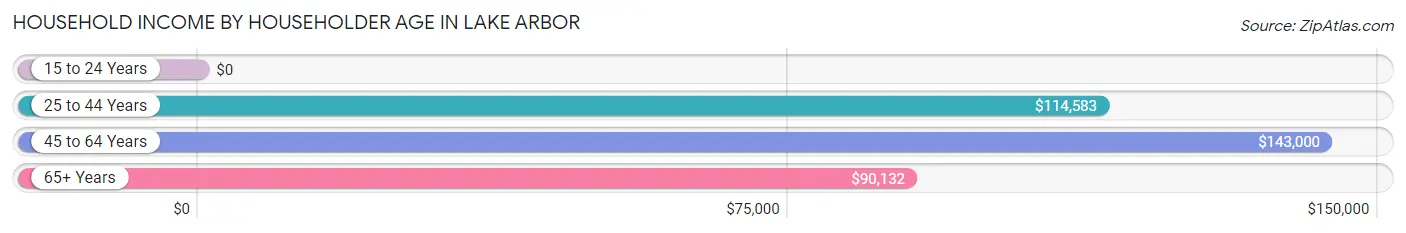
| Income Bracket | # Households | Median Income |
| 15 to 24 Years | 18 (0.3%) | $0 |
| 25 to 44 Years | 1,904 (30.8%) | $114,583 |
| 45 to 64 Years | 2,664 (43.1%) | $143,000 |
| 65+ Years | 1,594 (25.8%) | $90,132 |
| Total | 6,180 (100.0%) | $118,518 |
Poverty in Lake Arbor
Income Below Poverty by Sex and Age in Lake Arbor
With 5.8% poverty level for males and 6.4% for females among the residents of Lake Arbor, 5 year old males and 16 and 17 year old females are the most vulnerable to poverty, with 12 males (25.5%) and 25 females (27.2%) in their respective age groups living below the poverty level.
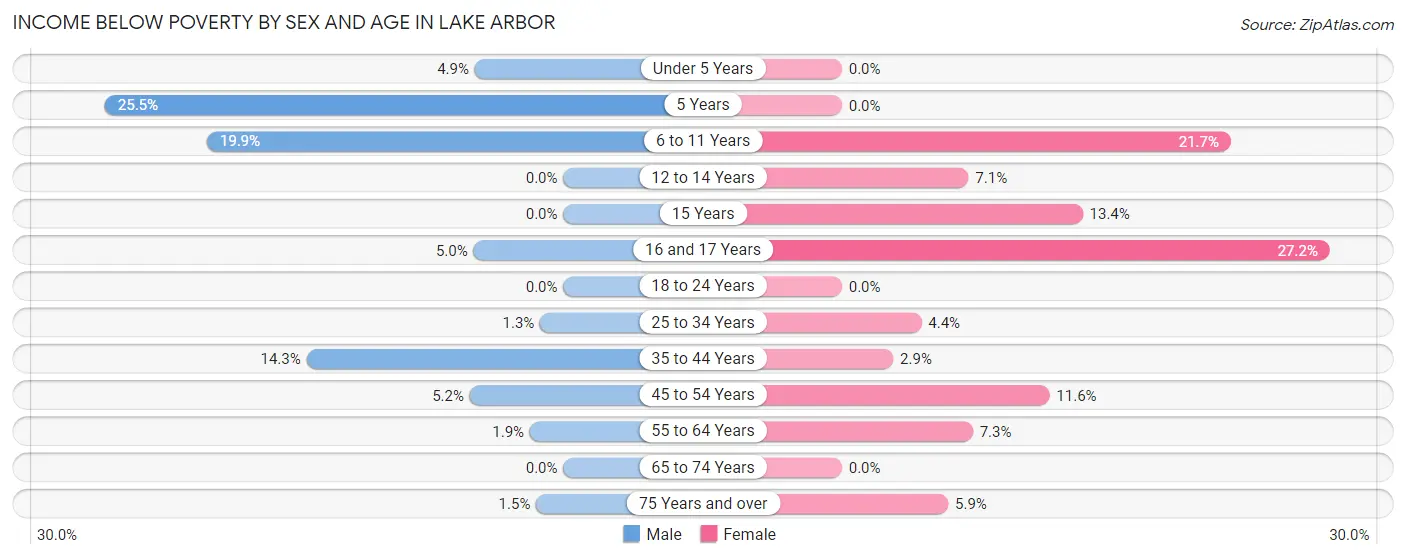
| Age Bracket | Male | Female |
| Under 5 Years | 18 (4.9%) | 0 (0.0%) |
| 5 Years | 12 (25.5%) | 0 (0.0%) |
| 6 to 11 Years | 103 (19.9%) | 102 (21.7%) |
| 12 to 14 Years | 0 (0.0%) | 22 (7.0%) |
| 15 Years | 0 (0.0%) | 11 (13.4%) |
| 16 and 17 Years | 12 (5.0%) | 25 (27.2%) |
| 18 to 24 Years | 0 (0.0%) | 0 (0.0%) |
| 25 to 34 Years | 11 (1.3%) | 42 (4.4%) |
| 35 to 44 Years | 148 (14.3%) | 36 (2.9%) |
| 45 to 54 Years | 62 (5.2%) | 156 (11.6%) |
| 55 to 64 Years | 18 (1.9%) | 74 (7.3%) |
| 65 to 74 Years | 0 (0.0%) | 0 (0.0%) |
| 75 Years and over | 8 (1.5%) | 40 (5.9%) |
| Total | 392 (5.8%) | 508 (6.4%) |
Income Above Poverty by Sex and Age in Lake Arbor
According to the poverty statistics in Lake Arbor, males aged 12 to 14 years and females aged under 5 years are the age groups that are most secure financially, with 100.0% of males and 100.0% of females in these age groups living above the poverty line.
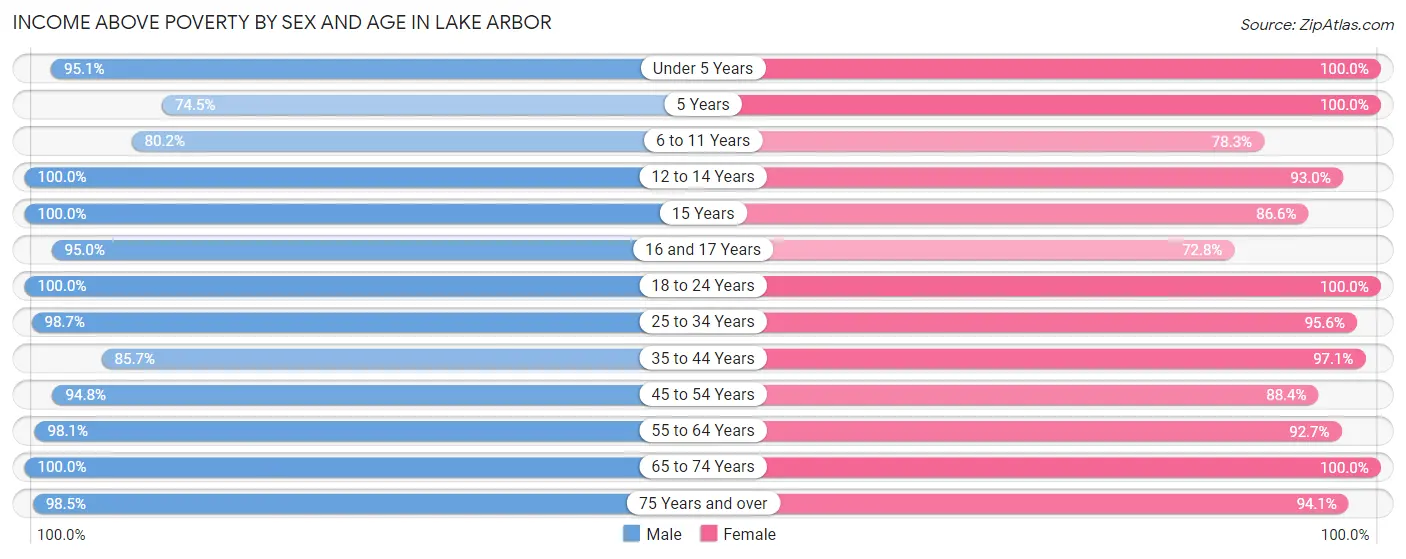
| Age Bracket | Male | Female |
| Under 5 Years | 347 (95.1%) | 340 (100.0%) |
| 5 Years | 35 (74.5%) | 67 (100.0%) |
| 6 to 11 Years | 416 (80.1%) | 369 (78.3%) |
| 12 to 14 Years | 217 (100.0%) | 290 (92.9%) |
| 15 Years | 71 (100.0%) | 71 (86.6%) |
| 16 and 17 Years | 228 (95.0%) | 67 (72.8%) |
| 18 to 24 Years | 359 (100.0%) | 445 (100.0%) |
| 25 to 34 Years | 842 (98.7%) | 907 (95.6%) |
| 35 to 44 Years | 887 (85.7%) | 1,222 (97.1%) |
| 45 to 54 Years | 1,129 (94.8%) | 1,193 (88.4%) |
| 55 to 64 Years | 949 (98.1%) | 941 (92.7%) |
| 65 to 74 Years | 415 (100.0%) | 866 (100.0%) |
| 75 Years and over | 523 (98.5%) | 636 (94.1%) |
| Total | 6,418 (94.2%) | 7,414 (93.6%) |
Income Below Poverty Among Married-Couple Families in Lake Arbor
The poverty statistics for married-couple families in Lake Arbor show that 2.6% or 50 of the total 1,926 families live below the poverty line. Families with 5 or more children have the highest poverty rate of 100.0%, comprising of 12 families. On the other hand, families with 3 or 4 children have the lowest poverty rate of 0.0%, which includes 0 families.
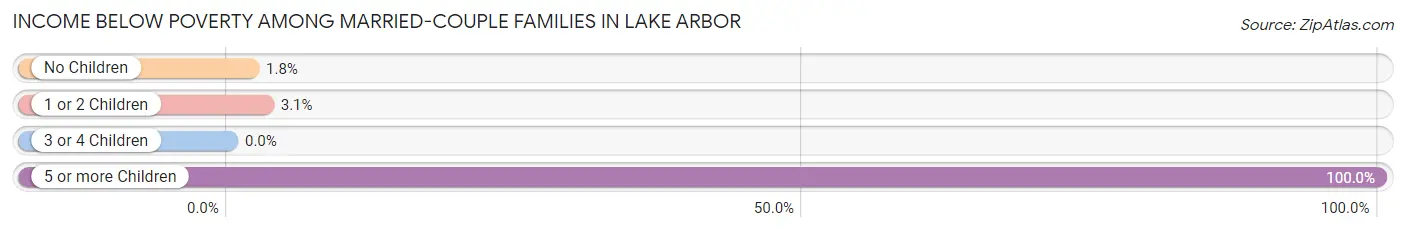
| Children | Above Poverty | Below Poverty |
| No Children | 1,231 (98.2%) | 23 (1.8%) |
| 1 or 2 Children | 468 (96.9%) | 15 (3.1%) |
| 3 or 4 Children | 177 (100.0%) | 0 (0.0%) |
| 5 or more Children | 0 (0.0%) | 12 (100.0%) |
| Total | 1,876 (97.4%) | 50 (2.6%) |
Income Below Poverty Among Single-Parent Households in Lake Arbor
According to the poverty data in Lake Arbor, 24.9% or 88 single-father households and 1.9% or 25 single-mother households are living below the poverty line. Among single-father households, those with 1 or 2 children have the highest poverty rate, with 88 households (40.0%) experiencing poverty. Likewise, among single-mother households, those with 1 or 2 children have the highest poverty rate, with 25 households (3.3%) falling below the poverty line.
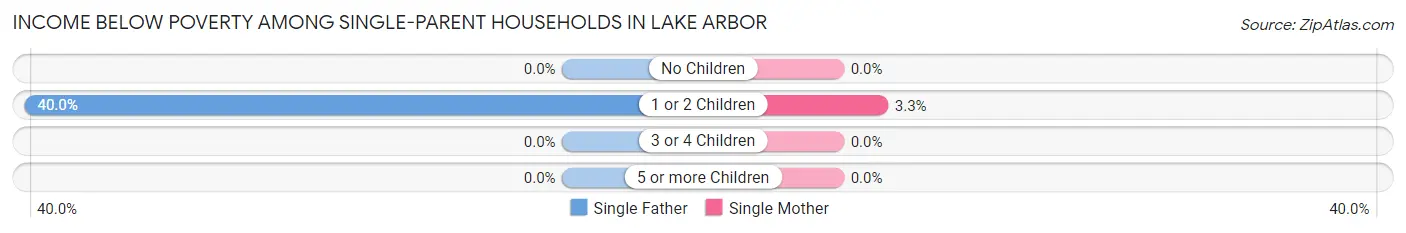
| Children | Single Father | Single Mother |
| No Children | 0 (0.0%) | 0 (0.0%) |
| 1 or 2 Children | 88 (40.0%) | 25 (3.3%) |
| 3 or 4 Children | 0 (0.0%) | 0 (0.0%) |
| 5 or more Children | 0 (0.0%) | 0 (0.0%) |
| Total | 88 (24.9%) | 25 (1.9%) |
Income Below Poverty Among Married-Couple vs Single-Parent Households in Lake Arbor
The poverty data for Lake Arbor shows that 50 of the married-couple family households (2.6%) and 113 of the single-parent households (6.8%) are living below the poverty level. Within the married-couple family households, those with 5 or more children have the highest poverty rate, with 12 households (100.0%) falling below the poverty line. Among the single-parent households, those with 1 or 2 children have the highest poverty rate, with 113 household (11.5%) living below poverty.
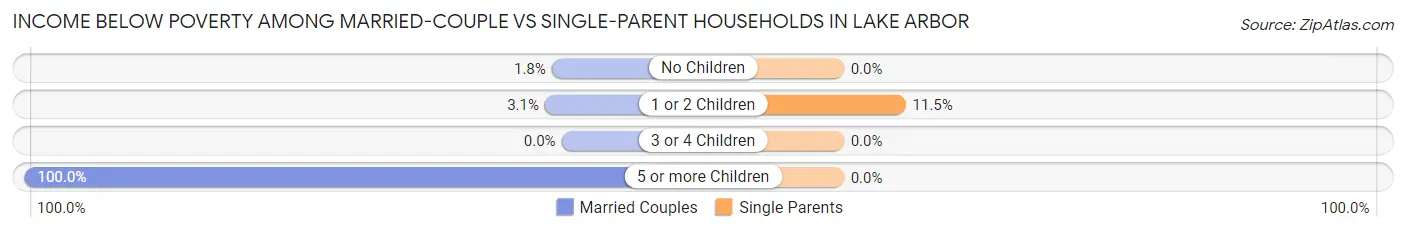
| Children | Married-Couple Families | Single-Parent Households |
| No Children | 23 (1.8%) | 0 (0.0%) |
| 1 or 2 Children | 15 (3.1%) | 113 (11.5%) |
| 3 or 4 Children | 0 (0.0%) | 0 (0.0%) |
| 5 or more Children | 12 (100.0%) | 0 (0.0%) |
| Total | 50 (2.6%) | 113 (6.8%) |
Race in Lake Arbor
The most populous races in Lake Arbor are Black / African American (13,057 | 87.6%), White / Caucasian (1,138 | 7.6%), and Hispanic or Latino (608 | 4.1%).
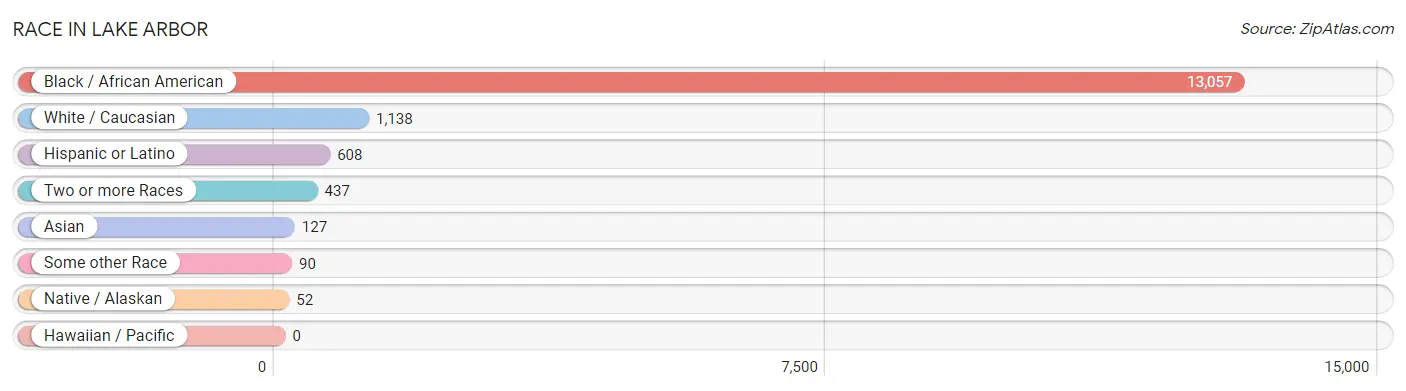
| Race | # Population | % Population |
| Asian | 127 | 0.9% |
| Black / African American | 13,057 | 87.6% |
| Hawaiian / Pacific | 0 | 0.0% |
| Hispanic or Latino | 608 | 4.1% |
| Native / Alaskan | 52 | 0.4% |
| White / Caucasian | 1,138 | 7.6% |
| Two or more Races | 437 | 2.9% |
| Some other Race | 90 | 0.6% |
| Total | 14,901 | 100.0% |
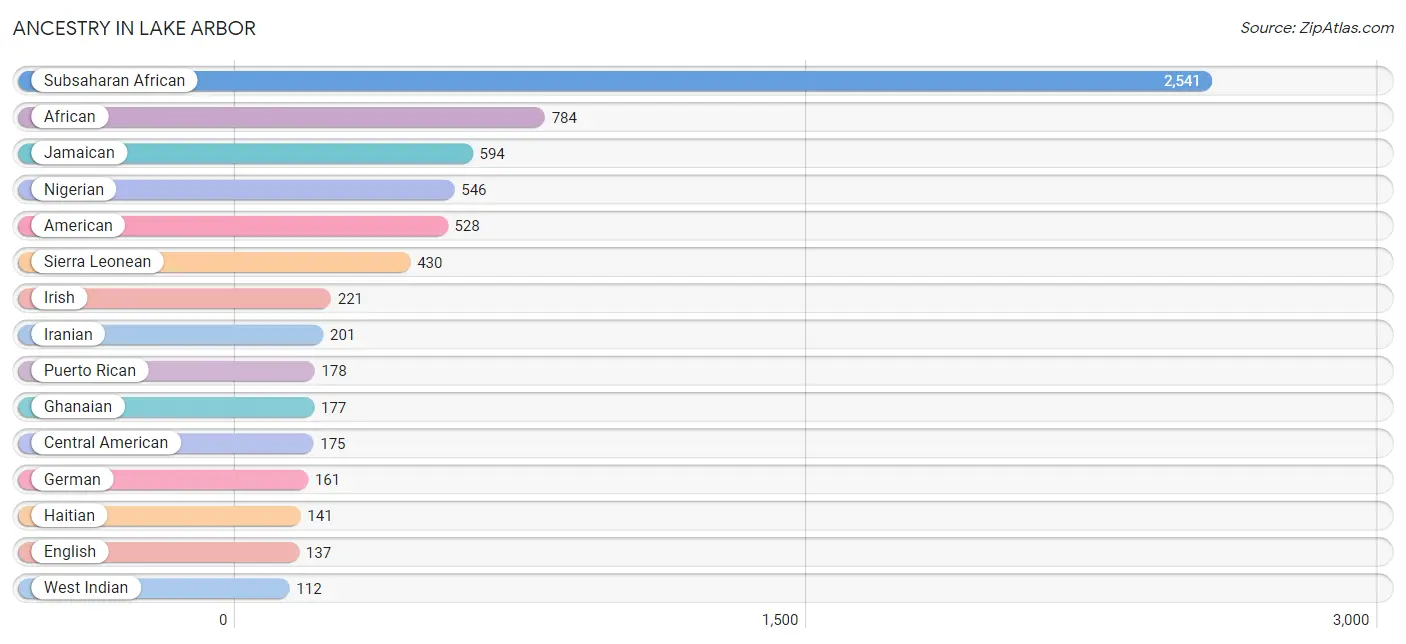
Ancestry in Lake Arbor
The most populous ancestries reported in Lake Arbor are Subsaharan African (2,541 | 17.1%), African (784 | 5.3%), Jamaican (594 | 4.0%), Nigerian (546 | 3.7%), and American (528 | 3.5%), together accounting for 33.5% of all Lake Arbor residents.
| Ancestry | # Population | % Population |
| African | 784 | 5.3% |
| American | 528 | 3.5% |
| Blackfeet | 56 | 0.4% |
| British West Indian | 10 | 0.1% |
| Burmese | 99 | 0.7% |
| Cape Verdean | 22 | 0.2% |
| Central American | 175 | 1.2% |
| Central American Indian | 41 | 0.3% |
| Colombian | 30 | 0.2% |
| Danish | 20 | 0.1% |
| Dominican | 99 | 0.7% |
| Dutch | 16 | 0.1% |
| Eastern European | 30 | 0.2% |
| English | 137 | 0.9% |
| Ethiopian | 10 | 0.1% |
| European | 50 | 0.3% |
| Filipino | 17 | 0.1% |
| French | 32 | 0.2% |
| French Canadian | 17 | 0.1% |
| German | 161 | 1.1% |
| Ghanaian | 177 | 1.2% |
| Guyanese | 80 | 0.5% |
| Haitian | 141 | 0.9% |
| Honduran | 45 | 0.3% |
| Indian (Asian) | 13 | 0.1% |
| Iranian | 201 | 1.3% |
| Irish | 221 | 1.5% |
| Italian | 66 | 0.4% |
| Jamaican | 594 | 4.0% |
| Kenyan | 69 | 0.5% |
| Korean | 54 | 0.4% |
| Lumbee | 13 | 0.1% |
| Mexican | 58 | 0.4% |
| Nicaraguan | 45 | 0.3% |
| Nigerian | 546 | 3.7% |
| Norwegian | 26 | 0.2% |
| Peruvian | 24 | 0.2% |
| Polish | 15 | 0.1% |
| Portuguese | 70 | 0.5% |
| Puerto Rican | 178 | 1.2% |
| Salvadoran | 85 | 0.6% |
| Scotch-Irish | 22 | 0.2% |
| Scottish | 37 | 0.3% |
| Sierra Leonean | 430 | 2.9% |
| South American | 54 | 0.4% |
| Subsaharan African | 2,541 | 17.1% |
| Thai | 22 | 0.2% |
| Trinidadian and Tobagonian | 82 | 0.5% |
| West Indian | 112 | 0.7% | View All 49 Rows |
Immigrants in Lake Arbor
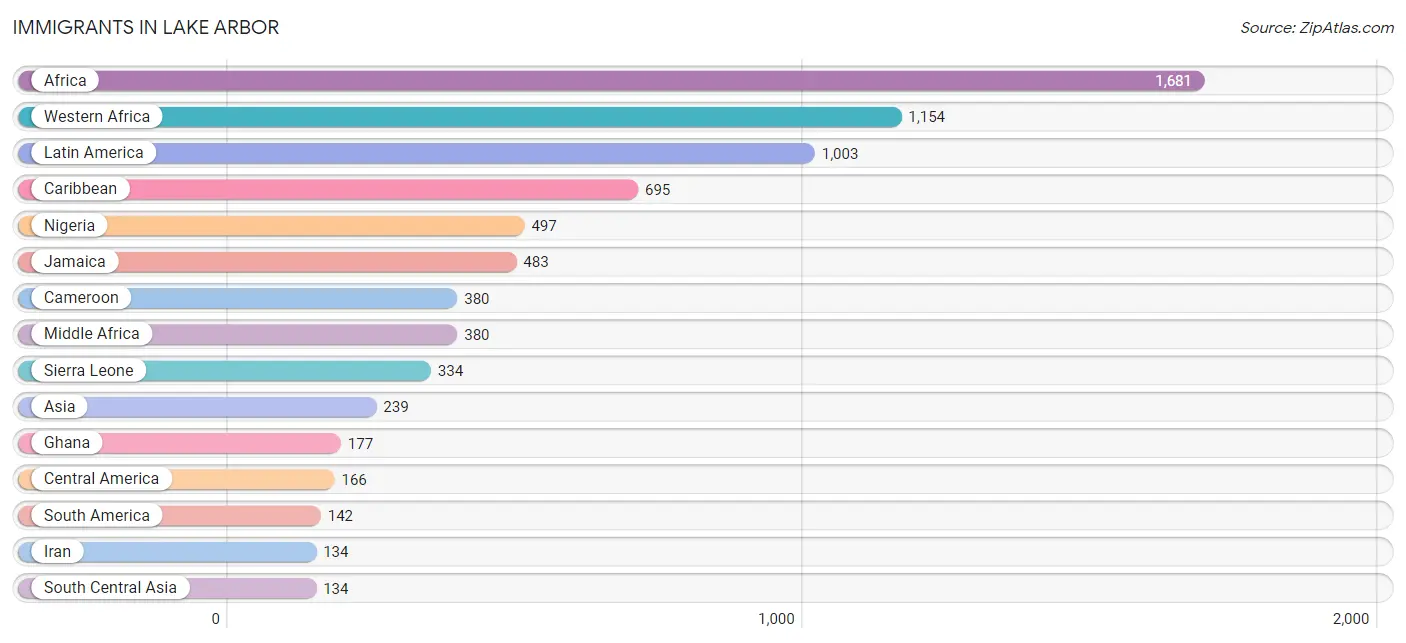
The most numerous immigrant groups reported in Lake Arbor came from Africa (1,681 | 11.3%), Western Africa (1,154 | 7.7%), Latin America (1,003 | 6.7%), Caribbean (695 | 4.7%), and Nigeria (497 | 3.3%), together accounting for 33.7% of all Lake Arbor residents.
| Immigration Origin | # Population | % Population |
| Africa | 1,681 | 11.3% |
| Asia | 239 | 1.6% |
| Cameroon | 380 | 2.5% |
| Caribbean | 695 | 4.7% |
| Central America | 166 | 1.1% |
| China | 17 | 0.1% |
| Colombia | 30 | 0.2% |
| Dominican Republic | 62 | 0.4% |
| Eastern Africa | 102 | 0.7% |
| Eastern Asia | 51 | 0.3% |
| El Salvador | 52 | 0.4% |
| England | 55 | 0.4% |
| Europe | 92 | 0.6% |
| France | 4 | 0.0% |
| Germany | 33 | 0.2% |
| Ghana | 177 | 1.2% |
| Guyana | 112 | 0.7% |
| Haiti | 23 | 0.2% |
| Honduras | 27 | 0.2% |
| Iran | 134 | 0.9% |
| Jamaica | 483 | 3.2% |
| Kenya | 69 | 0.5% |
| Korea | 34 | 0.2% |
| Latin America | 1,003 | 6.7% |
| Liberia | 21 | 0.1% |
| Middle Africa | 380 | 2.5% |
| Nicaragua | 45 | 0.3% |
| Nigeria | 497 | 3.3% |
| Northern Europe | 55 | 0.4% |
| Panama | 42 | 0.3% |
| Philippines | 54 | 0.4% |
| Sierra Leone | 334 | 2.2% |
| South America | 142 | 0.9% |
| South Central Asia | 134 | 0.9% |
| South Eastern Asia | 54 | 0.4% |
| Taiwan | 17 | 0.1% |
| Trinidad and Tobago | 55 | 0.4% |
| West Indies | 56 | 0.4% |
| Western Africa | 1,154 | 7.7% |
| Western Europe | 37 | 0.3% | View All 40 Rows |
Sex and Age in Lake Arbor
Sex and Age in Lake Arbor
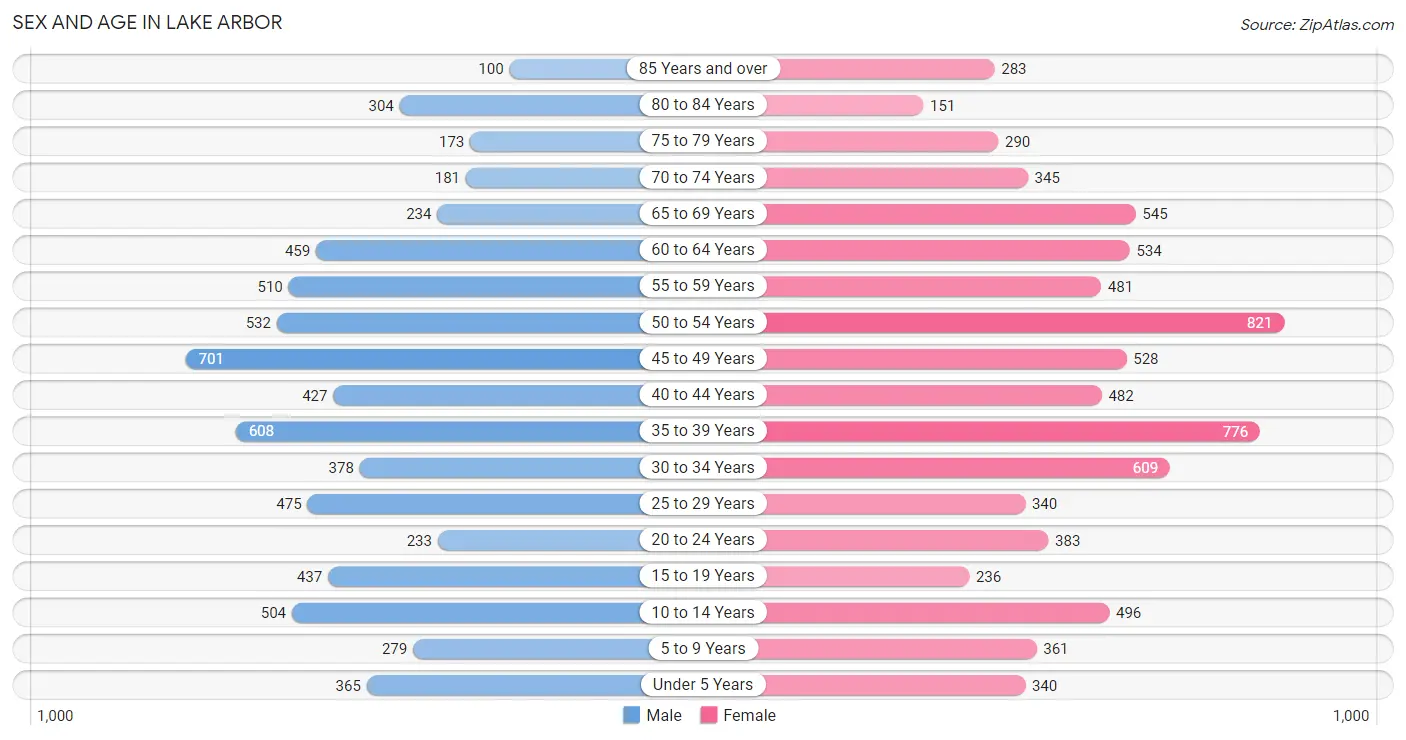
The most populous age groups in Lake Arbor are 45 to 49 Years (701 | 10.2%) for men and 50 to 54 Years (821 | 10.3%) for women.
| Age Bracket | Male | Female |
| Under 5 Years | 365 (5.3%) | 340 (4.3%) |
| 5 to 9 Years | 279 (4.0%) | 361 (4.5%) |
| 10 to 14 Years | 504 (7.3%) | 496 (6.2%) |
| 15 to 19 Years | 437 (6.3%) | 236 (2.9%) |
| 20 to 24 Years | 233 (3.4%) | 383 (4.8%) |
| 25 to 29 Years | 475 (6.9%) | 340 (4.3%) |
| 30 to 34 Years | 378 (5.5%) | 609 (7.6%) |
| 35 to 39 Years | 608 (8.8%) | 776 (9.7%) |
| 40 to 44 Years | 427 (6.2%) | 482 (6.0%) |
| 45 to 49 Years | 701 (10.2%) | 528 (6.6%) |
| 50 to 54 Years | 532 (7.7%) | 821 (10.3%) |
| 55 to 59 Years | 510 (7.4%) | 481 (6.0%) |
| 60 to 64 Years | 459 (6.7%) | 534 (6.7%) |
| 65 to 69 Years | 234 (3.4%) | 545 (6.8%) |
| 70 to 74 Years | 181 (2.6%) | 345 (4.3%) |
| 75 to 79 Years | 173 (2.5%) | 290 (3.6%) |
| 80 to 84 Years | 304 (4.4%) | 151 (1.9%) |
| 85 Years and over | 100 (1.5%) | 283 (3.5%) |
| Total | 6,900 (100.0%) | 8,001 (100.0%) |
Families and Households in Lake Arbor
Median Family Size in Lake Arbor
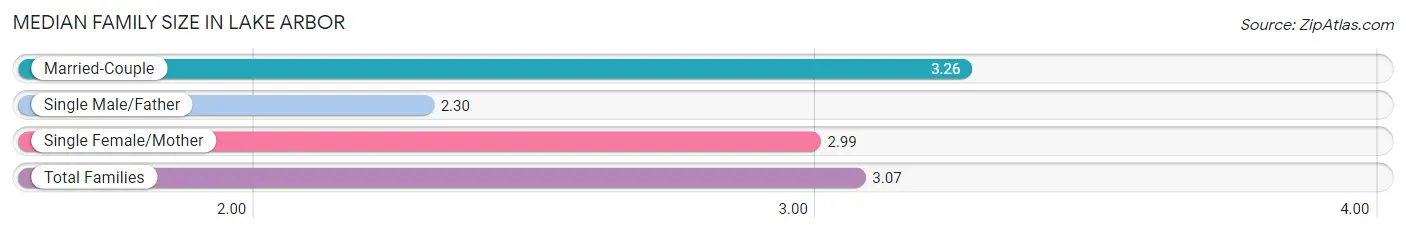
The median family size in Lake Arbor is 3.07 persons per family, with married-couple families (1,926 | 53.6%) accounting for the largest median family size of 3.26 persons per family. On the other hand, single male/father families (353 | 9.8%) represent the smallest median family size with 2.30 persons per family.
| Family Type | # Families | Family Size |
| Married-Couple | 1,926 (53.6%) | 3.26 |
| Single Male/Father | 353 (9.8%) | 2.30 |
| Single Female/Mother | 1,314 (36.6%) | 2.99 |
| Total Families | 3,593 (100.0%) | 3.07 |
Median Household Size in Lake Arbor
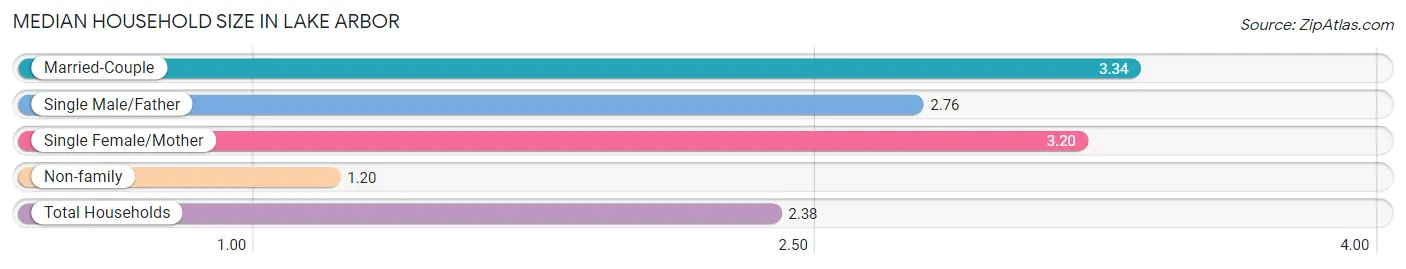
The median household size in Lake Arbor is 2.38 persons per household, with married-couple households (1,926 | 31.2%) accounting for the largest median household size of 3.34 persons per household. non-family households (2,587 | 41.9%) represent the smallest median household size with 1.20 persons per household.
| Household Type | # Households | Household Size |
| Married-Couple | 1,926 (31.2%) | 3.34 |
| Single Male/Father | 353 (5.7%) | 2.76 |
| Single Female/Mother | 1,314 (21.3%) | 3.20 |
| Non-family | 2,587 (41.9%) | 1.20 |
| Total Households | 6,180 (100.0%) | 2.38 |
Household Size by Marriage Status in Lake Arbor
Out of a total of 6,180 households in Lake Arbor, 3,593 (58.1%) are family households, while 2,587 (41.9%) are nonfamily households. The most numerous type of family households are 2-person households, comprising 1,638, and the most common type of nonfamily households are 1-person households, comprising 2,258.
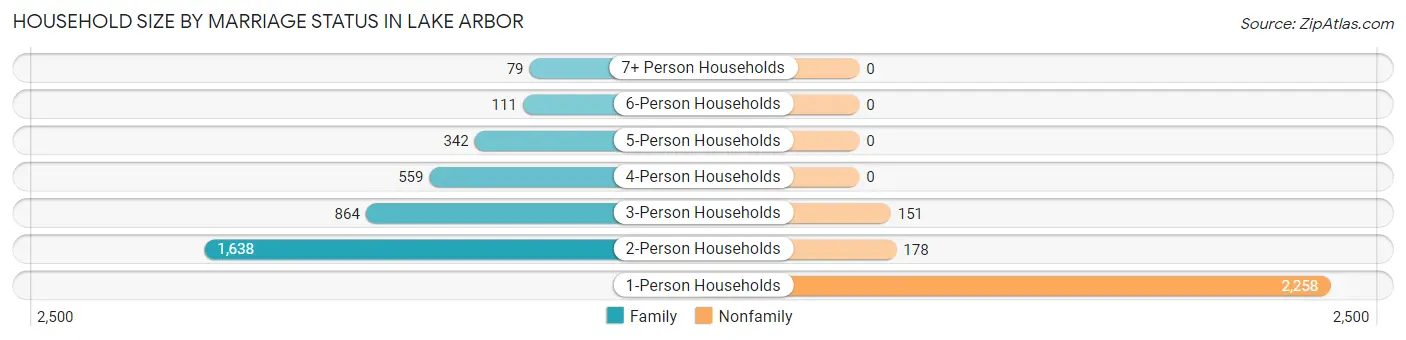
| Household Size | Family Households | Nonfamily Households |
| 1-Person Households | - | 2,258 (36.5%) |
| 2-Person Households | 1,638 (26.5%) | 178 (2.9%) |
| 3-Person Households | 864 (14.0%) | 151 (2.4%) |
| 4-Person Households | 559 (9.0%) | 0 (0.0%) |
| 5-Person Households | 342 (5.5%) | 0 (0.0%) |
| 6-Person Households | 111 (1.8%) | 0 (0.0%) |
| 7+ Person Households | 79 (1.3%) | 0 (0.0%) |
| Total | 3,593 (58.1%) | 2,587 (41.9%) |
Female Fertility in Lake Arbor
Fertility by Age in Lake Arbor
Average fertility rate in Lake Arbor is 40.0 births per 1,000 women. Women in the age bracket of 35 to 50 years have the highest fertility rate with 44.0 births per 1,000 women. Women in the age bracket of 35 to 50 years acount for 60.8% of all women with births.
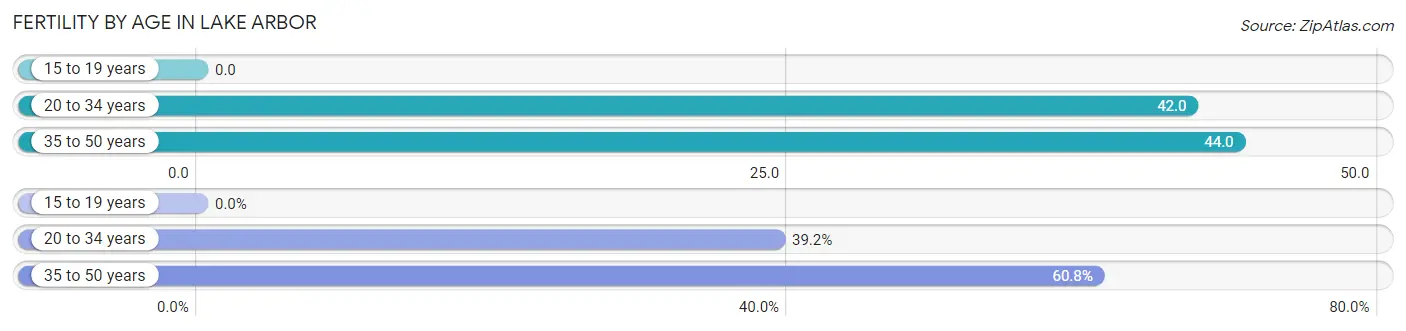
| Age Bracket | Women with Births | Births / 1,000 Women |
| 15 to 19 years | 0 (0.0%) | 0.0 |
| 20 to 34 years | 56 (39.2%) | 42.0 |
| 35 to 50 years | 87 (60.8%) | 44.0 |
| Total | 143 (100.0%) | 40.0 |
Fertility by Age by Marriage Status in Lake Arbor
74.1% of women with births (143) in Lake Arbor are married. The highest percentage of unmarried women with births falls into 20 to 34 years age bracket with 66.1% of them unmarried at the time of birth, while the lowest percentage of unmarried women with births belong to 35 to 50 years age bracket with 0.0% of them unmarried.
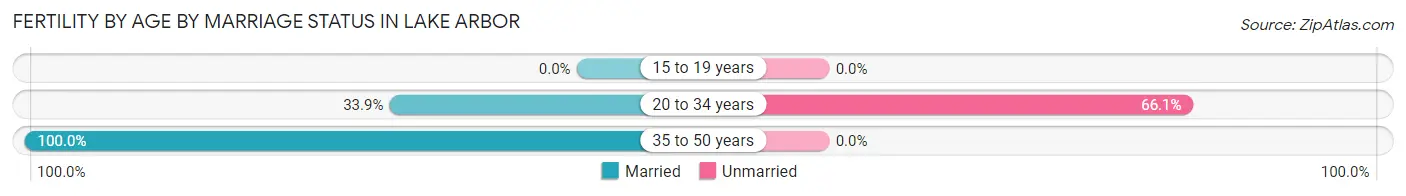
| Age Bracket | Married | Unmarried |
| 15 to 19 years | 0 (0.0%) | 0 (0.0%) |
| 20 to 34 years | 19 (33.9%) | 37 (66.1%) |
| 35 to 50 years | 87 (100.0%) | 0 (0.0%) |
| Total | 106 (74.1%) | 37 (25.9%) |
Fertility by Education in Lake Arbor
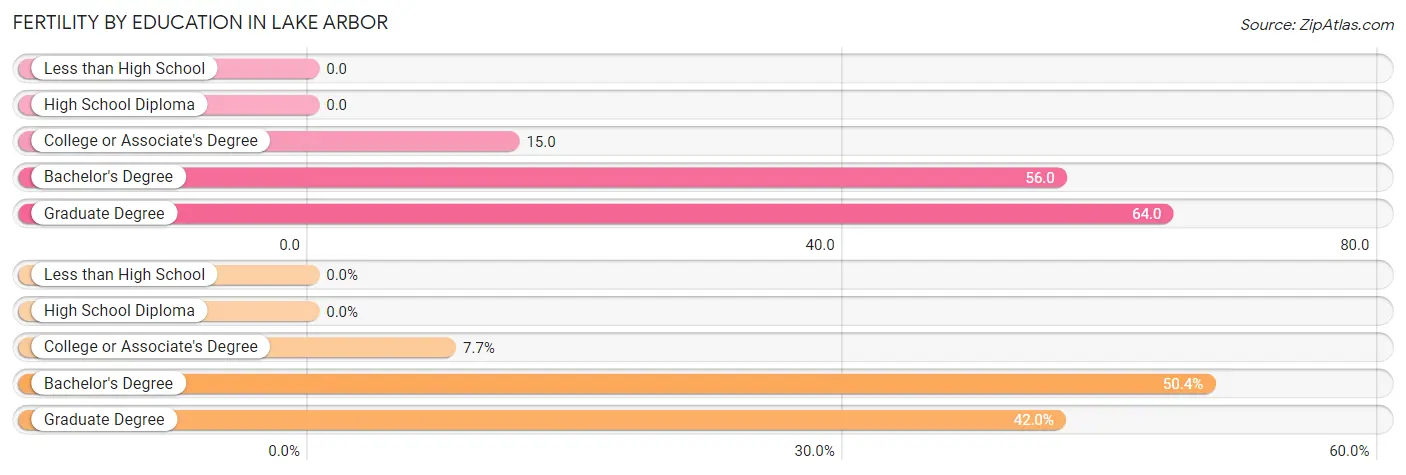
| Educational Attainment | Women with Births | Births / 1,000 Women |
| Less than High School | 0 (0.0%) | 0.0 |
| High School Diploma | 0 (0.0%) | 0.0 |
| College or Associate's Degree | 11 (7.7%) | 15.0 |
| Bachelor's Degree | 72 (50.3%) | 56.0 |
| Graduate Degree | 60 (42.0%) | 64.0 |
| Total | 143 (100.0%) | 40.0 |
Fertility by Education by Marriage Status in Lake Arbor
25.9% of women with births in Lake Arbor are unmarried. Women with the educational attainment of college or associate's degree are most likely to be married with 100.0% of them married at childbirth, while women with the educational attainment of graduate degree are least likely to be married with 61.7% of them unmarried at childbirth.
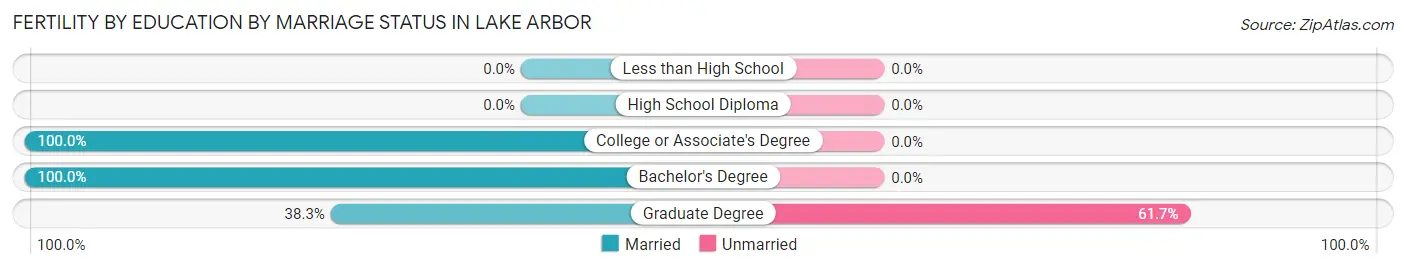
| Educational Attainment | Married | Unmarried |
| Less than High School | 0 (0.0%) | 0 (0.0%) |
| High School Diploma | 0 (0.0%) | 0 (0.0%) |
| College or Associate's Degree | 11 (100.0%) | 0 (0.0%) |
| Bachelor's Degree | 72 (100.0%) | 0 (0.0%) |
| Graduate Degree | 23 (38.3%) | 37 (61.7%) |
| Total | 106 (74.1%) | 37 (25.9%) |
Employment Characteristics in Lake Arbor
Employment by Class of Employer in Lake Arbor
Among the 8,487 employed individuals in Lake Arbor, private company employees (3,959 | 46.7%), federal government employees (1,520 | 17.9%), and not-for-profit organizations (1,078 | 12.7%) make up the most common classes of employment.
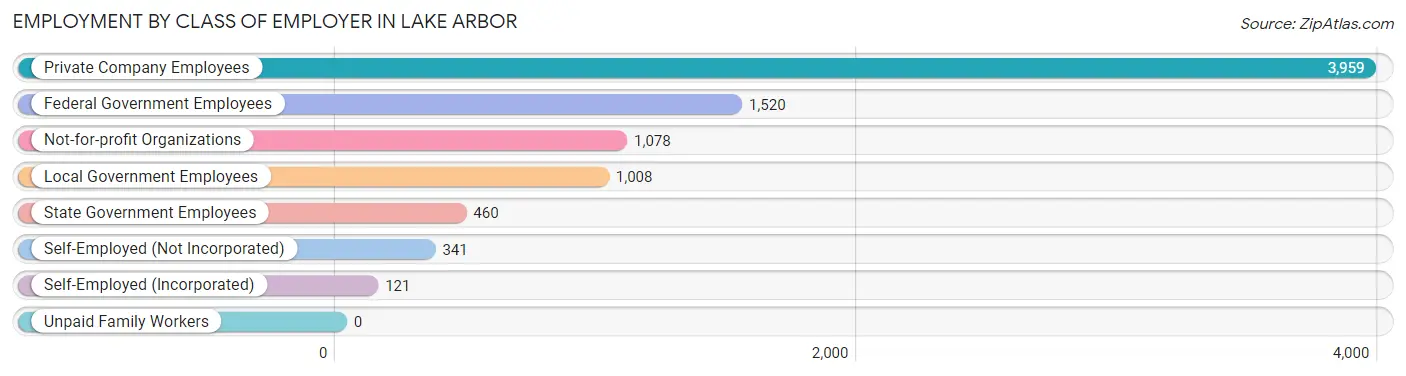
| Employer Class | # Employees | % Employees |
| Private Company Employees | 3,959 | 46.7% |
| Self-Employed (Incorporated) | 121 | 1.4% |
| Self-Employed (Not Incorporated) | 341 | 4.0% |
| Not-for-profit Organizations | 1,078 | 12.7% |
| Local Government Employees | 1,008 | 11.9% |
| State Government Employees | 460 | 5.4% |
| Federal Government Employees | 1,520 | 17.9% |
| Unpaid Family Workers | 0 | 0.0% |
| Total | 8,487 | 100.0% |
Employment Status by Age in Lake Arbor
According to the labor force statistics for Lake Arbor, out of the total population over 16 years of age (12,403), 73.4% or 9,104 individuals are in the labor force, with 5.1% or 464 of them unemployed. The age group with the highest labor force participation rate is 35 to 44 years, with 97.2% or 2,229 individuals in the labor force. Within the labor force, the 55 to 59 years age range has the highest percentage of unemployed individuals, with 10.2% or 89 of them being unemployed.
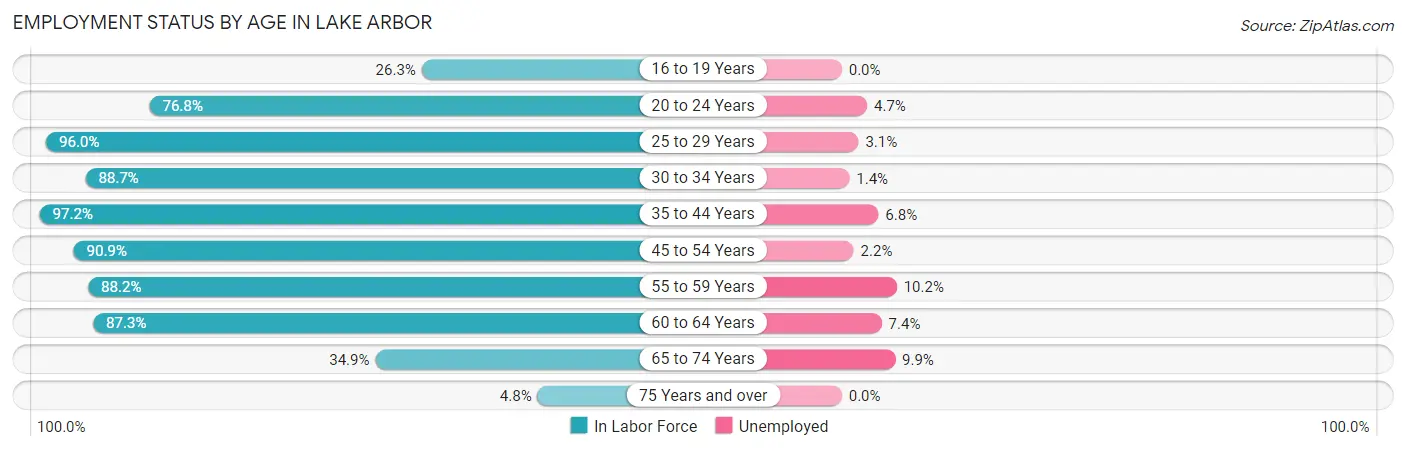
| Age Bracket | In Labor Force | Unemployed |
| 16 to 19 Years | 137 (26.3%) | 0 (0.0%) |
| 20 to 24 Years | 473 (76.8%) | 22 (4.7%) |
| 25 to 29 Years | 782 (96.0%) | 24 (3.1%) |
| 30 to 34 Years | 875 (88.7%) | 12 (1.4%) |
| 35 to 44 Years | 2,229 (97.2%) | 152 (6.8%) |
| 45 to 54 Years | 2,347 (90.9%) | 52 (2.2%) |
| 55 to 59 Years | 874 (88.2%) | 89 (10.2%) |
| 60 to 64 Years | 867 (87.3%) | 64 (7.4%) |
| 65 to 74 Years | 455 (34.9%) | 45 (9.9%) |
| 75 Years and over | 62 (4.8%) | 0 (0.0%) |
| Total | 9,104 (73.4%) | 464 (5.1%) |
Employment Status by Educational Attainment in Lake Arbor
According to labor force statistics for Lake Arbor, 92.1% of individuals (7,977) out of the total population between 25 and 64 years of age (8,661) are in the labor force, with 4.9% or 391 of them being unemployed. The group with the highest labor force participation rate are those with the educational attainment of bachelor's degree or higher, with 97.2% or 4,813 individuals in the labor force. Within the labor force, individuals with high school diploma education have the highest percentage of unemployment, with 15.9% or 151 of them being unemployed.
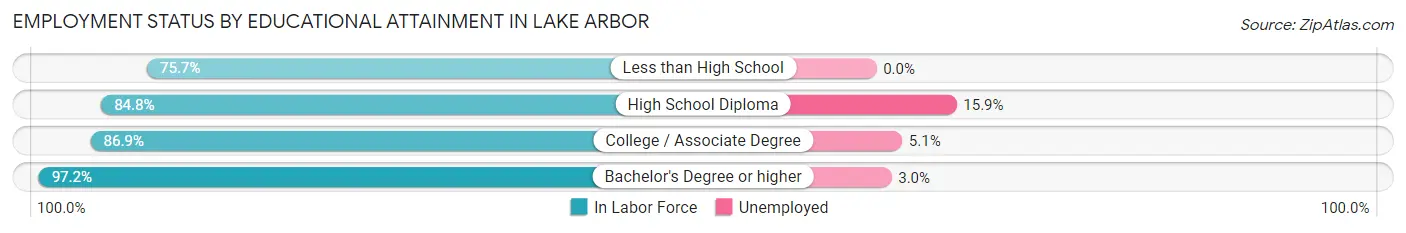
| Educational Attainment | In Labor Force | Unemployed |
| Less than High School | 289 (75.7%) | 0 (0.0%) |
| High School Diploma | 951 (84.8%) | 178 (15.9%) |
| College / Associate Degree | 1,917 (86.9%) | 113 (5.1%) |
| Bachelor's Degree or higher | 4,813 (97.2%) | 149 (3.0%) |
| Total | 7,977 (92.1%) | 424 (4.9%) |
Employment Occupations by Sex in Lake Arbor
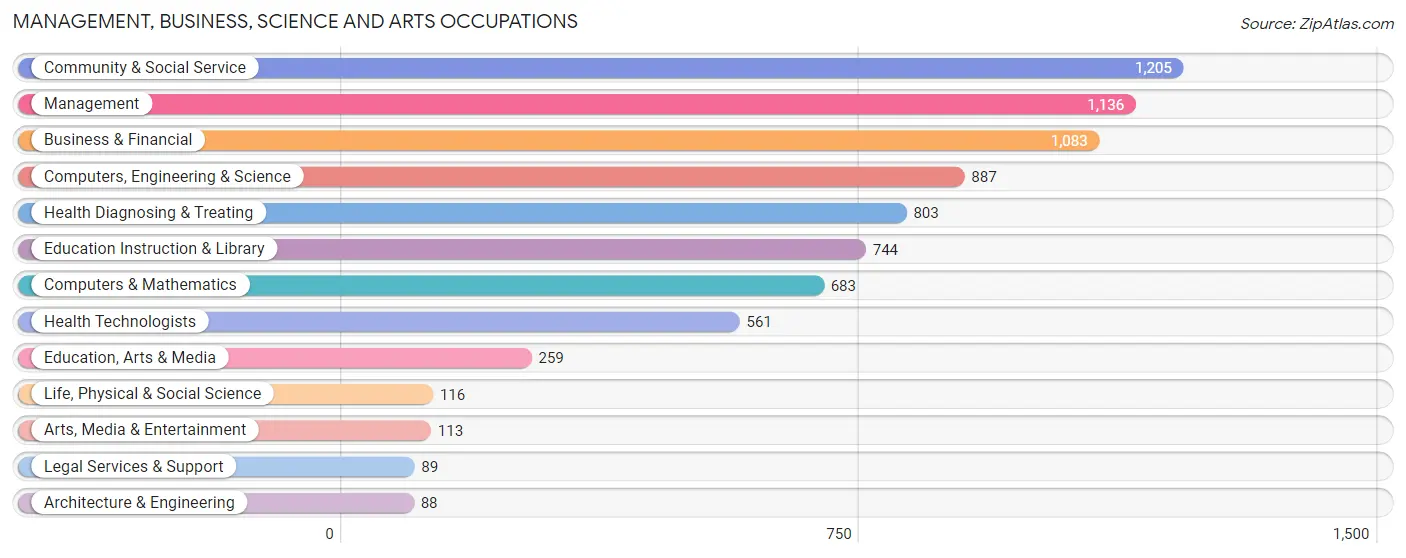
Management, Business, Science and Arts Occupations
The most common Management, Business, Science and Arts occupations in Lake Arbor are Community & Social Service (1,205 | 14.2%), Management (1,136 | 13.4%), Business & Financial (1,083 | 12.8%), Computers, Engineering & Science (887 | 10.4%), and Health Diagnosing & Treating (803 | 9.5%).
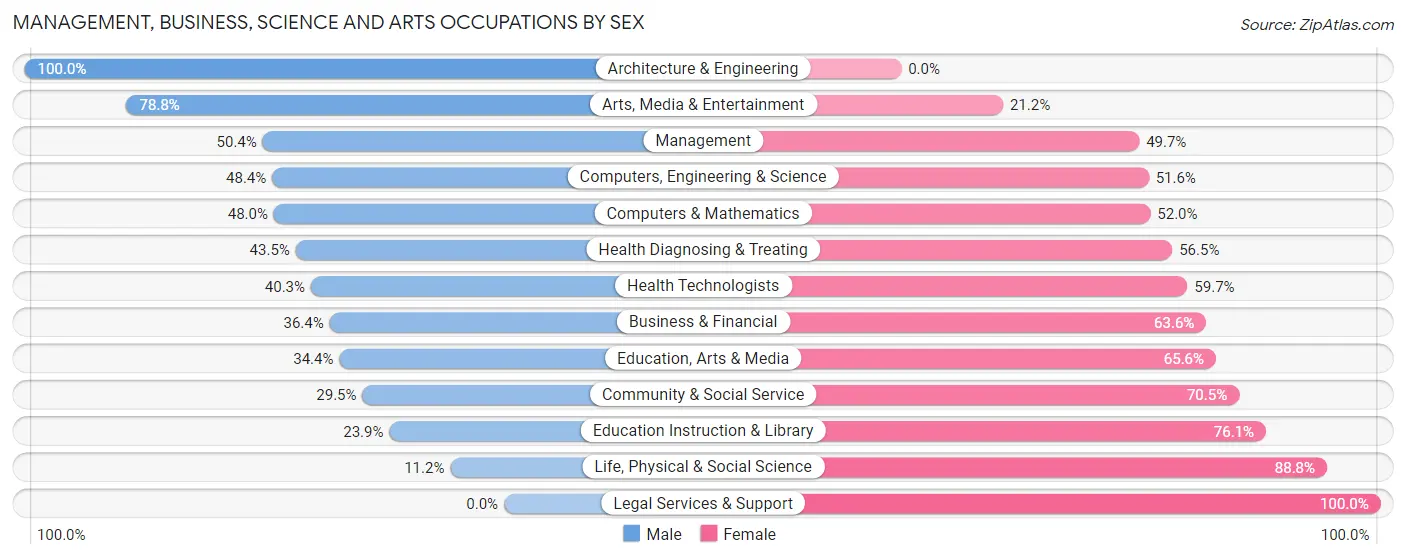
Management, Business, Science and Arts Occupations by Sex
Within the Management, Business, Science and Arts occupations in Lake Arbor, the most male-oriented occupations are Architecture & Engineering (100.0%), Arts, Media & Entertainment (78.8%), and Management (50.3%), while the most female-oriented occupations are Legal Services & Support (100.0%), Life, Physical & Social Science (88.8%), and Education Instruction & Library (76.1%).
| Occupation | Male | Female |
| Management | 572 (50.3%) | 564 (49.6%) |
| Business & Financial | 394 (36.4%) | 689 (63.6%) |
| Computers, Engineering & Science | 429 (48.4%) | 458 (51.6%) |
| Computers & Mathematics | 328 (48.0%) | 355 (52.0%) |
| Architecture & Engineering | 88 (100.0%) | 0 (0.0%) |
| Life, Physical & Social Science | 13 (11.2%) | 103 (88.8%) |
| Community & Social Service | 356 (29.5%) | 849 (70.5%) |
| Education, Arts & Media | 89 (34.4%) | 170 (65.6%) |
| Legal Services & Support | 0 (0.0%) | 89 (100.0%) |
| Education Instruction & Library | 178 (23.9%) | 566 (76.1%) |
| Arts, Media & Entertainment | 89 (78.8%) | 24 (21.2%) |
| Health Diagnosing & Treating | 349 (43.5%) | 454 (56.5%) |
| Health Technologists | 226 (40.3%) | 335 (59.7%) |
| Total (Category) | 2,100 (41.1%) | 3,014 (58.9%) |
| Total (Overall) | 3,956 (46.6%) | 4,538 (53.4%) |
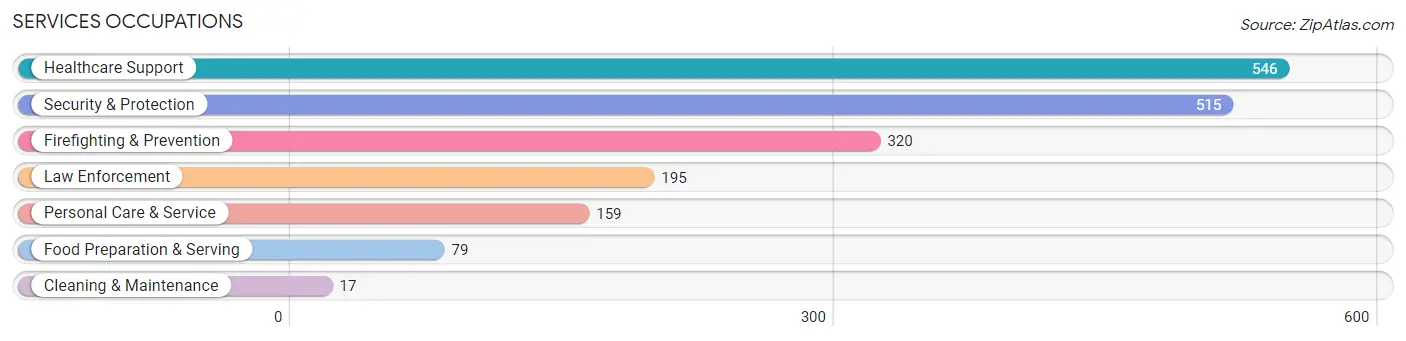
Services Occupations
The most common Services occupations in Lake Arbor are Healthcare Support (546 | 6.4%), Security & Protection (515 | 6.1%), Firefighting & Prevention (320 | 3.8%), Law Enforcement (195 | 2.3%), and Personal Care & Service (159 | 1.9%).
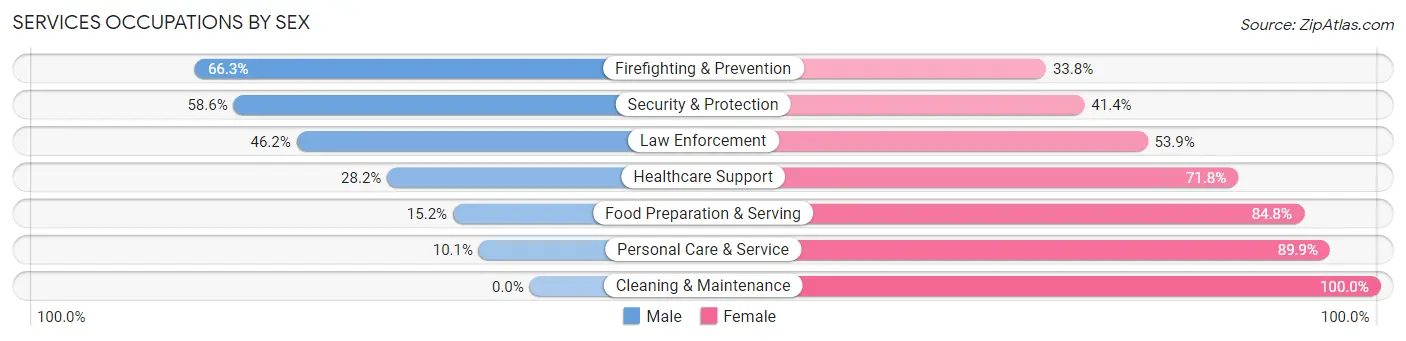
Services Occupations by Sex
Within the Services occupations in Lake Arbor, the most male-oriented occupations are Firefighting & Prevention (66.2%), Security & Protection (58.6%), and Law Enforcement (46.2%), while the most female-oriented occupations are Cleaning & Maintenance (100.0%), Personal Care & Service (89.9%), and Food Preparation & Serving (84.8%).
| Occupation | Male | Female |
| Healthcare Support | 154 (28.2%) | 392 (71.8%) |
| Security & Protection | 302 (58.6%) | 213 (41.4%) |
| Firefighting & Prevention | 212 (66.2%) | 108 (33.8%) |
| Law Enforcement | 90 (46.2%) | 105 (53.8%) |
| Food Preparation & Serving | 12 (15.2%) | 67 (84.8%) |
| Cleaning & Maintenance | 0 (0.0%) | 17 (100.0%) |
| Personal Care & Service | 16 (10.1%) | 143 (89.9%) |
| Total (Category) | 484 (36.8%) | 832 (63.2%) |
| Total (Overall) | 3,956 (46.6%) | 4,538 (53.4%) |
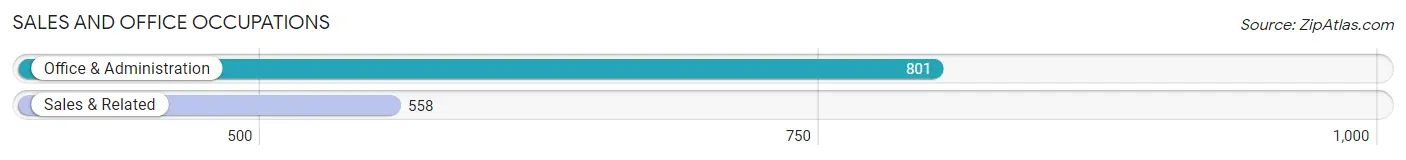
Sales and Office Occupations
The most common Sales and Office occupations in Lake Arbor are Office & Administration (801 | 9.4%), and Sales & Related (558 | 6.6%).
Sales and Office Occupations by Sex
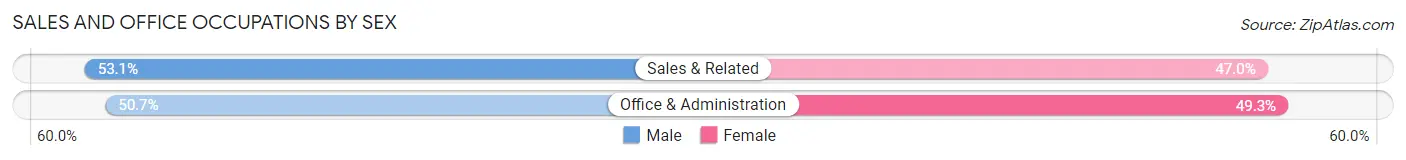
| Occupation | Male | Female |
| Sales & Related | 296 (53.0%) | 262 (46.9%) |
| Office & Administration | 406 (50.7%) | 395 (49.3%) |
| Total (Category) | 702 (51.7%) | 657 (48.3%) |
| Total (Overall) | 3,956 (46.6%) | 4,538 (53.4%) |
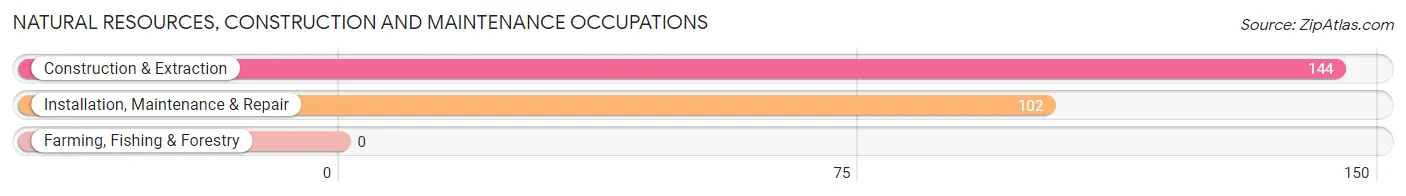
Natural Resources, Construction and Maintenance Occupations
The most common Natural Resources, Construction and Maintenance occupations in Lake Arbor are Construction & Extraction (144 | 1.7%), and Installation, Maintenance & Repair (102 | 1.2%).
Natural Resources, Construction and Maintenance Occupations by Sex
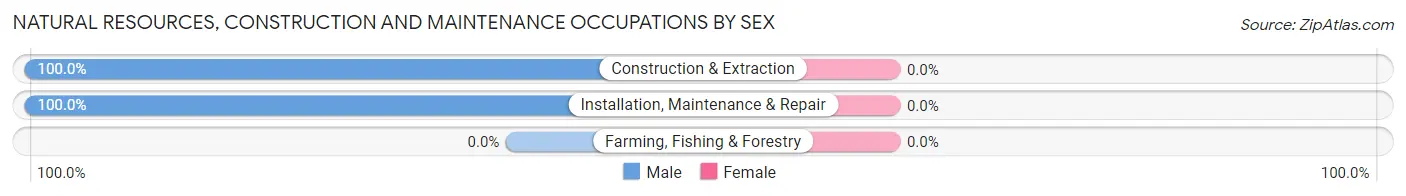
| Occupation | Male | Female |
| Farming, Fishing & Forestry | 0 (0.0%) | 0 (0.0%) |
| Construction & Extraction | 144 (100.0%) | 0 (0.0%) |
| Installation, Maintenance & Repair | 102 (100.0%) | 0 (0.0%) |
| Total (Category) | 246 (100.0%) | 0 (0.0%) |
| Total (Overall) | 3,956 (46.6%) | 4,538 (53.4%) |
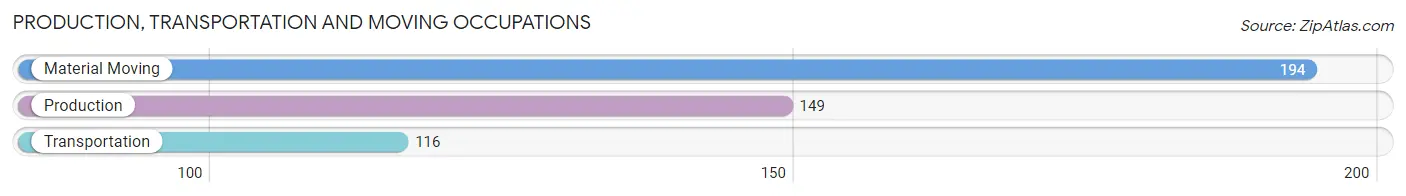
Production, Transportation and Moving Occupations
The most common Production, Transportation and Moving occupations in Lake Arbor are Material Moving (194 | 2.3%), Production (149 | 1.8%), and Transportation (116 | 1.4%).
Production, Transportation and Moving Occupations by Sex
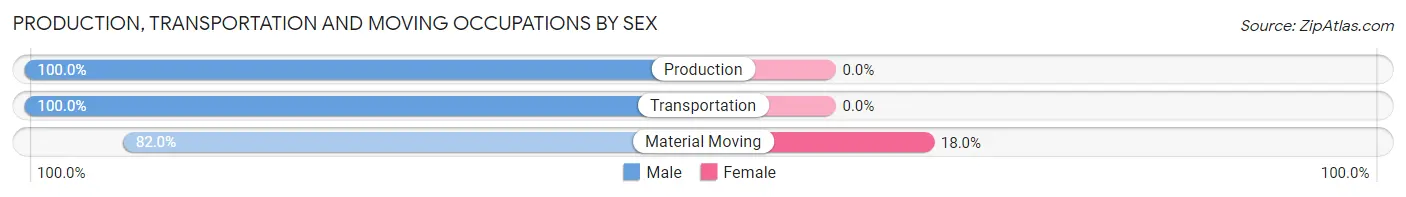
| Occupation | Male | Female |
| Production | 149 (100.0%) | 0 (0.0%) |
| Transportation | 116 (100.0%) | 0 (0.0%) |
| Material Moving | 159 (82.0%) | 35 (18.0%) |
| Total (Category) | 424 (92.4%) | 35 (7.6%) |
| Total (Overall) | 3,956 (46.6%) | 4,538 (53.4%) |
Employment Industries by Sex in Lake Arbor
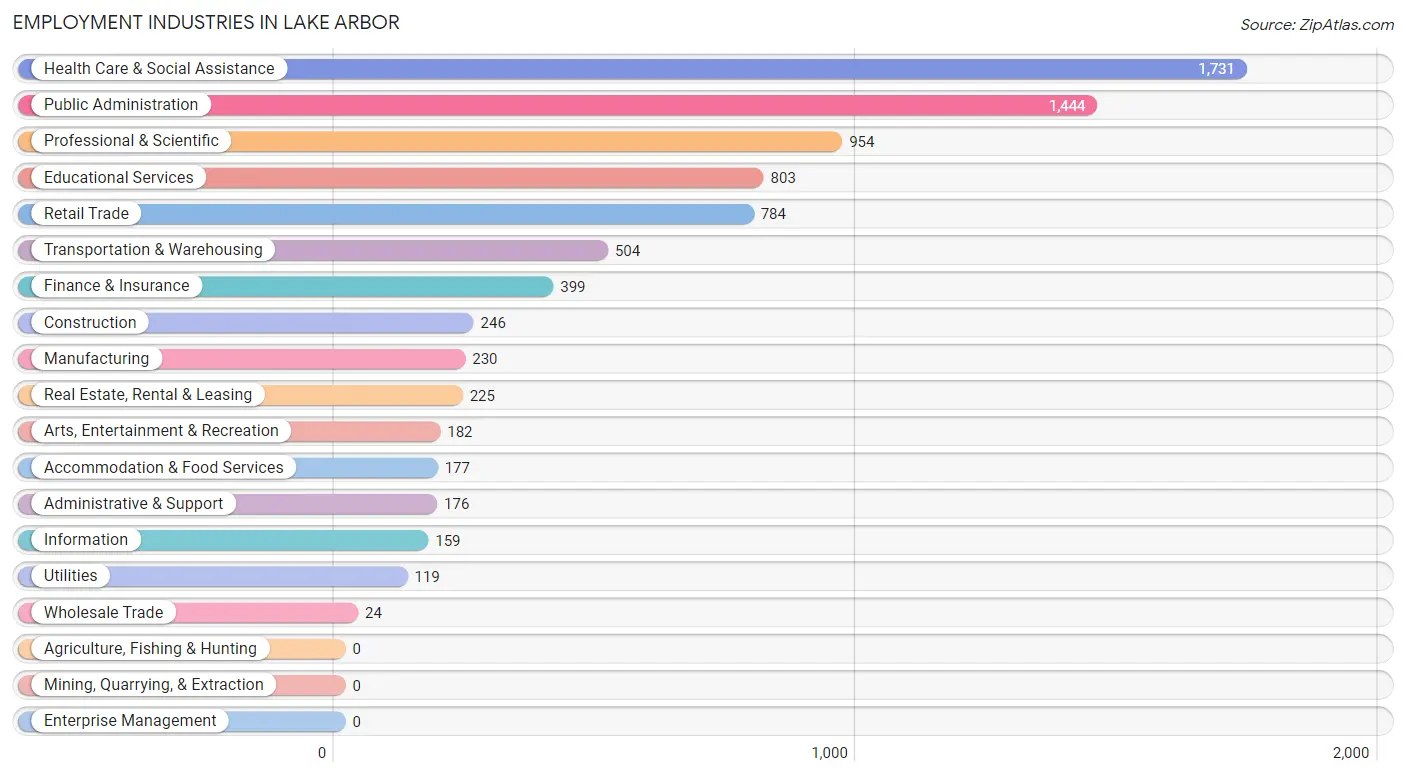
Employment Industries in Lake Arbor
The major employment industries in Lake Arbor include Health Care & Social Assistance (1,731 | 20.4%), Public Administration (1,444 | 17.0%), Professional & Scientific (954 | 11.2%), Educational Services (803 | 9.5%), and Retail Trade (784 | 9.2%).
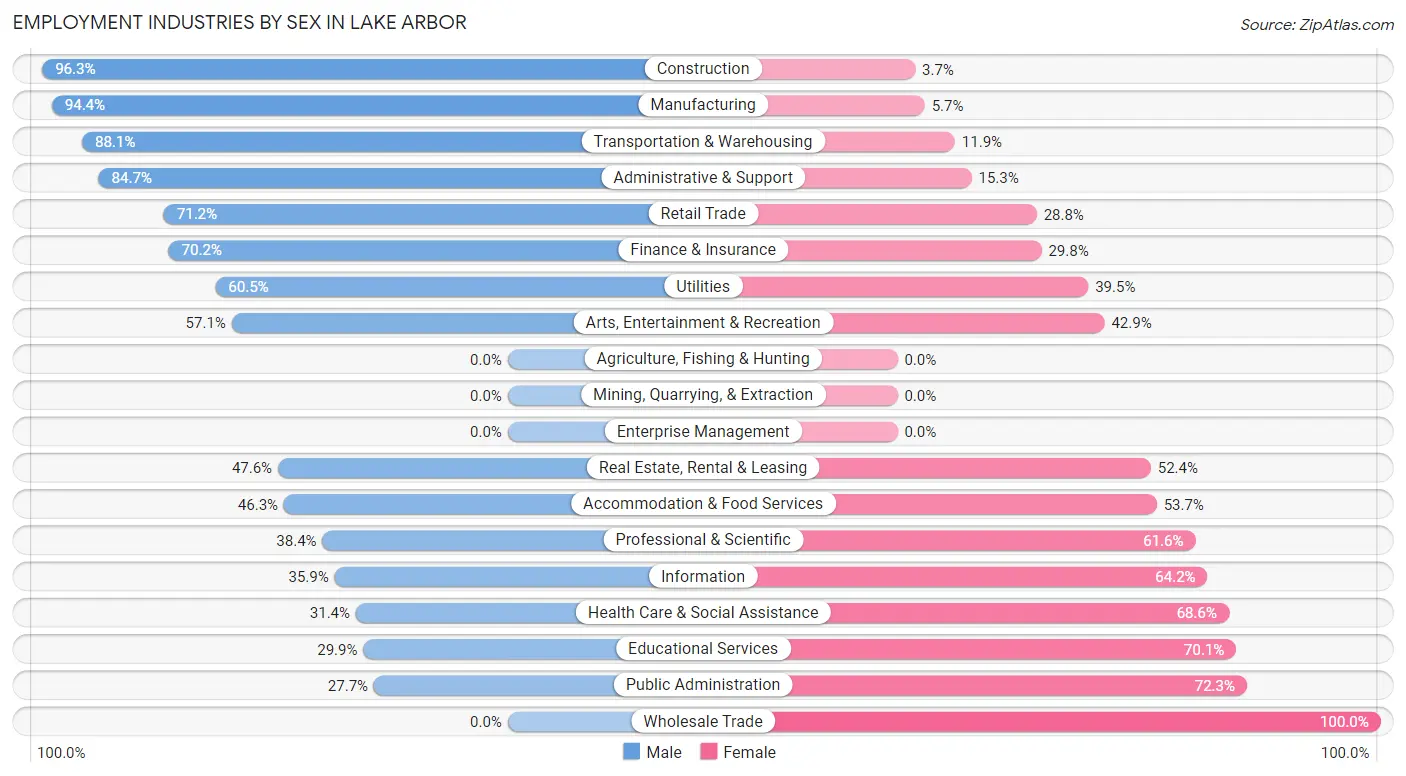
Employment Industries by Sex in Lake Arbor
The Lake Arbor industries that see more men than women are Construction (96.3%), Manufacturing (94.4%), and Transportation & Warehousing (88.1%), whereas the industries that tend to have a higher number of women are Wholesale Trade (100.0%), Public Administration (72.3%), and Educational Services (70.1%).
| Industry | Male | Female |
| Agriculture, Fishing & Hunting | 0 (0.0%) | 0 (0.0%) |
| Mining, Quarrying, & Extraction | 0 (0.0%) | 0 (0.0%) |
| Construction | 237 (96.3%) | 9 (3.7%) |
| Manufacturing | 217 (94.4%) | 13 (5.7%) |
| Wholesale Trade | 0 (0.0%) | 24 (100.0%) |
| Retail Trade | 558 (71.2%) | 226 (28.8%) |
| Transportation & Warehousing | 444 (88.1%) | 60 (11.9%) |
| Utilities | 72 (60.5%) | 47 (39.5%) |
| Information | 57 (35.8%) | 102 (64.1%) |
| Finance & Insurance | 280 (70.2%) | 119 (29.8%) |
| Real Estate, Rental & Leasing | 107 (47.6%) | 118 (52.4%) |
| Professional & Scientific | 366 (38.4%) | 588 (61.6%) |
| Enterprise Management | 0 (0.0%) | 0 (0.0%) |
| Administrative & Support | 149 (84.7%) | 27 (15.3%) |
| Educational Services | 240 (29.9%) | 563 (70.1%) |
| Health Care & Social Assistance | 544 (31.4%) | 1,187 (68.6%) |
| Arts, Entertainment & Recreation | 104 (57.1%) | 78 (42.9%) |
| Accommodation & Food Services | 82 (46.3%) | 95 (53.7%) |
| Public Administration | 400 (27.7%) | 1,044 (72.3%) |
| Total | 3,956 (46.6%) | 4,538 (53.4%) |
Education in Lake Arbor
School Enrollment in Lake Arbor
The most common levels of schooling among the 3,947 students in Lake Arbor are college / undergraduate (898 | 22.8%), middle school (834 | 21.1%), and graduate / professional (741 | 18.8%).
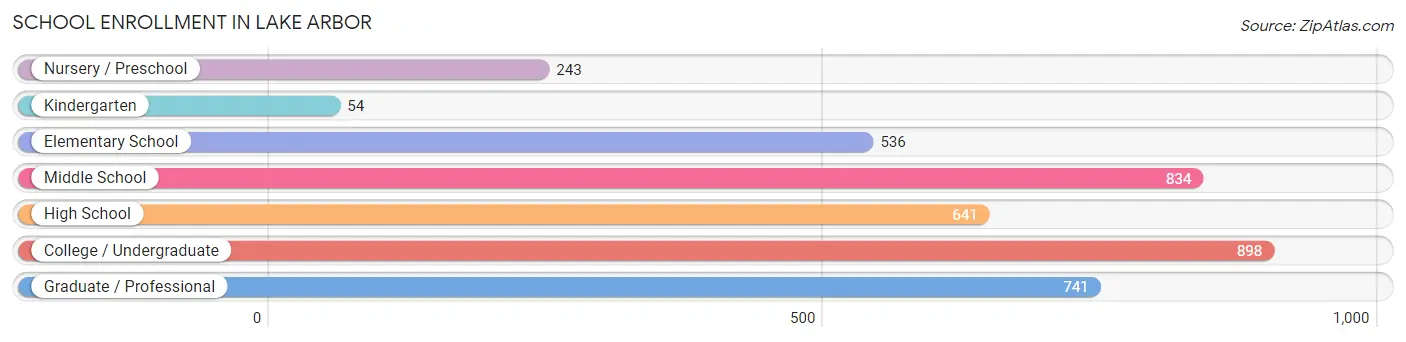
| School Level | # Students | % Students |
| Nursery / Preschool | 243 | 6.2% |
| Kindergarten | 54 | 1.4% |
| Elementary School | 536 | 13.6% |
| Middle School | 834 | 21.1% |
| High School | 641 | 16.2% |
| College / Undergraduate | 898 | 22.8% |
| Graduate / Professional | 741 | 18.8% |
| Total | 3,947 | 100.0% |
School Enrollment by Age by Funding Source in Lake Arbor
Out of a total of 3,947 students who are enrolled in schools in Lake Arbor, 1,074 (27.2%) attend a private institution, while the remaining 2,873 (72.8%) are enrolled in public schools. The age group of 3 to 4 year olds has the highest likelihood of being enrolled in private schools, with 143 (63.8% in the age bracket) enrolled. Conversely, the age group of 20 to 24 year olds has the lowest likelihood of being enrolled in a private school, with 439 (90.9% in the age bracket) attending a public institution.
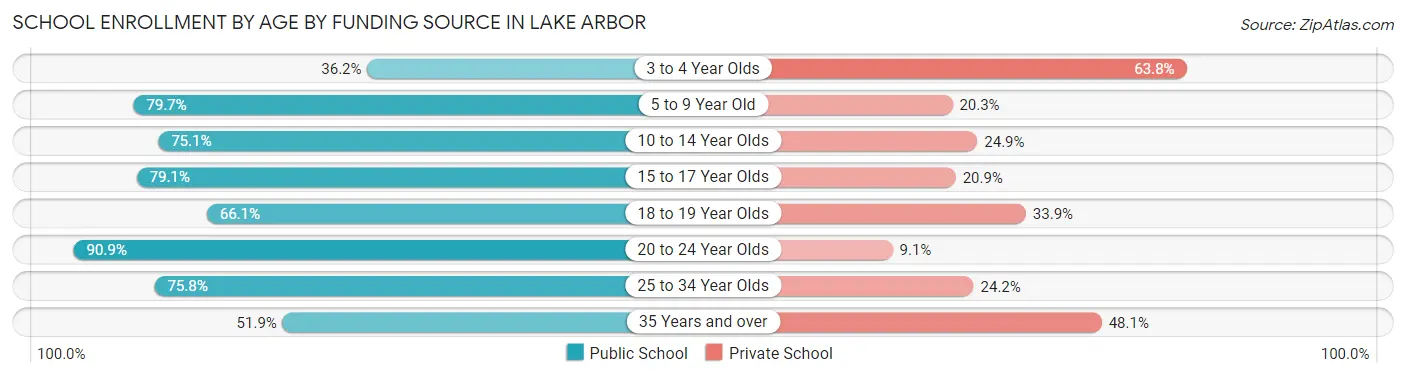
| Age Bracket | Public School | Private School |
| 3 to 4 Year Olds | 81 (36.2%) | 143 (63.8%) |
| 5 to 9 Year Old | 429 (79.7%) | 109 (20.3%) |
| 10 to 14 Year Olds | 751 (75.1%) | 249 (24.9%) |
| 15 to 17 Year Olds | 383 (79.1%) | 101 (20.9%) |
| 18 to 19 Year Olds | 109 (66.1%) | 56 (33.9%) |
| 20 to 24 Year Olds | 439 (90.9%) | 44 (9.1%) |
| 25 to 34 Year Olds | 426 (75.8%) | 136 (24.2%) |
| 35 Years and over | 255 (51.9%) | 236 (48.1%) |
| Total | 2,873 (72.8%) | 1,074 (27.2%) |
Educational Attainment by Field of Study in Lake Arbor
Business (1,477 | 22.1%), social sciences (762 | 11.4%), education (760 | 11.4%), science & technology (658 | 9.8%), and arts & humanities (545 | 8.2%) are the most common fields of study among 6,689 individuals in Lake Arbor who have obtained a bachelor's degree or higher.
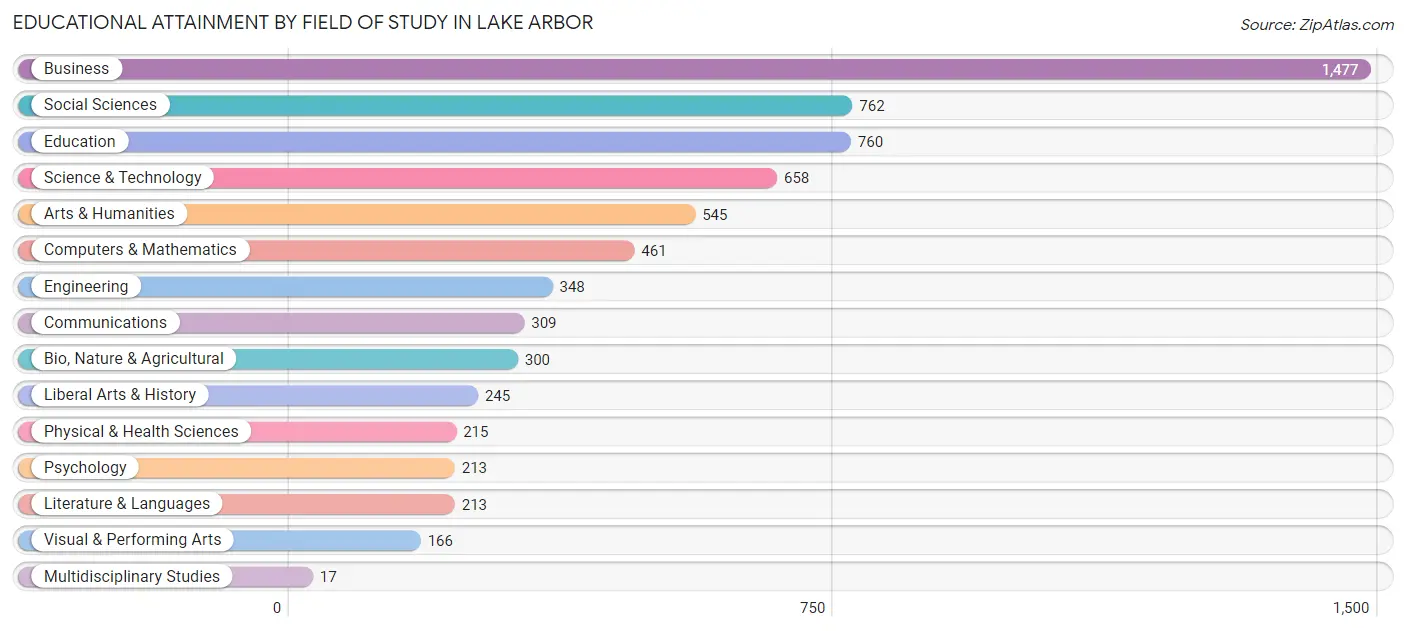
| Field of Study | # Graduates | % Graduates |
| Computers & Mathematics | 461 | 6.9% |
| Bio, Nature & Agricultural | 300 | 4.5% |
| Physical & Health Sciences | 215 | 3.2% |
| Psychology | 213 | 3.2% |
| Social Sciences | 762 | 11.4% |
| Engineering | 348 | 5.2% |
| Multidisciplinary Studies | 17 | 0.3% |
| Science & Technology | 658 | 9.8% |
| Business | 1,477 | 22.1% |
| Education | 760 | 11.4% |
| Literature & Languages | 213 | 3.2% |
| Liberal Arts & History | 245 | 3.7% |
| Visual & Performing Arts | 166 | 2.5% |
| Communications | 309 | 4.6% |
| Arts & Humanities | 545 | 8.2% |
| Total | 6,689 | 100.0% |
Transportation & Commute in Lake Arbor
Vehicle Availability by Sex in Lake Arbor
The most prevalent vehicle ownership categories in Lake Arbor are males with 3 vehicles (1,252, accounting for 31.0%) and females with 3 vehicles (1,426, making up 28.2%).
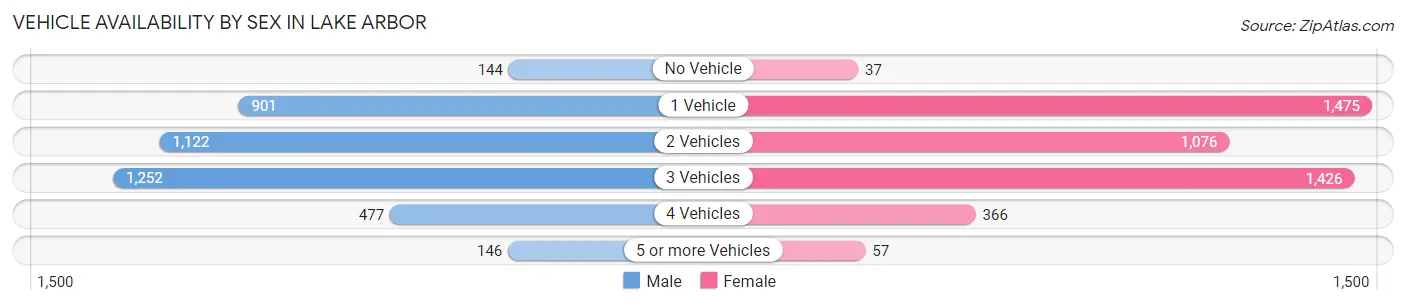
| Vehicles Available | Male | Female |
| No Vehicle | 144 (3.6%) | 37 (0.8%) |
| 1 Vehicle | 901 (22.3%) | 1,475 (33.2%) |
| 2 Vehicles | 1,122 (27.8%) | 1,076 (24.2%) |
| 3 Vehicles | 1,252 (31.0%) | 1,426 (32.1%) |
| 4 Vehicles | 477 (11.8%) | 366 (8.3%) |
| 5 or more Vehicles | 146 (3.6%) | 57 (1.3%) |
| Total | 4,042 (100.0%) | 4,437 (100.0%) |
Commute Time in Lake Arbor
The most frequently occuring commute durations in Lake Arbor are 60 to 89 minutes (1,305 commuters, 17.6%), 45 to 59 minutes (1,288 commuters, 17.4%), and 30 to 34 minutes (973 commuters, 13.2%).
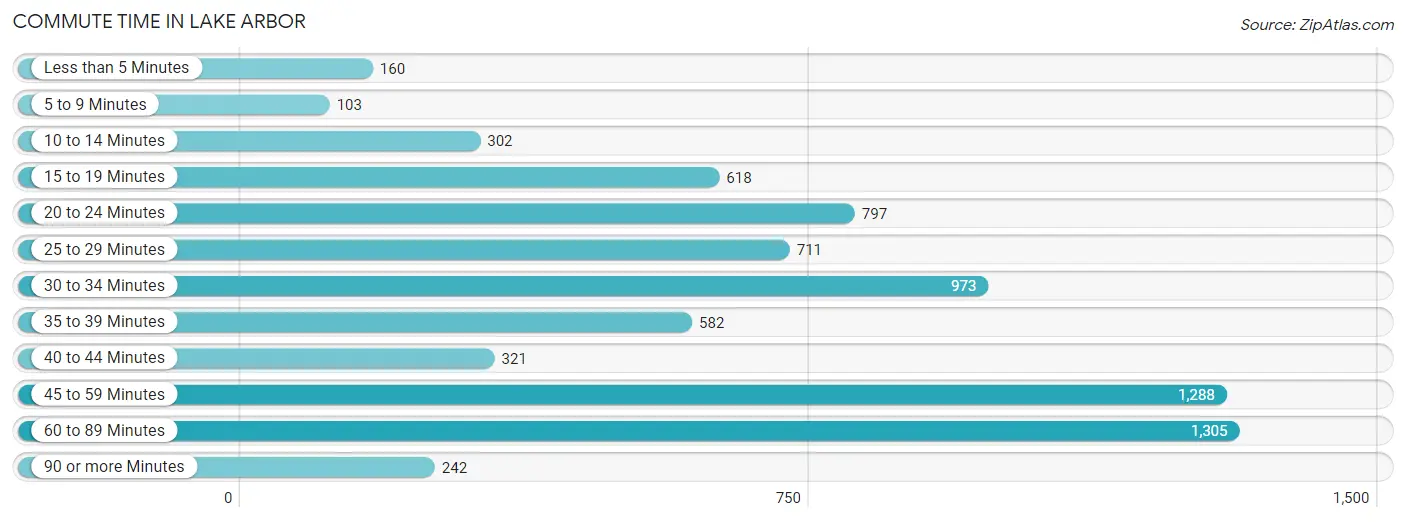
| Commute Time | # Commuters | % Commuters |
| Less than 5 Minutes | 160 | 2.2% |
| 5 to 9 Minutes | 103 | 1.4% |
| 10 to 14 Minutes | 302 | 4.1% |
| 15 to 19 Minutes | 618 | 8.4% |
| 20 to 24 Minutes | 797 | 10.8% |
| 25 to 29 Minutes | 711 | 9.6% |
| 30 to 34 Minutes | 973 | 13.2% |
| 35 to 39 Minutes | 582 | 7.9% |
| 40 to 44 Minutes | 321 | 4.3% |
| 45 to 59 Minutes | 1,288 | 17.4% |
| 60 to 89 Minutes | 1,305 | 17.6% |
| 90 or more Minutes | 242 | 3.3% |
Commute Time by Sex in Lake Arbor
The most common commute times in Lake Arbor are 45 to 59 minutes (605 commuters, 16.4%) for males and 60 to 89 minutes (700 commuters, 18.9%) for females.
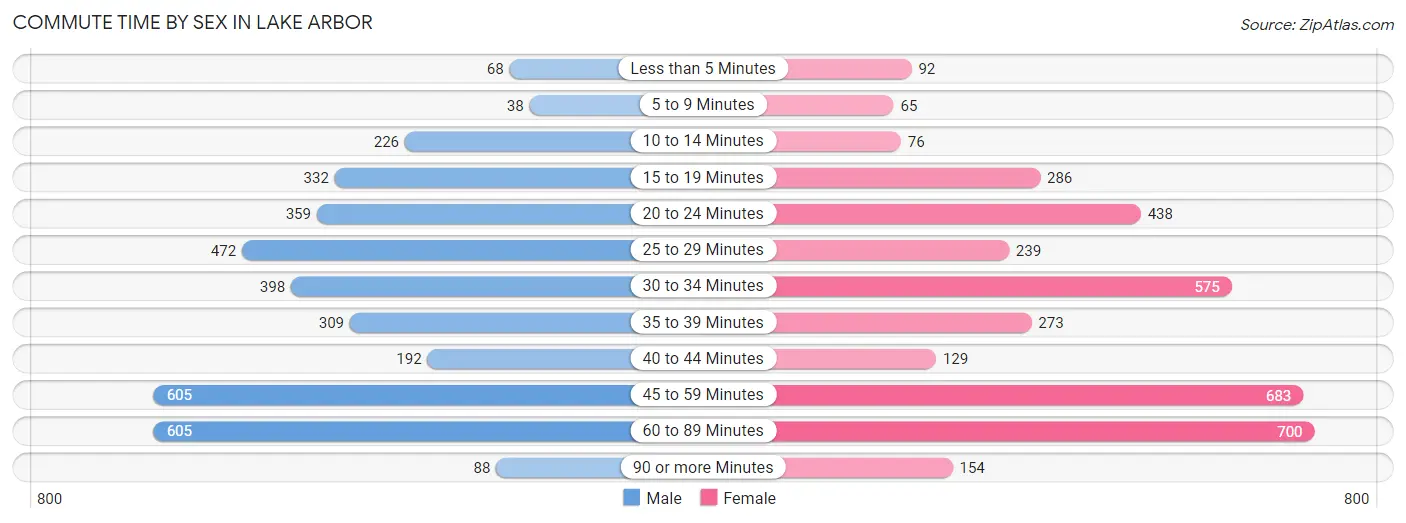
| Commute Time | Male | Female |
| Less than 5 Minutes | 68 (1.8%) | 92 (2.5%) |
| 5 to 9 Minutes | 38 (1.0%) | 65 (1.8%) |
| 10 to 14 Minutes | 226 (6.1%) | 76 (2.1%) |
| 15 to 19 Minutes | 332 (9.0%) | 286 (7.7%) |
| 20 to 24 Minutes | 359 (9.7%) | 438 (11.8%) |
| 25 to 29 Minutes | 472 (12.8%) | 239 (6.4%) |
| 30 to 34 Minutes | 398 (10.8%) | 575 (15.5%) |
| 35 to 39 Minutes | 309 (8.4%) | 273 (7.4%) |
| 40 to 44 Minutes | 192 (5.2%) | 129 (3.5%) |
| 45 to 59 Minutes | 605 (16.4%) | 683 (18.4%) |
| 60 to 89 Minutes | 605 (16.4%) | 700 (18.9%) |
| 90 or more Minutes | 88 (2.4%) | 154 (4.2%) |
Time of Departure to Work by Sex in Lake Arbor
The most frequent times of departure to work in Lake Arbor are 8:00 AM to 8:29 AM (591, 16.0%) for males and 7:00 AM to 7:29 AM (577, 15.5%) for females.
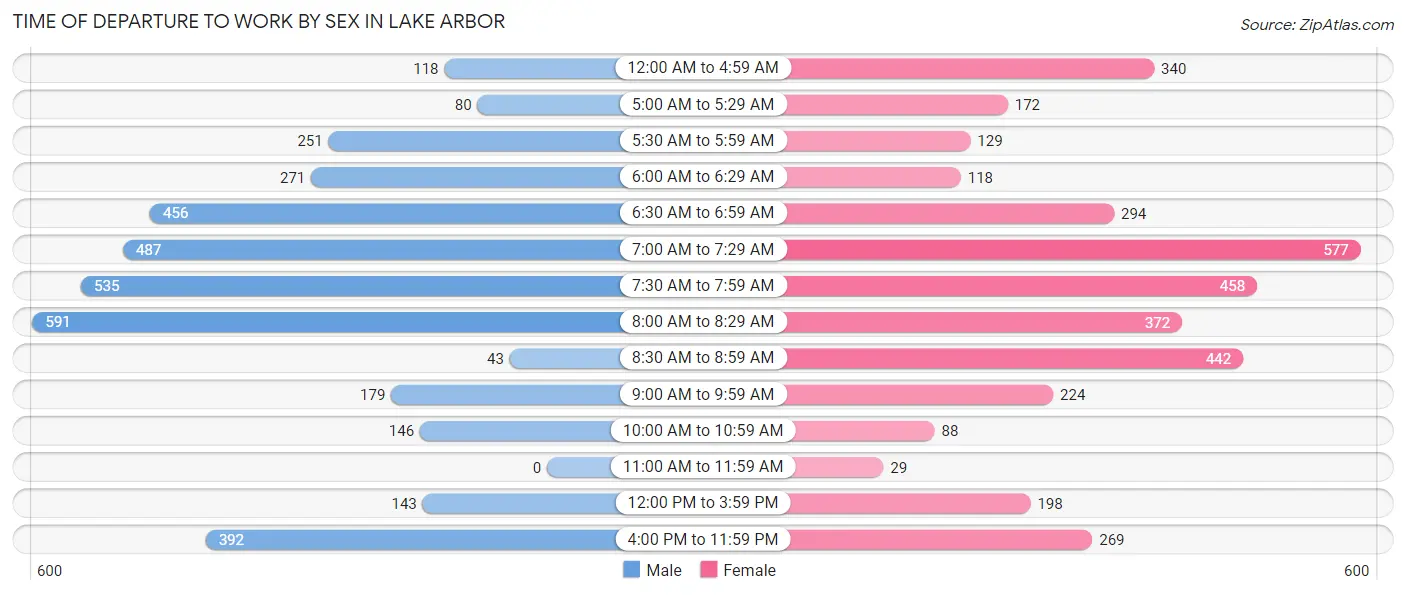
| Time of Departure | Male | Female |
| 12:00 AM to 4:59 AM | 118 (3.2%) | 340 (9.2%) |
| 5:00 AM to 5:29 AM | 80 (2.2%) | 172 (4.6%) |
| 5:30 AM to 5:59 AM | 251 (6.8%) | 129 (3.5%) |
| 6:00 AM to 6:29 AM | 271 (7.3%) | 118 (3.2%) |
| 6:30 AM to 6:59 AM | 456 (12.3%) | 294 (7.9%) |
| 7:00 AM to 7:29 AM | 487 (13.2%) | 577 (15.5%) |
| 7:30 AM to 7:59 AM | 535 (14.5%) | 458 (12.3%) |
| 8:00 AM to 8:29 AM | 591 (16.0%) | 372 (10.0%) |
| 8:30 AM to 8:59 AM | 43 (1.2%) | 442 (11.9%) |
| 9:00 AM to 9:59 AM | 179 (4.9%) | 224 (6.0%) |
| 10:00 AM to 10:59 AM | 146 (4.0%) | 88 (2.4%) |
| 11:00 AM to 11:59 AM | 0 (0.0%) | 29 (0.8%) |
| 12:00 PM to 3:59 PM | 143 (3.9%) | 198 (5.3%) |
| 4:00 PM to 11:59 PM | 392 (10.6%) | 269 (7.2%) |
| Total | 3,692 (100.0%) | 3,710 (100.0%) |
Housing Occupancy in Lake Arbor
Occupancy by Ownership in Lake Arbor
Of the total 6,180 dwellings in Lake Arbor, owner-occupied units account for 3,892 (63.0%), while renter-occupied units make up 2,288 (37.0%).
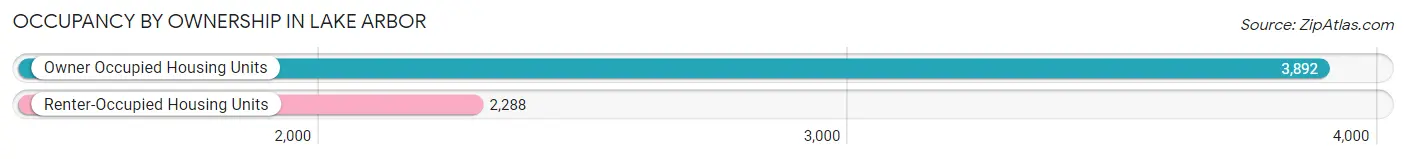
| Occupancy | # Housing Units | % Housing Units |
| Owner Occupied Housing Units | 3,892 | 63.0% |
| Renter-Occupied Housing Units | 2,288 | 37.0% |
| Total Occupied Housing Units | 6,180 | 100.0% |
Occupancy by Household Size in Lake Arbor
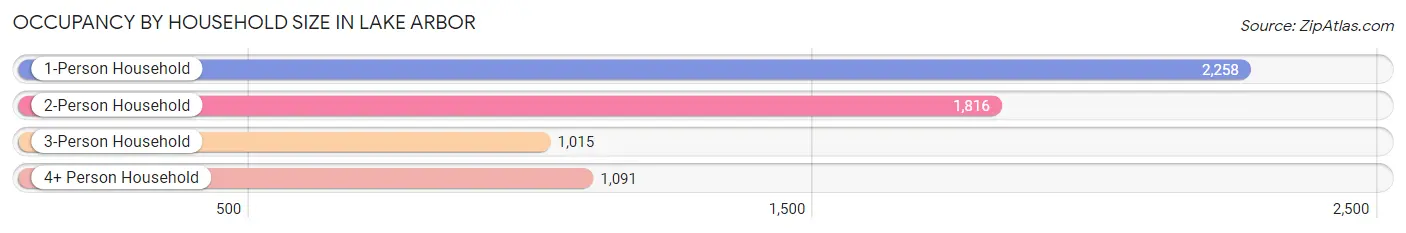
| Household Size | # Housing Units | % Housing Units |
| 1-Person Household | 2,258 | 36.5% |
| 2-Person Household | 1,816 | 29.4% |
| 3-Person Household | 1,015 | 16.4% |
| 4+ Person Household | 1,091 | 17.6% |
| Total Housing Units | 6,180 | 100.0% |
Occupancy by Ownership by Household Size in Lake Arbor
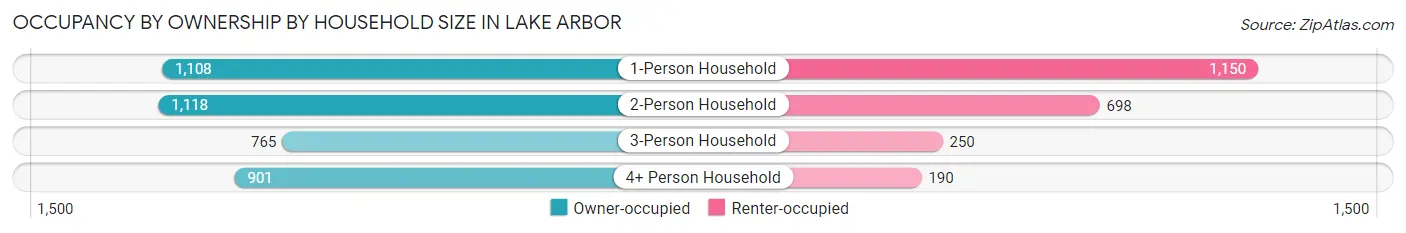
| Household Size | Owner-occupied | Renter-occupied |
| 1-Person Household | 1,108 (49.1%) | 1,150 (50.9%) |
| 2-Person Household | 1,118 (61.6%) | 698 (38.4%) |
| 3-Person Household | 765 (75.4%) | 250 (24.6%) |
| 4+ Person Household | 901 (82.6%) | 190 (17.4%) |
| Total Housing Units | 3,892 (63.0%) | 2,288 (37.0%) |
Occupancy by Educational Attainment in Lake Arbor
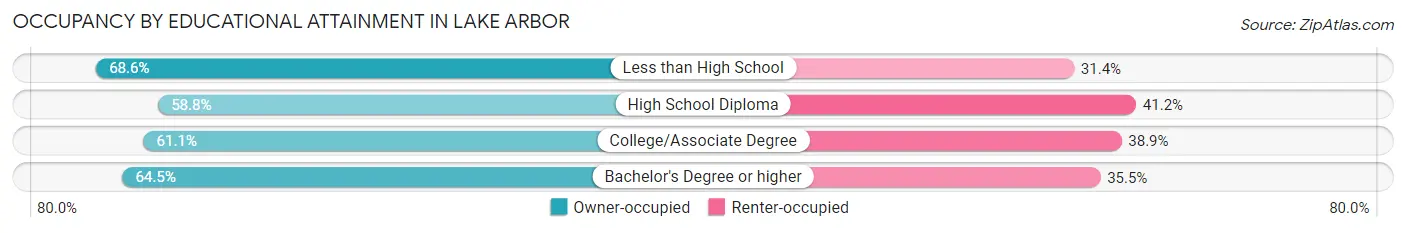
| Household Size | Owner-occupied | Renter-occupied |
| Less than High School | 81 (68.6%) | 37 (31.4%) |
| High School Diploma | 508 (58.8%) | 356 (41.2%) |
| College/Associate Degree | 872 (61.1%) | 555 (38.9%) |
| Bachelor's Degree or higher | 2,431 (64.5%) | 1,340 (35.5%) |
Occupancy by Age of Householder in Lake Arbor
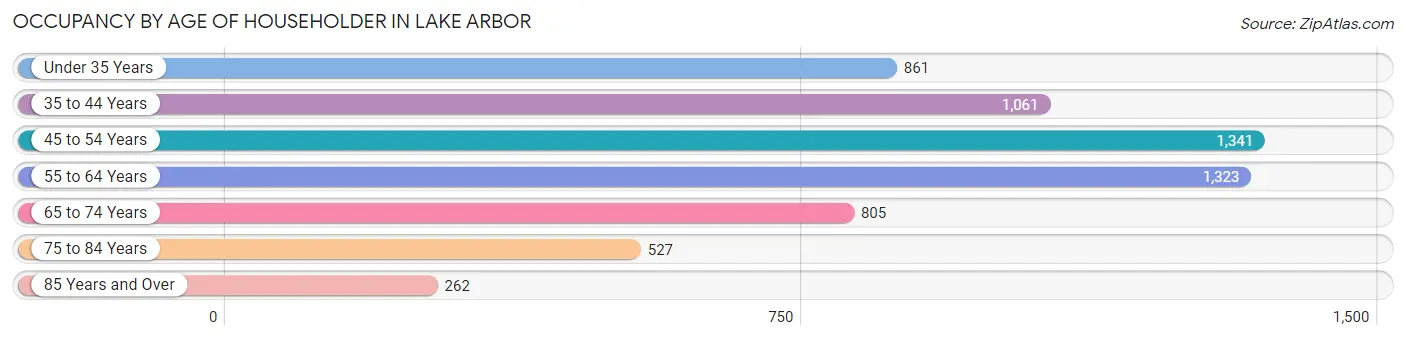
| Age Bracket | # Households | % Households |
| Under 35 Years | 861 | 13.9% |
| 35 to 44 Years | 1,061 | 17.2% |
| 45 to 54 Years | 1,341 | 21.7% |
| 55 to 64 Years | 1,323 | 21.4% |
| 65 to 74 Years | 805 | 13.0% |
| 75 to 84 Years | 527 | 8.5% |
| 85 Years and Over | 262 | 4.2% |
| Total | 6,180 | 100.0% |
Housing Finances in Lake Arbor
Median Income by Occupancy in Lake Arbor
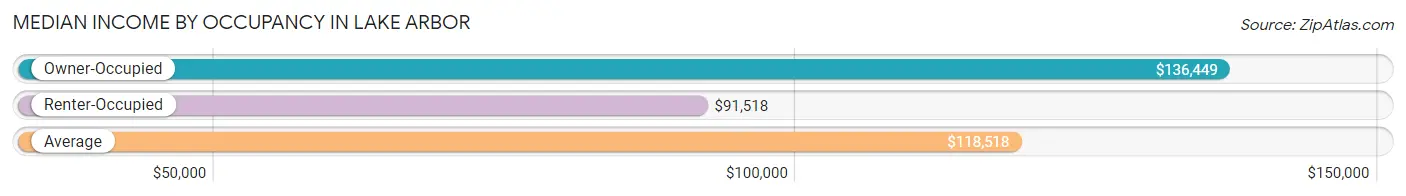
| Occupancy Type | # Households | Median Income |
| Owner-Occupied | 3,892 (63.0%) | $136,449 |
| Renter-Occupied | 2,288 (37.0%) | $91,518 |
| Average | 6,180 (100.0%) | $118,518 |
Occupancy by Householder Income Bracket in Lake Arbor
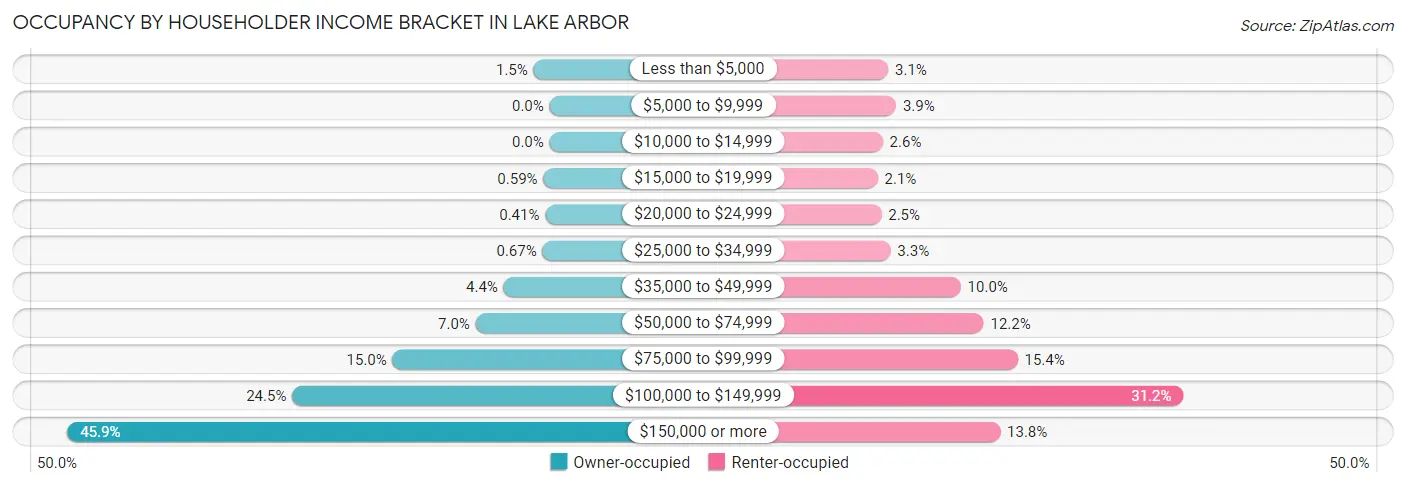
| Income Bracket | Owner-occupied | Renter-occupied |
| Less than $5,000 | 59 (1.5%) | 71 (3.1%) |
| $5,000 to $9,999 | 0 (0.0%) | 88 (3.8%) |
| $10,000 to $14,999 | 0 (0.0%) | 59 (2.6%) |
| $15,000 to $19,999 | 23 (0.6%) | 48 (2.1%) |
| $20,000 to $24,999 | 16 (0.4%) | 56 (2.5%) |
| $25,000 to $34,999 | 26 (0.7%) | 76 (3.3%) |
| $35,000 to $49,999 | 170 (4.4%) | 229 (10.0%) |
| $50,000 to $74,999 | 274 (7.0%) | 279 (12.2%) |
| $75,000 to $99,999 | 582 (14.9%) | 353 (15.4%) |
| $100,000 to $149,999 | 954 (24.5%) | 714 (31.2%) |
| $150,000 or more | 1,788 (45.9%) | 315 (13.8%) |
| Total | 3,892 (100.0%) | 2,288 (100.0%) |
Monthly Housing Cost Tiers in Lake Arbor
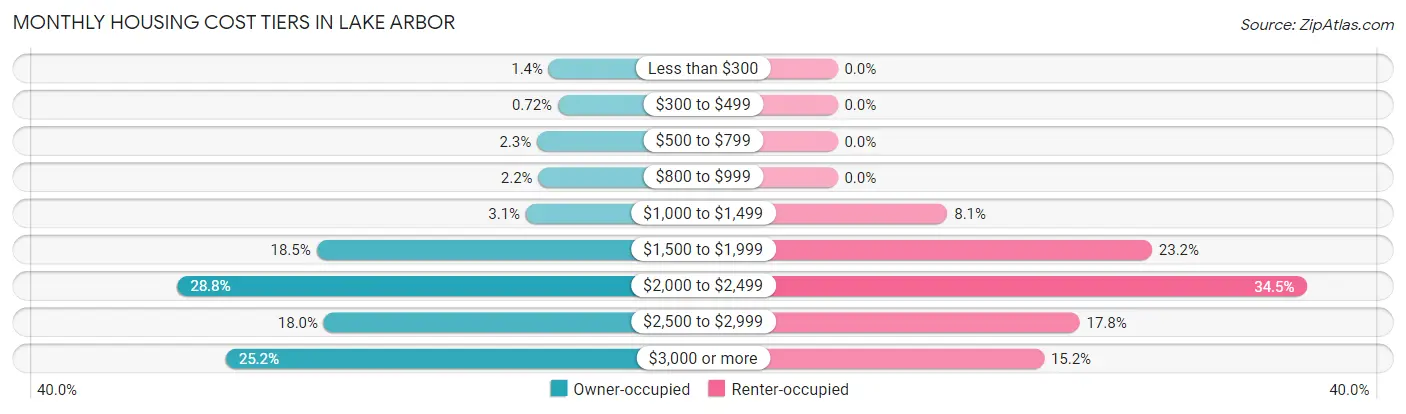
| Monthly Cost | Owner-occupied | Renter-occupied |
| Less than $300 | 54 (1.4%) | 0 (0.0%) |
| $300 to $499 | 28 (0.7%) | 0 (0.0%) |
| $500 to $799 | 88 (2.3%) | 0 (0.0%) |
| $800 to $999 | 84 (2.2%) | 0 (0.0%) |
| $1,000 to $1,499 | 120 (3.1%) | 185 (8.1%) |
| $1,500 to $1,999 | 720 (18.5%) | 530 (23.2%) |
| $2,000 to $2,499 | 1,119 (28.7%) | 790 (34.5%) |
| $2,500 to $2,999 | 699 (18.0%) | 408 (17.8%) |
| $3,000 or more | 980 (25.2%) | 348 (15.2%) |
| Total | 3,892 (100.0%) | 2,288 (100.0%) |
Physical Housing Characteristics in Lake Arbor
Housing Structures in Lake Arbor
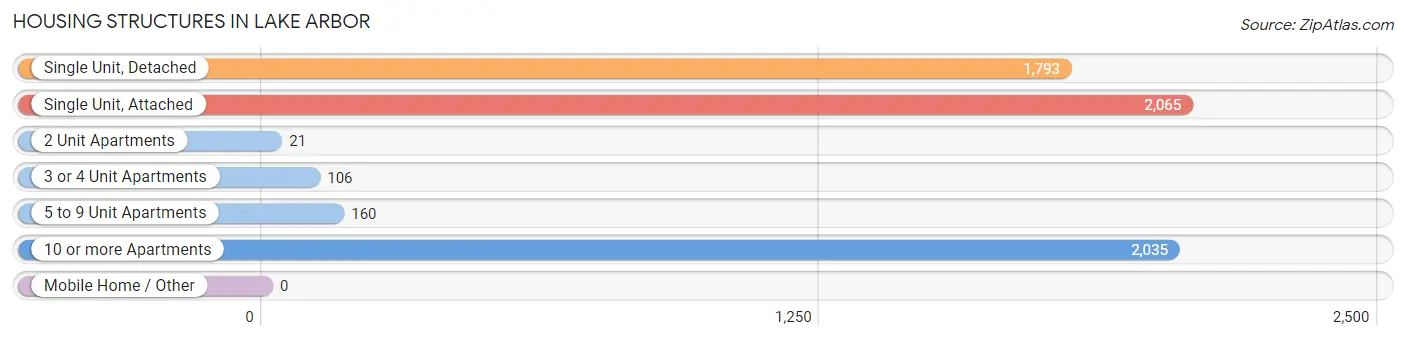
| Structure Type | # Housing Units | % Housing Units |
| Single Unit, Detached | 1,793 | 29.0% |
| Single Unit, Attached | 2,065 | 33.4% |
| 2 Unit Apartments | 21 | 0.3% |
| 3 or 4 Unit Apartments | 106 | 1.7% |
| 5 to 9 Unit Apartments | 160 | 2.6% |
| 10 or more Apartments | 2,035 | 32.9% |
| Mobile Home / Other | 0 | 0.0% |
| Total | 6,180 | 100.0% |
Housing Structures by Occupancy in Lake Arbor
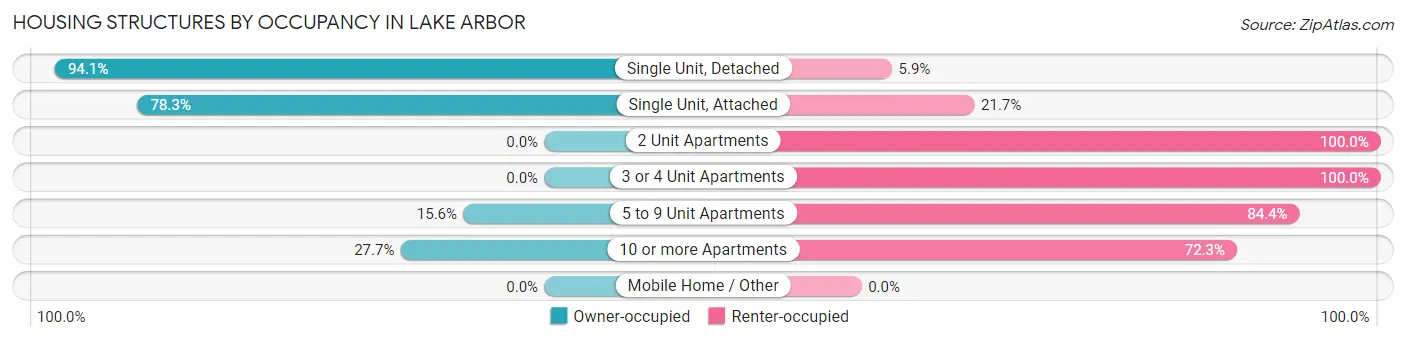
| Structure Type | Owner-occupied | Renter-occupied |
| Single Unit, Detached | 1,688 (94.1%) | 105 (5.9%) |
| Single Unit, Attached | 1,616 (78.3%) | 449 (21.7%) |
| 2 Unit Apartments | 0 (0.0%) | 21 (100.0%) |
| 3 or 4 Unit Apartments | 0 (0.0%) | 106 (100.0%) |
| 5 to 9 Unit Apartments | 25 (15.6%) | 135 (84.4%) |
| 10 or more Apartments | 563 (27.7%) | 1,472 (72.3%) |
| Mobile Home / Other | 0 (0.0%) | 0 (0.0%) |
| Total | 3,892 (63.0%) | 2,288 (37.0%) |
Housing Structures by Number of Rooms in Lake Arbor
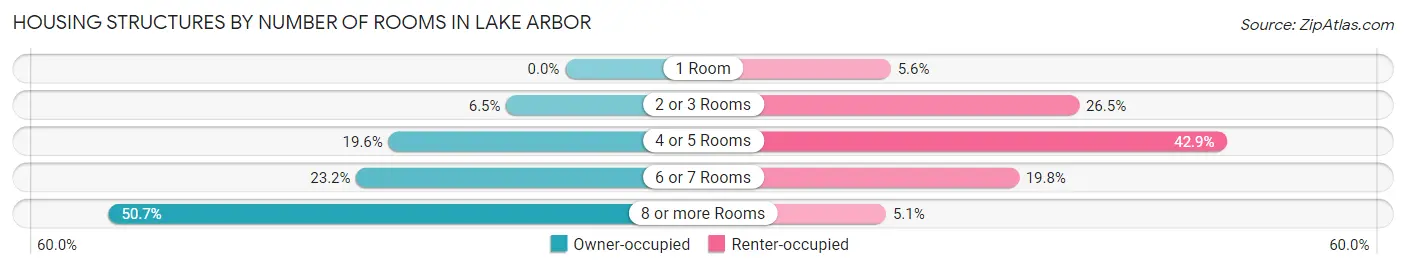
| Number of Rooms | Owner-occupied | Renter-occupied |
| 1 Room | 0 (0.0%) | 129 (5.6%) |
| 2 or 3 Rooms | 254 (6.5%) | 607 (26.5%) |
| 4 or 5 Rooms | 763 (19.6%) | 981 (42.9%) |
| 6 or 7 Rooms | 902 (23.2%) | 454 (19.8%) |
| 8 or more Rooms | 1,973 (50.7%) | 117 (5.1%) |
| Total | 3,892 (100.0%) | 2,288 (100.0%) |
Housing Structure by Heating Type in Lake Arbor
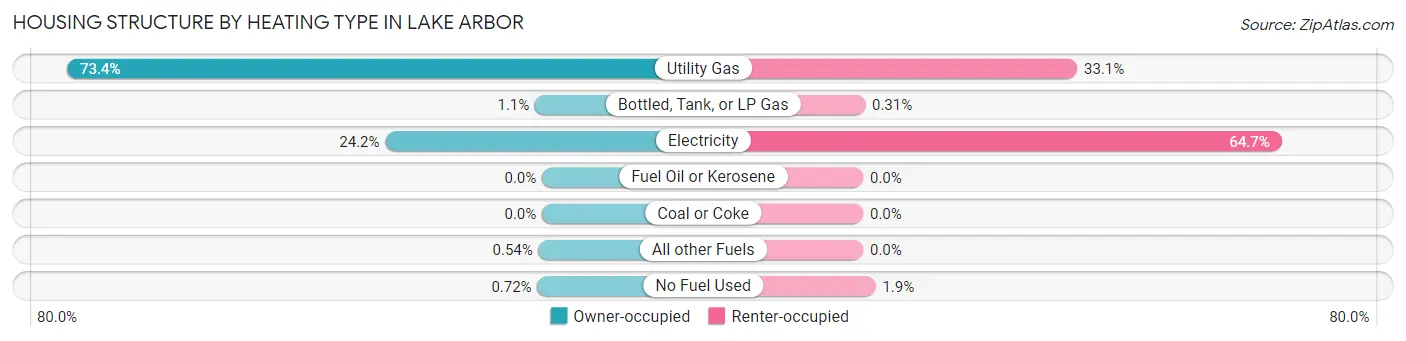
| Heating Type | Owner-occupied | Renter-occupied |
| Utility Gas | 2,858 (73.4%) | 757 (33.1%) |
| Bottled, Tank, or LP Gas | 42 (1.1%) | 7 (0.3%) |
| Electricity | 943 (24.2%) | 1,480 (64.7%) |
| Fuel Oil or Kerosene | 0 (0.0%) | 0 (0.0%) |
| Coal or Coke | 0 (0.0%) | 0 (0.0%) |
| All other Fuels | 21 (0.5%) | 0 (0.0%) |
| No Fuel Used | 28 (0.7%) | 44 (1.9%) |
| Total | 3,892 (100.0%) | 2,288 (100.0%) |
Household Vehicle Usage in Lake Arbor
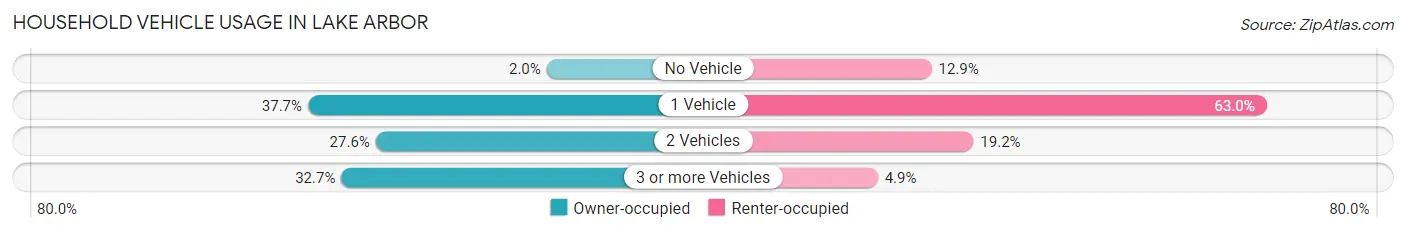
| Vehicles per Household | Owner-occupied | Renter-occupied |
| No Vehicle | 79 (2.0%) | 296 (12.9%) |
| 1 Vehicle | 1,467 (37.7%) | 1,441 (63.0%) |
| 2 Vehicles | 1,073 (27.6%) | 439 (19.2%) |
| 3 or more Vehicles | 1,273 (32.7%) | 112 (4.9%) |
| Total | 3,892 (100.0%) | 2,288 (100.0%) |
Real Estate & Mortgages in Lake Arbor
Real Estate and Mortgage Overview in Lake Arbor
| Characteristic | Without Mortgage | With Mortgage |
| Housing Units | 296 | 3,596 |
| Median Property Value | $342,000 | $423,400 |
| Median Household Income | $115,441 | $1,675 |
| Monthly Housing Costs | $835 | $980 |
| Real Estate Taxes | $4,778 | $33 |
Property Value by Mortgage Status in Lake Arbor
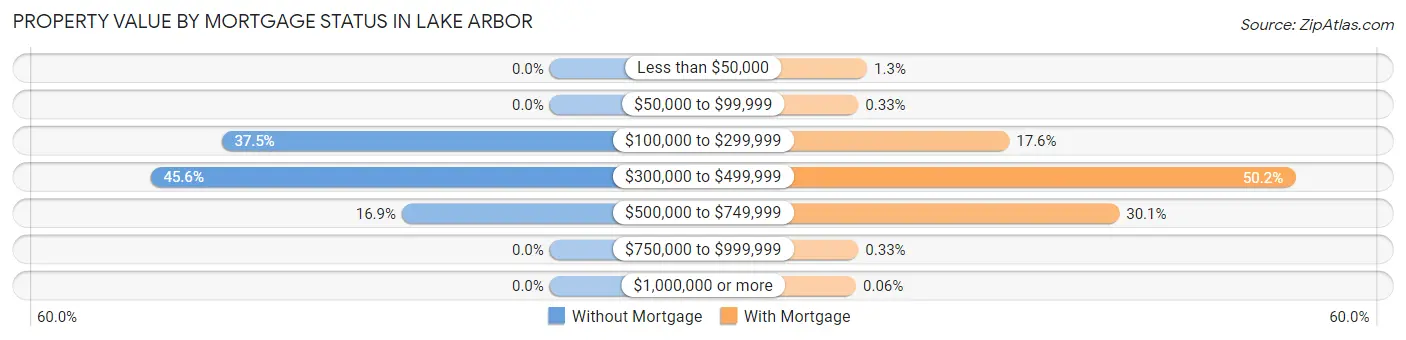
| Property Value | Without Mortgage | With Mortgage |
| Less than $50,000 | 0 (0.0%) | 48 (1.3%) |
| $50,000 to $99,999 | 0 (0.0%) | 12 (0.3%) |
| $100,000 to $299,999 | 111 (37.5%) | 632 (17.6%) |
| $300,000 to $499,999 | 135 (45.6%) | 1,806 (50.2%) |
| $500,000 to $749,999 | 50 (16.9%) | 1,084 (30.1%) |
| $750,000 to $999,999 | 0 (0.0%) | 12 (0.3%) |
| $1,000,000 or more | 0 (0.0%) | 2 (0.1%) |
| Total | 296 (100.0%) | 3,596 (100.0%) |
Household Income by Mortgage Status in Lake Arbor
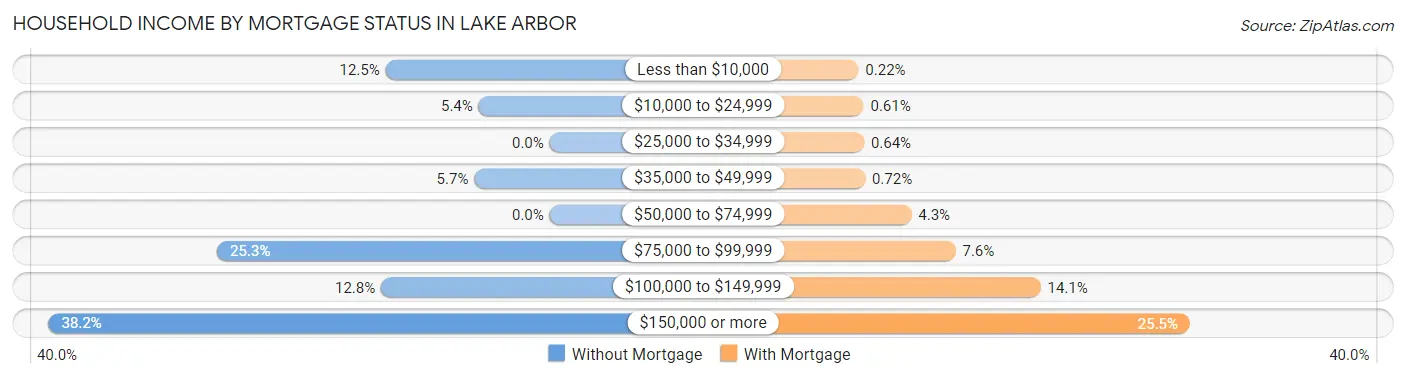
| Household Income | Without Mortgage | With Mortgage |
| Less than $10,000 | 37 (12.5%) | 8 (0.2%) |
| $10,000 to $24,999 | 16 (5.4%) | 22 (0.6%) |
| $25,000 to $34,999 | 0 (0.0%) | 23 (0.6%) |
| $35,000 to $49,999 | 17 (5.7%) | 26 (0.7%) |
| $50,000 to $74,999 | 0 (0.0%) | 153 (4.3%) |
| $75,000 to $99,999 | 75 (25.3%) | 274 (7.6%) |
| $100,000 to $149,999 | 38 (12.8%) | 507 (14.1%) |
| $150,000 or more | 113 (38.2%) | 916 (25.5%) |
| Total | 296 (100.0%) | 3,596 (100.0%) |
Property Value to Household Income Ratio in Lake Arbor
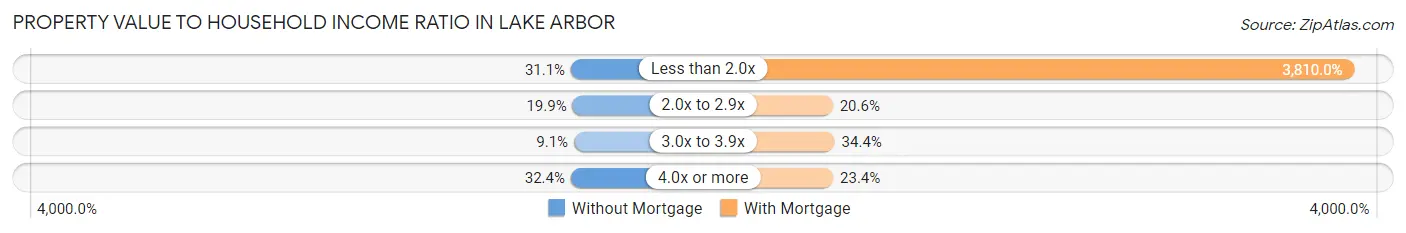
| Value-to-Income Ratio | Without Mortgage | With Mortgage |
| Less than 2.0x | 92 (31.1%) | 137,009 (3,810.0%) |
| 2.0x to 2.9x | 59 (19.9%) | 739 (20.5%) |
| 3.0x to 3.9x | 27 (9.1%) | 1,238 (34.4%) |
| 4.0x or more | 96 (32.4%) | 841 (23.4%) |
| Total | 296 (100.0%) | 3,596 (100.0%) |
Real Estate Taxes by Mortgage Status in Lake Arbor
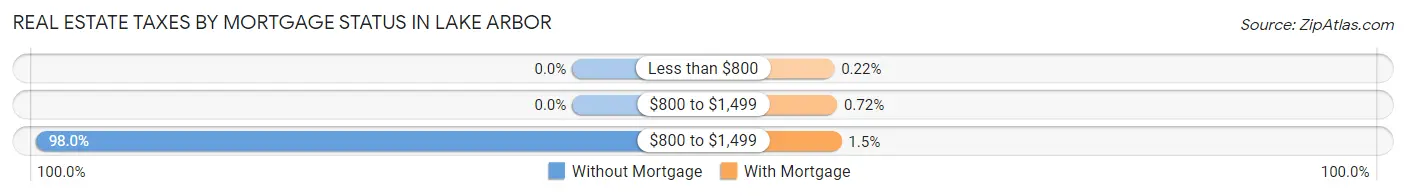
| Property Taxes | Without Mortgage | With Mortgage |
| Less than $800 | 0 (0.0%) | 8 (0.2%) |
| $800 to $1,499 | 0 (0.0%) | 26 (0.7%) |
| $800 to $1,499 | 290 (98.0%) | 55 (1.5%) |
| Total | 296 (100.0%) | 3,596 (100.0%) |
Health & Disability in Lake Arbor
Health Insurance Coverage by Age in Lake Arbor
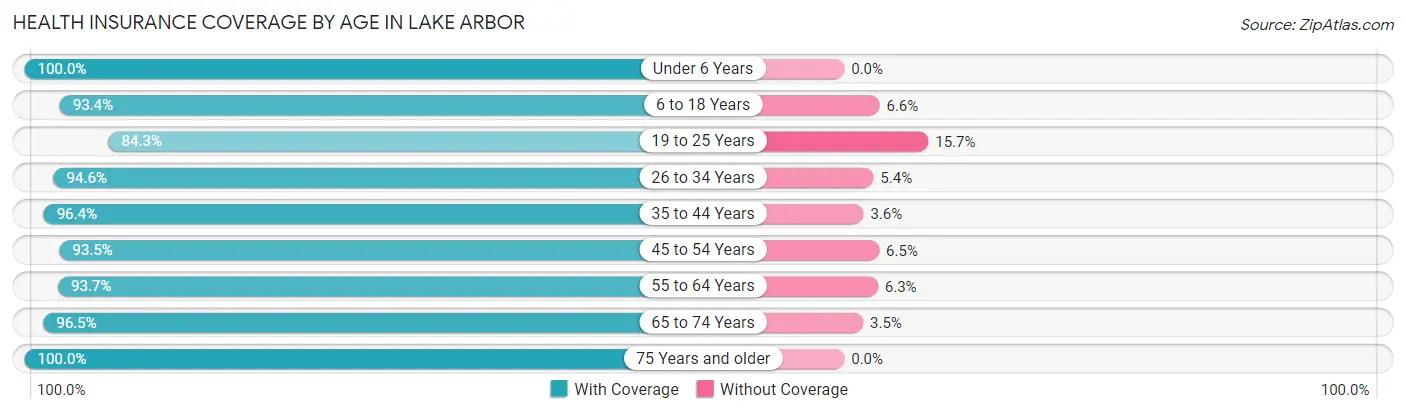
| Age Bracket | With Coverage | Without Coverage |
| Under 6 Years | 826 (100.0%) | 0 (0.0%) |
| 6 to 18 Years | 1,964 (93.4%) | 138 (6.6%) |
| 19 to 25 Years | 694 (84.3%) | 129 (15.7%) |
| 26 to 34 Years | 1,479 (94.6%) | 85 (5.4%) |
| 35 to 44 Years | 2,211 (96.4%) | 82 (3.6%) |
| 45 to 54 Years | 2,375 (93.5%) | 165 (6.5%) |
| 55 to 64 Years | 1,827 (93.7%) | 122 (6.3%) |
| 65 to 74 Years | 1,236 (96.5%) | 45 (3.5%) |
| 75 Years and older | 1,207 (100.0%) | 0 (0.0%) |
| Total | 13,819 (94.8%) | 766 (5.2%) |
Health Insurance Coverage by Citizenship Status in Lake Arbor
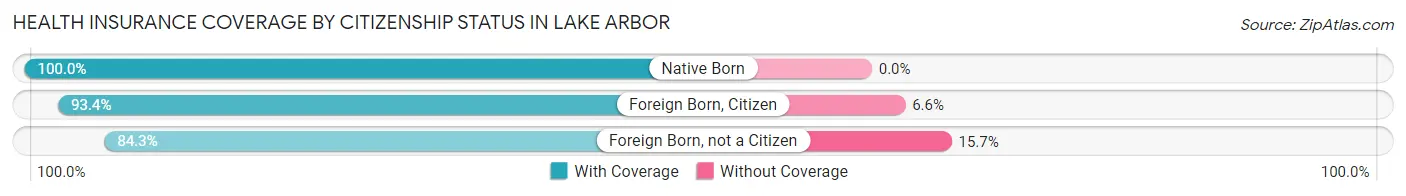
| Citizenship Status | With Coverage | Without Coverage |
| Native Born | 826 (100.0%) | 0 (0.0%) |
| Foreign Born, Citizen | 1,964 (93.4%) | 138 (6.6%) |
| Foreign Born, not a Citizen | 694 (84.3%) | 129 (15.7%) |
Health Insurance Coverage by Household Income in Lake Arbor
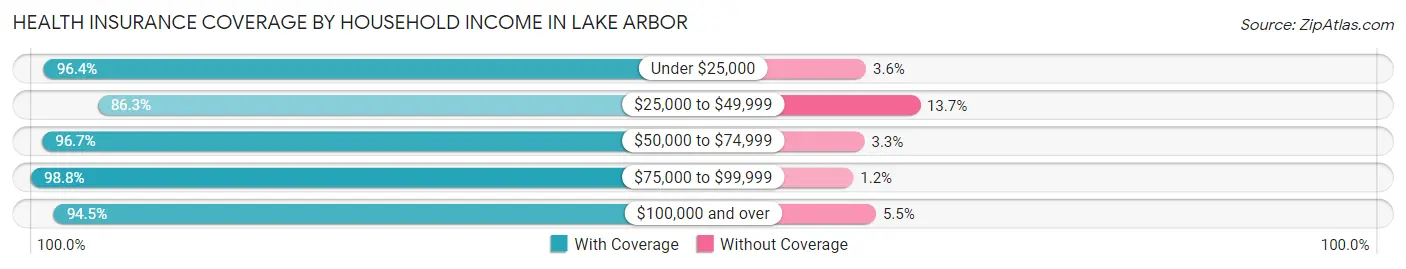
| Household Income | With Coverage | Without Coverage |
| Under $25,000 | 719 (96.4%) | 27 (3.6%) |
| $25,000 to $49,999 | 686 (86.3%) | 109 (13.7%) |
| $50,000 to $74,999 | 787 (96.7%) | 27 (3.3%) |
| $75,000 to $99,999 | 1,531 (98.8%) | 19 (1.2%) |
| $100,000 and over | 10,083 (94.5%) | 584 (5.5%) |
Public vs Private Health Insurance Coverage by Age in Lake Arbor
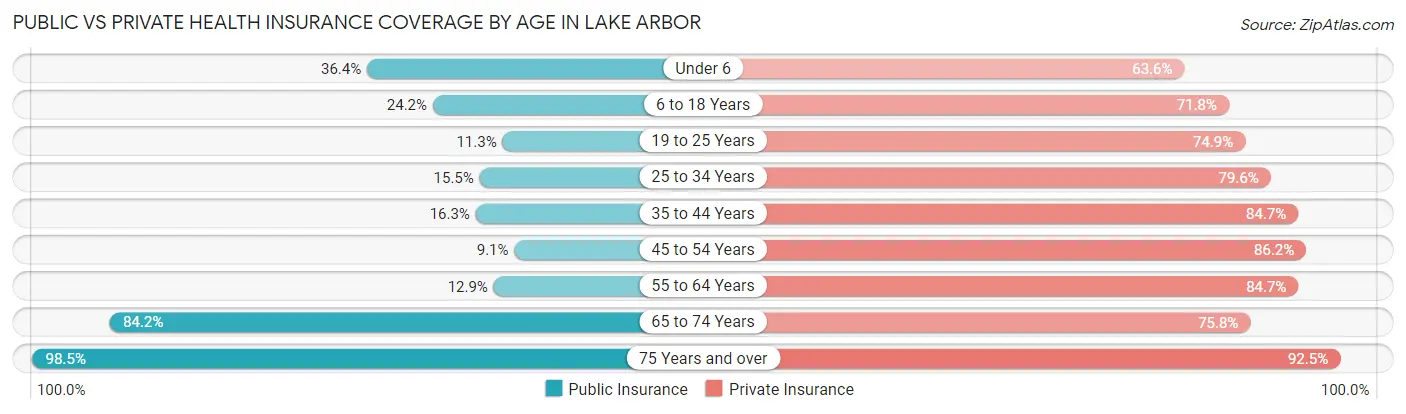
| Age Bracket | Public Insurance | Private Insurance |
| Under 6 | 301 (36.4%) | 525 (63.6%) |
| 6 to 18 Years | 509 (24.2%) | 1,510 (71.8%) |
| 19 to 25 Years | 93 (11.3%) | 616 (74.9%) |
| 25 to 34 Years | 243 (15.5%) | 1,245 (79.6%) |
| 35 to 44 Years | 373 (16.3%) | 1,942 (84.7%) |
| 45 to 54 Years | 231 (9.1%) | 2,189 (86.2%) |
| 55 to 64 Years | 252 (12.9%) | 1,651 (84.7%) |
| 65 to 74 Years | 1,078 (84.2%) | 971 (75.8%) |
| 75 Years and over | 1,189 (98.5%) | 1,116 (92.5%) |
| Total | 4,269 (29.3%) | 11,765 (80.7%) |
Disability Status by Sex by Age in Lake Arbor
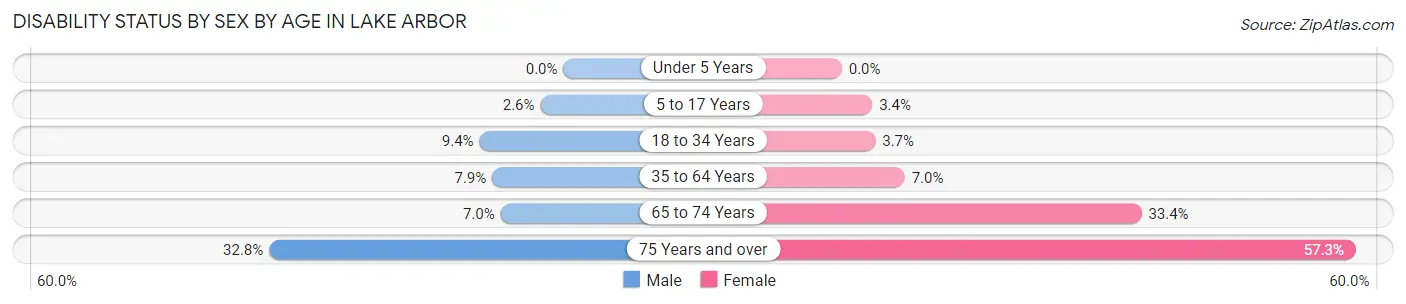
| Age Bracket | Male | Female |
| Under 5 Years | 0 (0.0%) | 0 (0.0%) |
| 5 to 17 Years | 28 (2.6%) | 35 (3.4%) |
| 18 to 34 Years | 102 (9.3%) | 52 (3.7%) |
| 35 to 64 Years | 251 (7.9%) | 254 (7.0%) |
| 65 to 74 Years | 29 (7.0%) | 289 (33.4%) |
| 75 Years and over | 174 (32.8%) | 387 (57.3%) |
Disability Class by Sex by Age in Lake Arbor
Disability Class: Hearing Difficulty
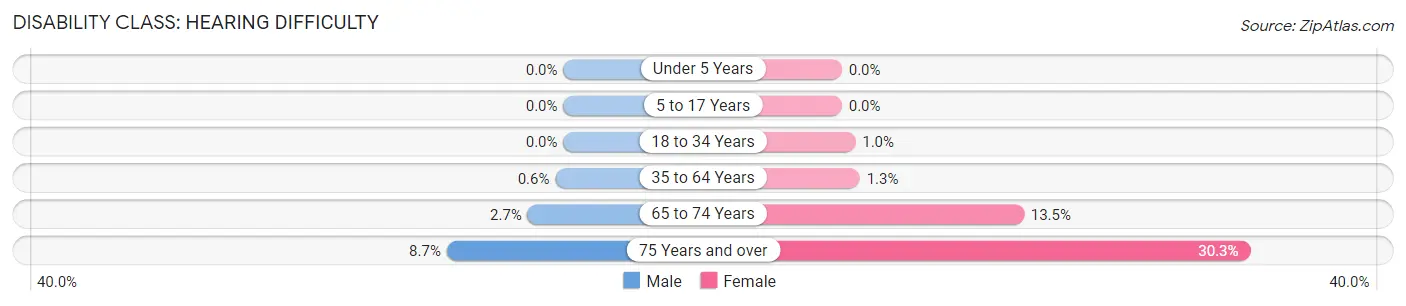
| Age Bracket | Male | Female |
| Under 5 Years | 0 (0.0%) | 0 (0.0%) |
| 5 to 17 Years | 0 (0.0%) | 0 (0.0%) |
| 18 to 34 Years | 0 (0.0%) | 14 (1.0%) |
| 35 to 64 Years | 19 (0.6%) | 48 (1.3%) |
| 65 to 74 Years | 11 (2.6%) | 117 (13.5%) |
| 75 Years and over | 46 (8.7%) | 205 (30.3%) |
Disability Class: Vision Difficulty
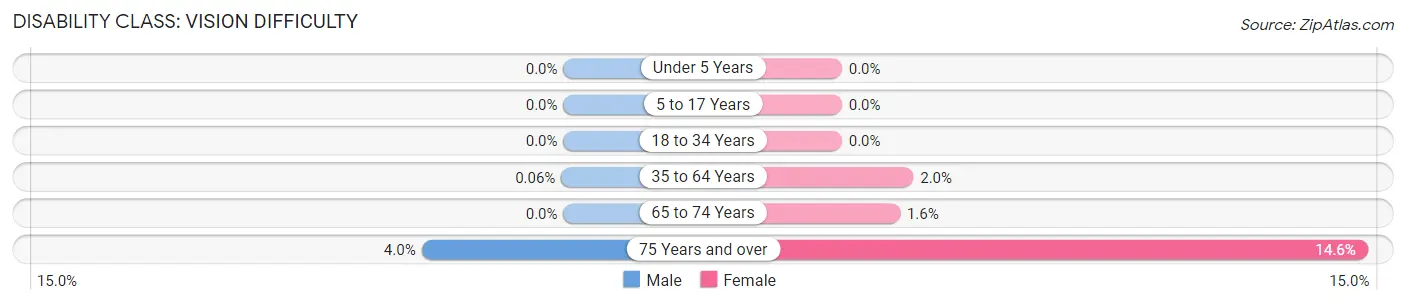
| Age Bracket | Male | Female |
| Under 5 Years | 0 (0.0%) | 0 (0.0%) |
| 5 to 17 Years | 0 (0.0%) | 0 (0.0%) |
| 18 to 34 Years | 0 (0.0%) | 0 (0.0%) |
| 35 to 64 Years | 2 (0.1%) | 72 (2.0%) |
| 65 to 74 Years | 0 (0.0%) | 14 (1.6%) |
| 75 Years and over | 21 (4.0%) | 99 (14.6%) |
Disability Class: Cognitive Difficulty
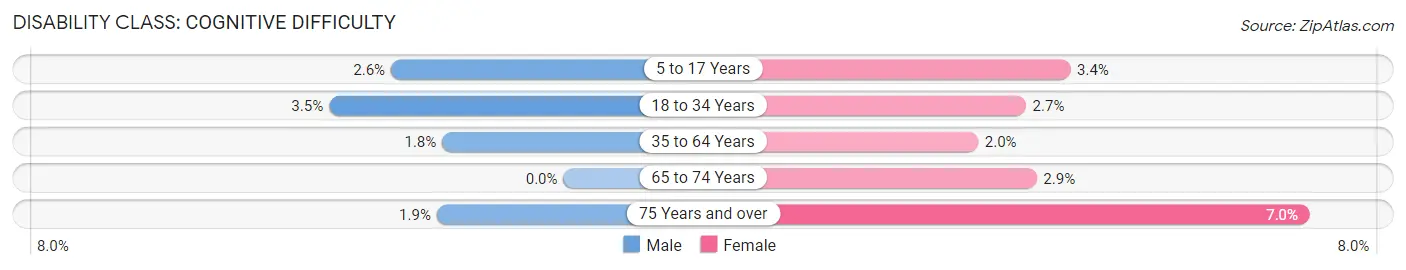
| Age Bracket | Male | Female |
| 5 to 17 Years | 28 (2.6%) | 35 (3.4%) |
| 18 to 34 Years | 38 (3.5%) | 38 (2.7%) |
| 35 to 64 Years | 57 (1.8%) | 73 (2.0%) |
| 65 to 74 Years | 0 (0.0%) | 25 (2.9%) |
| 75 Years and over | 10 (1.9%) | 47 (7.0%) |
Disability Class: Ambulatory Difficulty
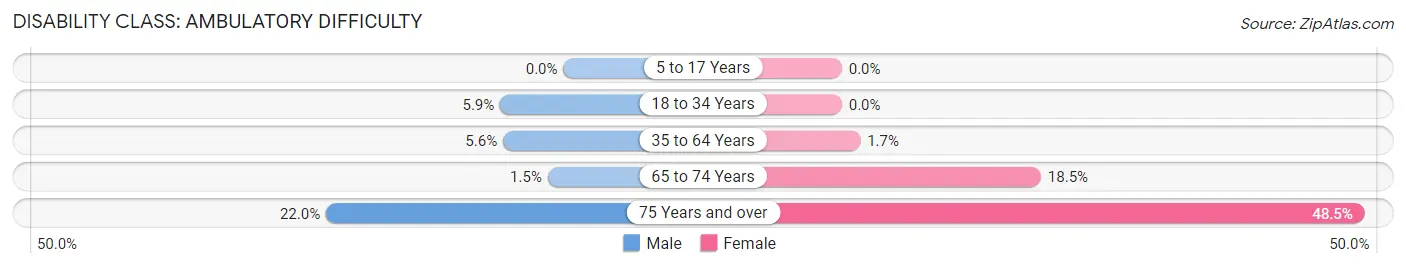
| Age Bracket | Male | Female |
| 5 to 17 Years | 0 (0.0%) | 0 (0.0%) |
| 18 to 34 Years | 64 (5.9%) | 0 (0.0%) |
| 35 to 64 Years | 177 (5.6%) | 62 (1.7%) |
| 65 to 74 Years | 6 (1.5%) | 160 (18.5%) |
| 75 Years and over | 117 (22.0%) | 328 (48.5%) |
Disability Class: Self-Care Difficulty
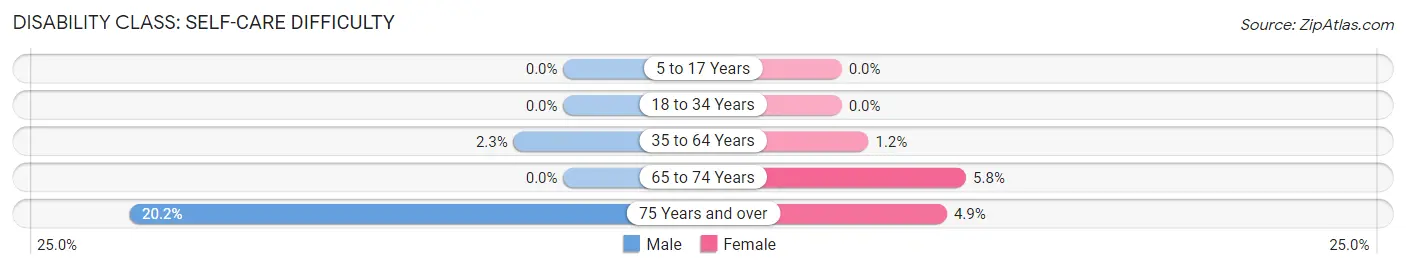
| Age Bracket | Male | Female |
| 5 to 17 Years | 0 (0.0%) | 0 (0.0%) |
| 18 to 34 Years | 0 (0.0%) | 0 (0.0%) |
| 35 to 64 Years | 73 (2.3%) | 45 (1.2%) |
| 65 to 74 Years | 0 (0.0%) | 50 (5.8%) |
| 75 Years and over | 107 (20.2%) | 33 (4.9%) |
Technology Access in Lake Arbor
Computing Device Access in Lake Arbor
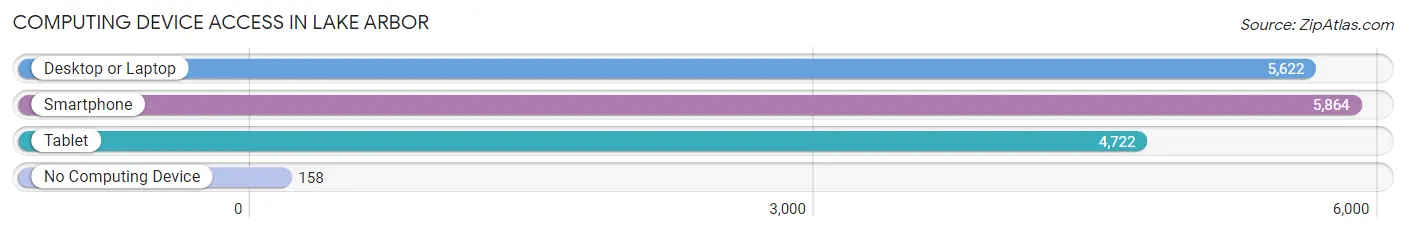
| Device Type | # Households | % Households |
| Desktop or Laptop | 5,622 | 91.0% |
| Smartphone | 5,864 | 94.9% |
| Tablet | 4,722 | 76.4% |
| No Computing Device | 158 | 2.6% |
| Total | 6,180 | 100.0% |
Internet Access in Lake Arbor
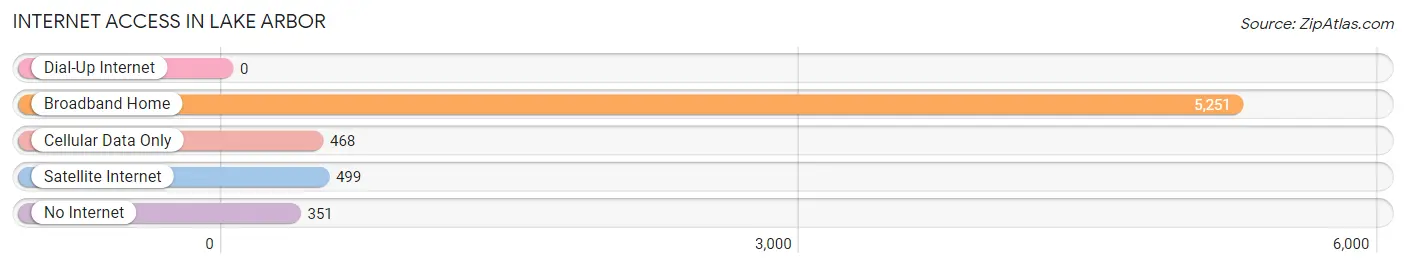
| Internet Type | # Households | % Households |
| Dial-Up Internet | 0 | 0.0% |
| Broadband Home | 5,251 | 85.0% |
| Cellular Data Only | 468 | 7.6% |
| Satellite Internet | 499 | 8.1% |
| No Internet | 351 | 5.7% |
| Total | 6,180 | 100.0% |
Lake Arbor Summary
History
The history of Lake Arbor, Maryland dates back to the mid-1800s when the area was first settled by farmers. The area was originally known as “Arborville” and was part of Anne Arundel County. In the early 1900s, the area was developed into a residential community and was renamed “Lake Arbor” in honor of the nearby lake.
The area was primarily rural until the 1950s when the population began to grow rapidly. The population of Lake Arbor increased from 1,000 in 1950 to over 10,000 by the end of the decade. This growth was largely due to the development of the nearby Washington, D.C. suburbs.
In the 1960s, Lake Arbor was incorporated as a town and the population continued to grow. By the end of the decade, the population had reached over 20,000.
The 1970s saw the construction of several new housing developments in the area, as well as the opening of a shopping center and other businesses. This period of growth continued into the 1980s and 1990s, and by 2000 the population had reached over 30,000.
Geography
Lake Arbor is located in Anne Arundel County, Maryland, approximately 20 miles south of Baltimore and 30 miles east of Washington, D.C. The town is situated on the western shore of the Chesapeake Bay and is bordered by the Patuxent River to the north and the Severn River to the south.
The town covers an area of approximately 8.5 square miles and is mostly residential, with some commercial and industrial areas. The terrain is mostly flat, with some hills in the northern part of the town.
Economy
The economy of Lake Arbor is largely based on the service industry, with many residents employed in retail, hospitality, and healthcare. The town is also home to several large employers, including the Anne Arundel Medical Center, the University of Maryland Medical Center, and the National Security Agency.
The town is also home to several small businesses including restaurants shops and other services
Demographics
As of the 2010 census, the population of Lake Arbor was 33,817. The racial makeup of the town was 57.3% White, 28.2% African American, 8.2% Asian, and 6.3% Hispanic or Latino.
The median household income in Lake Arbor was $68,845, and the median home value was $269,000. The town has a high rate of homeownership, with over 70% of residents owning their own homes.
The town is served by the Anne Arundel County Public Schools system, which includes several elementary, middle, and high schools. The town is also home to several private schools, including the Lake Arbor Christian Academy and the Lake Arbor Montessori School.
Common Questions
What is Per Capita Income in Lake Arbor?
Per Capita income in Lake Arbor is $57,753.
What is the Median Family Income in Lake Arbor?
Median Family Income in Lake Arbor is $135,872.
What is the Median Household income in Lake Arbor?
Median Household Income in Lake Arbor is $118,518.
What is Income or Wage Gap in Lake Arbor?
Income or Wage Gap in Lake Arbor is 27.5%.
Women in Lake Arbor earn 72.5 cents for every dollar earned by a man.
What is Inequality or Gini Index in Lake Arbor?
Inequality or Gini Index in Lake Arbor is 0.35.
What is the Total Population of Lake Arbor?
Total Population of Lake Arbor is 14,901.
What is the Total Male Population of Lake Arbor?
Total Male Population of Lake Arbor is 6,900.
What is the Total Female Population of Lake Arbor?
Total Female Population of Lake Arbor is 8,001.
What is the Ratio of Males per 100 Females in Lake Arbor?
There are 86.24 Males per 100 Females in Lake Arbor.
What is the Ratio of Females per 100 Males in Lake Arbor?
There are 115.96 Females per 100 Males in Lake Arbor.
What is the Median Population Age in Lake Arbor?
Median Population Age in Lake Arbor is 43.7 Years.
What is the Average Family Size in Lake Arbor
Average Family Size in Lake Arbor is 3.1 People.
What is the Average Household Size in Lake Arbor
Average Household Size in Lake Arbor is 2.4 People.
How Large is the Labor Force in Lake Arbor?
There are 9,104 People in the Labor Forcein in Lake Arbor.
What is the Percentage of People in the Labor Force in Lake Arbor?
73.4% of People are in the Labor Force in Lake Arbor.
What is the Unemployment Rate in Lake Arbor?
Unemployment Rate in Lake Arbor is 5.1%.