Cities with the Highest Percentage of Immigrants from Grenada in Maryland
RELATED REPORTS & OPTIONS
Grenada
Maryland
Compare Cities
Map of Cities with the Highest Percentage of Immigrants from Grenada in Maryland
0.00%
1.50%
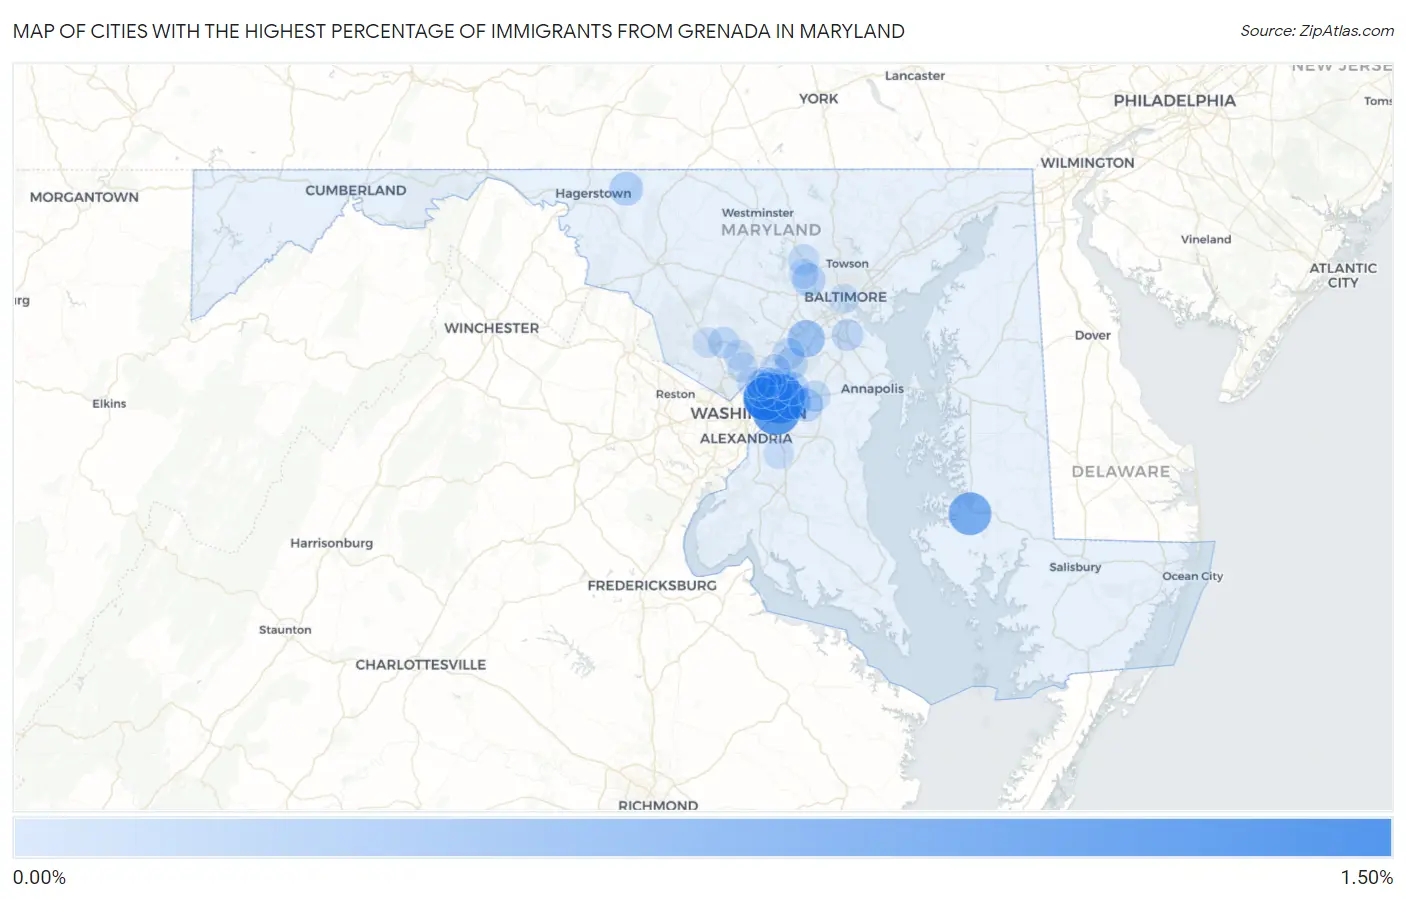
Cities with the Highest Percentage of Immigrants from Grenada in Maryland
| City | Grenada | vs State | vs National | |
| 1. | North Brentwood | 1.04% | 0.015%(+1.03)#-1 | 0.010%(+1.03)#0 |
| 2. | Landover Hills | 1.04% | 0.015%(+1.02)#0 | 0.010%(+1.03)#1 |
| 3. | Fairmount Heights | 0.94% | 0.015%(+0.925)#1 | 0.010%(+0.929)#2 |
| 4. | Mount Rainier | 0.71% | 0.015%(+0.699)#2 | 0.010%(+0.704)#3 |
| 5. | Cambridge | 0.67% | 0.015%(+0.659)#3 | 0.010%(+0.664)#4 |
| 6. | Woodlawn Cdp Prince George S County | 0.45% | 0.015%(+0.438)#4 | 0.010%(+0.442)#5 |
| 7. | Jessup | 0.37% | 0.015%(+0.360)#5 | 0.010%(+0.365)#6 |
| 8. | Springdale | 0.32% | 0.015%(+0.308)#6 | 0.010%(+0.313)#7 |
| 9. | Riverdale Park | 0.29% | 0.015%(+0.273)#7 | 0.010%(+0.278)#8 |
| 10. | Smithsburg | 0.20% | 0.015%(+0.183)#8 | 0.010%(+0.188)#9 |
| 11. | Woodmore | 0.18% | 0.015%(+0.168)#9 | 0.010%(+0.172)#10 |
| 12. | Milford Mill | 0.17% | 0.015%(+0.156)#10 | 0.010%(+0.161)#11 |
| 13. | Seabrook | 0.15% | 0.015%(+0.140)#11 | 0.010%(+0.144)#12 |
| 14. | Greenbelt | 0.15% | 0.015%(+0.131)#12 | 0.010%(+0.136)#13 |
| 15. | South Laurel | 0.13% | 0.015%(+0.112)#13 | 0.010%(+0.116)#14 |
| 16. | Glen Burnie | 0.098% | 0.015%(+0.083)#14 | 0.010%(+0.088)#15 |
| 17. | Laurel | 0.095% | 0.015%(+0.080)#15 | 0.010%(+0.084)#16 |
| 18. | Beltsville | 0.091% | 0.015%(+0.076)#16 | 0.010%(+0.081)#17 |
| 19. | Adelphi | 0.083% | 0.015%(+0.068)#17 | 0.010%(+0.072)#18 |
| 20. | Redland | 0.082% | 0.015%(+0.067)#18 | 0.010%(+0.071)#19 |
| 21. | Owings Mills | 0.074% | 0.015%(+0.059)#19 | 0.010%(+0.064)#20 |
| 22. | Bowie | 0.059% | 0.015%(+0.044)#20 | 0.010%(+0.048)#21 |
| 23. | Silver Spring | 0.055% | 0.015%(+0.040)#21 | 0.010%(+0.045)#22 |
| 24. | Langley Park | 0.041% | 0.015%(+0.026)#22 | 0.010%(+0.031)#23 |
| 25. | Aspen Hill | 0.041% | 0.015%(+0.026)#23 | 0.010%(+0.030)#24 |
| 26. | Chillum | 0.036% | 0.015%(+0.021)#24 | 0.010%(+0.026)#25 |
| 27. | Clinton | 0.025% | 0.015%(+0.010)#25 | 0.010%(+0.014)#26 |
| 28. | College Park | 0.023% | 0.015%(+0.008)#26 | 0.010%(+0.013)#27 |
| 29. | Gaithersburg | 0.023% | 0.015%(+0.008)#27 | 0.010%(+0.013)#28 |
| 30. | Wheaton | 0.023% | 0.015%(+0.008)#28 | 0.010%(+0.012)#29 |
| 31. | Randallstown | 0.017% | 0.015%(+0.002)#29 | 0.010%(+0.006)#30 |
| 32. | Baltimore | 0.013% | 0.015%(-0.002)#30 | 0.010%(+0.003)#889 |
Common Questions
What are the Top 10 Cities with the Highest Percentage of Immigrants from Grenada in Maryland?
Top 10 Cities with the Highest Percentage of Immigrants from Grenada in Maryland are:
#1
1.04%
#2
1.04%
#3
0.94%
#4
0.71%
#5
0.67%
#6
0.37%
#7
0.32%
#8
0.29%
#9
0.20%
#10
0.18%
What city has the Highest Percentage of Immigrants from Grenada in Maryland?
North Brentwood has the Highest Percentage of Immigrants from Grenada in Maryland with 1.04%.
What is the Percentage of Immigrants from Grenada in the State of Maryland?
Percentage of Immigrants from Grenada in Maryland is 0.015%.
What is the Percentage of Immigrants from Grenada in the United States?
Percentage of Immigrants from Grenada in the United States is 0.010%.