Mount Vernon, MD Map & Demographics
Mount Vernon Map
Mount Vernon Overview
$32,141
PER CAPITA INCOME
$84,333
AVG FAMILY INCOME
$56,467
AVG HOUSEHOLD INCOME
3.6%
WAGE / INCOME GAP [ % ]
96.4¢/ $1
WAGE / INCOME GAP [ $ ]
0.40
INEQUALITY / GINI INDEX
824
TOTAL POPULATION
456
MALE POPULATION
368
FEMALE POPULATION
123.91
MALES / 100 FEMALES
80.70
FEMALES / 100 MALES
55.6
MEDIAN AGE
2.6
AVG FAMILY SIZE
2.4
AVG HOUSEHOLD SIZE
510
LABOR FORCE [ PEOPLE ]
71.0%
PERCENT IN LABOR FORCE
Income in Mount Vernon
Income Overview in Mount Vernon
Per Capita Income in Mount Vernon is $32,141, while median incomes of families and households are $84,333 and $56,467 respectively.
| Characteristic | Number | Measure |
| Per Capita Income | 824 | $32,141 |
| Median Family Income | 260 | $84,333 |
| Mean Family Income | 260 | $87,515 |
| Median Household Income | 339 | $56,467 |
| Mean Household Income | 339 | $76,868 |
| Income Deficit | 260 | $0 |
| Wage / Income Gap (%) | 824 | 3.58% |
| Wage / Income Gap ($) | 824 | 96.42¢ per $1 |
| Gini / Inequality Index | 824 | 0.40 |
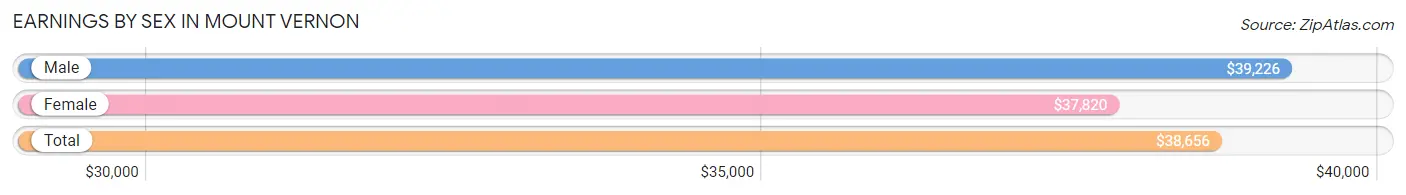
Earnings by Sex in Mount Vernon
Average Earnings in Mount Vernon are $38,656, $39,226 for men and $37,820 for women, a difference of 3.6%.
| Sex | Number | Average Earnings |
| Male | 233 (45.7%) | $39,226 |
| Female | 277 (54.3%) | $37,820 |
| Total | 510 (100.0%) | $38,656 |
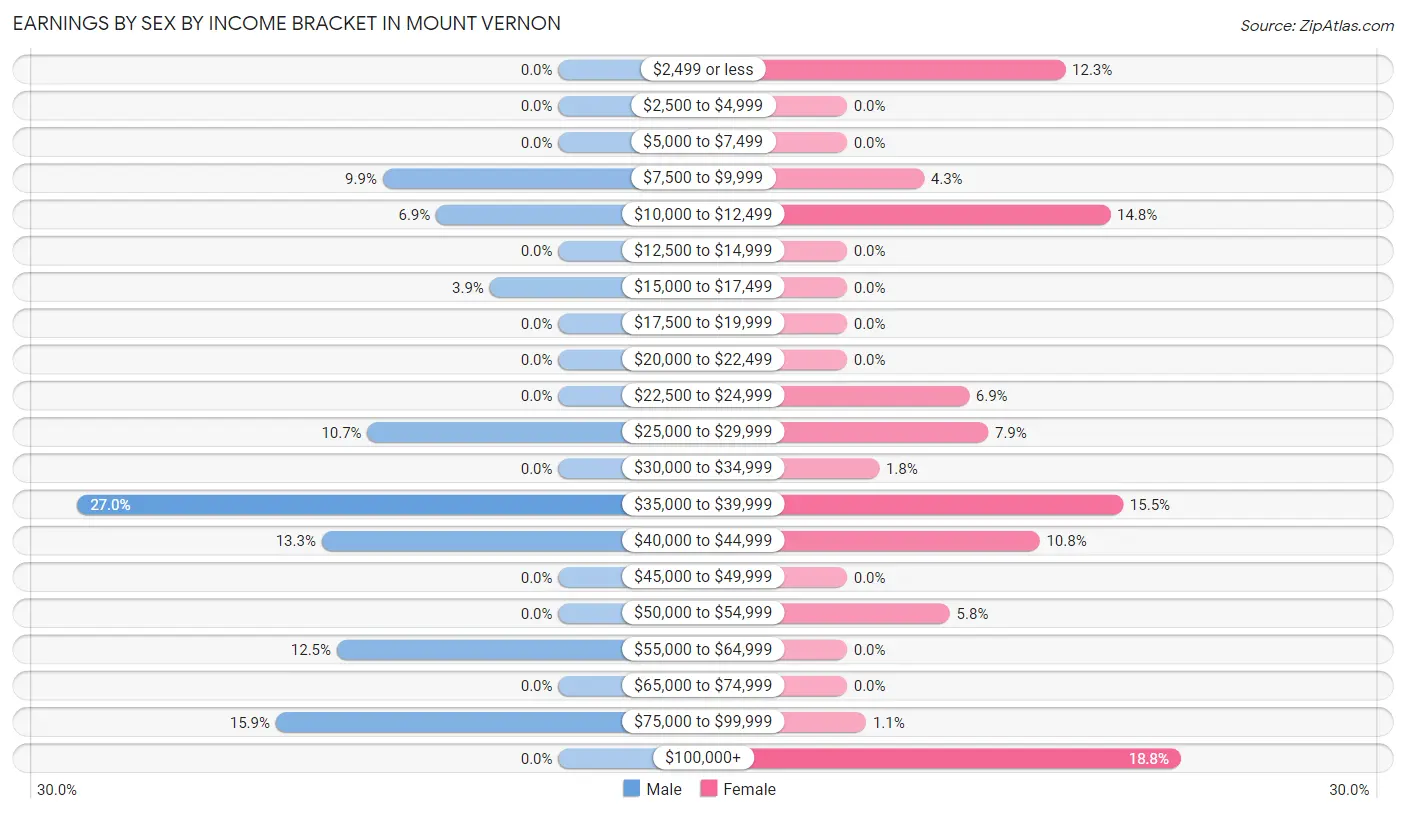
Earnings by Sex by Income Bracket in Mount Vernon
The most common earnings brackets in Mount Vernon are $35,000 to $39,999 for men (63 | 27.0%) and $100,000+ for women (52 | 18.8%).
| Income | Male | Female |
| $2,499 or less | 0 (0.0%) | 34 (12.3%) |
| $2,500 to $4,999 | 0 (0.0%) | 0 (0.0%) |
| $5,000 to $7,499 | 0 (0.0%) | 0 (0.0%) |
| $7,500 to $9,999 | 23 (9.9%) | 12 (4.3%) |
| $10,000 to $12,499 | 16 (6.9%) | 41 (14.8%) |
| $12,500 to $14,999 | 0 (0.0%) | 0 (0.0%) |
| $15,000 to $17,499 | 9 (3.9%) | 0 (0.0%) |
| $17,500 to $19,999 | 0 (0.0%) | 0 (0.0%) |
| $20,000 to $22,499 | 0 (0.0%) | 0 (0.0%) |
| $22,500 to $24,999 | 0 (0.0%) | 19 (6.9%) |
| $25,000 to $29,999 | 25 (10.7%) | 22 (7.9%) |
| $30,000 to $34,999 | 0 (0.0%) | 5 (1.8%) |
| $35,000 to $39,999 | 63 (27.0%) | 43 (15.5%) |
| $40,000 to $44,999 | 31 (13.3%) | 30 (10.8%) |
| $45,000 to $49,999 | 0 (0.0%) | 0 (0.0%) |
| $50,000 to $54,999 | 0 (0.0%) | 16 (5.8%) |
| $55,000 to $64,999 | 29 (12.4%) | 0 (0.0%) |
| $65,000 to $74,999 | 0 (0.0%) | 0 (0.0%) |
| $75,000 to $99,999 | 37 (15.9%) | 3 (1.1%) |
| $100,000+ | 0 (0.0%) | 52 (18.8%) |
| Total | 233 (100.0%) | 277 (100.0%) |
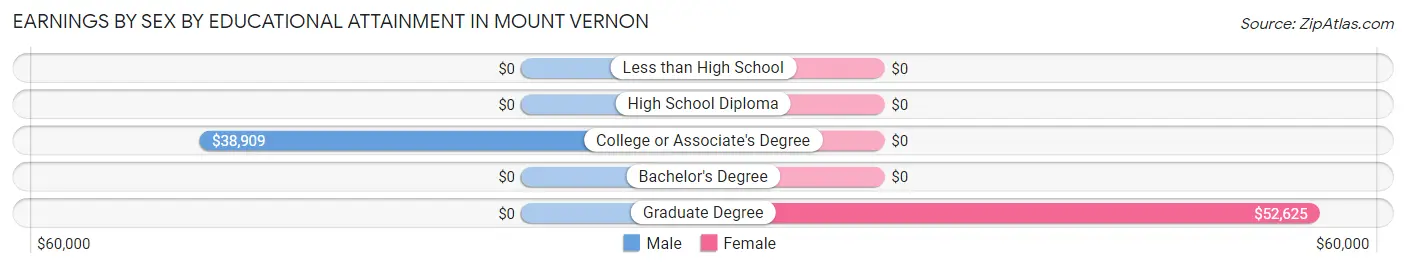
Earnings by Sex by Educational Attainment in Mount Vernon
Average earnings in Mount Vernon are $39,127 for men and $38,487 for women, a difference of 1.6%. Men with an educational attainment of college or associate's degree enjoy the highest average annual earnings of $38,909, while those with college or associate's degree education earn the least with $38,909. Women with an educational attainment of graduate degree earn the most with the average annual earnings of $52,625, while those with graduate degree education have the smallest earnings of $52,625.
| Educational Attainment | Male Income | Female Income |
| Less than High School | - | - |
| High School Diploma | - | - |
| College or Associate's Degree | $38,909 | $0 |
| Bachelor's Degree | - | - |
| Graduate Degree | - | - |
| Total | $39,127 | $38,487 |
Family Income in Mount Vernon
Family Income Brackets in Mount Vernon
According to the Mount Vernon family income data, there are 71 families falling into the $150,000 to $199,999 income range, which is the most common income bracket and makes up 27.3% of all families.
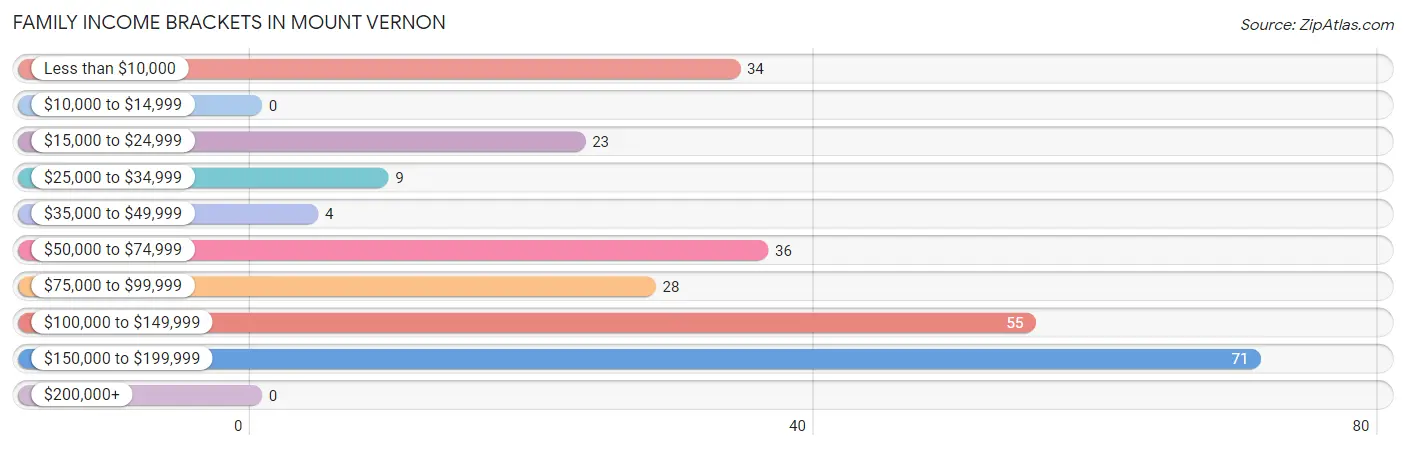
| Income Bracket | # Families | % Families |
| Less than $10,000 | 34 | 13.1% |
| $10,000 to $14,999 | 0 | 0.0% |
| $15,000 to $24,999 | 23 | 8.8% |
| $25,000 to $34,999 | 9 | 3.5% |
| $35,000 to $49,999 | 4 | 1.5% |
| $50,000 to $74,999 | 36 | 13.8% |
| $75,000 to $99,999 | 28 | 10.8% |
| $100,000 to $149,999 | 55 | 21.2% |
| $150,000 to $199,999 | 71 | 27.3% |
| $200,000+ | 0 | 0.0% |
Family Income by Famaliy Size in Mount Vernon
2-person families (200 | 76.9%) account for the highest median family income in Mount Vernon with $84,167 per family, while 2-person families (200 | 76.9%) have the highest median income of $42,084 per family member.
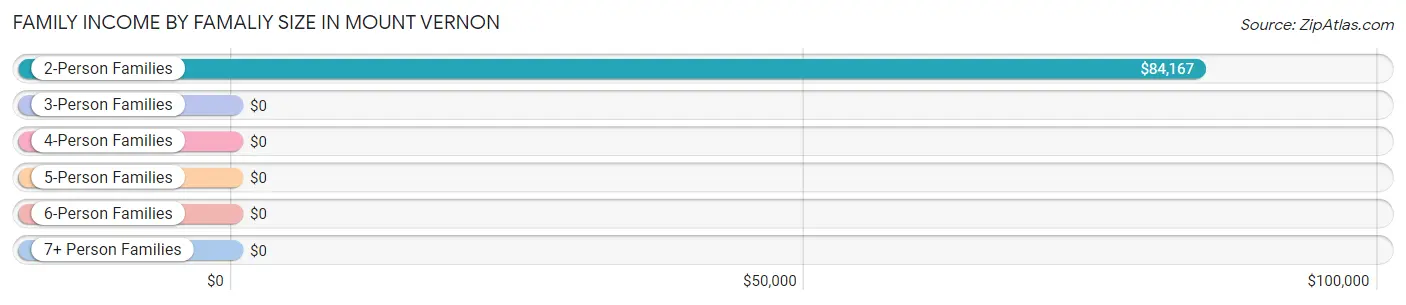
| Income Bracket | # Families | Median Income |
| 2-Person Families | 200 (76.9%) | $84,167 |
| 3-Person Families | 3 (1.1%) | $0 |
| 4-Person Families | 57 (21.9%) | $0 |
| 5-Person Families | 0 (0.0%) | $0 |
| 6-Person Families | 0 (0.0%) | $0 |
| 7+ Person Families | 0 (0.0%) | $0 |
| Total | 260 (100.0%) | $84,333 |
Family Income by Number of Earners in Mount Vernon
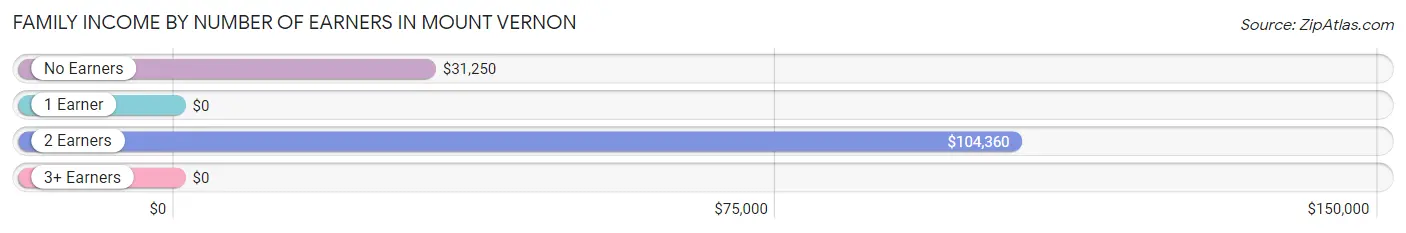
| Number of Earners | # Families | Median Income |
| No Earners | 23 (8.8%) | $31,250 |
| 1 Earner | 83 (31.9%) | $0 |
| 2 Earners | 126 (48.5%) | $104,360 |
| 3+ Earners | 28 (10.8%) | $0 |
| Total | 260 (100.0%) | $84,333 |
Household Income in Mount Vernon
Household Income Brackets in Mount Vernon
With 71 households falling in the category, the $150,000 to $199,999 income range is the most frequent in Mount Vernon, accounting for 20.9% of all households.
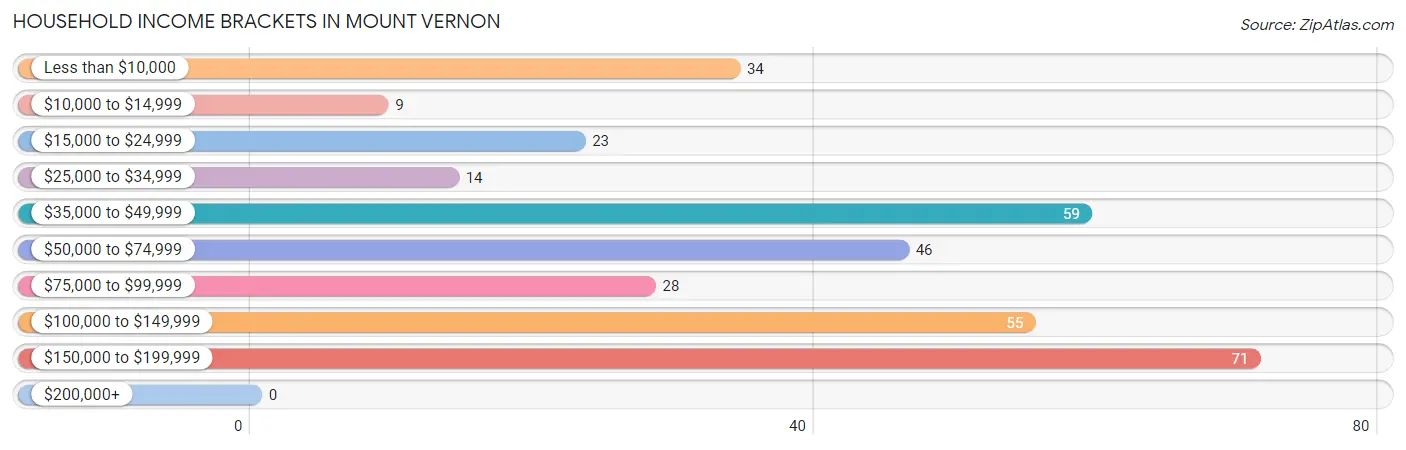
| Income Bracket | # Households | % Households |
| Less than $10,000 | 34 | 10.0% |
| $10,000 to $14,999 | 9 | 2.7% |
| $15,000 to $24,999 | 23 | 6.8% |
| $25,000 to $34,999 | 14 | 4.1% |
| $35,000 to $49,999 | 59 | 17.4% |
| $50,000 to $74,999 | 46 | 13.6% |
| $75,000 to $99,999 | 28 | 8.3% |
| $100,000 to $149,999 | 55 | 16.2% |
| $150,000 to $199,999 | 71 | 20.9% |
| $200,000+ | 0 | 0.0% |
Household Income by Householder Age in Mount Vernon
The median household income in Mount Vernon is $56,467, with the highest median household income of $92,500 found in the 45 to 64 years age bracket for the primary householder. A total of 208 households (61.4%) fall into this category. Meanwhile, the 15 to 24 years age bracket for the primary householder has the lowest median household income of $0, with 24 households (7.1%) in this group.
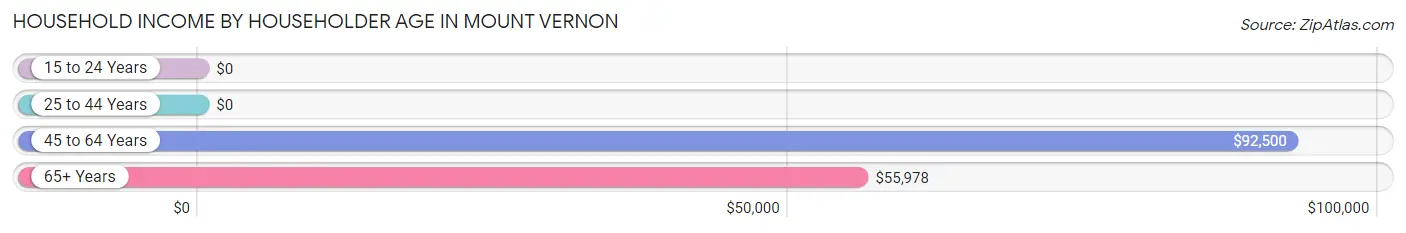
| Income Bracket | # Households | Median Income |
| 15 to 24 Years | 24 (7.1%) | $0 |
| 25 to 44 Years | 35 (10.3%) | $0 |
| 45 to 64 Years | 208 (61.4%) | $92,500 |
| 65+ Years | 72 (21.2%) | $55,978 |
| Total | 339 (100.0%) | $56,467 |
Poverty in Mount Vernon
Income Below Poverty by Sex and Age in Mount Vernon
With 35.7% poverty level for males and 14.4% for females among the residents of Mount Vernon, 5 year old males and 45 to 54 year old females are the most vulnerable to poverty, with 17 males (100.0%) and 34 females (77.3%) in their respective age groups living below the poverty level.
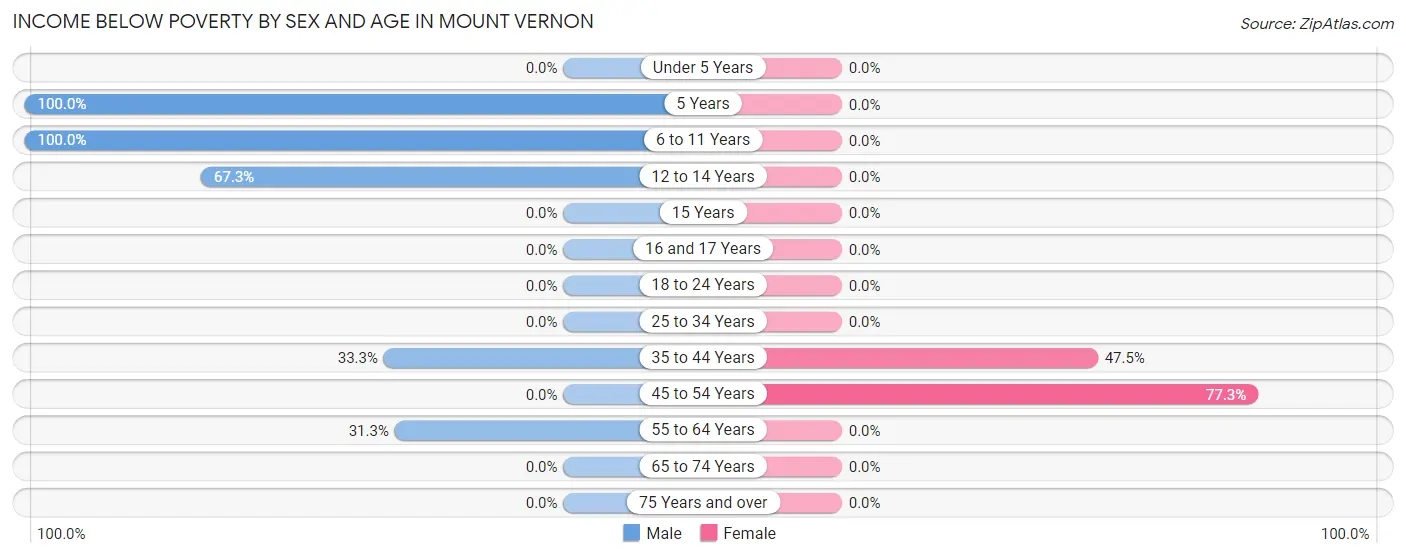
| Age Bracket | Male | Female |
| Under 5 Years | 0 (0.0%) | 0 (0.0%) |
| 5 Years | 17 (100.0%) | 0 (0.0%) |
| 6 to 11 Years | 16 (100.0%) | 0 (0.0%) |
| 12 to 14 Years | 37 (67.3%) | 0 (0.0%) |
| 15 Years | 0 (0.0%) | 0 (0.0%) |
| 16 and 17 Years | 0 (0.0%) | 0 (0.0%) |
| 18 to 24 Years | 0 (0.0%) | 0 (0.0%) |
| 25 to 34 Years | 0 (0.0%) | 0 (0.0%) |
| 35 to 44 Years | 16 (33.3%) | 19 (47.5%) |
| 45 to 54 Years | 0 (0.0%) | 34 (77.3%) |
| 55 to 64 Years | 77 (31.3%) | 0 (0.0%) |
| 65 to 74 Years | 0 (0.0%) | 0 (0.0%) |
| 75 Years and over | 0 (0.0%) | 0 (0.0%) |
| Total | 163 (35.7%) | 53 (14.4%) |
Income Above Poverty by Sex and Age in Mount Vernon
According to the poverty statistics in Mount Vernon, males aged 18 to 24 years and females aged 12 to 14 years are the age groups that are most secure financially, with 100.0% of males and 100.0% of females in these age groups living above the poverty line.
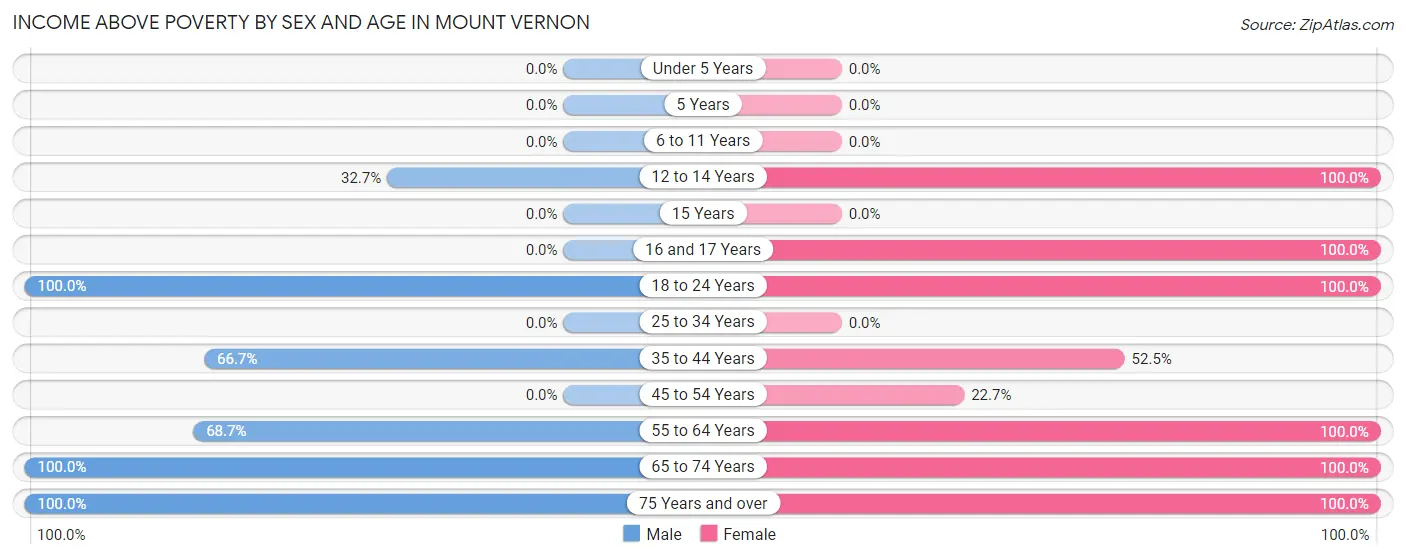
| Age Bracket | Male | Female |
| Under 5 Years | 0 (0.0%) | 0 (0.0%) |
| 5 Years | 0 (0.0%) | 0 (0.0%) |
| 6 to 11 Years | 0 (0.0%) | 0 (0.0%) |
| 12 to 14 Years | 18 (32.7%) | 18 (100.0%) |
| 15 Years | 0 (0.0%) | 0 (0.0%) |
| 16 and 17 Years | 0 (0.0%) | 9 (100.0%) |
| 18 to 24 Years | 23 (100.0%) | 46 (100.0%) |
| 25 to 34 Years | 0 (0.0%) | 0 (0.0%) |
| 35 to 44 Years | 32 (66.7%) | 21 (52.5%) |
| 45 to 54 Years | 0 (0.0%) | 10 (22.7%) |
| 55 to 64 Years | 169 (68.7%) | 144 (100.0%) |
| 65 to 74 Years | 30 (100.0%) | 40 (100.0%) |
| 75 Years and over | 21 (100.0%) | 27 (100.0%) |
| Total | 293 (64.2%) | 315 (85.6%) |
Income Below Poverty Among Married-Couple Families in Mount Vernon
The poverty statistics for married-couple families in Mount Vernon show that 7.5% or 16 of the total 213 families live below the poverty line. Families with 1 or 2 children have the highest poverty rate of 34.0%, comprising of 16 families. On the other hand, families with no children have the lowest poverty rate of 0.0%, which includes 0 families.
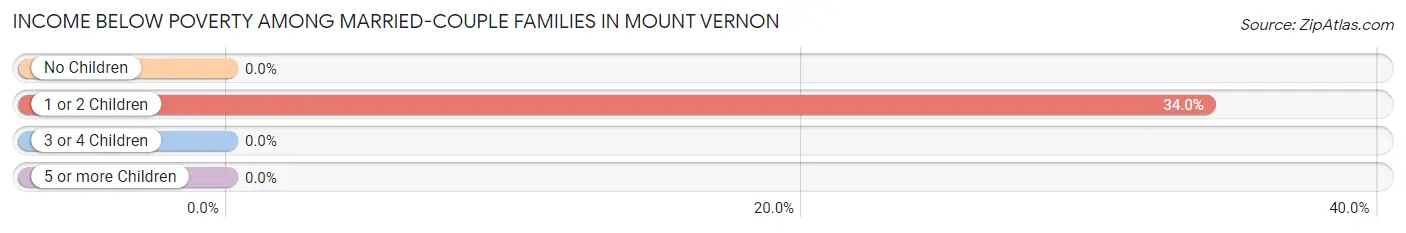
| Children | Above Poverty | Below Poverty |
| No Children | 166 (100.0%) | 0 (0.0%) |
| 1 or 2 Children | 31 (66.0%) | 16 (34.0%) |
| 3 or 4 Children | 0 (0.0%) | 0 (0.0%) |
| 5 or more Children | 0 (0.0%) | 0 (0.0%) |
| Total | 197 (92.5%) | 16 (7.5%) |
Income Below Poverty Among Single-Parent Households in Mount Vernon
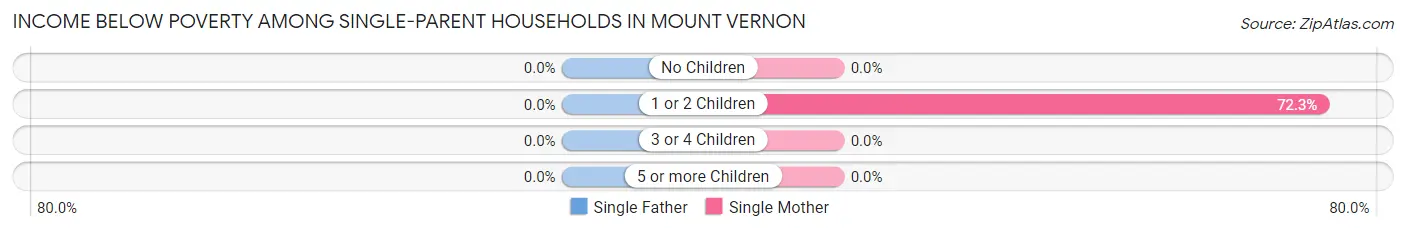
| Children | Single Father | Single Mother |
| No Children | 0 (0.0%) | 0 (0.0%) |
| 1 or 2 Children | 0 (0.0%) | 34 (72.3%) |
| 3 or 4 Children | 0 (0.0%) | 0 (0.0%) |
| 5 or more Children | 0 (0.0%) | 0 (0.0%) |
| Total | 0 (0.0%) | 34 (72.3%) |
Income Below Poverty Among Married-Couple vs Single-Parent Households in Mount Vernon
The poverty data for Mount Vernon shows that 16 of the married-couple family households (7.5%) and 34 of the single-parent households (72.3%) are living below the poverty level. Within the married-couple family households, those with 1 or 2 children have the highest poverty rate, with 16 households (34.0%) falling below the poverty line. Among the single-parent households, those with 1 or 2 children have the highest poverty rate, with 34 household (72.3%) living below poverty.
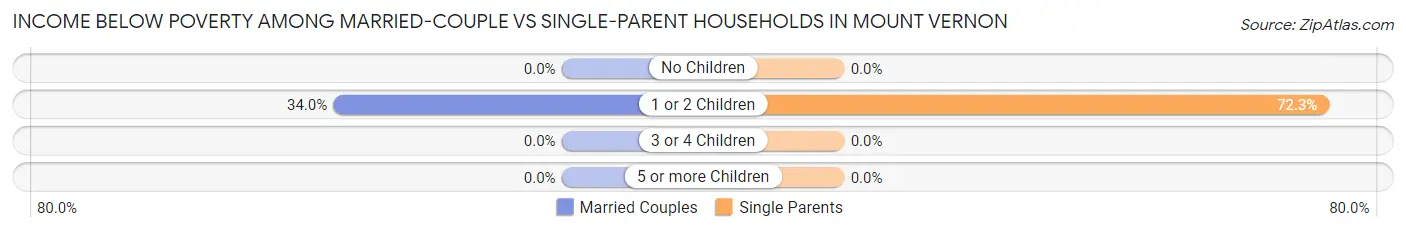
| Children | Married-Couple Families | Single-Parent Households |
| No Children | 0 (0.0%) | 0 (0.0%) |
| 1 or 2 Children | 16 (34.0%) | 34 (72.3%) |
| 3 or 4 Children | 0 (0.0%) | 0 (0.0%) |
| 5 or more Children | 0 (0.0%) | 0 (0.0%) |
| Total | 16 (7.5%) | 34 (72.3%) |
Race in Mount Vernon
The most populous races in Mount Vernon are White / Caucasian (716 | 86.9%), Asian (71 | 8.6%), and Two or more Races (37 | 4.5%).
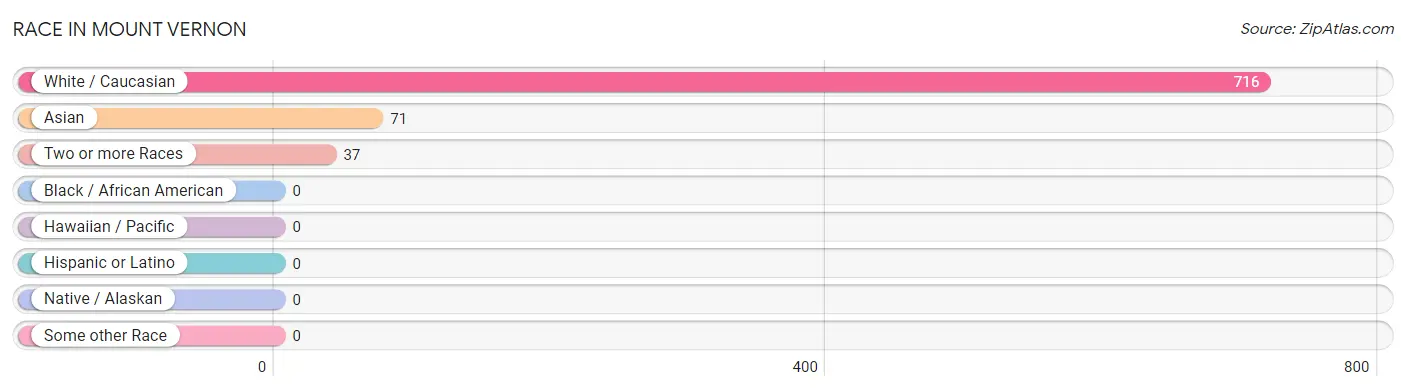
| Race | # Population | % Population |
| Asian | 71 | 8.6% |
| Black / African American | 0 | 0.0% |
| Hawaiian / Pacific | 0 | 0.0% |
| Hispanic or Latino | 0 | 0.0% |
| Native / Alaskan | 0 | 0.0% |
| White / Caucasian | 716 | 86.9% |
| Two or more Races | 37 | 4.5% |
| Some other Race | 0 | 0.0% |
| Total | 824 | 100.0% |
Ancestry in Mount Vernon
The most populous ancestries reported in Mount Vernon are American (273 | 33.1%), English (105 | 12.7%), German (95 | 11.5%), Sri Lankan (68 | 8.3%), and Italian (64 | 7.8%), together accounting for 73.4% of all Mount Vernon residents.
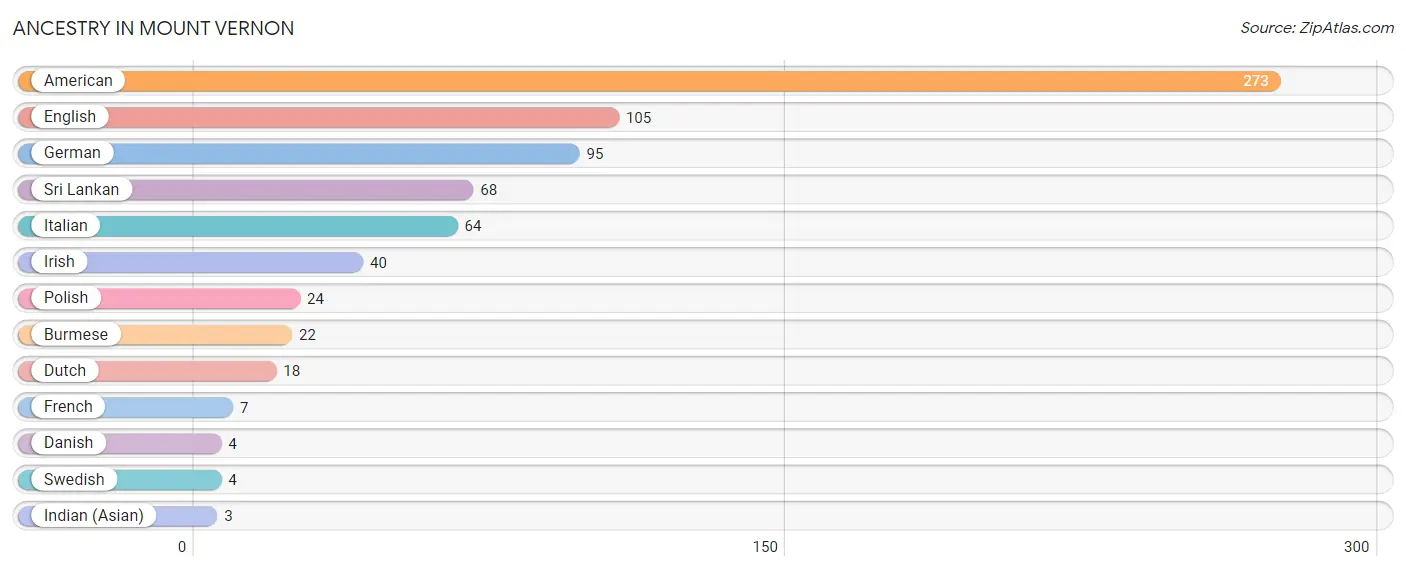
| Ancestry | # Population | % Population |
| American | 273 | 33.1% |
| Burmese | 22 | 2.7% |
| Danish | 4 | 0.5% |
| Dutch | 18 | 2.2% |
| English | 105 | 12.7% |
| French | 7 | 0.9% |
| German | 95 | 11.5% |
| Indian (Asian) | 3 | 0.4% |
| Irish | 40 | 4.9% |
| Italian | 64 | 7.8% |
| Polish | 24 | 2.9% |
| Sri Lankan | 68 | 8.3% |
| Swedish | 4 | 0.5% | View All 13 Rows |
Immigrants in Mount Vernon
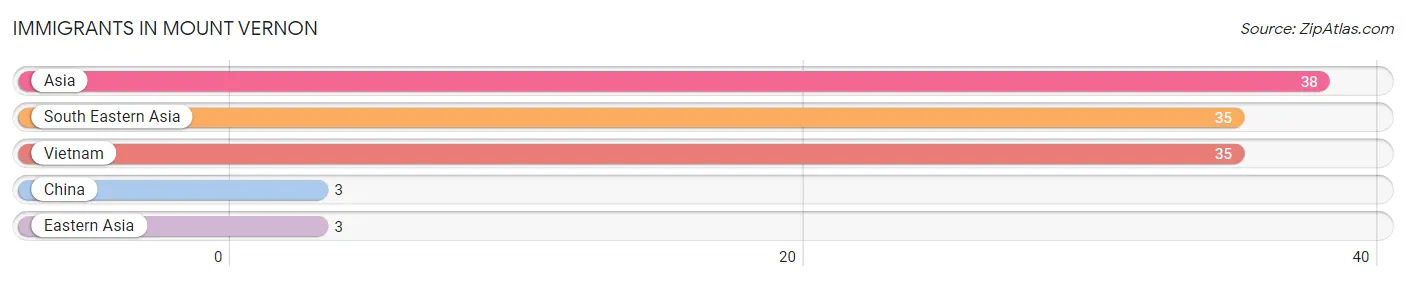
The most numerous immigrant groups reported in Mount Vernon came from Asia (38 | 4.6%), South Eastern Asia (35 | 4.3%), Vietnam (35 | 4.3%), China (3 | 0.4%), and Eastern Asia (3 | 0.4%), together accounting for 13.8% of all Mount Vernon residents.
| Immigration Origin | # Population | % Population |
| Asia | 38 | 4.6% |
| China | 3 | 0.4% |
| Eastern Asia | 3 | 0.4% |
| South Eastern Asia | 35 | 4.3% |
| Vietnam | 35 | 4.3% | View All 5 Rows |
Sex and Age in Mount Vernon
Sex and Age in Mount Vernon
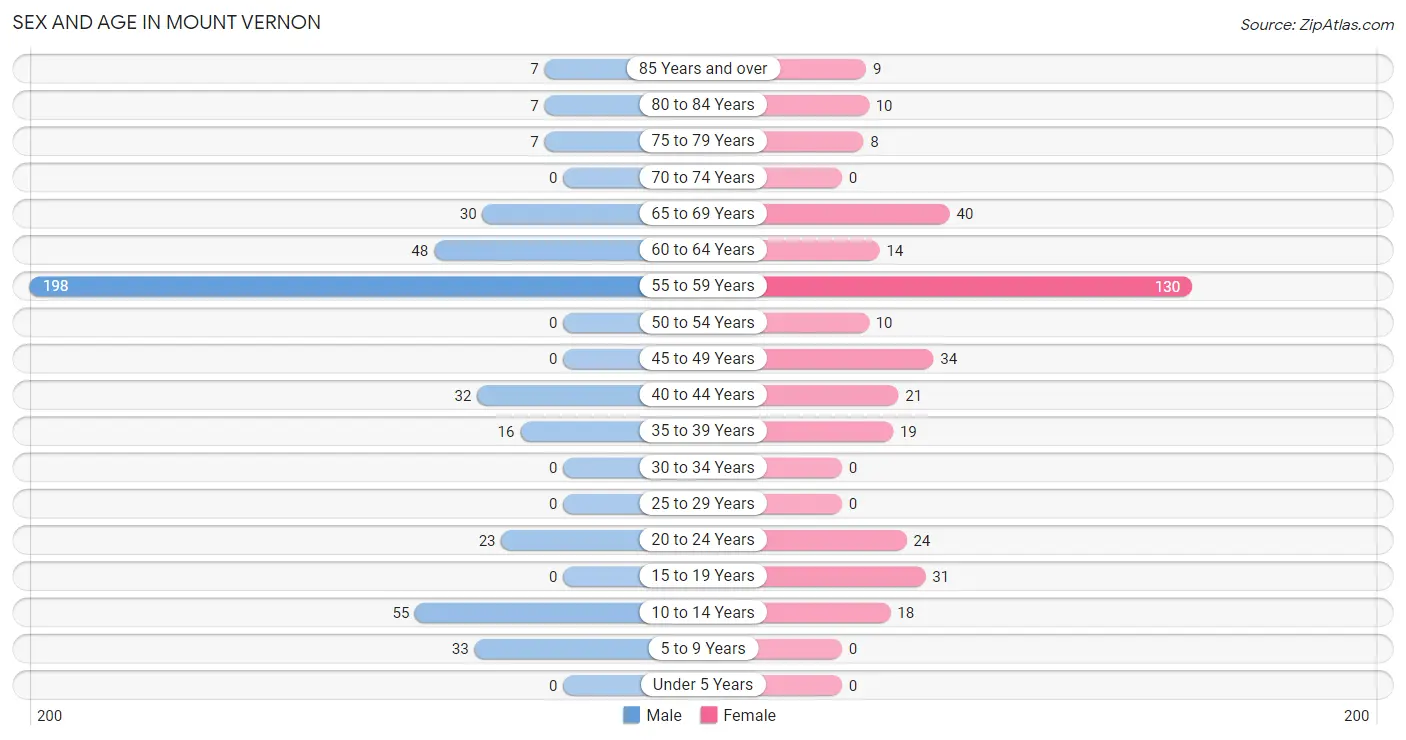
The most populous age groups in Mount Vernon are 55 to 59 Years (198 | 43.4%) for men and 55 to 59 Years (130 | 35.3%) for women.
| Age Bracket | Male | Female |
| Under 5 Years | 0 (0.0%) | 0 (0.0%) |
| 5 to 9 Years | 33 (7.2%) | 0 (0.0%) |
| 10 to 14 Years | 55 (12.1%) | 18 (4.9%) |
| 15 to 19 Years | 0 (0.0%) | 31 (8.4%) |
| 20 to 24 Years | 23 (5.0%) | 24 (6.5%) |
| 25 to 29 Years | 0 (0.0%) | 0 (0.0%) |
| 30 to 34 Years | 0 (0.0%) | 0 (0.0%) |
| 35 to 39 Years | 16 (3.5%) | 19 (5.2%) |
| 40 to 44 Years | 32 (7.0%) | 21 (5.7%) |
| 45 to 49 Years | 0 (0.0%) | 34 (9.2%) |
| 50 to 54 Years | 0 (0.0%) | 10 (2.7%) |
| 55 to 59 Years | 198 (43.4%) | 130 (35.3%) |
| 60 to 64 Years | 48 (10.5%) | 14 (3.8%) |
| 65 to 69 Years | 30 (6.6%) | 40 (10.9%) |
| 70 to 74 Years | 0 (0.0%) | 0 (0.0%) |
| 75 to 79 Years | 7 (1.5%) | 8 (2.2%) |
| 80 to 84 Years | 7 (1.5%) | 10 (2.7%) |
| 85 Years and over | 7 (1.5%) | 9 (2.5%) |
| Total | 456 (100.0%) | 368 (100.0%) |
Families and Households in Mount Vernon
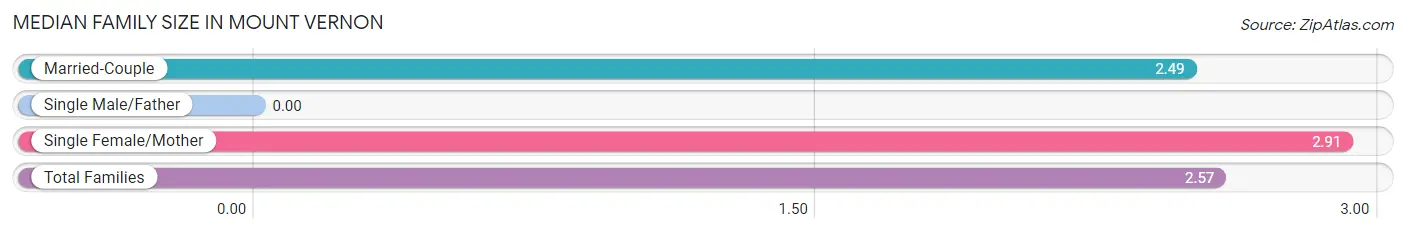
Median Family Size in Mount Vernon
| Family Type | # Families | Family Size |
| Married-Couple | 213 (81.9%) | 2.49 |
| Single Male/Father | 0 (0.0%) | - |
| Single Female/Mother | 47 (18.1%) | 2.91 |
| Total Families | 260 (100.0%) | 2.57 |
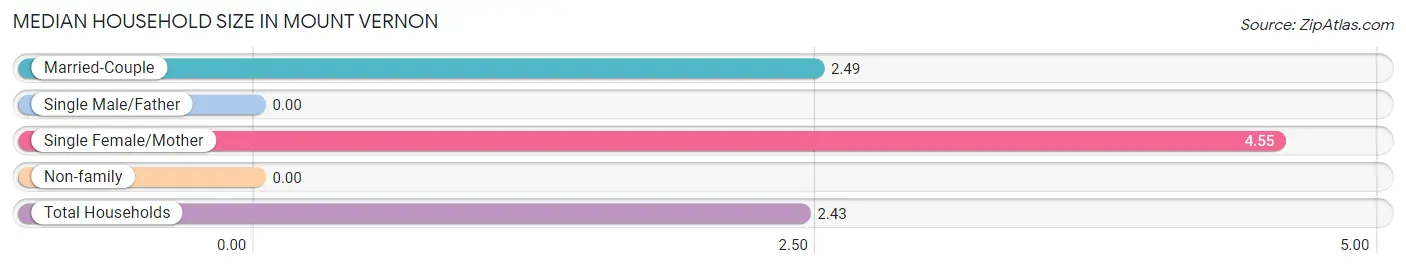
Median Household Size in Mount Vernon
| Household Type | # Households | Household Size |
| Married-Couple | 213 (62.8%) | 2.49 |
| Single Male/Father | 0 (0.0%) | - |
| Single Female/Mother | 47 (13.9%) | 4.55 |
| Non-family | 79 (23.3%) | - |
| Total Households | 339 (100.0%) | 2.43 |
Household Size by Marriage Status in Mount Vernon
Out of a total of 339 households in Mount Vernon, 260 (76.7%) are family households, while 79 (23.3%) are nonfamily households. The most numerous type of family households are 2-person households, comprising 166, and the most common type of nonfamily households are 1-person households, comprising 79.
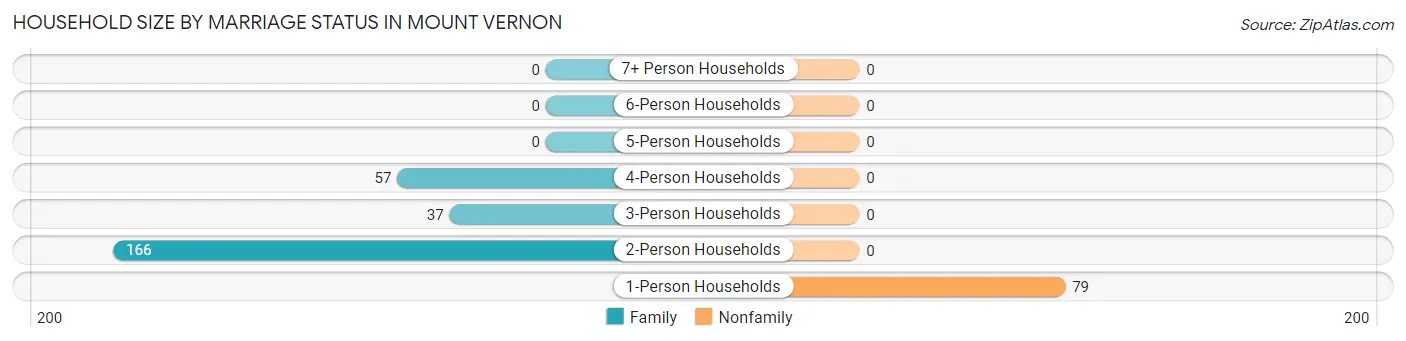
| Household Size | Family Households | Nonfamily Households |
| 1-Person Households | - | 79 (23.3%) |
| 2-Person Households | 166 (49.0%) | 0 (0.0%) |
| 3-Person Households | 37 (10.9%) | 0 (0.0%) |
| 4-Person Households | 57 (16.8%) | 0 (0.0%) |
| 5-Person Households | 0 (0.0%) | 0 (0.0%) |
| 6-Person Households | 0 (0.0%) | 0 (0.0%) |
| 7+ Person Households | 0 (0.0%) | 0 (0.0%) |
| Total | 260 (76.7%) | 79 (23.3%) |
Female Fertility in Mount Vernon
Fertility by Age in Mount Vernon
| Age Bracket | Women with Births | Births / 1,000 Women |
| 15 to 19 years | 0 (0.0%) | 0.0 |
| 20 to 34 years | 0 (0.0%) | 0.0 |
| 35 to 50 years | 0 (0.0%) | 0.0 |
| Total | 0 (0.0%) | 0.0 |
Fertility by Age by Marriage Status in Mount Vernon
| Age Bracket | Married | Unmarried |
| 15 to 19 years | 0 (0.0%) | 0 (0.0%) |
| 20 to 34 years | 0 (0.0%) | 0 (0.0%) |
| 35 to 50 years | 0 (0.0%) | 0 (0.0%) |
| Total | 0 (0.0%) | 0 (0.0%) |
Fertility by Education in Mount Vernon
| Educational Attainment | Women with Births | Births / 1,000 Women |
| Less than High School | 0 (0.0%) | 0.0 |
| High School Diploma | 0 (0.0%) | 0.0 |
| College or Associate's Degree | 0 (0.0%) | 0.0 |
| Bachelor's Degree | 0 (0.0%) | 0.0 |
| Graduate Degree | 0 (0.0%) | 0.0 |
| Total | 0 (0.0%) | 0.0 |
Fertility by Education by Marriage Status in Mount Vernon
| Educational Attainment | Married | Unmarried |
| Less than High School | 0 (0.0%) | 0 (0.0%) |
| High School Diploma | 0 (0.0%) | 0 (0.0%) |
| College or Associate's Degree | 0 (0.0%) | 0 (0.0%) |
| Bachelor's Degree | 0 (0.0%) | 0 (0.0%) |
| Graduate Degree | 0 (0.0%) | 0 (0.0%) |
| Total | 0 (0.0%) | 0 (0.0%) |
Employment Characteristics in Mount Vernon
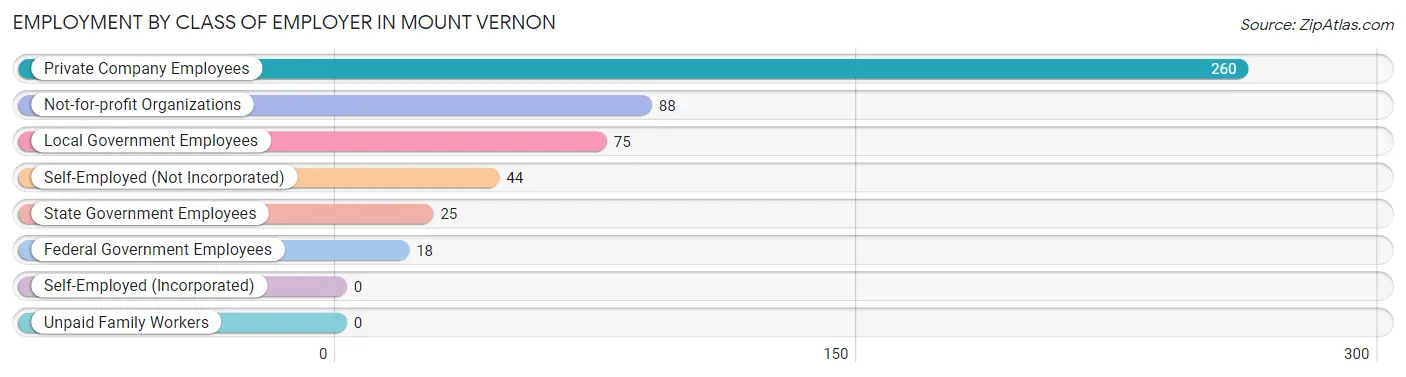
Employment by Class of Employer in Mount Vernon
Among the 510 employed individuals in Mount Vernon, private company employees (260 | 51.0%), not-for-profit organizations (88 | 17.2%), and local government employees (75 | 14.7%) make up the most common classes of employment.
| Employer Class | # Employees | % Employees |
| Private Company Employees | 260 | 51.0% |
| Self-Employed (Incorporated) | 0 | 0.0% |
| Self-Employed (Not Incorporated) | 44 | 8.6% |
| Not-for-profit Organizations | 88 | 17.2% |
| Local Government Employees | 75 | 14.7% |
| State Government Employees | 25 | 4.9% |
| Federal Government Employees | 18 | 3.5% |
| Unpaid Family Workers | 0 | 0.0% |
| Total | 510 | 100.0% |
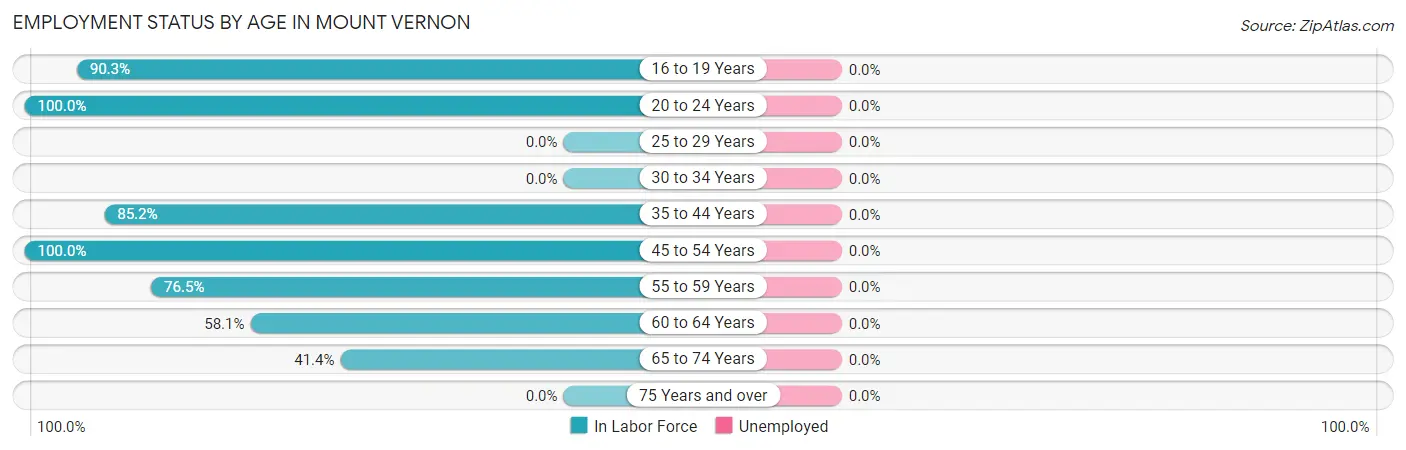
Employment Status by Age in Mount Vernon
| Age Bracket | In Labor Force | Unemployed |
| 16 to 19 Years | 28 (90.3%) | 0 (0.0%) |
| 20 to 24 Years | 47 (100.0%) | 0 (0.0%) |
| 25 to 29 Years | 0 (0.0%) | 0 (0.0%) |
| 30 to 34 Years | 0 (0.0%) | 0 (0.0%) |
| 35 to 44 Years | 75 (85.2%) | 0 (0.0%) |
| 45 to 54 Years | 44 (100.0%) | 0 (0.0%) |
| 55 to 59 Years | 251 (76.5%) | 0 (0.0%) |
| 60 to 64 Years | 36 (58.1%) | 0 (0.0%) |
| 65 to 74 Years | 29 (41.4%) | 0 (0.0%) |
| 75 Years and over | 0 (0.0%) | 0 (0.0%) |
| Total | 510 (71.0%) | 0 (0.0%) |
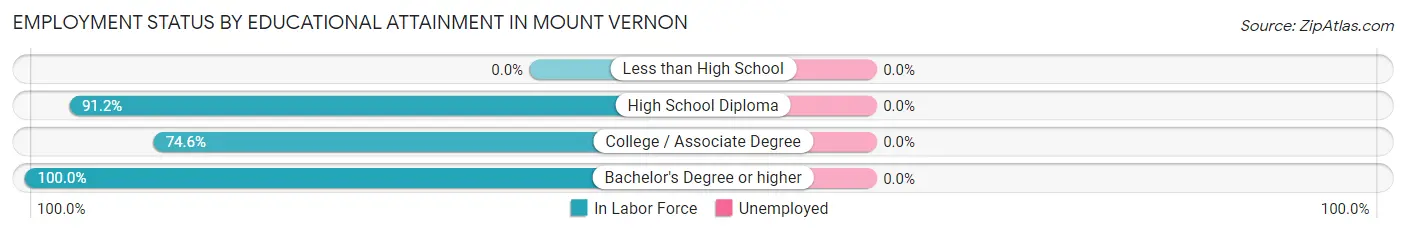
Employment Status by Educational Attainment in Mount Vernon
| Educational Attainment | In Labor Force | Unemployed |
| Less than High School | 0 (0.0%) | 0 (0.0%) |
| High School Diploma | 134 (91.2%) | 0 (0.0%) |
| College / Associate Degree | 253 (74.6%) | 0 (0.0%) |
| Bachelor's Degree or higher | 19 (100.0%) | 0 (0.0%) |
| Total | 406 (77.8%) | 0 (0.0%) |
Employment Occupations by Sex in Mount Vernon
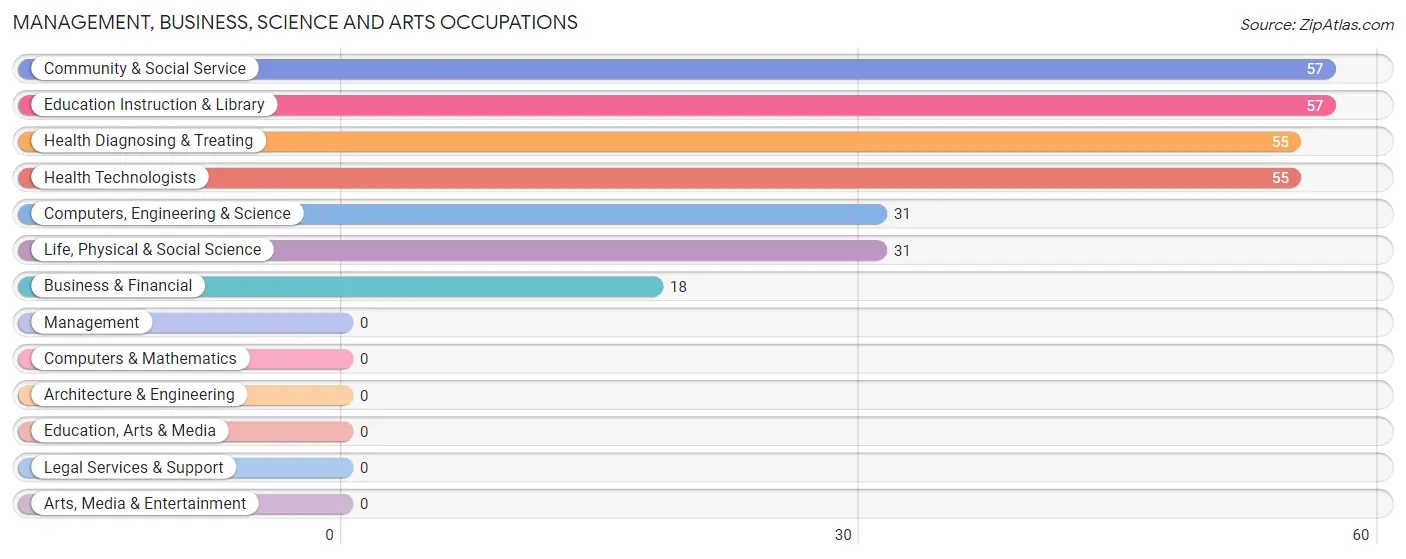
Management, Business, Science and Arts Occupations
The most common Management, Business, Science and Arts occupations in Mount Vernon are Community & Social Service (57 | 11.2%), Education Instruction & Library (57 | 11.2%), Health Diagnosing & Treating (55 | 10.8%), Health Technologists (55 | 10.8%), and Computers, Engineering & Science (31 | 6.1%).
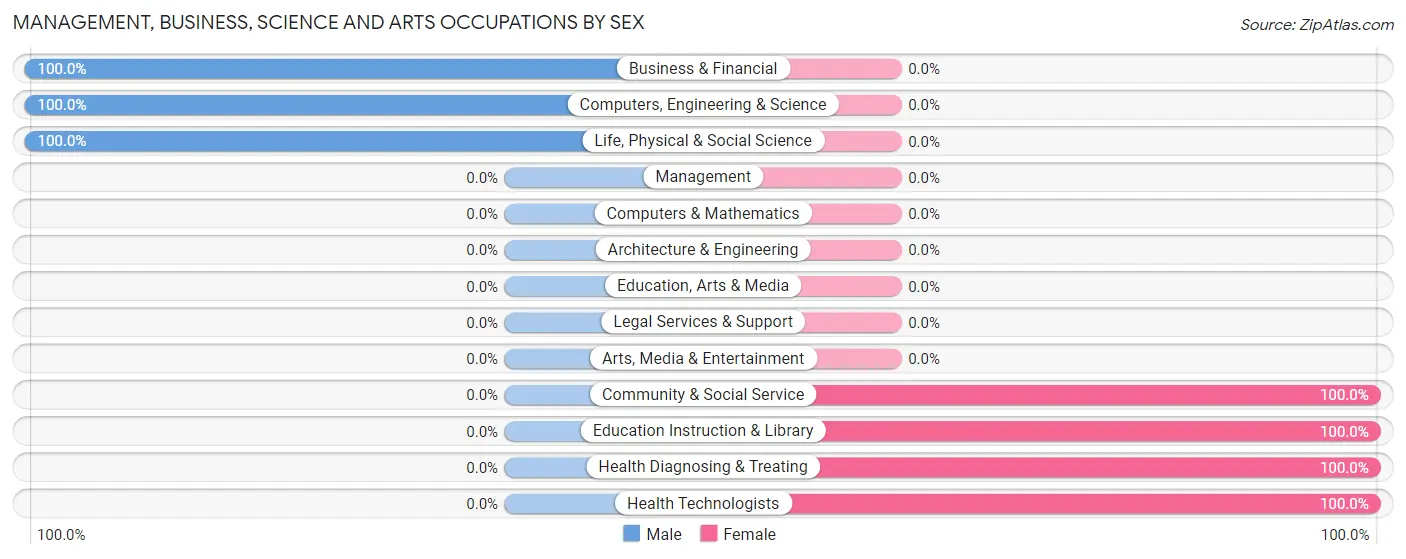
Management, Business, Science and Arts Occupations by Sex
Within the Management, Business, Science and Arts occupations in Mount Vernon, the most male-oriented occupations are Business & Financial (100.0%), Computers, Engineering & Science (100.0%), and Life, Physical & Social Science (100.0%), while the most female-oriented occupations are Community & Social Service (100.0%), Education Instruction & Library (100.0%), and Health Diagnosing & Treating (100.0%).
| Occupation | Male | Female |
| Management | 0 (0.0%) | 0 (0.0%) |
| Business & Financial | 18 (100.0%) | 0 (0.0%) |
| Computers, Engineering & Science | 31 (100.0%) | 0 (0.0%) |
| Computers & Mathematics | 0 (0.0%) | 0 (0.0%) |
| Architecture & Engineering | 0 (0.0%) | 0 (0.0%) |
| Life, Physical & Social Science | 31 (100.0%) | 0 (0.0%) |
| Community & Social Service | 0 (0.0%) | 57 (100.0%) |
| Education, Arts & Media | 0 (0.0%) | 0 (0.0%) |
| Legal Services & Support | 0 (0.0%) | 0 (0.0%) |
| Education Instruction & Library | 0 (0.0%) | 57 (100.0%) |
| Arts, Media & Entertainment | 0 (0.0%) | 0 (0.0%) |
| Health Diagnosing & Treating | 0 (0.0%) | 55 (100.0%) |
| Health Technologists | 0 (0.0%) | 55 (100.0%) |
| Total (Category) | 49 (30.4%) | 112 (69.6%) |
| Total (Overall) | 233 (45.7%) | 277 (54.3%) |
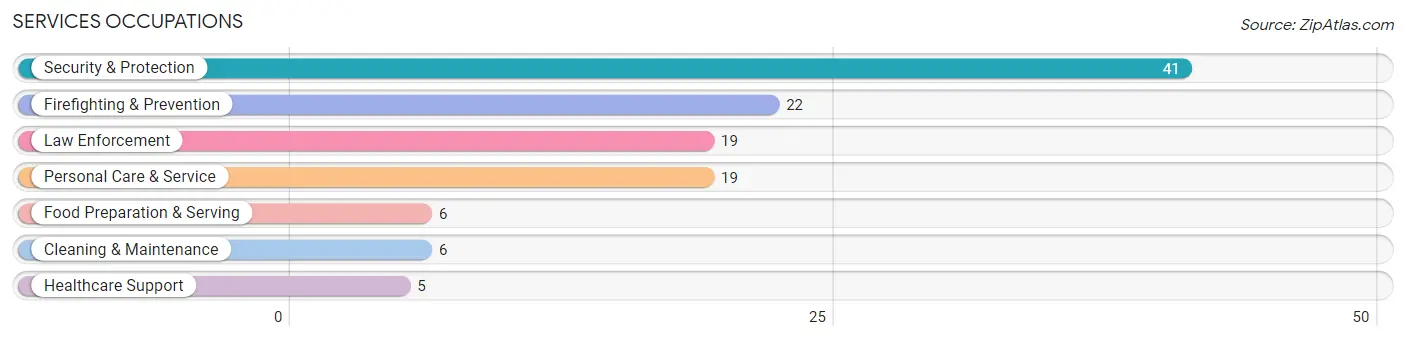
Services Occupations
The most common Services occupations in Mount Vernon are Security & Protection (41 | 8.0%), Firefighting & Prevention (22 | 4.3%), Law Enforcement (19 | 3.7%), Personal Care & Service (19 | 3.7%), and Food Preparation & Serving (6 | 1.2%).
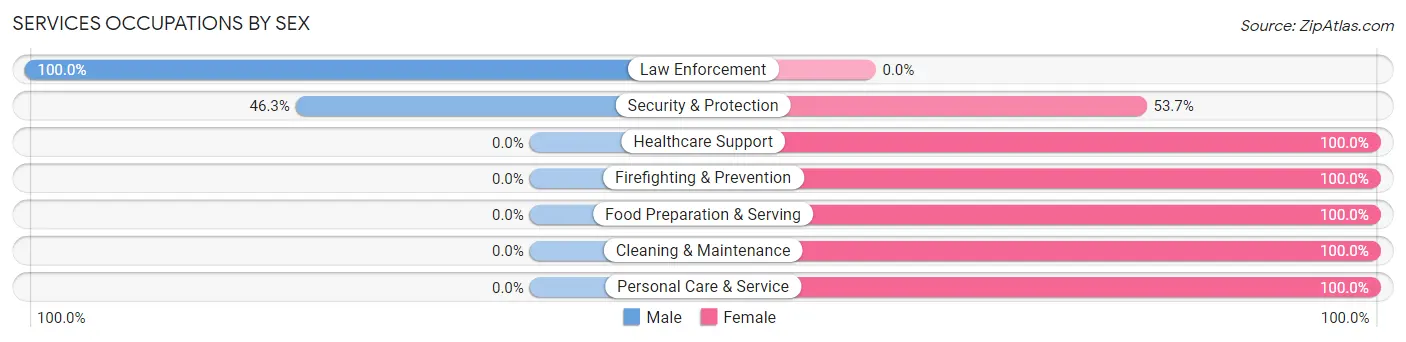
Services Occupations by Sex
Within the Services occupations in Mount Vernon, the most male-oriented occupations are Law Enforcement (100.0%), and Security & Protection (46.3%), while the most female-oriented occupations are Healthcare Support (100.0%), Firefighting & Prevention (100.0%), and Food Preparation & Serving (100.0%).
| Occupation | Male | Female |
| Healthcare Support | 0 (0.0%) | 5 (100.0%) |
| Security & Protection | 19 (46.3%) | 22 (53.7%) |
| Firefighting & Prevention | 0 (0.0%) | 22 (100.0%) |
| Law Enforcement | 19 (100.0%) | 0 (0.0%) |
| Food Preparation & Serving | 0 (0.0%) | 6 (100.0%) |
| Cleaning & Maintenance | 0 (0.0%) | 6 (100.0%) |
| Personal Care & Service | 0 (0.0%) | 19 (100.0%) |
| Total (Category) | 19 (24.7%) | 58 (75.3%) |
| Total (Overall) | 233 (45.7%) | 277 (54.3%) |
Sales and Office Occupations
The most common Sales and Office occupations in Mount Vernon are Sales & Related (112 | 22.0%), and Office & Administration (67 | 13.1%).
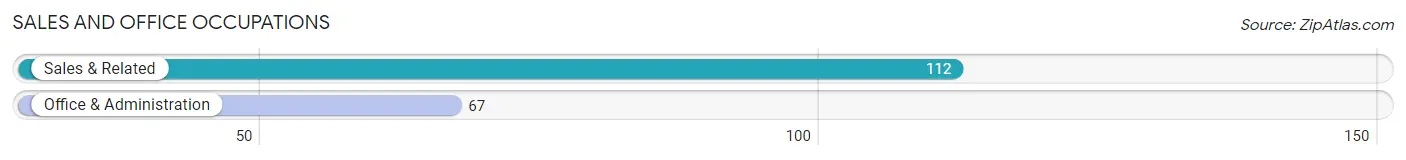
Sales and Office Occupations by Sex
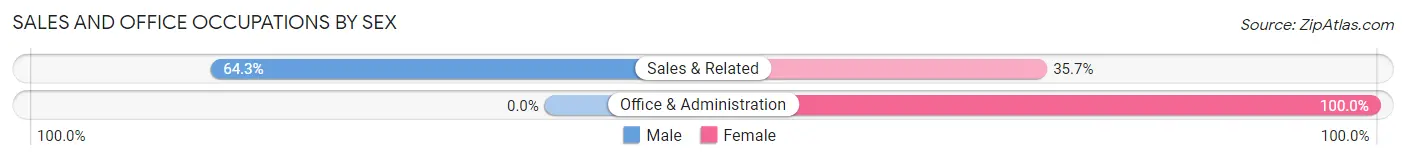
| Occupation | Male | Female |
| Sales & Related | 72 (64.3%) | 40 (35.7%) |
| Office & Administration | 0 (0.0%) | 67 (100.0%) |
| Total (Category) | 72 (40.2%) | 107 (59.8%) |
| Total (Overall) | 233 (45.7%) | 277 (54.3%) |
Natural Resources, Construction and Maintenance Occupations
The most common Natural Resources, Construction and Maintenance occupations in Mount Vernon are Farming, Fishing & Forestry (39 | 7.6%), and Construction & Extraction (29 | 5.7%).
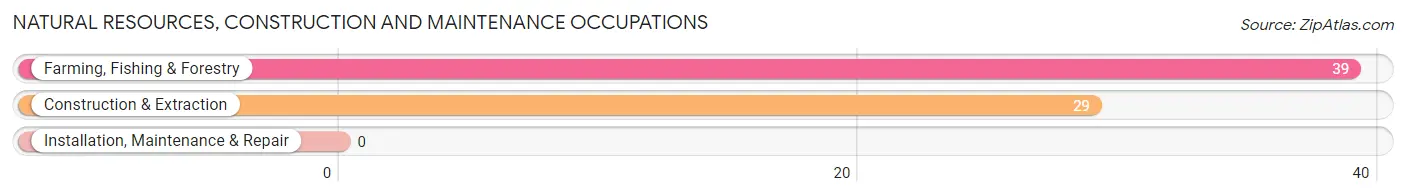
Natural Resources, Construction and Maintenance Occupations by Sex
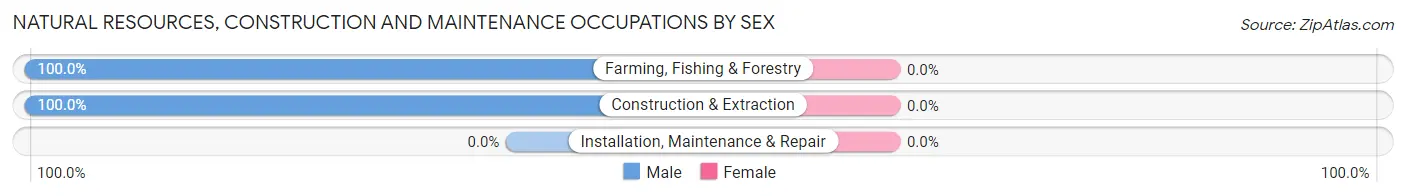
| Occupation | Male | Female |
| Farming, Fishing & Forestry | 39 (100.0%) | 0 (0.0%) |
| Construction & Extraction | 29 (100.0%) | 0 (0.0%) |
| Installation, Maintenance & Repair | 0 (0.0%) | 0 (0.0%) |
| Total (Category) | 68 (100.0%) | 0 (0.0%) |
| Total (Overall) | 233 (45.7%) | 277 (54.3%) |
Production, Transportation and Moving Occupations
The most common Production, Transportation and Moving occupations in Mount Vernon are , and Transportation (25 | 4.9%).
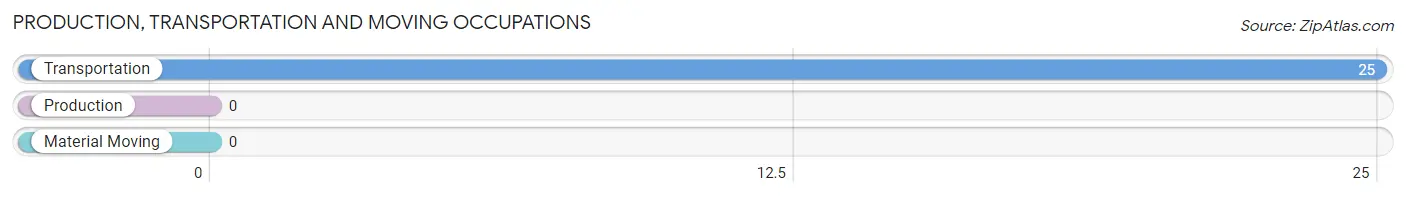
Production, Transportation and Moving Occupations by Sex
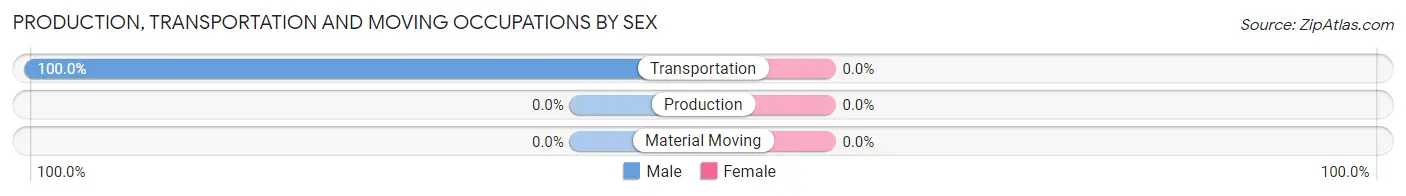
| Occupation | Male | Female |
| Production | 0 (0.0%) | 0 (0.0%) |
| Transportation | 25 (100.0%) | 0 (0.0%) |
| Material Moving | 0 (0.0%) | 0 (0.0%) |
| Total (Category) | 25 (100.0%) | 0 (0.0%) |
| Total (Overall) | 233 (45.7%) | 277 (54.3%) |
Employment Industries by Sex in Mount Vernon
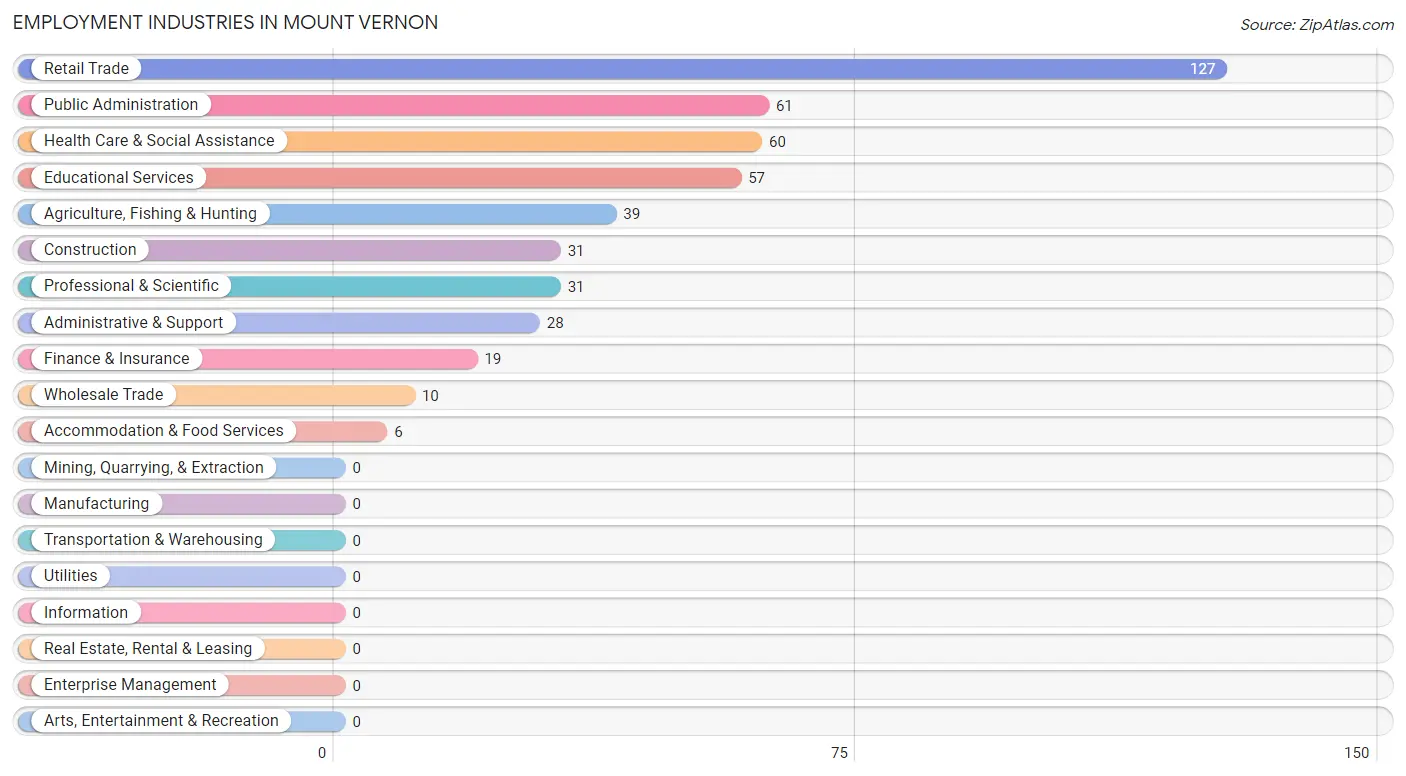
Employment Industries in Mount Vernon
The major employment industries in Mount Vernon include Retail Trade (127 | 24.9%), Public Administration (61 | 12.0%), Health Care & Social Assistance (60 | 11.8%), Educational Services (57 | 11.2%), and Agriculture, Fishing & Hunting (39 | 7.6%).
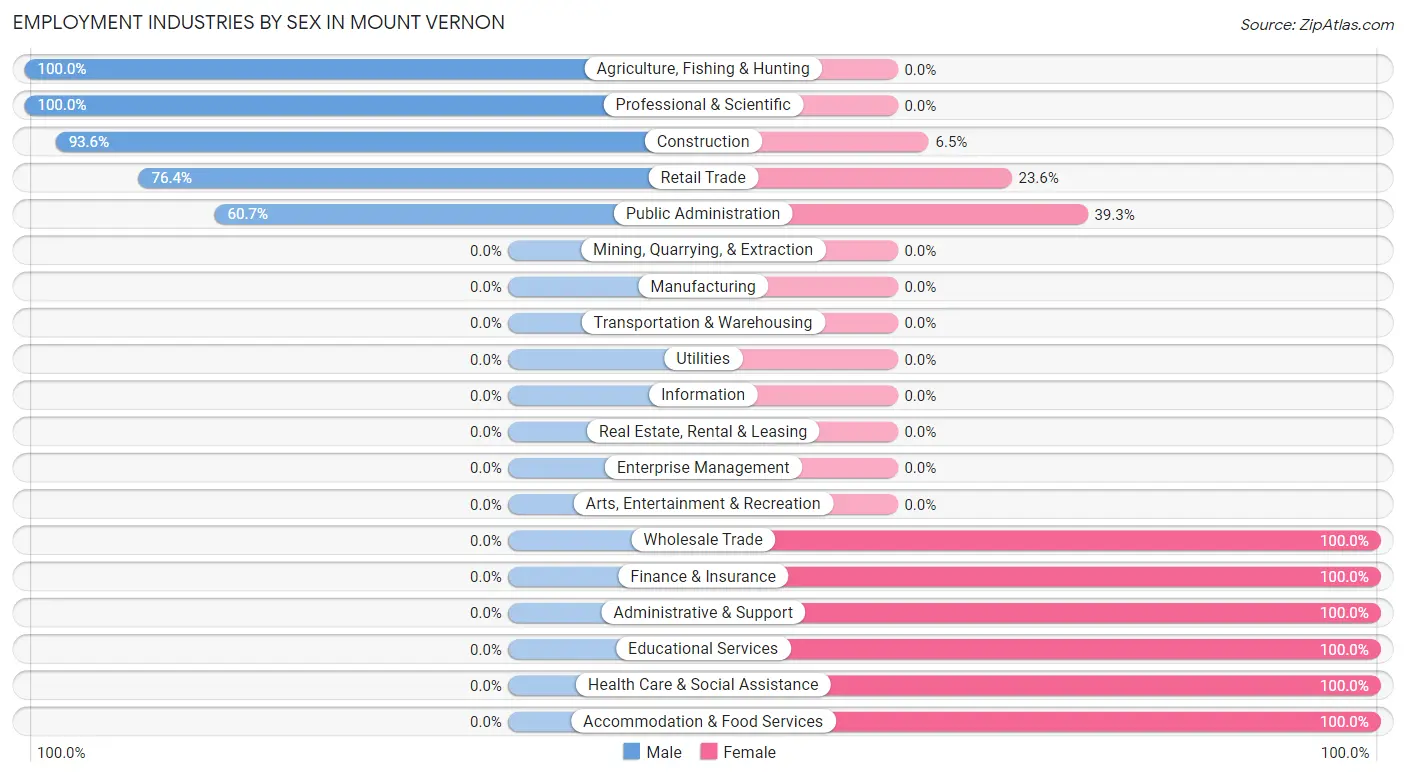
Employment Industries by Sex in Mount Vernon
The Mount Vernon industries that see more men than women are Agriculture, Fishing & Hunting (100.0%), Professional & Scientific (100.0%), and Construction (93.5%), whereas the industries that tend to have a higher number of women are Wholesale Trade (100.0%), Finance & Insurance (100.0%), and Administrative & Support (100.0%).
| Industry | Male | Female |
| Agriculture, Fishing & Hunting | 39 (100.0%) | 0 (0.0%) |
| Mining, Quarrying, & Extraction | 0 (0.0%) | 0 (0.0%) |
| Construction | 29 (93.5%) | 2 (6.5%) |
| Manufacturing | 0 (0.0%) | 0 (0.0%) |
| Wholesale Trade | 0 (0.0%) | 10 (100.0%) |
| Retail Trade | 97 (76.4%) | 30 (23.6%) |
| Transportation & Warehousing | 0 (0.0%) | 0 (0.0%) |
| Utilities | 0 (0.0%) | 0 (0.0%) |
| Information | 0 (0.0%) | 0 (0.0%) |
| Finance & Insurance | 0 (0.0%) | 19 (100.0%) |
| Real Estate, Rental & Leasing | 0 (0.0%) | 0 (0.0%) |
| Professional & Scientific | 31 (100.0%) | 0 (0.0%) |
| Enterprise Management | 0 (0.0%) | 0 (0.0%) |
| Administrative & Support | 0 (0.0%) | 28 (100.0%) |
| Educational Services | 0 (0.0%) | 57 (100.0%) |
| Health Care & Social Assistance | 0 (0.0%) | 60 (100.0%) |
| Arts, Entertainment & Recreation | 0 (0.0%) | 0 (0.0%) |
| Accommodation & Food Services | 0 (0.0%) | 6 (100.0%) |
| Public Administration | 37 (60.7%) | 24 (39.3%) |
| Total | 233 (45.7%) | 277 (54.3%) |
Education in Mount Vernon
School Enrollment in Mount Vernon
The most common levels of schooling among the 137 students in Mount Vernon are middle school (55 | 40.2%), high school (49 | 35.8%), and elementary school (33 | 24.1%).
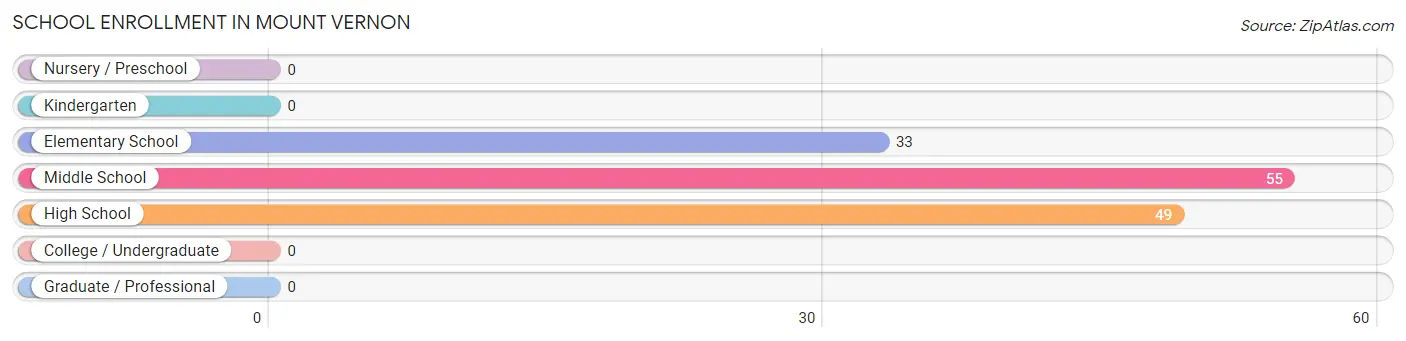
| School Level | # Students | % Students |
| Nursery / Preschool | 0 | 0.0% |
| Kindergarten | 0 | 0.0% |
| Elementary School | 33 | 24.1% |
| Middle School | 55 | 40.2% |
| High School | 49 | 35.8% |
| College / Undergraduate | 0 | 0.0% |
| Graduate / Professional | 0 | 0.0% |
| Total | 137 | 100.0% |
School Enrollment by Age by Funding Source in Mount Vernon
Out of a total of 137 students who are enrolled in schools in Mount Vernon, 3 (2.2%) attend a private institution, while the remaining 134 (97.8%) are enrolled in public schools. The age group of 15 to 17 year olds has the highest likelihood of being enrolled in private schools, with 3 (33.3% in the age bracket) enrolled. Conversely, the age group of 5 to 9 year old has the lowest likelihood of being enrolled in a private school, with 33 (100.0% in the age bracket) attending a public institution.
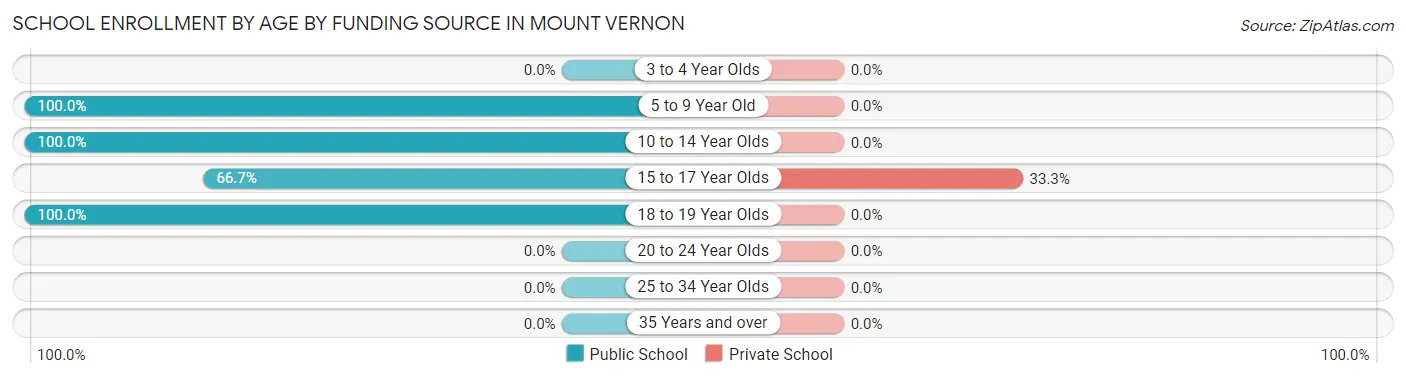
| Age Bracket | Public School | Private School |
| 3 to 4 Year Olds | 0 (0.0%) | 0 (0.0%) |
| 5 to 9 Year Old | 33 (100.0%) | 0 (0.0%) |
| 10 to 14 Year Olds | 73 (100.0%) | 0 (0.0%) |
| 15 to 17 Year Olds | 6 (66.7%) | 3 (33.3%) |
| 18 to 19 Year Olds | 22 (100.0%) | 0 (0.0%) |
| 20 to 24 Year Olds | 0 (0.0%) | 0 (0.0%) |
| 25 to 34 Year Olds | 0 (0.0%) | 0 (0.0%) |
| 35 Years and over | 0 (0.0%) | 0 (0.0%) |
| Total | 134 (97.8%) | 3 (2.2%) |
Educational Attainment by Field of Study in Mount Vernon
Bio, nature & agricultural (16 | 39.0%), business (10 | 24.4%), education (6 | 14.6%), communications (6 | 14.6%), and science & technology (3 | 7.3%) are the most common fields of study among 41 individuals in Mount Vernon who have obtained a bachelor's degree or higher.
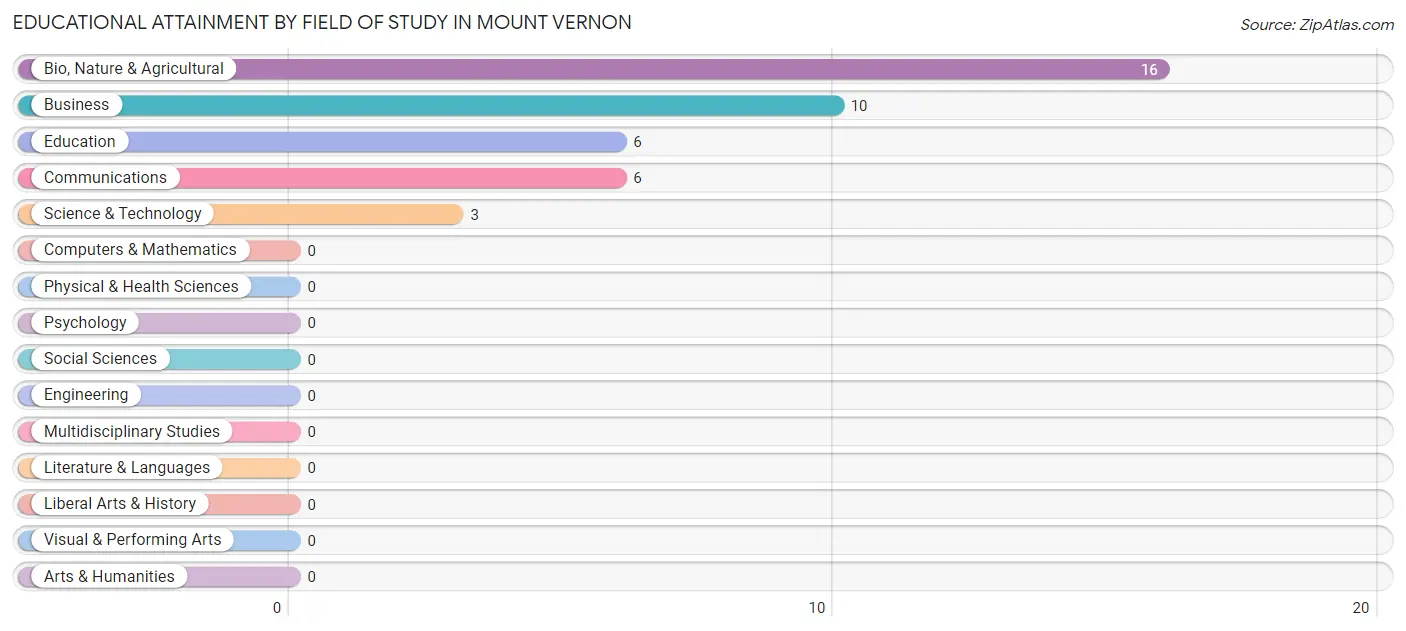
| Field of Study | # Graduates | % Graduates |
| Computers & Mathematics | 0 | 0.0% |
| Bio, Nature & Agricultural | 16 | 39.0% |
| Physical & Health Sciences | 0 | 0.0% |
| Psychology | 0 | 0.0% |
| Social Sciences | 0 | 0.0% |
| Engineering | 0 | 0.0% |
| Multidisciplinary Studies | 0 | 0.0% |
| Science & Technology | 3 | 7.3% |
| Business | 10 | 24.4% |
| Education | 6 | 14.6% |
| Literature & Languages | 0 | 0.0% |
| Liberal Arts & History | 0 | 0.0% |
| Visual & Performing Arts | 0 | 0.0% |
| Communications | 6 | 14.6% |
| Arts & Humanities | 0 | 0.0% |
| Total | 41 | 100.0% |
Transportation & Commute in Mount Vernon
Vehicle Availability by Sex in Mount Vernon
The most prevalent vehicle ownership categories in Mount Vernon are males with 3 vehicles (119, accounting for 51.1%) and females with 3 vehicles (114, making up 43.0%).
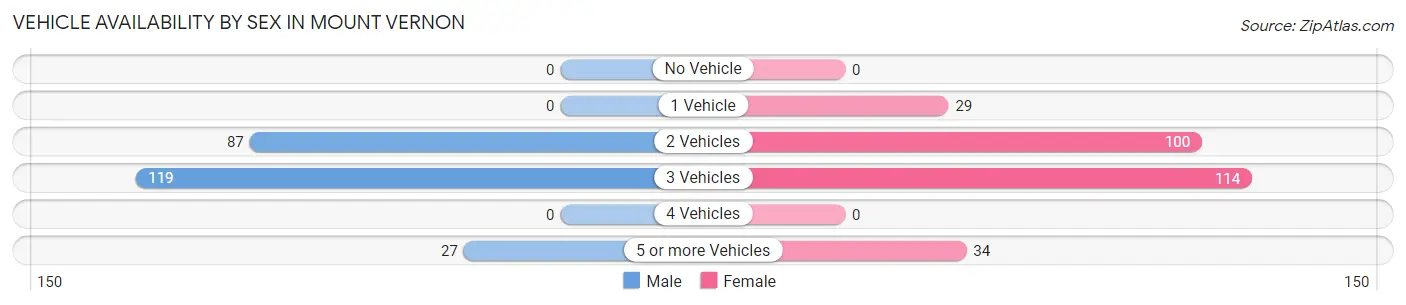
| Vehicles Available | Male | Female |
| No Vehicle | 0 (0.0%) | 0 (0.0%) |
| 1 Vehicle | 0 (0.0%) | 29 (10.5%) |
| 2 Vehicles | 87 (37.3%) | 100 (36.1%) |
| 3 Vehicles | 119 (51.1%) | 114 (41.2%) |
| 4 Vehicles | 0 (0.0%) | 0 (0.0%) |
| 5 or more Vehicles | 27 (11.6%) | 34 (12.3%) |
| Total | 233 (100.0%) | 277 (100.0%) |
Commute Time in Mount Vernon
The most frequently occuring commute durations in Mount Vernon are 30 to 34 minutes (134 commuters, 27.8%), 40 to 44 minutes (115 commuters, 23.9%), and 20 to 24 minutes (80 commuters, 16.6%).
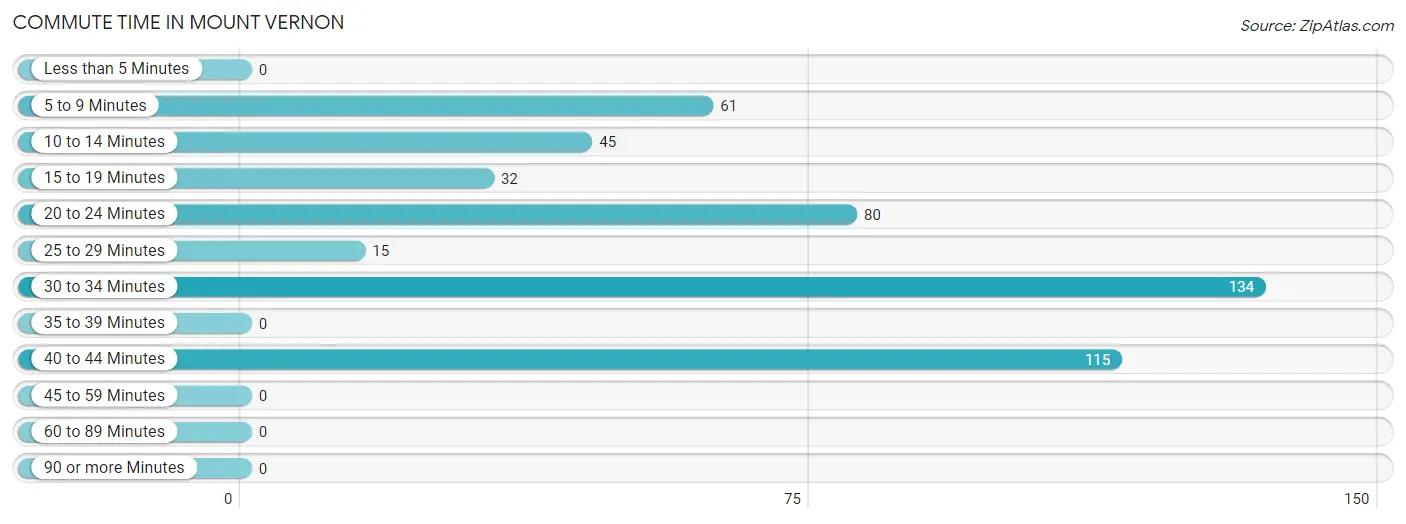
| Commute Time | # Commuters | % Commuters |
| Less than 5 Minutes | 0 | 0.0% |
| 5 to 9 Minutes | 61 | 12.7% |
| 10 to 14 Minutes | 45 | 9.3% |
| 15 to 19 Minutes | 32 | 6.6% |
| 20 to 24 Minutes | 80 | 16.6% |
| 25 to 29 Minutes | 15 | 3.1% |
| 30 to 34 Minutes | 134 | 27.8% |
| 35 to 39 Minutes | 0 | 0.0% |
| 40 to 44 Minutes | 115 | 23.9% |
| 45 to 59 Minutes | 0 | 0.0% |
| 60 to 89 Minutes | 0 | 0.0% |
| 90 or more Minutes | 0 | 0.0% |
Commute Time by Sex in Mount Vernon
The most common commute times in Mount Vernon are 40 to 44 minutes (63 commuters, 29.3%) for males and 30 to 34 minutes (78 commuters, 29.2%) for females.
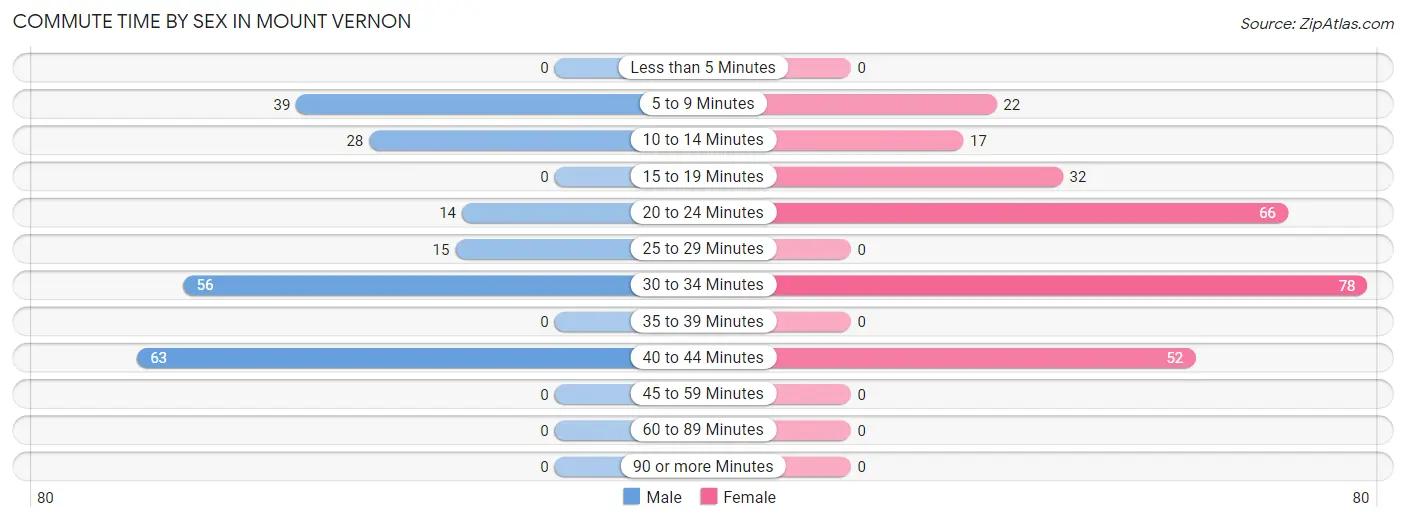
| Commute Time | Male | Female |
| Less than 5 Minutes | 0 (0.0%) | 0 (0.0%) |
| 5 to 9 Minutes | 39 (18.1%) | 22 (8.2%) |
| 10 to 14 Minutes | 28 (13.0%) | 17 (6.4%) |
| 15 to 19 Minutes | 0 (0.0%) | 32 (12.0%) |
| 20 to 24 Minutes | 14 (6.5%) | 66 (24.7%) |
| 25 to 29 Minutes | 15 (7.0%) | 0 (0.0%) |
| 30 to 34 Minutes | 56 (26.1%) | 78 (29.2%) |
| 35 to 39 Minutes | 0 (0.0%) | 0 (0.0%) |
| 40 to 44 Minutes | 63 (29.3%) | 52 (19.5%) |
| 45 to 59 Minutes | 0 (0.0%) | 0 (0.0%) |
| 60 to 89 Minutes | 0 (0.0%) | 0 (0.0%) |
| 90 or more Minutes | 0 (0.0%) | 0 (0.0%) |
Time of Departure to Work by Sex in Mount Vernon
The most frequent times of departure to work in Mount Vernon are 7:00 AM to 7:29 AM (88, 40.9%) for males and 7:00 AM to 7:29 AM (71, 26.6%) for females.
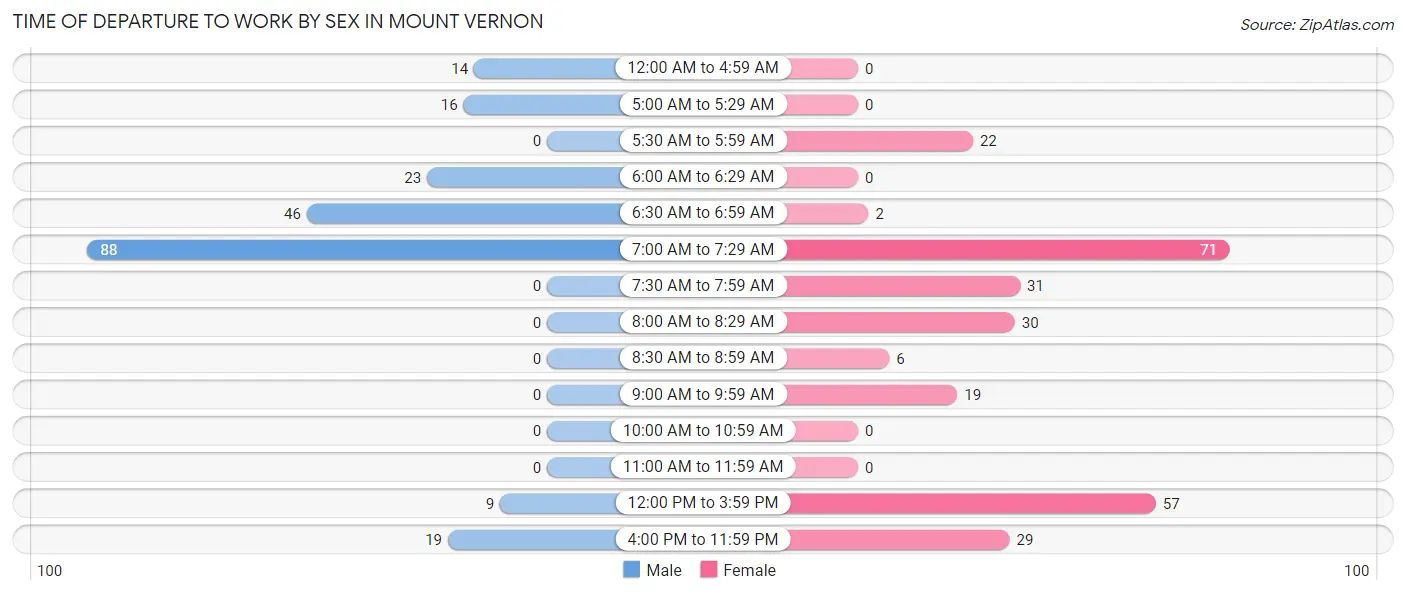
| Time of Departure | Male | Female |
| 12:00 AM to 4:59 AM | 14 (6.5%) | 0 (0.0%) |
| 5:00 AM to 5:29 AM | 16 (7.4%) | 0 (0.0%) |
| 5:30 AM to 5:59 AM | 0 (0.0%) | 22 (8.2%) |
| 6:00 AM to 6:29 AM | 23 (10.7%) | 0 (0.0%) |
| 6:30 AM to 6:59 AM | 46 (21.4%) | 2 (0.7%) |
| 7:00 AM to 7:29 AM | 88 (40.9%) | 71 (26.6%) |
| 7:30 AM to 7:59 AM | 0 (0.0%) | 31 (11.6%) |
| 8:00 AM to 8:29 AM | 0 (0.0%) | 30 (11.2%) |
| 8:30 AM to 8:59 AM | 0 (0.0%) | 6 (2.2%) |
| 9:00 AM to 9:59 AM | 0 (0.0%) | 19 (7.1%) |
| 10:00 AM to 10:59 AM | 0 (0.0%) | 0 (0.0%) |
| 11:00 AM to 11:59 AM | 0 (0.0%) | 0 (0.0%) |
| 12:00 PM to 3:59 PM | 9 (4.2%) | 57 (21.3%) |
| 4:00 PM to 11:59 PM | 19 (8.8%) | 29 (10.9%) |
| Total | 215 (100.0%) | 267 (100.0%) |
Housing Occupancy in Mount Vernon
Occupancy by Ownership in Mount Vernon
Of the total 339 dwellings in Mount Vernon, owner-occupied units account for 315 (92.9%), while renter-occupied units make up 24 (7.1%).
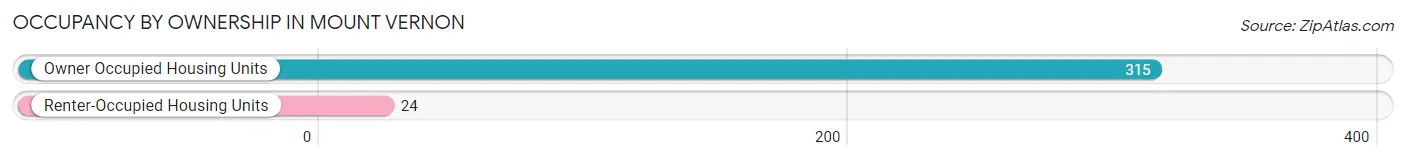
| Occupancy | # Housing Units | % Housing Units |
| Owner Occupied Housing Units | 315 | 92.9% |
| Renter-Occupied Housing Units | 24 | 7.1% |
| Total Occupied Housing Units | 339 | 100.0% |
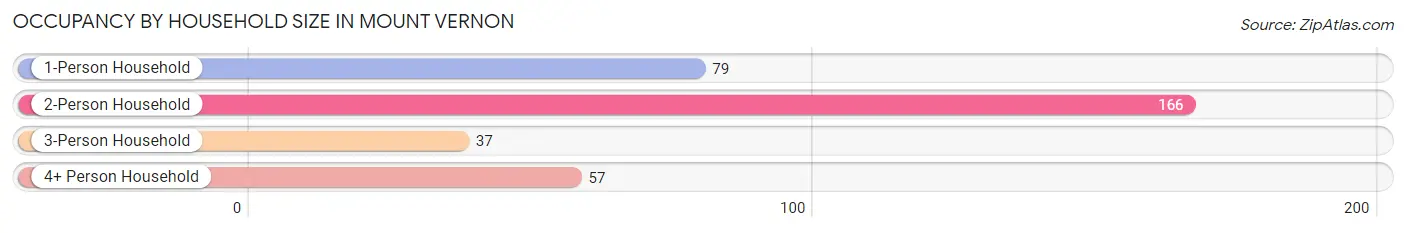
Occupancy by Household Size in Mount Vernon
| Household Size | # Housing Units | % Housing Units |
| 1-Person Household | 79 | 23.3% |
| 2-Person Household | 166 | 49.0% |
| 3-Person Household | 37 | 10.9% |
| 4+ Person Household | 57 | 16.8% |
| Total Housing Units | 339 | 100.0% |
Occupancy by Ownership by Household Size in Mount Vernon
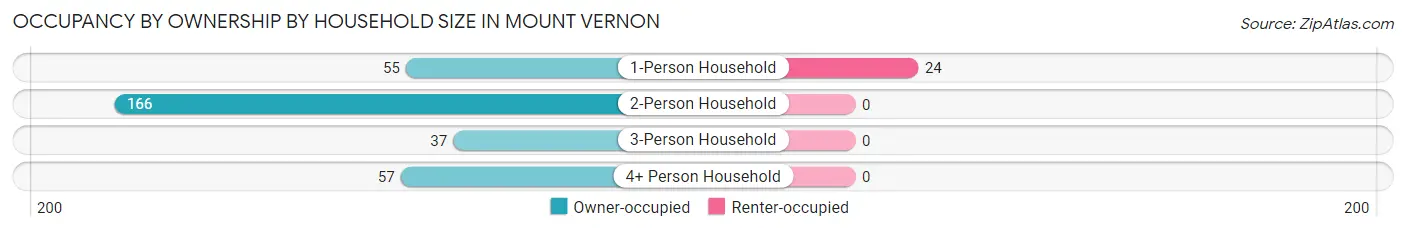
| Household Size | Owner-occupied | Renter-occupied |
| 1-Person Household | 55 (69.6%) | 24 (30.4%) |
| 2-Person Household | 166 (100.0%) | 0 (0.0%) |
| 3-Person Household | 37 (100.0%) | 0 (0.0%) |
| 4+ Person Household | 57 (100.0%) | 0 (0.0%) |
| Total Housing Units | 315 (92.9%) | 24 (7.1%) |
Occupancy by Educational Attainment in Mount Vernon
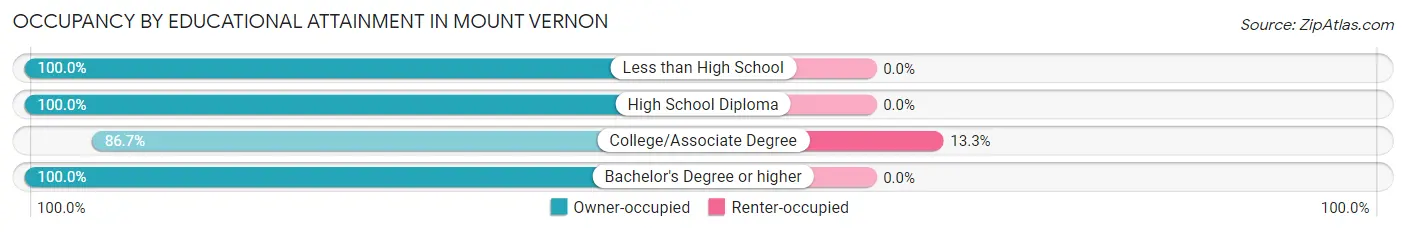
| Household Size | Owner-occupied | Renter-occupied |
| Less than High School | 27 (100.0%) | 0 (0.0%) |
| High School Diploma | 100 (100.0%) | 0 (0.0%) |
| College/Associate Degree | 156 (86.7%) | 24 (13.3%) |
| Bachelor's Degree or higher | 32 (100.0%) | 0 (0.0%) |
Occupancy by Age of Householder in Mount Vernon
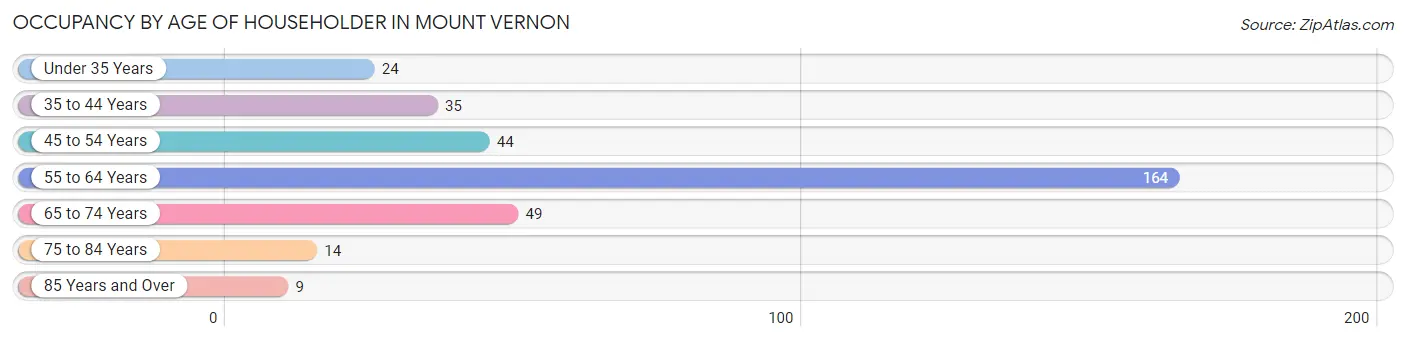
| Age Bracket | # Households | % Households |
| Under 35 Years | 24 | 7.1% |
| 35 to 44 Years | 35 | 10.3% |
| 45 to 54 Years | 44 | 13.0% |
| 55 to 64 Years | 164 | 48.4% |
| 65 to 74 Years | 49 | 14.4% |
| 75 to 84 Years | 14 | 4.1% |
| 85 Years and Over | 9 | 2.6% |
| Total | 339 | 100.0% |
Housing Finances in Mount Vernon
Median Income by Occupancy in Mount Vernon
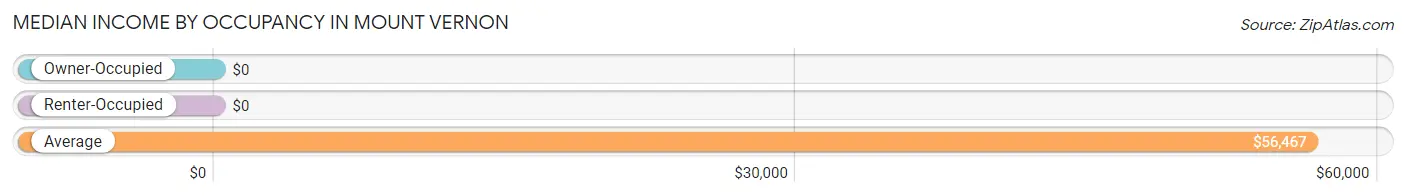
| Occupancy Type | # Households | Median Income |
| Owner-Occupied | 315 (92.9%) | $0 |
| Renter-Occupied | 24 (7.1%) | $0 |
| Average | 339 (100.0%) | $56,467 |
Occupancy by Householder Income Bracket in Mount Vernon
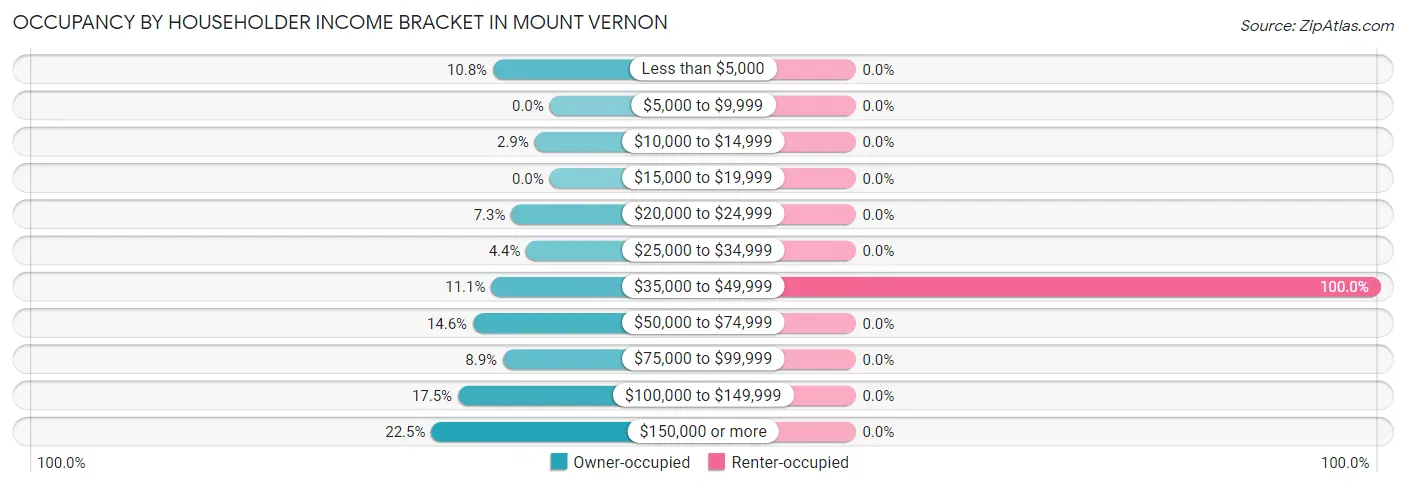
| Income Bracket | Owner-occupied | Renter-occupied |
| Less than $5,000 | 34 (10.8%) | 0 (0.0%) |
| $5,000 to $9,999 | 0 (0.0%) | 0 (0.0%) |
| $10,000 to $14,999 | 9 (2.9%) | 0 (0.0%) |
| $15,000 to $19,999 | 0 (0.0%) | 0 (0.0%) |
| $20,000 to $24,999 | 23 (7.3%) | 0 (0.0%) |
| $25,000 to $34,999 | 14 (4.4%) | 0 (0.0%) |
| $35,000 to $49,999 | 35 (11.1%) | 24 (100.0%) |
| $50,000 to $74,999 | 46 (14.6%) | 0 (0.0%) |
| $75,000 to $99,999 | 28 (8.9%) | 0 (0.0%) |
| $100,000 to $149,999 | 55 (17.5%) | 0 (0.0%) |
| $150,000 or more | 71 (22.5%) | 0 (0.0%) |
| Total | 315 (100.0%) | 24 (100.0%) |
Monthly Housing Cost Tiers in Mount Vernon
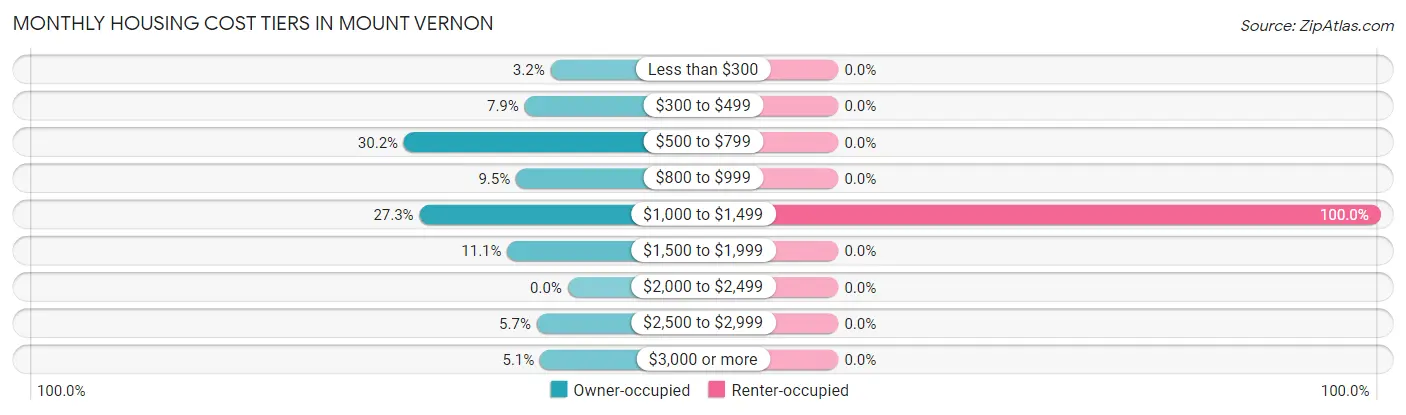
| Monthly Cost | Owner-occupied | Renter-occupied |
| Less than $300 | 10 (3.2%) | 0 (0.0%) |
| $300 to $499 | 25 (7.9%) | 0 (0.0%) |
| $500 to $799 | 95 (30.2%) | 0 (0.0%) |
| $800 to $999 | 30 (9.5%) | 0 (0.0%) |
| $1,000 to $1,499 | 86 (27.3%) | 24 (100.0%) |
| $1,500 to $1,999 | 35 (11.1%) | 0 (0.0%) |
| $2,000 to $2,499 | 0 (0.0%) | 0 (0.0%) |
| $2,500 to $2,999 | 18 (5.7%) | 0 (0.0%) |
| $3,000 or more | 16 (5.1%) | 0 (0.0%) |
| Total | 315 (100.0%) | 24 (100.0%) |
Physical Housing Characteristics in Mount Vernon
Housing Structures in Mount Vernon
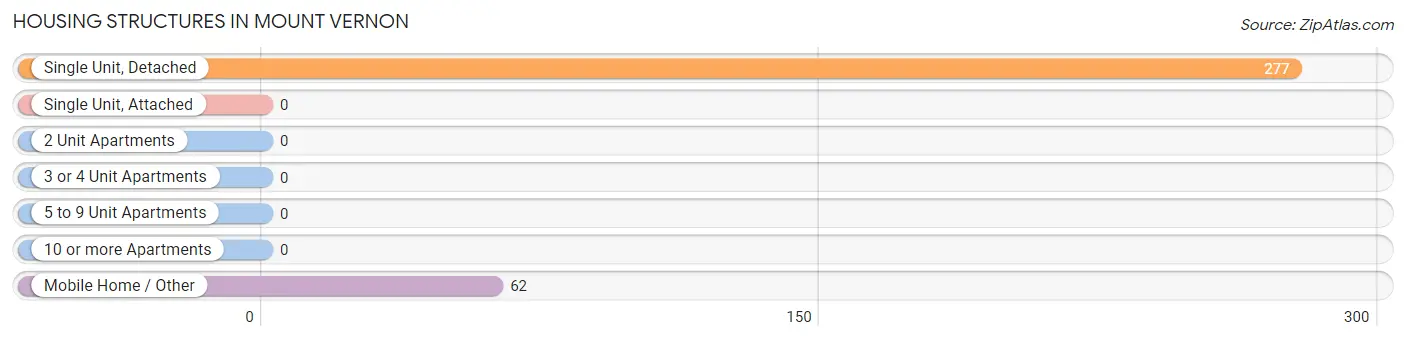
| Structure Type | # Housing Units | % Housing Units |
| Single Unit, Detached | 277 | 81.7% |
| Single Unit, Attached | 0 | 0.0% |
| 2 Unit Apartments | 0 | 0.0% |
| 3 or 4 Unit Apartments | 0 | 0.0% |
| 5 to 9 Unit Apartments | 0 | 0.0% |
| 10 or more Apartments | 0 | 0.0% |
| Mobile Home / Other | 62 | 18.3% |
| Total | 339 | 100.0% |
Housing Structures by Occupancy in Mount Vernon
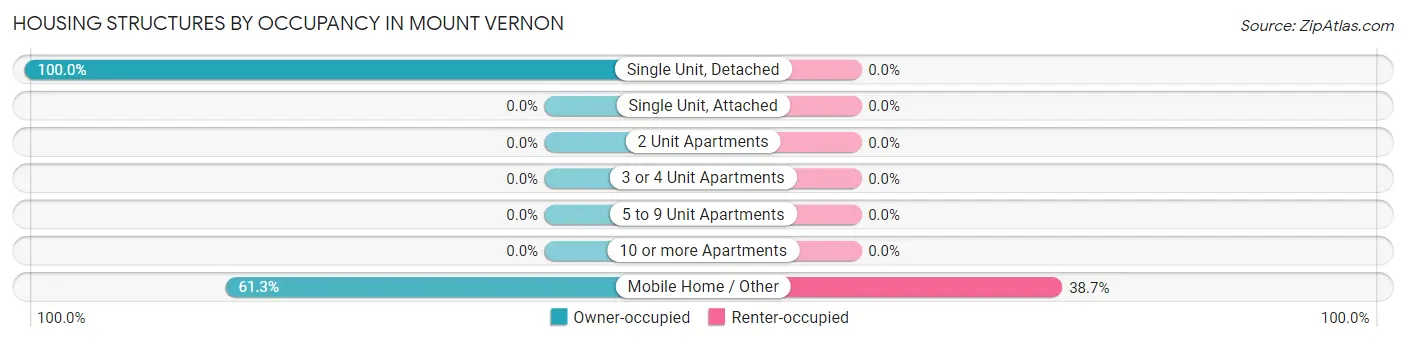
| Structure Type | Owner-occupied | Renter-occupied |
| Single Unit, Detached | 277 (100.0%) | 0 (0.0%) |
| Single Unit, Attached | 0 (0.0%) | 0 (0.0%) |
| 2 Unit Apartments | 0 (0.0%) | 0 (0.0%) |
| 3 or 4 Unit Apartments | 0 (0.0%) | 0 (0.0%) |
| 5 to 9 Unit Apartments | 0 (0.0%) | 0 (0.0%) |
| 10 or more Apartments | 0 (0.0%) | 0 (0.0%) |
| Mobile Home / Other | 38 (61.3%) | 24 (38.7%) |
| Total | 315 (92.9%) | 24 (7.1%) |
Housing Structures by Number of Rooms in Mount Vernon
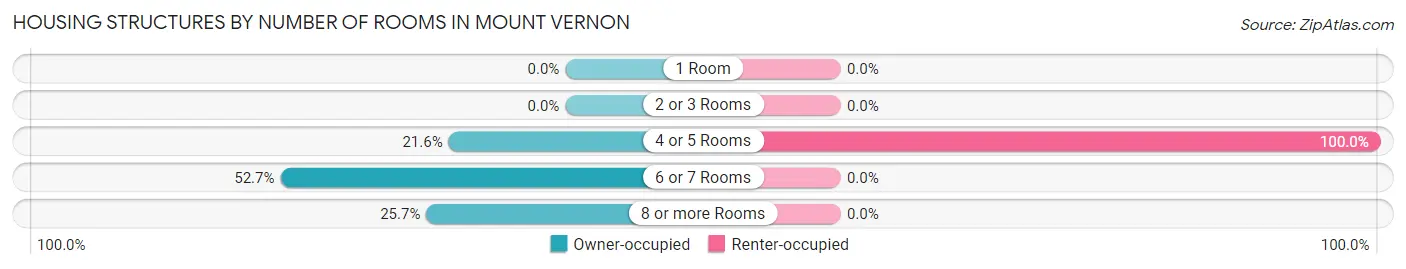
| Number of Rooms | Owner-occupied | Renter-occupied |
| 1 Room | 0 (0.0%) | 0 (0.0%) |
| 2 or 3 Rooms | 0 (0.0%) | 0 (0.0%) |
| 4 or 5 Rooms | 68 (21.6%) | 24 (100.0%) |
| 6 or 7 Rooms | 166 (52.7%) | 0 (0.0%) |
| 8 or more Rooms | 81 (25.7%) | 0 (0.0%) |
| Total | 315 (100.0%) | 24 (100.0%) |
Housing Structure by Heating Type in Mount Vernon
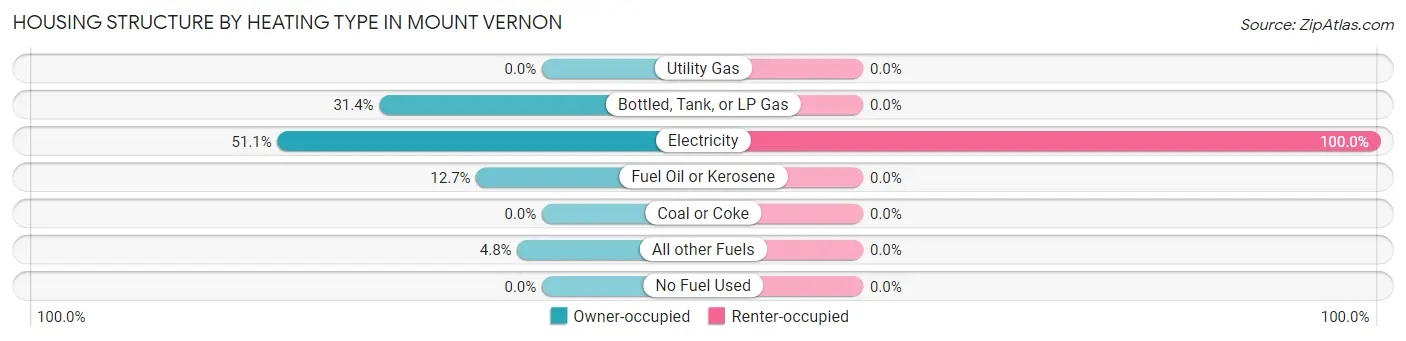
| Heating Type | Owner-occupied | Renter-occupied |
| Utility Gas | 0 (0.0%) | 0 (0.0%) |
| Bottled, Tank, or LP Gas | 99 (31.4%) | 0 (0.0%) |
| Electricity | 161 (51.1%) | 24 (100.0%) |
| Fuel Oil or Kerosene | 40 (12.7%) | 0 (0.0%) |
| Coal or Coke | 0 (0.0%) | 0 (0.0%) |
| All other Fuels | 15 (4.8%) | 0 (0.0%) |
| No Fuel Used | 0 (0.0%) | 0 (0.0%) |
| Total | 315 (100.0%) | 24 (100.0%) |
Household Vehicle Usage in Mount Vernon
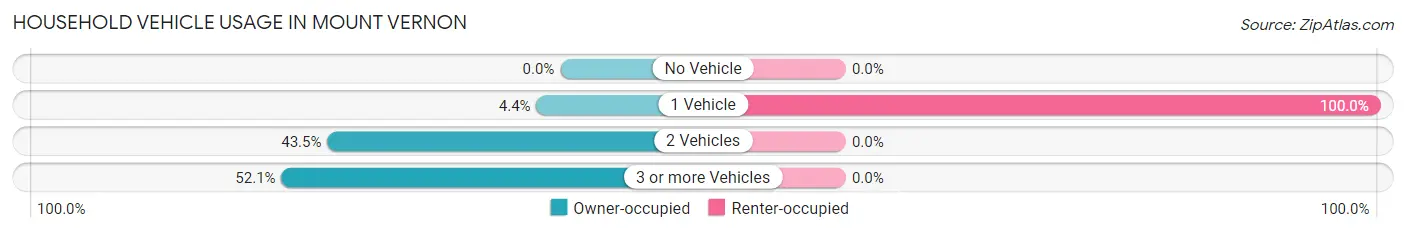
| Vehicles per Household | Owner-occupied | Renter-occupied |
| No Vehicle | 0 (0.0%) | 0 (0.0%) |
| 1 Vehicle | 14 (4.4%) | 24 (100.0%) |
| 2 Vehicles | 137 (43.5%) | 0 (0.0%) |
| 3 or more Vehicles | 164 (52.1%) | 0 (0.0%) |
| Total | 315 (100.0%) | 24 (100.0%) |
Real Estate & Mortgages in Mount Vernon
Real Estate and Mortgage Overview in Mount Vernon
| Characteristic | Without Mortgage | With Mortgage |
| Housing Units | 111 | 204 |
| Median Property Value | $134,200 | $226,000 |
| Median Household Income | - | - |
| Monthly Housing Costs | $560 | $16 |
| Real Estate Taxes | $956 | $0 |
Property Value by Mortgage Status in Mount Vernon
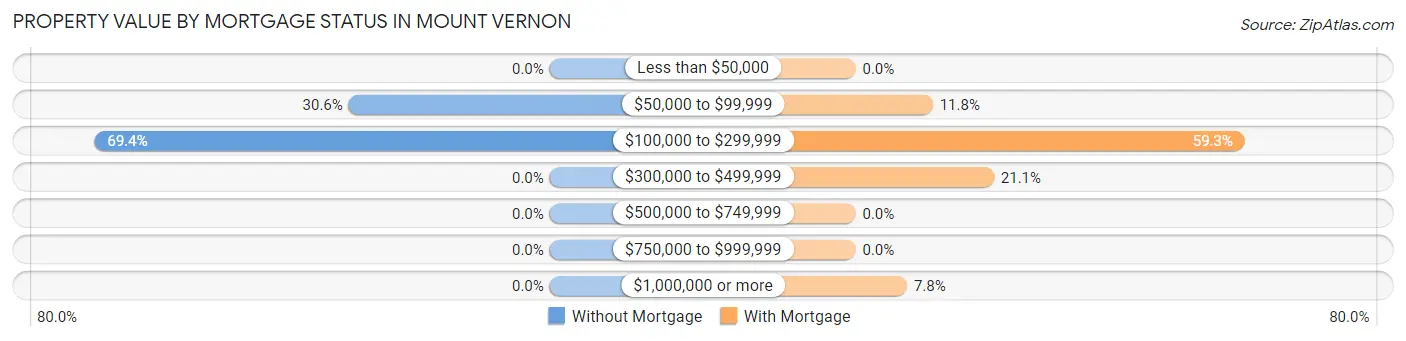
| Property Value | Without Mortgage | With Mortgage |
| Less than $50,000 | 0 (0.0%) | 0 (0.0%) |
| $50,000 to $99,999 | 34 (30.6%) | 24 (11.8%) |
| $100,000 to $299,999 | 77 (69.4%) | 121 (59.3%) |
| $300,000 to $499,999 | 0 (0.0%) | 43 (21.1%) |
| $500,000 to $749,999 | 0 (0.0%) | 0 (0.0%) |
| $750,000 to $999,999 | 0 (0.0%) | 0 (0.0%) |
| $1,000,000 or more | 0 (0.0%) | 16 (7.8%) |
| Total | 111 (100.0%) | 204 (100.0%) |
Household Income by Mortgage Status in Mount Vernon
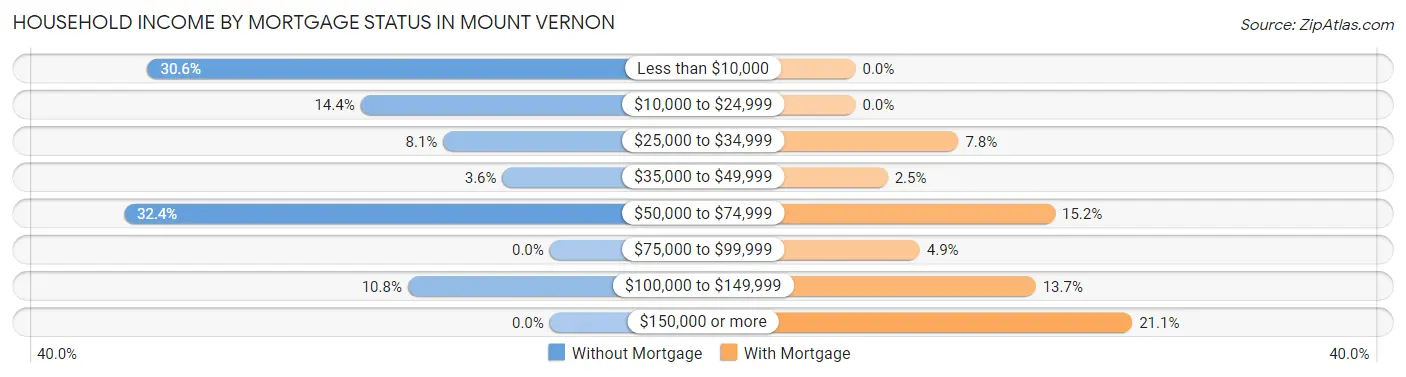
| Household Income | Without Mortgage | With Mortgage |
| Less than $10,000 | 34 (30.6%) | 0 (0.0%) |
| $10,000 to $24,999 | 16 (14.4%) | 0 (0.0%) |
| $25,000 to $34,999 | 9 (8.1%) | 16 (7.8%) |
| $35,000 to $49,999 | 4 (3.6%) | 5 (2.5%) |
| $50,000 to $74,999 | 36 (32.4%) | 31 (15.2%) |
| $75,000 to $99,999 | 0 (0.0%) | 10 (4.9%) |
| $100,000 to $149,999 | 12 (10.8%) | 28 (13.7%) |
| $150,000 or more | 0 (0.0%) | 43 (21.1%) |
| Total | 111 (100.0%) | 204 (100.0%) |
Property Value to Household Income Ratio in Mount Vernon
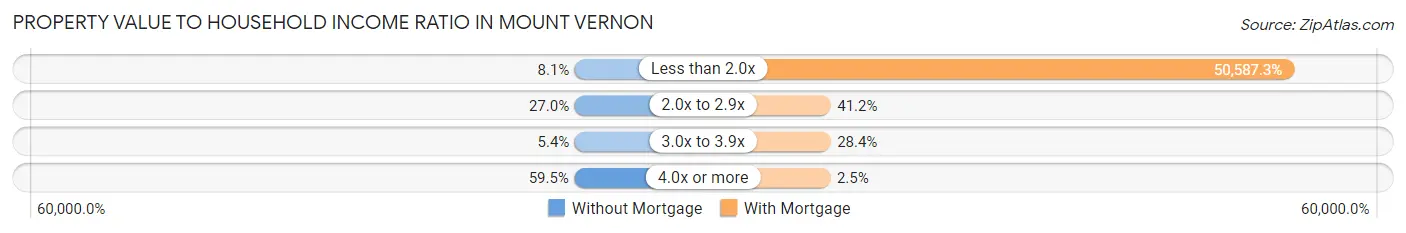
| Value-to-Income Ratio | Without Mortgage | With Mortgage |
| Less than 2.0x | 9 (8.1%) | 103,198 (50,587.3%) |
| 2.0x to 2.9x | 30 (27.0%) | 84 (41.2%) |
| 3.0x to 3.9x | 6 (5.4%) | 58 (28.4%) |
| 4.0x or more | 66 (59.5%) | 5 (2.5%) |
| Total | 111 (100.0%) | 204 (100.0%) |
Real Estate Taxes by Mortgage Status in Mount Vernon
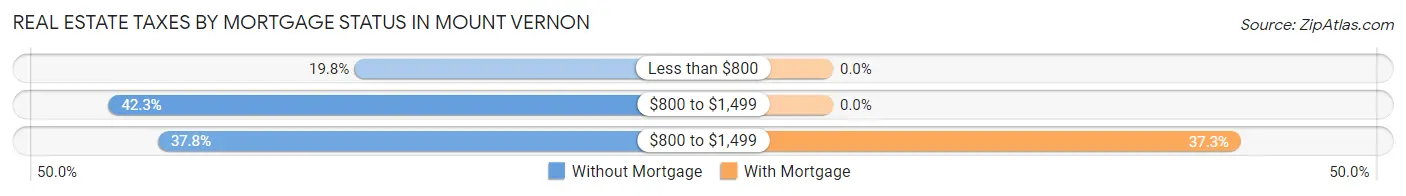
| Property Taxes | Without Mortgage | With Mortgage |
| Less than $800 | 22 (19.8%) | 0 (0.0%) |
| $800 to $1,499 | 47 (42.3%) | 0 (0.0%) |
| $800 to $1,499 | 42 (37.8%) | 76 (37.2%) |
| Total | 111 (100.0%) | 204 (100.0%) |
Health & Disability in Mount Vernon
Health Insurance Coverage by Age in Mount Vernon
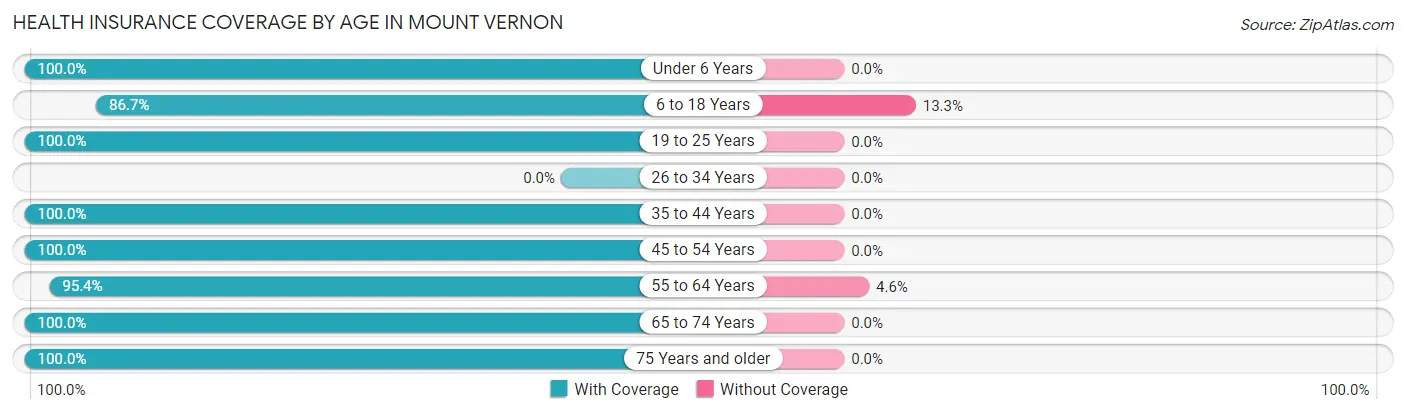
| Age Bracket | With Coverage | Without Coverage |
| Under 6 Years | 17 (100.0%) | 0 (0.0%) |
| 6 to 18 Years | 104 (86.7%) | 16 (13.3%) |
| 19 to 25 Years | 47 (100.0%) | 0 (0.0%) |
| 26 to 34 Years | 0 (0.0%) | 0 (0.0%) |
| 35 to 44 Years | 88 (100.0%) | 0 (0.0%) |
| 45 to 54 Years | 44 (100.0%) | 0 (0.0%) |
| 55 to 64 Years | 372 (95.4%) | 18 (4.6%) |
| 65 to 74 Years | 70 (100.0%) | 0 (0.0%) |
| 75 Years and older | 48 (100.0%) | 0 (0.0%) |
| Total | 790 (95.9%) | 34 (4.1%) |
Health Insurance Coverage by Citizenship Status in Mount Vernon
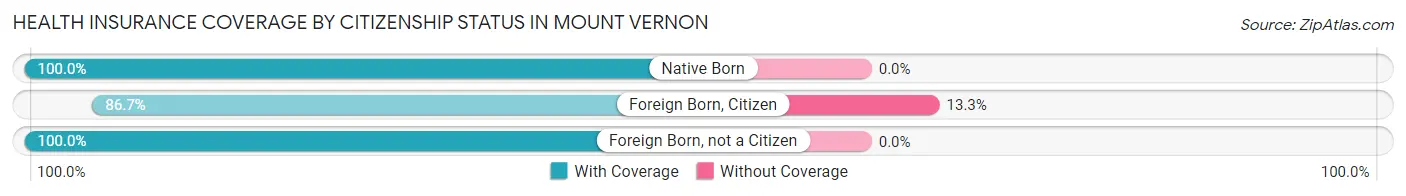
| Citizenship Status | With Coverage | Without Coverage |
| Native Born | 17 (100.0%) | 0 (0.0%) |
| Foreign Born, Citizen | 104 (86.7%) | 16 (13.3%) |
| Foreign Born, not a Citizen | 47 (100.0%) | 0 (0.0%) |
Health Insurance Coverage by Household Income in Mount Vernon
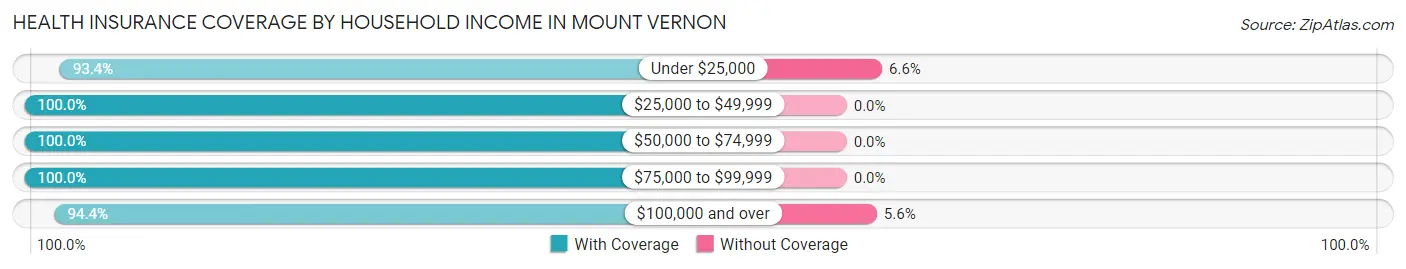
| Household Income | With Coverage | Without Coverage |
| Under $25,000 | 226 (93.4%) | 16 (6.6%) |
| $25,000 to $49,999 | 83 (100.0%) | 0 (0.0%) |
| $50,000 to $74,999 | 82 (100.0%) | 0 (0.0%) |
| $75,000 to $99,999 | 98 (100.0%) | 0 (0.0%) |
| $100,000 and over | 301 (94.4%) | 18 (5.6%) |
Public vs Private Health Insurance Coverage by Age in Mount Vernon
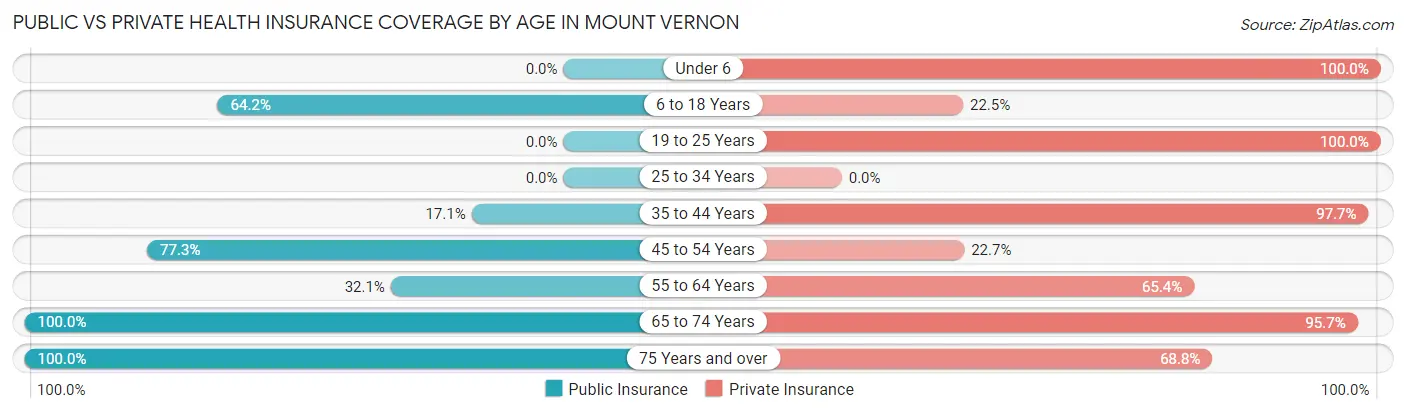
| Age Bracket | Public Insurance | Private Insurance |
| Under 6 | 0 (0.0%) | 17 (100.0%) |
| 6 to 18 Years | 77 (64.2%) | 27 (22.5%) |
| 19 to 25 Years | 0 (0.0%) | 47 (100.0%) |
| 25 to 34 Years | 0 (0.0%) | 0 (0.0%) |
| 35 to 44 Years | 15 (17.1%) | 86 (97.7%) |
| 45 to 54 Years | 34 (77.3%) | 10 (22.7%) |
| 55 to 64 Years | 125 (32.1%) | 255 (65.4%) |
| 65 to 74 Years | 70 (100.0%) | 67 (95.7%) |
| 75 Years and over | 48 (100.0%) | 33 (68.8%) |
| Total | 369 (44.8%) | 542 (65.8%) |
Disability Status by Sex by Age in Mount Vernon
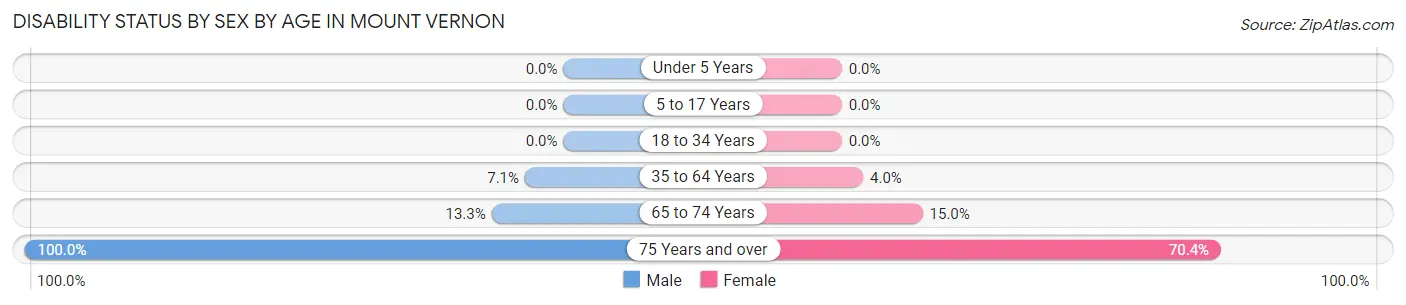
| Age Bracket | Male | Female |
| Under 5 Years | 0 (0.0%) | 0 (0.0%) |
| 5 to 17 Years | 0 (0.0%) | 0 (0.0%) |
| 18 to 34 Years | 0 (0.0%) | 0 (0.0%) |
| 35 to 64 Years | 21 (7.1%) | 9 (4.0%) |
| 65 to 74 Years | 4 (13.3%) | 6 (15.0%) |
| 75 Years and over | 21 (100.0%) | 19 (70.4%) |
Disability Class by Sex by Age in Mount Vernon
Disability Class: Hearing Difficulty
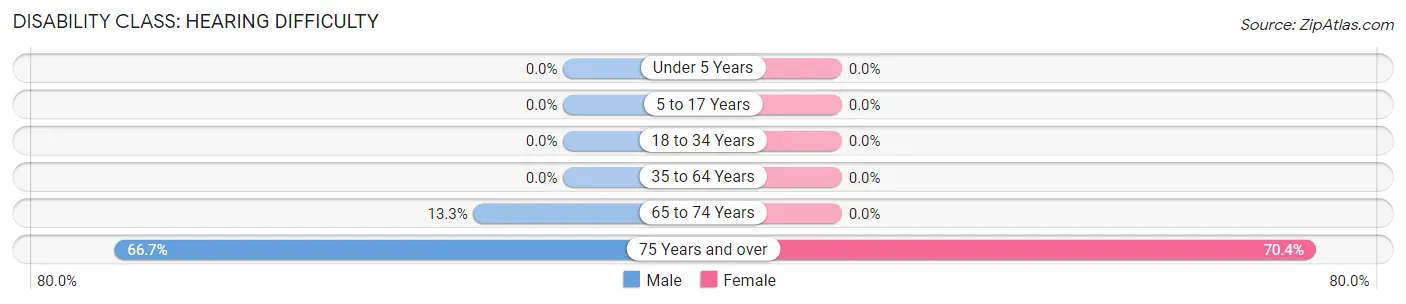
| Age Bracket | Male | Female |
| Under 5 Years | 0 (0.0%) | 0 (0.0%) |
| 5 to 17 Years | 0 (0.0%) | 0 (0.0%) |
| 18 to 34 Years | 0 (0.0%) | 0 (0.0%) |
| 35 to 64 Years | 0 (0.0%) | 0 (0.0%) |
| 65 to 74 Years | 4 (13.3%) | 0 (0.0%) |
| 75 Years and over | 14 (66.7%) | 19 (70.4%) |
Disability Class: Vision Difficulty
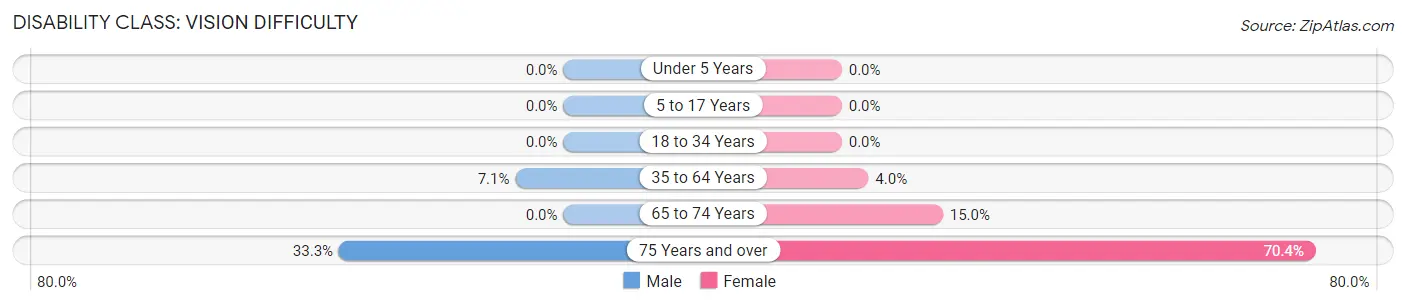
| Age Bracket | Male | Female |
| Under 5 Years | 0 (0.0%) | 0 (0.0%) |
| 5 to 17 Years | 0 (0.0%) | 0 (0.0%) |
| 18 to 34 Years | 0 (0.0%) | 0 (0.0%) |
| 35 to 64 Years | 21 (7.1%) | 9 (4.0%) |
| 65 to 74 Years | 0 (0.0%) | 6 (15.0%) |
| 75 Years and over | 7 (33.3%) | 19 (70.4%) |
Disability Class: Cognitive Difficulty
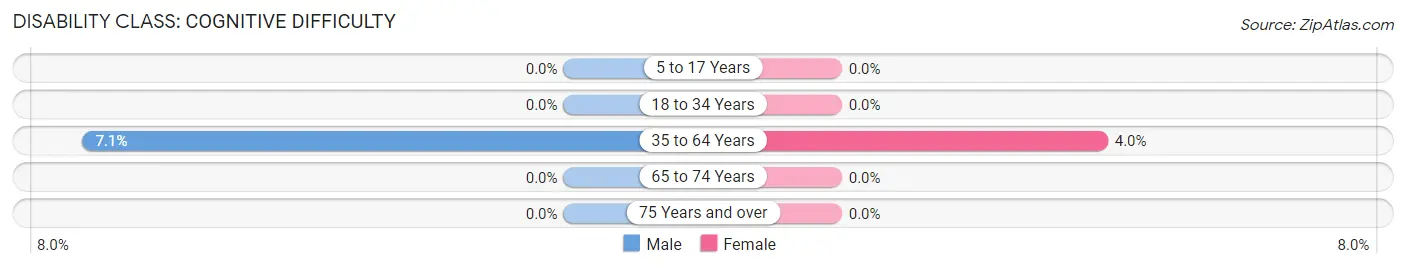
| Age Bracket | Male | Female |
| 5 to 17 Years | 0 (0.0%) | 0 (0.0%) |
| 18 to 34 Years | 0 (0.0%) | 0 (0.0%) |
| 35 to 64 Years | 21 (7.1%) | 9 (4.0%) |
| 65 to 74 Years | 0 (0.0%) | 0 (0.0%) |
| 75 Years and over | 0 (0.0%) | 0 (0.0%) |
Disability Class: Ambulatory Difficulty
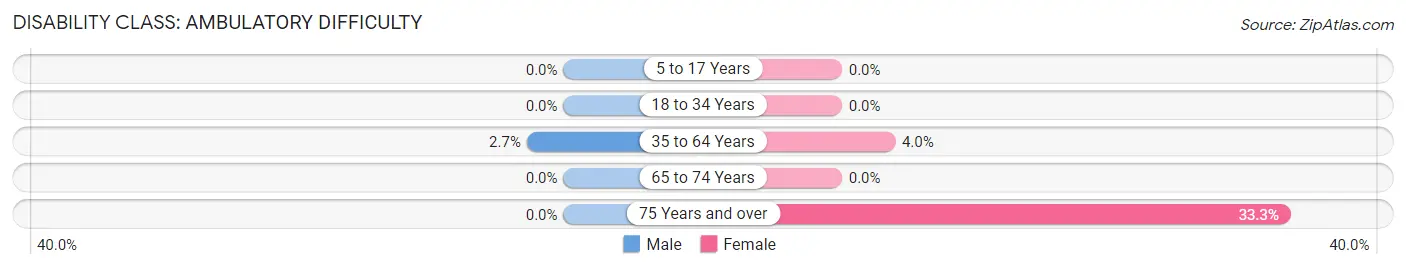
| Age Bracket | Male | Female |
| 5 to 17 Years | 0 (0.0%) | 0 (0.0%) |
| 18 to 34 Years | 0 (0.0%) | 0 (0.0%) |
| 35 to 64 Years | 8 (2.7%) | 9 (4.0%) |
| 65 to 74 Years | 0 (0.0%) | 0 (0.0%) |
| 75 Years and over | 0 (0.0%) | 9 (33.3%) |
Disability Class: Self-Care Difficulty
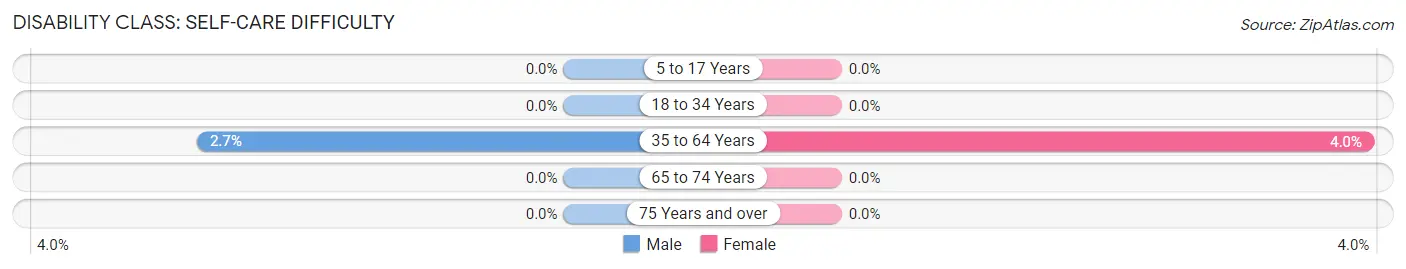
| Age Bracket | Male | Female |
| 5 to 17 Years | 0 (0.0%) | 0 (0.0%) |
| 18 to 34 Years | 0 (0.0%) | 0 (0.0%) |
| 35 to 64 Years | 8 (2.7%) | 9 (4.0%) |
| 65 to 74 Years | 0 (0.0%) | 0 (0.0%) |
| 75 Years and over | 0 (0.0%) | 0 (0.0%) |
Technology Access in Mount Vernon
Computing Device Access in Mount Vernon
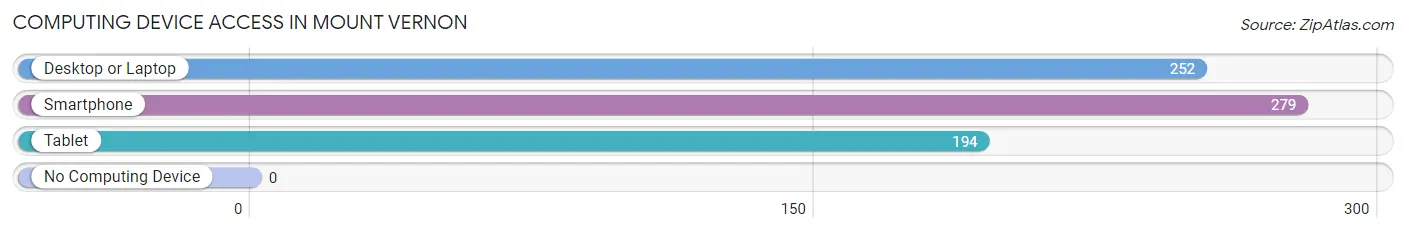
| Device Type | # Households | % Households |
| Desktop or Laptop | 252 | 74.3% |
| Smartphone | 279 | 82.3% |
| Tablet | 194 | 57.2% |
| No Computing Device | 0 | 0.0% |
| Total | 339 | 100.0% |
Internet Access in Mount Vernon
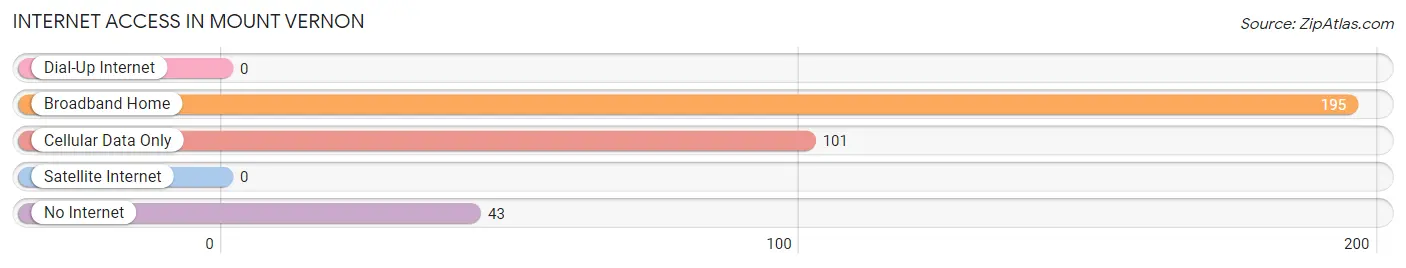
| Internet Type | # Households | % Households |
| Dial-Up Internet | 0 | 0.0% |
| Broadband Home | 195 | 57.5% |
| Cellular Data Only | 101 | 29.8% |
| Satellite Internet | 0 | 0.0% |
| No Internet | 43 | 12.7% |
| Total | 339 | 100.0% |
Mount Vernon Summary
Introduction
Mount Vernon is a city located in the state of Maryland, United States. It is located in the Baltimore-Washington metropolitan area and is the county seat of Baltimore County. The city is named after George Washington's plantation, Mount Vernon, which is located nearby. The city has a population of approximately 67,000 people and is the second-largest city in the state of Maryland.
History
Mount Vernon was first settled in the early 1700s by English settlers. The area was originally known as Pig Point, and was part of Baltimore County. In 1745, the area was renamed Mount Vernon in honor of George Washington's plantation, which was located nearby. The city was officially incorporated in 1851.
In the late 1800s, the city experienced a period of growth and development. The city was home to a number of factories and businesses, and the population grew rapidly. The city was also home to a number of prominent citizens, including the first African-American mayor of Baltimore, William P. Cole.
In the early 1900s, the city experienced a period of decline. The factories and businesses closed, and the population decreased. The city was also affected by the Great Depression and World War II.
In the late 1900s, the city experienced a period of revitalization. The city was home to a number of new businesses and industries, and the population began to increase. The city was also home to a number of cultural and educational institutions, including the Walters Art Museum and the Maryland Institute College of Art.
Geography
Mount Vernon is located in the state of Maryland, United States. It is located in the Baltimore-Washington metropolitan area and is the county seat of Baltimore County. The city is located on the Patapsco River, and is bordered by the cities of Baltimore, Towson, and Catonsville. The city has a total area of 4.3 square miles, and has a population density of 15,717 people per square mile.
Economy
Mount Vernon has a diverse economy, with a number of businesses and industries located in the city. The city is home to a number of corporate headquarters, including the headquarters of Under Armour, T. Rowe Price, and Legg Mason. The city is also home to a number of educational and cultural institutions, including the Walters Art Museum and the Maryland Institute College of Art.
The city is also home to a number of healthcare facilities, including the University of Maryland Medical Center and the Johns Hopkins Hospital. The city is also home to a number of retail stores and restaurants, as well as a number of parks and recreational facilities.
Demographics
As of the 2010 census, the population of Mount Vernon was 67,000 people. The racial makeup of the city was 57.3% White, 28.2% African American, 0.3% Native American, 4.2% Asian, 0.1% Pacific Islander, and 9.9% from other races. The median household income was $50,000, and the median family income was $60,000.
Conclusion
Mount Vernon is a city located in the state of Maryland, United States. It is located in the Baltimore-Washington metropolitan area and is the county seat of Baltimore County. The city has a population of approximately 67,000 people and is the second-largest city in the state of Maryland. The city has a diverse economy, with a number of businesses and industries located in the city. The city is also home to a number of educational and cultural institutions, as well as a number of healthcare facilities. The racial makeup of the city is 57.3% White, 28.2% African American, 0.3% Native American, 4.2% Asian, 0.1% Pacific Islander, and 9.9% from other races. The median household income was $50,000, and the median family income was $60,000.
Common Questions
What is Per Capita Income in Mount Vernon?
Per Capita income in Mount Vernon is $32,141.
What is the Median Family Income in Mount Vernon?
Median Family Income in Mount Vernon is $84,333.
What is the Median Household income in Mount Vernon?
Median Household Income in Mount Vernon is $56,467.
What is Income or Wage Gap in Mount Vernon?
Income or Wage Gap in Mount Vernon is 3.6%.
Women in Mount Vernon earn 96.4 cents for every dollar earned by a man.
What is Inequality or Gini Index in Mount Vernon?
Inequality or Gini Index in Mount Vernon is 0.40.
What is the Total Population of Mount Vernon?
Total Population of Mount Vernon is 824.
What is the Total Male Population of Mount Vernon?
Total Male Population of Mount Vernon is 456.
What is the Total Female Population of Mount Vernon?
Total Female Population of Mount Vernon is 368.
What is the Ratio of Males per 100 Females in Mount Vernon?
There are 123.91 Males per 100 Females in Mount Vernon.
What is the Ratio of Females per 100 Males in Mount Vernon?
There are 80.70 Females per 100 Males in Mount Vernon.
What is the Median Population Age in Mount Vernon?
Median Population Age in Mount Vernon is 55.6 Years.
What is the Average Family Size in Mount Vernon
Average Family Size in Mount Vernon is 2.6 People.
What is the Average Household Size in Mount Vernon
Average Household Size in Mount Vernon is 2.4 People.
How Large is the Labor Force in Mount Vernon?
There are 510 People in the Labor Forcein in Mount Vernon.
What is the Percentage of People in the Labor Force in Mount Vernon?
71.0% of People are in the Labor Force in Mount Vernon.