Gilmore, MD Map & Demographics
Gilmore Map
Gilmore Overview
$20,506
PER CAPITA INCOME
$102,804
AVG FAMILY INCOME
$84,904
AVG HOUSEHOLD INCOME
0.27
INEQUALITY / GINI INDEX
359
TOTAL POPULATION
223
MALE POPULATION
136
FEMALE POPULATION
163.97
MALES / 100 FEMALES
60.99
FEMALES / 100 MALES
20.5
MEDIAN AGE
4.6
AVG FAMILY SIZE
4.3
AVG HOUSEHOLD SIZE
217
LABOR FORCE [ PEOPLE ]
76.1%
PERCENT IN LABOR FORCE
Income in Gilmore
Income Overview in Gilmore
Per Capita Income in Gilmore is $20,506, while median incomes of families and households are $102,804 and $84,904 respectively.
| Characteristic | Number | Measure |
| Per Capita Income | 359 | $20,506 |
| Median Family Income | 73 | $102,804 |
| Mean Family Income | 73 | $85,303 |
| Median Household Income | 83 | $84,904 |
| Mean Household Income | 83 | $79,773 |
| Income Deficit | 73 | $0 |
| Wage / Income Gap (%) | 359 | 0.00% |
| Wage / Income Gap ($) | 359 | 100.00¢ per $1 |
| Gini / Inequality Index | 359 | 0.27 |
Earnings by Sex in Gilmore
| Sex | Number | Average Earnings |
| Male | 114 (51.6%) | $0 |
| Female | 107 (48.4%) | $0 |
| Total | 221 (100.0%) | $0 |
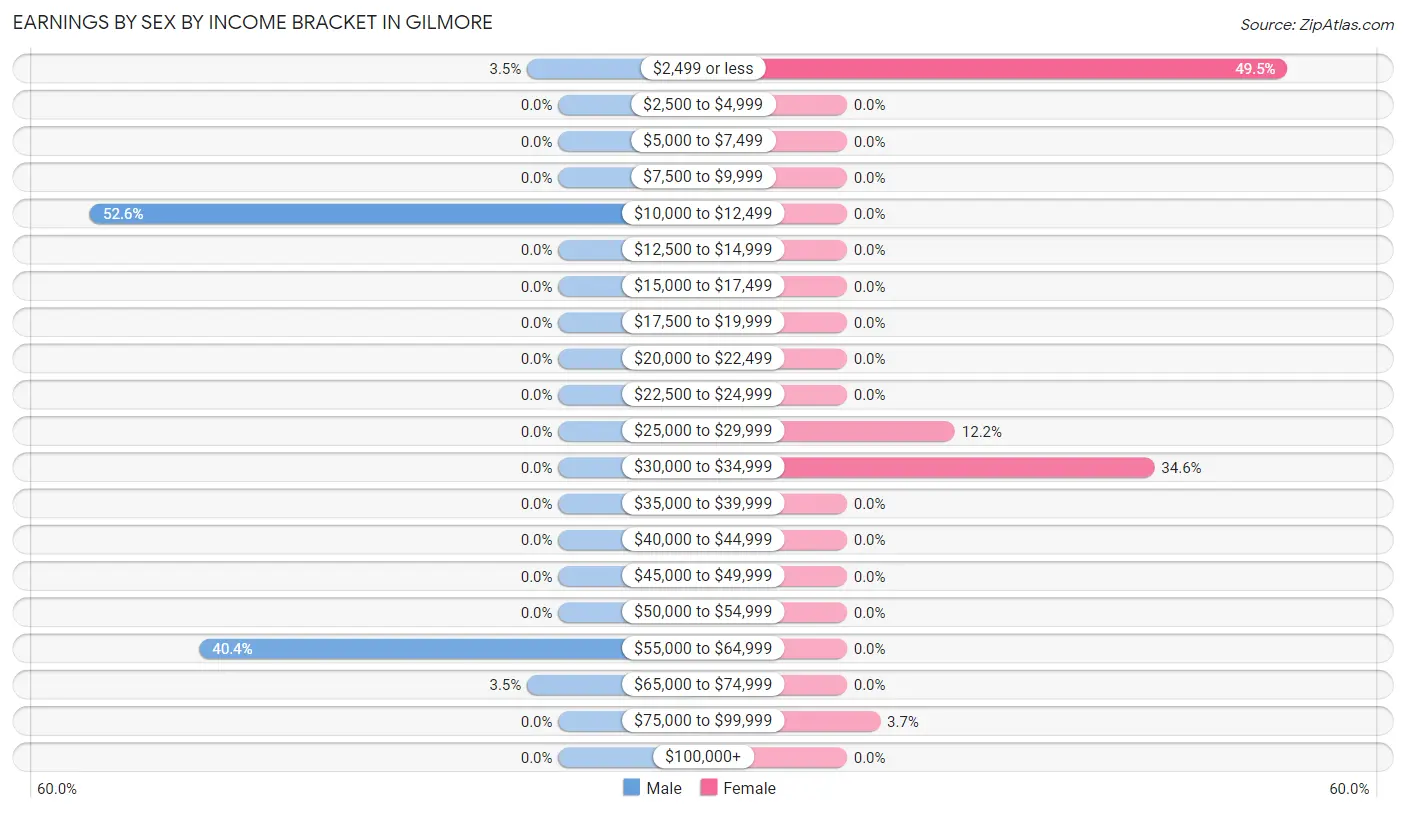
Earnings by Sex by Income Bracket in Gilmore
The most common earnings brackets in Gilmore are $10,000 to $12,499 for men (60 | 52.6%) and $2,499 or less for women (53 | 49.5%).
| Income | Male | Female |
| $2,499 or less | 4 (3.5%) | 53 (49.5%) |
| $2,500 to $4,999 | 0 (0.0%) | 0 (0.0%) |
| $5,000 to $7,499 | 0 (0.0%) | 0 (0.0%) |
| $7,500 to $9,999 | 0 (0.0%) | 0 (0.0%) |
| $10,000 to $12,499 | 60 (52.6%) | 0 (0.0%) |
| $12,500 to $14,999 | 0 (0.0%) | 0 (0.0%) |
| $15,000 to $17,499 | 0 (0.0%) | 0 (0.0%) |
| $17,500 to $19,999 | 0 (0.0%) | 0 (0.0%) |
| $20,000 to $22,499 | 0 (0.0%) | 0 (0.0%) |
| $22,500 to $24,999 | 0 (0.0%) | 0 (0.0%) |
| $25,000 to $29,999 | 0 (0.0%) | 13 (12.1%) |
| $30,000 to $34,999 | 0 (0.0%) | 37 (34.6%) |
| $35,000 to $39,999 | 0 (0.0%) | 0 (0.0%) |
| $40,000 to $44,999 | 0 (0.0%) | 0 (0.0%) |
| $45,000 to $49,999 | 0 (0.0%) | 0 (0.0%) |
| $50,000 to $54,999 | 0 (0.0%) | 0 (0.0%) |
| $55,000 to $64,999 | 46 (40.4%) | 0 (0.0%) |
| $65,000 to $74,999 | 4 (3.5%) | 0 (0.0%) |
| $75,000 to $99,999 | 0 (0.0%) | 4 (3.7%) |
| $100,000+ | 0 (0.0%) | 0 (0.0%) |
| Total | 114 (100.0%) | 107 (100.0%) |
Earnings by Sex by Educational Attainment in Gilmore
| Educational Attainment | Male Income | Female Income |
| Less than High School | - | - |
| High School Diploma | - | - |
| College or Associate's Degree | - | - |
| Bachelor's Degree | - | - |
| Graduate Degree | - | - |
| Total | - | - |
Family Income in Gilmore
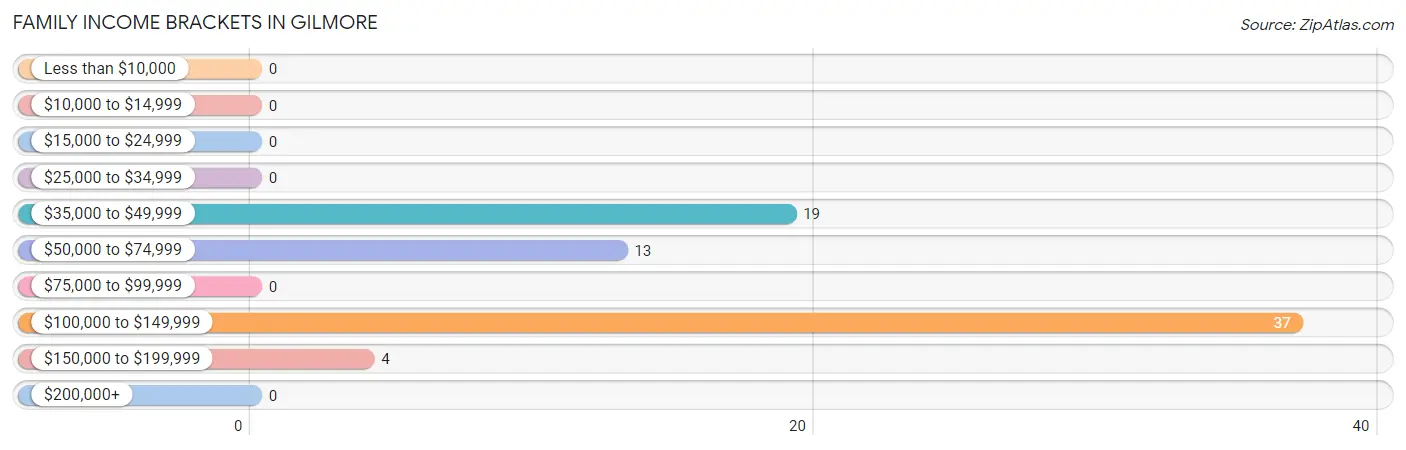
Family Income Brackets in Gilmore
According to the Gilmore family income data, there are 37 families falling into the $100,000 to $149,999 income range, which is the most common income bracket and makes up 50.7% of all families.
| Income Bracket | # Families | % Families |
| Less than $10,000 | 0 | 0.0% |
| $10,000 to $14,999 | 0 | 0.0% |
| $15,000 to $24,999 | 0 | 0.0% |
| $25,000 to $34,999 | 0 | 0.0% |
| $35,000 to $49,999 | 19 | 26.0% |
| $50,000 to $74,999 | 13 | 17.8% |
| $75,000 to $99,999 | 0 | 0.0% |
| $100,000 to $149,999 | 37 | 50.7% |
| $150,000 to $199,999 | 4 | 5.5% |
| $200,000+ | 0 | 0.0% |
Family Income by Famaliy Size in Gilmore
| Income Bracket | # Families | Median Income |
| 2-Person Families | 13 (17.8%) | $0 |
| 3-Person Families | 0 (0.0%) | $0 |
| 4-Person Families | 41 (56.2%) | $0 |
| 5-Person Families | 19 (26.0%) | $0 |
| 6-Person Families | 0 (0.0%) | $0 |
| 7+ Person Families | 0 (0.0%) | $0 |
| Total | 73 (100.0%) | $102,804 |
Family Income by Number of Earners in Gilmore
| Number of Earners | # Families | Median Income |
| No Earners | 19 (26.0%) | $0 |
| 1 Earner | 13 (17.8%) | $0 |
| 2 Earners | 0 (0.0%) | $0 |
| 3+ Earners | 41 (56.2%) | $0 |
| Total | 73 (100.0%) | $102,804 |
Household Income in Gilmore
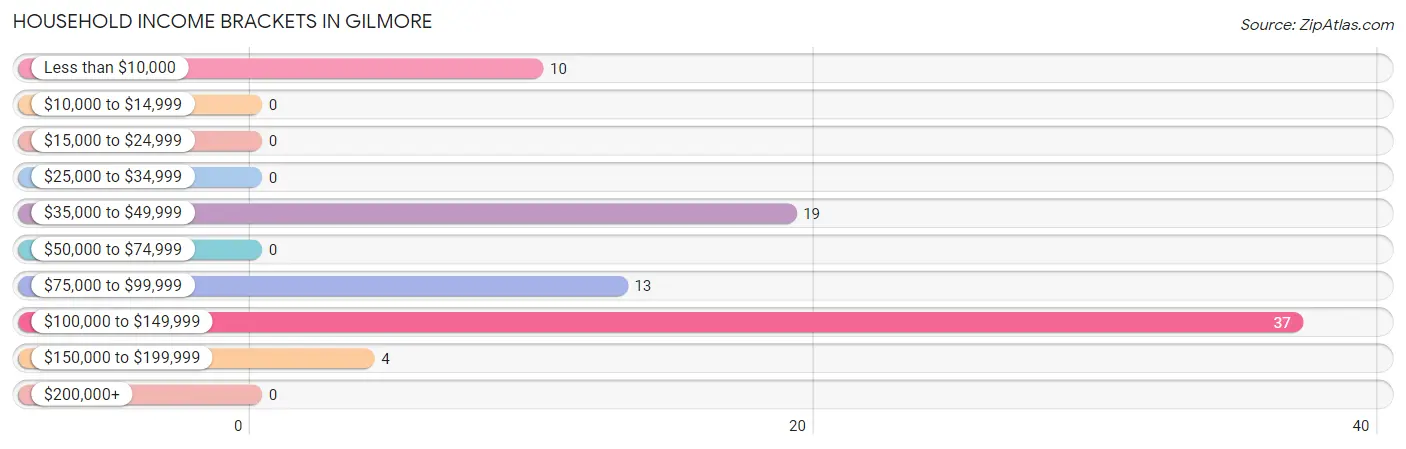
Household Income Brackets in Gilmore
With 37 households falling in the category, the $100,000 to $149,999 income range is the most frequent in Gilmore, accounting for 44.6% of all households.
| Income Bracket | # Households | % Households |
| Less than $10,000 | 10 | 12.0% |
| $10,000 to $14,999 | 0 | 0.0% |
| $15,000 to $24,999 | 0 | 0.0% |
| $25,000 to $34,999 | 0 | 0.0% |
| $35,000 to $49,999 | 19 | 22.9% |
| $50,000 to $74,999 | 0 | 0.0% |
| $75,000 to $99,999 | 13 | 15.7% |
| $100,000 to $149,999 | 37 | 44.6% |
| $150,000 to $199,999 | 4 | 4.8% |
| $200,000+ | 0 | 0.0% |
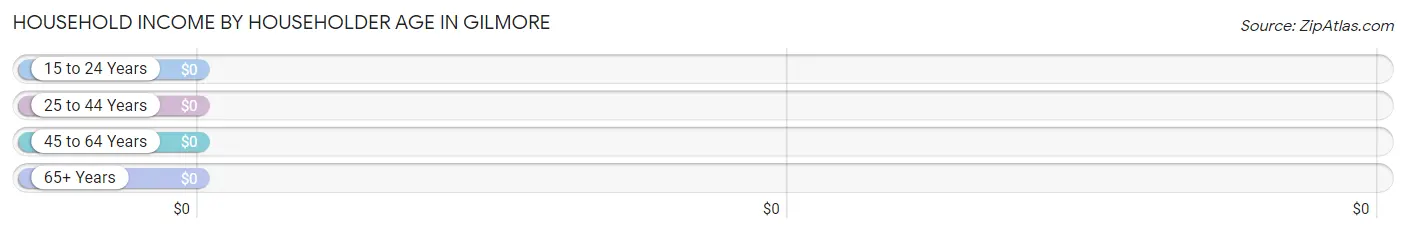
Household Income by Householder Age in Gilmore
| Income Bracket | # Households | Median Income |
| 15 to 24 Years | 0 (0.0%) | $0 |
| 25 to 44 Years | 56 (67.5%) | $0 |
| 45 to 64 Years | 14 (16.9%) | $0 |
| 65+ Years | 13 (15.7%) | $0 |
| Total | 83 (100.0%) | $84,904 |
Poverty in Gilmore
Income Below Poverty by Sex and Age in Gilmore
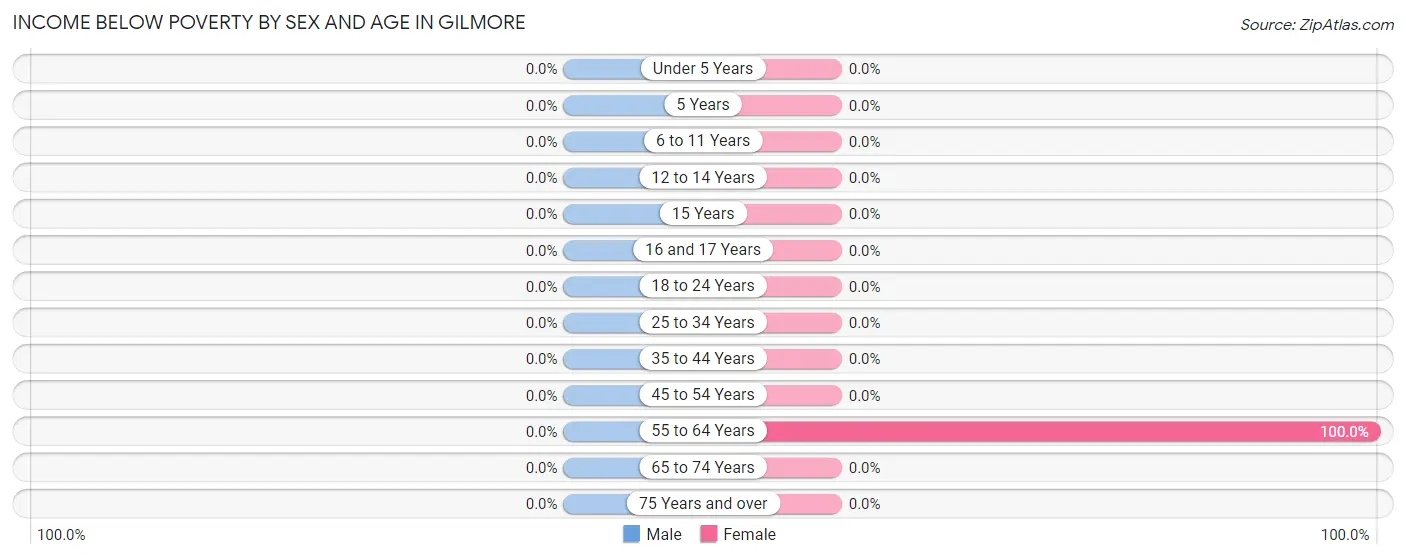
| Age Bracket | Male | Female |
| Under 5 Years | 0 (0.0%) | 0 (0.0%) |
| 5 Years | 0 (0.0%) | 0 (0.0%) |
| 6 to 11 Years | 0 (0.0%) | 0 (0.0%) |
| 12 to 14 Years | 0 (0.0%) | 0 (0.0%) |
| 15 Years | 0 (0.0%) | 0 (0.0%) |
| 16 and 17 Years | 0 (0.0%) | 0 (0.0%) |
| 18 to 24 Years | 0 (0.0%) | 0 (0.0%) |
| 25 to 34 Years | 0 (0.0%) | 0 (0.0%) |
| 35 to 44 Years | 0 (0.0%) | 0 (0.0%) |
| 45 to 54 Years | 0 (0.0%) | 0 (0.0%) |
| 55 to 64 Years | 0 (0.0%) | 10 (100.0%) |
| 65 to 74 Years | 0 (0.0%) | 0 (0.0%) |
| 75 Years and over | 0 (0.0%) | 0 (0.0%) |
| Total | 0 (0.0%) | 10 (7.3%) |
Income Above Poverty by Sex and Age in Gilmore
According to the poverty statistics in Gilmore, males aged 6 to 11 years and females aged 16 and 17 years are the age groups that are most secure financially, with 100.0% of males and 100.0% of females in these age groups living above the poverty line.
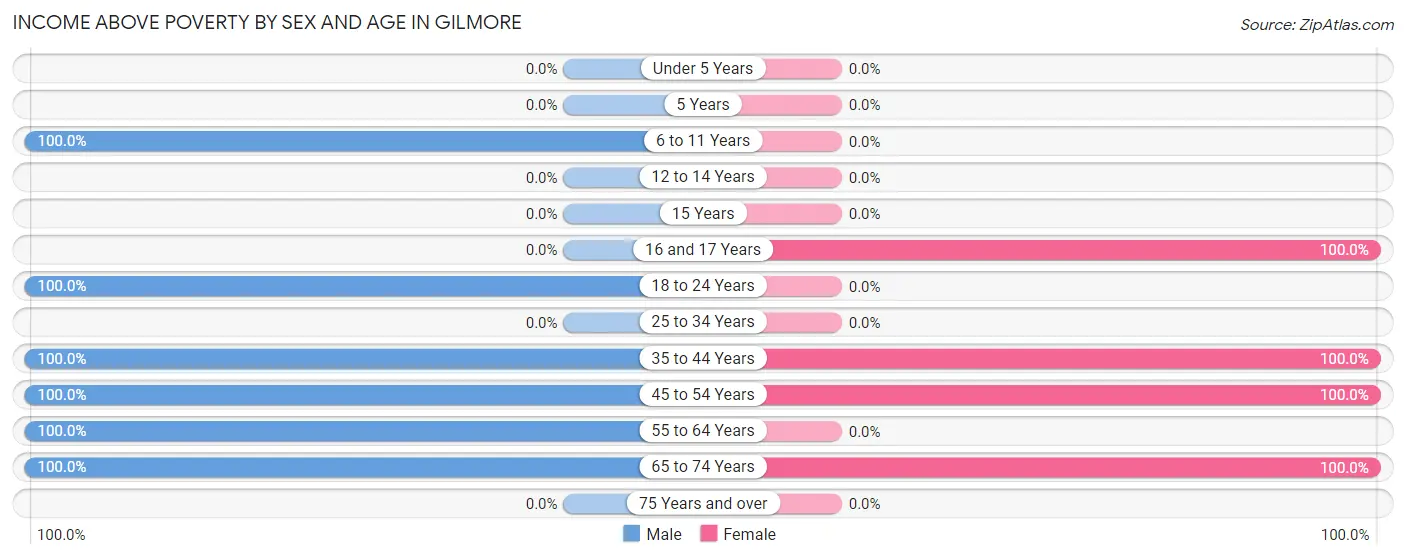
| Age Bracket | Male | Female |
| Under 5 Years | 0 (0.0%) | 0 (0.0%) |
| 5 Years | 0 (0.0%) | 0 (0.0%) |
| 6 to 11 Years | 74 (100.0%) | 0 (0.0%) |
| 12 to 14 Years | 0 (0.0%) | 0 (0.0%) |
| 15 Years | 0 (0.0%) | 0 (0.0%) |
| 16 and 17 Years | 0 (0.0%) | 53 (100.0%) |
| 18 to 24 Years | 64 (100.0%) | 0 (0.0%) |
| 25 to 34 Years | 0 (0.0%) | 0 (0.0%) |
| 35 to 44 Years | 46 (100.0%) | 56 (100.0%) |
| 45 to 54 Years | 22 (100.0%) | 4 (100.0%) |
| 55 to 64 Years | 4 (100.0%) | 0 (0.0%) |
| 65 to 74 Years | 13 (100.0%) | 13 (100.0%) |
| 75 Years and over | 0 (0.0%) | 0 (0.0%) |
| Total | 223 (100.0%) | 126 (92.6%) |
Income Below Poverty Among Married-Couple Families in Gilmore
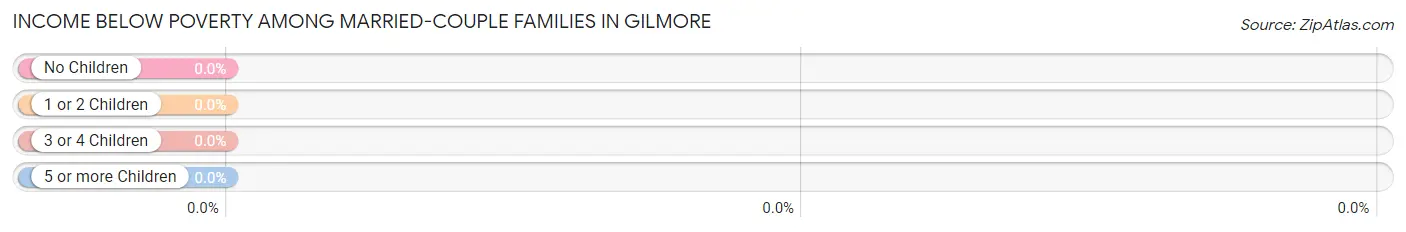
| Children | Above Poverty | Below Poverty |
| No Children | 4 (100.0%) | 0 (0.0%) |
| 1 or 2 Children | 37 (100.0%) | 0 (0.0%) |
| 3 or 4 Children | 19 (100.0%) | 0 (0.0%) |
| 5 or more Children | 0 (0.0%) | 0 (0.0%) |
| Total | 60 (100.0%) | 0 (0.0%) |
Income Below Poverty Among Single-Parent Households in Gilmore
| Children | Single Father | Single Mother |
| No Children | 0 (0.0%) | 0 (0.0%) |
| 1 or 2 Children | 0 (0.0%) | 0 (0.0%) |
| 3 or 4 Children | 0 (0.0%) | 0 (0.0%) |
| 5 or more Children | 0 (0.0%) | 0 (0.0%) |
| Total | 0 (0.0%) | 0 (0.0%) |
Income Below Poverty Among Married-Couple vs Single-Parent Households in Gilmore
| Children | Married-Couple Families | Single-Parent Households |
| No Children | 0 (0.0%) | 0 (0.0%) |
| 1 or 2 Children | 0 (0.0%) | 0 (0.0%) |
| 3 or 4 Children | 0 (0.0%) | 0 (0.0%) |
| 5 or more Children | 0 (0.0%) | 0 (0.0%) |
| Total | 0 (0.0%) | 0 (0.0%) |
Race in Gilmore
The most populous races in Gilmore are White / Caucasian (321 | 89.4%), Hispanic or Latino (38 | 10.6%), and Two or more Races (38 | 10.6%).
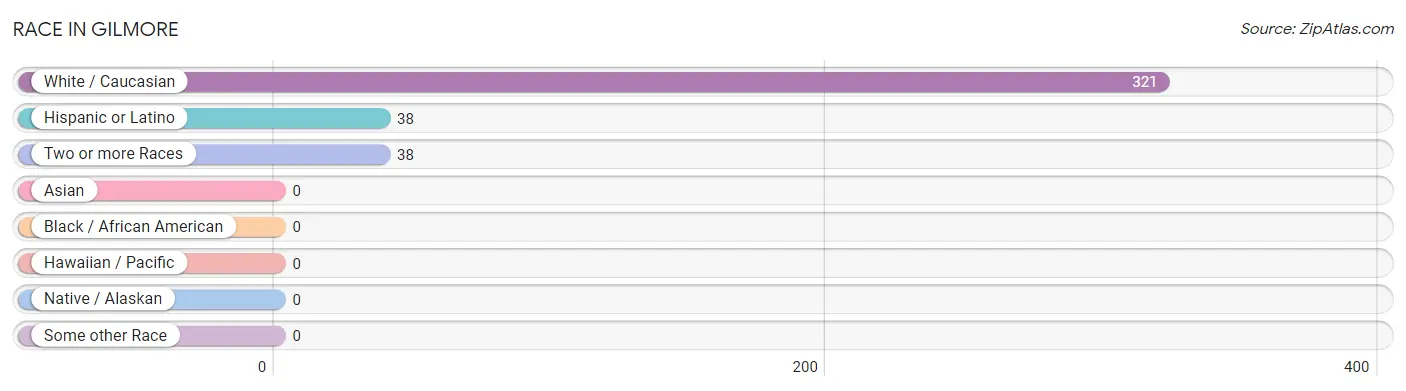
| Race | # Population | % Population |
| Asian | 0 | 0.0% |
| Black / African American | 0 | 0.0% |
| Hawaiian / Pacific | 0 | 0.0% |
| Hispanic or Latino | 38 | 10.6% |
| Native / Alaskan | 0 | 0.0% |
| White / Caucasian | 321 | 89.4% |
| Two or more Races | 38 | 10.6% |
| Some other Race | 0 | 0.0% |
| Total | 359 | 100.0% |
Ancestry in Gilmore
The most populous ancestries reported in Gilmore are Mexican (25 | 7.0%), Central American (13 | 3.6%), and Salvadoran (13 | 3.6%), together accounting for 14.2% of all Gilmore residents.
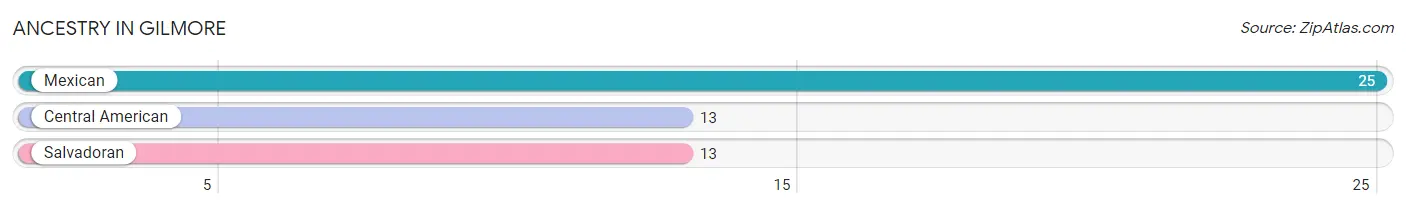
| Ancestry | # Population | % Population |
| Central American | 13 | 3.6% |
| Mexican | 25 | 7.0% |
| Salvadoran | 13 | 3.6% | View All 3 Rows |
Immigrants in Gilmore
The most numerous immigrant groups reported in Gilmore came from Central America (26 | 7.2%), Latin America (26 | 7.2%), and Mexico (26 | 7.2%), together accounting for 21.7% of all Gilmore residents.
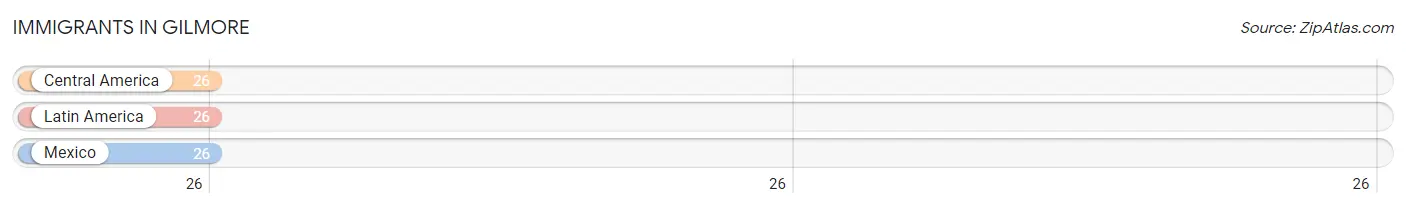
| Immigration Origin | # Population | % Population |
| Central America | 26 | 7.2% |
| Latin America | 26 | 7.2% |
| Mexico | 26 | 7.2% | View All 3 Rows |
Sex and Age in Gilmore
Sex and Age in Gilmore
The most populous age groups in Gilmore are 10 to 14 Years (50 | 22.4%) for men and 35 to 39 Years (56 | 41.2%) for women.
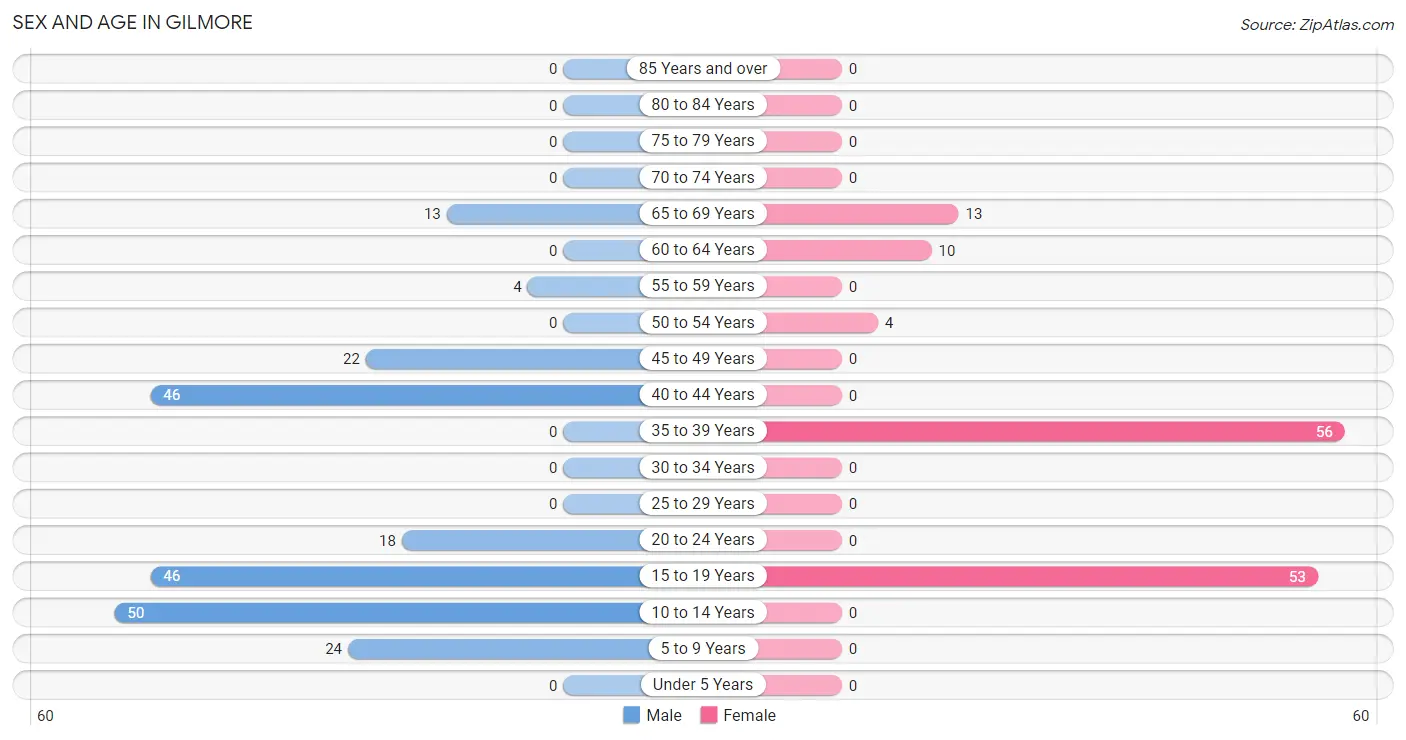
| Age Bracket | Male | Female |
| Under 5 Years | 0 (0.0%) | 0 (0.0%) |
| 5 to 9 Years | 24 (10.8%) | 0 (0.0%) |
| 10 to 14 Years | 50 (22.4%) | 0 (0.0%) |
| 15 to 19 Years | 46 (20.6%) | 53 (39.0%) |
| 20 to 24 Years | 18 (8.1%) | 0 (0.0%) |
| 25 to 29 Years | 0 (0.0%) | 0 (0.0%) |
| 30 to 34 Years | 0 (0.0%) | 0 (0.0%) |
| 35 to 39 Years | 0 (0.0%) | 56 (41.2%) |
| 40 to 44 Years | 46 (20.6%) | 0 (0.0%) |
| 45 to 49 Years | 22 (9.9%) | 0 (0.0%) |
| 50 to 54 Years | 0 (0.0%) | 4 (2.9%) |
| 55 to 59 Years | 4 (1.8%) | 0 (0.0%) |
| 60 to 64 Years | 0 (0.0%) | 10 (7.3%) |
| 65 to 69 Years | 13 (5.8%) | 13 (9.6%) |
| 70 to 74 Years | 0 (0.0%) | 0 (0.0%) |
| 75 to 79 Years | 0 (0.0%) | 0 (0.0%) |
| 80 to 84 Years | 0 (0.0%) | 0 (0.0%) |
| 85 Years and over | 0 (0.0%) | 0 (0.0%) |
| Total | 223 (100.0%) | 136 (100.0%) |
Families and Households in Gilmore
Median Family Size in Gilmore
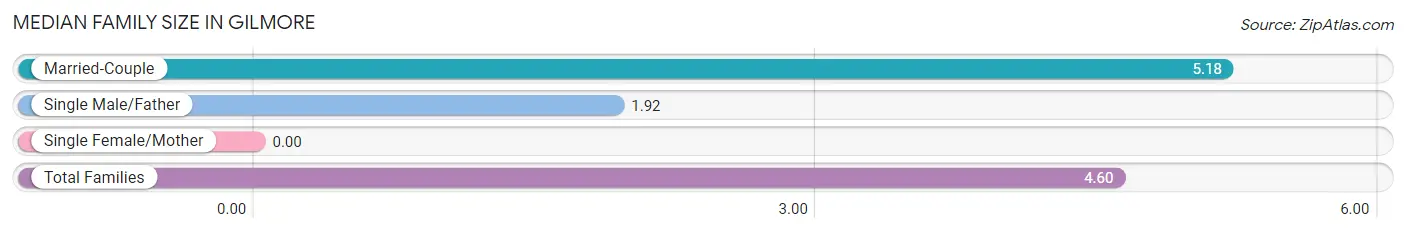
| Family Type | # Families | Family Size |
| Married-Couple | 60 (82.2%) | 5.18 |
| Single Male/Father | 13 (17.8%) | 1.92 |
| Single Female/Mother | 0 (0.0%) | - |
| Total Families | 73 (100.0%) | 4.60 |
Median Household Size in Gilmore
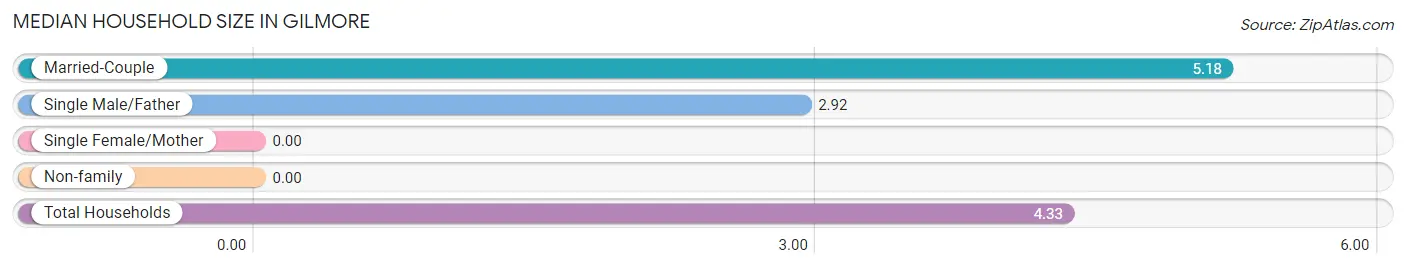
| Household Type | # Households | Household Size |
| Married-Couple | 60 (72.3%) | 5.18 |
| Single Male/Father | 13 (15.7%) | 2.92 |
| Single Female/Mother | 0 (0.0%) | - |
| Non-family | 10 (12.0%) | - |
| Total Households | 83 (100.0%) | 4.33 |
Household Size by Marriage Status in Gilmore
Out of a total of 83 households in Gilmore, 73 (87.9%) are family households, while 10 (12.0%) are nonfamily households. The most numerous type of family households are 4-person households, comprising 41, and the most common type of nonfamily households are 1-person households, comprising 10.
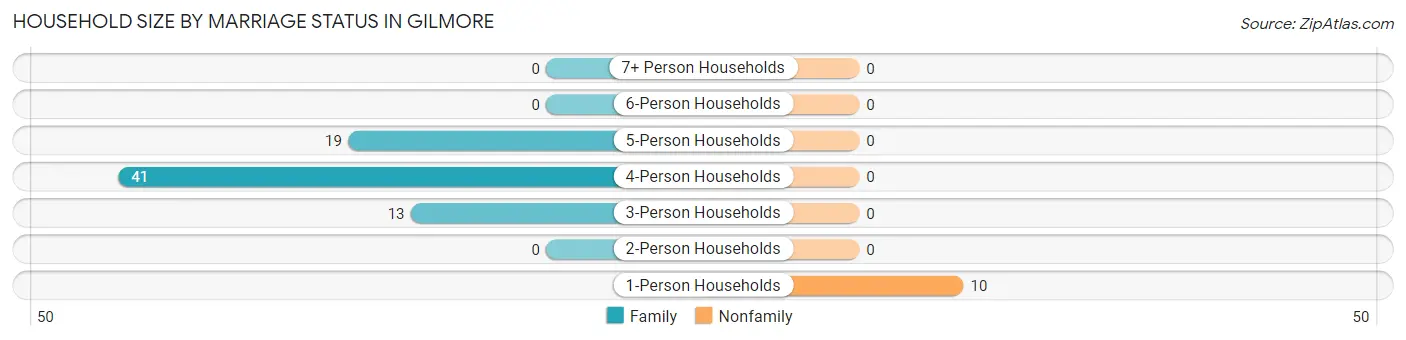
| Household Size | Family Households | Nonfamily Households |
| 1-Person Households | - | 10 (12.0%) |
| 2-Person Households | 0 (0.0%) | 0 (0.0%) |
| 3-Person Households | 13 (15.7%) | 0 (0.0%) |
| 4-Person Households | 41 (49.4%) | 0 (0.0%) |
| 5-Person Households | 19 (22.9%) | 0 (0.0%) |
| 6-Person Households | 0 (0.0%) | 0 (0.0%) |
| 7+ Person Households | 0 (0.0%) | 0 (0.0%) |
| Total | 73 (87.9%) | 10 (12.0%) |
Female Fertility in Gilmore
Fertility by Age in Gilmore
| Age Bracket | Women with Births | Births / 1,000 Women |
| 15 to 19 years | 0 (0.0%) | 0.0 |
| 20 to 34 years | 0 (0.0%) | 0.0 |
| 35 to 50 years | 0 (0.0%) | 0.0 |
| Total | 0 (0.0%) | 0.0 |
Fertility by Age by Marriage Status in Gilmore
| Age Bracket | Married | Unmarried |
| 15 to 19 years | 0 (0.0%) | 0 (0.0%) |
| 20 to 34 years | 0 (0.0%) | 0 (0.0%) |
| 35 to 50 years | 0 (0.0%) | 0 (0.0%) |
| Total | 0 (0.0%) | 0 (0.0%) |
Fertility by Education in Gilmore

| Educational Attainment | Women with Births | Births / 1,000 Women |
| Less than High School | 0 (0.0%) | 0.0 |
| High School Diploma | 0 (0.0%) | 0.0 |
| College or Associate's Degree | 0 (0.0%) | 0.0 |
| Bachelor's Degree | 0 (0.0%) | 0.0 |
| Graduate Degree | 0 (0.0%) | 0.0 |
| Total | 0 (0.0%) | 0.0 |
Fertility by Education by Marriage Status in Gilmore
| Educational Attainment | Married | Unmarried |
| Less than High School | 0 (0.0%) | 0 (0.0%) |
| High School Diploma | 0 (0.0%) | 0 (0.0%) |
| College or Associate's Degree | 0 (0.0%) | 0 (0.0%) |
| Bachelor's Degree | 0 (0.0%) | 0 (0.0%) |
| Graduate Degree | 0 (0.0%) | 0 (0.0%) |
| Total | 0 (0.0%) | 0 (0.0%) |
Employment Characteristics in Gilmore
Employment by Class of Employer in Gilmore
Among the 217 employed individuals in Gilmore, private company employees (84 | 38.7%), federal government employees (50 | 23.0%), and not-for-profit organizations (42 | 19.4%) make up the most common classes of employment.
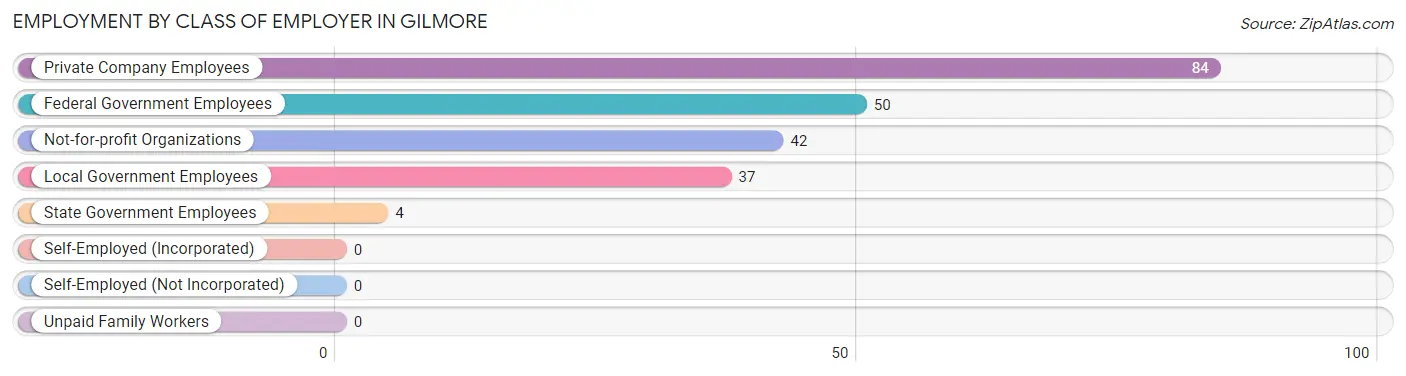
| Employer Class | # Employees | % Employees |
| Private Company Employees | 84 | 38.7% |
| Self-Employed (Incorporated) | 0 | 0.0% |
| Self-Employed (Not Incorporated) | 0 | 0.0% |
| Not-for-profit Organizations | 42 | 19.4% |
| Local Government Employees | 37 | 17.1% |
| State Government Employees | 4 | 1.8% |
| Federal Government Employees | 50 | 23.0% |
| Unpaid Family Workers | 0 | 0.0% |
| Total | 217 | 100.0% |
Employment Status by Age in Gilmore
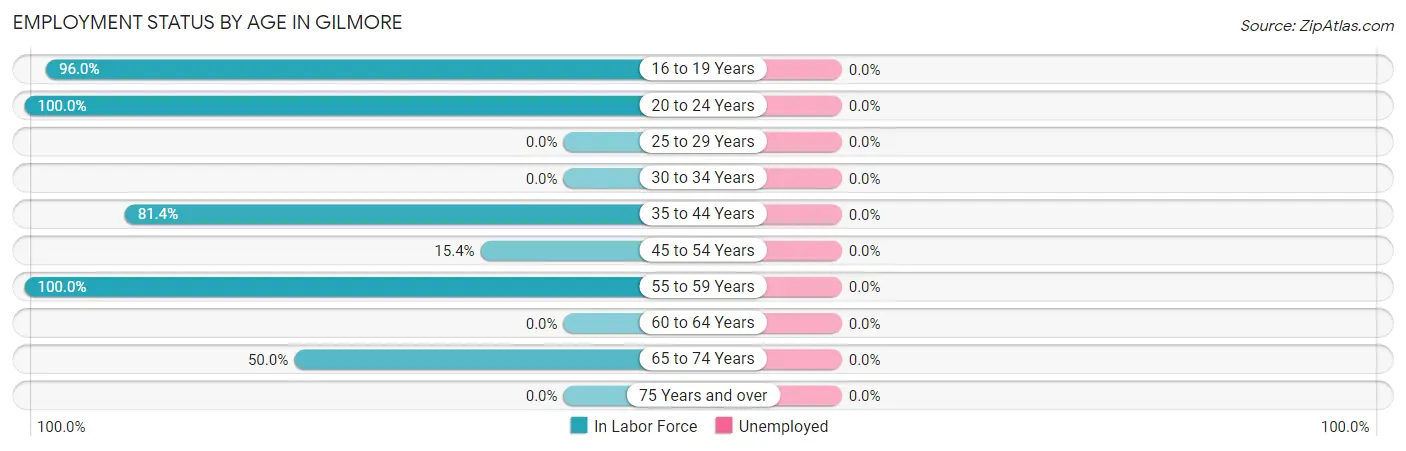
| Age Bracket | In Labor Force | Unemployed |
| 16 to 19 Years | 95 (96.0%) | 0 (0.0%) |
| 20 to 24 Years | 18 (100.0%) | 0 (0.0%) |
| 25 to 29 Years | 0 (0.0%) | 0 (0.0%) |
| 30 to 34 Years | 0 (0.0%) | 0 (0.0%) |
| 35 to 44 Years | 83 (81.4%) | 0 (0.0%) |
| 45 to 54 Years | 4 (15.4%) | 0 (0.0%) |
| 55 to 59 Years | 4 (100.0%) | 0 (0.0%) |
| 60 to 64 Years | 0 (0.0%) | 0 (0.0%) |
| 65 to 74 Years | 13 (50.0%) | 0 (0.0%) |
| 75 Years and over | 0 (0.0%) | 0 (0.0%) |
| Total | 217 (76.1%) | 0 (0.0%) |
Employment Status by Educational Attainment in Gilmore
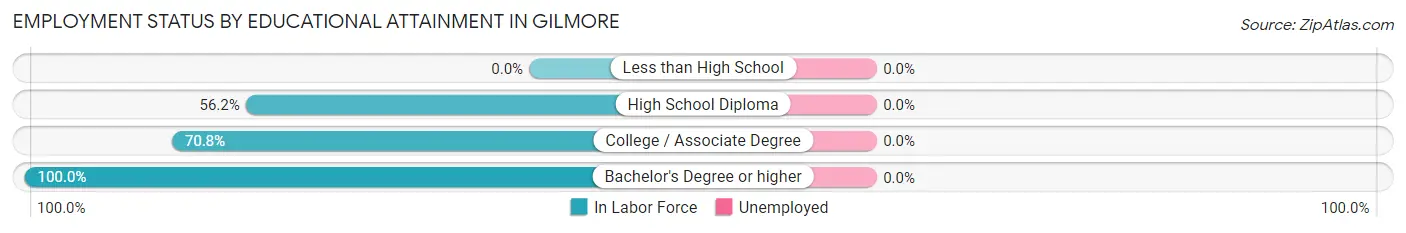
| Educational Attainment | In Labor Force | Unemployed |
| Less than High School | 0 (0.0%) | 0 (0.0%) |
| High School Diploma | 41 (56.2%) | 0 (0.0%) |
| College / Associate Degree | 46 (70.8%) | 0 (0.0%) |
| Bachelor's Degree or higher | 4 (100.0%) | 0 (0.0%) |
| Total | 91 (64.1%) | 0 (0.0%) |
Employment Occupations by Sex in Gilmore
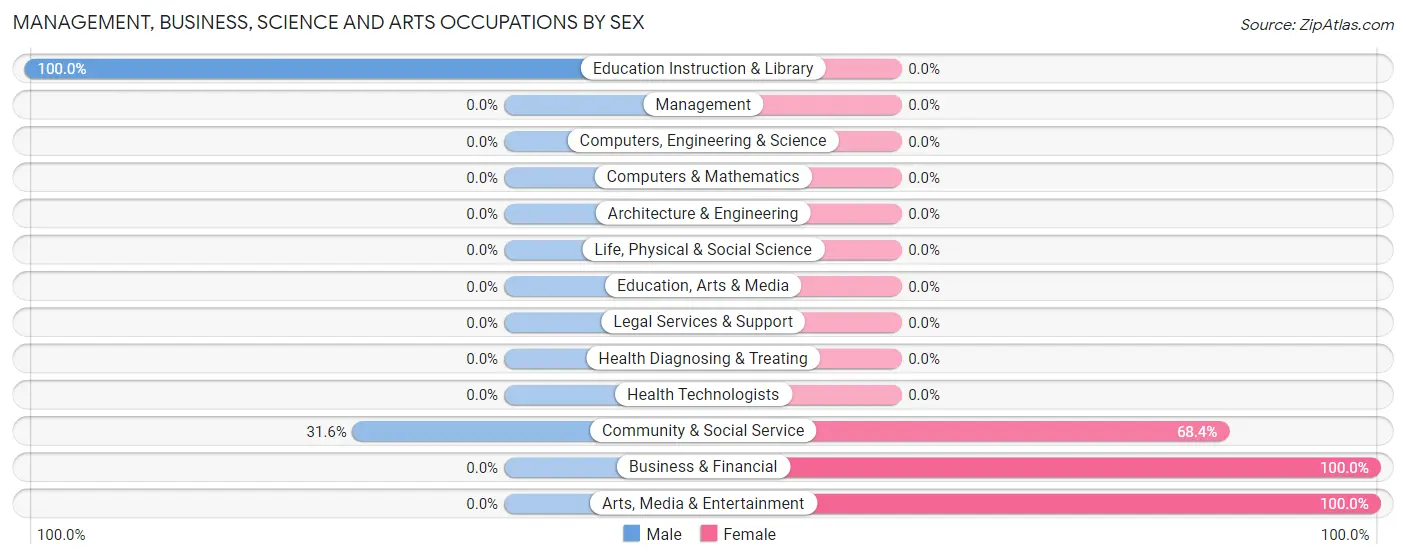
Management, Business, Science and Arts Occupations
The most common Management, Business, Science and Arts occupations in Gilmore are Community & Social Service (19 | 8.8%), Arts, Media & Entertainment (13 | 6.0%), Education Instruction & Library (6 | 2.8%), and Business & Financial (4 | 1.8%).
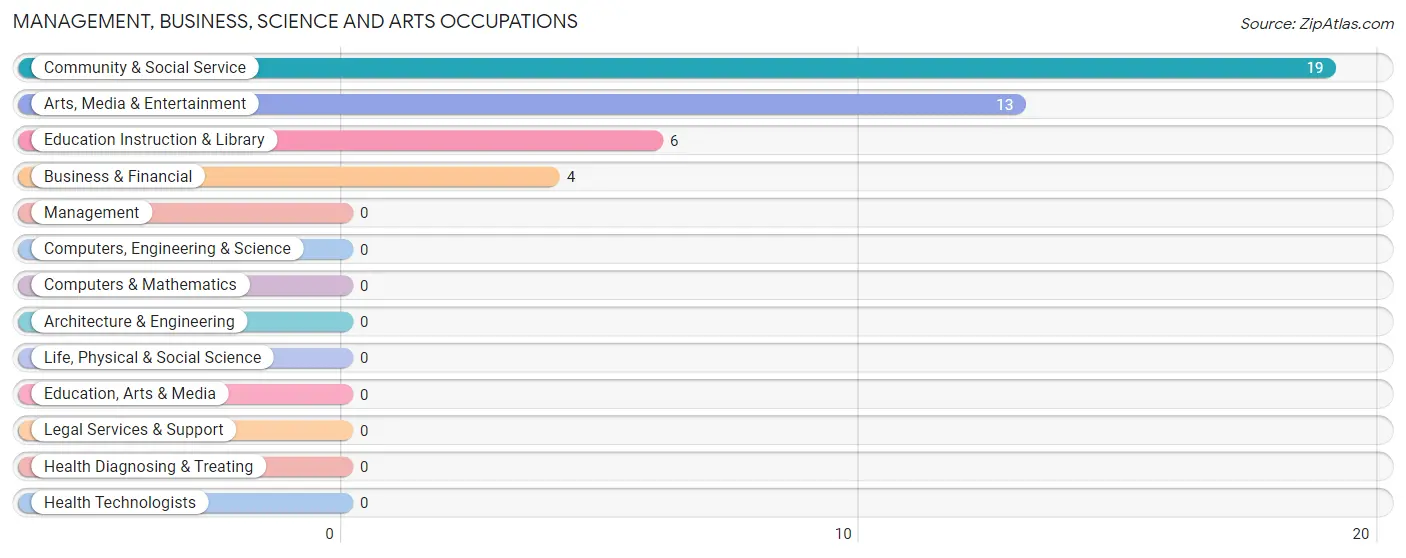
Management, Business, Science and Arts Occupations by Sex
Within the Management, Business, Science and Arts occupations in Gilmore, the most male-oriented occupations are Education Instruction & Library (100.0%), and Community & Social Service (31.6%), while the most female-oriented occupations are Business & Financial (100.0%), Arts, Media & Entertainment (100.0%), and Community & Social Service (68.4%).
| Occupation | Male | Female |
| Management | 0 (0.0%) | 0 (0.0%) |
| Business & Financial | 0 (0.0%) | 4 (100.0%) |
| Computers, Engineering & Science | 0 (0.0%) | 0 (0.0%) |
| Computers & Mathematics | 0 (0.0%) | 0 (0.0%) |
| Architecture & Engineering | 0 (0.0%) | 0 (0.0%) |
| Life, Physical & Social Science | 0 (0.0%) | 0 (0.0%) |
| Community & Social Service | 6 (31.6%) | 13 (68.4%) |
| Education, Arts & Media | 0 (0.0%) | 0 (0.0%) |
| Legal Services & Support | 0 (0.0%) | 0 (0.0%) |
| Education Instruction & Library | 6 (100.0%) | 0 (0.0%) |
| Arts, Media & Entertainment | 0 (0.0%) | 13 (100.0%) |
| Health Diagnosing & Treating | 0 (0.0%) | 0 (0.0%) |
| Health Technologists | 0 (0.0%) | 0 (0.0%) |
| Total (Category) | 6 (26.1%) | 17 (73.9%) |
| Total (Overall) | 110 (50.7%) | 107 (49.3%) |
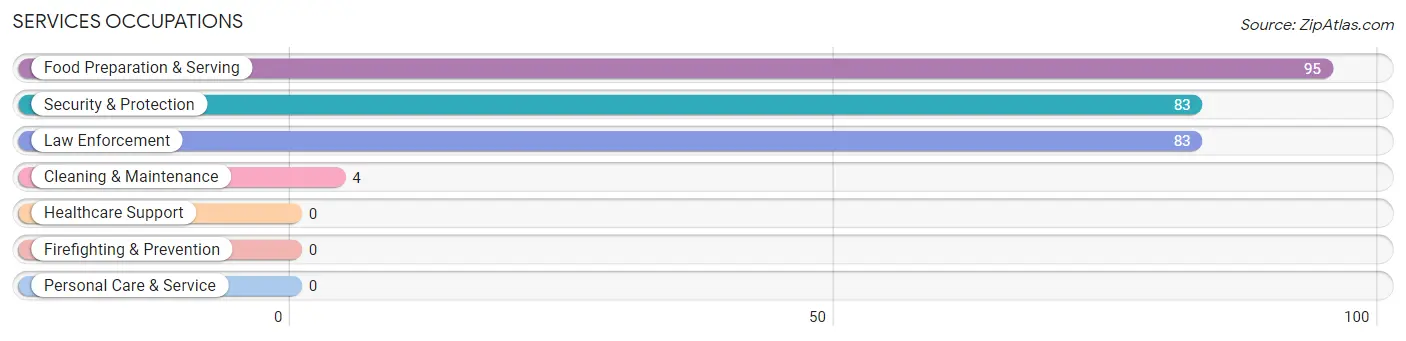
Services Occupations
The most common Services occupations in Gilmore are Food Preparation & Serving (95 | 43.8%), Security & Protection (83 | 38.3%), Law Enforcement (83 | 38.3%), and Cleaning & Maintenance (4 | 1.8%).
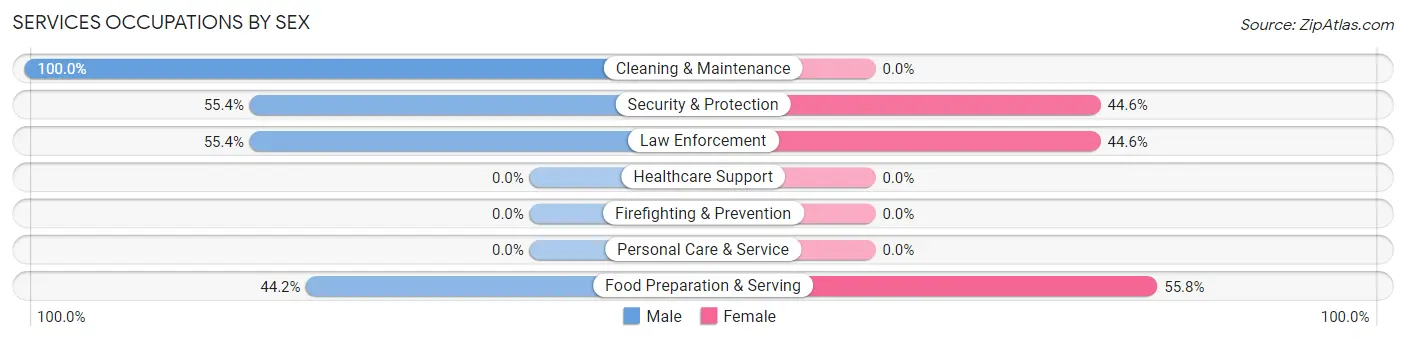
Services Occupations by Sex
Within the Services occupations in Gilmore, the most male-oriented occupations are Cleaning & Maintenance (100.0%), Security & Protection (55.4%), and Law Enforcement (55.4%), while the most female-oriented occupations are Food Preparation & Serving (55.8%), Security & Protection (44.6%), and Law Enforcement (44.6%).
| Occupation | Male | Female |
| Healthcare Support | 0 (0.0%) | 0 (0.0%) |
| Security & Protection | 46 (55.4%) | 37 (44.6%) |
| Firefighting & Prevention | 0 (0.0%) | 0 (0.0%) |
| Law Enforcement | 46 (55.4%) | 37 (44.6%) |
| Food Preparation & Serving | 42 (44.2%) | 53 (55.8%) |
| Cleaning & Maintenance | 4 (100.0%) | 0 (0.0%) |
| Personal Care & Service | 0 (0.0%) | 0 (0.0%) |
| Total (Category) | 92 (50.5%) | 90 (49.4%) |
| Total (Overall) | 110 (50.7%) | 107 (49.3%) |
Sales and Office Occupations
Sales and Office Occupations by Sex
| Occupation | Male | Female |
| Sales & Related | 0 (0.0%) | 0 (0.0%) |
| Office & Administration | 0 (0.0%) | 0 (0.0%) |
| Total (Category) | 0 (0.0%) | 0 (0.0%) |
| Total (Overall) | 110 (50.7%) | 107 (49.3%) |
Natural Resources, Construction and Maintenance Occupations
Natural Resources, Construction and Maintenance Occupations by Sex
| Occupation | Male | Female |
| Farming, Fishing & Forestry | 0 (0.0%) | 0 (0.0%) |
| Construction & Extraction | 0 (0.0%) | 0 (0.0%) |
| Installation, Maintenance & Repair | 0 (0.0%) | 0 (0.0%) |
| Total (Category) | 0 (0.0%) | 0 (0.0%) |
| Total (Overall) | 110 (50.7%) | 107 (49.3%) |
Production, Transportation and Moving Occupations
The most common Production, Transportation and Moving occupations in Gilmore are , and Transportation (12 | 5.5%).
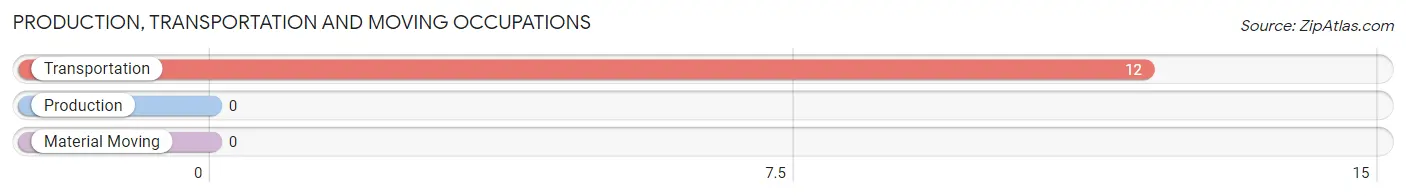
Production, Transportation and Moving Occupations by Sex
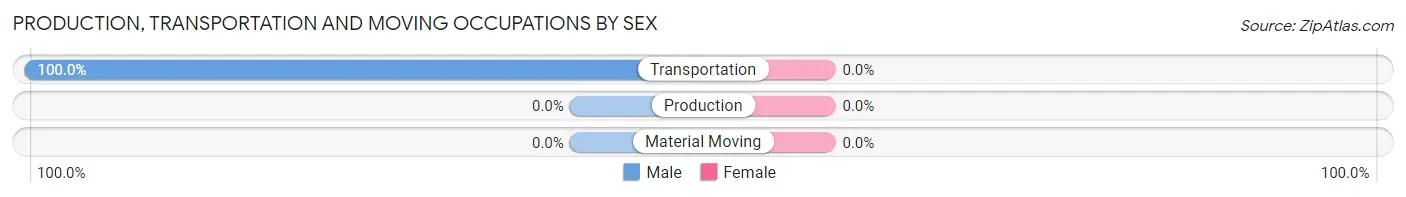
| Occupation | Male | Female |
| Production | 0 (0.0%) | 0 (0.0%) |
| Transportation | 12 (100.0%) | 0 (0.0%) |
| Material Moving | 0 (0.0%) | 0 (0.0%) |
| Total (Category) | 12 (100.0%) | 0 (0.0%) |
| Total (Overall) | 110 (50.7%) | 107 (49.3%) |
Employment Industries by Sex in Gilmore
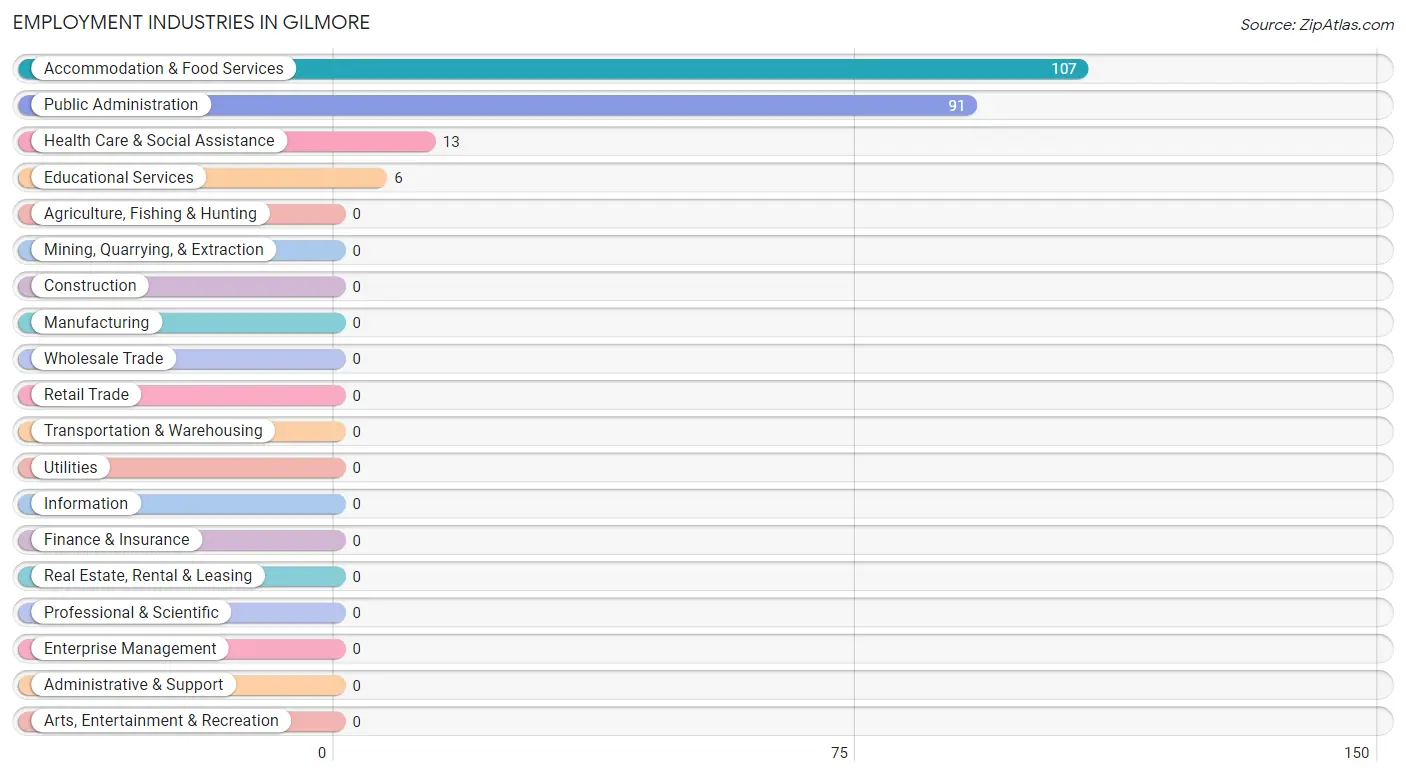
Employment Industries in Gilmore
The major employment industries in Gilmore include Accommodation & Food Services (107 | 49.3%), Public Administration (91 | 41.9%), Health Care & Social Assistance (13 | 6.0%), and Educational Services (6 | 2.8%).
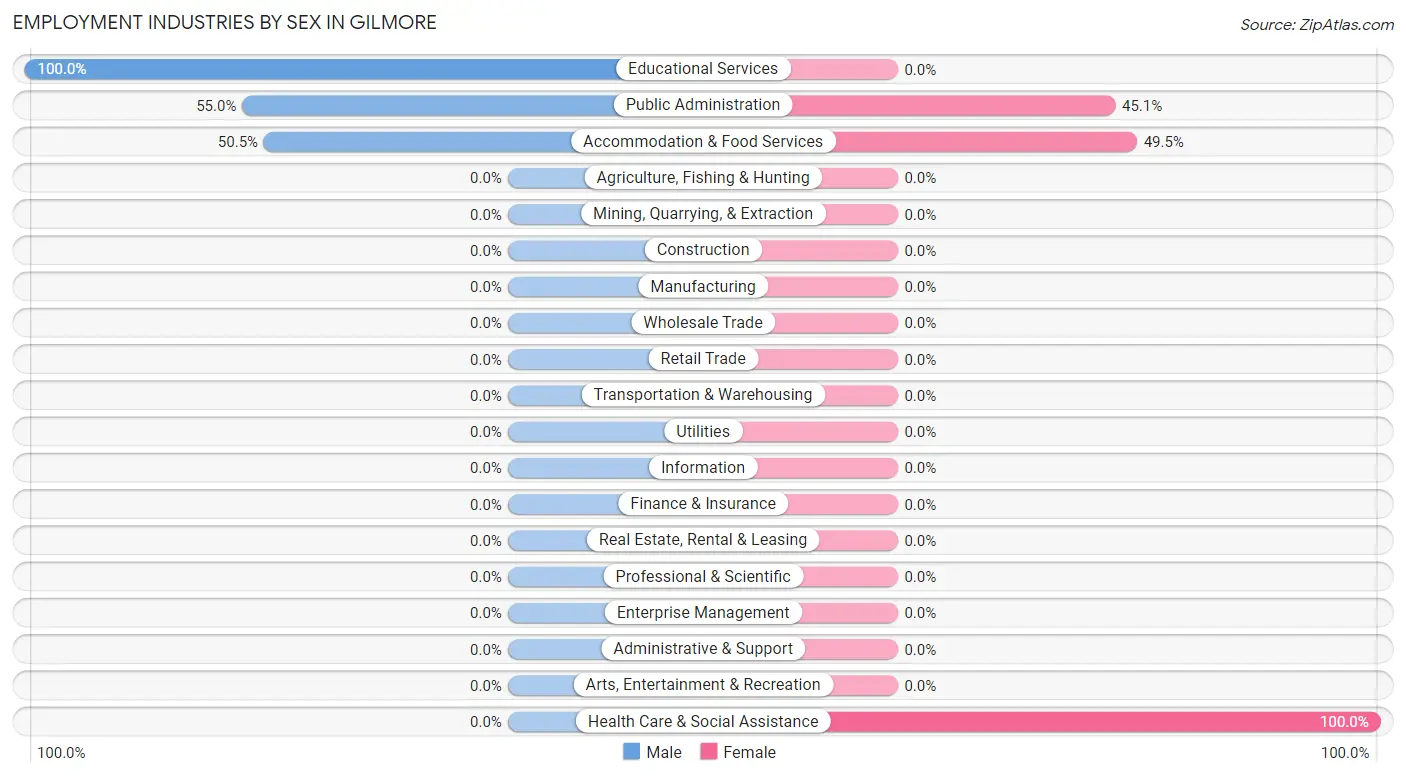
Employment Industries by Sex in Gilmore
The Gilmore industries that see more men than women are Educational Services (100.0%), Public Administration (54.9%), and Accommodation & Food Services (50.5%), whereas the industries that tend to have a higher number of women are Health Care & Social Assistance (100.0%), Accommodation & Food Services (49.5%), and Public Administration (45.1%).
| Industry | Male | Female |
| Agriculture, Fishing & Hunting | 0 (0.0%) | 0 (0.0%) |
| Mining, Quarrying, & Extraction | 0 (0.0%) | 0 (0.0%) |
| Construction | 0 (0.0%) | 0 (0.0%) |
| Manufacturing | 0 (0.0%) | 0 (0.0%) |
| Wholesale Trade | 0 (0.0%) | 0 (0.0%) |
| Retail Trade | 0 (0.0%) | 0 (0.0%) |
| Transportation & Warehousing | 0 (0.0%) | 0 (0.0%) |
| Utilities | 0 (0.0%) | 0 (0.0%) |
| Information | 0 (0.0%) | 0 (0.0%) |
| Finance & Insurance | 0 (0.0%) | 0 (0.0%) |
| Real Estate, Rental & Leasing | 0 (0.0%) | 0 (0.0%) |
| Professional & Scientific | 0 (0.0%) | 0 (0.0%) |
| Enterprise Management | 0 (0.0%) | 0 (0.0%) |
| Administrative & Support | 0 (0.0%) | 0 (0.0%) |
| Educational Services | 6 (100.0%) | 0 (0.0%) |
| Health Care & Social Assistance | 0 (0.0%) | 13 (100.0%) |
| Arts, Entertainment & Recreation | 0 (0.0%) | 0 (0.0%) |
| Accommodation & Food Services | 54 (50.5%) | 53 (49.5%) |
| Public Administration | 50 (54.9%) | 41 (45.1%) |
| Total | 110 (50.7%) | 107 (49.3%) |
Education in Gilmore
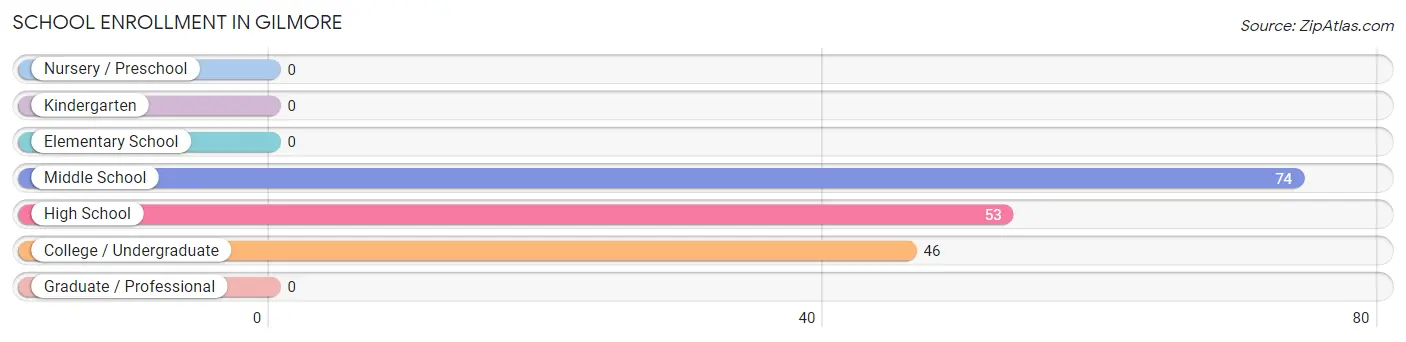
School Enrollment in Gilmore
The most common levels of schooling among the 173 students in Gilmore are middle school (74 | 42.8%), high school (53 | 30.6%), and college / undergraduate (46 | 26.6%).
| School Level | # Students | % Students |
| Nursery / Preschool | 0 | 0.0% |
| Kindergarten | 0 | 0.0% |
| Elementary School | 0 | 0.0% |
| Middle School | 74 | 42.8% |
| High School | 53 | 30.6% |
| College / Undergraduate | 46 | 26.6% |
| Graduate / Professional | 0 | 0.0% |
| Total | 173 | 100.0% |
School Enrollment by Age by Funding Source in Gilmore
Out of a total of 173 students who are enrolled in schools in Gilmore, 74 (42.8%) attend a private institution, while the remaining 99 (57.2%) are enrolled in public schools. The age group of 5 to 9 year old has the highest likelihood of being enrolled in private schools, with 24 (100.0% in the age bracket) enrolled. Conversely, the age group of 15 to 17 year olds has the lowest likelihood of being enrolled in a private school, with 53 (100.0% in the age bracket) attending a public institution.
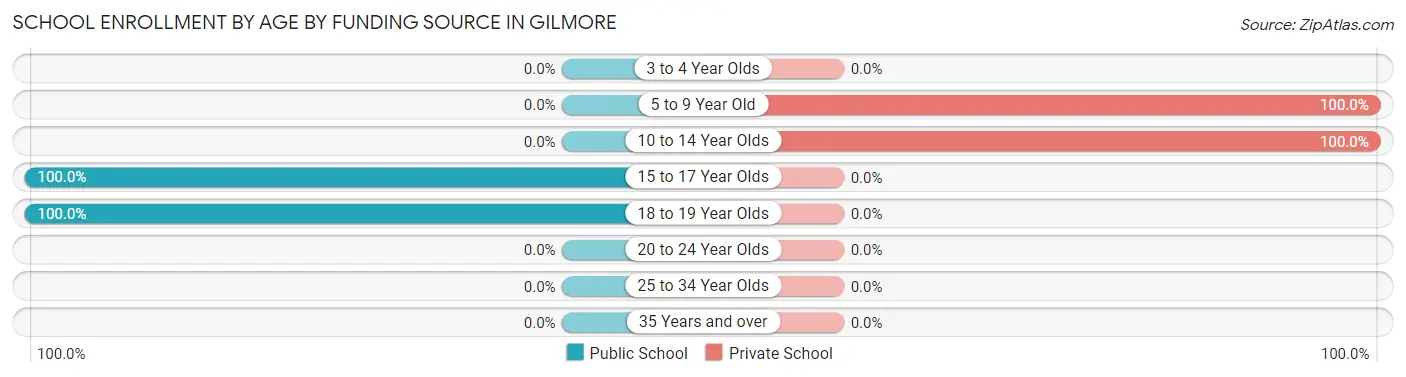
| Age Bracket | Public School | Private School |
| 3 to 4 Year Olds | 0 (0.0%) | 0 (0.0%) |
| 5 to 9 Year Old | 0 (0.0%) | 24 (100.0%) |
| 10 to 14 Year Olds | 0 (0.0%) | 50 (100.0%) |
| 15 to 17 Year Olds | 53 (100.0%) | 0 (0.0%) |
| 18 to 19 Year Olds | 46 (100.0%) | 0 (0.0%) |
| 20 to 24 Year Olds | 0 (0.0%) | 0 (0.0%) |
| 25 to 34 Year Olds | 0 (0.0%) | 0 (0.0%) |
| 35 Years and over | 0 (0.0%) | 0 (0.0%) |
| Total | 99 (57.2%) | 74 (42.8%) |
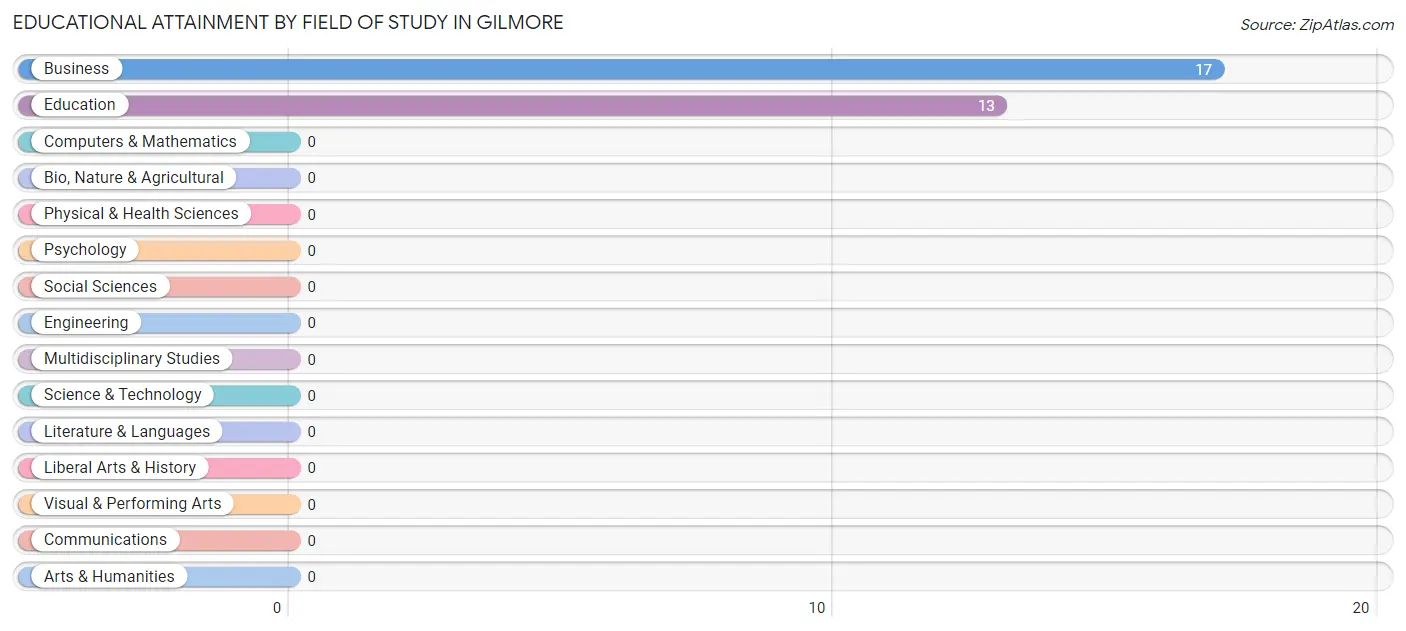
Educational Attainment by Field of Study in Gilmore
Business (17 | 56.7%), and education (13 | 43.3%) are the most common fields of study among 30 individuals in Gilmore who have obtained a bachelor's degree or higher.
| Field of Study | # Graduates | % Graduates |
| Computers & Mathematics | 0 | 0.0% |
| Bio, Nature & Agricultural | 0 | 0.0% |
| Physical & Health Sciences | 0 | 0.0% |
| Psychology | 0 | 0.0% |
| Social Sciences | 0 | 0.0% |
| Engineering | 0 | 0.0% |
| Multidisciplinary Studies | 0 | 0.0% |
| Science & Technology | 0 | 0.0% |
| Business | 17 | 56.7% |
| Education | 13 | 43.3% |
| Literature & Languages | 0 | 0.0% |
| Liberal Arts & History | 0 | 0.0% |
| Visual & Performing Arts | 0 | 0.0% |
| Communications | 0 | 0.0% |
| Arts & Humanities | 0 | 0.0% |
| Total | 30 | 100.0% |
Transportation & Commute in Gilmore
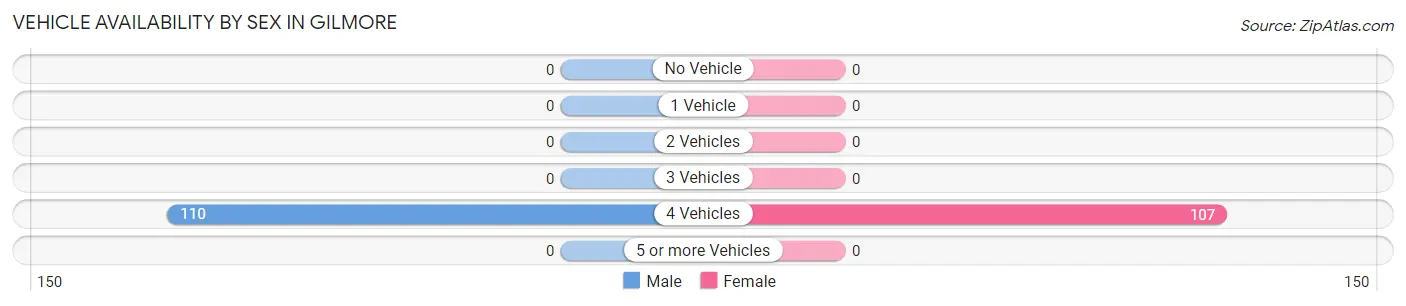
Vehicle Availability by Sex in Gilmore
The most prevalent vehicle ownership categories in Gilmore are males with 4 vehicles (110, accounting for 100.0%) and females with 4 vehicles (107, making up 102.8%).
| Vehicles Available | Male | Female |
| No Vehicle | 0 (0.0%) | 0 (0.0%) |
| 1 Vehicle | 0 (0.0%) | 0 (0.0%) |
| 2 Vehicles | 0 (0.0%) | 0 (0.0%) |
| 3 Vehicles | 0 (0.0%) | 0 (0.0%) |
| 4 Vehicles | 110 (100.0%) | 107 (100.0%) |
| 5 or more Vehicles | 0 (0.0%) | 0 (0.0%) |
| Total | 110 (100.0%) | 107 (100.0%) |
Commute Time in Gilmore
The most frequently occuring commute durations in Gilmore are 15 to 19 minutes (107 commuters, 49.3%), 20 to 24 minutes (46 commuters, 21.2%), and 45 to 59 minutes (37 commuters, 17.1%).
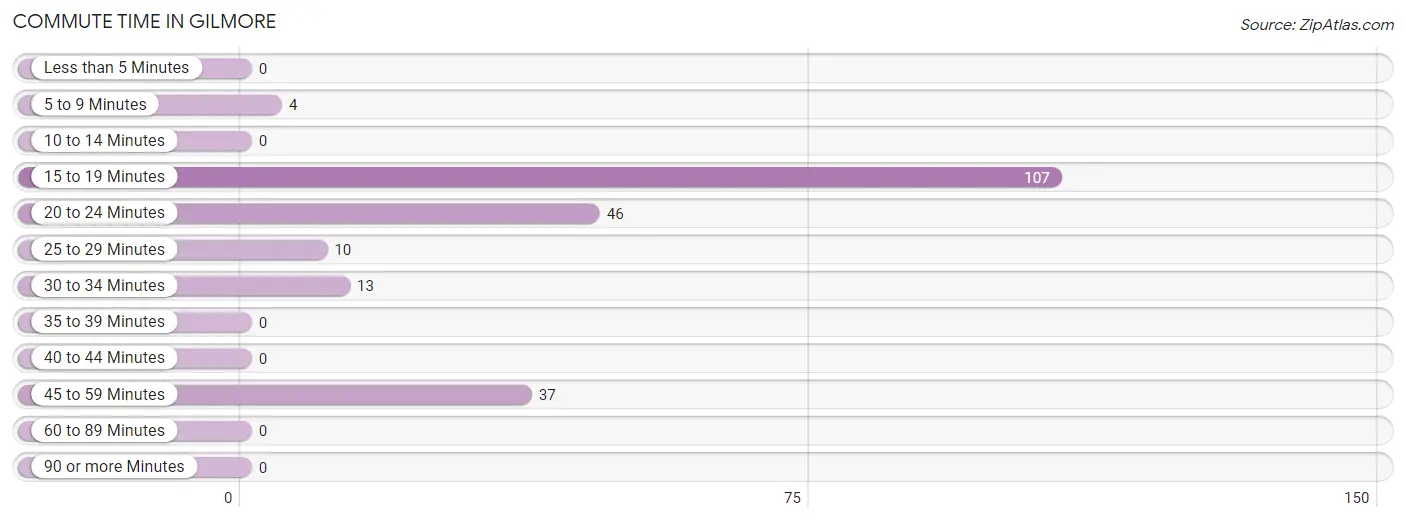
| Commute Time | # Commuters | % Commuters |
| Less than 5 Minutes | 0 | 0.0% |
| 5 to 9 Minutes | 4 | 1.8% |
| 10 to 14 Minutes | 0 | 0.0% |
| 15 to 19 Minutes | 107 | 49.3% |
| 20 to 24 Minutes | 46 | 21.2% |
| 25 to 29 Minutes | 10 | 4.6% |
| 30 to 34 Minutes | 13 | 6.0% |
| 35 to 39 Minutes | 0 | 0.0% |
| 40 to 44 Minutes | 0 | 0.0% |
| 45 to 59 Minutes | 37 | 17.1% |
| 60 to 89 Minutes | 0 | 0.0% |
| 90 or more Minutes | 0 | 0.0% |
Commute Time by Sex in Gilmore
The most common commute times in Gilmore are 15 to 19 minutes (54 commuters, 49.1%) for males and 15 to 19 minutes (53 commuters, 49.5%) for females.
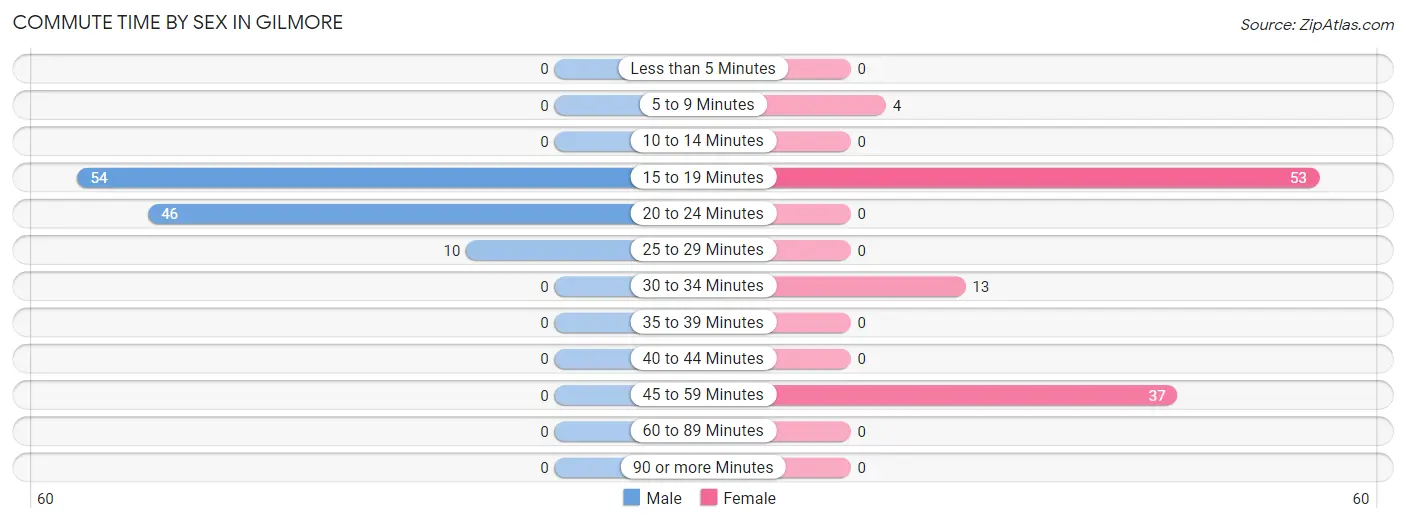
| Commute Time | Male | Female |
| Less than 5 Minutes | 0 (0.0%) | 0 (0.0%) |
| 5 to 9 Minutes | 0 (0.0%) | 4 (3.7%) |
| 10 to 14 Minutes | 0 (0.0%) | 0 (0.0%) |
| 15 to 19 Minutes | 54 (49.1%) | 53 (49.5%) |
| 20 to 24 Minutes | 46 (41.8%) | 0 (0.0%) |
| 25 to 29 Minutes | 10 (9.1%) | 0 (0.0%) |
| 30 to 34 Minutes | 0 (0.0%) | 13 (12.1%) |
| 35 to 39 Minutes | 0 (0.0%) | 0 (0.0%) |
| 40 to 44 Minutes | 0 (0.0%) | 0 (0.0%) |
| 45 to 59 Minutes | 0 (0.0%) | 37 (34.6%) |
| 60 to 89 Minutes | 0 (0.0%) | 0 (0.0%) |
| 90 or more Minutes | 0 (0.0%) | 0 (0.0%) |
Time of Departure to Work by Sex in Gilmore
The most frequent times of departure to work in Gilmore are 6:30 AM to 6:59 AM (46, 41.8%) for males and 4:00 PM to 11:59 PM (53, 49.5%) for females.
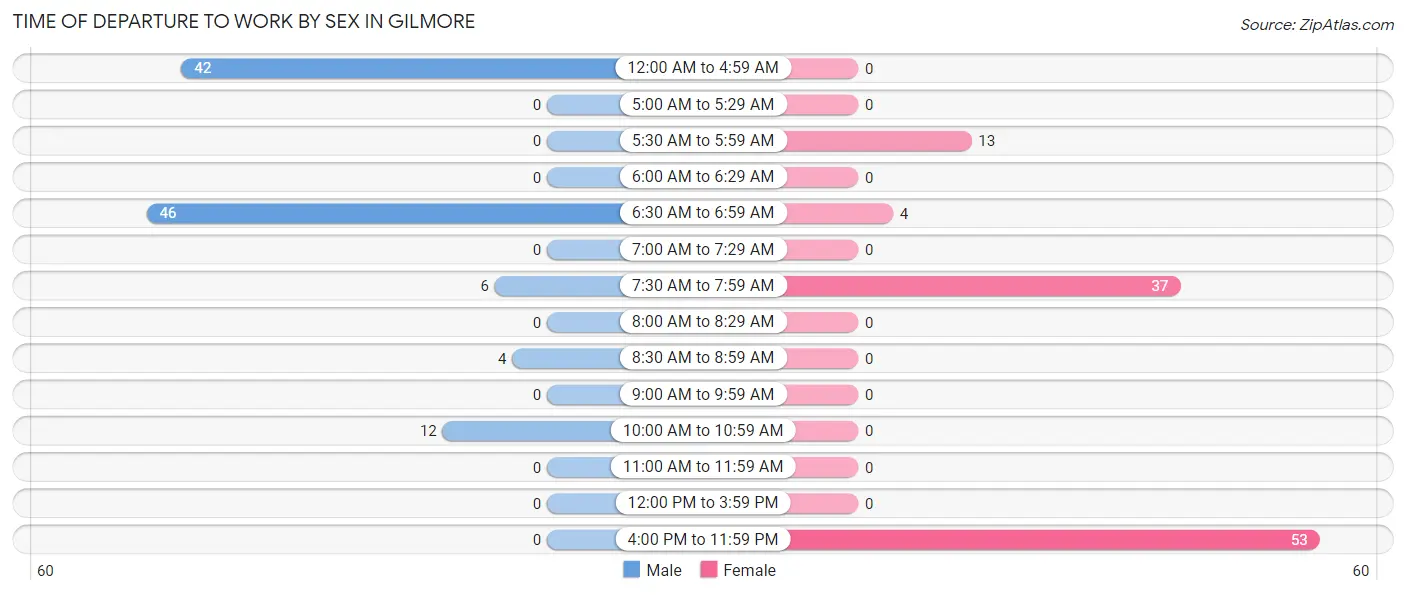
| Time of Departure | Male | Female |
| 12:00 AM to 4:59 AM | 42 (38.2%) | 0 (0.0%) |
| 5:00 AM to 5:29 AM | 0 (0.0%) | 0 (0.0%) |
| 5:30 AM to 5:59 AM | 0 (0.0%) | 13 (12.1%) |
| 6:00 AM to 6:29 AM | 0 (0.0%) | 0 (0.0%) |
| 6:30 AM to 6:59 AM | 46 (41.8%) | 4 (3.7%) |
| 7:00 AM to 7:29 AM | 0 (0.0%) | 0 (0.0%) |
| 7:30 AM to 7:59 AM | 6 (5.4%) | 37 (34.6%) |
| 8:00 AM to 8:29 AM | 0 (0.0%) | 0 (0.0%) |
| 8:30 AM to 8:59 AM | 4 (3.6%) | 0 (0.0%) |
| 9:00 AM to 9:59 AM | 0 (0.0%) | 0 (0.0%) |
| 10:00 AM to 10:59 AM | 12 (10.9%) | 0 (0.0%) |
| 11:00 AM to 11:59 AM | 0 (0.0%) | 0 (0.0%) |
| 12:00 PM to 3:59 PM | 0 (0.0%) | 0 (0.0%) |
| 4:00 PM to 11:59 PM | 0 (0.0%) | 53 (49.5%) |
| Total | 110 (100.0%) | 107 (100.0%) |
Housing Occupancy in Gilmore
Occupancy by Ownership in Gilmore
Of the total 83 dwellings in Gilmore, owner-occupied units account for 83 (100.0%), while renter-occupied units make up 0 (0.0%).
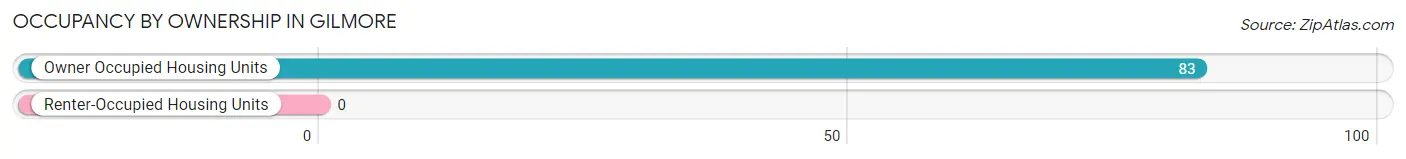
| Occupancy | # Housing Units | % Housing Units |
| Owner Occupied Housing Units | 83 | 100.0% |
| Renter-Occupied Housing Units | 0 | 0.0% |
| Total Occupied Housing Units | 83 | 100.0% |
Occupancy by Household Size in Gilmore
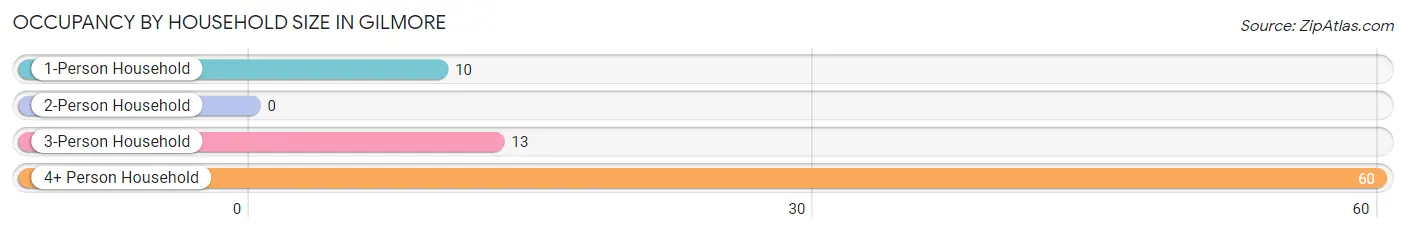
| Household Size | # Housing Units | % Housing Units |
| 1-Person Household | 10 | 12.0% |
| 2-Person Household | 0 | 0.0% |
| 3-Person Household | 13 | 15.7% |
| 4+ Person Household | 60 | 72.3% |
| Total Housing Units | 83 | 100.0% |
Occupancy by Ownership by Household Size in Gilmore
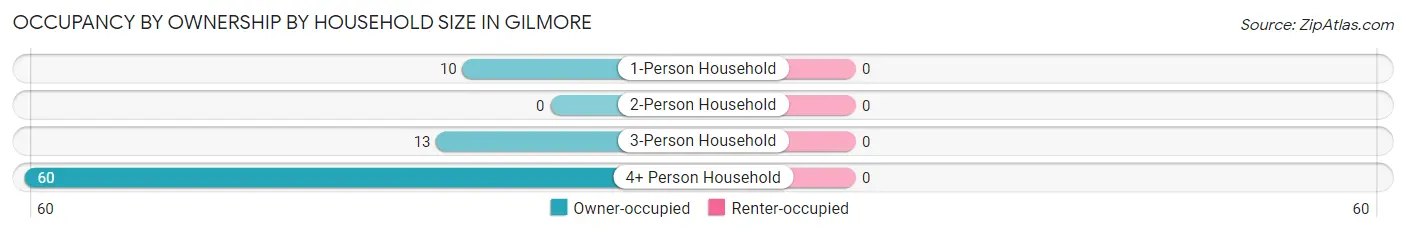
| Household Size | Owner-occupied | Renter-occupied |
| 1-Person Household | 10 (100.0%) | 0 (0.0%) |
| 2-Person Household | 0 (0.0%) | 0 (0.0%) |
| 3-Person Household | 13 (100.0%) | 0 (0.0%) |
| 4+ Person Household | 60 (100.0%) | 0 (0.0%) |
| Total Housing Units | 83 (100.0%) | 0 (0.0%) |
Occupancy by Educational Attainment in Gilmore
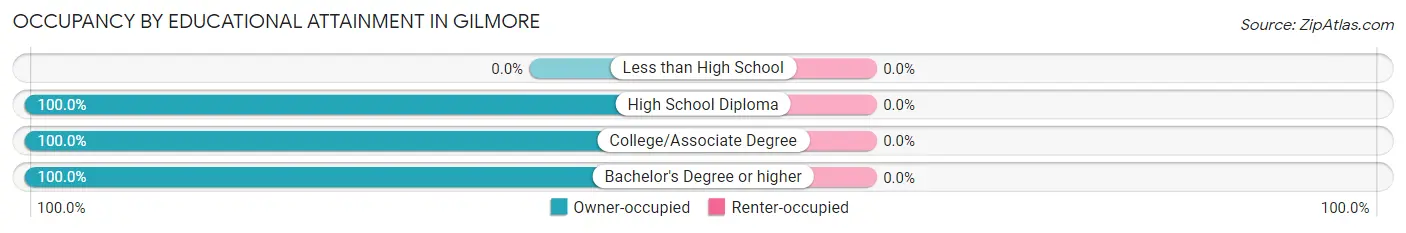
| Household Size | Owner-occupied | Renter-occupied |
| Less than High School | 0 (0.0%) | 0 (0.0%) |
| High School Diploma | 51 (100.0%) | 0 (0.0%) |
| College/Associate Degree | 19 (100.0%) | 0 (0.0%) |
| Bachelor's Degree or higher | 13 (100.0%) | 0 (0.0%) |
Occupancy by Age of Householder in Gilmore
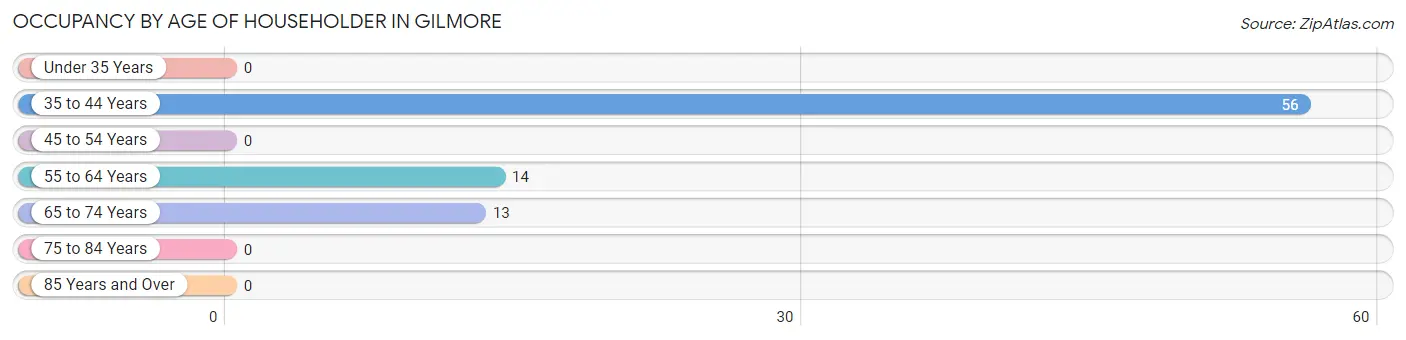
| Age Bracket | # Households | % Households |
| Under 35 Years | 0 | 0.0% |
| 35 to 44 Years | 56 | 67.5% |
| 45 to 54 Years | 0 | 0.0% |
| 55 to 64 Years | 14 | 16.9% |
| 65 to 74 Years | 13 | 15.7% |
| 75 to 84 Years | 0 | 0.0% |
| 85 Years and Over | 0 | 0.0% |
| Total | 83 | 100.0% |
Housing Finances in Gilmore
Median Income by Occupancy in Gilmore
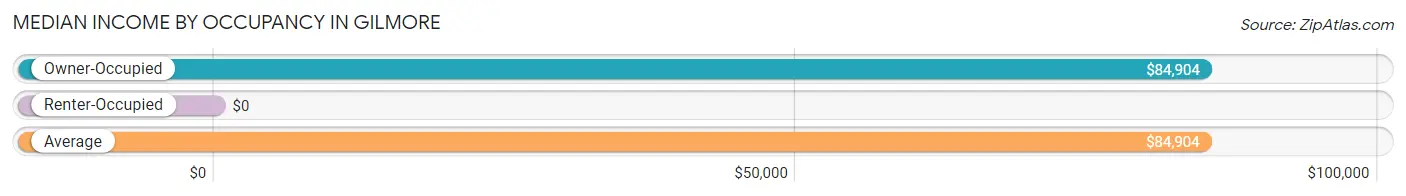
| Occupancy Type | # Households | Median Income |
| Owner-Occupied | 83 (100.0%) | $84,904 |
| Renter-Occupied | 0 (0.0%) | $0 |
| Average | 83 (100.0%) | $84,904 |
Occupancy by Householder Income Bracket in Gilmore
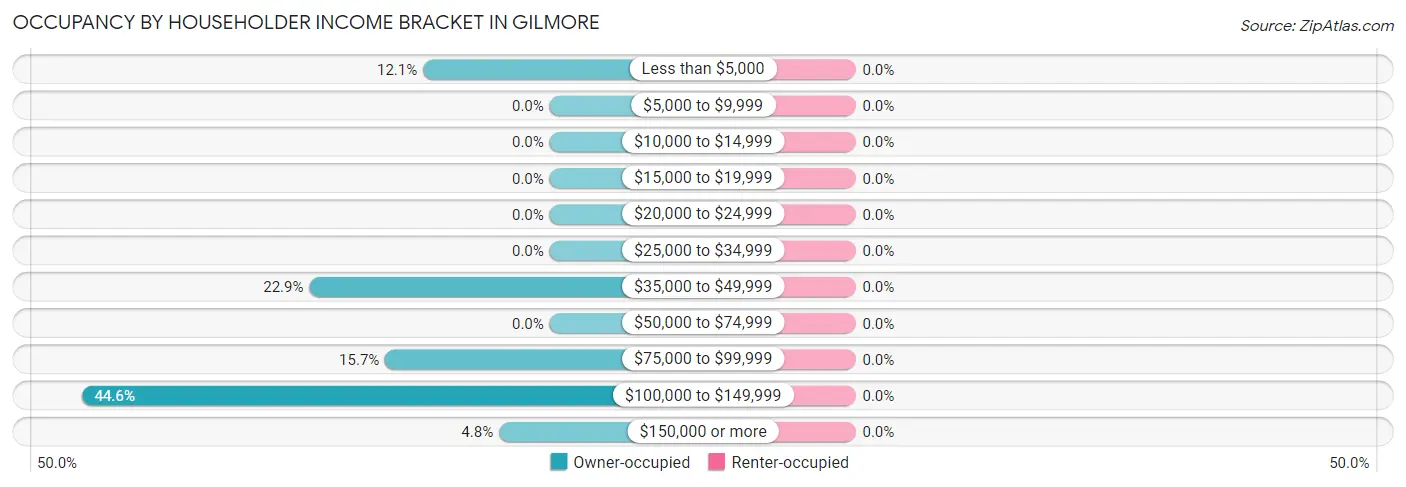
| Income Bracket | Owner-occupied | Renter-occupied |
| Less than $5,000 | 10 (12.0%) | 0 (0.0%) |
| $5,000 to $9,999 | 0 (0.0%) | 0 (0.0%) |
| $10,000 to $14,999 | 0 (0.0%) | 0 (0.0%) |
| $15,000 to $19,999 | 0 (0.0%) | 0 (0.0%) |
| $20,000 to $24,999 | 0 (0.0%) | 0 (0.0%) |
| $25,000 to $34,999 | 0 (0.0%) | 0 (0.0%) |
| $35,000 to $49,999 | 19 (22.9%) | 0 (0.0%) |
| $50,000 to $74,999 | 0 (0.0%) | 0 (0.0%) |
| $75,000 to $99,999 | 13 (15.7%) | 0 (0.0%) |
| $100,000 to $149,999 | 37 (44.6%) | 0 (0.0%) |
| $150,000 or more | 4 (4.8%) | 0 (0.0%) |
| Total | 83 (100.0%) | 0 (0.0%) |
Monthly Housing Cost Tiers in Gilmore
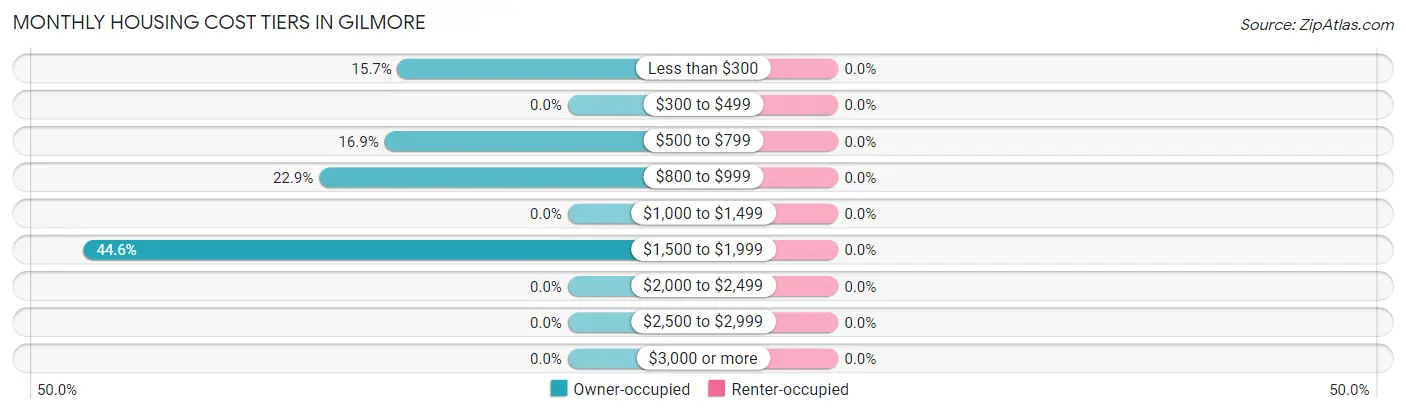
| Monthly Cost | Owner-occupied | Renter-occupied |
| Less than $300 | 13 (15.7%) | 0 (0.0%) |
| $300 to $499 | 0 (0.0%) | 0 (0.0%) |
| $500 to $799 | 14 (16.9%) | 0 (0.0%) |
| $800 to $999 | 19 (22.9%) | 0 (0.0%) |
| $1,000 to $1,499 | 0 (0.0%) | 0 (0.0%) |
| $1,500 to $1,999 | 37 (44.6%) | 0 (0.0%) |
| $2,000 to $2,499 | 0 (0.0%) | 0 (0.0%) |
| $2,500 to $2,999 | 0 (0.0%) | 0 (0.0%) |
| $3,000 or more | 0 (0.0%) | 0 (0.0%) |
| Total | 83 (100.0%) | 0 (0.0%) |
Physical Housing Characteristics in Gilmore
Housing Structures in Gilmore
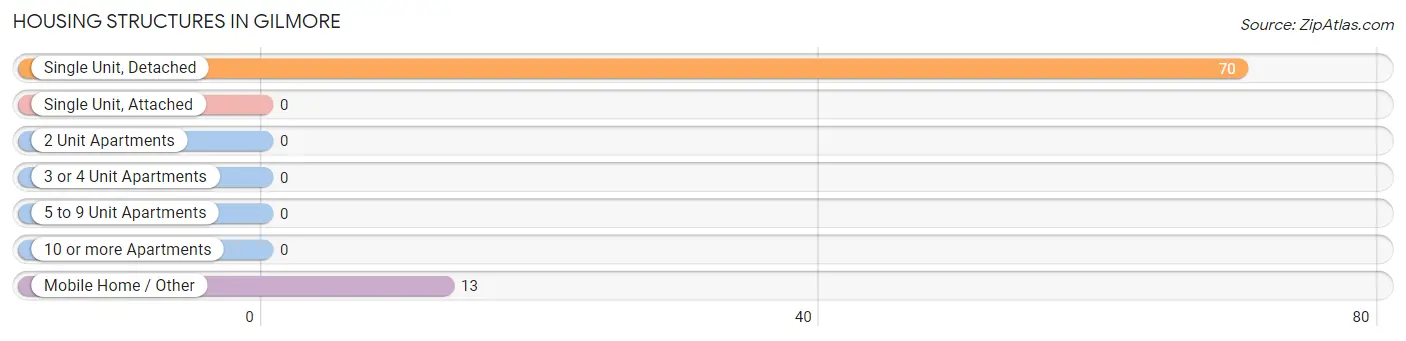
| Structure Type | # Housing Units | % Housing Units |
| Single Unit, Detached | 70 | 84.3% |
| Single Unit, Attached | 0 | 0.0% |
| 2 Unit Apartments | 0 | 0.0% |
| 3 or 4 Unit Apartments | 0 | 0.0% |
| 5 to 9 Unit Apartments | 0 | 0.0% |
| 10 or more Apartments | 0 | 0.0% |
| Mobile Home / Other | 13 | 15.7% |
| Total | 83 | 100.0% |
Housing Structures by Occupancy in Gilmore
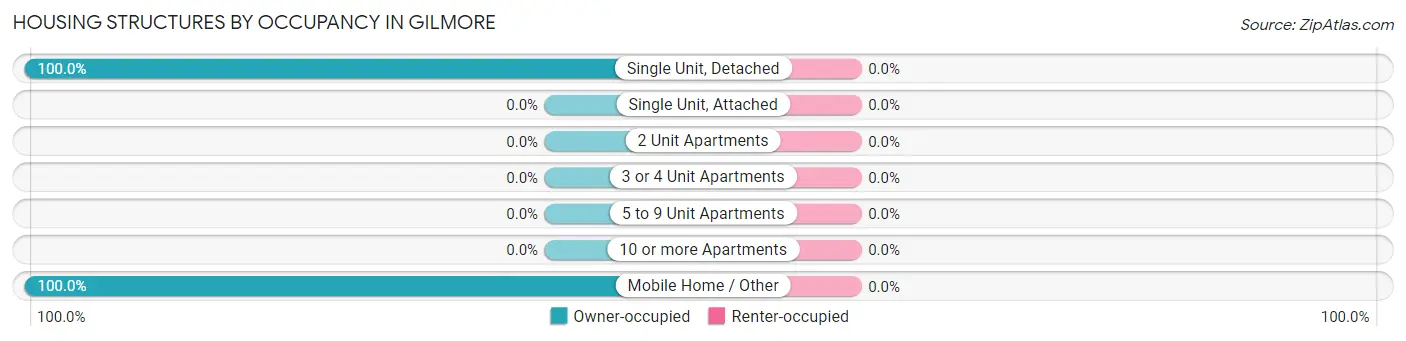
| Structure Type | Owner-occupied | Renter-occupied |
| Single Unit, Detached | 70 (100.0%) | 0 (0.0%) |
| Single Unit, Attached | 0 (0.0%) | 0 (0.0%) |
| 2 Unit Apartments | 0 (0.0%) | 0 (0.0%) |
| 3 or 4 Unit Apartments | 0 (0.0%) | 0 (0.0%) |
| 5 to 9 Unit Apartments | 0 (0.0%) | 0 (0.0%) |
| 10 or more Apartments | 0 (0.0%) | 0 (0.0%) |
| Mobile Home / Other | 13 (100.0%) | 0 (0.0%) |
| Total | 83 (100.0%) | 0 (0.0%) |
Housing Structures by Number of Rooms in Gilmore
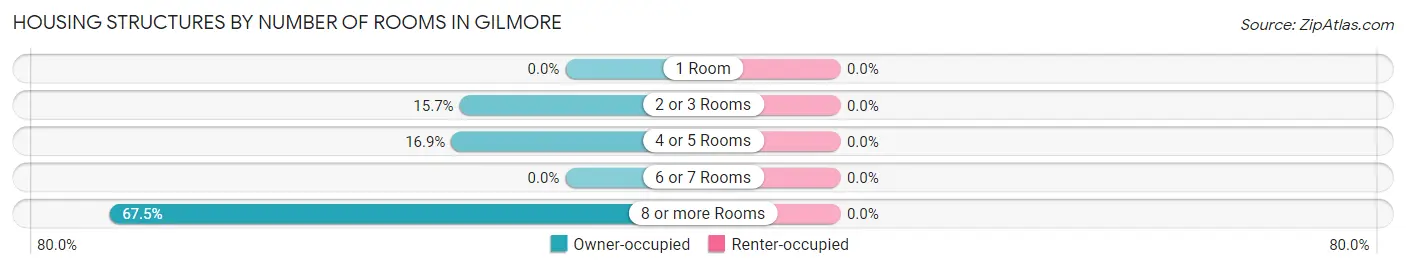
| Number of Rooms | Owner-occupied | Renter-occupied |
| 1 Room | 0 (0.0%) | 0 (0.0%) |
| 2 or 3 Rooms | 13 (15.7%) | 0 (0.0%) |
| 4 or 5 Rooms | 14 (16.9%) | 0 (0.0%) |
| 6 or 7 Rooms | 0 (0.0%) | 0 (0.0%) |
| 8 or more Rooms | 56 (67.5%) | 0 (0.0%) |
| Total | 83 (100.0%) | 0 (0.0%) |
Housing Structure by Heating Type in Gilmore
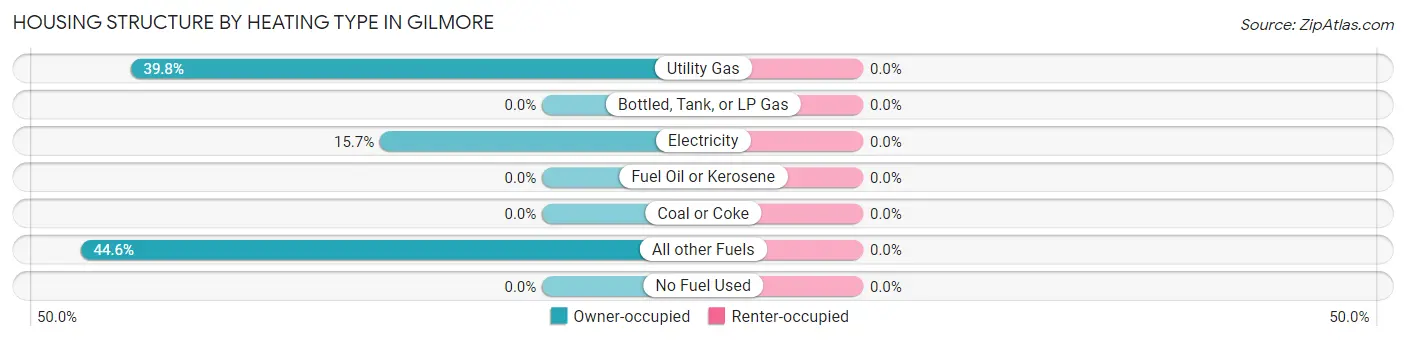
| Heating Type | Owner-occupied | Renter-occupied |
| Utility Gas | 33 (39.8%) | 0 (0.0%) |
| Bottled, Tank, or LP Gas | 0 (0.0%) | 0 (0.0%) |
| Electricity | 13 (15.7%) | 0 (0.0%) |
| Fuel Oil or Kerosene | 0 (0.0%) | 0 (0.0%) |
| Coal or Coke | 0 (0.0%) | 0 (0.0%) |
| All other Fuels | 37 (44.6%) | 0 (0.0%) |
| No Fuel Used | 0 (0.0%) | 0 (0.0%) |
| Total | 83 (100.0%) | 0 (0.0%) |
Household Vehicle Usage in Gilmore
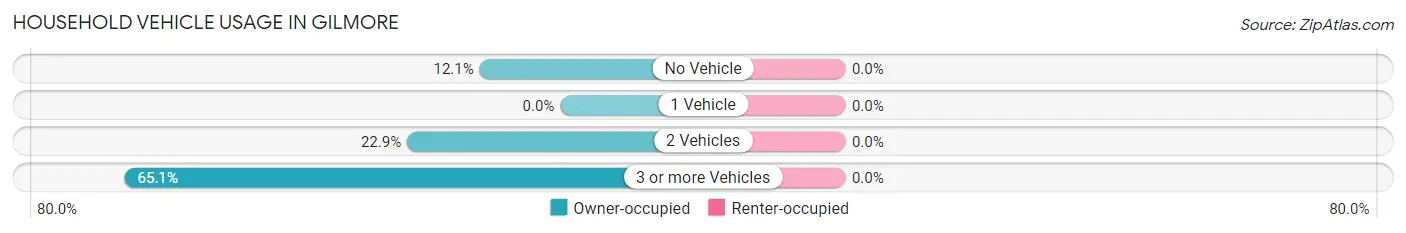
| Vehicles per Household | Owner-occupied | Renter-occupied |
| No Vehicle | 10 (12.0%) | 0 (0.0%) |
| 1 Vehicle | 0 (0.0%) | 0 (0.0%) |
| 2 Vehicles | 19 (22.9%) | 0 (0.0%) |
| 3 or more Vehicles | 54 (65.1%) | 0 (0.0%) |
| Total | 83 (100.0%) | 0 (0.0%) |
Real Estate & Mortgages in Gilmore
Real Estate and Mortgage Overview in Gilmore
| Characteristic | Without Mortgage | With Mortgage |
| Housing Units | 17 | 66 |
| Median Property Value | - | - |
| Median Household Income | - | - |
| Monthly Housing Costs | - | - |
| Real Estate Taxes | - | - |
Property Value by Mortgage Status in Gilmore
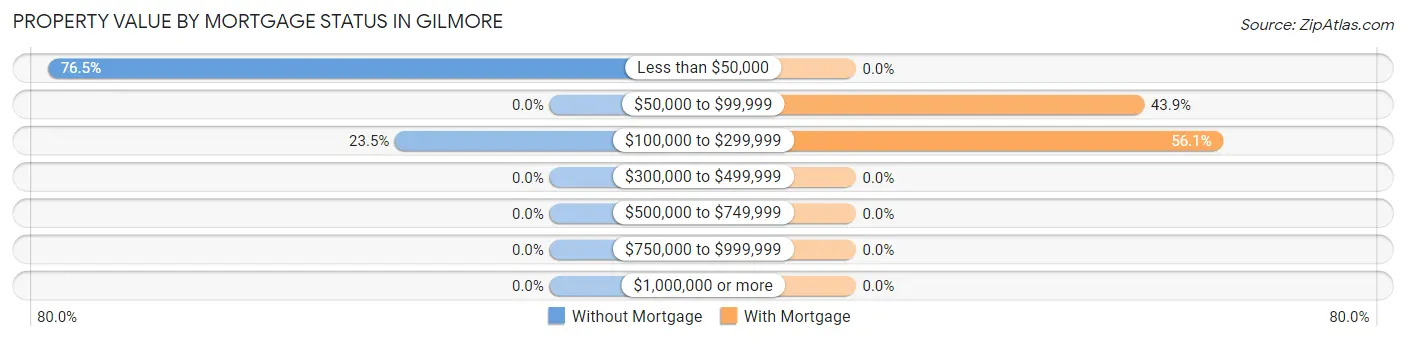
| Property Value | Without Mortgage | With Mortgage |
| Less than $50,000 | 13 (76.5%) | 0 (0.0%) |
| $50,000 to $99,999 | 0 (0.0%) | 29 (43.9%) |
| $100,000 to $299,999 | 4 (23.5%) | 37 (56.1%) |
| $300,000 to $499,999 | 0 (0.0%) | 0 (0.0%) |
| $500,000 to $749,999 | 0 (0.0%) | 0 (0.0%) |
| $750,000 to $999,999 | 0 (0.0%) | 0 (0.0%) |
| $1,000,000 or more | 0 (0.0%) | 0 (0.0%) |
| Total | 17 (100.0%) | 66 (100.0%) |
Household Income by Mortgage Status in Gilmore
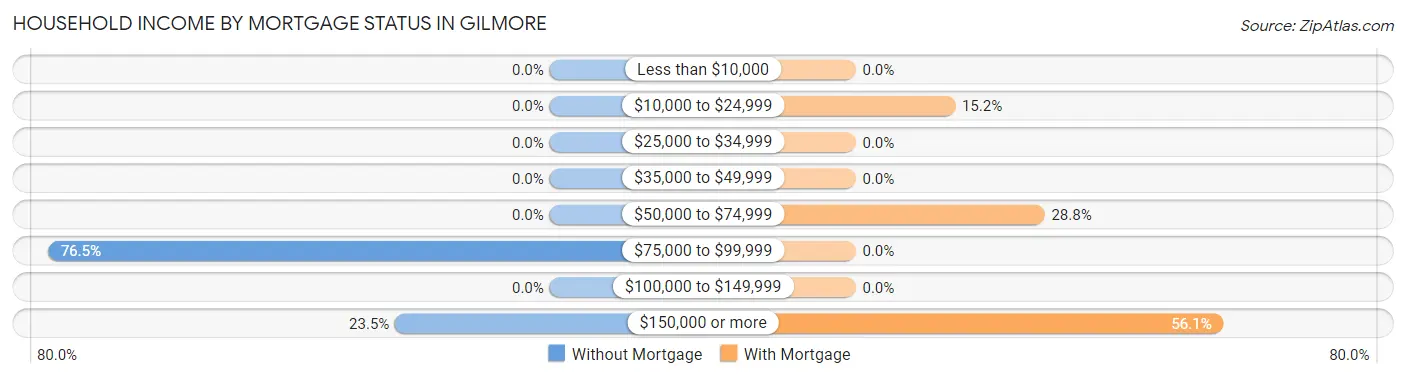
| Household Income | Without Mortgage | With Mortgage |
| Less than $10,000 | 0 (0.0%) | 0 (0.0%) |
| $10,000 to $24,999 | 0 (0.0%) | 10 (15.1%) |
| $25,000 to $34,999 | 0 (0.0%) | 0 (0.0%) |
| $35,000 to $49,999 | 0 (0.0%) | 0 (0.0%) |
| $50,000 to $74,999 | 0 (0.0%) | 19 (28.8%) |
| $75,000 to $99,999 | 13 (76.5%) | 0 (0.0%) |
| $100,000 to $149,999 | 0 (0.0%) | 0 (0.0%) |
| $150,000 or more | 4 (23.5%) | 37 (56.1%) |
| Total | 17 (100.0%) | 66 (100.0%) |
Property Value to Household Income Ratio in Gilmore
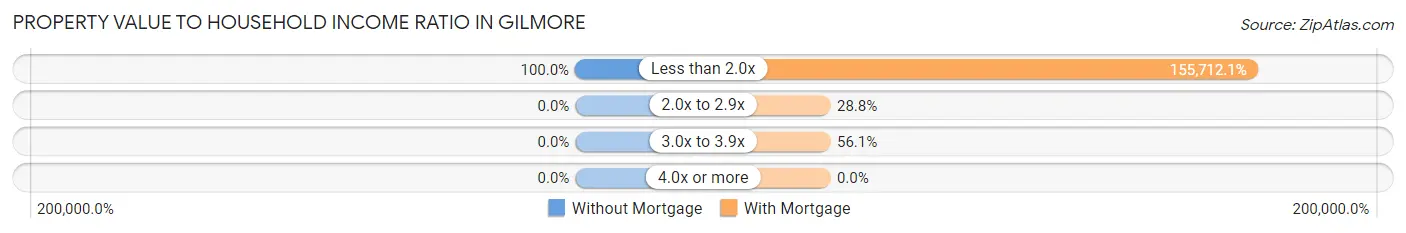
| Value-to-Income Ratio | Without Mortgage | With Mortgage |
| Less than 2.0x | 17 (100.0%) | 102,770 (155,712.1%) |
| 2.0x to 2.9x | 0 (0.0%) | 19 (28.8%) |
| 3.0x to 3.9x | 0 (0.0%) | 37 (56.1%) |
| 4.0x or more | 0 (0.0%) | 0 (0.0%) |
| Total | 17 (100.0%) | 66 (100.0%) |
Real Estate Taxes by Mortgage Status in Gilmore
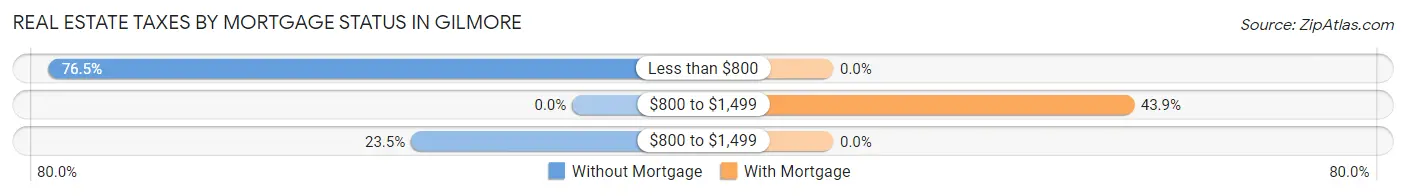
| Property Taxes | Without Mortgage | With Mortgage |
| Less than $800 | 13 (76.5%) | 0 (0.0%) |
| $800 to $1,499 | 0 (0.0%) | 29 (43.9%) |
| $800 to $1,499 | 4 (23.5%) | 0 (0.0%) |
| Total | 17 (100.0%) | 66 (100.0%) |
Health & Disability in Gilmore
Health Insurance Coverage by Age in Gilmore
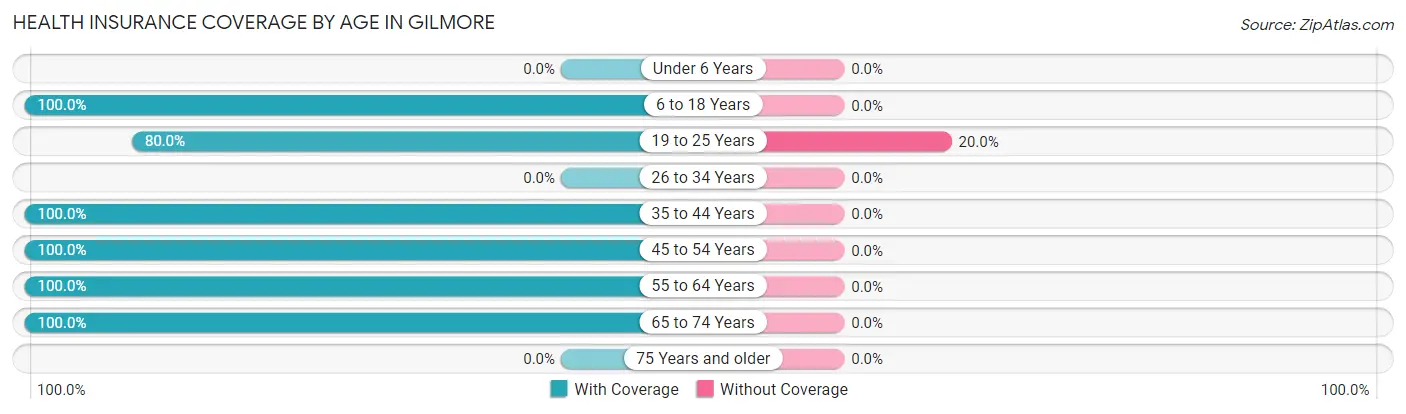
| Age Bracket | With Coverage | Without Coverage |
| Under 6 Years | 0 (0.0%) | 0 (0.0%) |
| 6 to 18 Years | 131 (100.0%) | 0 (0.0%) |
| 19 to 25 Years | 48 (80.0%) | 12 (20.0%) |
| 26 to 34 Years | 0 (0.0%) | 0 (0.0%) |
| 35 to 44 Years | 102 (100.0%) | 0 (0.0%) |
| 45 to 54 Years | 26 (100.0%) | 0 (0.0%) |
| 55 to 64 Years | 14 (100.0%) | 0 (0.0%) |
| 65 to 74 Years | 26 (100.0%) | 0 (0.0%) |
| 75 Years and older | 0 (0.0%) | 0 (0.0%) |
| Total | 347 (96.7%) | 12 (3.3%) |
Health Insurance Coverage by Citizenship Status in Gilmore
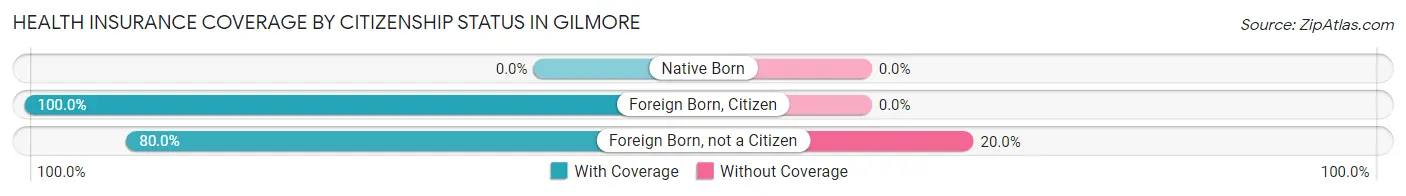
| Citizenship Status | With Coverage | Without Coverage |
| Native Born | 0 (0.0%) | 0 (0.0%) |
| Foreign Born, Citizen | 131 (100.0%) | 0 (0.0%) |
| Foreign Born, not a Citizen | 48 (80.0%) | 12 (20.0%) |
Health Insurance Coverage by Household Income in Gilmore
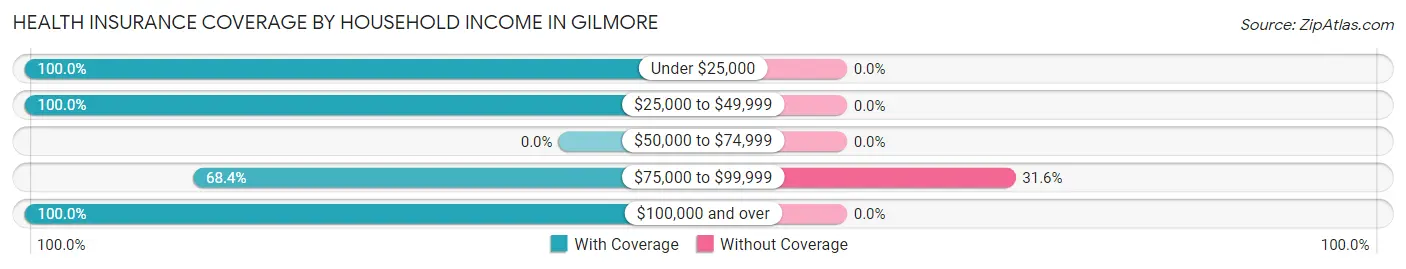
| Household Income | With Coverage | Without Coverage |
| Under $25,000 | 10 (100.0%) | 0 (0.0%) |
| $25,000 to $49,999 | 115 (100.0%) | 0 (0.0%) |
| $50,000 to $74,999 | 0 (0.0%) | 0 (0.0%) |
| $75,000 to $99,999 | 26 (68.4%) | 12 (31.6%) |
| $100,000 and over | 196 (100.0%) | 0 (0.0%) |
Public vs Private Health Insurance Coverage by Age in Gilmore
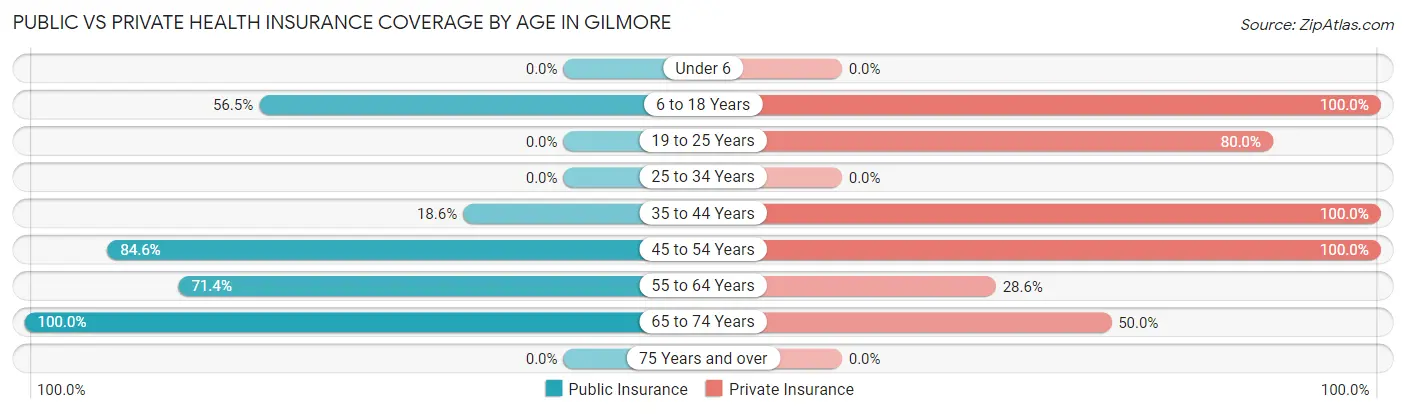
| Age Bracket | Public Insurance | Private Insurance |
| Under 6 | 0 (0.0%) | 0 (0.0%) |
| 6 to 18 Years | 74 (56.5%) | 131 (100.0%) |
| 19 to 25 Years | 0 (0.0%) | 48 (80.0%) |
| 25 to 34 Years | 0 (0.0%) | 0 (0.0%) |
| 35 to 44 Years | 19 (18.6%) | 102 (100.0%) |
| 45 to 54 Years | 22 (84.6%) | 26 (100.0%) |
| 55 to 64 Years | 10 (71.4%) | 4 (28.6%) |
| 65 to 74 Years | 26 (100.0%) | 13 (50.0%) |
| 75 Years and over | 0 (0.0%) | 0 (0.0%) |
| Total | 151 (42.1%) | 324 (90.2%) |
Disability Status by Sex by Age in Gilmore
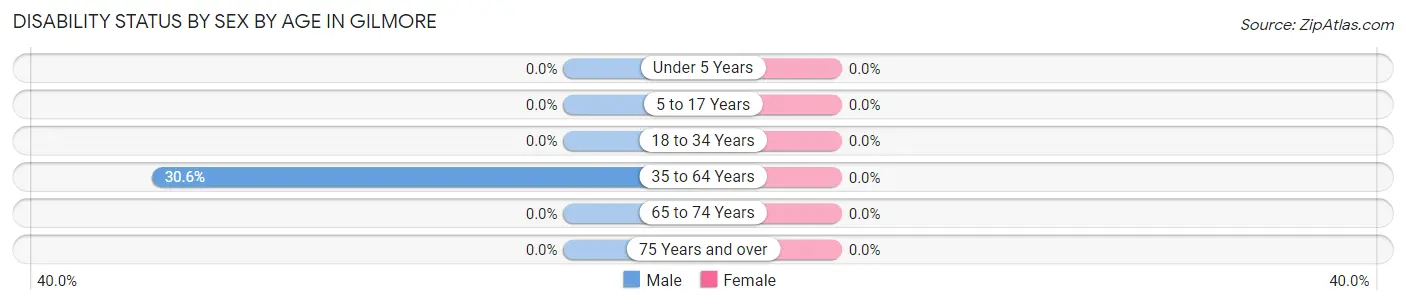
| Age Bracket | Male | Female |
| Under 5 Years | 0 (0.0%) | 0 (0.0%) |
| 5 to 17 Years | 0 (0.0%) | 0 (0.0%) |
| 18 to 34 Years | 0 (0.0%) | 0 (0.0%) |
| 35 to 64 Years | 22 (30.6%) | 0 (0.0%) |
| 65 to 74 Years | 0 (0.0%) | 0 (0.0%) |
| 75 Years and over | 0 (0.0%) | 0 (0.0%) |
Disability Class by Sex by Age in Gilmore
Disability Class: Hearing Difficulty
| Age Bracket | Male | Female |
| Under 5 Years | 0 (0.0%) | 0 (0.0%) |
| 5 to 17 Years | 0 (0.0%) | 0 (0.0%) |
| 18 to 34 Years | 0 (0.0%) | 0 (0.0%) |
| 35 to 64 Years | 0 (0.0%) | 0 (0.0%) |
| 65 to 74 Years | 0 (0.0%) | 0 (0.0%) |
| 75 Years and over | 0 (0.0%) | 0 (0.0%) |
Disability Class: Vision Difficulty
| Age Bracket | Male | Female |
| Under 5 Years | 0 (0.0%) | 0 (0.0%) |
| 5 to 17 Years | 0 (0.0%) | 0 (0.0%) |
| 18 to 34 Years | 0 (0.0%) | 0 (0.0%) |
| 35 to 64 Years | 0 (0.0%) | 0 (0.0%) |
| 65 to 74 Years | 0 (0.0%) | 0 (0.0%) |
| 75 Years and over | 0 (0.0%) | 0 (0.0%) |
Disability Class: Cognitive Difficulty
| Age Bracket | Male | Female |
| 5 to 17 Years | 0 (0.0%) | 0 (0.0%) |
| 18 to 34 Years | 0 (0.0%) | 0 (0.0%) |
| 35 to 64 Years | 0 (0.0%) | 0 (0.0%) |
| 65 to 74 Years | 0 (0.0%) | 0 (0.0%) |
| 75 Years and over | 0 (0.0%) | 0 (0.0%) |
Disability Class: Ambulatory Difficulty
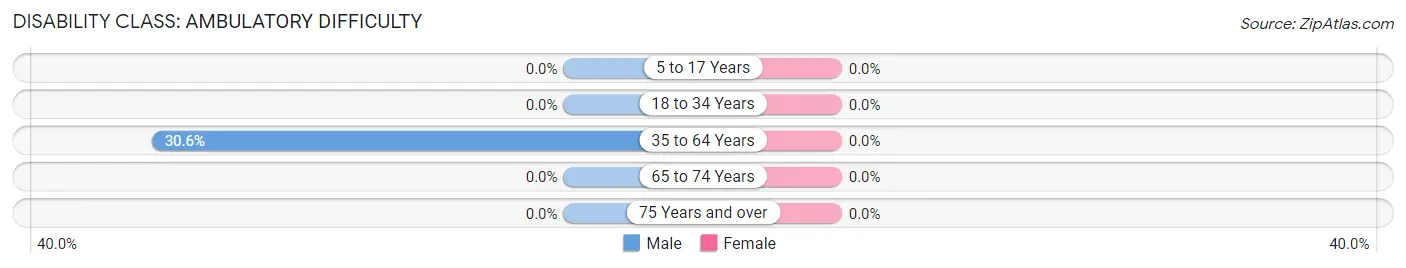
| Age Bracket | Male | Female |
| 5 to 17 Years | 0 (0.0%) | 0 (0.0%) |
| 18 to 34 Years | 0 (0.0%) | 0 (0.0%) |
| 35 to 64 Years | 22 (30.6%) | 0 (0.0%) |
| 65 to 74 Years | 0 (0.0%) | 0 (0.0%) |
| 75 Years and over | 0 (0.0%) | 0 (0.0%) |
Disability Class: Self-Care Difficulty
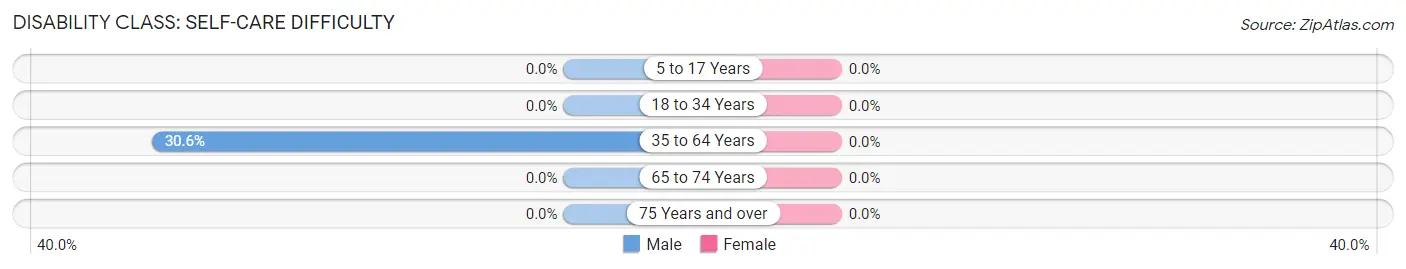
| Age Bracket | Male | Female |
| 5 to 17 Years | 0 (0.0%) | 0 (0.0%) |
| 18 to 34 Years | 0 (0.0%) | 0 (0.0%) |
| 35 to 64 Years | 22 (30.6%) | 0 (0.0%) |
| 65 to 74 Years | 0 (0.0%) | 0 (0.0%) |
| 75 Years and over | 0 (0.0%) | 0 (0.0%) |
Technology Access in Gilmore
Computing Device Access in Gilmore
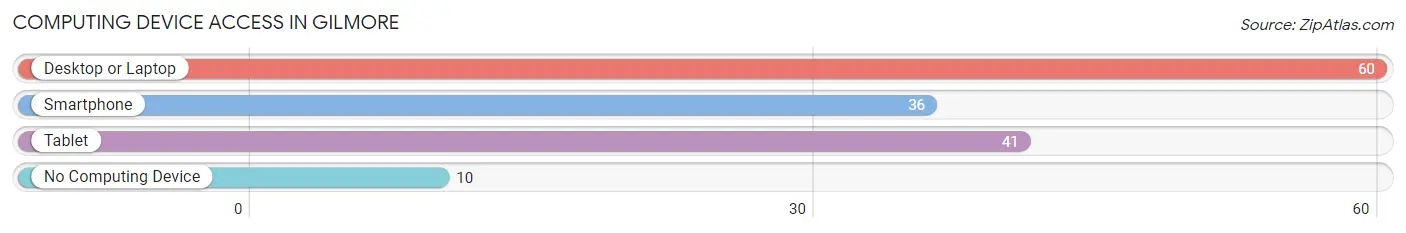
| Device Type | # Households | % Households |
| Desktop or Laptop | 60 | 72.3% |
| Smartphone | 36 | 43.4% |
| Tablet | 41 | 49.4% |
| No Computing Device | 10 | 12.0% |
| Total | 83 | 100.0% |
Internet Access in Gilmore
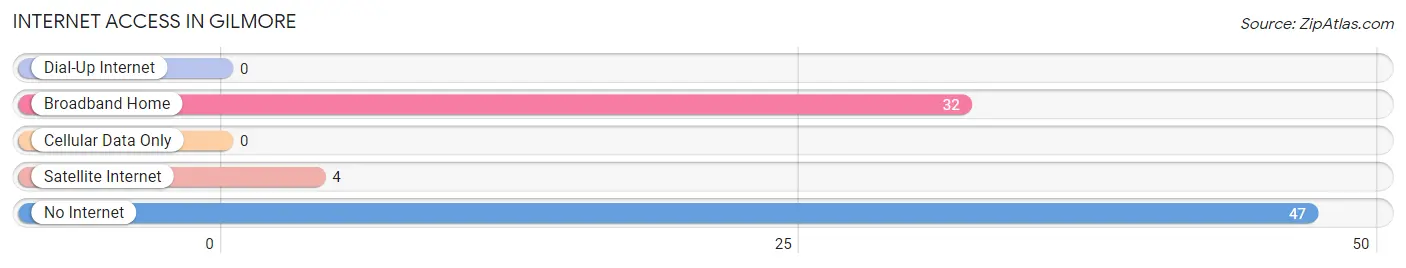
| Internet Type | # Households | % Households |
| Dial-Up Internet | 0 | 0.0% |
| Broadband Home | 32 | 38.6% |
| Cellular Data Only | 0 | 0.0% |
| Satellite Internet | 4 | 4.8% |
| No Internet | 47 | 56.6% |
| Total | 83 | 100.0% |
Gilmore Summary
Gilmore, Maryland is a small town located in the eastern part of the state, in Caroline County. It is situated on the banks of the Choptank River, about 25 miles east of the state capital of Annapolis. The town has a population of just over 1,000 people, and is known for its rural charm and small-town atmosphere.
History
The area that is now Gilmore was first settled in the early 1700s by English colonists. The town was originally known as “The Crossroads” due to its location at the intersection of two major roads. In 1810, the town was officially incorporated as Gilmore, named after the local Gilmore family.
In the late 1800s, Gilmore was a thriving agricultural community, with many of its residents working in the local tobacco and grain industries. The town also had a number of small businesses, including a general store, a blacksmith shop, and a post office.
Geography
Gilmore is located in the eastern part of Caroline County, on the banks of the Choptank River. The town is situated on a flat plain, with the surrounding area consisting of rolling hills and forests. The climate in Gilmore is humid subtropical, with hot, humid summers and mild winters.
Economy
The economy of Gilmore is largely based on agriculture. The town is home to several farms, which produce a variety of crops, including corn, soybeans, and wheat. In addition, there are several small businesses in the area, including a general store, a gas station, and a few restaurants.
Demographics
As of the 2010 census, the population of Gilmore was 1,072. The racial makeup of the town was 94.3% White, 3.2% African American, 0.3% Native American, 0.2% Asian, and 1.9% from other races. The median household income in Gilmore was $45,000, and the median home value was $150,000.
Conclusion
Gilmore, Maryland is a small town located in the eastern part of the state, in Caroline County. It is situated on the banks of the Choptank River, and has a population of just over 1,000 people. The town has a long history, and its economy is largely based on agriculture. The racial makeup of the town is predominantly White, with a small percentage of African American, Native American, and Asian residents. The median household income in Gilmore is $45,000, and the median home value is $150,000.
Common Questions
What is Per Capita Income in Gilmore?
Per Capita income in Gilmore is $20,506.
What is the Median Family Income in Gilmore?
Median Family Income in Gilmore is $102,804.
What is the Median Household income in Gilmore?
Median Household Income in Gilmore is $84,904.
What is Inequality or Gini Index in Gilmore?
Inequality or Gini Index in Gilmore is 0.27.
What is the Total Population of Gilmore?
Total Population of Gilmore is 359.
What is the Total Male Population of Gilmore?
Total Male Population of Gilmore is 223.
What is the Total Female Population of Gilmore?
Total Female Population of Gilmore is 136.
What is the Ratio of Males per 100 Females in Gilmore?
There are 163.97 Males per 100 Females in Gilmore.
What is the Ratio of Females per 100 Males in Gilmore?
There are 60.99 Females per 100 Males in Gilmore.
What is the Median Population Age in Gilmore?
Median Population Age in Gilmore is 20.5 Years.
What is the Average Family Size in Gilmore
Average Family Size in Gilmore is 4.6 People.
What is the Average Household Size in Gilmore
Average Household Size in Gilmore is 4.3 People.
How Large is the Labor Force in Gilmore?
There are 217 People in the Labor Forcein in Gilmore.
What is the Percentage of People in the Labor Force in Gilmore?
76.1% of People are in the Labor Force in Gilmore.