Fairwood, MD Map & Demographics
Fairwood Map
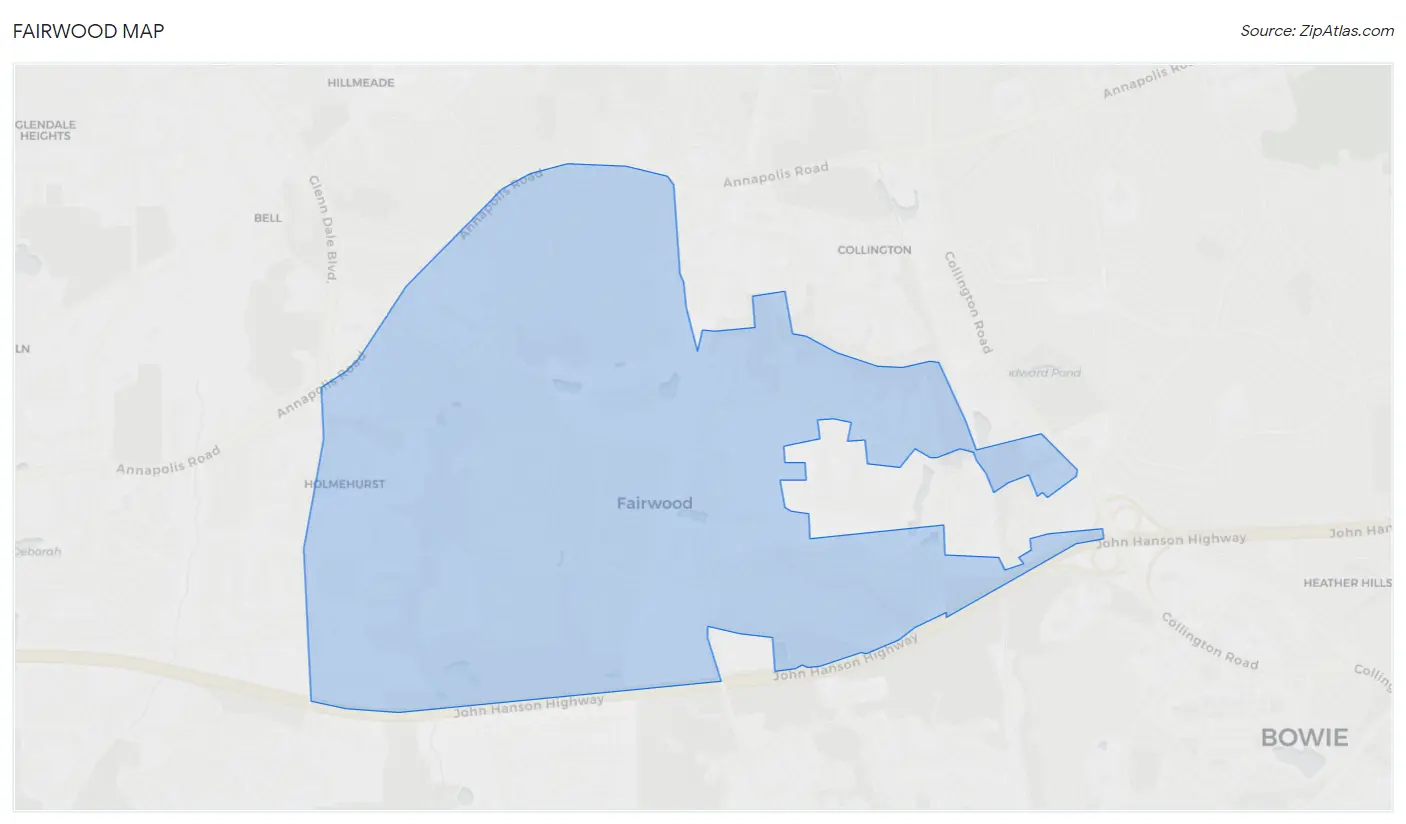
Fairwood Overview
$69,011
PER CAPITA INCOME
$215,703
AVG FAMILY INCOME
$191,304
AVG HOUSEHOLD INCOME
4.2%
WAGE / INCOME GAP [ % ]
95.8¢/ $1
WAGE / INCOME GAP [ $ ]
0.30
INEQUALITY / GINI INDEX
7,653
TOTAL POPULATION
3,678
MALE POPULATION
3,975
FEMALE POPULATION
92.53
MALES / 100 FEMALES
108.08
FEMALES / 100 MALES
39.5
MEDIAN AGE
3.2
AVG FAMILY SIZE
3.2
AVG HOUSEHOLD SIZE
4,447
LABOR FORCE [ PEOPLE ]
81.4%
PERCENT IN LABOR FORCE
2.0%
UNEMPLOYMENT RATE
Income in Fairwood
Income Overview in Fairwood
Per Capita Income in Fairwood is $69,011, while median incomes of families and households are $215,703 and $191,304 respectively.
| Characteristic | Number | Measure |
| Per Capita Income | 7,653 | $69,011 |
| Median Family Income | 2,022 | $215,703 |
| Mean Family Income | 2,022 | $227,897 |
| Median Household Income | 2,420 | $191,304 |
| Mean Household Income | 2,420 | $215,801 |
| Income Deficit | 2,022 | $0 |
| Wage / Income Gap (%) | 7,653 | 4.19% |
| Wage / Income Gap ($) | 7,653 | 95.81¢ per $1 |
| Gini / Inequality Index | 7,653 | 0.30 |
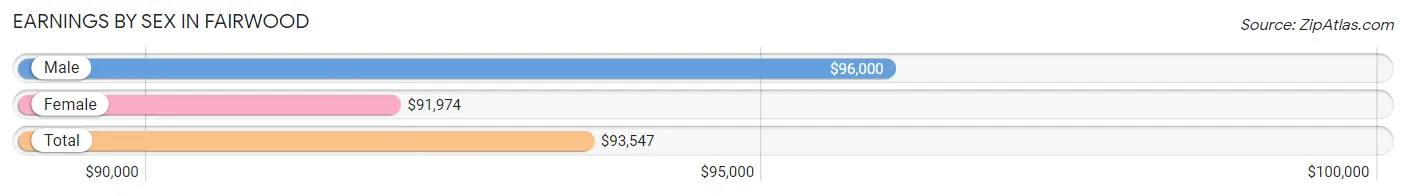
Earnings by Sex in Fairwood
Average Earnings in Fairwood are $93,547, $96,000 for men and $91,974 for women, a difference of 4.2%.
| Sex | Number | Average Earnings |
| Male | 2,156 (45.8%) | $96,000 |
| Female | 2,556 (54.2%) | $91,974 |
| Total | 4,712 (100.0%) | $93,547 |
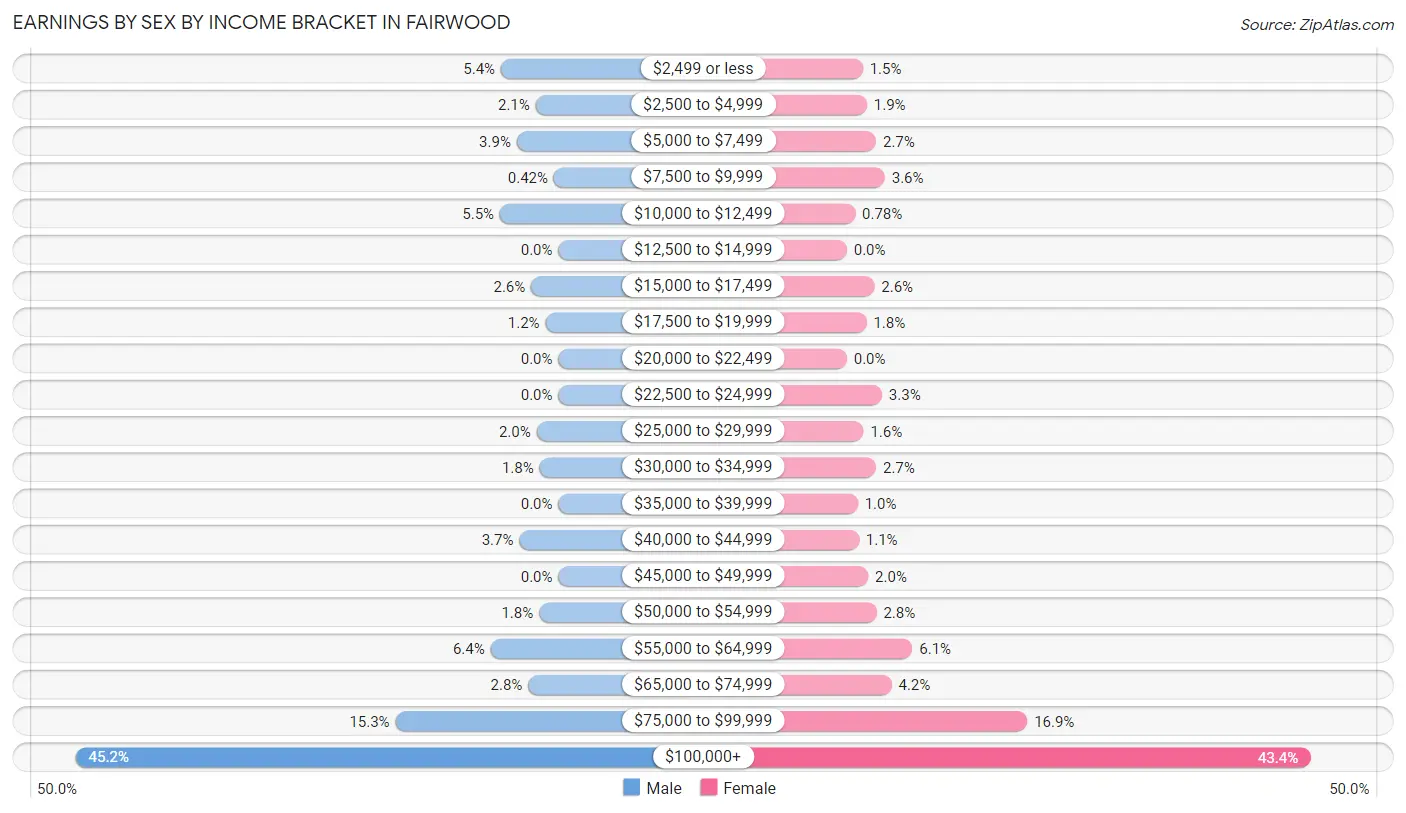
Earnings by Sex by Income Bracket in Fairwood
The most common earnings brackets in Fairwood are $100,000+ for men (975 | 45.2%) and $100,000+ for women (1,109 | 43.4%).
| Income | Male | Female |
| $2,499 or less | 116 (5.4%) | 38 (1.5%) |
| $2,500 to $4,999 | 46 (2.1%) | 48 (1.9%) |
| $5,000 to $7,499 | 84 (3.9%) | 70 (2.7%) |
| $7,500 to $9,999 | 9 (0.4%) | 91 (3.6%) |
| $10,000 to $12,499 | 118 (5.5%) | 20 (0.8%) |
| $12,500 to $14,999 | 0 (0.0%) | 0 (0.0%) |
| $15,000 to $17,499 | 55 (2.5%) | 66 (2.6%) |
| $17,500 to $19,999 | 26 (1.2%) | 47 (1.8%) |
| $20,000 to $22,499 | 0 (0.0%) | 0 (0.0%) |
| $22,500 to $24,999 | 0 (0.0%) | 84 (3.3%) |
| $25,000 to $29,999 | 44 (2.0%) | 40 (1.6%) |
| $30,000 to $34,999 | 38 (1.8%) | 70 (2.7%) |
| $35,000 to $39,999 | 0 (0.0%) | 26 (1.0%) |
| $40,000 to $44,999 | 79 (3.7%) | 29 (1.1%) |
| $45,000 to $49,999 | 0 (0.0%) | 51 (2.0%) |
| $50,000 to $54,999 | 39 (1.8%) | 71 (2.8%) |
| $55,000 to $64,999 | 137 (6.4%) | 157 (6.1%) |
| $65,000 to $74,999 | 61 (2.8%) | 107 (4.2%) |
| $75,000 to $99,999 | 329 (15.3%) | 432 (16.9%) |
| $100,000+ | 975 (45.2%) | 1,109 (43.4%) |
| Total | 2,156 (100.0%) | 2,556 (100.0%) |
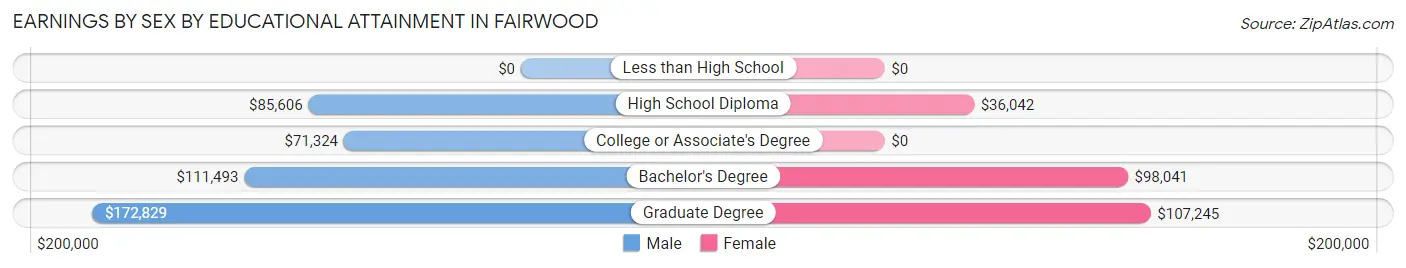
Earnings by Sex by Educational Attainment in Fairwood
Average earnings in Fairwood are $110,733 for men and $94,545 for women, a difference of 14.6%. Men with an educational attainment of graduate degree enjoy the highest average annual earnings of $172,829, while those with college or associate's degree education earn the least with $71,324. Women with an educational attainment of graduate degree earn the most with the average annual earnings of $107,245, while those with high school diploma education have the smallest earnings of $36,042.
| Educational Attainment | Male Income | Female Income |
| Less than High School | - | - |
| High School Diploma | $85,606 | $36,042 |
| College or Associate's Degree | $71,324 | $0 |
| Bachelor's Degree | $111,493 | $98,041 |
| Graduate Degree | $172,829 | $107,245 |
| Total | $110,733 | $94,545 |
Family Income in Fairwood
Family Income Brackets in Fairwood
According to the Fairwood family income data, there are 1,072 families falling into the $200,000+ income range, which is the most common income bracket and makes up 53.0% of all families.
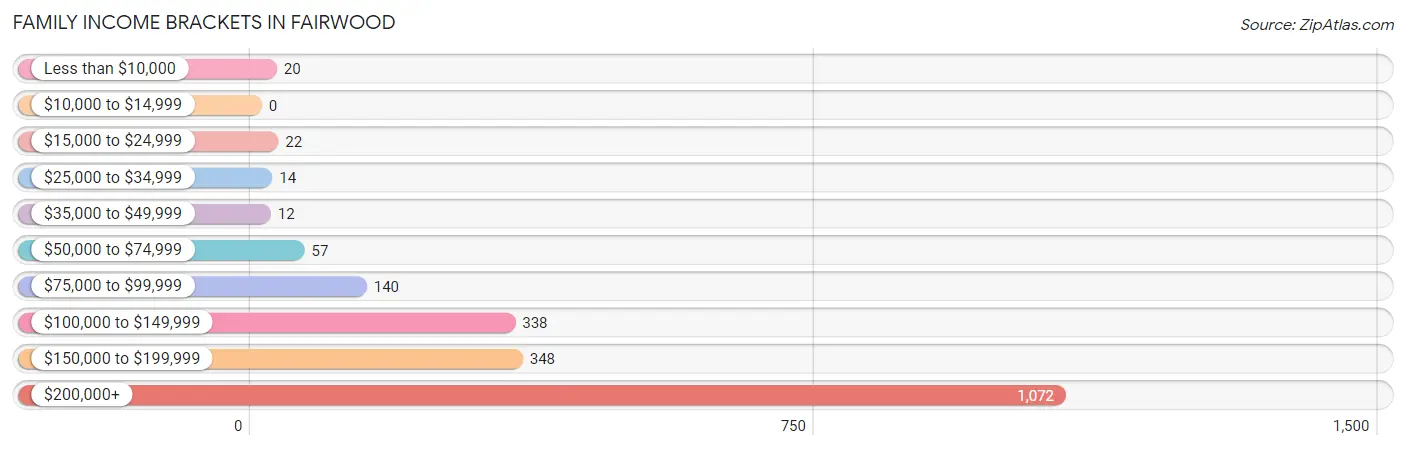
| Income Bracket | # Families | % Families |
| Less than $10,000 | 20 | 1.0% |
| $10,000 to $14,999 | 0 | 0.0% |
| $15,000 to $24,999 | 22 | 1.1% |
| $25,000 to $34,999 | 14 | 0.7% |
| $35,000 to $49,999 | 12 | 0.6% |
| $50,000 to $74,999 | 57 | 2.8% |
| $75,000 to $99,999 | 140 | 6.9% |
| $100,000 to $149,999 | 338 | 16.7% |
| $150,000 to $199,999 | 348 | 17.2% |
| $200,000+ | 1,072 | 53.0% |
Family Income by Famaliy Size in Fairwood
4-person families (475 | 23.5%) account for the highest median family income in Fairwood with $250,001 per family, while 2-person families (871 | 43.1%) have the highest median income of $85,604 per family member.
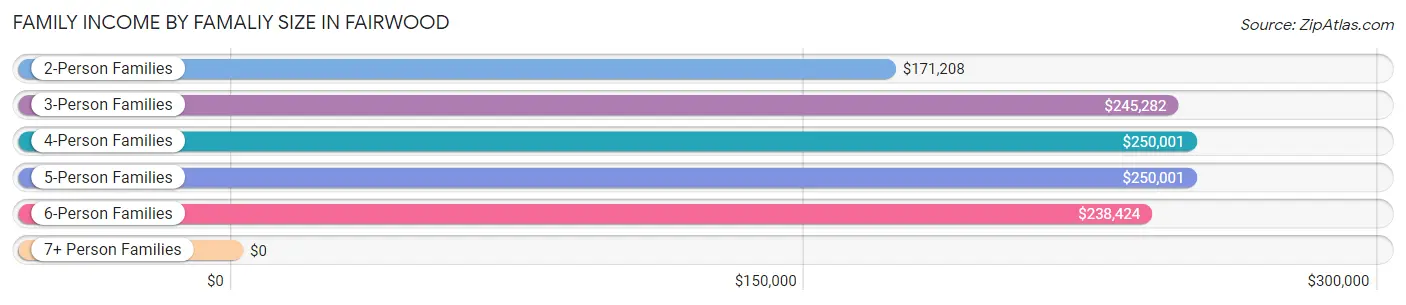
| Income Bracket | # Families | Median Income |
| 2-Person Families | 871 (43.1%) | $171,208 |
| 3-Person Families | 379 (18.7%) | $245,282 |
| 4-Person Families | 475 (23.5%) | $250,001 |
| 5-Person Families | 144 (7.1%) | $250,001 |
| 6-Person Families | 141 (7.0%) | $238,424 |
| 7+ Person Families | 12 (0.6%) | $0 |
| Total | 2,022 (100.0%) | $215,703 |
Family Income by Number of Earners in Fairwood
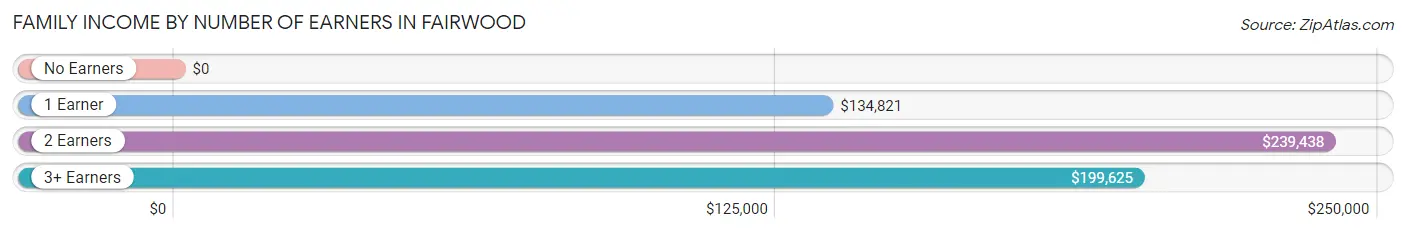
| Number of Earners | # Families | Median Income |
| No Earners | 21 (1.0%) | $0 |
| 1 Earner | 475 (23.5%) | $134,821 |
| 2 Earners | 1,095 (54.1%) | $239,438 |
| 3+ Earners | 431 (21.3%) | $199,625 |
| Total | 2,022 (100.0%) | $215,703 |
Household Income in Fairwood
Household Income Brackets in Fairwood
With 1,133 households falling in the category, the $200,000+ income range is the most frequent in Fairwood, accounting for 46.8% of all households.
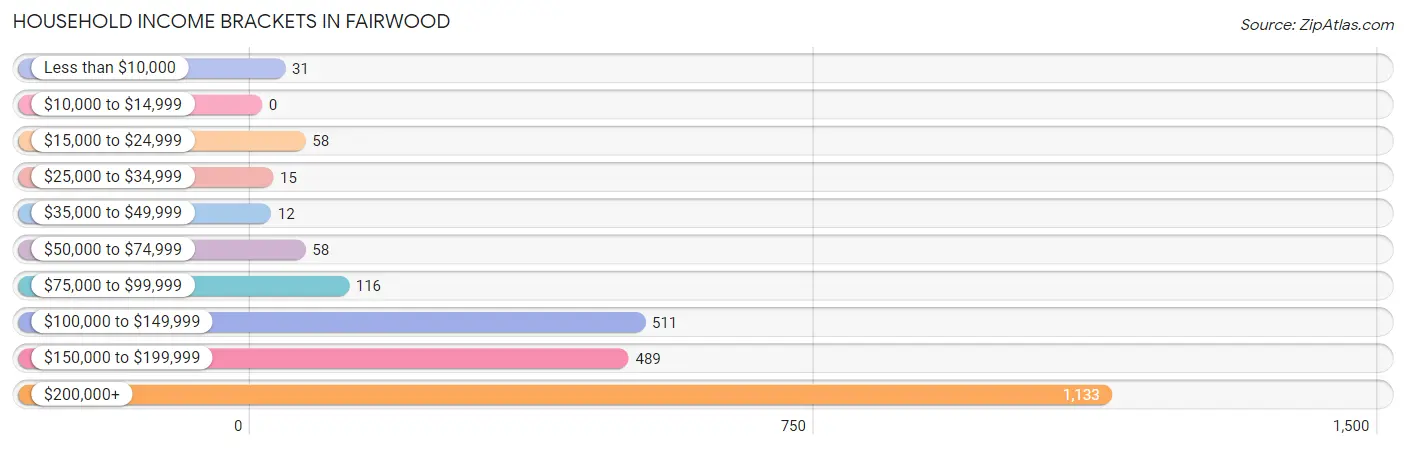
| Income Bracket | # Households | % Households |
| Less than $10,000 | 31 | 1.3% |
| $10,000 to $14,999 | 0 | 0.0% |
| $15,000 to $24,999 | 58 | 2.4% |
| $25,000 to $34,999 | 15 | 0.6% |
| $35,000 to $49,999 | 12 | 0.5% |
| $50,000 to $74,999 | 58 | 2.4% |
| $75,000 to $99,999 | 116 | 4.8% |
| $100,000 to $149,999 | 511 | 21.1% |
| $150,000 to $199,999 | 489 | 20.2% |
| $200,000+ | 1,133 | 46.8% |
Household Income by Householder Age in Fairwood
The median household income in Fairwood is $191,304, with the highest median household income of $207,639 found in the 25 to 44 years age bracket for the primary householder. A total of 790 households (32.6%) fall into this category.
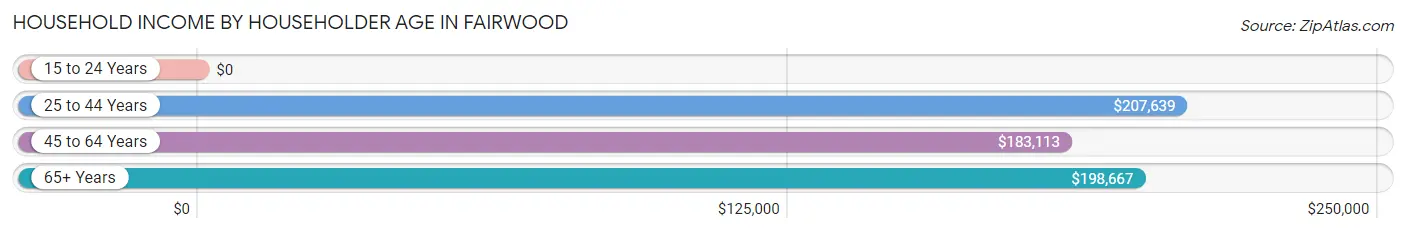
| Income Bracket | # Households | Median Income |
| 15 to 24 Years | 0 (0.0%) | $0 |
| 25 to 44 Years | 790 (32.6%) | $207,639 |
| 45 to 64 Years | 1,356 (56.0%) | $183,113 |
| 65+ Years | 274 (11.3%) | $198,667 |
| Total | 2,420 (100.0%) | $191,304 |
Poverty in Fairwood
Income Below Poverty by Sex and Age in Fairwood
With 1.3% poverty level for males and 2.7% for females among the residents of Fairwood, under 5 year old males and under 5 year old females are the most vulnerable to poverty, with 23 males (11.4%) and 22 females (15.2%) in their respective age groups living below the poverty level.
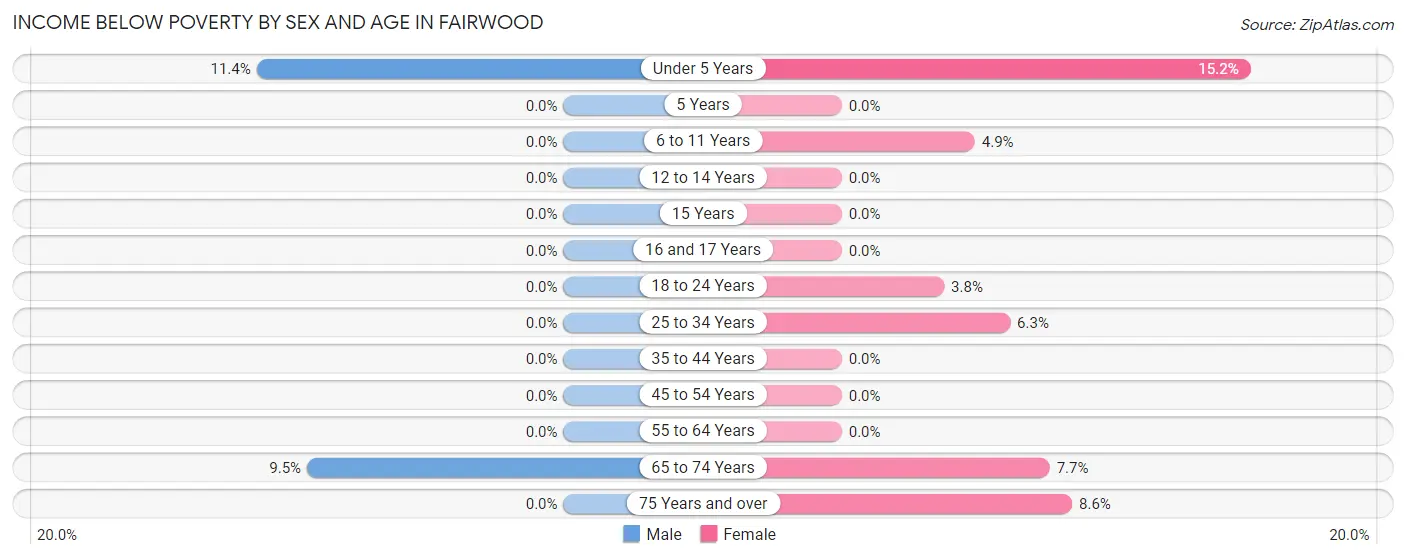
| Age Bracket | Male | Female |
| Under 5 Years | 23 (11.4%) | 22 (15.2%) |
| 5 Years | 0 (0.0%) | 0 (0.0%) |
| 6 to 11 Years | 0 (0.0%) | 20 (4.9%) |
| 12 to 14 Years | 0 (0.0%) | 0 (0.0%) |
| 15 Years | 0 (0.0%) | 0 (0.0%) |
| 16 and 17 Years | 0 (0.0%) | 0 (0.0%) |
| 18 to 24 Years | 0 (0.0%) | 7 (3.8%) |
| 25 to 34 Years | 0 (0.0%) | 21 (6.2%) |
| 35 to 44 Years | 0 (0.0%) | 0 (0.0%) |
| 45 to 54 Years | 0 (0.0%) | 0 (0.0%) |
| 55 to 64 Years | 0 (0.0%) | 0 (0.0%) |
| 65 to 74 Years | 22 (9.5%) | 20 (7.7%) |
| 75 Years and over | 0 (0.0%) | 10 (8.6%) |
| Total | 45 (1.3%) | 100 (2.7%) |
Income Above Poverty by Sex and Age in Fairwood
According to the poverty statistics in Fairwood, males aged 5 years and females aged 5 years are the age groups that are most secure financially, with 100.0% of males and 100.0% of females in these age groups living above the poverty line.
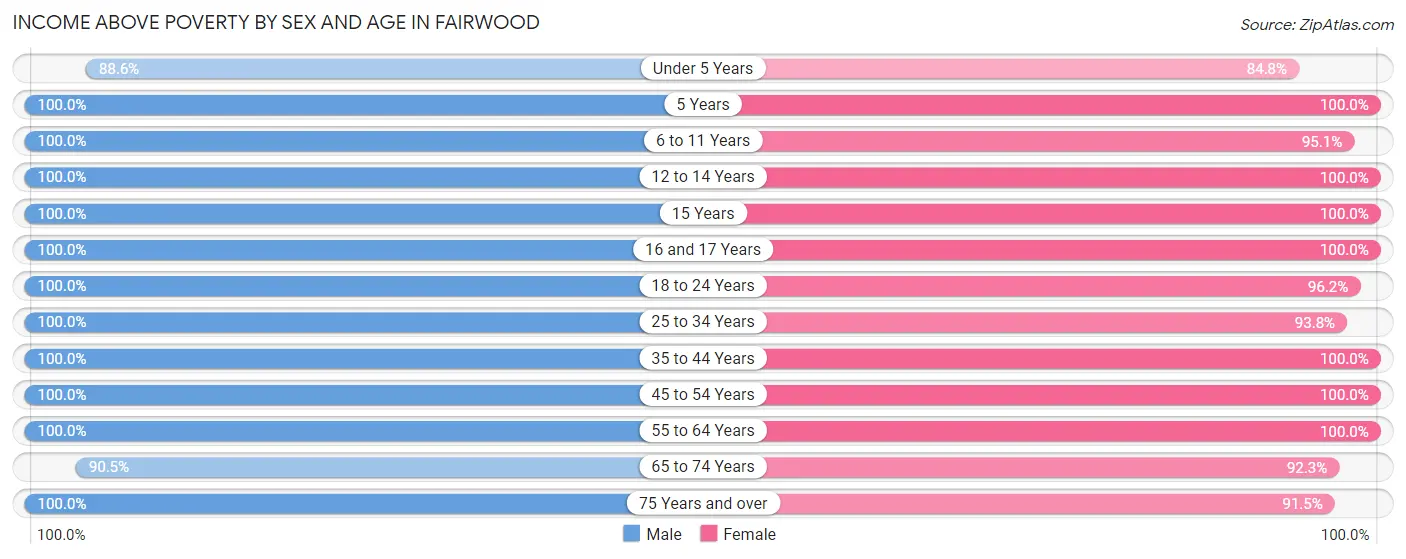
| Age Bracket | Male | Female |
| Under 5 Years | 179 (88.6%) | 123 (84.8%) |
| 5 Years | 77 (100.0%) | 20 (100.0%) |
| 6 to 11 Years | 280 (100.0%) | 385 (95.1%) |
| 12 to 14 Years | 169 (100.0%) | 169 (100.0%) |
| 15 Years | 75 (100.0%) | 56 (100.0%) |
| 16 and 17 Years | 73 (100.0%) | 14 (100.0%) |
| 18 to 24 Years | 330 (100.0%) | 177 (96.2%) |
| 25 to 34 Years | 317 (100.0%) | 315 (93.8%) |
| 35 to 44 Years | 557 (100.0%) | 543 (100.0%) |
| 45 to 54 Years | 509 (100.0%) | 828 (100.0%) |
| 55 to 64 Years | 455 (100.0%) | 658 (100.0%) |
| 65 to 74 Years | 209 (90.5%) | 239 (92.3%) |
| 75 Years and over | 48 (100.0%) | 107 (91.4%) |
| Total | 3,278 (98.7%) | 3,634 (97.3%) |
Income Below Poverty Among Married-Couple Families in Fairwood
The poverty statistics for married-couple families in Fairwood show that 1.4% or 22 of the total 1,618 families live below the poverty line. Families with no children have the highest poverty rate of 2.5%, comprising of 22 families. On the other hand, families with 1 or 2 children have the lowest poverty rate of 0.0%, which includes 0 families.
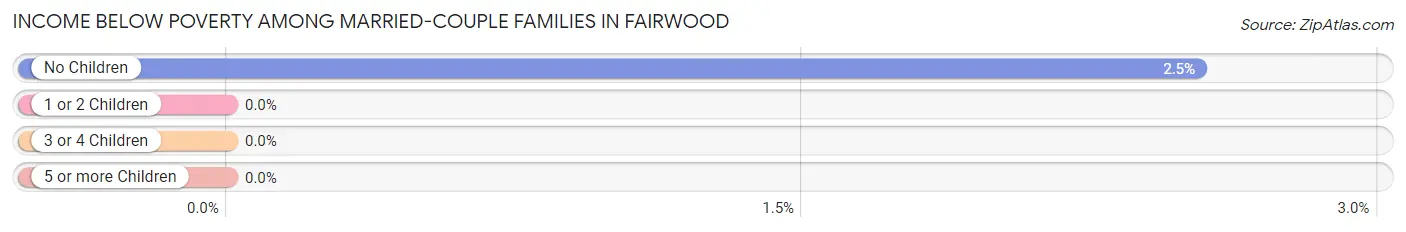
| Children | Above Poverty | Below Poverty |
| No Children | 847 (97.5%) | 22 (2.5%) |
| 1 or 2 Children | 642 (100.0%) | 0 (0.0%) |
| 3 or 4 Children | 107 (100.0%) | 0 (0.0%) |
| 5 or more Children | 0 (0.0%) | 0 (0.0%) |
| Total | 1,596 (98.6%) | 22 (1.4%) |
Income Below Poverty Among Single-Parent Households in Fairwood
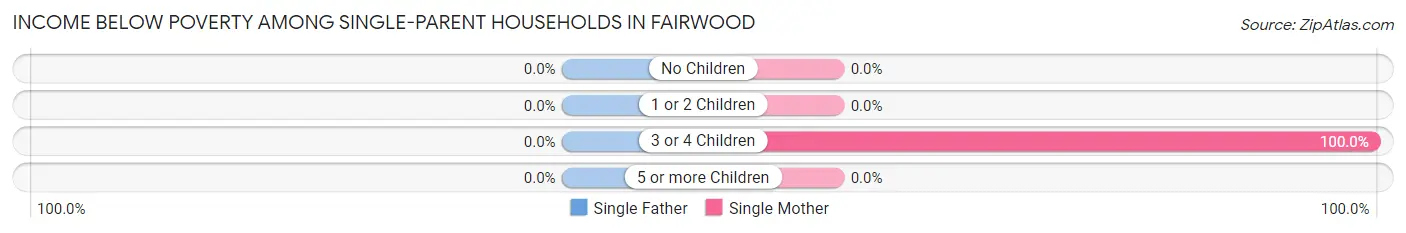
| Children | Single Father | Single Mother |
| No Children | 0 (0.0%) | 0 (0.0%) |
| 1 or 2 Children | 0 (0.0%) | 0 (0.0%) |
| 3 or 4 Children | 0 (0.0%) | 21 (100.0%) |
| 5 or more Children | 0 (0.0%) | 0 (0.0%) |
| Total | 0 (0.0%) | 21 (6.5%) |
Income Below Poverty Among Married-Couple vs Single-Parent Households in Fairwood
The poverty data for Fairwood shows that 22 of the married-couple family households (1.4%) and 21 of the single-parent households (5.2%) are living below the poverty level. Within the married-couple family households, those with no children have the highest poverty rate, with 22 households (2.5%) falling below the poverty line. Among the single-parent households, those with 3 or 4 children have the highest poverty rate, with 21 household (100.0%) living below poverty.
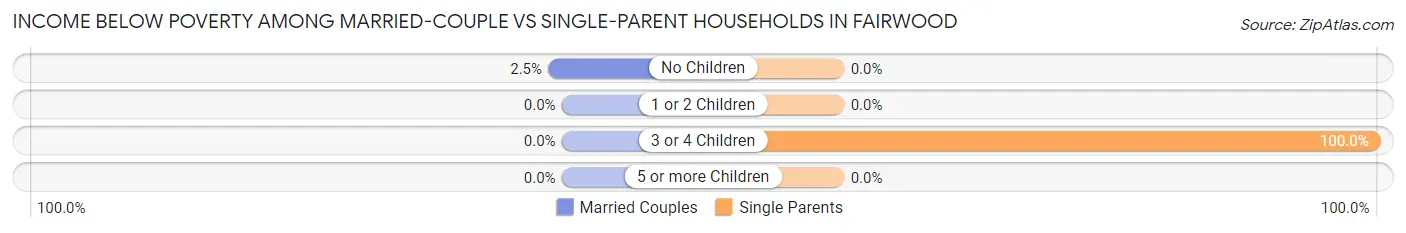
| Children | Married-Couple Families | Single-Parent Households |
| No Children | 22 (2.5%) | 0 (0.0%) |
| 1 or 2 Children | 0 (0.0%) | 0 (0.0%) |
| 3 or 4 Children | 0 (0.0%) | 21 (100.0%) |
| 5 or more Children | 0 (0.0%) | 0 (0.0%) |
| Total | 22 (1.4%) | 21 (5.2%) |
Race in Fairwood
The most populous races in Fairwood are Black / African American (6,166 | 80.6%), Asian (666 | 8.7%), and Two or more Races (484 | 6.3%).
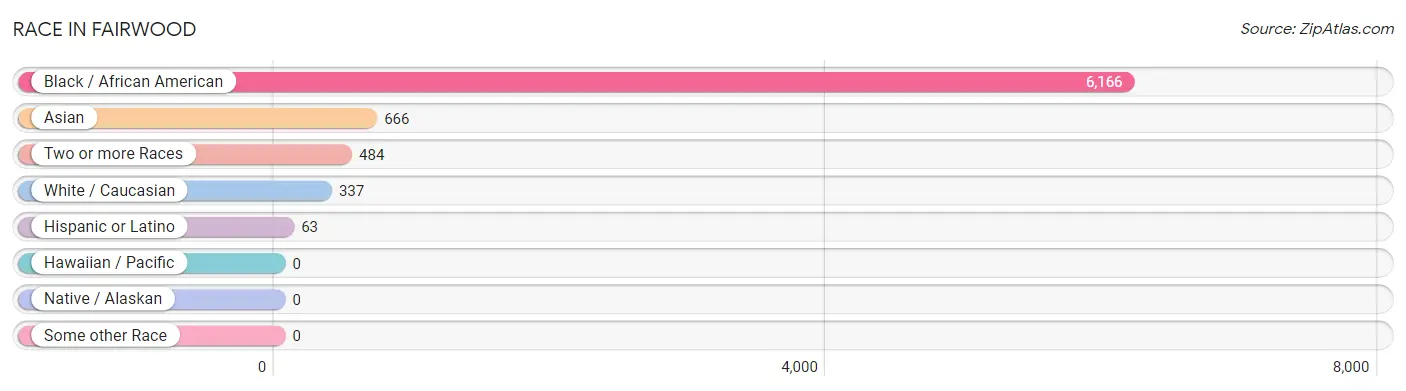
| Race | # Population | % Population |
| Asian | 666 | 8.7% |
| Black / African American | 6,166 | 80.6% |
| Hawaiian / Pacific | 0 | 0.0% |
| Hispanic or Latino | 63 | 0.8% |
| Native / Alaskan | 0 | 0.0% |
| White / Caucasian | 337 | 4.4% |
| Two or more Races | 484 | 6.3% |
| Some other Race | 0 | 0.0% |
| Total | 7,653 | 100.0% |
Ancestry in Fairwood
The most populous ancestries reported in Fairwood are Subsaharan African (822 | 10.7%), Nigerian (434 | 5.7%), American (348 | 4.5%), Guyanese (316 | 4.1%), and Jamaican (255 | 3.3%), together accounting for 28.4% of all Fairwood residents.
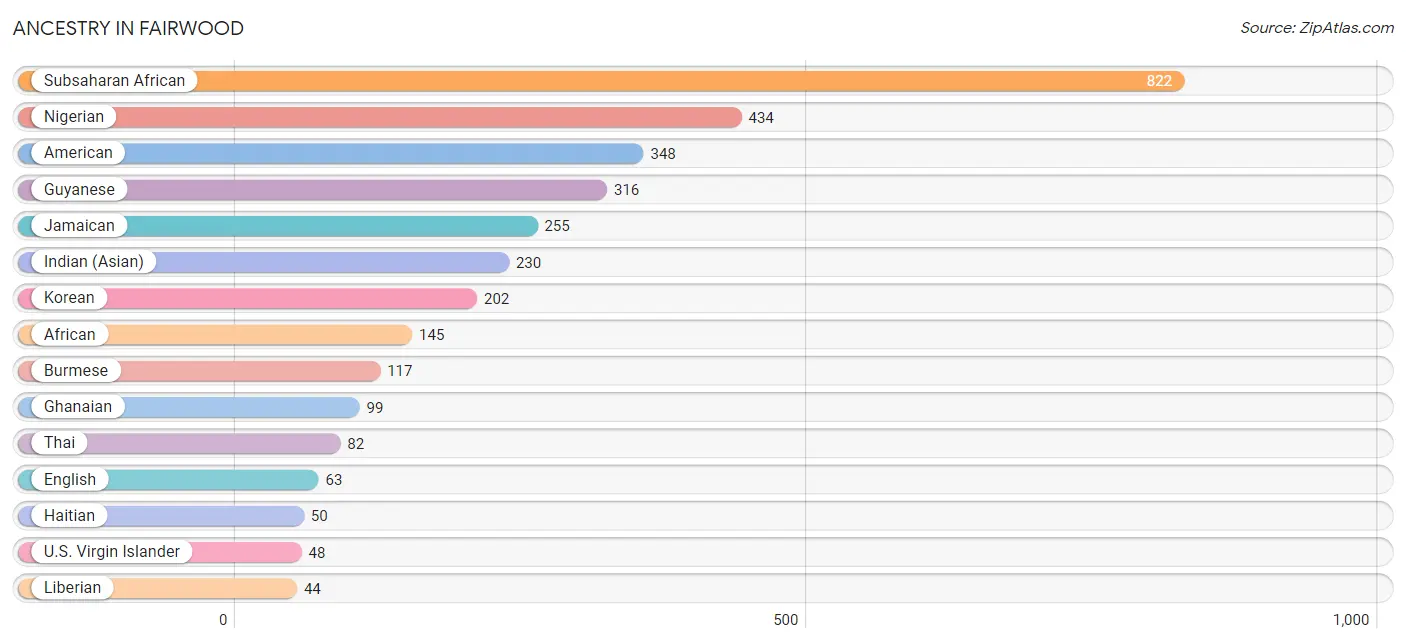
| Ancestry | # Population | % Population |
| African | 145 | 1.9% |
| American | 348 | 4.5% |
| Arab | 36 | 0.5% |
| Barbadian | 18 | 0.2% |
| Bhutanese | 19 | 0.3% |
| British West Indian | 42 | 0.5% |
| Burmese | 117 | 1.5% |
| Central American | 7 | 0.1% |
| Costa Rican | 7 | 0.1% |
| Dutch | 24 | 0.3% |
| English | 63 | 0.8% |
| European | 12 | 0.2% |
| German | 39 | 0.5% |
| Ghanaian | 99 | 1.3% |
| Guyanese | 316 | 4.1% |
| Haitian | 50 | 0.6% |
| Indian (Asian) | 230 | 3.0% |
| Irish | 10 | 0.1% |
| Italian | 38 | 0.5% |
| Jamaican | 255 | 3.3% |
| Jordanian | 19 | 0.3% |
| Korean | 202 | 2.6% |
| Lebanese | 17 | 0.2% |
| Liberian | 44 | 0.6% |
| Mexican | 18 | 0.2% |
| Nigerian | 434 | 5.7% |
| Polish | 28 | 0.4% |
| Portuguese | 13 | 0.2% |
| Puerto Rican | 13 | 0.2% |
| Russian | 28 | 0.4% |
| Scotch-Irish | 13 | 0.2% |
| Subsaharan African | 822 | 10.7% |
| Thai | 82 | 1.1% |
| U.S. Virgin Islander | 48 | 0.6% |
| Ukrainian | 20 | 0.3% | View All 35 Rows |
Immigrants in Fairwood
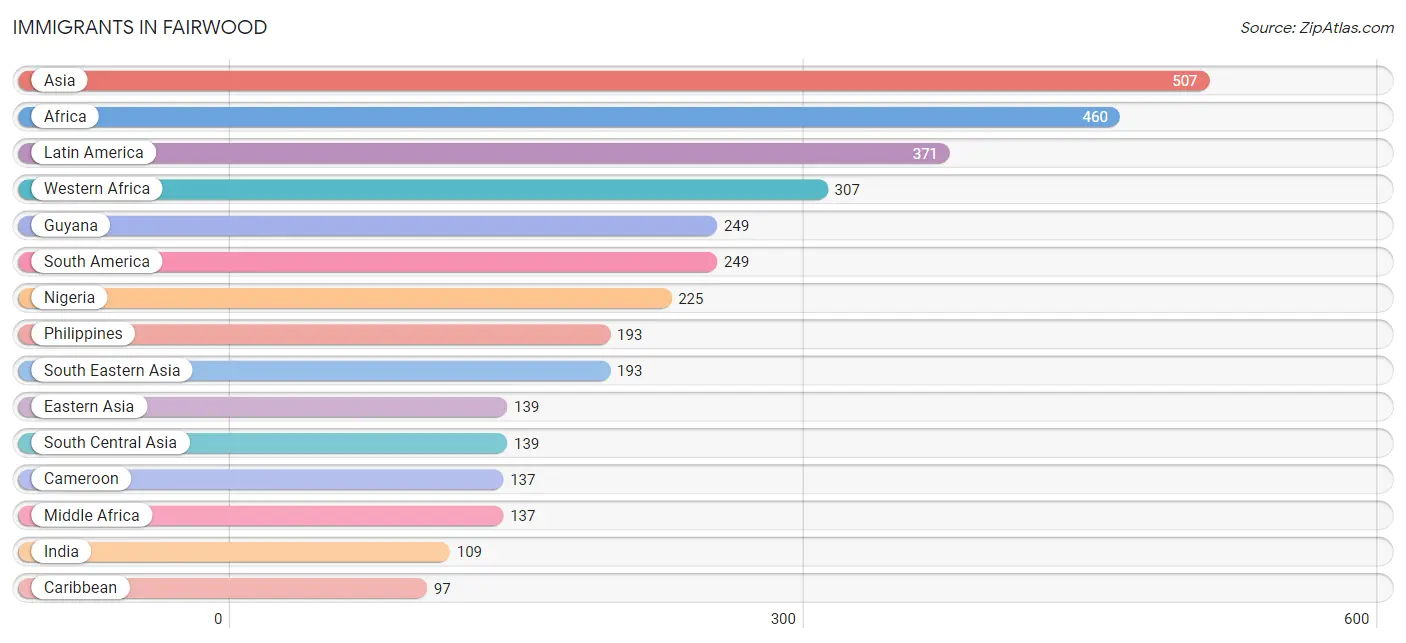
The most numerous immigrant groups reported in Fairwood came from Asia (507 | 6.6%), Africa (460 | 6.0%), Latin America (371 | 4.9%), Western Africa (307 | 4.0%), and Guyana (249 | 3.3%), together accounting for 24.7% of all Fairwood residents.
| Immigration Origin | # Population | % Population |
| Africa | 460 | 6.0% |
| Asia | 507 | 6.6% |
| Barbados | 9 | 0.1% |
| Cameroon | 137 | 1.8% |
| Caribbean | 97 | 1.3% |
| Central America | 25 | 0.3% |
| China | 97 | 1.3% |
| Costa Rica | 7 | 0.1% |
| Eastern Africa | 16 | 0.2% |
| Eastern Asia | 139 | 1.8% |
| Europe | 30 | 0.4% |
| Germany | 10 | 0.1% |
| Ghana | 45 | 0.6% |
| Guyana | 249 | 3.3% |
| India | 109 | 1.4% |
| Jamaica | 88 | 1.1% |
| Jordan | 19 | 0.3% |
| Korea | 42 | 0.5% |
| Latin America | 371 | 4.9% |
| Lebanon | 17 | 0.2% |
| Mexico | 18 | 0.2% |
| Middle Africa | 137 | 1.8% |
| Nigeria | 225 | 2.9% |
| Northern Europe | 20 | 0.3% |
| Pakistan | 30 | 0.4% |
| Philippines | 193 | 2.5% |
| Senegal | 28 | 0.4% |
| South America | 249 | 3.3% |
| South Central Asia | 139 | 1.8% |
| South Eastern Asia | 193 | 2.5% |
| Taiwan | 22 | 0.3% |
| Western Africa | 307 | 4.0% |
| Western Asia | 36 | 0.5% |
| Western Europe | 10 | 0.1% | View All 34 Rows |
Sex and Age in Fairwood
Sex and Age in Fairwood
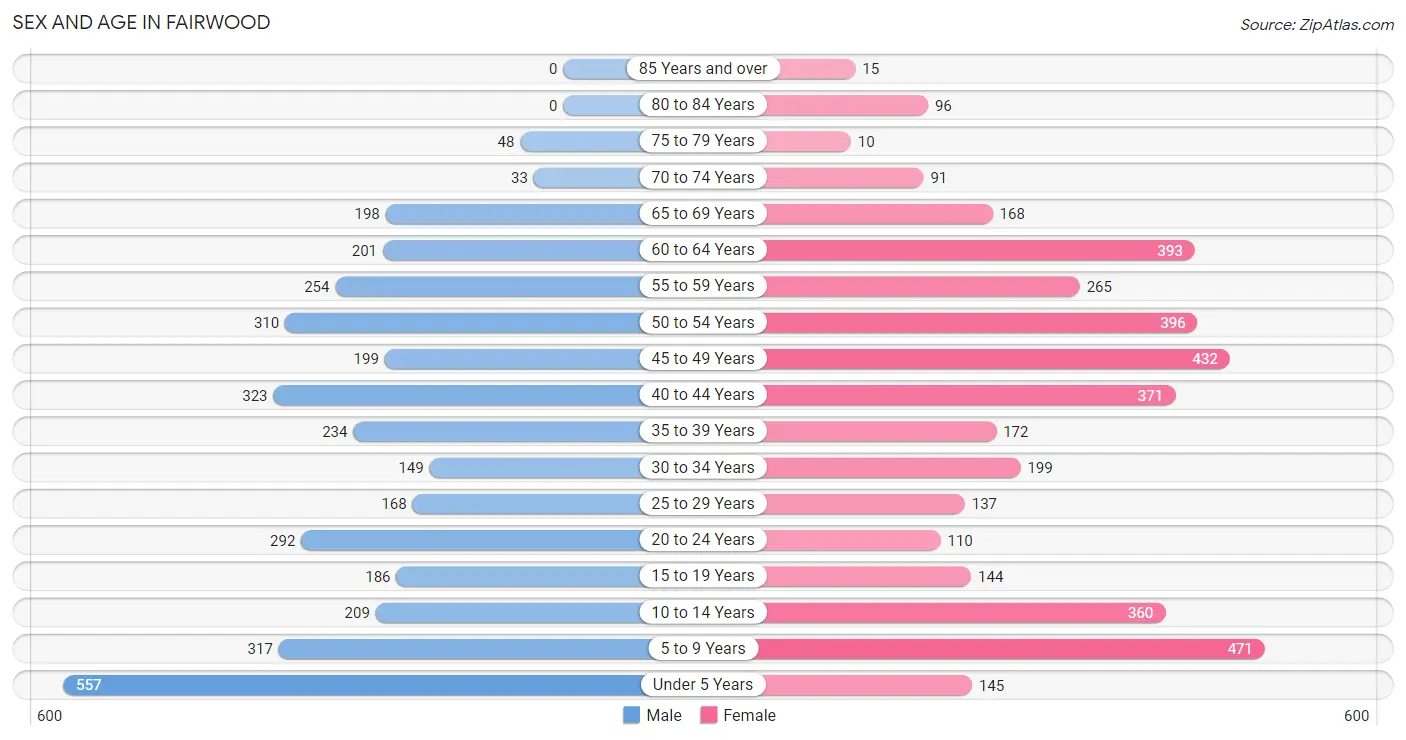
The most populous age groups in Fairwood are Under 5 Years (557 | 15.1%) for men and 5 to 9 Years (471 | 11.8%) for women.
| Age Bracket | Male | Female |
| Under 5 Years | 557 (15.1%) | 145 (3.6%) |
| 5 to 9 Years | 317 (8.6%) | 471 (11.8%) |
| 10 to 14 Years | 209 (5.7%) | 360 (9.1%) |
| 15 to 19 Years | 186 (5.1%) | 144 (3.6%) |
| 20 to 24 Years | 292 (7.9%) | 110 (2.8%) |
| 25 to 29 Years | 168 (4.6%) | 137 (3.5%) |
| 30 to 34 Years | 149 (4.1%) | 199 (5.0%) |
| 35 to 39 Years | 234 (6.4%) | 172 (4.3%) |
| 40 to 44 Years | 323 (8.8%) | 371 (9.3%) |
| 45 to 49 Years | 199 (5.4%) | 432 (10.9%) |
| 50 to 54 Years | 310 (8.4%) | 396 (10.0%) |
| 55 to 59 Years | 254 (6.9%) | 265 (6.7%) |
| 60 to 64 Years | 201 (5.5%) | 393 (9.9%) |
| 65 to 69 Years | 198 (5.4%) | 168 (4.2%) |
| 70 to 74 Years | 33 (0.9%) | 91 (2.3%) |
| 75 to 79 Years | 48 (1.3%) | 10 (0.3%) |
| 80 to 84 Years | 0 (0.0%) | 96 (2.4%) |
| 85 Years and over | 0 (0.0%) | 15 (0.4%) |
| Total | 3,678 (100.0%) | 3,975 (100.0%) |
Families and Households in Fairwood
Median Family Size in Fairwood
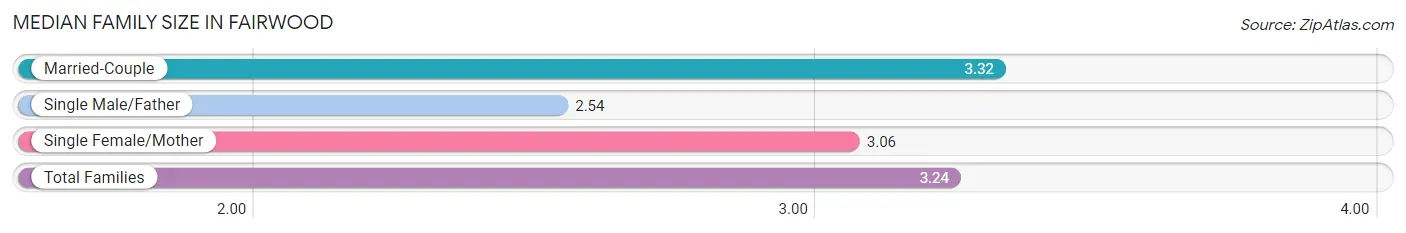
The median family size in Fairwood is 3.24 persons per family, with married-couple families (1,618 | 80.0%) accounting for the largest median family size of 3.32 persons per family. On the other hand, single male/father families (82 | 4.1%) represent the smallest median family size with 2.54 persons per family.
| Family Type | # Families | Family Size |
| Married-Couple | 1,618 (80.0%) | 3.32 |
| Single Male/Father | 82 (4.1%) | 2.54 |
| Single Female/Mother | 322 (15.9%) | 3.06 |
| Total Families | 2,022 (100.0%) | 3.24 |
Median Household Size in Fairwood
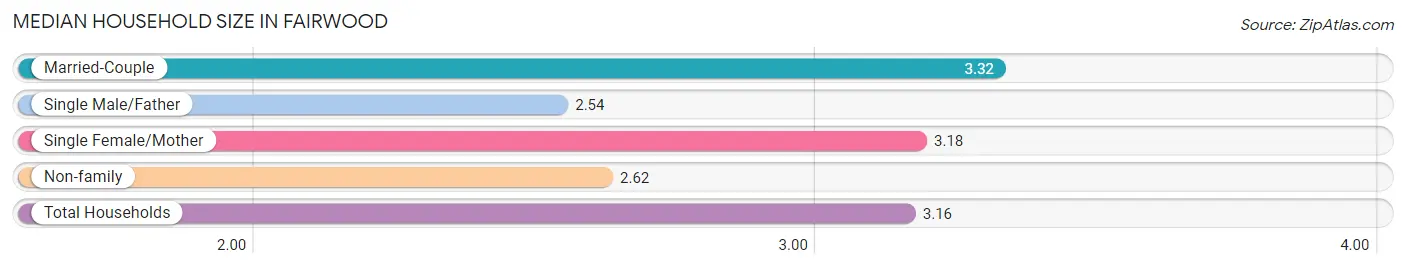
The median household size in Fairwood is 3.16 persons per household, with married-couple households (1,618 | 66.9%) accounting for the largest median household size of 3.32 persons per household. single male/father households (82 | 3.4%) represent the smallest median household size with 2.54 persons per household.
| Household Type | # Households | Household Size |
| Married-Couple | 1,618 (66.9%) | 3.32 |
| Single Male/Father | 82 (3.4%) | 2.54 |
| Single Female/Mother | 322 (13.3%) | 3.18 |
| Non-family | 398 (16.5%) | 2.62 |
| Total Households | 2,420 (100.0%) | 3.16 |
Household Size by Marriage Status in Fairwood
Out of a total of 2,420 households in Fairwood, 2,022 (83.6%) are family households, while 398 (16.5%) are nonfamily households. The most numerous type of family households are 2-person households, comprising 859, and the most common type of nonfamily households are 1-person households, comprising 260.
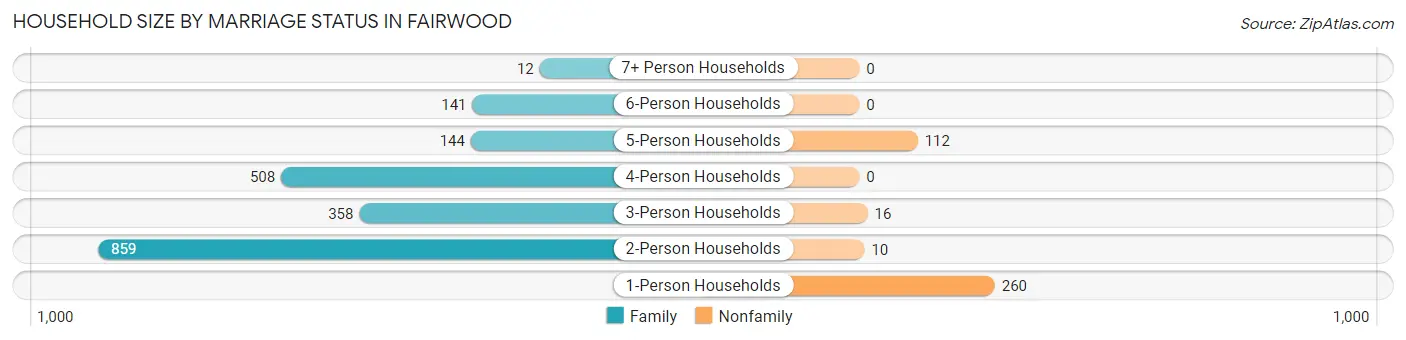
| Household Size | Family Households | Nonfamily Households |
| 1-Person Households | - | 260 (10.7%) |
| 2-Person Households | 859 (35.5%) | 10 (0.4%) |
| 3-Person Households | 358 (14.8%) | 16 (0.7%) |
| 4-Person Households | 508 (21.0%) | 0 (0.0%) |
| 5-Person Households | 144 (5.9%) | 112 (4.6%) |
| 6-Person Households | 141 (5.8%) | 0 (0.0%) |
| 7+ Person Households | 12 (0.5%) | 0 (0.0%) |
| Total | 2,022 (83.6%) | 398 (16.5%) |
Female Fertility in Fairwood
Fertility by Age in Fairwood
Average fertility rate in Fairwood is 55.0 births per 1,000 women. Women in the age bracket of 35 to 50 years have the highest fertility rate with 66.0 births per 1,000 women. Women in the age bracket of 35 to 50 years acount for 77.2% of all women with births.
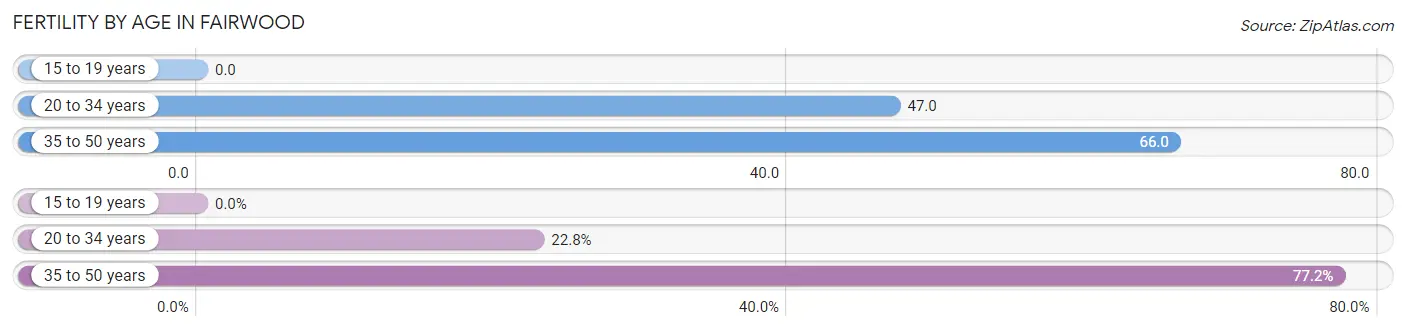
| Age Bracket | Women with Births | Births / 1,000 Women |
| 15 to 19 years | 0 (0.0%) | 0.0 |
| 20 to 34 years | 21 (22.8%) | 47.0 |
| 35 to 50 years | 71 (77.2%) | 66.0 |
| Total | 92 (100.0%) | 55.0 |
Fertility by Age by Marriage Status in Fairwood
64.1% of women with births (92) in Fairwood are married. The highest percentage of unmarried women with births falls into 35 to 50 years age bracket with 46.5% of them unmarried at the time of birth, while the lowest percentage of unmarried women with births belong to 20 to 34 years age bracket with 0.0% of them unmarried.
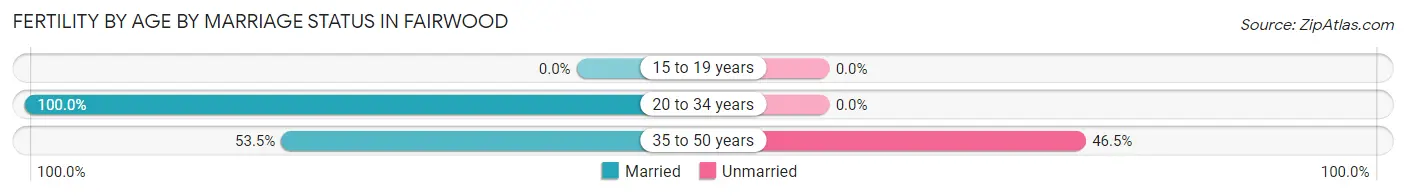
| Age Bracket | Married | Unmarried |
| 15 to 19 years | 0 (0.0%) | 0 (0.0%) |
| 20 to 34 years | 21 (100.0%) | 0 (0.0%) |
| 35 to 50 years | 38 (53.5%) | 33 (46.5%) |
| Total | 59 (64.1%) | 33 (35.9%) |
Fertility by Education in Fairwood
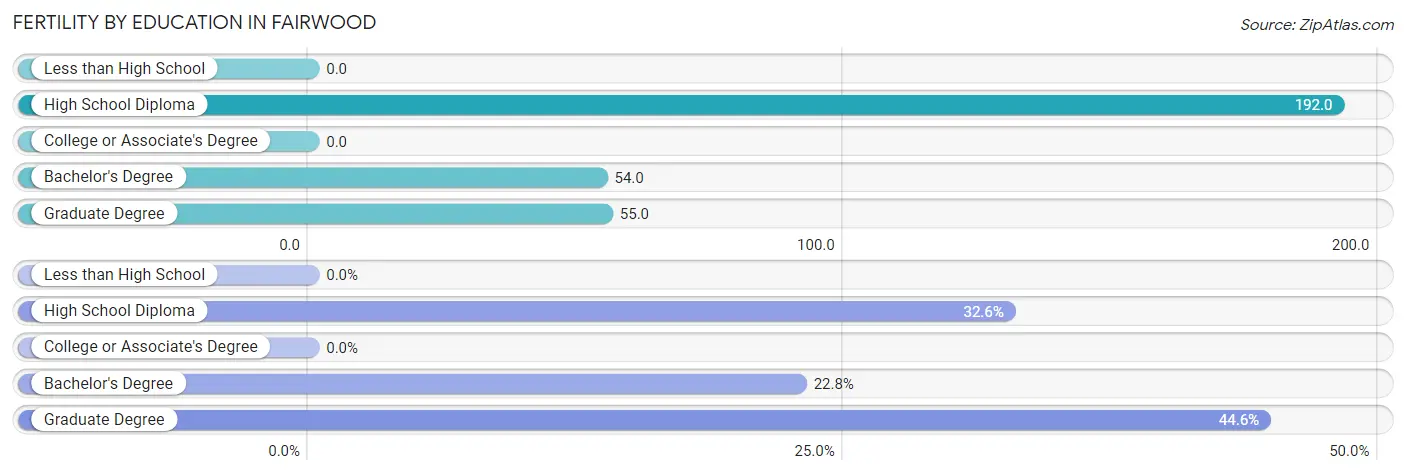
| Educational Attainment | Women with Births | Births / 1,000 Women |
| Less than High School | 0 (0.0%) | 0.0 |
| High School Diploma | 30 (32.6%) | 192.0 |
| College or Associate's Degree | 0 (0.0%) | 0.0 |
| Bachelor's Degree | 21 (22.8%) | 54.0 |
| Graduate Degree | 41 (44.6%) | 55.0 |
| Total | 92 (100.0%) | 55.0 |
Fertility by Education by Marriage Status in Fairwood
35.9% of women with births in Fairwood are unmarried. Women with the educational attainment of high school diploma are most likely to be married with 100.0% of them married at childbirth, while women with the educational attainment of graduate degree are least likely to be married with 80.5% of them unmarried at childbirth.
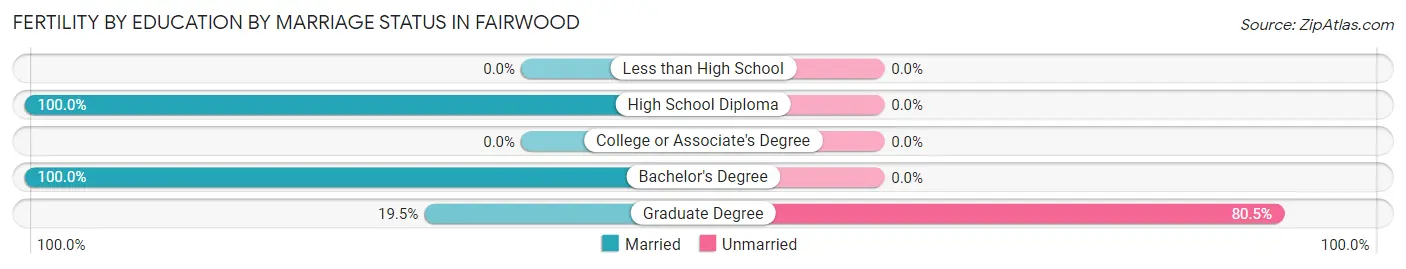
| Educational Attainment | Married | Unmarried |
| Less than High School | 0 (0.0%) | 0 (0.0%) |
| High School Diploma | 30 (100.0%) | 0 (0.0%) |
| College or Associate's Degree | 0 (0.0%) | 0 (0.0%) |
| Bachelor's Degree | 21 (100.0%) | 0 (0.0%) |
| Graduate Degree | 8 (19.5%) | 33 (80.5%) |
| Total | 59 (64.1%) | 33 (35.9%) |
Employment Characteristics in Fairwood
Employment by Class of Employer in Fairwood
Among the 4,347 employed individuals in Fairwood, private company employees (1,729 | 39.8%), federal government employees (1,354 | 31.1%), and not-for-profit organizations (452 | 10.4%) make up the most common classes of employment.
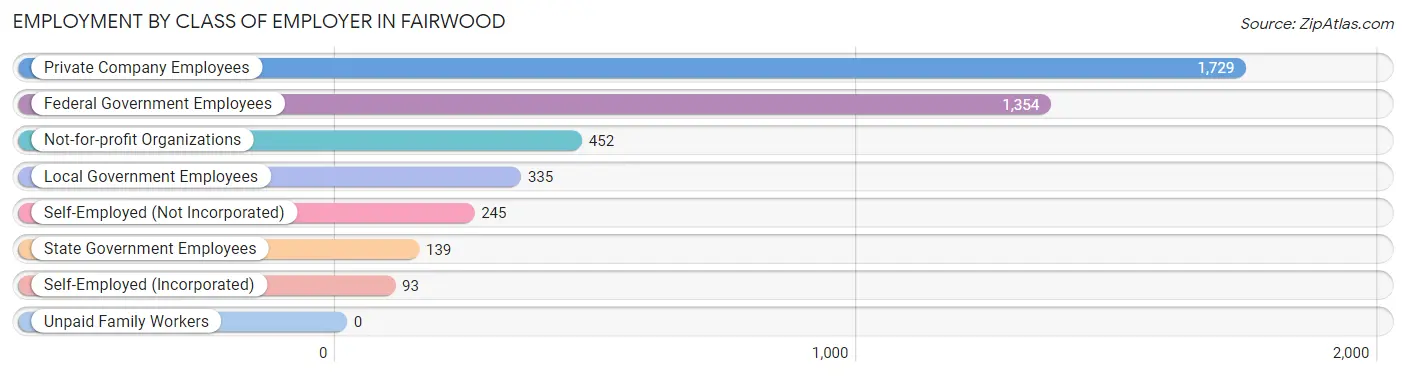
| Employer Class | # Employees | % Employees |
| Private Company Employees | 1,729 | 39.8% |
| Self-Employed (Incorporated) | 93 | 2.1% |
| Self-Employed (Not Incorporated) | 245 | 5.6% |
| Not-for-profit Organizations | 452 | 10.4% |
| Local Government Employees | 335 | 7.7% |
| State Government Employees | 139 | 3.2% |
| Federal Government Employees | 1,354 | 31.1% |
| Unpaid Family Workers | 0 | 0.0% |
| Total | 4,347 | 100.0% |
Employment Status by Age in Fairwood
According to the labor force statistics for Fairwood, out of the total population over 16 years of age (5,463), 81.4% or 4,447 individuals are in the labor force, with 2.0% or 89 of them unemployed. The age group with the highest labor force participation rate is 35 to 44 years, with 96.4% or 1,060 individuals in the labor force. Within the labor force, the 16 to 19 years age range has the highest percentage of unemployed individuals, with 13.0% or 7 of them being unemployed.
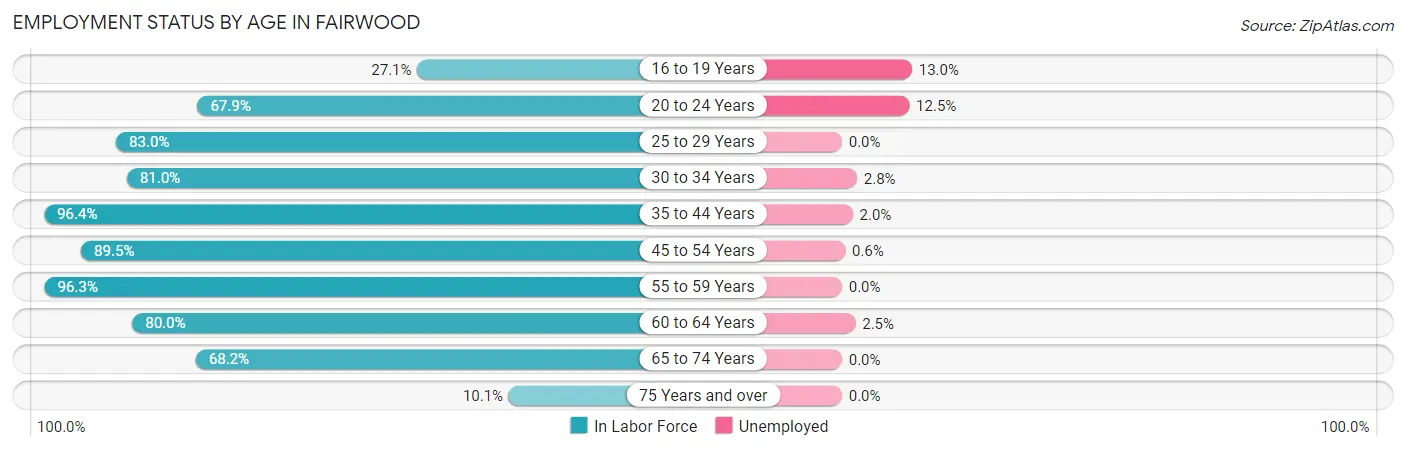
| Age Bracket | In Labor Force | Unemployed |
| 16 to 19 Years | 54 (27.1%) | 7 (13.0%) |
| 20 to 24 Years | 273 (67.9%) | 34 (12.5%) |
| 25 to 29 Years | 253 (83.0%) | 0 (0.0%) |
| 30 to 34 Years | 282 (81.0%) | 8 (2.8%) |
| 35 to 44 Years | 1,060 (96.4%) | 21 (2.0%) |
| 45 to 54 Years | 1,197 (89.5%) | 7 (0.6%) |
| 55 to 59 Years | 500 (96.3%) | 0 (0.0%) |
| 60 to 64 Years | 475 (80.0%) | 12 (2.5%) |
| 65 to 74 Years | 334 (68.2%) | 0 (0.0%) |
| 75 Years and over | 17 (10.1%) | 0 (0.0%) |
| Total | 4,447 (81.4%) | 89 (2.0%) |
Employment Status by Educational Attainment in Fairwood
According to labor force statistics for Fairwood, 89.6% of individuals (3,766) out of the total population between 25 and 64 years of age (4,203) are in the labor force, with 1.3% or 49 of them being unemployed. The group with the highest labor force participation rate are those with the educational attainment of bachelor's degree or higher, with 92.2% or 2,789 individuals in the labor force. Within the labor force, individuals with college / associate degree education have the highest percentage of unemployment, with 2.6% or 15 of them being unemployed.
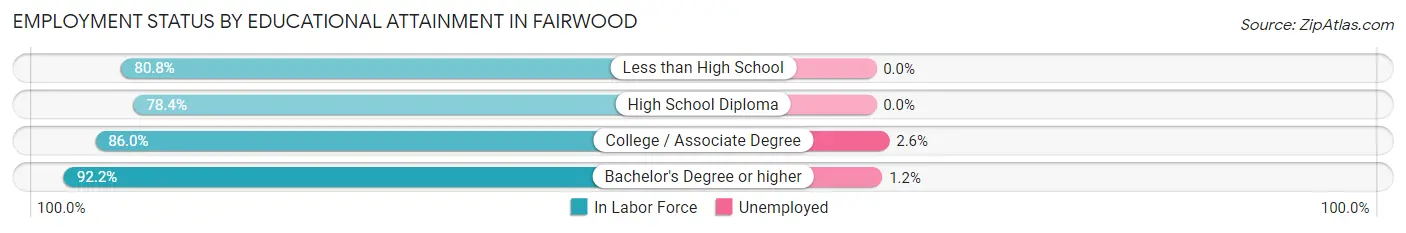
| Educational Attainment | In Labor Force | Unemployed |
| Less than High School | 80 (80.8%) | 0 (0.0%) |
| High School Diploma | 313 (78.4%) | 0 (0.0%) |
| College / Associate Degree | 585 (86.0%) | 18 (2.6%) |
| Bachelor's Degree or higher | 2,789 (92.2%) | 36 (1.2%) |
| Total | 3,766 (89.6%) | 55 (1.3%) |
Employment Occupations by Sex in Fairwood
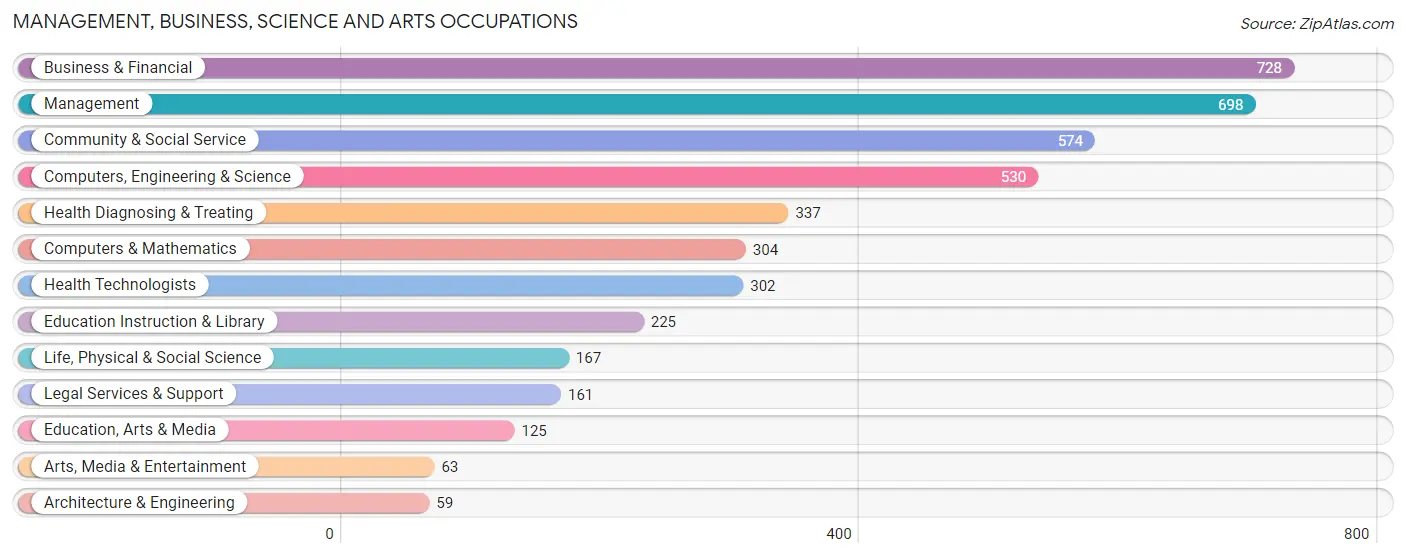
Management, Business, Science and Arts Occupations
The most common Management, Business, Science and Arts occupations in Fairwood are Business & Financial (728 | 16.8%), Management (698 | 16.1%), Community & Social Service (574 | 13.3%), Computers, Engineering & Science (530 | 12.2%), and Health Diagnosing & Treating (337 | 7.8%).
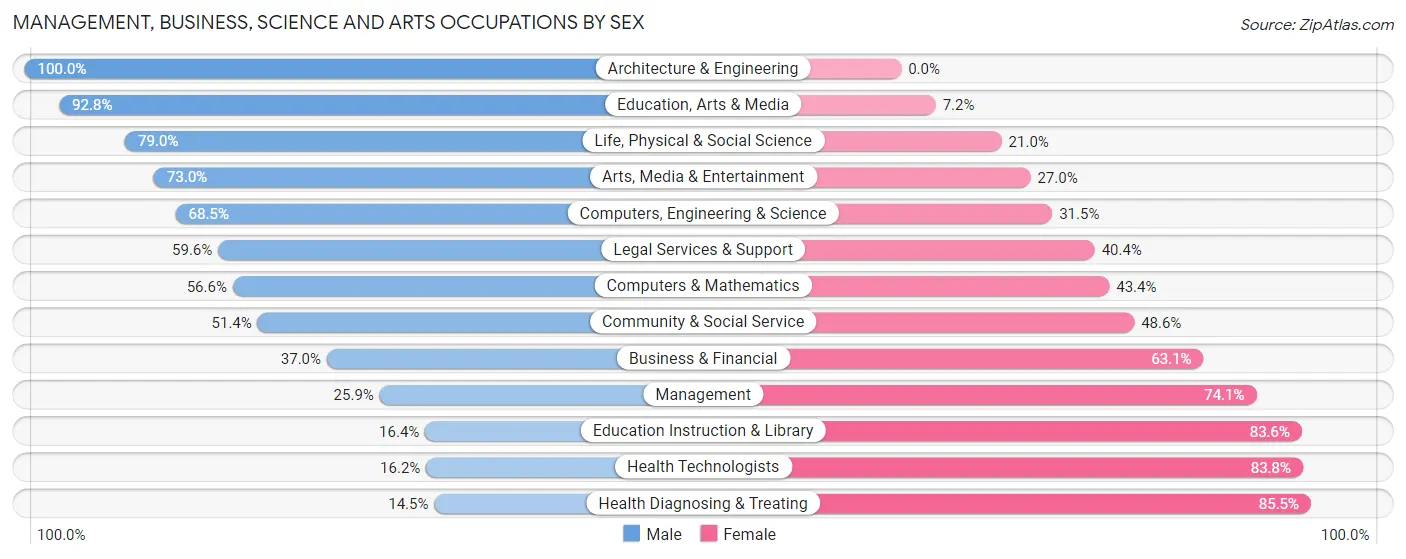
Management, Business, Science and Arts Occupations by Sex
Within the Management, Business, Science and Arts occupations in Fairwood, the most male-oriented occupations are Architecture & Engineering (100.0%), Education, Arts & Media (92.8%), and Life, Physical & Social Science (79.0%), while the most female-oriented occupations are Health Diagnosing & Treating (85.5%), Health Technologists (83.8%), and Education Instruction & Library (83.6%).
| Occupation | Male | Female |
| Management | 181 (25.9%) | 517 (74.1%) |
| Business & Financial | 269 (36.9%) | 459 (63.0%) |
| Computers, Engineering & Science | 363 (68.5%) | 167 (31.5%) |
| Computers & Mathematics | 172 (56.6%) | 132 (43.4%) |
| Architecture & Engineering | 59 (100.0%) | 0 (0.0%) |
| Life, Physical & Social Science | 132 (79.0%) | 35 (21.0%) |
| Community & Social Service | 295 (51.4%) | 279 (48.6%) |
| Education, Arts & Media | 116 (92.8%) | 9 (7.2%) |
| Legal Services & Support | 96 (59.6%) | 65 (40.4%) |
| Education Instruction & Library | 37 (16.4%) | 188 (83.6%) |
| Arts, Media & Entertainment | 46 (73.0%) | 17 (27.0%) |
| Health Diagnosing & Treating | 49 (14.5%) | 288 (85.5%) |
| Health Technologists | 49 (16.2%) | 253 (83.8%) |
| Total (Category) | 1,157 (40.4%) | 1,710 (59.6%) |
| Total (Overall) | 2,007 (46.4%) | 2,319 (53.6%) |
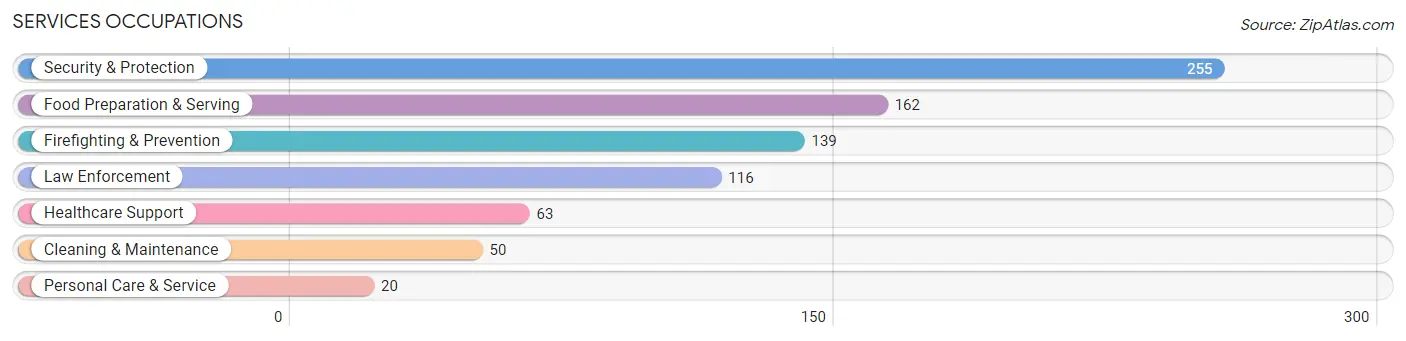
Services Occupations
The most common Services occupations in Fairwood are Security & Protection (255 | 5.9%), Food Preparation & Serving (162 | 3.7%), Firefighting & Prevention (139 | 3.2%), Law Enforcement (116 | 2.7%), and Healthcare Support (63 | 1.5%).
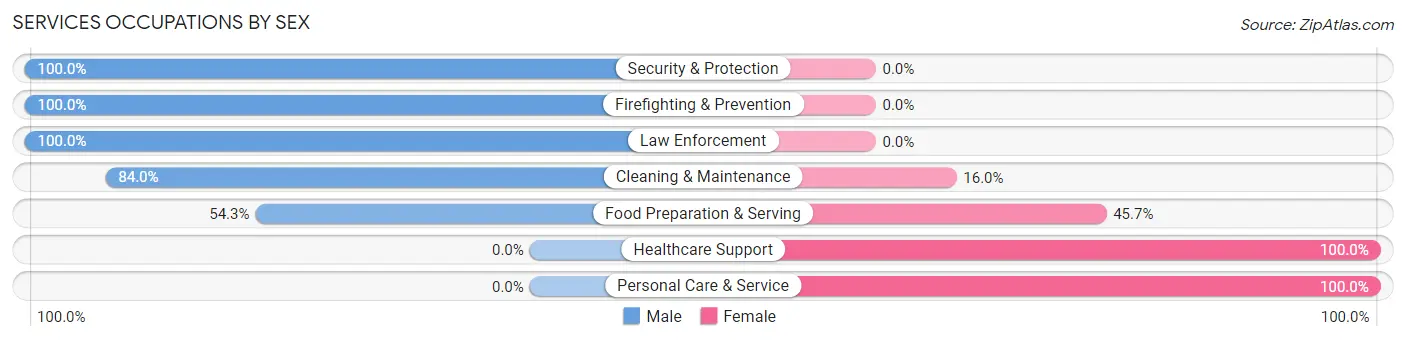
Services Occupations by Sex
Within the Services occupations in Fairwood, the most male-oriented occupations are Security & Protection (100.0%), Firefighting & Prevention (100.0%), and Law Enforcement (100.0%), while the most female-oriented occupations are Healthcare Support (100.0%), Personal Care & Service (100.0%), and Food Preparation & Serving (45.7%).
| Occupation | Male | Female |
| Healthcare Support | 0 (0.0%) | 63 (100.0%) |
| Security & Protection | 255 (100.0%) | 0 (0.0%) |
| Firefighting & Prevention | 139 (100.0%) | 0 (0.0%) |
| Law Enforcement | 116 (100.0%) | 0 (0.0%) |
| Food Preparation & Serving | 88 (54.3%) | 74 (45.7%) |
| Cleaning & Maintenance | 42 (84.0%) | 8 (16.0%) |
| Personal Care & Service | 0 (0.0%) | 20 (100.0%) |
| Total (Category) | 385 (70.0%) | 165 (30.0%) |
| Total (Overall) | 2,007 (46.4%) | 2,319 (53.6%) |
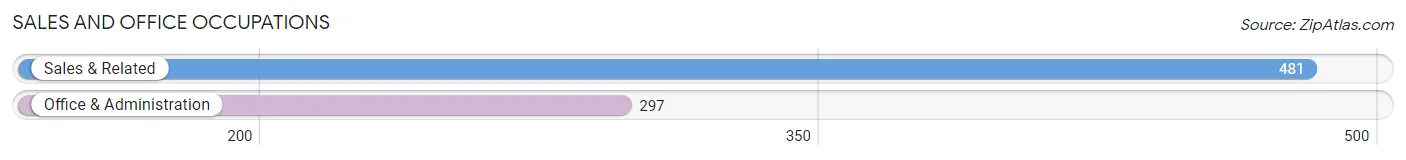
Sales and Office Occupations
The most common Sales and Office occupations in Fairwood are Sales & Related (481 | 11.1%), and Office & Administration (297 | 6.9%).
Sales and Office Occupations by Sex
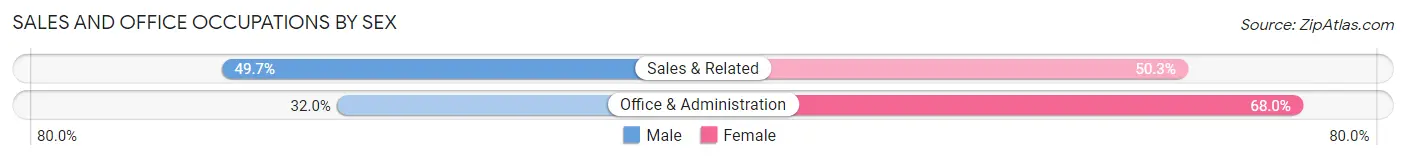
| Occupation | Male | Female |
| Sales & Related | 239 (49.7%) | 242 (50.3%) |
| Office & Administration | 95 (32.0%) | 202 (68.0%) |
| Total (Category) | 334 (42.9%) | 444 (57.1%) |
| Total (Overall) | 2,007 (46.4%) | 2,319 (53.6%) |
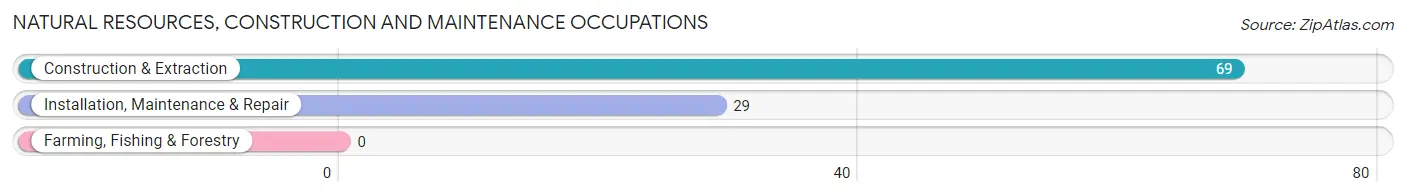
Natural Resources, Construction and Maintenance Occupations
The most common Natural Resources, Construction and Maintenance occupations in Fairwood are Construction & Extraction (69 | 1.6%), and Installation, Maintenance & Repair (29 | 0.7%).
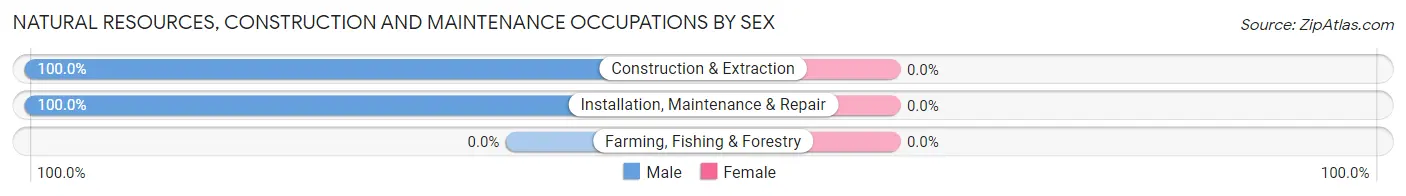
Natural Resources, Construction and Maintenance Occupations by Sex
| Occupation | Male | Female |
| Farming, Fishing & Forestry | 0 (0.0%) | 0 (0.0%) |
| Construction & Extraction | 69 (100.0%) | 0 (0.0%) |
| Installation, Maintenance & Repair | 29 (100.0%) | 0 (0.0%) |
| Total (Category) | 98 (100.0%) | 0 (0.0%) |
| Total (Overall) | 2,007 (46.4%) | 2,319 (53.6%) |
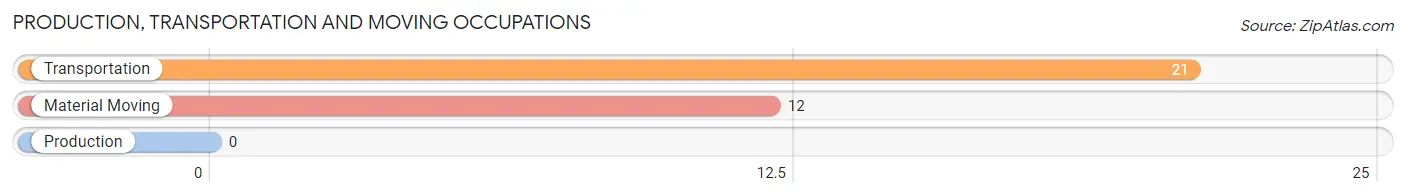
Production, Transportation and Moving Occupations
The most common Production, Transportation and Moving occupations in Fairwood are Transportation (21 | 0.5%), and Material Moving (12 | 0.3%).
Production, Transportation and Moving Occupations by Sex
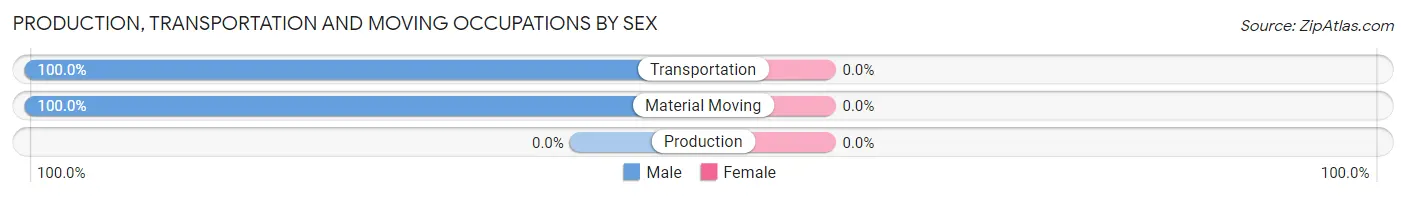
| Occupation | Male | Female |
| Production | 0 (0.0%) | 0 (0.0%) |
| Transportation | 21 (100.0%) | 0 (0.0%) |
| Material Moving | 12 (100.0%) | 0 (0.0%) |
| Total (Category) | 33 (100.0%) | 0 (0.0%) |
| Total (Overall) | 2,007 (46.4%) | 2,319 (53.6%) |
Employment Industries by Sex in Fairwood
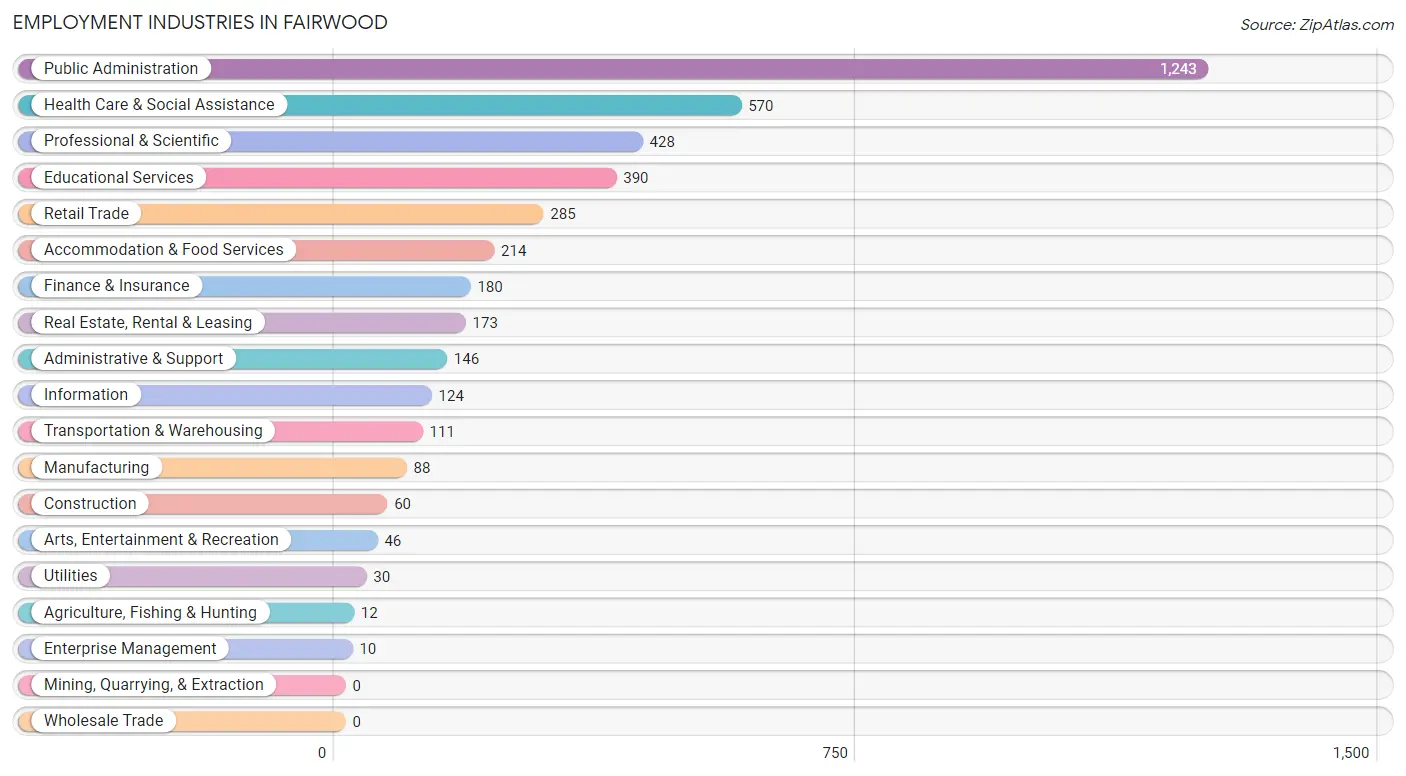
Employment Industries in Fairwood
The major employment industries in Fairwood include Public Administration (1,243 | 28.7%), Health Care & Social Assistance (570 | 13.2%), Professional & Scientific (428 | 9.9%), Educational Services (390 | 9.0%), and Retail Trade (285 | 6.6%).
Employment Industries by Sex in Fairwood
The Fairwood industries that see more men than women are Agriculture, Fishing & Hunting (100.0%), Transportation & Warehousing (100.0%), and Enterprise Management (100.0%), whereas the industries that tend to have a higher number of women are Utilities (100.0%), Health Care & Social Assistance (86.5%), and Educational Services (80.0%).
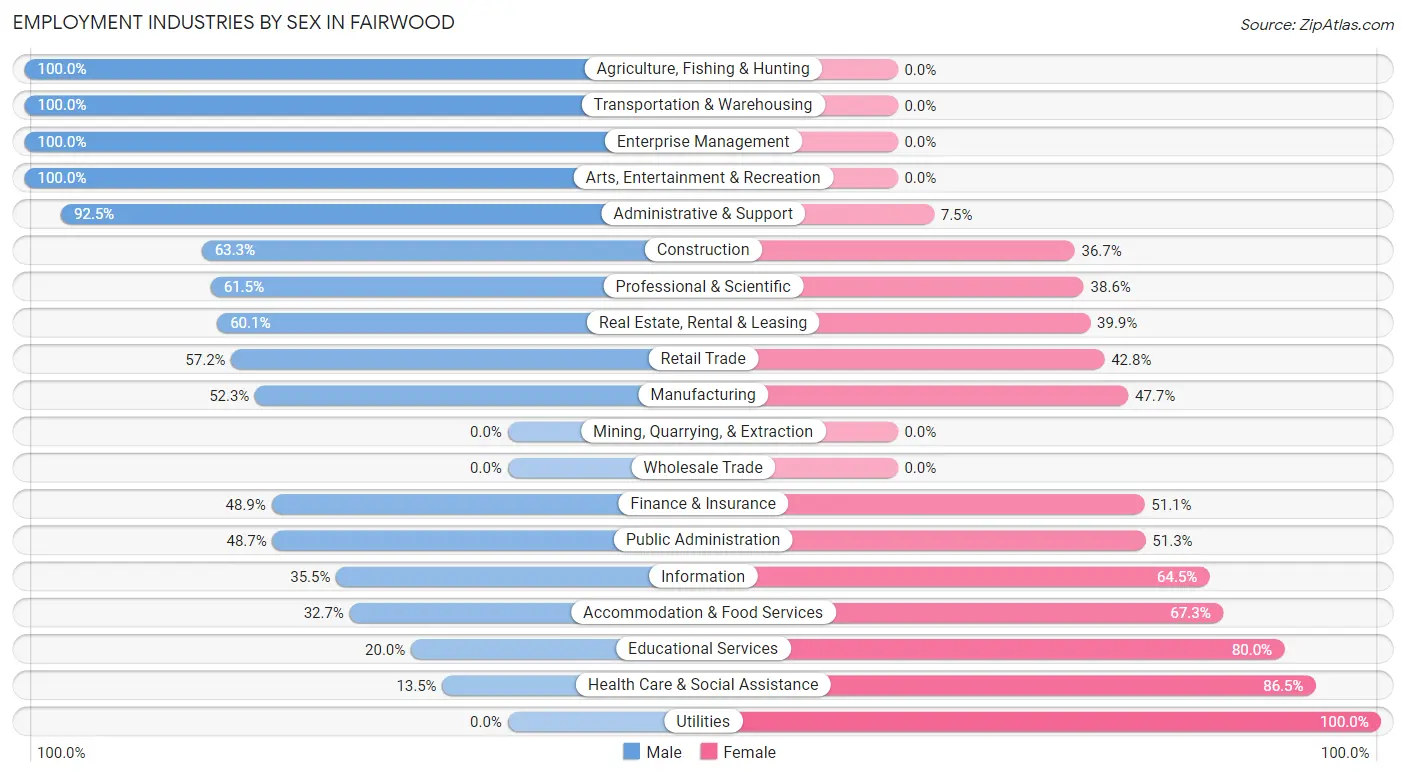
| Industry | Male | Female |
| Agriculture, Fishing & Hunting | 12 (100.0%) | 0 (0.0%) |
| Mining, Quarrying, & Extraction | 0 (0.0%) | 0 (0.0%) |
| Construction | 38 (63.3%) | 22 (36.7%) |
| Manufacturing | 46 (52.3%) | 42 (47.7%) |
| Wholesale Trade | 0 (0.0%) | 0 (0.0%) |
| Retail Trade | 163 (57.2%) | 122 (42.8%) |
| Transportation & Warehousing | 111 (100.0%) | 0 (0.0%) |
| Utilities | 0 (0.0%) | 30 (100.0%) |
| Information | 44 (35.5%) | 80 (64.5%) |
| Finance & Insurance | 88 (48.9%) | 92 (51.1%) |
| Real Estate, Rental & Leasing | 104 (60.1%) | 69 (39.9%) |
| Professional & Scientific | 263 (61.5%) | 165 (38.6%) |
| Enterprise Management | 10 (100.0%) | 0 (0.0%) |
| Administrative & Support | 135 (92.5%) | 11 (7.5%) |
| Educational Services | 78 (20.0%) | 312 (80.0%) |
| Health Care & Social Assistance | 77 (13.5%) | 493 (86.5%) |
| Arts, Entertainment & Recreation | 46 (100.0%) | 0 (0.0%) |
| Accommodation & Food Services | 70 (32.7%) | 144 (67.3%) |
| Public Administration | 605 (48.7%) | 638 (51.3%) |
| Total | 2,007 (46.4%) | 2,319 (53.6%) |
Education in Fairwood
School Enrollment in Fairwood
The most common levels of schooling among the 2,144 students in Fairwood are college / undergraduate (507 | 23.6%), elementary school (467 | 21.8%), and middle school (455 | 21.2%).
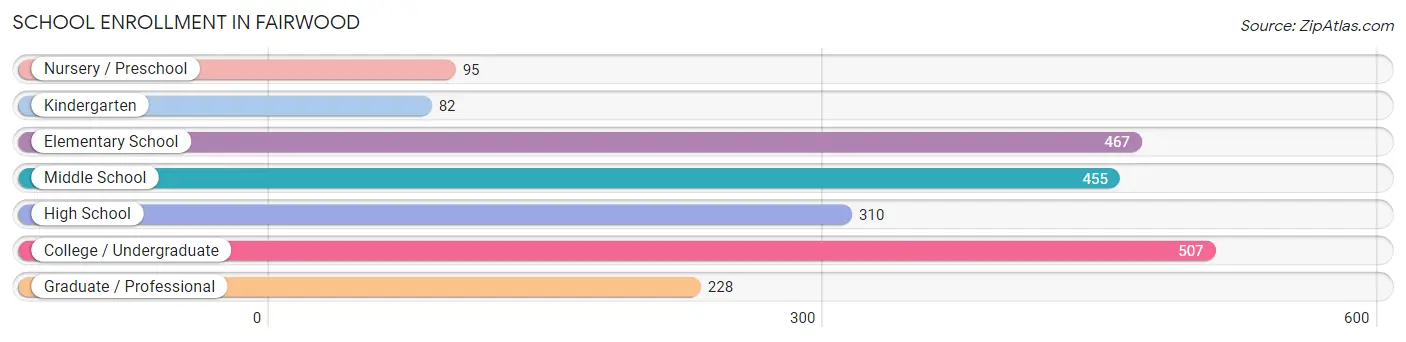
| School Level | # Students | % Students |
| Nursery / Preschool | 95 | 4.4% |
| Kindergarten | 82 | 3.8% |
| Elementary School | 467 | 21.8% |
| Middle School | 455 | 21.2% |
| High School | 310 | 14.5% |
| College / Undergraduate | 507 | 23.6% |
| Graduate / Professional | 228 | 10.6% |
| Total | 2,144 | 100.0% |
School Enrollment by Age by Funding Source in Fairwood
Out of a total of 2,144 students who are enrolled in schools in Fairwood, 716 (33.4%) attend a private institution, while the remaining 1,428 (66.6%) are enrolled in public schools. The age group of 3 to 4 year olds has the highest likelihood of being enrolled in private schools, with 36 (53.7% in the age bracket) enrolled. Conversely, the age group of 20 to 24 year olds has the lowest likelihood of being enrolled in a private school, with 252 (86.0% in the age bracket) attending a public institution.
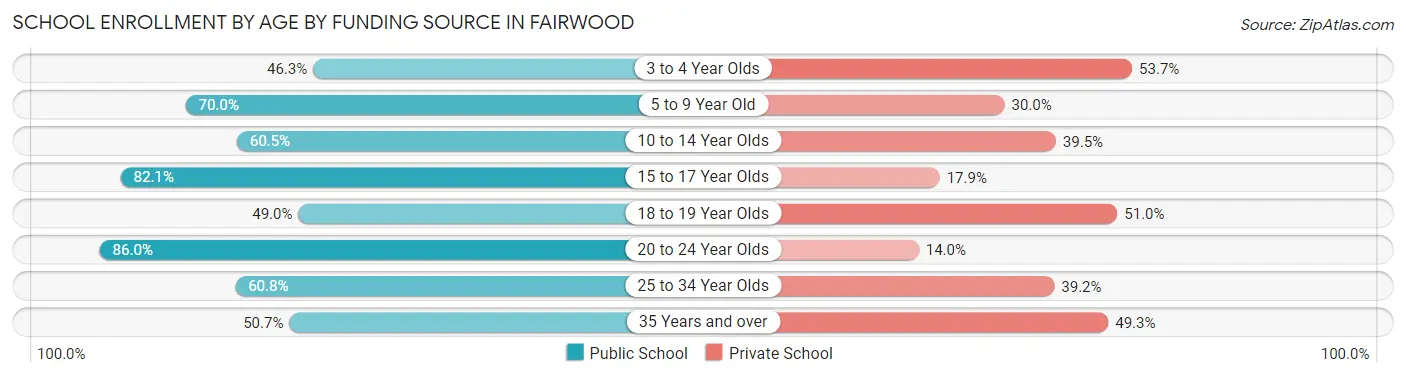
| Age Bracket | Public School | Private School |
| 3 to 4 Year Olds | 31 (46.3%) | 36 (53.7%) |
| 5 to 9 Year Old | 418 (70.0%) | 179 (30.0%) |
| 10 to 14 Year Olds | 306 (60.5%) | 200 (39.5%) |
| 15 to 17 Year Olds | 179 (82.1%) | 39 (17.9%) |
| 18 to 19 Year Olds | 50 (49.0%) | 52 (51.0%) |
| 20 to 24 Year Olds | 252 (86.0%) | 41 (14.0%) |
| 25 to 34 Year Olds | 48 (60.8%) | 31 (39.2%) |
| 35 Years and over | 143 (50.7%) | 139 (49.3%) |
| Total | 1,428 (66.6%) | 716 (33.4%) |
Educational Attainment by Field of Study in Fairwood
Business (1,308 | 36.1%), social sciences (538 | 14.9%), science & technology (375 | 10.4%), education (280 | 7.7%), and bio, nature & agricultural (239 | 6.6%) are the most common fields of study among 3,619 individuals in Fairwood who have obtained a bachelor's degree or higher.
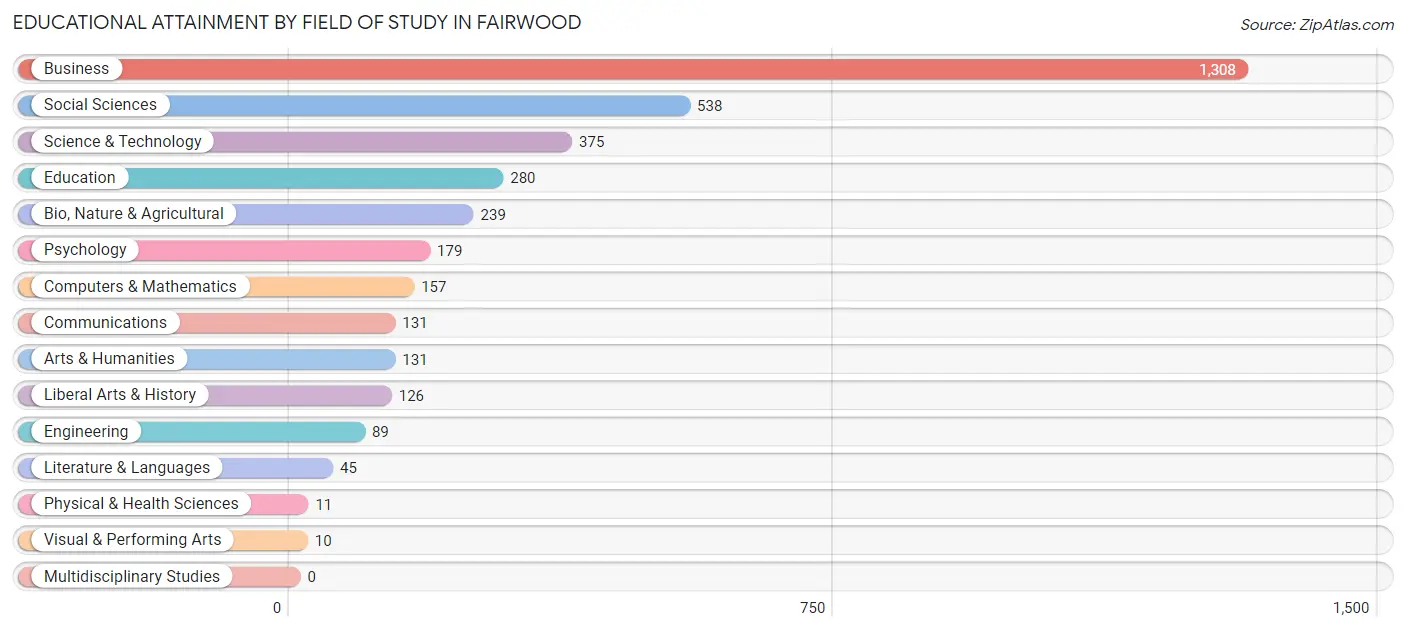
| Field of Study | # Graduates | % Graduates |
| Computers & Mathematics | 157 | 4.3% |
| Bio, Nature & Agricultural | 239 | 6.6% |
| Physical & Health Sciences | 11 | 0.3% |
| Psychology | 179 | 5.0% |
| Social Sciences | 538 | 14.9% |
| Engineering | 89 | 2.5% |
| Multidisciplinary Studies | 0 | 0.0% |
| Science & Technology | 375 | 10.4% |
| Business | 1,308 | 36.1% |
| Education | 280 | 7.7% |
| Literature & Languages | 45 | 1.2% |
| Liberal Arts & History | 126 | 3.5% |
| Visual & Performing Arts | 10 | 0.3% |
| Communications | 131 | 3.6% |
| Arts & Humanities | 131 | 3.6% |
| Total | 3,619 | 100.0% |
Transportation & Commute in Fairwood
Vehicle Availability by Sex in Fairwood
The most prevalent vehicle ownership categories in Fairwood are males with 2 vehicles (887, accounting for 43.8%) and females with 2 vehicles (909, making up 38.2%).
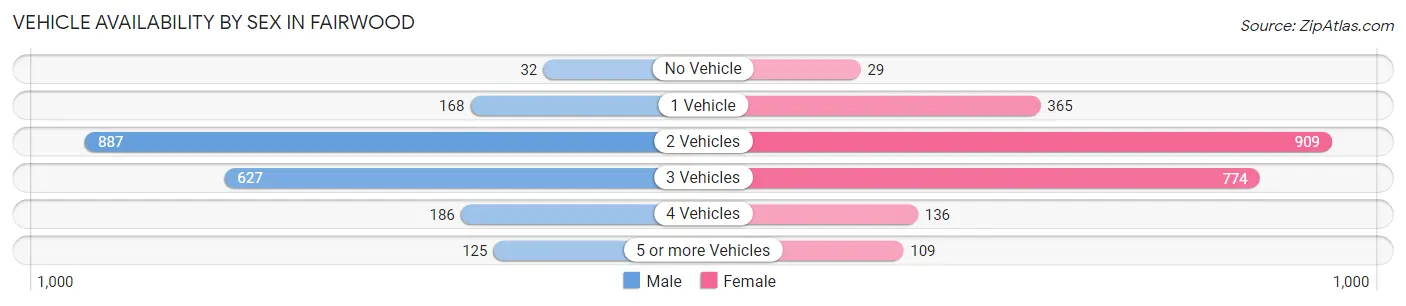
| Vehicles Available | Male | Female |
| No Vehicle | 32 (1.6%) | 29 (1.3%) |
| 1 Vehicle | 168 (8.3%) | 365 (15.7%) |
| 2 Vehicles | 887 (43.8%) | 909 (39.2%) |
| 3 Vehicles | 627 (31.0%) | 774 (33.3%) |
| 4 Vehicles | 186 (9.2%) | 136 (5.9%) |
| 5 or more Vehicles | 125 (6.2%) | 109 (4.7%) |
| Total | 2,025 (100.0%) | 2,322 (100.0%) |
Commute Time in Fairwood
The most frequently occuring commute durations in Fairwood are 30 to 34 minutes (781 commuters, 23.9%), 60 to 89 minutes (645 commuters, 19.7%), and 45 to 59 minutes (572 commuters, 17.5%).
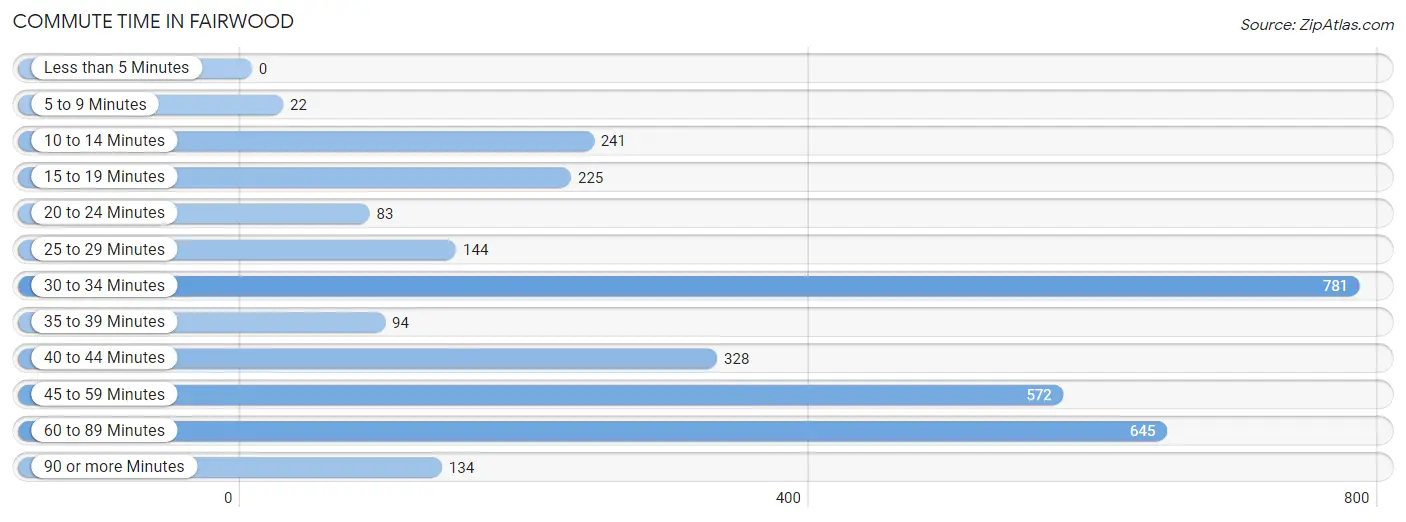
| Commute Time | # Commuters | % Commuters |
| Less than 5 Minutes | 0 | 0.0% |
| 5 to 9 Minutes | 22 | 0.7% |
| 10 to 14 Minutes | 241 | 7.4% |
| 15 to 19 Minutes | 225 | 6.9% |
| 20 to 24 Minutes | 83 | 2.5% |
| 25 to 29 Minutes | 144 | 4.4% |
| 30 to 34 Minutes | 781 | 23.9% |
| 35 to 39 Minutes | 94 | 2.9% |
| 40 to 44 Minutes | 328 | 10.0% |
| 45 to 59 Minutes | 572 | 17.5% |
| 60 to 89 Minutes | 645 | 19.7% |
| 90 or more Minutes | 134 | 4.1% |
Commute Time by Sex in Fairwood
The most common commute times in Fairwood are 30 to 34 minutes (397 commuters, 23.9%) for males and 30 to 34 minutes (384 commuters, 23.9%) for females.
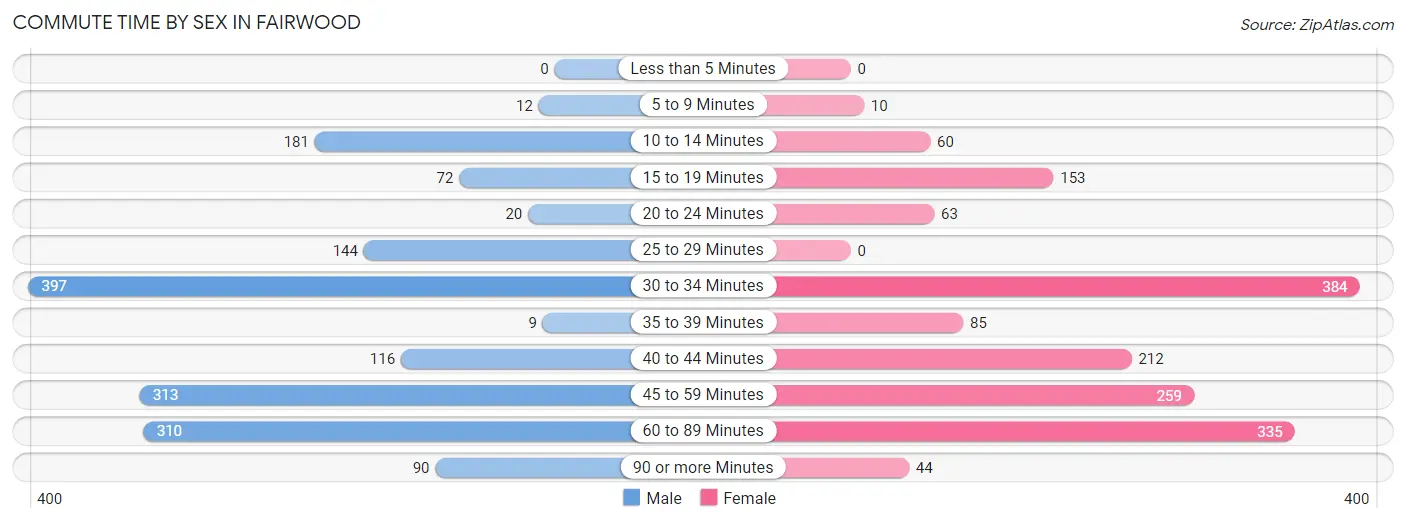
| Commute Time | Male | Female |
| Less than 5 Minutes | 0 (0.0%) | 0 (0.0%) |
| 5 to 9 Minutes | 12 (0.7%) | 10 (0.6%) |
| 10 to 14 Minutes | 181 (10.9%) | 60 (3.7%) |
| 15 to 19 Minutes | 72 (4.3%) | 153 (9.5%) |
| 20 to 24 Minutes | 20 (1.2%) | 63 (3.9%) |
| 25 to 29 Minutes | 144 (8.6%) | 0 (0.0%) |
| 30 to 34 Minutes | 397 (23.9%) | 384 (23.9%) |
| 35 to 39 Minutes | 9 (0.5%) | 85 (5.3%) |
| 40 to 44 Minutes | 116 (7.0%) | 212 (13.2%) |
| 45 to 59 Minutes | 313 (18.8%) | 259 (16.1%) |
| 60 to 89 Minutes | 310 (18.6%) | 335 (20.9%) |
| 90 or more Minutes | 90 (5.4%) | 44 (2.7%) |
Time of Departure to Work by Sex in Fairwood
The most frequent times of departure to work in Fairwood are 9:00 AM to 9:59 AM (369, 22.2%) for males and 7:00 AM to 7:29 AM (242, 15.1%) for females.
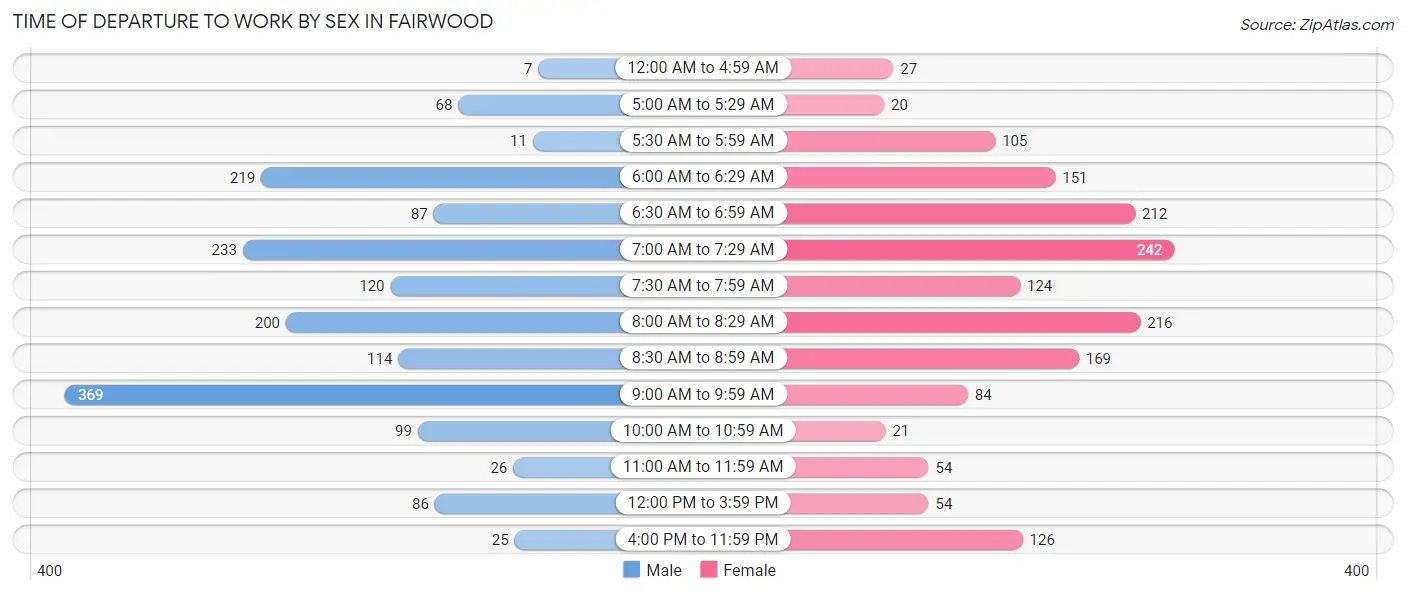
| Time of Departure | Male | Female |
| 12:00 AM to 4:59 AM | 7 (0.4%) | 27 (1.7%) |
| 5:00 AM to 5:29 AM | 68 (4.1%) | 20 (1.3%) |
| 5:30 AM to 5:59 AM | 11 (0.7%) | 105 (6.5%) |
| 6:00 AM to 6:29 AM | 219 (13.2%) | 151 (9.4%) |
| 6:30 AM to 6:59 AM | 87 (5.2%) | 212 (13.2%) |
| 7:00 AM to 7:29 AM | 233 (14.0%) | 242 (15.1%) |
| 7:30 AM to 7:59 AM | 120 (7.2%) | 124 (7.7%) |
| 8:00 AM to 8:29 AM | 200 (12.0%) | 216 (13.5%) |
| 8:30 AM to 8:59 AM | 114 (6.9%) | 169 (10.5%) |
| 9:00 AM to 9:59 AM | 369 (22.2%) | 84 (5.2%) |
| 10:00 AM to 10:59 AM | 99 (5.9%) | 21 (1.3%) |
| 11:00 AM to 11:59 AM | 26 (1.6%) | 54 (3.4%) |
| 12:00 PM to 3:59 PM | 86 (5.2%) | 54 (3.4%) |
| 4:00 PM to 11:59 PM | 25 (1.5%) | 126 (7.9%) |
| Total | 1,664 (100.0%) | 1,605 (100.0%) |
Housing Occupancy in Fairwood
Occupancy by Ownership in Fairwood
Of the total 2,420 dwellings in Fairwood, owner-occupied units account for 2,257 (93.3%), while renter-occupied units make up 163 (6.7%).
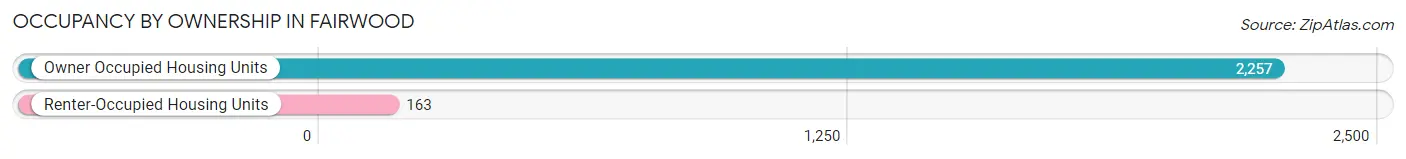
| Occupancy | # Housing Units | % Housing Units |
| Owner Occupied Housing Units | 2,257 | 93.3% |
| Renter-Occupied Housing Units | 163 | 6.7% |
| Total Occupied Housing Units | 2,420 | 100.0% |
Occupancy by Household Size in Fairwood
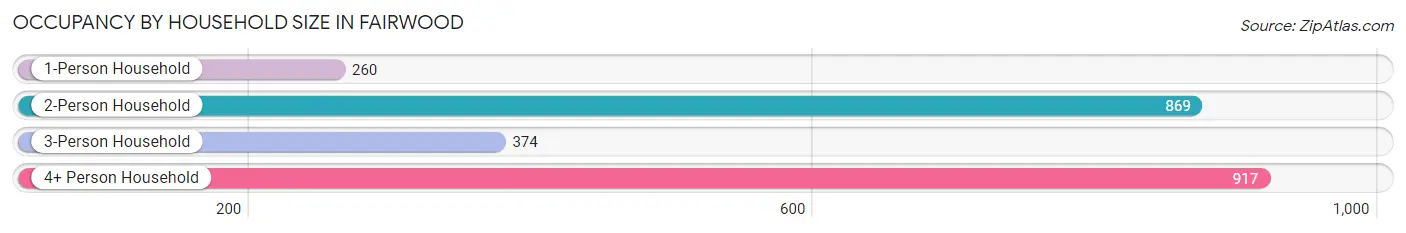
| Household Size | # Housing Units | % Housing Units |
| 1-Person Household | 260 | 10.7% |
| 2-Person Household | 869 | 35.9% |
| 3-Person Household | 374 | 15.4% |
| 4+ Person Household | 917 | 37.9% |
| Total Housing Units | 2,420 | 100.0% |
Occupancy by Ownership by Household Size in Fairwood
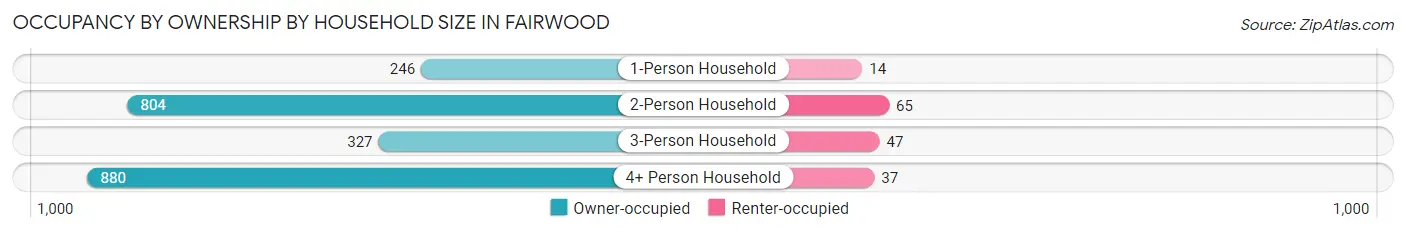
| Household Size | Owner-occupied | Renter-occupied |
| 1-Person Household | 246 (94.6%) | 14 (5.4%) |
| 2-Person Household | 804 (92.5%) | 65 (7.5%) |
| 3-Person Household | 327 (87.4%) | 47 (12.6%) |
| 4+ Person Household | 880 (96.0%) | 37 (4.0%) |
| Total Housing Units | 2,257 (93.3%) | 163 (6.7%) |
Occupancy by Educational Attainment in Fairwood
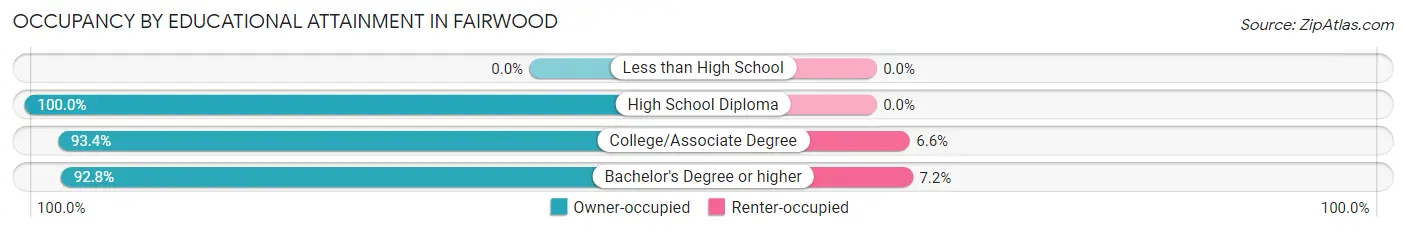
| Household Size | Owner-occupied | Renter-occupied |
| Less than High School | 0 (0.0%) | 0 (0.0%) |
| High School Diploma | 136 (100.0%) | 0 (0.0%) |
| College/Associate Degree | 227 (93.4%) | 16 (6.6%) |
| Bachelor's Degree or higher | 1,894 (92.8%) | 147 (7.2%) |
Occupancy by Age of Householder in Fairwood
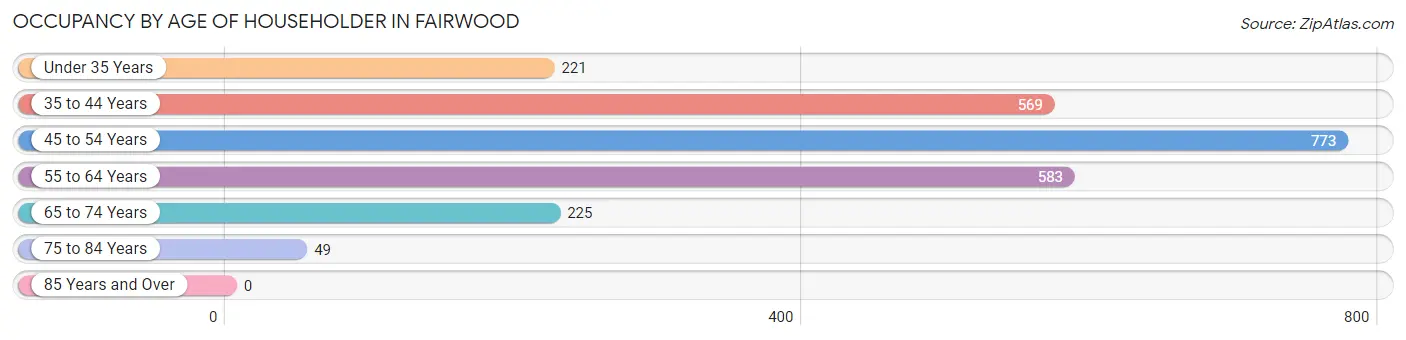
| Age Bracket | # Households | % Households |
| Under 35 Years | 221 | 9.1% |
| 35 to 44 Years | 569 | 23.5% |
| 45 to 54 Years | 773 | 31.9% |
| 55 to 64 Years | 583 | 24.1% |
| 65 to 74 Years | 225 | 9.3% |
| 75 to 84 Years | 49 | 2.0% |
| 85 Years and Over | 0 | 0.0% |
| Total | 2,420 | 100.0% |
Housing Finances in Fairwood
Median Income by Occupancy in Fairwood
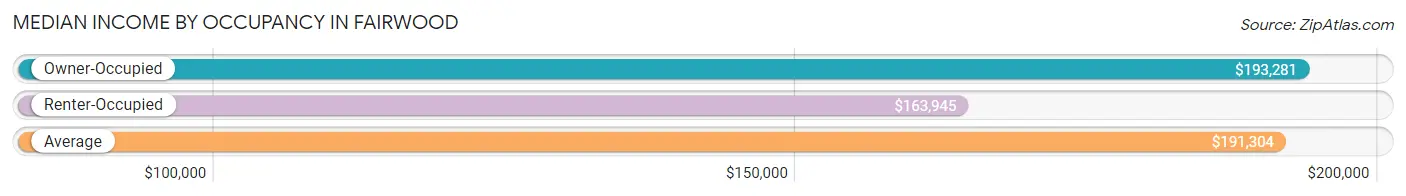
| Occupancy Type | # Households | Median Income |
| Owner-Occupied | 2,257 (93.3%) | $193,281 |
| Renter-Occupied | 163 (6.7%) | $163,945 |
| Average | 2,420 (100.0%) | $191,304 |
Occupancy by Householder Income Bracket in Fairwood
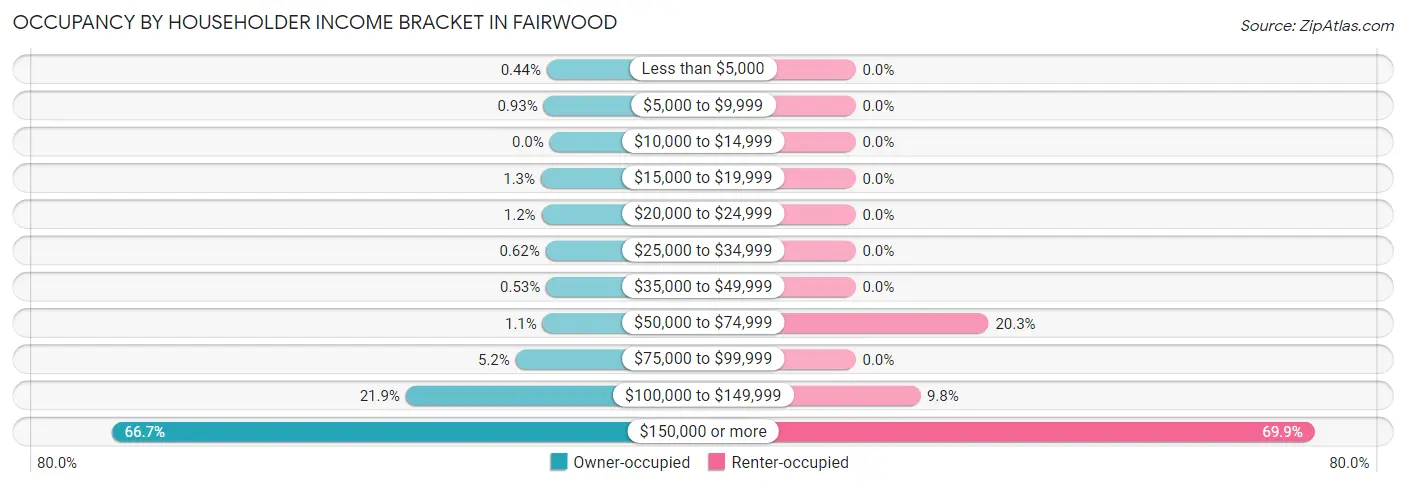
| Income Bracket | Owner-occupied | Renter-occupied |
| Less than $5,000 | 10 (0.4%) | 0 (0.0%) |
| $5,000 to $9,999 | 21 (0.9%) | 0 (0.0%) |
| $10,000 to $14,999 | 0 (0.0%) | 0 (0.0%) |
| $15,000 to $19,999 | 30 (1.3%) | 0 (0.0%) |
| $20,000 to $24,999 | 28 (1.2%) | 0 (0.0%) |
| $25,000 to $34,999 | 14 (0.6%) | 0 (0.0%) |
| $35,000 to $49,999 | 12 (0.5%) | 0 (0.0%) |
| $50,000 to $74,999 | 24 (1.1%) | 33 (20.3%) |
| $75,000 to $99,999 | 117 (5.2%) | 0 (0.0%) |
| $100,000 to $149,999 | 495 (21.9%) | 16 (9.8%) |
| $150,000 or more | 1,506 (66.7%) | 114 (69.9%) |
| Total | 2,257 (100.0%) | 163 (100.0%) |
Monthly Housing Cost Tiers in Fairwood
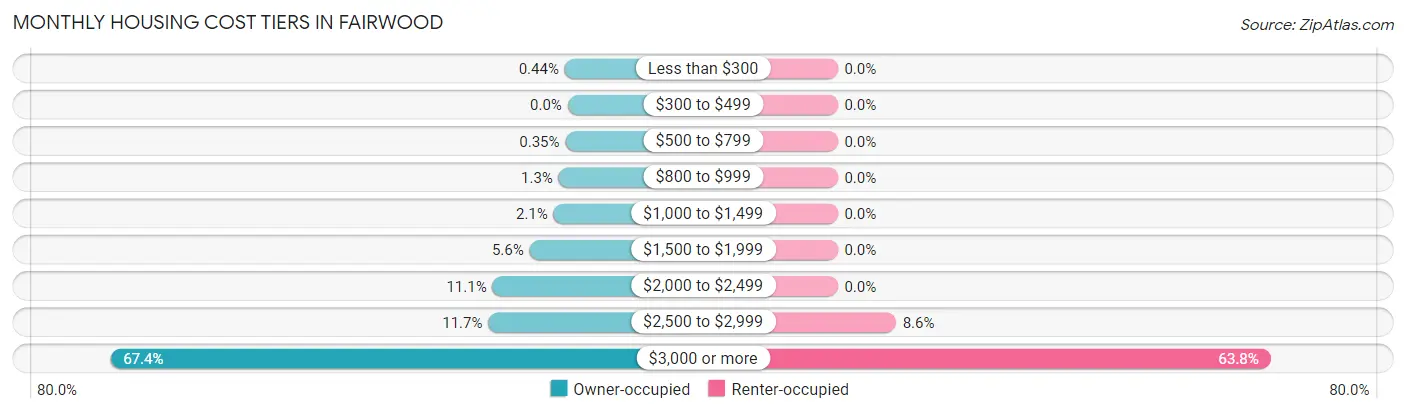
| Monthly Cost | Owner-occupied | Renter-occupied |
| Less than $300 | 10 (0.4%) | 0 (0.0%) |
| $300 to $499 | 0 (0.0%) | 0 (0.0%) |
| $500 to $799 | 8 (0.4%) | 0 (0.0%) |
| $800 to $999 | 30 (1.3%) | 0 (0.0%) |
| $1,000 to $1,499 | 47 (2.1%) | 0 (0.0%) |
| $1,500 to $1,999 | 127 (5.6%) | 0 (0.0%) |
| $2,000 to $2,499 | 250 (11.1%) | 0 (0.0%) |
| $2,500 to $2,999 | 264 (11.7%) | 14 (8.6%) |
| $3,000 or more | 1,521 (67.4%) | 104 (63.8%) |
| Total | 2,257 (100.0%) | 163 (100.0%) |
Physical Housing Characteristics in Fairwood
Housing Structures in Fairwood
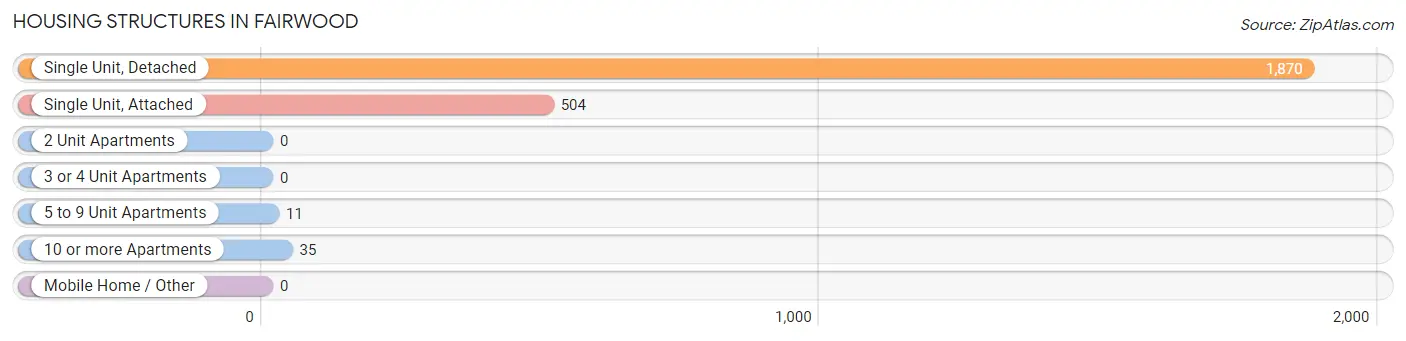
| Structure Type | # Housing Units | % Housing Units |
| Single Unit, Detached | 1,870 | 77.3% |
| Single Unit, Attached | 504 | 20.8% |
| 2 Unit Apartments | 0 | 0.0% |
| 3 or 4 Unit Apartments | 0 | 0.0% |
| 5 to 9 Unit Apartments | 11 | 0.4% |
| 10 or more Apartments | 35 | 1.5% |
| Mobile Home / Other | 0 | 0.0% |
| Total | 2,420 | 100.0% |
Housing Structures by Occupancy in Fairwood
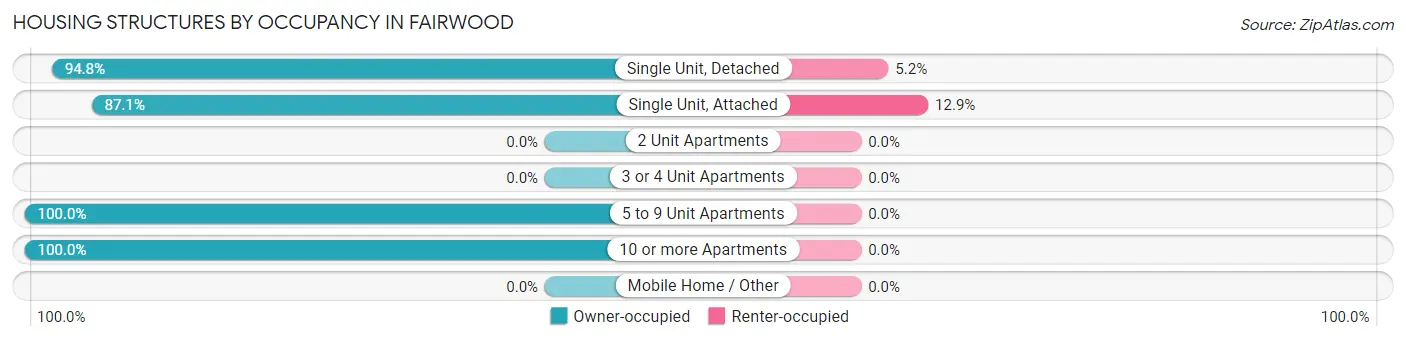
| Structure Type | Owner-occupied | Renter-occupied |
| Single Unit, Detached | 1,772 (94.8%) | 98 (5.2%) |
| Single Unit, Attached | 439 (87.1%) | 65 (12.9%) |
| 2 Unit Apartments | 0 (0.0%) | 0 (0.0%) |
| 3 or 4 Unit Apartments | 0 (0.0%) | 0 (0.0%) |
| 5 to 9 Unit Apartments | 11 (100.0%) | 0 (0.0%) |
| 10 or more Apartments | 35 (100.0%) | 0 (0.0%) |
| Mobile Home / Other | 0 (0.0%) | 0 (0.0%) |
| Total | 2,257 (93.3%) | 163 (6.7%) |
Housing Structures by Number of Rooms in Fairwood
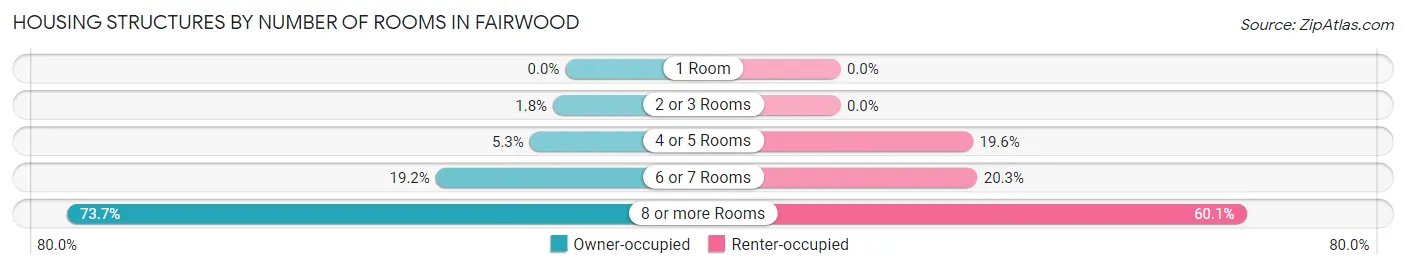
| Number of Rooms | Owner-occupied | Renter-occupied |
| 1 Room | 0 (0.0%) | 0 (0.0%) |
| 2 or 3 Rooms | 41 (1.8%) | 0 (0.0%) |
| 4 or 5 Rooms | 119 (5.3%) | 32 (19.6%) |
| 6 or 7 Rooms | 433 (19.2%) | 33 (20.3%) |
| 8 or more Rooms | 1,664 (73.7%) | 98 (60.1%) |
| Total | 2,257 (100.0%) | 163 (100.0%) |
Housing Structure by Heating Type in Fairwood
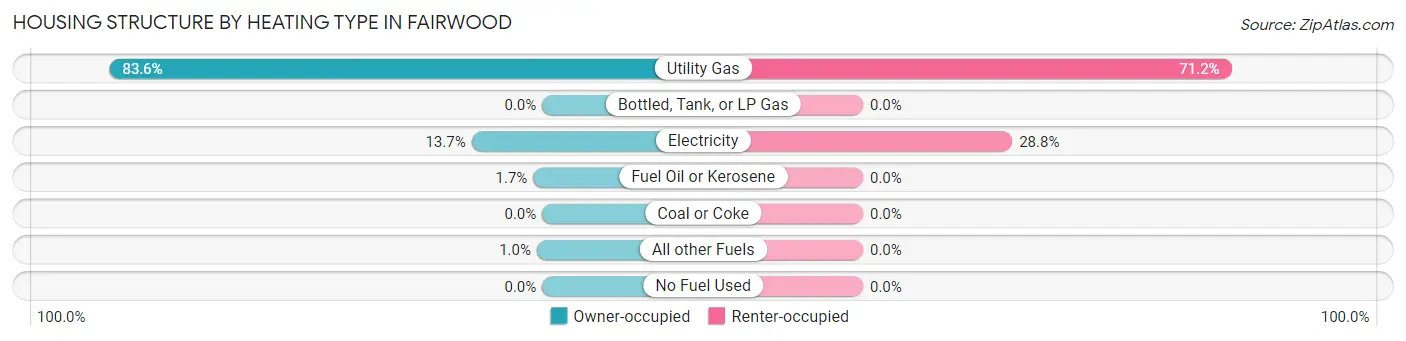
| Heating Type | Owner-occupied | Renter-occupied |
| Utility Gas | 1,887 (83.6%) | 116 (71.2%) |
| Bottled, Tank, or LP Gas | 0 (0.0%) | 0 (0.0%) |
| Electricity | 308 (13.7%) | 47 (28.8%) |
| Fuel Oil or Kerosene | 39 (1.7%) | 0 (0.0%) |
| Coal or Coke | 0 (0.0%) | 0 (0.0%) |
| All other Fuels | 23 (1.0%) | 0 (0.0%) |
| No Fuel Used | 0 (0.0%) | 0 (0.0%) |
| Total | 2,257 (100.0%) | 163 (100.0%) |
Household Vehicle Usage in Fairwood
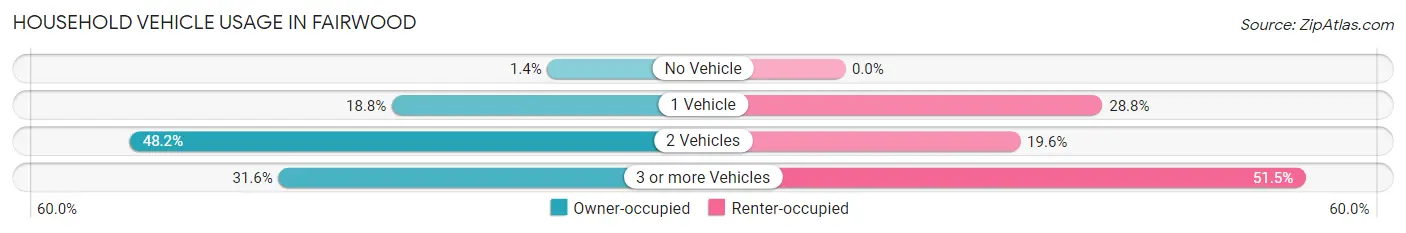
| Vehicles per Household | Owner-occupied | Renter-occupied |
| No Vehicle | 32 (1.4%) | 0 (0.0%) |
| 1 Vehicle | 425 (18.8%) | 47 (28.8%) |
| 2 Vehicles | 1,088 (48.2%) | 32 (19.6%) |
| 3 or more Vehicles | 712 (31.6%) | 84 (51.5%) |
| Total | 2,257 (100.0%) | 163 (100.0%) |
Real Estate & Mortgages in Fairwood
Real Estate and Mortgage Overview in Fairwood
| Characteristic | Without Mortgage | With Mortgage |
| Housing Units | 161 | 2,096 |
| Median Property Value | $690,100 | $666,700 |
| Median Household Income | $238,875 | $1,400 |
| Monthly Housing Costs | $1,468 | $1,521 |
| Real Estate Taxes | $8,558 | $28 |
Property Value by Mortgage Status in Fairwood
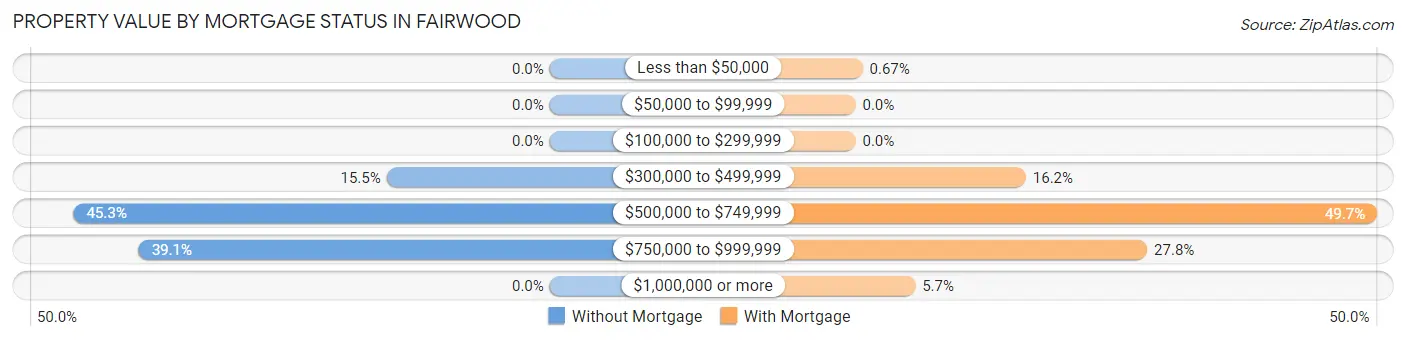
| Property Value | Without Mortgage | With Mortgage |
| Less than $50,000 | 0 (0.0%) | 14 (0.7%) |
| $50,000 to $99,999 | 0 (0.0%) | 0 (0.0%) |
| $100,000 to $299,999 | 0 (0.0%) | 0 (0.0%) |
| $300,000 to $499,999 | 25 (15.5%) | 340 (16.2%) |
| $500,000 to $749,999 | 73 (45.3%) | 1,041 (49.7%) |
| $750,000 to $999,999 | 63 (39.1%) | 582 (27.8%) |
| $1,000,000 or more | 0 (0.0%) | 119 (5.7%) |
| Total | 161 (100.0%) | 2,096 (100.0%) |
Household Income by Mortgage Status in Fairwood
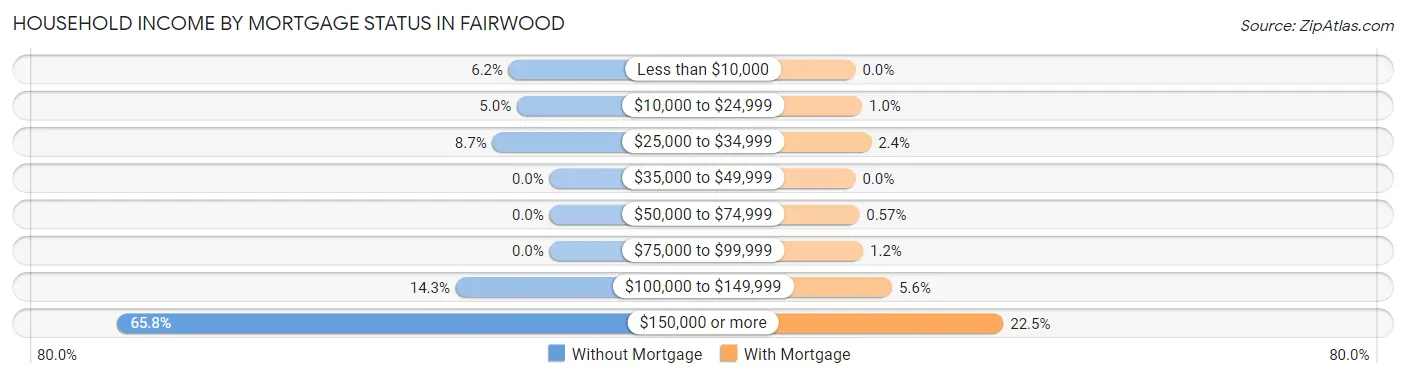
| Household Income | Without Mortgage | With Mortgage |
| Less than $10,000 | 10 (6.2%) | 0 (0.0%) |
| $10,000 to $24,999 | 8 (5.0%) | 21 (1.0%) |
| $25,000 to $34,999 | 14 (8.7%) | 50 (2.4%) |
| $35,000 to $49,999 | 0 (0.0%) | 0 (0.0%) |
| $50,000 to $74,999 | 0 (0.0%) | 12 (0.6%) |
| $75,000 to $99,999 | 0 (0.0%) | 24 (1.1%) |
| $100,000 to $149,999 | 23 (14.3%) | 117 (5.6%) |
| $150,000 or more | 106 (65.8%) | 472 (22.5%) |
| Total | 161 (100.0%) | 2,096 (100.0%) |
Property Value to Household Income Ratio in Fairwood
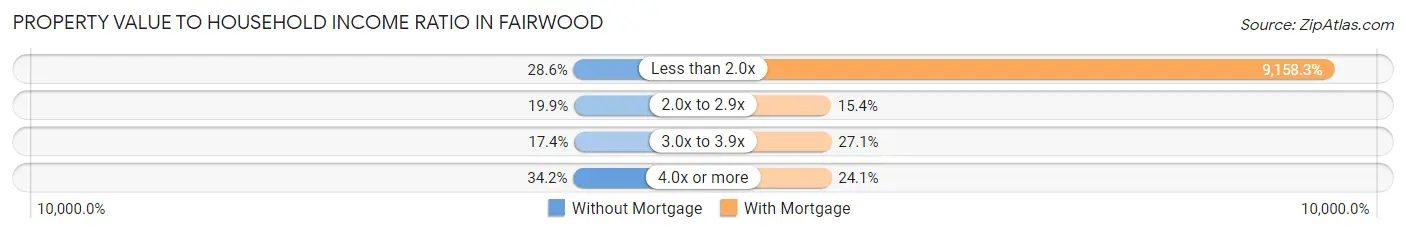
| Value-to-Income Ratio | Without Mortgage | With Mortgage |
| Less than 2.0x | 46 (28.6%) | 191,957 (9,158.2%) |
| 2.0x to 2.9x | 32 (19.9%) | 323 (15.4%) |
| 3.0x to 3.9x | 28 (17.4%) | 568 (27.1%) |
| 4.0x or more | 55 (34.2%) | 506 (24.1%) |
| Total | 161 (100.0%) | 2,096 (100.0%) |
Real Estate Taxes by Mortgage Status in Fairwood
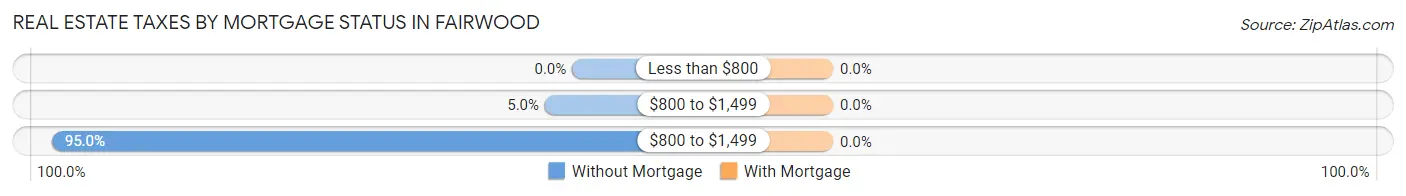
| Property Taxes | Without Mortgage | With Mortgage |
| Less than $800 | 0 (0.0%) | 0 (0.0%) |
| $800 to $1,499 | 8 (5.0%) | 0 (0.0%) |
| $800 to $1,499 | 153 (95.0%) | 0 (0.0%) |
| Total | 161 (100.0%) | 2,096 (100.0%) |
Health & Disability in Fairwood
Health Insurance Coverage by Age in Fairwood
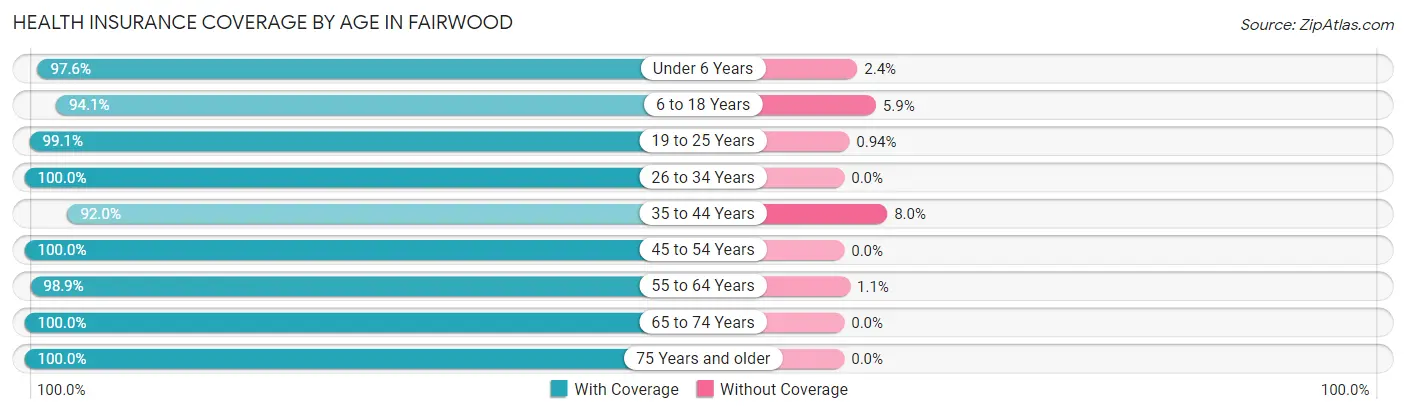
| Age Bracket | With Coverage | Without Coverage |
| Under 6 Years | 883 (97.6%) | 22 (2.4%) |
| 6 to 18 Years | 1,341 (94.1%) | 84 (5.9%) |
| 19 to 25 Years | 527 (99.1%) | 5 (0.9%) |
| 26 to 34 Years | 582 (100.0%) | 0 (0.0%) |
| 35 to 44 Years | 1,001 (92.0%) | 87 (8.0%) |
| 45 to 54 Years | 1,319 (100.0%) | 0 (0.0%) |
| 55 to 64 Years | 1,101 (98.9%) | 12 (1.1%) |
| 65 to 74 Years | 490 (100.0%) | 0 (0.0%) |
| 75 Years and older | 165 (100.0%) | 0 (0.0%) |
| Total | 7,409 (97.2%) | 210 (2.8%) |
Health Insurance Coverage by Citizenship Status in Fairwood
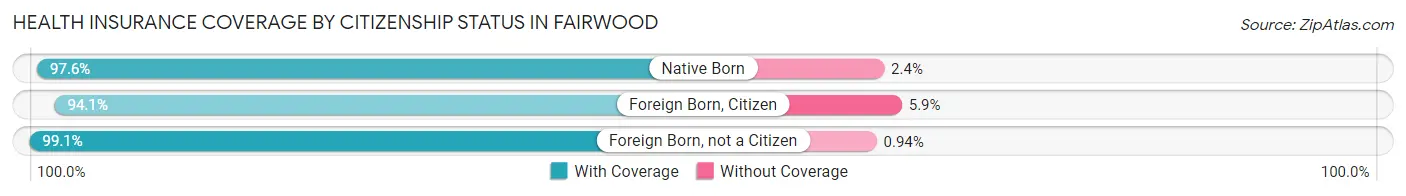
| Citizenship Status | With Coverage | Without Coverage |
| Native Born | 883 (97.6%) | 22 (2.4%) |
| Foreign Born, Citizen | 1,341 (94.1%) | 84 (5.9%) |
| Foreign Born, not a Citizen | 527 (99.1%) | 5 (0.9%) |
Health Insurance Coverage by Household Income in Fairwood
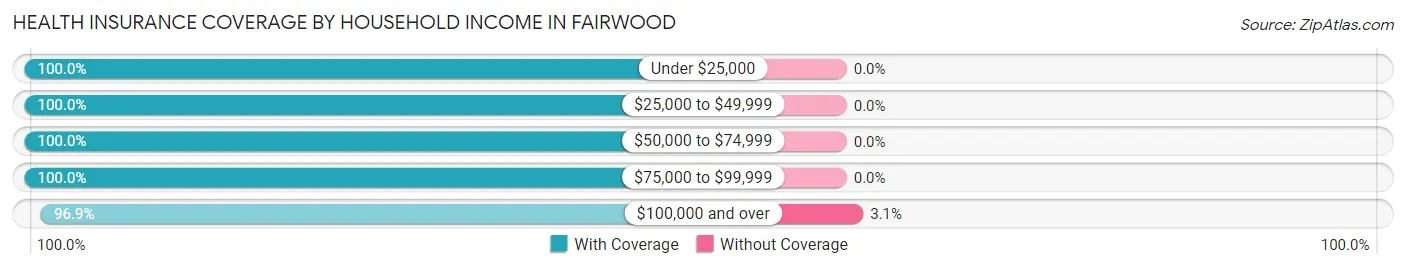
| Household Income | With Coverage | Without Coverage |
| Under $25,000 | 174 (100.0%) | 0 (0.0%) |
| $25,000 to $49,999 | 78 (100.0%) | 0 (0.0%) |
| $50,000 to $74,999 | 149 (100.0%) | 0 (0.0%) |
| $75,000 to $99,999 | 412 (100.0%) | 0 (0.0%) |
| $100,000 and over | 6,596 (96.9%) | 210 (3.1%) |
Public vs Private Health Insurance Coverage by Age in Fairwood
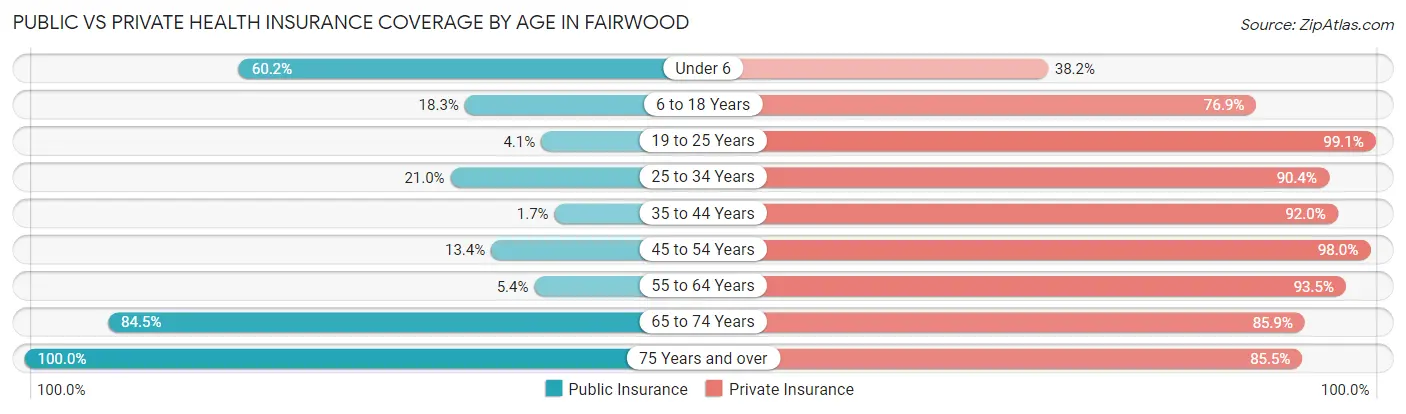
| Age Bracket | Public Insurance | Private Insurance |
| Under 6 | 545 (60.2%) | 346 (38.2%) |
| 6 to 18 Years | 261 (18.3%) | 1,096 (76.9%) |
| 19 to 25 Years | 22 (4.1%) | 527 (99.1%) |
| 25 to 34 Years | 122 (21.0%) | 526 (90.4%) |
| 35 to 44 Years | 18 (1.7%) | 1,001 (92.0%) |
| 45 to 54 Years | 177 (13.4%) | 1,293 (98.0%) |
| 55 to 64 Years | 60 (5.4%) | 1,041 (93.5%) |
| 65 to 74 Years | 414 (84.5%) | 421 (85.9%) |
| 75 Years and over | 165 (100.0%) | 141 (85.5%) |
| Total | 1,784 (23.4%) | 6,392 (83.9%) |
Disability Status by Sex by Age in Fairwood
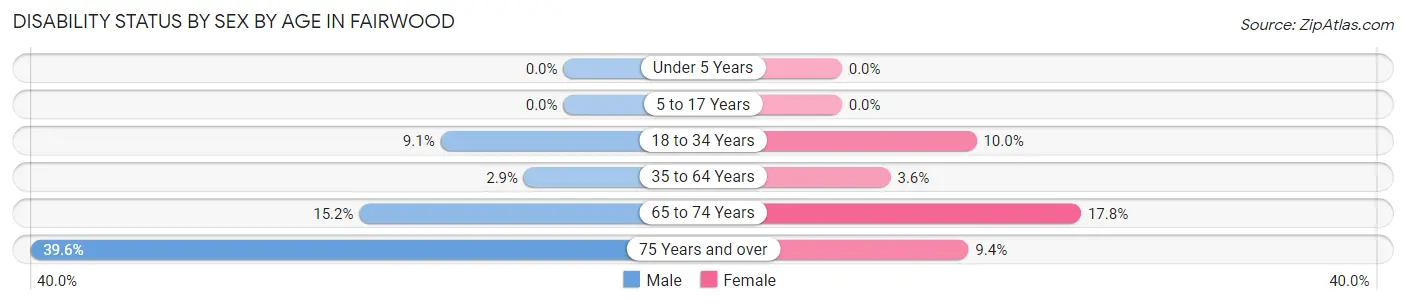
| Age Bracket | Male | Female |
| Under 5 Years | 0 (0.0%) | 0 (0.0%) |
| 5 to 17 Years | 0 (0.0%) | 0 (0.0%) |
| 18 to 34 Years | 59 (9.1%) | 52 (10.0%) |
| 35 to 64 Years | 44 (2.9%) | 73 (3.6%) |
| 65 to 74 Years | 35 (15.1%) | 46 (17.8%) |
| 75 Years and over | 19 (39.6%) | 11 (9.4%) |
Disability Class by Sex by Age in Fairwood
Disability Class: Hearing Difficulty
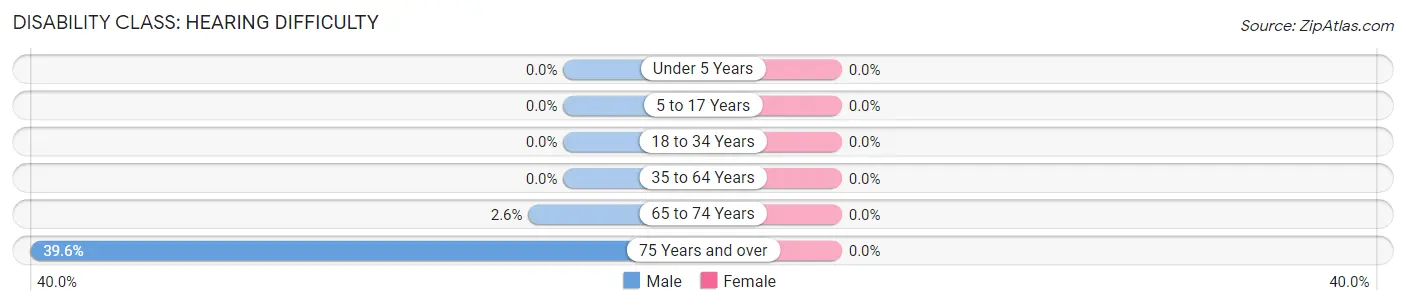
| Age Bracket | Male | Female |
| Under 5 Years | 0 (0.0%) | 0 (0.0%) |
| 5 to 17 Years | 0 (0.0%) | 0 (0.0%) |
| 18 to 34 Years | 0 (0.0%) | 0 (0.0%) |
| 35 to 64 Years | 0 (0.0%) | 0 (0.0%) |
| 65 to 74 Years | 6 (2.6%) | 0 (0.0%) |
| 75 Years and over | 19 (39.6%) | 0 (0.0%) |
Disability Class: Vision Difficulty
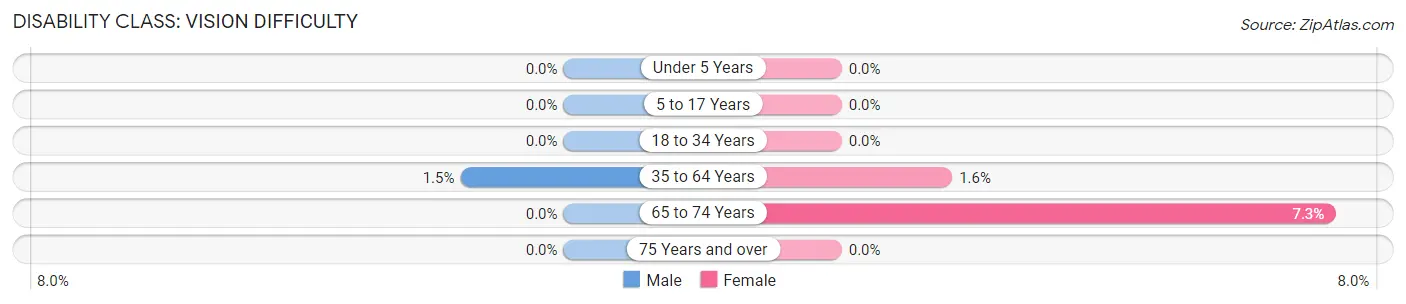
| Age Bracket | Male | Female |
| Under 5 Years | 0 (0.0%) | 0 (0.0%) |
| 5 to 17 Years | 0 (0.0%) | 0 (0.0%) |
| 18 to 34 Years | 0 (0.0%) | 0 (0.0%) |
| 35 to 64 Years | 23 (1.5%) | 33 (1.6%) |
| 65 to 74 Years | 0 (0.0%) | 19 (7.3%) |
| 75 Years and over | 0 (0.0%) | 0 (0.0%) |
Disability Class: Cognitive Difficulty
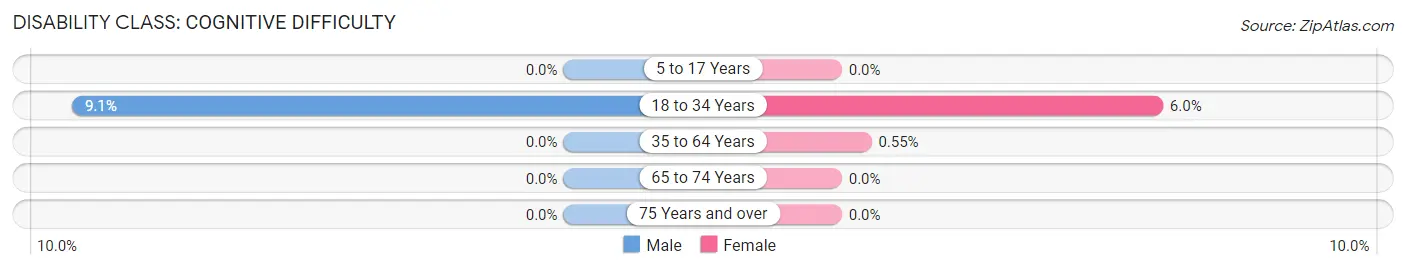
| Age Bracket | Male | Female |
| 5 to 17 Years | 0 (0.0%) | 0 (0.0%) |
| 18 to 34 Years | 59 (9.1%) | 31 (6.0%) |
| 35 to 64 Years | 0 (0.0%) | 11 (0.5%) |
| 65 to 74 Years | 0 (0.0%) | 0 (0.0%) |
| 75 Years and over | 0 (0.0%) | 0 (0.0%) |
Disability Class: Ambulatory Difficulty
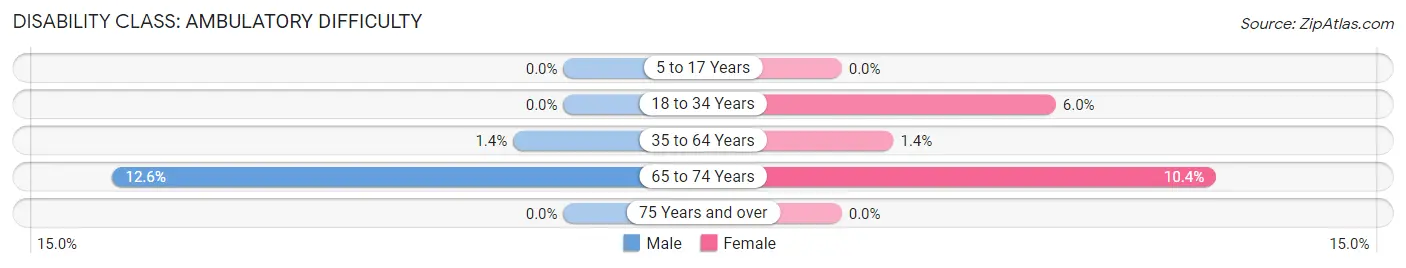
| Age Bracket | Male | Female |
| 5 to 17 Years | 0 (0.0%) | 0 (0.0%) |
| 18 to 34 Years | 0 (0.0%) | 31 (6.0%) |
| 35 to 64 Years | 21 (1.4%) | 29 (1.4%) |
| 65 to 74 Years | 29 (12.6%) | 27 (10.4%) |
| 75 Years and over | 0 (0.0%) | 0 (0.0%) |
Disability Class: Self-Care Difficulty
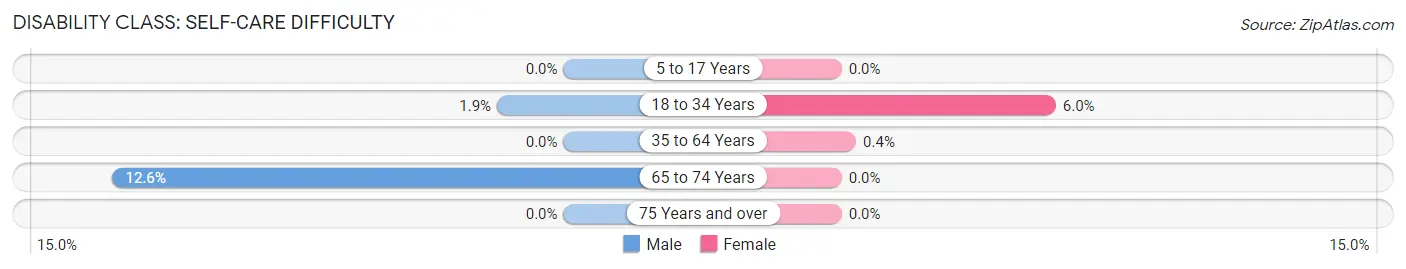
| Age Bracket | Male | Female |
| 5 to 17 Years | 0 (0.0%) | 0 (0.0%) |
| 18 to 34 Years | 12 (1.8%) | 31 (6.0%) |
| 35 to 64 Years | 0 (0.0%) | 8 (0.4%) |
| 65 to 74 Years | 29 (12.6%) | 0 (0.0%) |
| 75 Years and over | 0 (0.0%) | 0 (0.0%) |
Technology Access in Fairwood
Computing Device Access in Fairwood
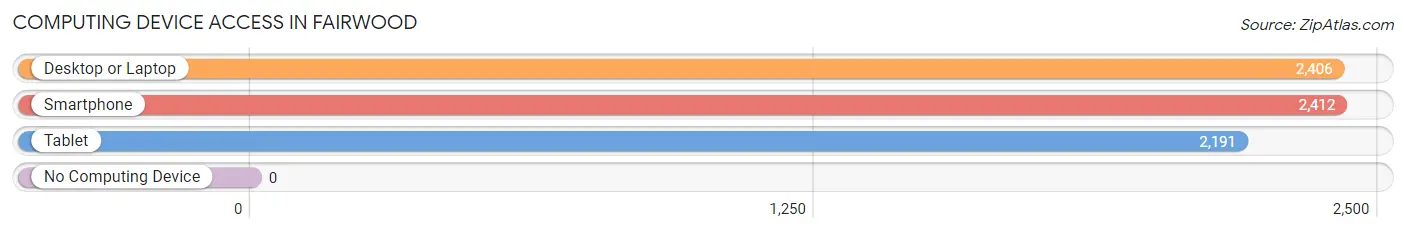
| Device Type | # Households | % Households |
| Desktop or Laptop | 2,406 | 99.4% |
| Smartphone | 2,412 | 99.7% |
| Tablet | 2,191 | 90.5% |
| No Computing Device | 0 | 0.0% |
| Total | 2,420 | 100.0% |
Internet Access in Fairwood
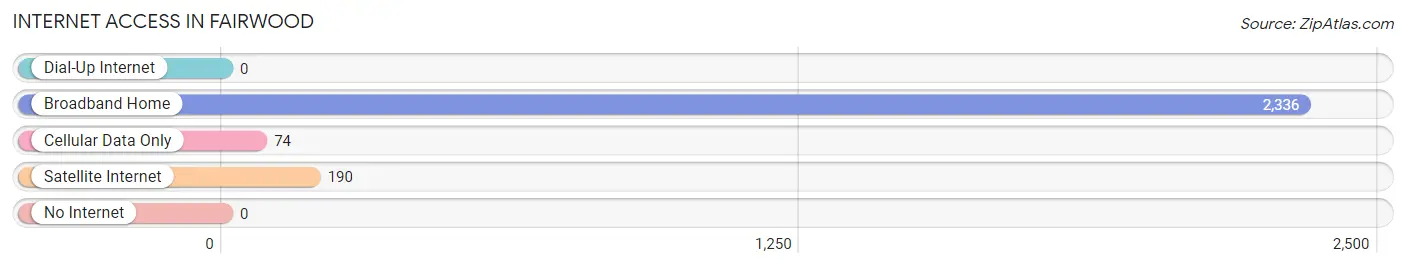
| Internet Type | # Households | % Households |
| Dial-Up Internet | 0 | 0.0% |
| Broadband Home | 2,336 | 96.5% |
| Cellular Data Only | 74 | 3.1% |
| Satellite Internet | 190 | 7.9% |
| No Internet | 0 | 0.0% |
| Total | 2,420 | 100.0% |
Fairwood Summary
Fairwood is a census-designated place (CDP) located in Prince George’s County, Maryland, United States. It is situated in the northern part of the county, approximately 15 miles east of Washington, D.C. As of the 2010 census, the population of Fairwood was 8,945.
History
The area that is now Fairwood was originally inhabited by the Piscataway Indians. The first European settlers arrived in the area in the late 1700s. The area was known as “Fairwood” by the early 1800s, and the name was derived from the abundance of fair woods in the area.
In the late 1800s, the area was primarily used for farming. The area was also home to a number of small businesses, including a general store, a blacksmith shop, and a post office.
In the early 1900s, the area began to experience rapid growth. The population of Fairwood increased from just over 500 in 1910 to over 1,000 by 1920. This growth was largely due to the development of the Washington, Baltimore and Annapolis Electric Railway, which provided easy access to Washington, D.C.
In the 1950s, the area experienced a period of suburbanization. This was due to the construction of the Capital Beltway, which provided easy access to the suburbs of Washington, D.C. The population of Fairwood increased from 1,500 in 1950 to over 8,000 by 2000.
Geography
Fairwood is located at 38°59'25"N 76°51'45"W (38.990278, -76.862444). It is situated in the northern part of Prince George’s County, approximately 15 miles east of Washington, D.C.
The area is primarily composed of suburban neighborhoods. The terrain is generally flat, with some rolling hills. The area is home to a number of parks and recreational areas, including Fairwood Park, Fairwood Lakes Park, and Fairwood Golf Course.
Economy
The economy of Fairwood is largely based on the service industry. The area is home to a number of retail stores, restaurants, and other businesses. The area is also home to a number of government and military facilities, including the Joint Base Andrews Naval Air Facility.
Demographics
As of the 2010 census, the population of Fairwood was 8,945. The racial makeup of the area was 57.3% White, 28.2% African American, 8.2% Asian, and 5.3% Hispanic or Latino. The median household income was $90,945, and the median home value was $346,000.
Conclusion
Fairwood is a census-designated place located in Prince George’s County, Maryland. It is situated in the northern part of the county, approximately 15 miles east of Washington, D.C. The area was originally inhabited by the Piscataway Indians, and was later settled by European settlers in the late 1700s. The area experienced rapid growth in the early 1900s due to the development of the Washington, Baltimore and Annapolis Electric Railway. The area experienced a period of suburbanization in the 1950s due to the construction of the Capital Beltway. As of the 2010 census, the population of Fairwood was 8,945. The economy of Fairwood is largely based on the service industry, and the area is home to a number of government and military facilities. The racial makeup of the area was 57.3% White, 28.2% African American, 8.2% Asian, and 5.3% Hispanic or Latino. The median household income was $90,945, and the median home value was $346,000.
Common Questions
What is Per Capita Income in Fairwood?
Per Capita income in Fairwood is $69,011.
What is the Median Family Income in Fairwood?
Median Family Income in Fairwood is $215,703.
What is the Median Household income in Fairwood?
Median Household Income in Fairwood is $191,304.
What is Income or Wage Gap in Fairwood?
Income or Wage Gap in Fairwood is 4.2%.
Women in Fairwood earn 95.8 cents for every dollar earned by a man.
What is Inequality or Gini Index in Fairwood?
Inequality or Gini Index in Fairwood is 0.30.
What is the Total Population of Fairwood?
Total Population of Fairwood is 7,653.
What is the Total Male Population of Fairwood?
Total Male Population of Fairwood is 3,678.
What is the Total Female Population of Fairwood?
Total Female Population of Fairwood is 3,975.
What is the Ratio of Males per 100 Females in Fairwood?
There are 92.53 Males per 100 Females in Fairwood.
What is the Ratio of Females per 100 Males in Fairwood?
There are 108.08 Females per 100 Males in Fairwood.
What is the Median Population Age in Fairwood?
Median Population Age in Fairwood is 39.5 Years.
What is the Average Family Size in Fairwood
Average Family Size in Fairwood is 3.2 People.
What is the Average Household Size in Fairwood
Average Household Size in Fairwood is 3.2 People.
How Large is the Labor Force in Fairwood?
There are 4,447 People in the Labor Forcein in Fairwood.
What is the Percentage of People in the Labor Force in Fairwood?
81.4% of People are in the Labor Force in Fairwood.
What is the Unemployment Rate in Fairwood?
Unemployment Rate in Fairwood is 2.0%.