Zip Codes with the Highest Percentage of Population Employed in Security & Protection in Maryland
RELATED REPORTS & OPTIONS
Security & Protection
Maryland
Compare Zip Codes
Map of Zip Codes with the Highest Percentage of Population Employed in Security & Protection in Maryland
0.0%
30.0%
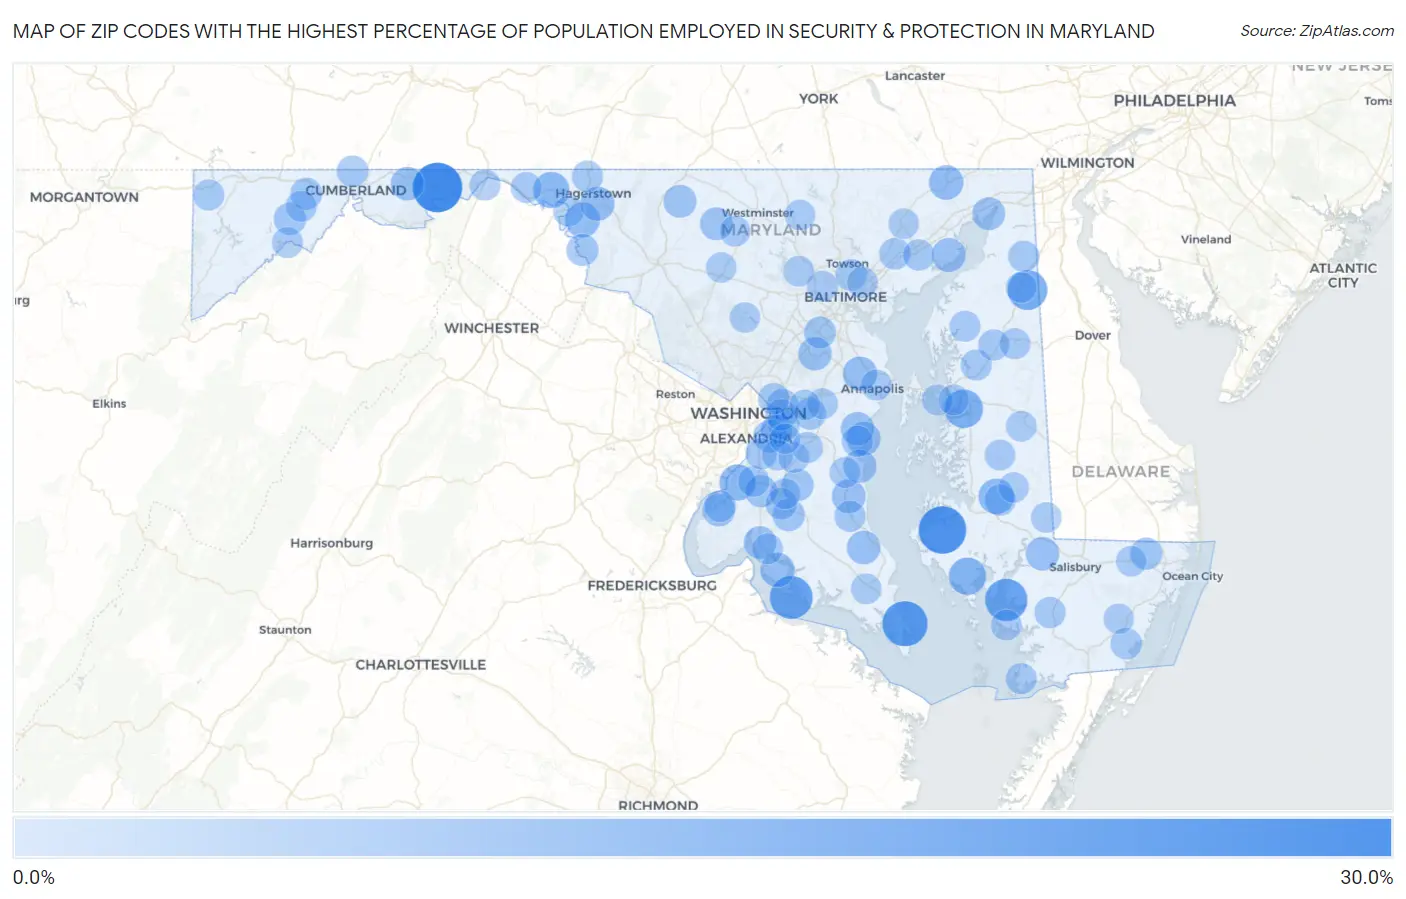
Zip Codes with the Highest Percentage of Population Employed in Security & Protection in Maryland
| Zip Code | % Employed | vs State | vs National | |
| 1. | 21766 | 26.6% | 2.8%(+23.8)#1 | 2.1%(+24.5)#116 |
| 2. | 21677 | 24.2% | 2.8%(+21.4)#2 | 2.1%(+22.0)#137 |
| 3. | 20628 | 21.5% | 2.8%(+18.7)#3 | 2.1%(+19.3)#178 |
| 4. | 20625 | 18.7% | 2.8%(+15.9)#4 | 2.1%(+16.6)#233 |
| 5. | 21840 | 18.0% | 2.8%(+15.2)#5 | 2.1%(+15.8)#252 |
| 6. | 21650 | 15.0% | 2.8%(+12.2)#6 | 2.1%(+12.9)#361 |
| 7. | 21679 | 13.5% | 2.8%(+10.7)#7 | 2.1%(+11.4)#446 |
| 8. | 21626 | 12.1% | 2.8%(+9.32)#8 | 2.1%(+9.97)#544 |
| 9. | 20616 | 10.7% | 2.8%(+7.95)#9 | 2.1%(+8.60)#672 |
| 10. | 21722 | 10.7% | 2.8%(+7.93)#10 | 2.1%(+8.58)#674 |
| 11. | 21664 | 9.8% | 2.8%(+7.01)#11 | 2.1%(+7.66)#795 |
| 12. | 21733 | 9.3% | 2.8%(+6.46)#12 | 2.1%(+7.11)#869 |
| 13. | 21918 | 8.8% | 2.8%(+6.03)#13 | 2.1%(+6.68)#945 |
| 14. | 20664 | 8.7% | 2.8%(+5.86)#14 | 2.1%(+6.51)#973 |
| 15. | 21405 | 8.6% | 2.8%(+5.77)#15 | 2.1%(+6.42)#992 |
| 16. | 21734 | 8.4% | 2.8%(+5.57)#16 | 2.1%(+6.22)#1,051 |
| 17. | 21005 | 8.1% | 2.8%(+5.34)#17 | 2.1%(+5.99)#1,117 |
| 18. | 20639 | 8.0% | 2.8%(+5.22)#18 | 2.1%(+5.87)#1,164 |
| 19. | 20733 | 7.9% | 2.8%(+5.14)#19 | 2.1%(+5.79)#1,187 |
| 20. | 20685 | 7.8% | 2.8%(+5.03)#20 | 2.1%(+5.68)#1,231 |
| 21. | 21830 | 7.7% | 2.8%(+4.93)#21 | 2.1%(+5.58)#1,259 |
| 22. | 20755 | 7.6% | 2.8%(+4.75)#22 | 2.1%(+5.40)#1,313 |
| 23. | 21530 | 7.5% | 2.8%(+4.73)#23 | 2.1%(+5.38)#1,321 |
| 24. | 20778 | 7.5% | 2.8%(+4.69)#24 | 2.1%(+5.34)#1,340 |
| 25. | 20714 | 7.2% | 2.8%(+4.39)#25 | 2.1%(+5.04)#1,447 |
| 26. | 21914 | 7.0% | 2.8%(+4.22)#26 | 2.1%(+4.87)#1,522 |
| 27. | 21778 | 7.0% | 2.8%(+4.17)#27 | 2.1%(+4.82)#1,549 |
| 28. | 20640 | 6.8% | 2.8%(+4.02)#28 | 2.1%(+4.67)#1,623 |
| 29. | 21791 | 6.8% | 2.8%(+3.95)#29 | 2.1%(+4.60)#1,658 |
| 30. | 20748 | 6.7% | 2.8%(+3.93)#30 | 2.1%(+4.58)#1,674 |
| 31. | 20611 | 6.7% | 2.8%(+3.88)#31 | 2.1%(+4.53)#1,695 |
| 32. | 21521 | 6.3% | 2.8%(+3.55)#32 | 2.1%(+4.20)#1,867 |
| 33. | 20617 | 6.3% | 2.8%(+3.54)#33 | 2.1%(+4.19)#1,871 |
| 34. | 20603 | 6.2% | 2.8%(+3.41)#34 | 2.1%(+4.06)#1,951 |
| 35. | 20613 | 6.2% | 2.8%(+3.38)#35 | 2.1%(+4.03)#1,965 |
| 36. | 21872 | 6.2% | 2.8%(+3.36)#36 | 2.1%(+4.01)#1,975 |
| 37. | 21782 | 5.9% | 2.8%(+3.05)#37 | 2.1%(+3.70)#2,177 |
| 38. | 21076 | 5.8% | 2.8%(+3.02)#38 | 2.1%(+3.66)#2,199 |
| 39. | 20774 | 5.8% | 2.8%(+3.00)#39 | 2.1%(+3.65)#2,209 |
| 40. | 21532 | 5.7% | 2.8%(+2.92)#40 | 2.1%(+3.56)#2,279 |
| 41. | 20746 | 5.6% | 2.8%(+2.84)#41 | 2.1%(+3.49)#2,333 |
| 42. | 20785 | 5.6% | 2.8%(+2.80)#42 | 2.1%(+3.45)#2,372 |
| 43. | 20747 | 5.5% | 2.8%(+2.75)#43 | 2.1%(+3.40)#2,419 |
| 44. | 20602 | 5.5% | 2.8%(+2.73)#44 | 2.1%(+3.38)#2,430 |
| 45. | 21239 | 5.4% | 2.8%(+2.62)#45 | 2.1%(+3.27)#2,527 |
| 46. | 20658 | 5.3% | 2.8%(+2.55)#46 | 2.1%(+3.20)#2,586 |
| 47. | 21156 | 5.3% | 2.8%(+2.51)#47 | 2.1%(+3.16)#2,631 |
| 48. | 21529 | 5.3% | 2.8%(+2.51)#48 | 2.1%(+3.15)#2,639 |
| 49. | 21631 | 5.3% | 2.8%(+2.48)#49 | 2.1%(+3.13)#2,651 |
| 50. | 20743 | 5.3% | 2.8%(+2.47)#50 | 2.1%(+3.12)#2,657 |
| 51. | 21040 | 5.2% | 2.8%(+2.42)#51 | 2.1%(+3.07)#2,699 |
| 52. | 21829 | 5.2% | 2.8%(+2.37)#52 | 2.1%(+3.02)#2,735 |
| 53. | 20710 | 5.1% | 2.8%(+2.34)#53 | 2.1%(+2.99)#2,772 |
| 54. | 21912 | 5.1% | 2.8%(+2.25)#54 | 2.1%(+2.90)#2,862 |
| 55. | 21767 | 5.1% | 2.8%(+2.25)#55 | 2.1%(+2.90)#2,865 |
| 56. | 20678 | 5.0% | 2.8%(+2.20)#56 | 2.1%(+2.85)#2,931 |
| 57. | 20607 | 5.0% | 2.8%(+2.16)#57 | 2.1%(+2.81)#2,973 |
| 58. | 20751 | 4.9% | 2.8%(+2.11)#58 | 2.1%(+2.76)#3,039 |
| 59. | 21853 | 4.9% | 2.8%(+2.10)#59 | 2.1%(+2.75)#3,043 |
| 60. | 21531 | 4.9% | 2.8%(+2.07)#60 | 2.1%(+2.72)#3,086 |
| 61. | 20744 | 4.9% | 2.8%(+2.07)#61 | 2.1%(+2.72)#3,092 |
| 62. | 21617 | 4.9% | 2.8%(+2.05)#62 | 2.1%(+2.70)#3,103 |
| 63. | 21623 | 4.8% | 2.8%(+2.00)#63 | 2.1%(+2.65)#3,181 |
| 64. | 21539 | 4.8% | 2.8%(+1.99)#64 | 2.1%(+2.64)#3,183 |
| 65. | 21817 | 4.8% | 2.8%(+1.98)#65 | 2.1%(+2.63)#3,190 |
| 66. | 21540 | 4.8% | 2.8%(+1.96)#66 | 2.1%(+2.61)#3,218 |
| 67. | 21206 | 4.7% | 2.8%(+1.95)#67 | 2.1%(+2.60)#3,240 |
| 68. | 21207 | 4.7% | 2.8%(+1.94)#68 | 2.1%(+2.58)#3,254 |
| 69. | 21750 | 4.7% | 2.8%(+1.93)#69 | 2.1%(+2.58)#3,267 |
| 70. | 20735 | 4.7% | 2.8%(+1.92)#70 | 2.1%(+2.57)#3,272 |
| 71. | 21402 | 4.7% | 2.8%(+1.92)#71 | 2.1%(+2.57)#3,277 |
| 72. | 21638 | 4.7% | 2.8%(+1.89)#72 | 2.1%(+2.54)#3,318 |
| 73. | 21607 | 4.7% | 2.8%(+1.89)#73 | 2.1%(+2.54)#3,320 |
| 74. | 21620 | 4.7% | 2.8%(+1.89)#74 | 2.1%(+2.54)#3,322 |
| 75. | 20623 | 4.7% | 2.8%(+1.87)#75 | 2.1%(+2.51)#3,350 |
| 76. | 20772 | 4.7% | 2.8%(+1.86)#76 | 2.1%(+2.51)#3,354 |
| 77. | 20736 | 4.7% | 2.8%(+1.86)#77 | 2.1%(+2.50)#3,363 |
| 78. | 20632 | 4.6% | 2.8%(+1.81)#78 | 2.1%(+2.46)#3,429 |
| 79. | 20716 | 4.6% | 2.8%(+1.81)#79 | 2.1%(+2.46)#3,432 |
| 80. | 21711 | 4.6% | 2.8%(+1.79)#80 | 2.1%(+2.43)#3,475 |
| 81. | 20601 | 4.5% | 2.8%(+1.72)#81 | 2.1%(+2.37)#3,589 |
| 82. | 21821 | 4.5% | 2.8%(+1.67)#82 | 2.1%(+2.32)#3,654 |
| 83. | 21635 | 4.5% | 2.8%(+1.67)#83 | 2.1%(+2.32)#3,659 |
| 84. | 21655 | 4.5% | 2.8%(+1.66)#84 | 2.1%(+2.31)#3,669 |
| 85. | 21658 | 4.4% | 2.8%(+1.59)#85 | 2.1%(+2.24)#3,789 |
| 86. | 21133 | 4.4% | 2.8%(+1.59)#86 | 2.1%(+2.24)#3,800 |
| 87. | 21874 | 4.4% | 2.8%(+1.57)#87 | 2.1%(+2.22)#3,827 |
| 88. | 21629 | 4.4% | 2.8%(+1.56)#88 | 2.1%(+2.21)#3,846 |
| 89. | 21776 | 4.4% | 2.8%(+1.56)#89 | 2.1%(+2.21)#3,851 |
| 90. | 20619 | 4.3% | 2.8%(+1.55)#90 | 2.1%(+2.20)#3,870 |
| 91. | 21155 | 4.3% | 2.8%(+1.51)#91 | 2.1%(+2.16)#3,933 |
| 92. | 21795 | 4.3% | 2.8%(+1.50)#92 | 2.1%(+2.15)#3,951 |
| 93. | 21771 | 4.3% | 2.8%(+1.47)#93 | 2.1%(+2.12)#3,996 |
| 94. | 21014 | 4.2% | 2.8%(+1.45)#94 | 2.1%(+2.10)#4,035 |
| 95. | 20762 | 4.2% | 2.8%(+1.42)#95 | 2.1%(+2.07)#4,089 |
| 96. | 20721 | 4.1% | 2.8%(+1.35)#96 | 2.1%(+2.00)#4,211 |
| 97. | 20833 | 4.1% | 2.8%(+1.32)#97 | 2.1%(+1.97)#4,274 |
| 98. | 21861 | 4.1% | 2.8%(+1.30)#98 | 2.1%(+1.95)#4,298 |
| 99. | 21643 | 4.1% | 2.8%(+1.30)#99 | 2.1%(+1.95)#4,299 |
| 100. | 21863 | 4.1% | 2.8%(+1.29)#100 | 2.1%(+1.94)#4,326 |
Common Questions
What are the Top 10 Zip Codes with the Highest Percentage of Population Employed in Security & Protection in Maryland?
Top 10 Zip Codes with the Highest Percentage of Population Employed in Security & Protection in Maryland are:
What zip code has the Highest Percentage of Population Employed in Security & Protection in Maryland?
21766 has the Highest Percentage of Population Employed in Security & Protection in Maryland with 26.6%.
What is the Percentage of Population Employed in Security & Protection in the State of Maryland?
Percentage of Population Employed in Security & Protection in Maryland is 2.8%.
What is the Percentage of Population Employed in Security & Protection in the United States?
Percentage of Population Employed in Security & Protection in the United States is 2.1%.