Dargan, MD Map & Demographics
Dargan Map
Dargan Overview
$34,740
PER CAPITA INCOME
0.24
INEQUALITY / GINI INDEX
189
TOTAL POPULATION
104
MALE POPULATION
85
FEMALE POPULATION
122.35
MALES / 100 FEMALES
81.73
FEMALES / 100 MALES
32.3
MEDIAN AGE
2.8
AVG FAMILY SIZE
2.6
AVG HOUSEHOLD SIZE
109
LABOR FORCE [ PEOPLE ]
82.0%
PERCENT IN LABOR FORCE
29.4%
UNEMPLOYMENT RATE
Income in Dargan
Income Overview in Dargan
| Characteristic | Number | Measure |
| Per Capita Income | 189 | $34,740 |
| Median Family Income | 49 | $0 |
| Mean Family Income | 49 | $97,994 |
| Median Household Income | 73 | $0 |
| Mean Household Income | 73 | $93,553 |
| Income Deficit | 49 | $0 |
| Wage / Income Gap (%) | 189 | 0.00% |
| Wage / Income Gap ($) | 189 | 100.00¢ per $1 |
| Gini / Inequality Index | 189 | 0.24 |
Earnings by Sex in Dargan
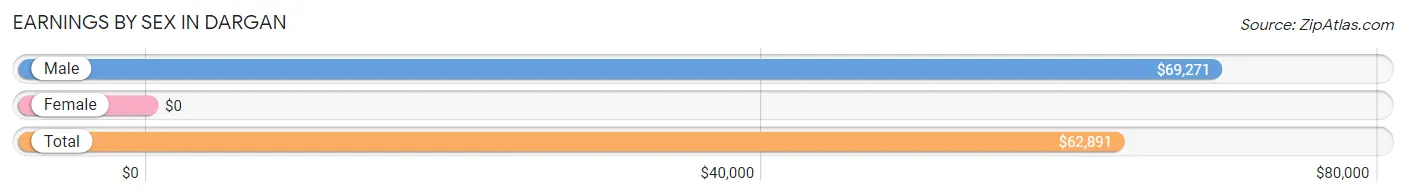
| Sex | Number | Average Earnings |
| Male | 49 (52.7%) | $69,271 |
| Female | 44 (47.3%) | $0 |
| Total | 93 (100.0%) | $62,891 |
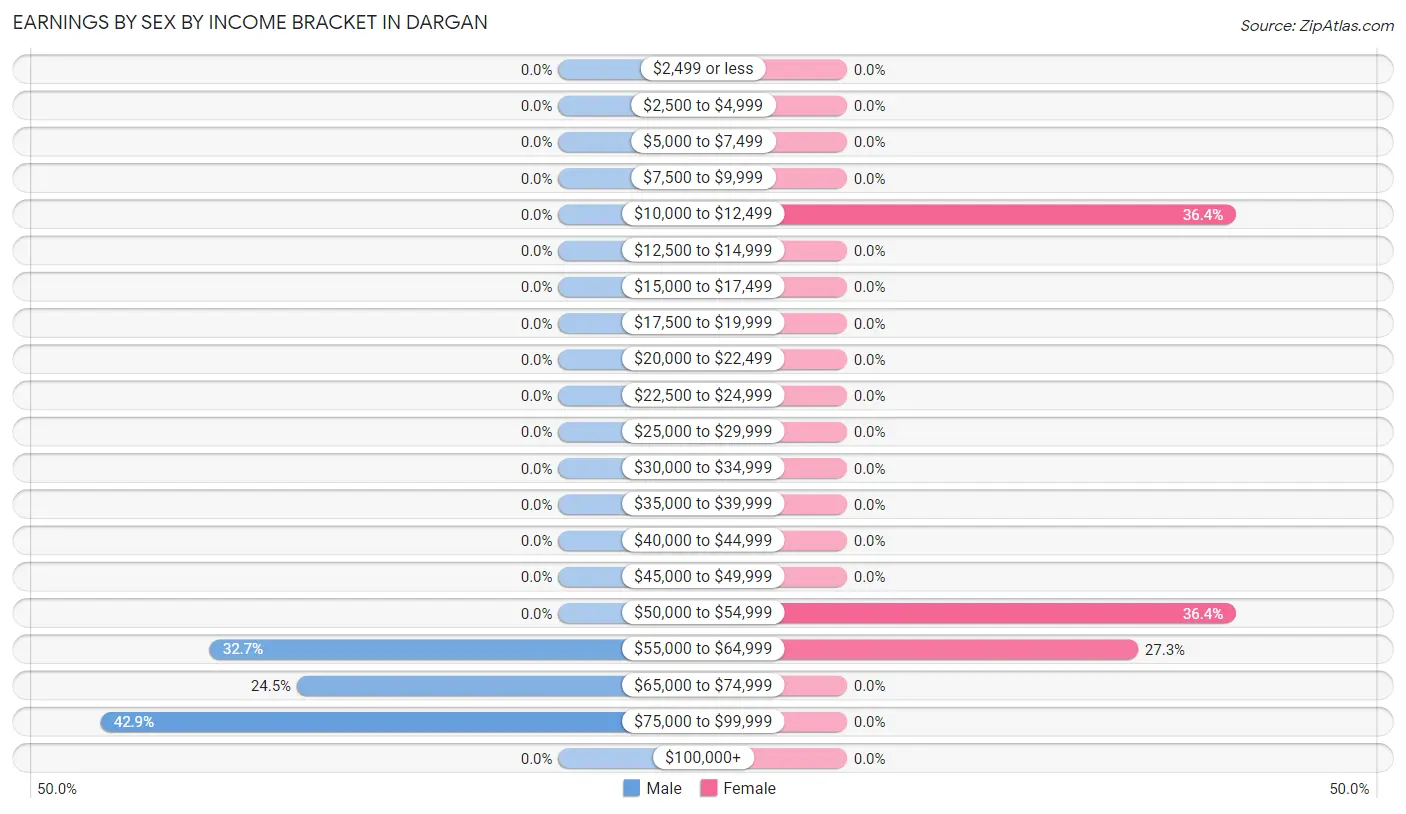
Earnings by Sex by Income Bracket in Dargan
The most common earnings brackets in Dargan are $75,000 to $99,999 for men (21 | 42.9%) and $10,000 to $12,499 for women (16 | 36.4%).
| Income | Male | Female |
| $2,499 or less | 0 (0.0%) | 0 (0.0%) |
| $2,500 to $4,999 | 0 (0.0%) | 0 (0.0%) |
| $5,000 to $7,499 | 0 (0.0%) | 0 (0.0%) |
| $7,500 to $9,999 | 0 (0.0%) | 0 (0.0%) |
| $10,000 to $12,499 | 0 (0.0%) | 16 (36.4%) |
| $12,500 to $14,999 | 0 (0.0%) | 0 (0.0%) |
| $15,000 to $17,499 | 0 (0.0%) | 0 (0.0%) |
| $17,500 to $19,999 | 0 (0.0%) | 0 (0.0%) |
| $20,000 to $22,499 | 0 (0.0%) | 0 (0.0%) |
| $22,500 to $24,999 | 0 (0.0%) | 0 (0.0%) |
| $25,000 to $29,999 | 0 (0.0%) | 0 (0.0%) |
| $30,000 to $34,999 | 0 (0.0%) | 0 (0.0%) |
| $35,000 to $39,999 | 0 (0.0%) | 0 (0.0%) |
| $40,000 to $44,999 | 0 (0.0%) | 0 (0.0%) |
| $45,000 to $49,999 | 0 (0.0%) | 0 (0.0%) |
| $50,000 to $54,999 | 0 (0.0%) | 16 (36.4%) |
| $55,000 to $64,999 | 16 (32.7%) | 12 (27.3%) |
| $65,000 to $74,999 | 12 (24.5%) | 0 (0.0%) |
| $75,000 to $99,999 | 21 (42.9%) | 0 (0.0%) |
| $100,000+ | 0 (0.0%) | 0 (0.0%) |
| Total | 49 (100.0%) | 44 (100.0%) |
Earnings by Sex by Educational Attainment in Dargan
| Educational Attainment | Male Income | Female Income |
| Less than High School | - | - |
| High School Diploma | - | - |
| College or Associate's Degree | - | - |
| Bachelor's Degree | - | - |
| Graduate Degree | - | - |
| Total | $69,271 | $0 |
Family Income in Dargan
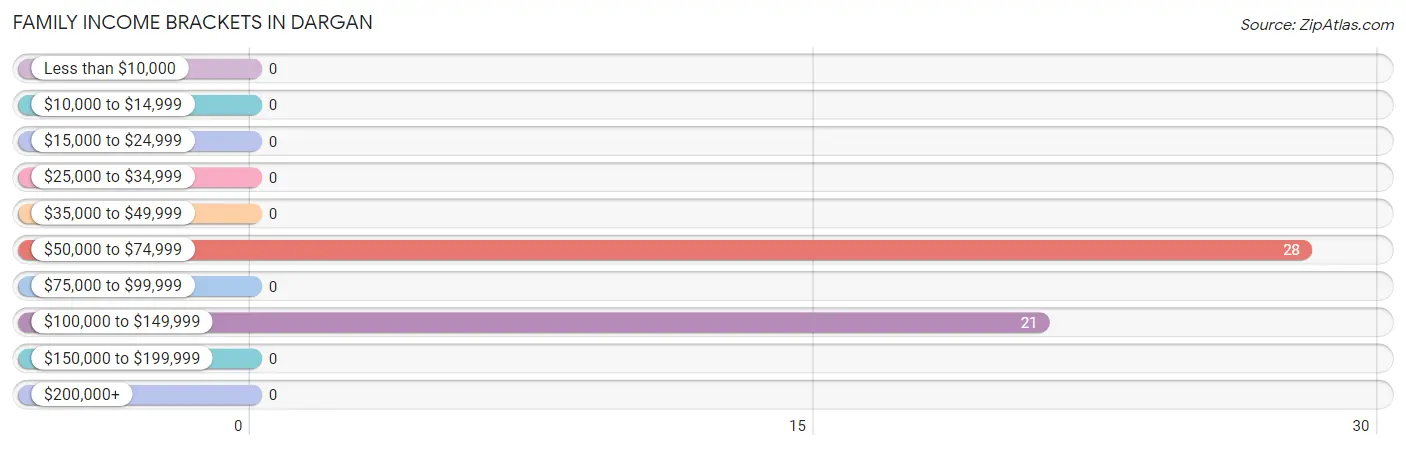
Family Income Brackets in Dargan
According to the Dargan family income data, there are 28 families falling into the $50,000 to $74,999 income range, which is the most common income bracket and makes up 57.1% of all families.
| Income Bracket | # Families | % Families |
| Less than $10,000 | 0 | 0.0% |
| $10,000 to $14,999 | 0 | 0.0% |
| $15,000 to $24,999 | 0 | 0.0% |
| $25,000 to $34,999 | 0 | 0.0% |
| $35,000 to $49,999 | 0 | 0.0% |
| $50,000 to $74,999 | 28 | 57.1% |
| $75,000 to $99,999 | 0 | 0.0% |
| $100,000 to $149,999 | 21 | 42.9% |
| $150,000 to $199,999 | 0 | 0.0% |
| $200,000+ | 0 | 0.0% |
Family Income by Famaliy Size in Dargan
| Income Bracket | # Families | Median Income |
| 2-Person Families | 16 (32.7%) | $0 |
| 3-Person Families | 21 (42.9%) | $0 |
| 4-Person Families | 12 (24.5%) | $0 |
| 5-Person Families | 0 (0.0%) | $0 |
| 6-Person Families | 0 (0.0%) | $0 |
| 7+ Person Families | 0 (0.0%) | $0 |
| Total | 49 (100.0%) | $0 |
Family Income by Number of Earners in Dargan
| Number of Earners | # Families | Median Income |
| No Earners | 0 (0.0%) | $0 |
| 1 Earner | 28 (57.1%) | $0 |
| 2 Earners | 21 (42.9%) | $0 |
| 3+ Earners | 0 (0.0%) | $0 |
| Total | 49 (100.0%) | $0 |
Household Income in Dargan
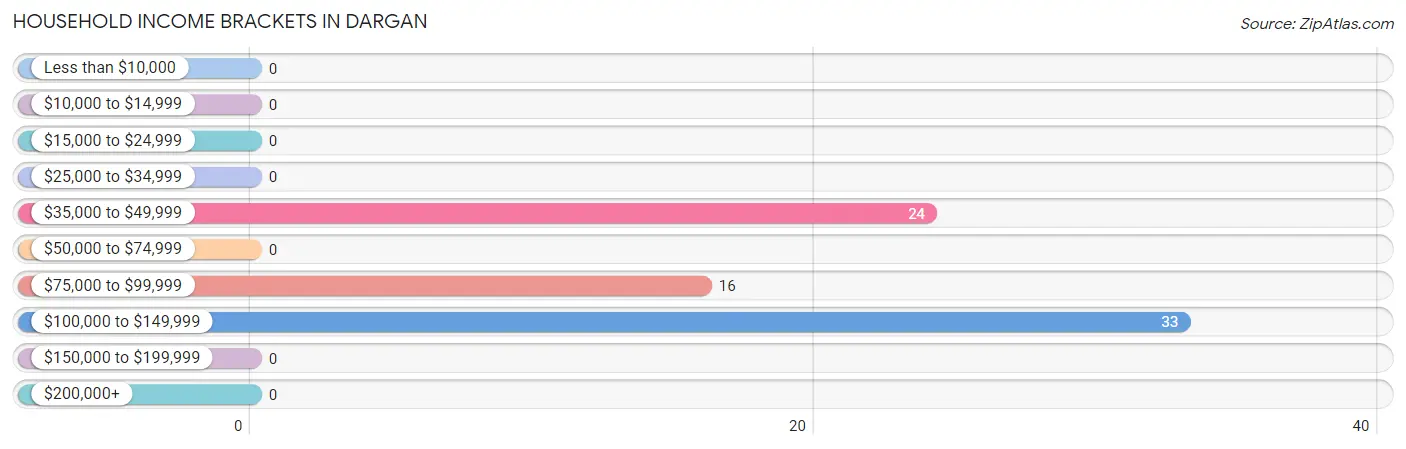
Household Income Brackets in Dargan
With 33 households falling in the category, the $100,000 to $149,999 income range is the most frequent in Dargan, accounting for 45.2% of all households.
| Income Bracket | # Households | % Households |
| Less than $10,000 | 0 | 0.0% |
| $10,000 to $14,999 | 0 | 0.0% |
| $15,000 to $24,999 | 0 | 0.0% |
| $25,000 to $34,999 | 0 | 0.0% |
| $35,000 to $49,999 | 24 | 32.9% |
| $50,000 to $74,999 | 0 | 0.0% |
| $75,000 to $99,999 | 16 | 21.9% |
| $100,000 to $149,999 | 33 | 45.2% |
| $150,000 to $199,999 | 0 | 0.0% |
| $200,000+ | 0 | 0.0% |
Household Income by Householder Age in Dargan
The median household income in Dargan is $0, with the highest median household income of $134,271 found in the 25 to 44 years age bracket for the primary householder. A total of 49 households (67.1%) fall into this category.
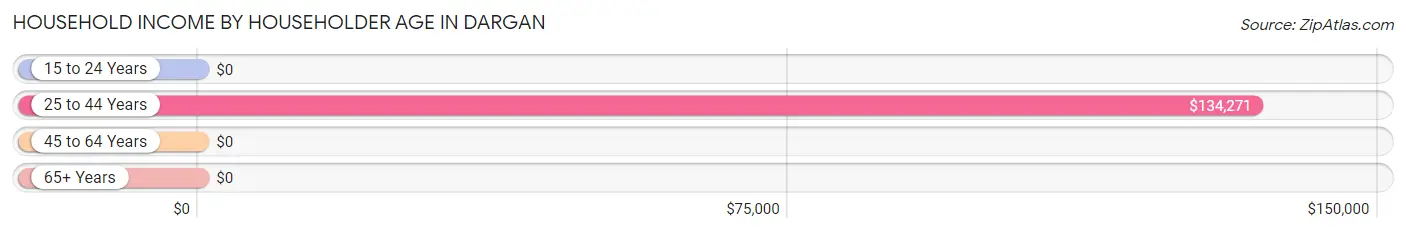
| Income Bracket | # Households | Median Income |
| 15 to 24 Years | 0 (0.0%) | $0 |
| 25 to 44 Years | 49 (67.1%) | $134,271 |
| 45 to 64 Years | 0 (0.0%) | $0 |
| 65+ Years | 24 (32.9%) | $0 |
| Total | 73 (100.0%) | $0 |
Poverty in Dargan
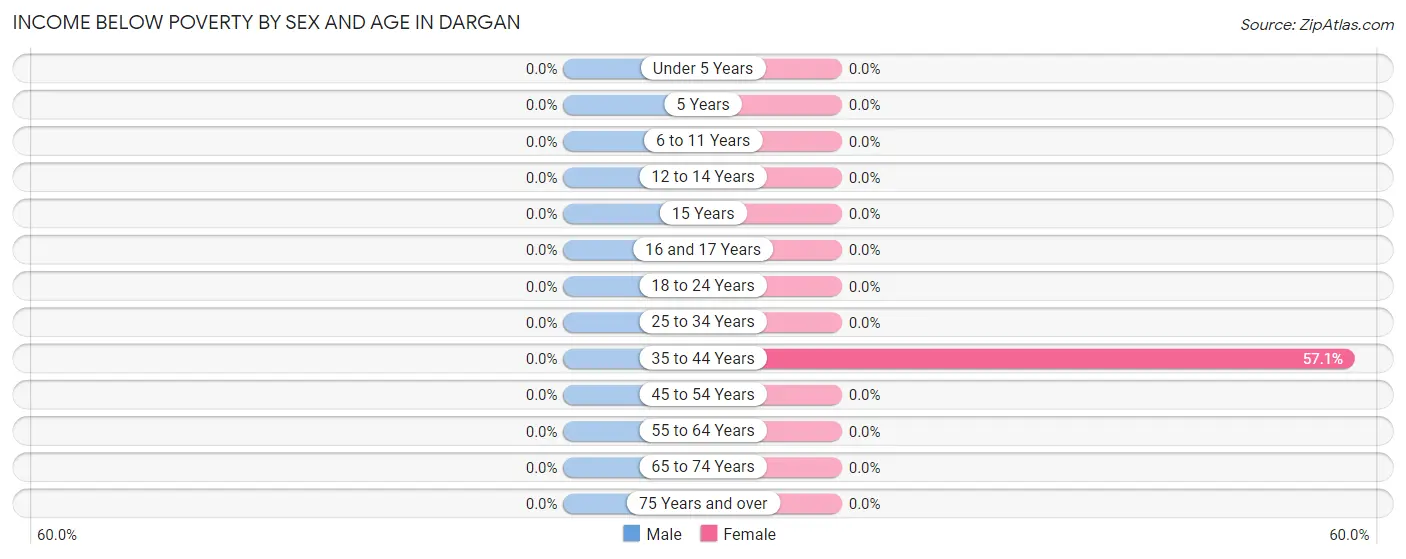
Income Below Poverty by Sex and Age in Dargan
| Age Bracket | Male | Female |
| Under 5 Years | 0 (0.0%) | 0 (0.0%) |
| 5 Years | 0 (0.0%) | 0 (0.0%) |
| 6 to 11 Years | 0 (0.0%) | 0 (0.0%) |
| 12 to 14 Years | 0 (0.0%) | 0 (0.0%) |
| 15 Years | 0 (0.0%) | 0 (0.0%) |
| 16 and 17 Years | 0 (0.0%) | 0 (0.0%) |
| 18 to 24 Years | 0 (0.0%) | 0 (0.0%) |
| 25 to 34 Years | 0 (0.0%) | 0 (0.0%) |
| 35 to 44 Years | 0 (0.0%) | 16 (57.1%) |
| 45 to 54 Years | 0 (0.0%) | 0 (0.0%) |
| 55 to 64 Years | 0 (0.0%) | 0 (0.0%) |
| 65 to 74 Years | 0 (0.0%) | 0 (0.0%) |
| 75 Years and over | 0 (0.0%) | 0 (0.0%) |
| Total | 0 (0.0%) | 16 (18.8%) |
Income Above Poverty by Sex and Age in Dargan
According to the poverty statistics in Dargan, males aged under 5 years and females aged under 5 years are the age groups that are most secure financially, with 100.0% of males and 100.0% of females in these age groups living above the poverty line.
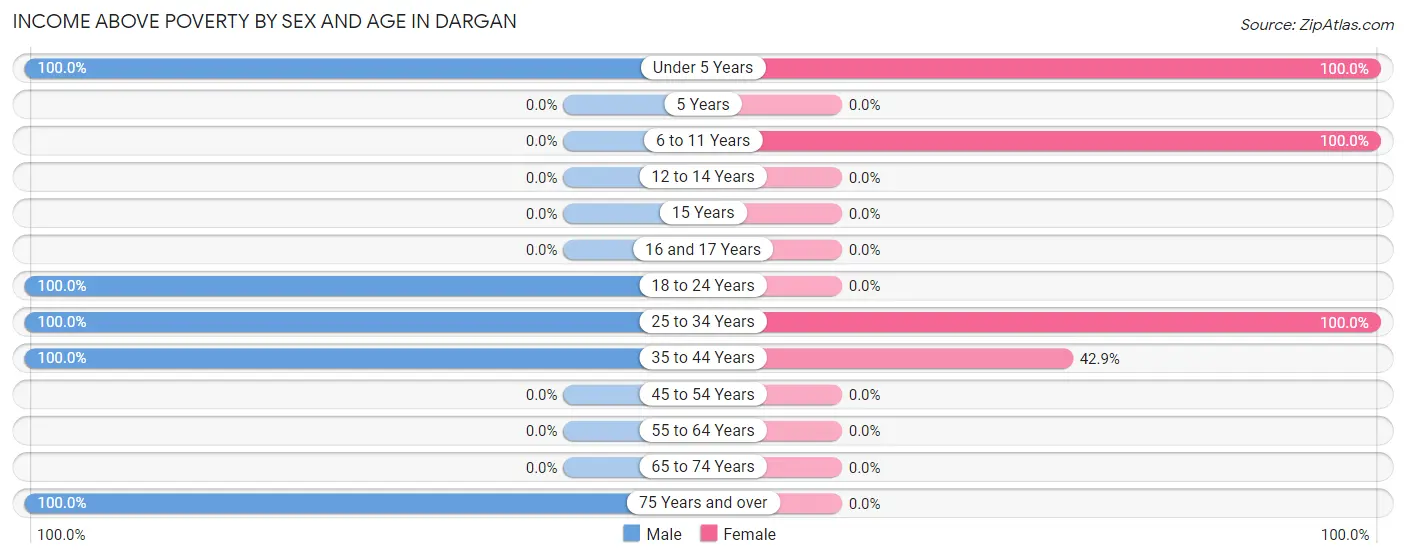
| Age Bracket | Male | Female |
| Under 5 Years | 15 (100.0%) | 16 (100.0%) |
| 5 Years | 0 (0.0%) | 0 (0.0%) |
| 6 to 11 Years | 0 (0.0%) | 25 (100.0%) |
| 12 to 14 Years | 0 (0.0%) | 0 (0.0%) |
| 15 Years | 0 (0.0%) | 0 (0.0%) |
| 16 and 17 Years | 0 (0.0%) | 0 (0.0%) |
| 18 to 24 Years | 16 (100.0%) | 0 (0.0%) |
| 25 to 34 Years | 21 (100.0%) | 16 (100.0%) |
| 35 to 44 Years | 28 (100.0%) | 12 (42.9%) |
| 45 to 54 Years | 0 (0.0%) | 0 (0.0%) |
| 55 to 64 Years | 0 (0.0%) | 0 (0.0%) |
| 65 to 74 Years | 0 (0.0%) | 0 (0.0%) |
| 75 Years and over | 24 (100.0%) | 0 (0.0%) |
| Total | 104 (100.0%) | 69 (81.2%) |
Income Below Poverty Among Married-Couple Families in Dargan
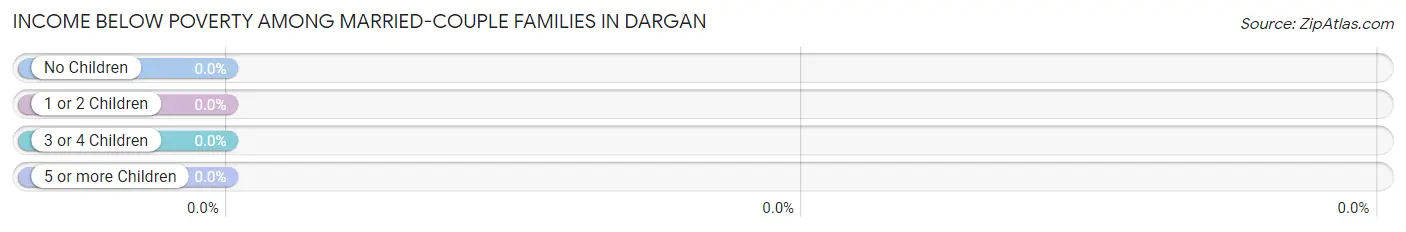
| Children | Above Poverty | Below Poverty |
| No Children | 0 (0.0%) | 0 (0.0%) |
| 1 or 2 Children | 21 (100.0%) | 0 (0.0%) |
| 3 or 4 Children | 0 (0.0%) | 0 (0.0%) |
| 5 or more Children | 0 (0.0%) | 0 (0.0%) |
| Total | 21 (100.0%) | 0 (0.0%) |
Income Below Poverty Among Single-Parent Households in Dargan
| Children | Single Father | Single Mother |
| No Children | 0 (0.0%) | 0 (0.0%) |
| 1 or 2 Children | 0 (0.0%) | 0 (0.0%) |
| 3 or 4 Children | 0 (0.0%) | 0 (0.0%) |
| 5 or more Children | 0 (0.0%) | 0 (0.0%) |
| Total | 0 (0.0%) | 0 (0.0%) |
Income Below Poverty Among Married-Couple vs Single-Parent Households in Dargan
| Children | Married-Couple Families | Single-Parent Households |
| No Children | 0 (0.0%) | 0 (0.0%) |
| 1 or 2 Children | 0 (0.0%) | 0 (0.0%) |
| 3 or 4 Children | 0 (0.0%) | 0 (0.0%) |
| 5 or more Children | 0 (0.0%) | 0 (0.0%) |
| Total | 0 (0.0%) | 0 (0.0%) |
Race in Dargan
The most populous races in Dargan are , and White / Caucasian (189 | 100.0%).
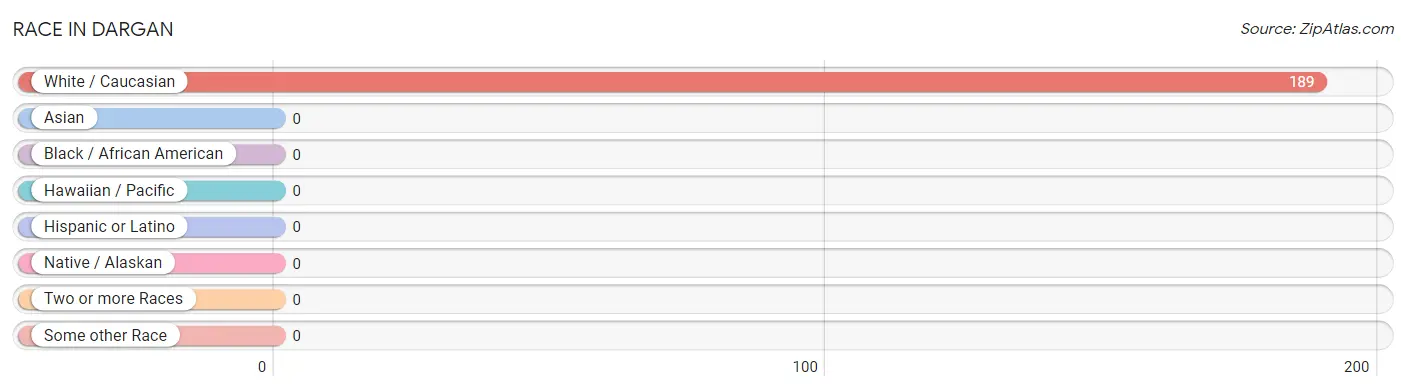
| Race | # Population | % Population |
| Asian | 0 | 0.0% |
| Black / African American | 0 | 0.0% |
| Hawaiian / Pacific | 0 | 0.0% |
| Hispanic or Latino | 0 | 0.0% |
| Native / Alaskan | 0 | 0.0% |
| White / Caucasian | 189 | 100.0% |
| Two or more Races | 0 | 0.0% |
| Some other Race | 0 | 0.0% |
| Total | 189 | 100.0% |
Ancestry in Dargan
The most populous ancestries reported in Dargan are Irish (37 | 19.6%), Polish (24 | 12.7%), German (16 | 8.5%), and Italian (16 | 8.5%), together accounting for 49.2% of all Dargan residents.
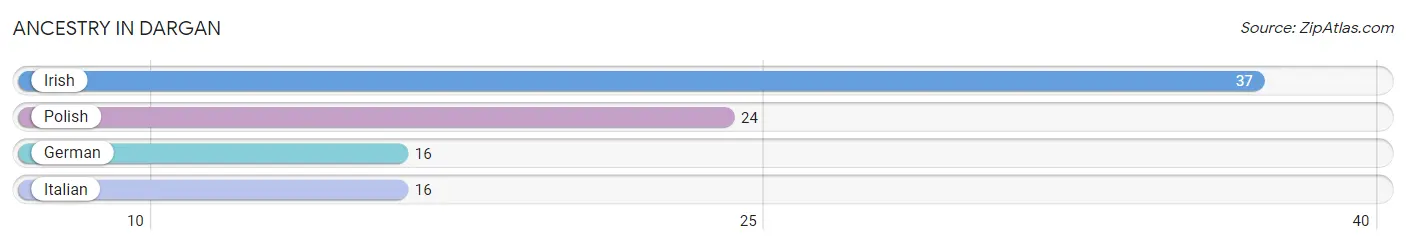
| Ancestry | # Population | % Population |
| German | 16 | 8.5% |
| Irish | 37 | 19.6% |
| Italian | 16 | 8.5% |
| Polish | 24 | 12.7% | View All 4 Rows |
Immigrants in Dargan

| Immigration Origin | # Population | % Population | View All 0 Rows |
Sex and Age in Dargan
Sex and Age in Dargan
The most populous age groups in Dargan are 85 Years and over (24 | 23.1%) for men and Under 5 Years (16 | 18.8%) for women.
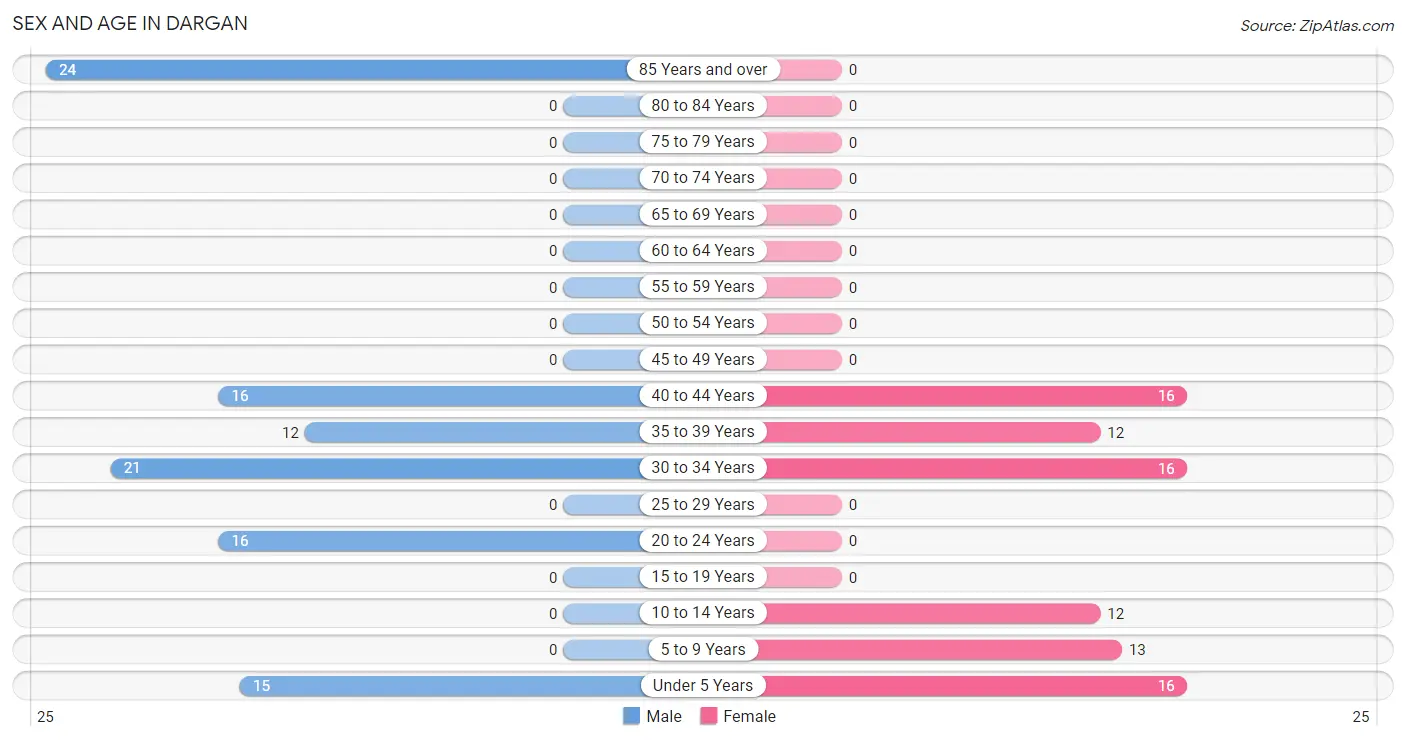
| Age Bracket | Male | Female |
| Under 5 Years | 15 (14.4%) | 16 (18.8%) |
| 5 to 9 Years | 0 (0.0%) | 13 (15.3%) |
| 10 to 14 Years | 0 (0.0%) | 12 (14.1%) |
| 15 to 19 Years | 0 (0.0%) | 0 (0.0%) |
| 20 to 24 Years | 16 (15.4%) | 0 (0.0%) |
| 25 to 29 Years | 0 (0.0%) | 0 (0.0%) |
| 30 to 34 Years | 21 (20.2%) | 16 (18.8%) |
| 35 to 39 Years | 12 (11.5%) | 12 (14.1%) |
| 40 to 44 Years | 16 (15.4%) | 16 (18.8%) |
| 45 to 49 Years | 0 (0.0%) | 0 (0.0%) |
| 50 to 54 Years | 0 (0.0%) | 0 (0.0%) |
| 55 to 59 Years | 0 (0.0%) | 0 (0.0%) |
| 60 to 64 Years | 0 (0.0%) | 0 (0.0%) |
| 65 to 69 Years | 0 (0.0%) | 0 (0.0%) |
| 70 to 74 Years | 0 (0.0%) | 0 (0.0%) |
| 75 to 79 Years | 0 (0.0%) | 0 (0.0%) |
| 80 to 84 Years | 0 (0.0%) | 0 (0.0%) |
| 85 Years and over | 24 (23.1%) | 0 (0.0%) |
| Total | 104 (100.0%) | 85 (100.0%) |
Families and Households in Dargan
Median Family Size in Dargan
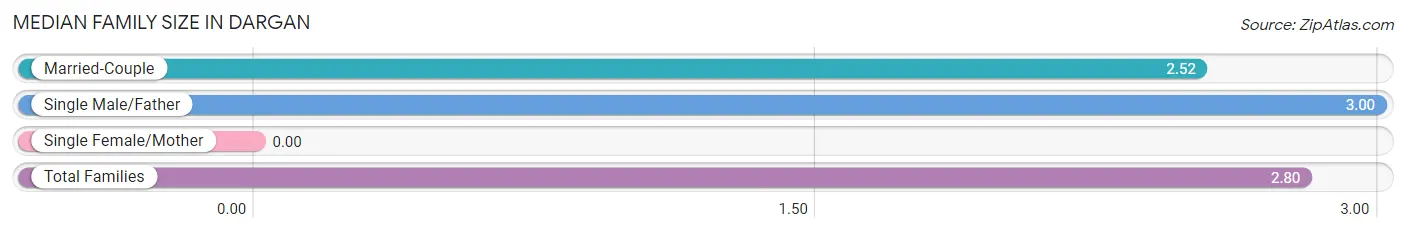
| Family Type | # Families | Family Size |
| Married-Couple | 21 (42.9%) | 2.52 |
| Single Male/Father | 28 (57.1%) | 3.00 |
| Single Female/Mother | 0 (0.0%) | - |
| Total Families | 49 (100.0%) | 2.80 |
Median Household Size in Dargan

| Household Type | # Households | Household Size |
| Married-Couple | 21 (28.8%) | 2.52 |
| Single Male/Father | 28 (38.4%) | 4.00 |
| Single Female/Mother | 0 (0.0%) | - |
| Non-family | 24 (32.9%) | - |
| Total Households | 73 (100.0%) | 2.59 |
Household Size by Marriage Status in Dargan
Out of a total of 73 households in Dargan, 49 (67.1%) are family households, while 24 (32.9%) are nonfamily households. The most numerous type of family households are 3-person households, comprising 37, and the most common type of nonfamily households are 1-person households, comprising 24.
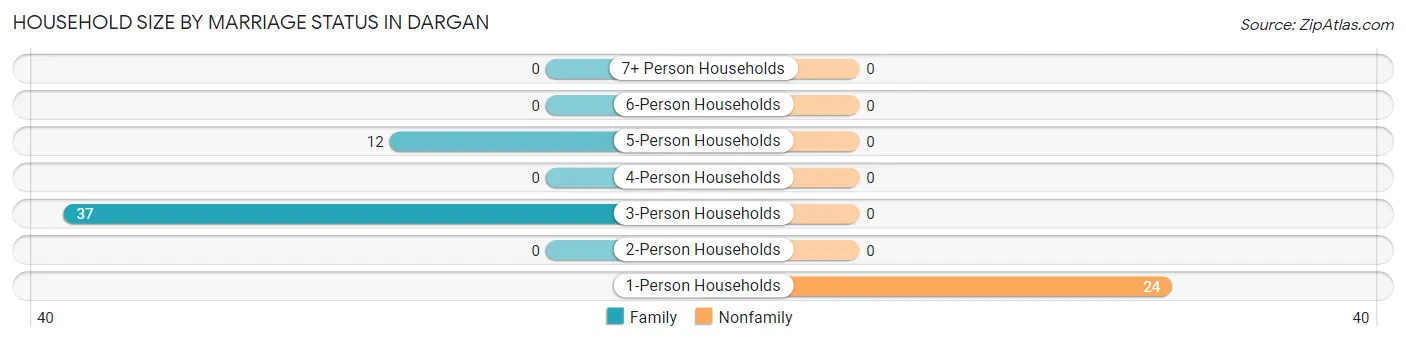
| Household Size | Family Households | Nonfamily Households |
| 1-Person Households | - | 24 (32.9%) |
| 2-Person Households | 0 (0.0%) | 0 (0.0%) |
| 3-Person Households | 37 (50.7%) | 0 (0.0%) |
| 4-Person Households | 0 (0.0%) | 0 (0.0%) |
| 5-Person Households | 12 (16.4%) | 0 (0.0%) |
| 6-Person Households | 0 (0.0%) | 0 (0.0%) |
| 7+ Person Households | 0 (0.0%) | 0 (0.0%) |
| Total | 49 (67.1%) | 24 (32.9%) |
Female Fertility in Dargan
Fertility by Age in Dargan
Average fertility rate in Dargan is 636.0 births per 1,000 women. Women in the age bracket of 20 to 34 years have the highest fertility rate with 1,000.0 births per 1,000 women. Women in the age bracket of 20 to 34 years acount for 57.1% of all women with births.
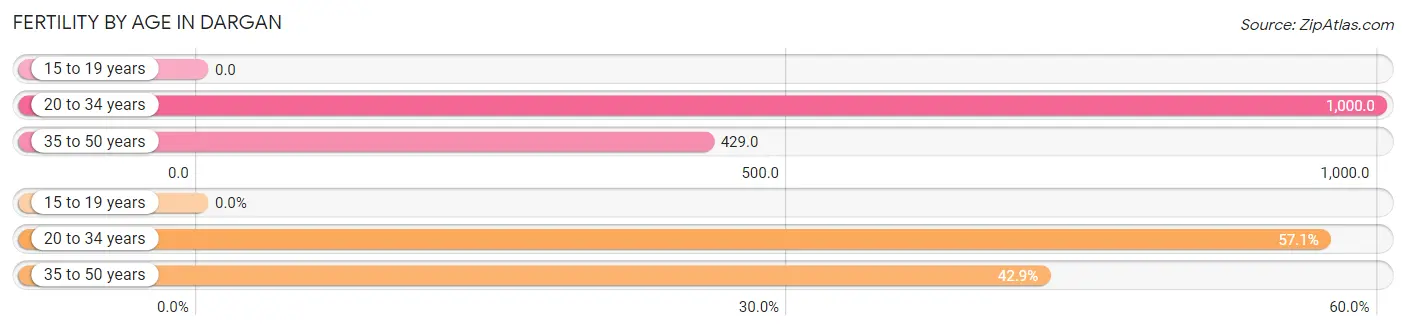
| Age Bracket | Women with Births | Births / 1,000 Women |
| 15 to 19 years | 0 (0.0%) | 0.0 |
| 20 to 34 years | 16 (57.1%) | 1,000.0 |
| 35 to 50 years | 12 (42.9%) | 429.0 |
| Total | 28 (100.0%) | 636.0 |
Fertility by Age by Marriage Status in Dargan
57.1% of women with births (28) in Dargan are married. The highest percentage of unmarried women with births falls into 35 to 50 years age bracket with 100.0% of them unmarried at the time of birth, while the lowest percentage of unmarried women with births belong to 20 to 34 years age bracket with 0.0% of them unmarried.
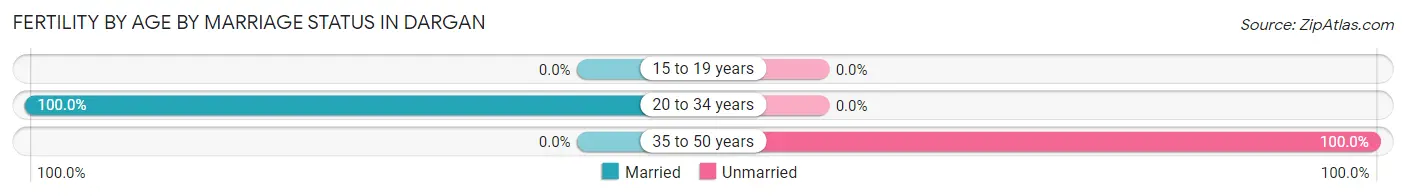
| Age Bracket | Married | Unmarried |
| 15 to 19 years | 0 (0.0%) | 0 (0.0%) |
| 20 to 34 years | 16 (100.0%) | 0 (0.0%) |
| 35 to 50 years | 0 (0.0%) | 12 (100.0%) |
| Total | 16 (57.1%) | 12 (42.9%) |
Fertility by Education in Dargan
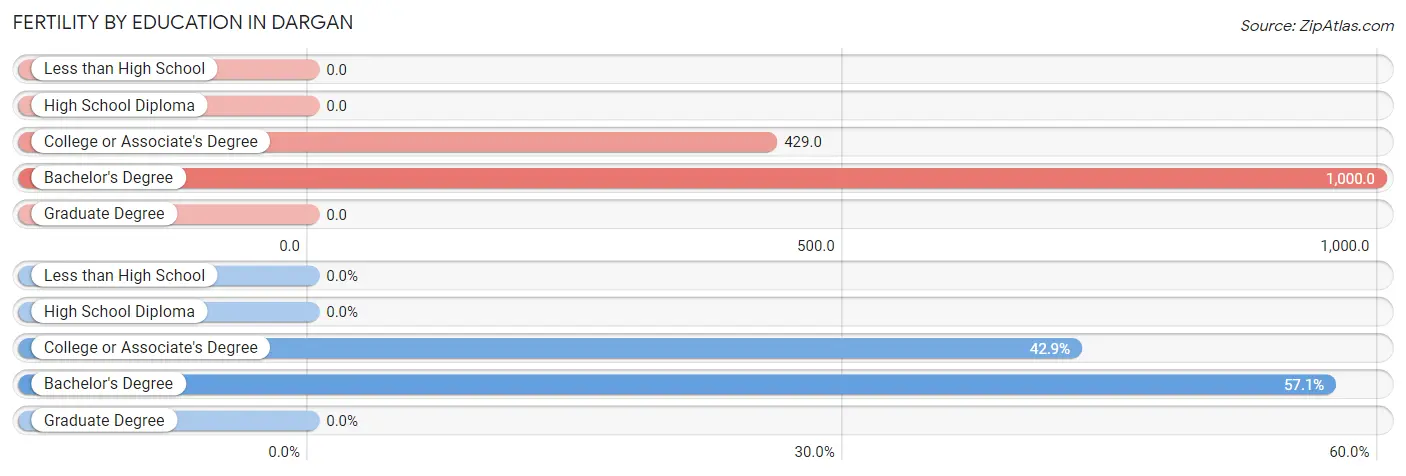
| Educational Attainment | Women with Births | Births / 1,000 Women |
| Less than High School | 0 (0.0%) | 0.0 |
| High School Diploma | 0 (0.0%) | 0.0 |
| College or Associate's Degree | 12 (42.9%) | 429.0 |
| Bachelor's Degree | 16 (57.1%) | 1,000.0 |
| Graduate Degree | 0 (0.0%) | 0.0 |
| Total | 28 (100.0%) | 636.0 |
Fertility by Education by Marriage Status in Dargan
42.9% of women with births in Dargan are unmarried. Women with the educational attainment of bachelor's degree are most likely to be married with 100.0% of them married at childbirth, while women with the educational attainment of college or associate's degree are least likely to be married with 100.0% of them unmarried at childbirth.
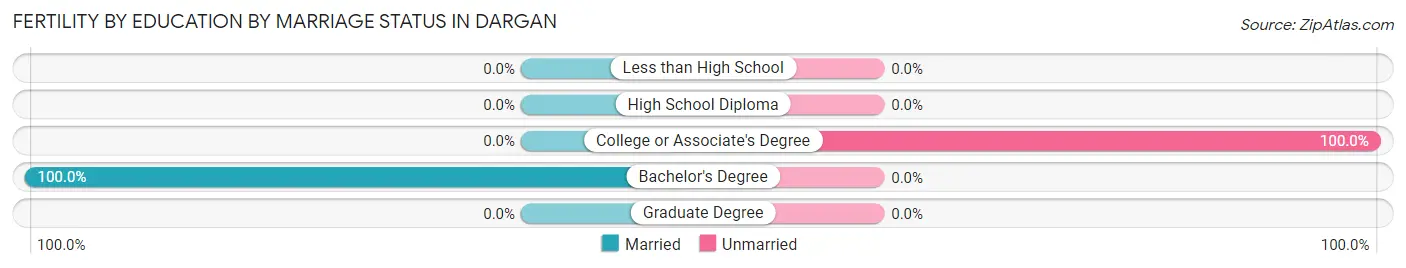
| Educational Attainment | Married | Unmarried |
| Less than High School | 0 (0.0%) | 0 (0.0%) |
| High School Diploma | 0 (0.0%) | 0 (0.0%) |
| College or Associate's Degree | 0 (0.0%) | 12 (100.0%) |
| Bachelor's Degree | 16 (100.0%) | 0 (0.0%) |
| Graduate Degree | 0 (0.0%) | 0 (0.0%) |
| Total | 16 (57.1%) | 12 (42.9%) |
Employment Characteristics in Dargan
Employment by Class of Employer in Dargan
Among the 77 employed individuals in Dargan, local government employees (33 | 42.9%), self-employed (incorporated) (16 | 20.8%), and not-for-profit organizations (16 | 20.8%) make up the most common classes of employment.
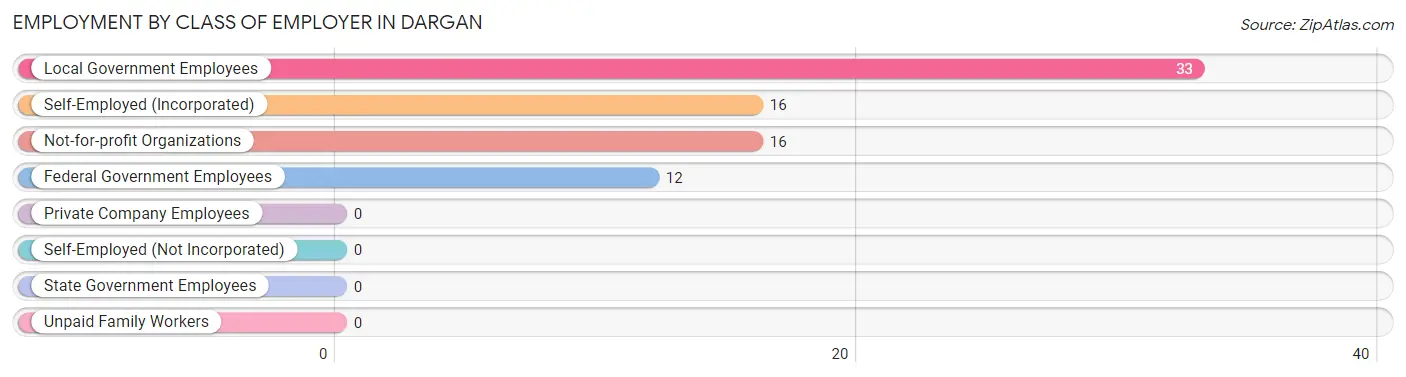
| Employer Class | # Employees | % Employees |
| Private Company Employees | 0 | 0.0% |
| Self-Employed (Incorporated) | 16 | 20.8% |
| Self-Employed (Not Incorporated) | 0 | 0.0% |
| Not-for-profit Organizations | 16 | 20.8% |
| Local Government Employees | 33 | 42.9% |
| State Government Employees | 0 | 0.0% |
| Federal Government Employees | 12 | 15.6% |
| Unpaid Family Workers | 0 | 0.0% |
| Total | 77 | 100.0% |
Employment Status by Age in Dargan
According to the labor force statistics for Dargan, out of the total population over 16 years of age (133), 82.0% or 109 individuals are in the labor force, with 29.4% or 32 of them unemployed. The age group with the highest labor force participation rate is 20 to 24 years, with 100.0% or 16 individuals in the labor force. Within the labor force, the 20 to 24 years age range has the highest percentage of unemployed individuals, with 100.0% or 16 of them being unemployed.
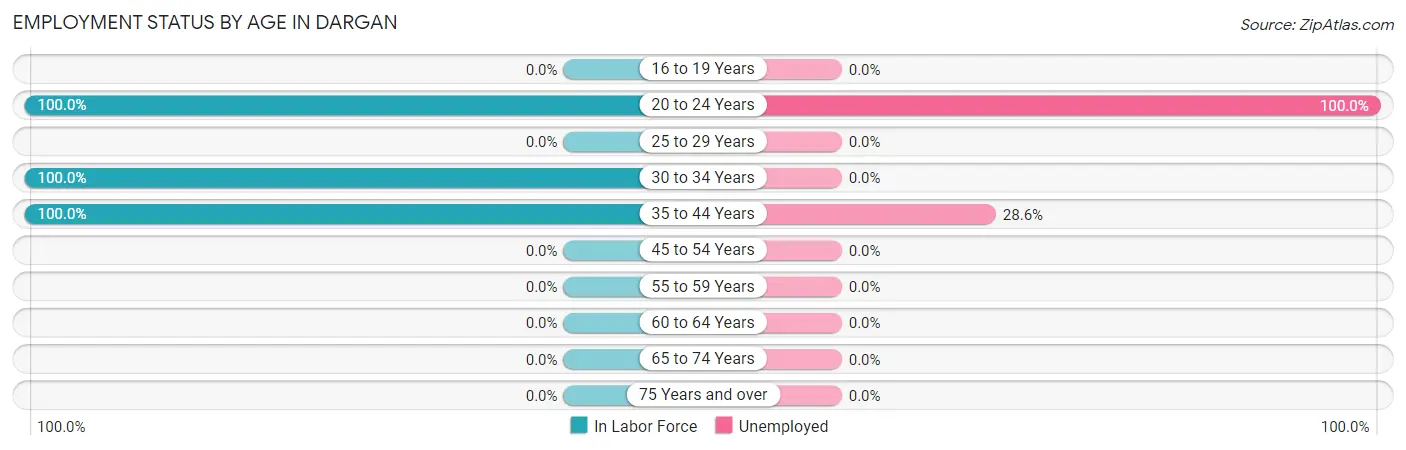
| Age Bracket | In Labor Force | Unemployed |
| 16 to 19 Years | 0 (0.0%) | 0 (0.0%) |
| 20 to 24 Years | 16 (100.0%) | 16 (100.0%) |
| 25 to 29 Years | 0 (0.0%) | 0 (0.0%) |
| 30 to 34 Years | 37 (100.0%) | 0 (0.0%) |
| 35 to 44 Years | 56 (100.0%) | 16 (28.6%) |
| 45 to 54 Years | 0 (0.0%) | 0 (0.0%) |
| 55 to 59 Years | 0 (0.0%) | 0 (0.0%) |
| 60 to 64 Years | 0 (0.0%) | 0 (0.0%) |
| 65 to 74 Years | 0 (0.0%) | 0 (0.0%) |
| 75 Years and over | 0 (0.0%) | 0 (0.0%) |
| Total | 109 (82.0%) | 32 (29.4%) |
Employment Status by Educational Attainment in Dargan
According to labor force statistics for Dargan, 100.0% of individuals (93) out of the total population between 25 and 64 years of age (93) are in the labor force, with 17.2% or 16 of them being unemployed. The group with the highest labor force participation rate are those with the educational attainment of college / associate degree, with 100.0% or 40 individuals in the labor force. Within the labor force, individuals with college / associate degree education have the highest percentage of unemployment, with 40.0% or 16 of them being unemployed.
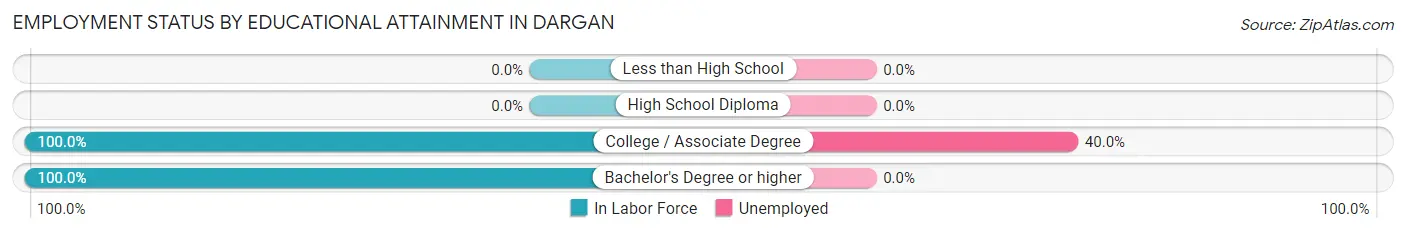
| Educational Attainment | In Labor Force | Unemployed |
| Less than High School | 0 (0.0%) | 0 (0.0%) |
| High School Diploma | 0 (0.0%) | 0 (0.0%) |
| College / Associate Degree | 40 (100.0%) | 16 (40.0%) |
| Bachelor's Degree or higher | 53 (100.0%) | 0 (0.0%) |
| Total | 93 (100.0%) | 16 (17.2%) |
Employment Occupations by Sex in Dargan
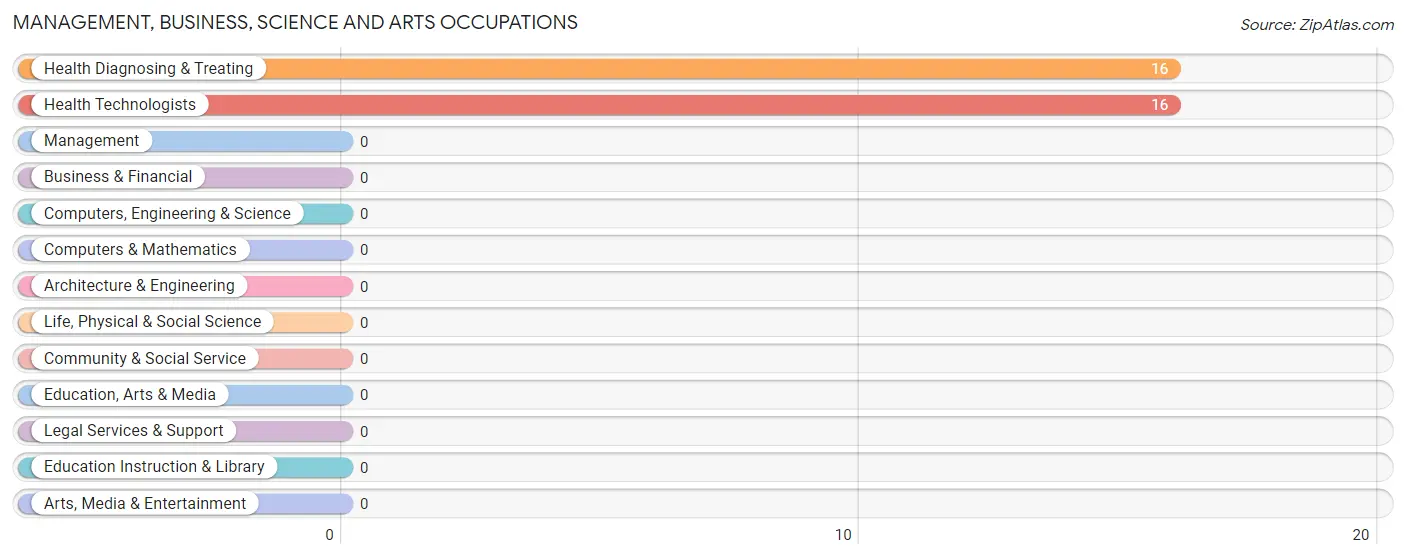
Management, Business, Science and Arts Occupations
The most common Management, Business, Science and Arts occupations in Dargan are Health Diagnosing & Treating (16 | 20.8%), and Health Technologists (16 | 20.8%).
Management, Business, Science and Arts Occupations by Sex
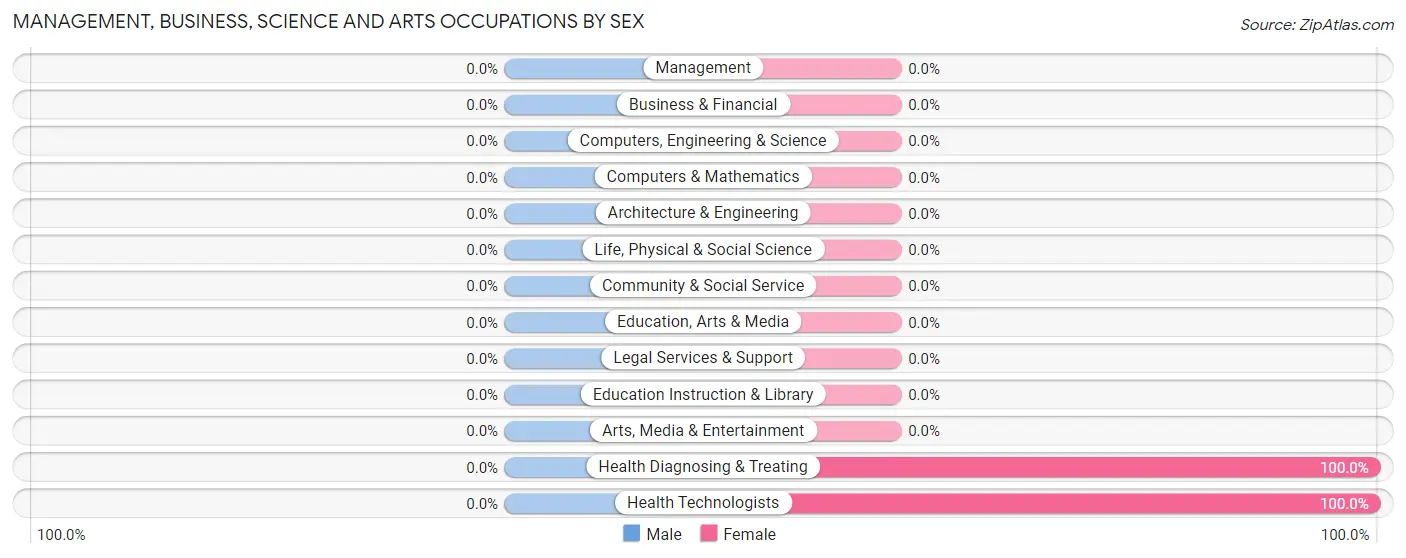
| Occupation | Male | Female |
| Management | 0 (0.0%) | 0 (0.0%) |
| Business & Financial | 0 (0.0%) | 0 (0.0%) |
| Computers, Engineering & Science | 0 (0.0%) | 0 (0.0%) |
| Computers & Mathematics | 0 (0.0%) | 0 (0.0%) |
| Architecture & Engineering | 0 (0.0%) | 0 (0.0%) |
| Life, Physical & Social Science | 0 (0.0%) | 0 (0.0%) |
| Community & Social Service | 0 (0.0%) | 0 (0.0%) |
| Education, Arts & Media | 0 (0.0%) | 0 (0.0%) |
| Legal Services & Support | 0 (0.0%) | 0 (0.0%) |
| Education Instruction & Library | 0 (0.0%) | 0 (0.0%) |
| Arts, Media & Entertainment | 0 (0.0%) | 0 (0.0%) |
| Health Diagnosing & Treating | 0 (0.0%) | 16 (100.0%) |
| Health Technologists | 0 (0.0%) | 16 (100.0%) |
| Total (Category) | 0 (0.0%) | 16 (100.0%) |
| Total (Overall) | 49 (63.6%) | 28 (36.4%) |
Services Occupations
The most common Services occupations in Dargan are Security & Protection (33 | 42.9%), Law Enforcement (21 | 27.3%), and Firefighting & Prevention (12 | 15.6%).
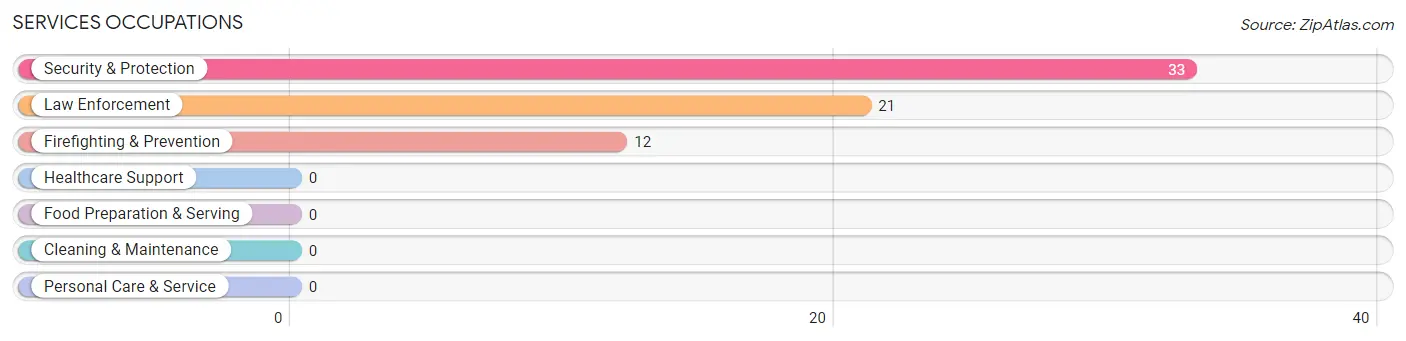
Services Occupations by Sex
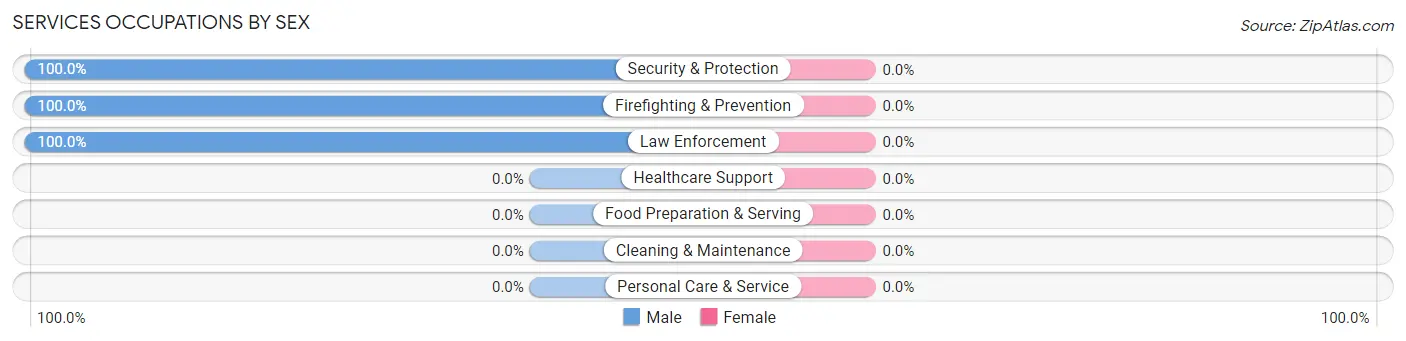
| Occupation | Male | Female |
| Healthcare Support | 0 (0.0%) | 0 (0.0%) |
| Security & Protection | 33 (100.0%) | 0 (0.0%) |
| Firefighting & Prevention | 12 (100.0%) | 0 (0.0%) |
| Law Enforcement | 21 (100.0%) | 0 (0.0%) |
| Food Preparation & Serving | 0 (0.0%) | 0 (0.0%) |
| Cleaning & Maintenance | 0 (0.0%) | 0 (0.0%) |
| Personal Care & Service | 0 (0.0%) | 0 (0.0%) |
| Total (Category) | 33 (100.0%) | 0 (0.0%) |
| Total (Overall) | 49 (63.6%) | 28 (36.4%) |
Sales and Office Occupations
The most common Sales and Office occupations in Dargan are Sales & Related (16 | 20.8%), and Office & Administration (12 | 15.6%).
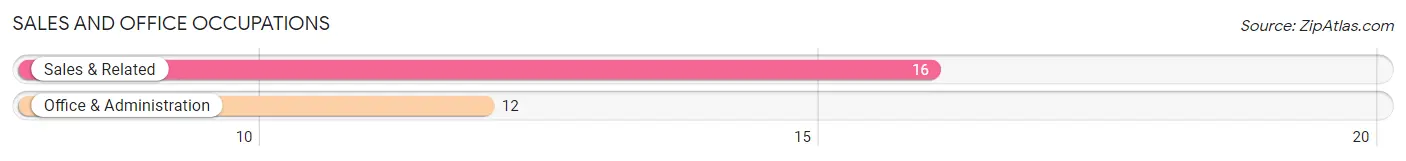
Sales and Office Occupations by Sex

| Occupation | Male | Female |
| Sales & Related | 16 (100.0%) | 0 (0.0%) |
| Office & Administration | 0 (0.0%) | 12 (100.0%) |
| Total (Category) | 16 (57.1%) | 12 (42.9%) |
| Total (Overall) | 49 (63.6%) | 28 (36.4%) |
Natural Resources, Construction and Maintenance Occupations
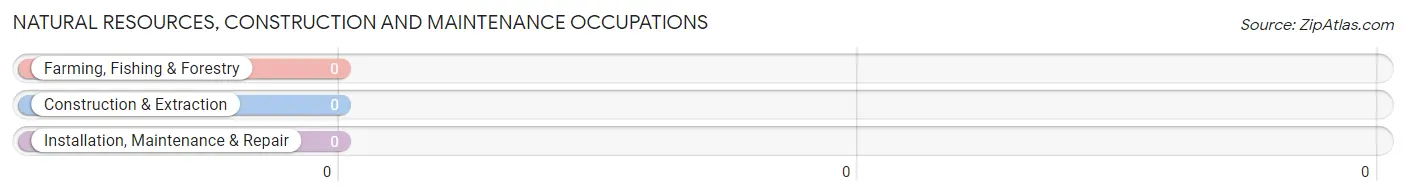
Natural Resources, Construction and Maintenance Occupations by Sex
| Occupation | Male | Female |
| Farming, Fishing & Forestry | 0 (0.0%) | 0 (0.0%) |
| Construction & Extraction | 0 (0.0%) | 0 (0.0%) |
| Installation, Maintenance & Repair | 0 (0.0%) | 0 (0.0%) |
| Total (Category) | 0 (0.0%) | 0 (0.0%) |
| Total (Overall) | 49 (63.6%) | 28 (36.4%) |
Production, Transportation and Moving Occupations
Production, Transportation and Moving Occupations by Sex
| Occupation | Male | Female |
| Production | 0 (0.0%) | 0 (0.0%) |
| Transportation | 0 (0.0%) | 0 (0.0%) |
| Material Moving | 0 (0.0%) | 0 (0.0%) |
| Total (Category) | 0 (0.0%) | 0 (0.0%) |
| Total (Overall) | 49 (63.6%) | 28 (36.4%) |
Employment Industries by Sex in Dargan
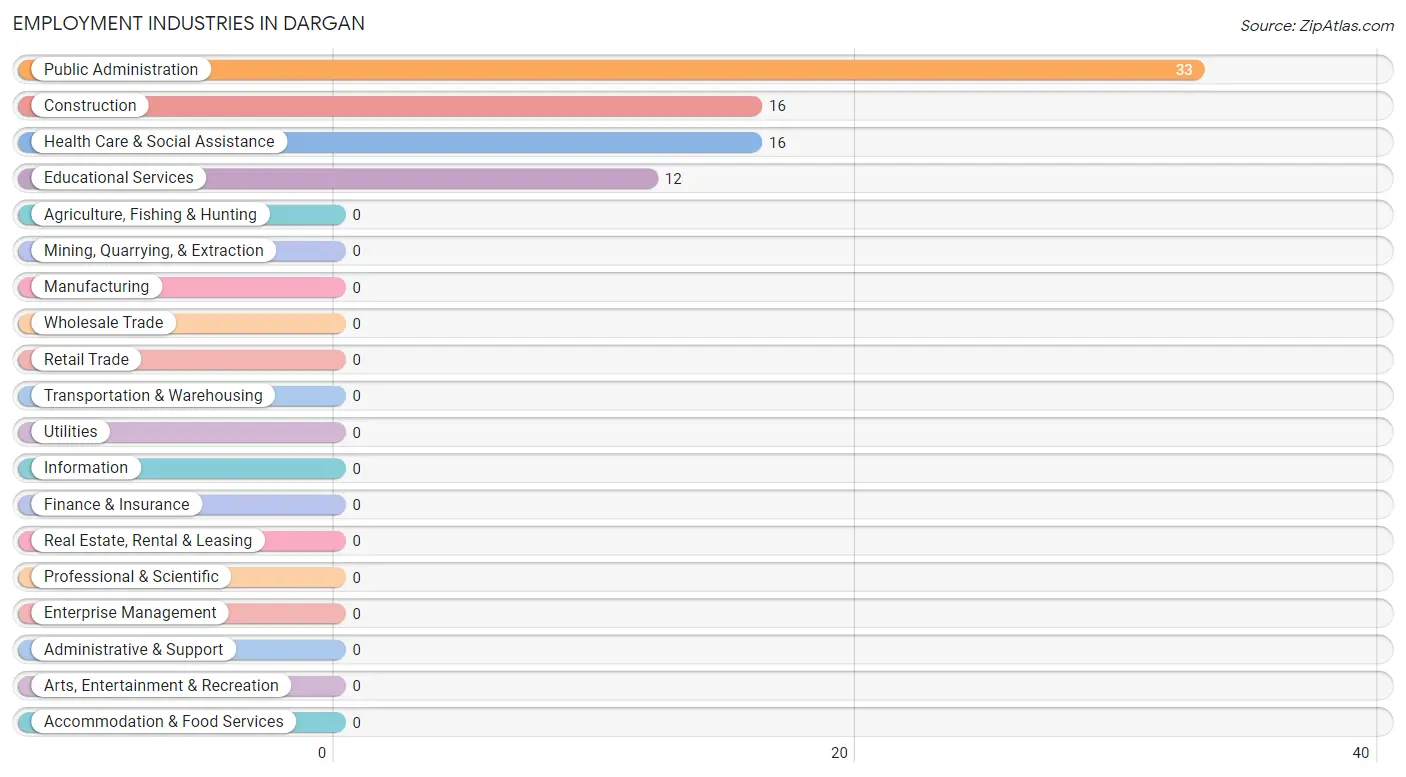
Employment Industries in Dargan
The major employment industries in Dargan include Public Administration (33 | 42.9%), Construction (16 | 20.8%), Health Care & Social Assistance (16 | 20.8%), and Educational Services (12 | 15.6%).
Employment Industries by Sex in Dargan
The Dargan industries that see more men than women are Construction (100.0%), and Public Administration (100.0%), whereas the industries that tend to have a higher number of women are Educational Services (100.0%), and Health Care & Social Assistance (100.0%).
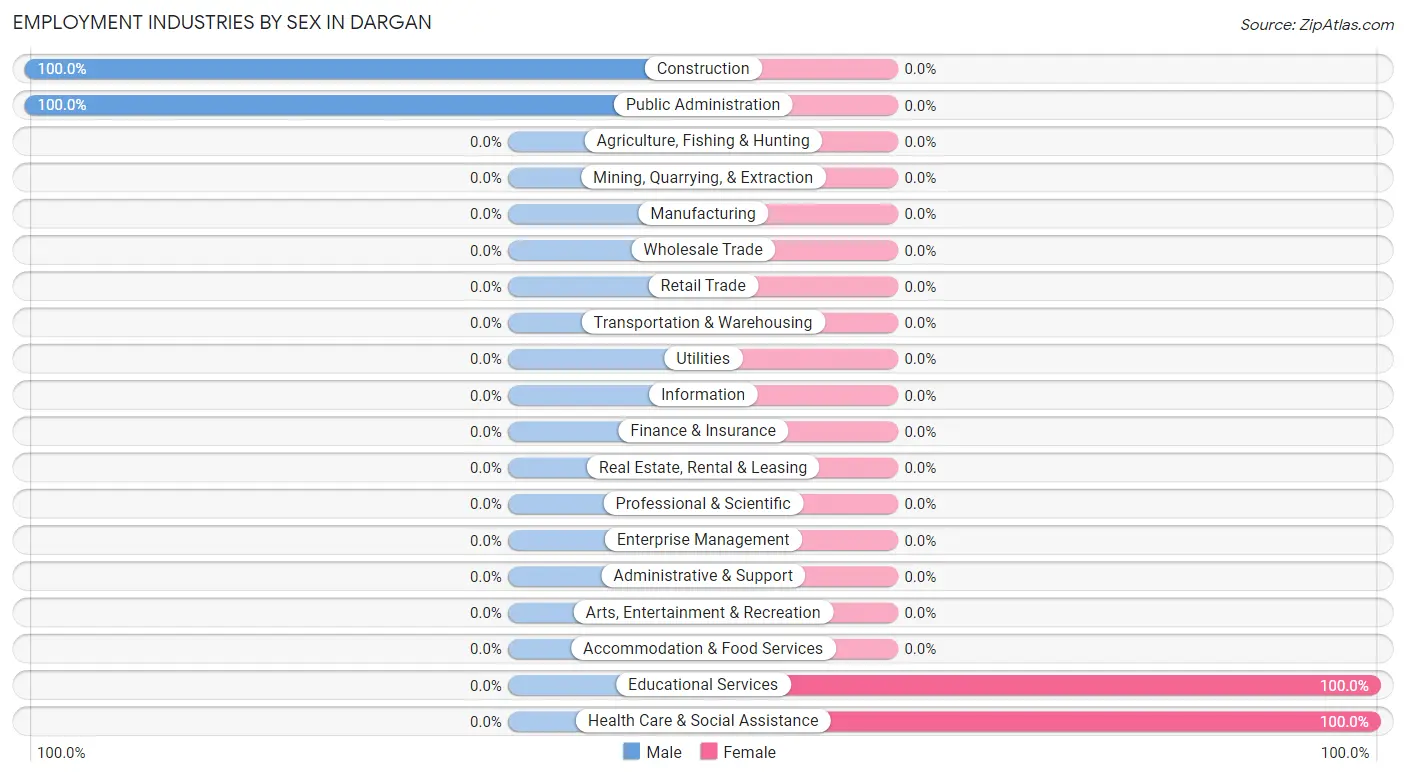
| Industry | Male | Female |
| Agriculture, Fishing & Hunting | 0 (0.0%) | 0 (0.0%) |
| Mining, Quarrying, & Extraction | 0 (0.0%) | 0 (0.0%) |
| Construction | 16 (100.0%) | 0 (0.0%) |
| Manufacturing | 0 (0.0%) | 0 (0.0%) |
| Wholesale Trade | 0 (0.0%) | 0 (0.0%) |
| Retail Trade | 0 (0.0%) | 0 (0.0%) |
| Transportation & Warehousing | 0 (0.0%) | 0 (0.0%) |
| Utilities | 0 (0.0%) | 0 (0.0%) |
| Information | 0 (0.0%) | 0 (0.0%) |
| Finance & Insurance | 0 (0.0%) | 0 (0.0%) |
| Real Estate, Rental & Leasing | 0 (0.0%) | 0 (0.0%) |
| Professional & Scientific | 0 (0.0%) | 0 (0.0%) |
| Enterprise Management | 0 (0.0%) | 0 (0.0%) |
| Administrative & Support | 0 (0.0%) | 0 (0.0%) |
| Educational Services | 0 (0.0%) | 12 (100.0%) |
| Health Care & Social Assistance | 0 (0.0%) | 16 (100.0%) |
| Arts, Entertainment & Recreation | 0 (0.0%) | 0 (0.0%) |
| Accommodation & Food Services | 0 (0.0%) | 0 (0.0%) |
| Public Administration | 33 (100.0%) | 0 (0.0%) |
| Total | 49 (63.6%) | 28 (36.4%) |
Education in Dargan
School Enrollment in Dargan
The most common levels of schooling among the 25 students in Dargan are elementary school (13 | 52.0%), and middle school (12 | 48.0%).
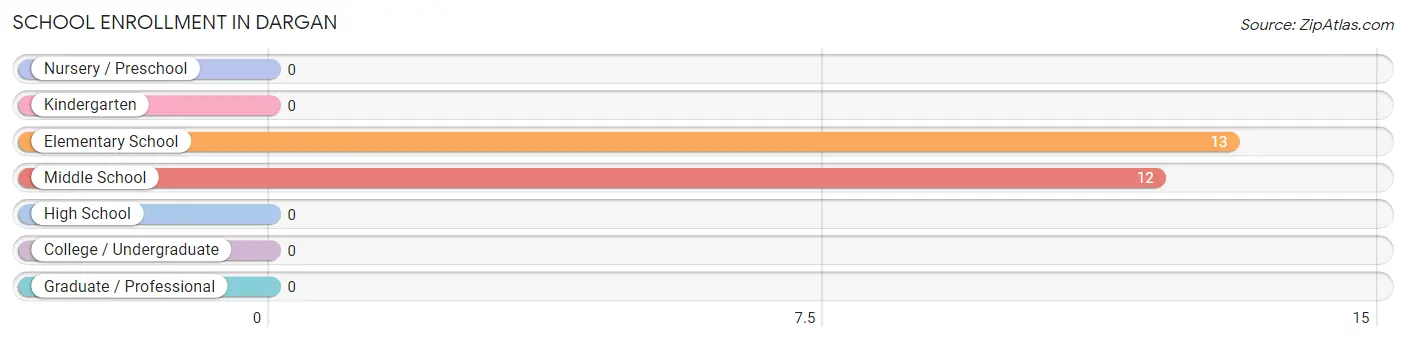
| School Level | # Students | % Students |
| Nursery / Preschool | 0 | 0.0% |
| Kindergarten | 0 | 0.0% |
| Elementary School | 13 | 52.0% |
| Middle School | 12 | 48.0% |
| High School | 0 | 0.0% |
| College / Undergraduate | 0 | 0.0% |
| Graduate / Professional | 0 | 0.0% |
| Total | 25 | 100.0% |
School Enrollment by Age by Funding Source in Dargan
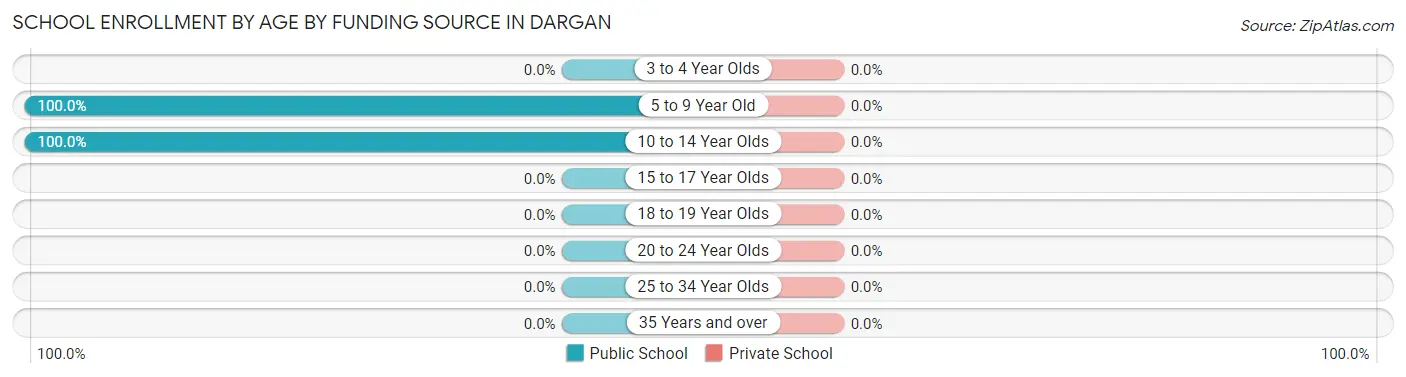
| Age Bracket | Public School | Private School |
| 3 to 4 Year Olds | 0 (0.0%) | 0 (0.0%) |
| 5 to 9 Year Old | 13 (100.0%) | 0 (0.0%) |
| 10 to 14 Year Olds | 12 (100.0%) | 0 (0.0%) |
| 15 to 17 Year Olds | 0 (0.0%) | 0 (0.0%) |
| 18 to 19 Year Olds | 0 (0.0%) | 0 (0.0%) |
| 20 to 24 Year Olds | 0 (0.0%) | 0 (0.0%) |
| 25 to 34 Year Olds | 0 (0.0%) | 0 (0.0%) |
| 35 Years and over | 0 (0.0%) | 0 (0.0%) |
| Total | 25 (100.0%) | 0 (0.0%) |
Educational Attainment by Field of Study in Dargan
Arts & humanities (21 | 39.6%), computers & mathematics (16 | 30.2%), and science & technology (16 | 30.2%) are the most common fields of study among 53 individuals in Dargan who have obtained a bachelor's degree or higher.
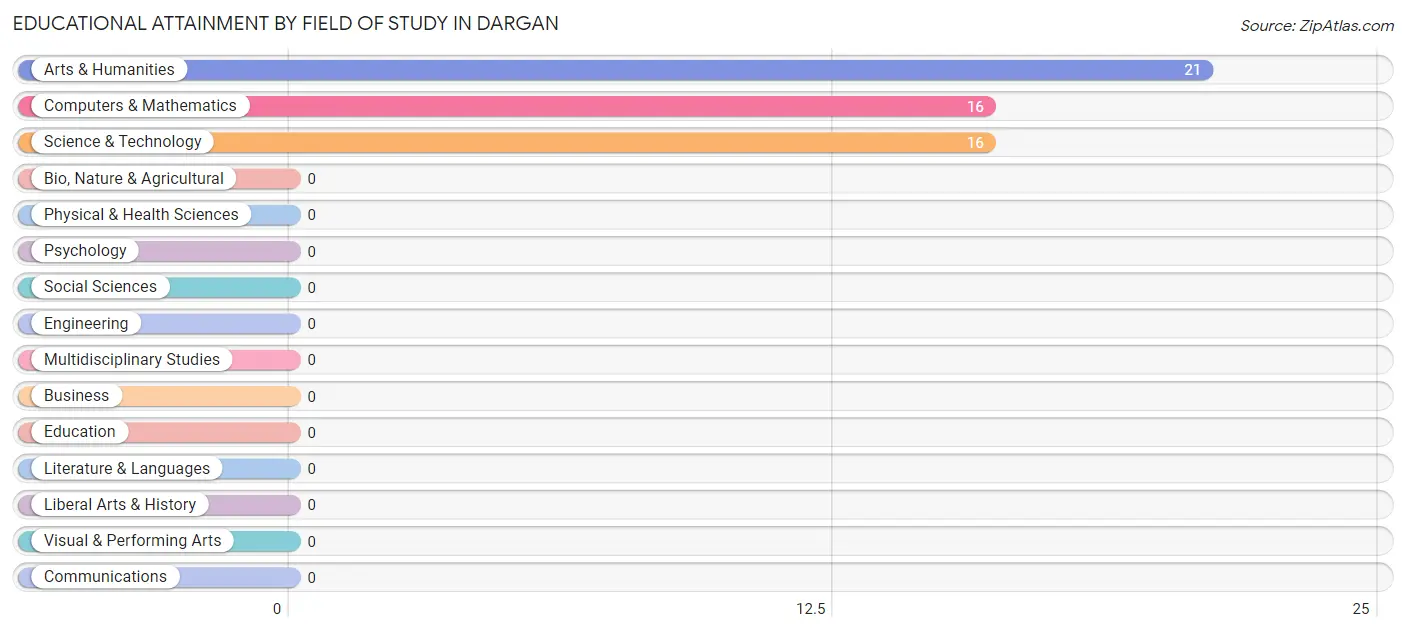
| Field of Study | # Graduates | % Graduates |
| Computers & Mathematics | 16 | 30.2% |
| Bio, Nature & Agricultural | 0 | 0.0% |
| Physical & Health Sciences | 0 | 0.0% |
| Psychology | 0 | 0.0% |
| Social Sciences | 0 | 0.0% |
| Engineering | 0 | 0.0% |
| Multidisciplinary Studies | 0 | 0.0% |
| Science & Technology | 16 | 30.2% |
| Business | 0 | 0.0% |
| Education | 0 | 0.0% |
| Literature & Languages | 0 | 0.0% |
| Liberal Arts & History | 0 | 0.0% |
| Visual & Performing Arts | 0 | 0.0% |
| Communications | 0 | 0.0% |
| Arts & Humanities | 21 | 39.6% |
| Total | 53 | 100.0% |
Transportation & Commute in Dargan
Vehicle Availability by Sex in Dargan
The most prevalent vehicle ownership categories in Dargan are males with 3 vehicles (28, accounting for 57.1%) and females with 3 vehicles (12, making up 100.0%).
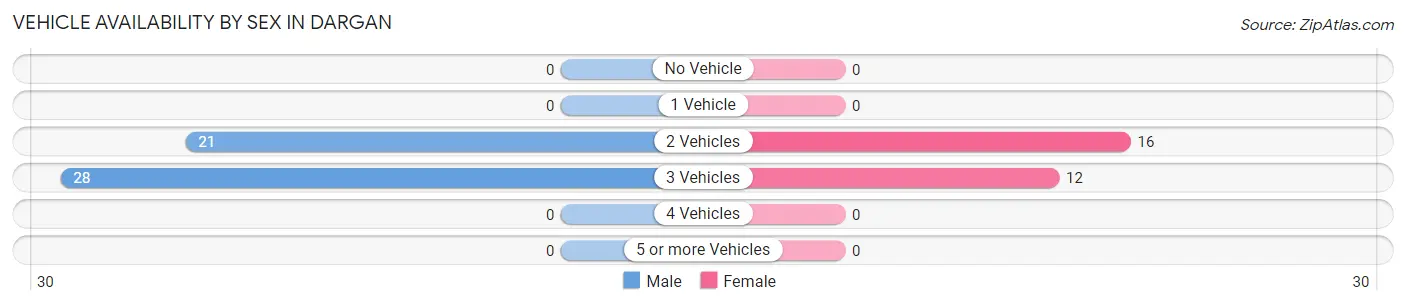
| Vehicles Available | Male | Female |
| No Vehicle | 0 (0.0%) | 0 (0.0%) |
| 1 Vehicle | 0 (0.0%) | 0 (0.0%) |
| 2 Vehicles | 21 (42.9%) | 16 (57.1%) |
| 3 Vehicles | 28 (57.1%) | 12 (42.9%) |
| 4 Vehicles | 0 (0.0%) | 0 (0.0%) |
| 5 or more Vehicles | 0 (0.0%) | 0 (0.0%) |
| Total | 49 (100.0%) | 28 (100.0%) |
Commute Time in Dargan
The most frequently occuring commute durations in Dargan are less than 5 minutes (16 commuters, 36.4%), 30 to 34 minutes (16 commuters, 36.4%), and 40 to 44 minutes (12 commuters, 27.3%).
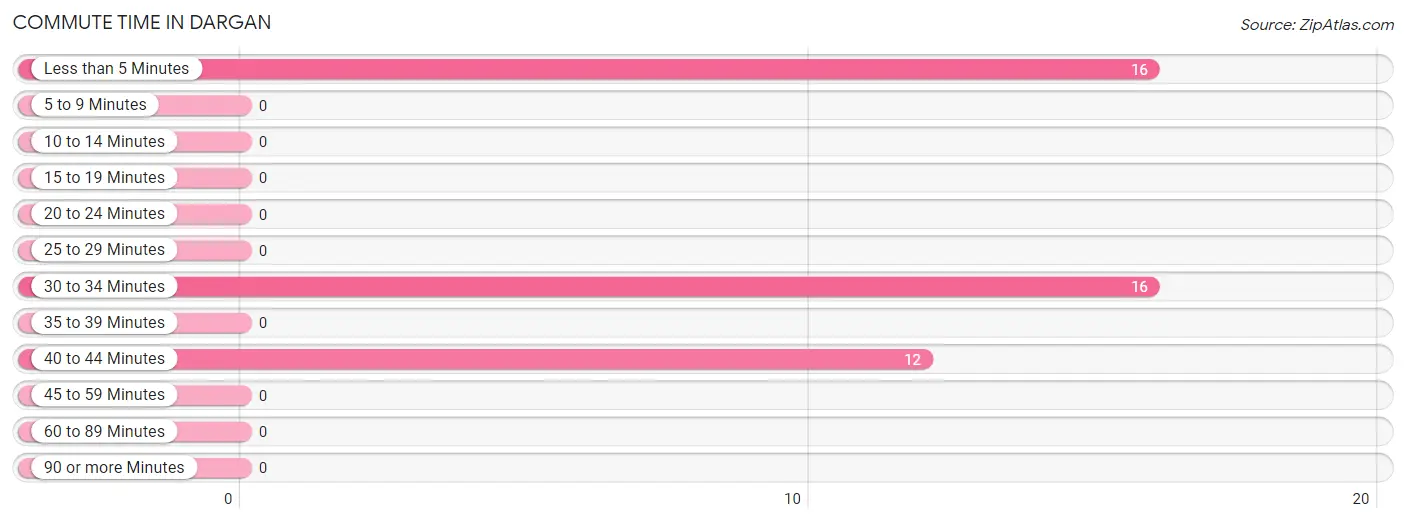
| Commute Time | # Commuters | % Commuters |
| Less than 5 Minutes | 16 | 36.4% |
| 5 to 9 Minutes | 0 | 0.0% |
| 10 to 14 Minutes | 0 | 0.0% |
| 15 to 19 Minutes | 0 | 0.0% |
| 20 to 24 Minutes | 0 | 0.0% |
| 25 to 29 Minutes | 0 | 0.0% |
| 30 to 34 Minutes | 16 | 36.4% |
| 35 to 39 Minutes | 0 | 0.0% |
| 40 to 44 Minutes | 12 | 27.3% |
| 45 to 59 Minutes | 0 | 0.0% |
| 60 to 89 Minutes | 0 | 0.0% |
| 90 or more Minutes | 0 | 0.0% |
Commute Time by Sex in Dargan
The most common commute times in Dargan are 30 to 34 minutes (16 commuters, 57.1%) for males and less than 5 minutes (16 commuters, 100.0%) for females.
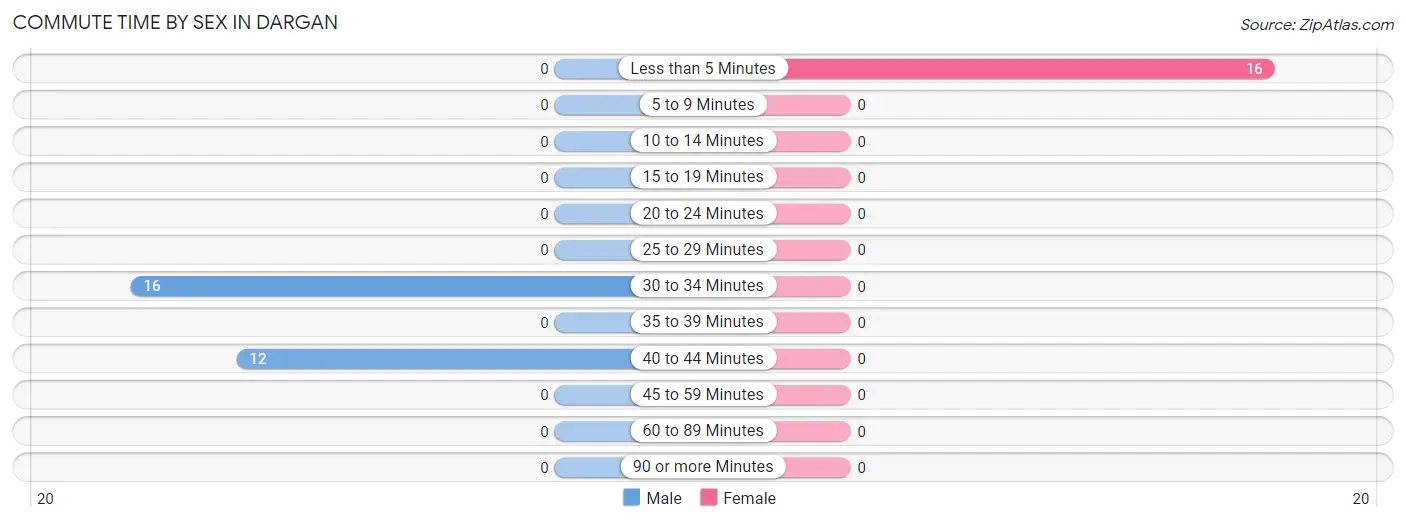
| Commute Time | Male | Female |
| Less than 5 Minutes | 0 (0.0%) | 16 (100.0%) |
| 5 to 9 Minutes | 0 (0.0%) | 0 (0.0%) |
| 10 to 14 Minutes | 0 (0.0%) | 0 (0.0%) |
| 15 to 19 Minutes | 0 (0.0%) | 0 (0.0%) |
| 20 to 24 Minutes | 0 (0.0%) | 0 (0.0%) |
| 25 to 29 Minutes | 0 (0.0%) | 0 (0.0%) |
| 30 to 34 Minutes | 16 (57.1%) | 0 (0.0%) |
| 35 to 39 Minutes | 0 (0.0%) | 0 (0.0%) |
| 40 to 44 Minutes | 12 (42.9%) | 0 (0.0%) |
| 45 to 59 Minutes | 0 (0.0%) | 0 (0.0%) |
| 60 to 89 Minutes | 0 (0.0%) | 0 (0.0%) |
| 90 or more Minutes | 0 (0.0%) | 0 (0.0%) |
Time of Departure to Work by Sex in Dargan
The most frequent times of departure to work in Dargan are 6:30 AM to 6:59 AM (28, 100.0%) for males and 7:00 AM to 7:29 AM (16, 100.0%) for females.
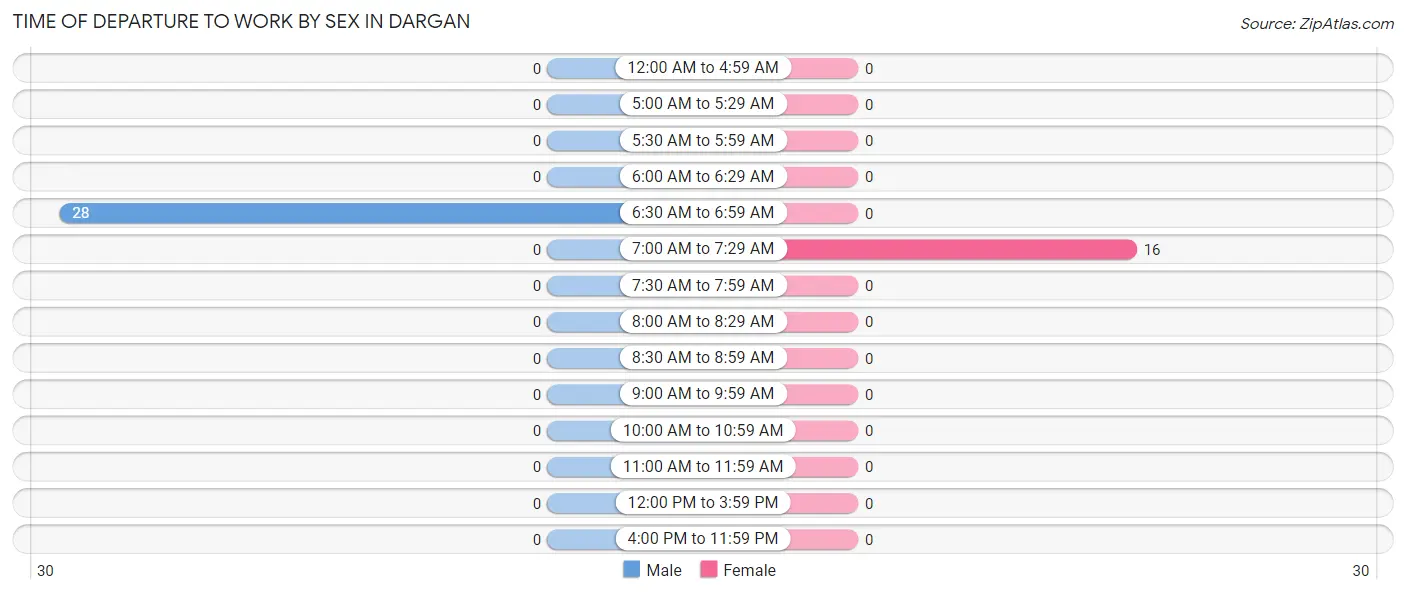
| Time of Departure | Male | Female |
| 12:00 AM to 4:59 AM | 0 (0.0%) | 0 (0.0%) |
| 5:00 AM to 5:29 AM | 0 (0.0%) | 0 (0.0%) |
| 5:30 AM to 5:59 AM | 0 (0.0%) | 0 (0.0%) |
| 6:00 AM to 6:29 AM | 0 (0.0%) | 0 (0.0%) |
| 6:30 AM to 6:59 AM | 28 (100.0%) | 0 (0.0%) |
| 7:00 AM to 7:29 AM | 0 (0.0%) | 16 (100.0%) |
| 7:30 AM to 7:59 AM | 0 (0.0%) | 0 (0.0%) |
| 8:00 AM to 8:29 AM | 0 (0.0%) | 0 (0.0%) |
| 8:30 AM to 8:59 AM | 0 (0.0%) | 0 (0.0%) |
| 9:00 AM to 9:59 AM | 0 (0.0%) | 0 (0.0%) |
| 10:00 AM to 10:59 AM | 0 (0.0%) | 0 (0.0%) |
| 11:00 AM to 11:59 AM | 0 (0.0%) | 0 (0.0%) |
| 12:00 PM to 3:59 PM | 0 (0.0%) | 0 (0.0%) |
| 4:00 PM to 11:59 PM | 0 (0.0%) | 0 (0.0%) |
| Total | 28 (100.0%) | 16 (100.0%) |
Housing Occupancy in Dargan
Occupancy by Ownership in Dargan
Of the total 73 dwellings in Dargan, owner-occupied units account for 73 (100.0%), while renter-occupied units make up 0 (0.0%).
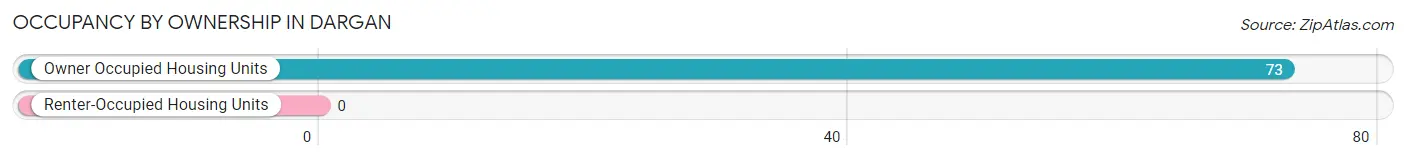
| Occupancy | # Housing Units | % Housing Units |
| Owner Occupied Housing Units | 73 | 100.0% |
| Renter-Occupied Housing Units | 0 | 0.0% |
| Total Occupied Housing Units | 73 | 100.0% |
Occupancy by Household Size in Dargan
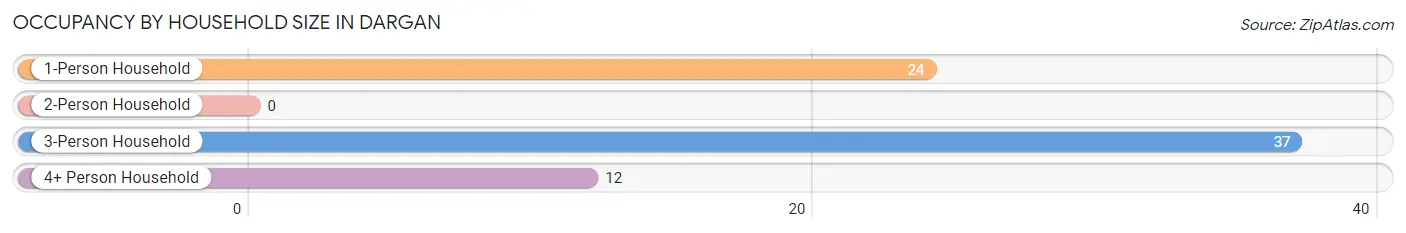
| Household Size | # Housing Units | % Housing Units |
| 1-Person Household | 24 | 32.9% |
| 2-Person Household | 0 | 0.0% |
| 3-Person Household | 37 | 50.7% |
| 4+ Person Household | 12 | 16.4% |
| Total Housing Units | 73 | 100.0% |
Occupancy by Ownership by Household Size in Dargan
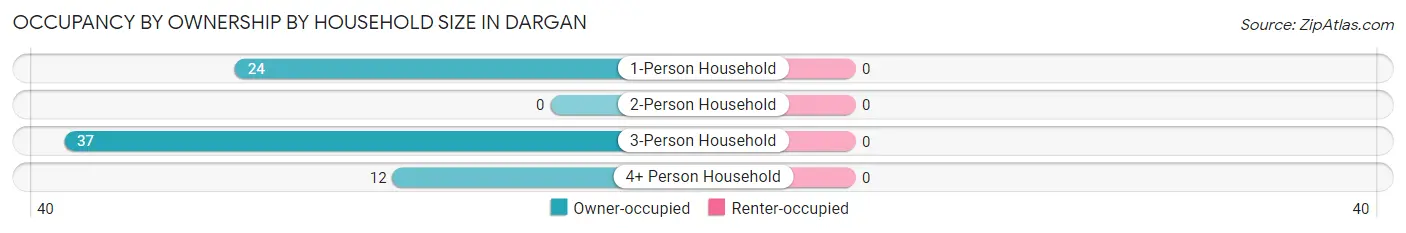
| Household Size | Owner-occupied | Renter-occupied |
| 1-Person Household | 24 (100.0%) | 0 (0.0%) |
| 2-Person Household | 0 (0.0%) | 0 (0.0%) |
| 3-Person Household | 37 (100.0%) | 0 (0.0%) |
| 4+ Person Household | 12 (100.0%) | 0 (0.0%) |
| Total Housing Units | 73 (100.0%) | 0 (0.0%) |
Occupancy by Educational Attainment in Dargan
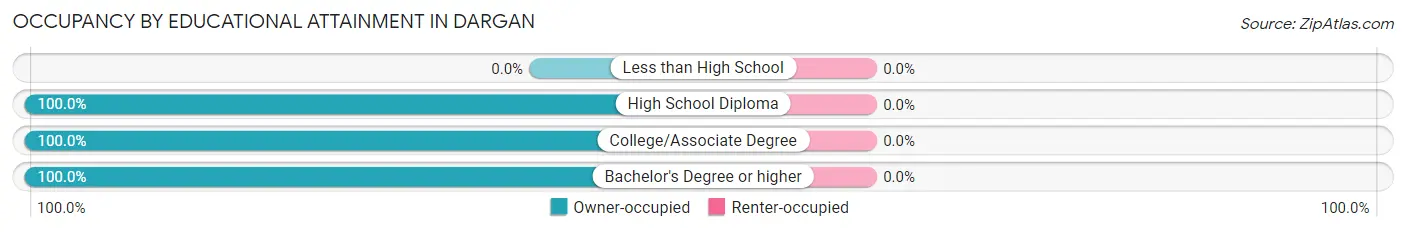
| Household Size | Owner-occupied | Renter-occupied |
| Less than High School | 0 (0.0%) | 0 (0.0%) |
| High School Diploma | 24 (100.0%) | 0 (0.0%) |
| College/Associate Degree | 12 (100.0%) | 0 (0.0%) |
| Bachelor's Degree or higher | 37 (100.0%) | 0 (0.0%) |
Occupancy by Age of Householder in Dargan
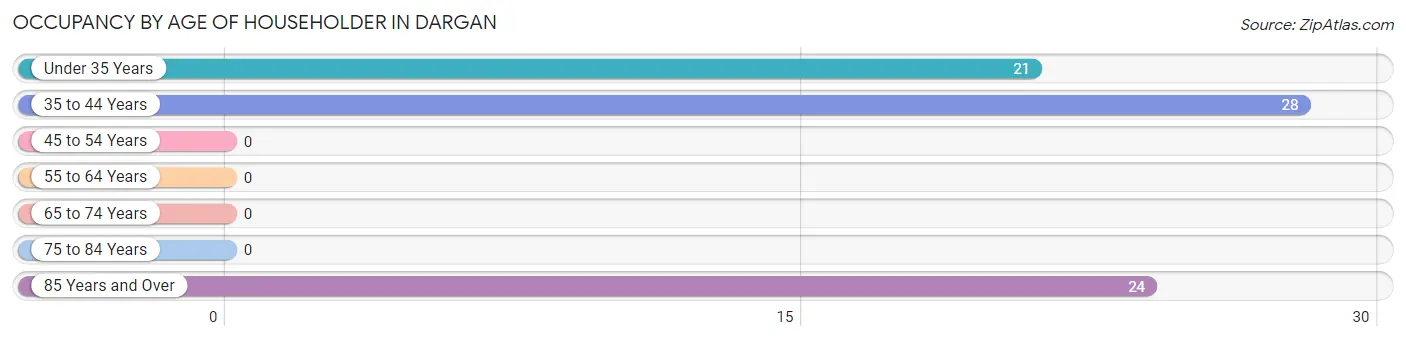
| Age Bracket | # Households | % Households |
| Under 35 Years | 21 | 28.8% |
| 35 to 44 Years | 28 | 38.4% |
| 45 to 54 Years | 0 | 0.0% |
| 55 to 64 Years | 0 | 0.0% |
| 65 to 74 Years | 0 | 0.0% |
| 75 to 84 Years | 0 | 0.0% |
| 85 Years and Over | 24 | 32.9% |
| Total | 73 | 100.0% |
Housing Finances in Dargan
Median Income by Occupancy in Dargan
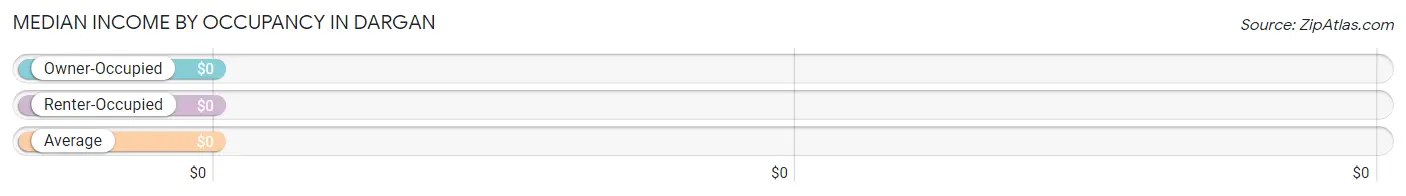
| Occupancy Type | # Households | Median Income |
| Owner-Occupied | 73 (100.0%) | $0 |
| Renter-Occupied | 0 (0.0%) | $0 |
| Average | 73 (100.0%) | $0 |
Occupancy by Householder Income Bracket in Dargan
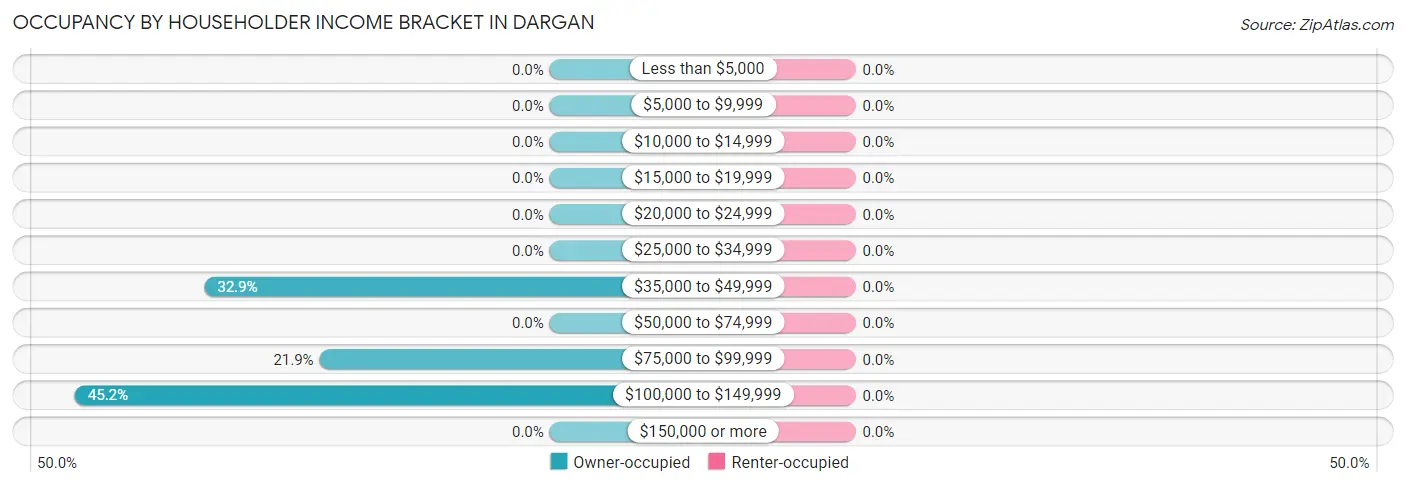
| Income Bracket | Owner-occupied | Renter-occupied |
| Less than $5,000 | 0 (0.0%) | 0 (0.0%) |
| $5,000 to $9,999 | 0 (0.0%) | 0 (0.0%) |
| $10,000 to $14,999 | 0 (0.0%) | 0 (0.0%) |
| $15,000 to $19,999 | 0 (0.0%) | 0 (0.0%) |
| $20,000 to $24,999 | 0 (0.0%) | 0 (0.0%) |
| $25,000 to $34,999 | 0 (0.0%) | 0 (0.0%) |
| $35,000 to $49,999 | 24 (32.9%) | 0 (0.0%) |
| $50,000 to $74,999 | 0 (0.0%) | 0 (0.0%) |
| $75,000 to $99,999 | 16 (21.9%) | 0 (0.0%) |
| $100,000 to $149,999 | 33 (45.2%) | 0 (0.0%) |
| $150,000 or more | 0 (0.0%) | 0 (0.0%) |
| Total | 73 (100.0%) | 0 (0.0%) |
Monthly Housing Cost Tiers in Dargan
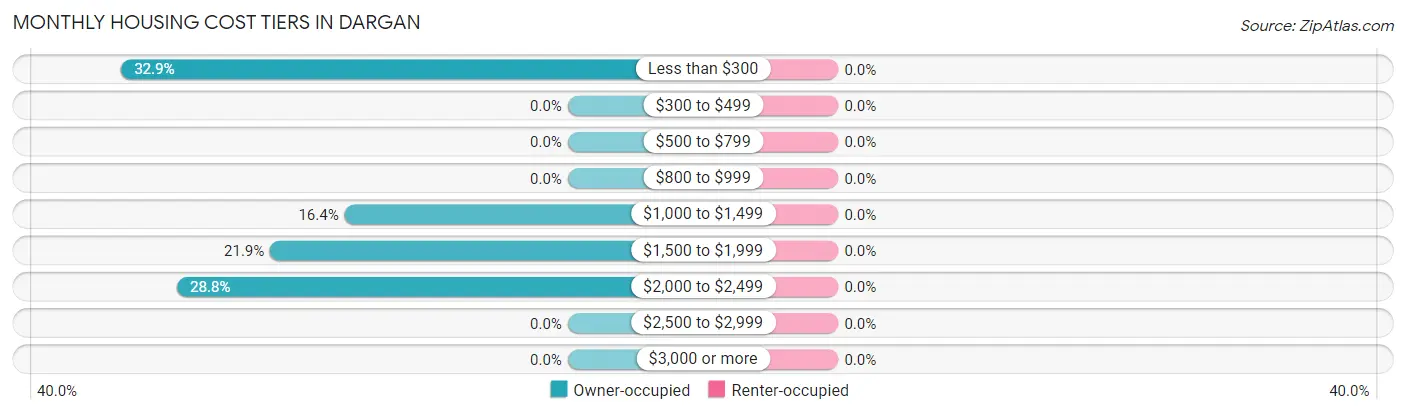
| Monthly Cost | Owner-occupied | Renter-occupied |
| Less than $300 | 24 (32.9%) | 0 (0.0%) |
| $300 to $499 | 0 (0.0%) | 0 (0.0%) |
| $500 to $799 | 0 (0.0%) | 0 (0.0%) |
| $800 to $999 | 0 (0.0%) | 0 (0.0%) |
| $1,000 to $1,499 | 12 (16.4%) | 0 (0.0%) |
| $1,500 to $1,999 | 16 (21.9%) | 0 (0.0%) |
| $2,000 to $2,499 | 21 (28.8%) | 0 (0.0%) |
| $2,500 to $2,999 | 0 (0.0%) | 0 (0.0%) |
| $3,000 or more | 0 (0.0%) | 0 (0.0%) |
| Total | 73 (100.0%) | 0 (0.0%) |
Physical Housing Characteristics in Dargan
Housing Structures in Dargan
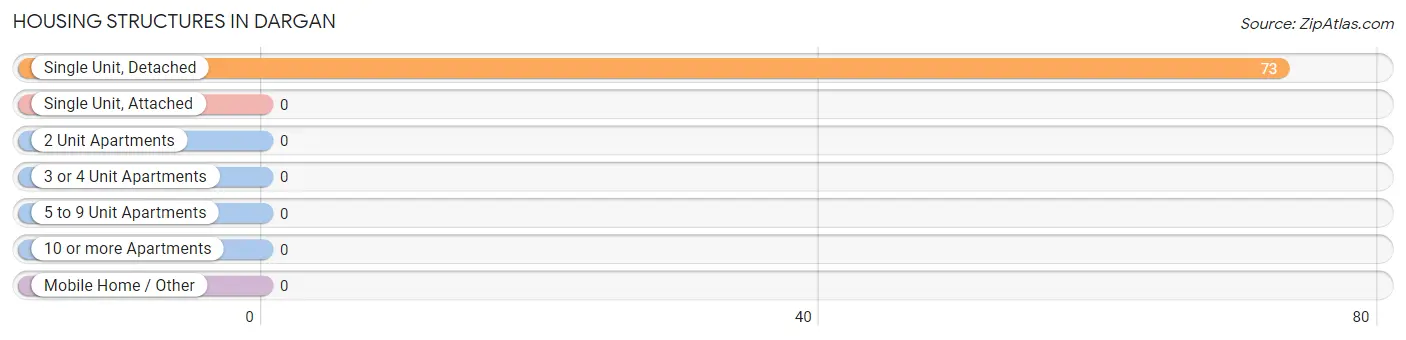
| Structure Type | # Housing Units | % Housing Units |
| Single Unit, Detached | 73 | 100.0% |
| Single Unit, Attached | 0 | 0.0% |
| 2 Unit Apartments | 0 | 0.0% |
| 3 or 4 Unit Apartments | 0 | 0.0% |
| 5 to 9 Unit Apartments | 0 | 0.0% |
| 10 or more Apartments | 0 | 0.0% |
| Mobile Home / Other | 0 | 0.0% |
| Total | 73 | 100.0% |
Housing Structures by Occupancy in Dargan
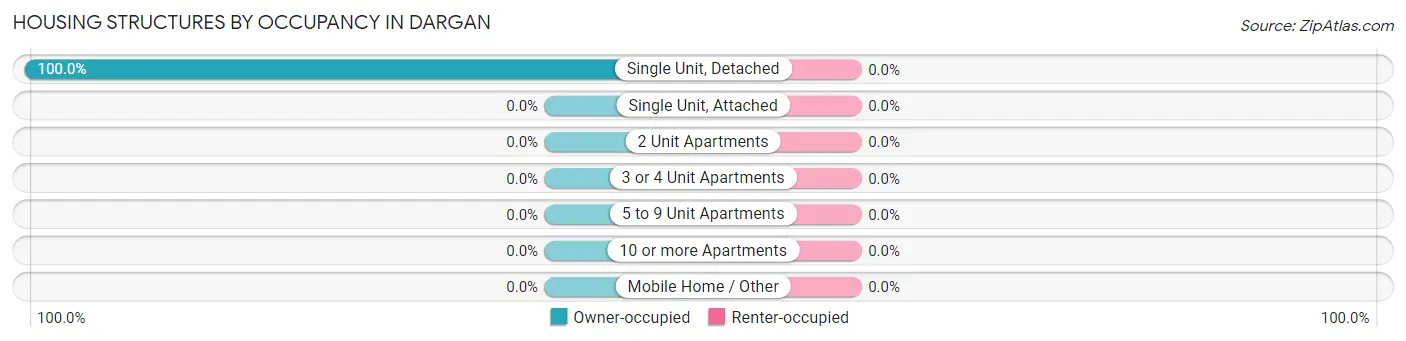
| Structure Type | Owner-occupied | Renter-occupied |
| Single Unit, Detached | 73 (100.0%) | 0 (0.0%) |
| Single Unit, Attached | 0 (0.0%) | 0 (0.0%) |
| 2 Unit Apartments | 0 (0.0%) | 0 (0.0%) |
| 3 or 4 Unit Apartments | 0 (0.0%) | 0 (0.0%) |
| 5 to 9 Unit Apartments | 0 (0.0%) | 0 (0.0%) |
| 10 or more Apartments | 0 (0.0%) | 0 (0.0%) |
| Mobile Home / Other | 0 (0.0%) | 0 (0.0%) |
| Total | 73 (100.0%) | 0 (0.0%) |
Housing Structures by Number of Rooms in Dargan
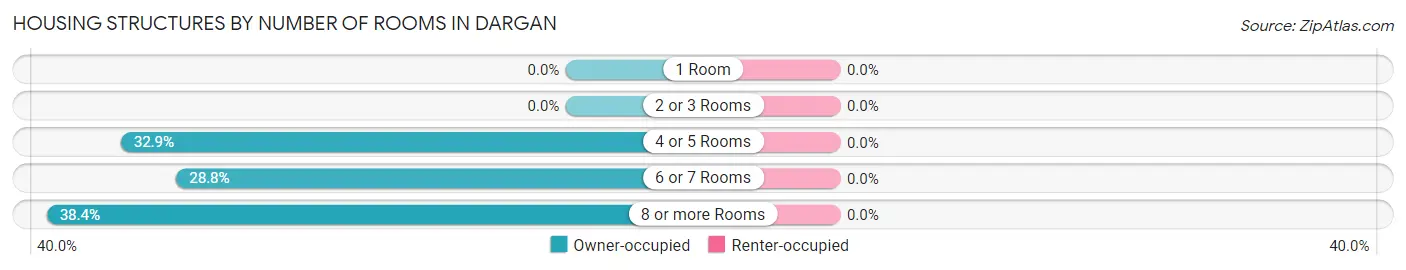
| Number of Rooms | Owner-occupied | Renter-occupied |
| 1 Room | 0 (0.0%) | 0 (0.0%) |
| 2 or 3 Rooms | 0 (0.0%) | 0 (0.0%) |
| 4 or 5 Rooms | 24 (32.9%) | 0 (0.0%) |
| 6 or 7 Rooms | 21 (28.8%) | 0 (0.0%) |
| 8 or more Rooms | 28 (38.4%) | 0 (0.0%) |
| Total | 73 (100.0%) | 0 (0.0%) |
Housing Structure by Heating Type in Dargan
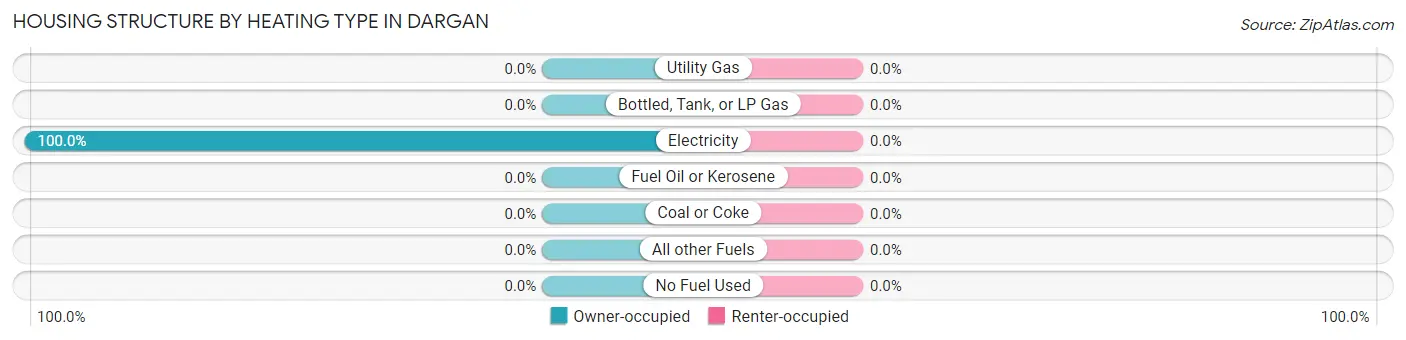
| Heating Type | Owner-occupied | Renter-occupied |
| Utility Gas | 0 (0.0%) | 0 (0.0%) |
| Bottled, Tank, or LP Gas | 0 (0.0%) | 0 (0.0%) |
| Electricity | 73 (100.0%) | 0 (0.0%) |
| Fuel Oil or Kerosene | 0 (0.0%) | 0 (0.0%) |
| Coal or Coke | 0 (0.0%) | 0 (0.0%) |
| All other Fuels | 0 (0.0%) | 0 (0.0%) |
| No Fuel Used | 0 (0.0%) | 0 (0.0%) |
| Total | 73 (100.0%) | 0 (0.0%) |
Household Vehicle Usage in Dargan
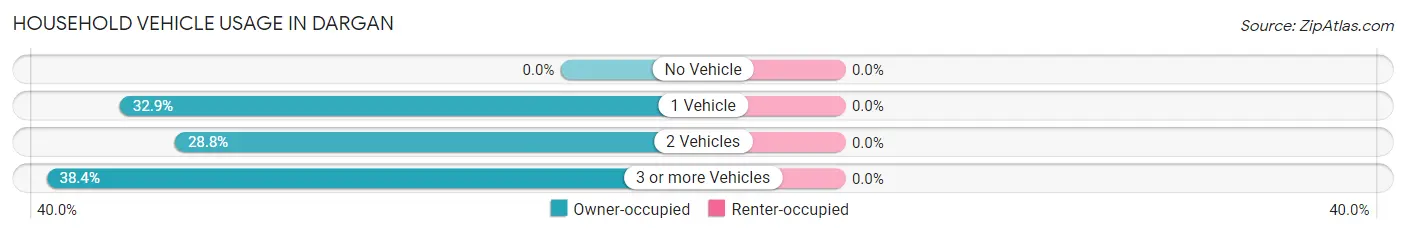
| Vehicles per Household | Owner-occupied | Renter-occupied |
| No Vehicle | 0 (0.0%) | 0 (0.0%) |
| 1 Vehicle | 24 (32.9%) | 0 (0.0%) |
| 2 Vehicles | 21 (28.8%) | 0 (0.0%) |
| 3 or more Vehicles | 28 (38.4%) | 0 (0.0%) |
| Total | 73 (100.0%) | 0 (0.0%) |
Real Estate & Mortgages in Dargan
Real Estate and Mortgage Overview in Dargan
| Characteristic | Without Mortgage | With Mortgage |
| Housing Units | 24 | 49 |
| Median Property Value | - | - |
| Median Household Income | - | - |
| Monthly Housing Costs | - | - |
| Real Estate Taxes | - | - |
Property Value by Mortgage Status in Dargan
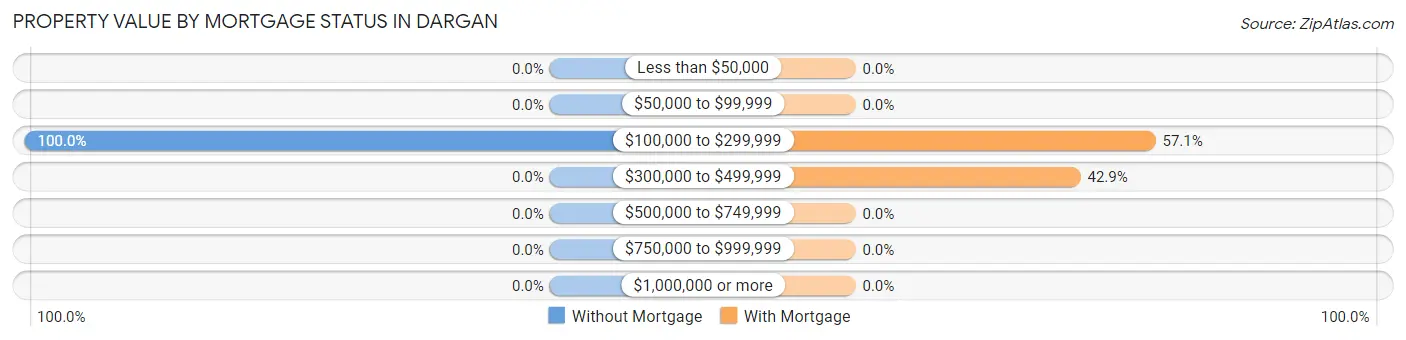
| Property Value | Without Mortgage | With Mortgage |
| Less than $50,000 | 0 (0.0%) | 0 (0.0%) |
| $50,000 to $99,999 | 0 (0.0%) | 0 (0.0%) |
| $100,000 to $299,999 | 24 (100.0%) | 28 (57.1%) |
| $300,000 to $499,999 | 0 (0.0%) | 21 (42.9%) |
| $500,000 to $749,999 | 0 (0.0%) | 0 (0.0%) |
| $750,000 to $999,999 | 0 (0.0%) | 0 (0.0%) |
| $1,000,000 or more | 0 (0.0%) | 0 (0.0%) |
| Total | 24 (100.0%) | 49 (100.0%) |
Household Income by Mortgage Status in Dargan
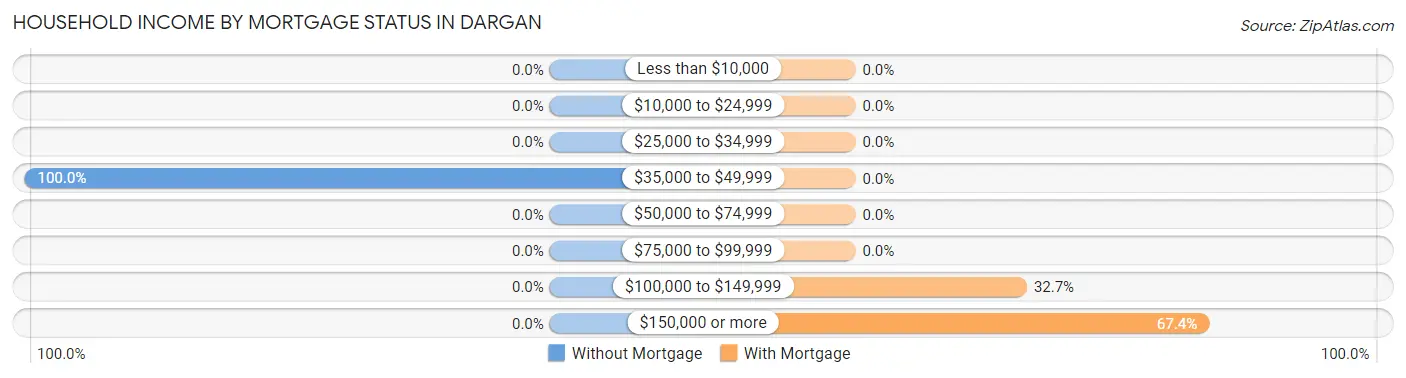
| Household Income | Without Mortgage | With Mortgage |
| Less than $10,000 | 0 (0.0%) | 0 (0.0%) |
| $10,000 to $24,999 | 0 (0.0%) | 0 (0.0%) |
| $25,000 to $34,999 | 0 (0.0%) | 0 (0.0%) |
| $35,000 to $49,999 | 24 (100.0%) | 0 (0.0%) |
| $50,000 to $74,999 | 0 (0.0%) | 0 (0.0%) |
| $75,000 to $99,999 | 0 (0.0%) | 0 (0.0%) |
| $100,000 to $149,999 | 0 (0.0%) | 16 (32.7%) |
| $150,000 or more | 0 (0.0%) | 33 (67.3%) |
| Total | 24 (100.0%) | 49 (100.0%) |
Property Value to Household Income Ratio in Dargan
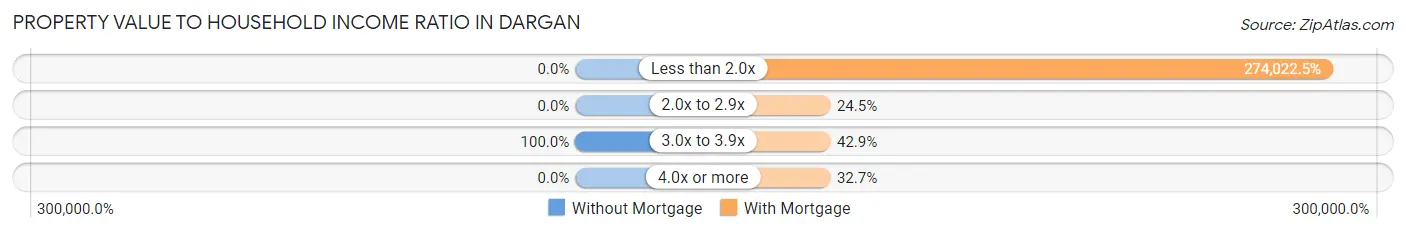
| Value-to-Income Ratio | Without Mortgage | With Mortgage |
| Less than 2.0x | 0 (0.0%) | 134,271 (274,022.4%) |
| 2.0x to 2.9x | 0 (0.0%) | 12 (24.5%) |
| 3.0x to 3.9x | 24 (100.0%) | 21 (42.9%) |
| 4.0x or more | 0 (0.0%) | 16 (32.7%) |
| Total | 24 (100.0%) | 49 (100.0%) |
Real Estate Taxes by Mortgage Status in Dargan
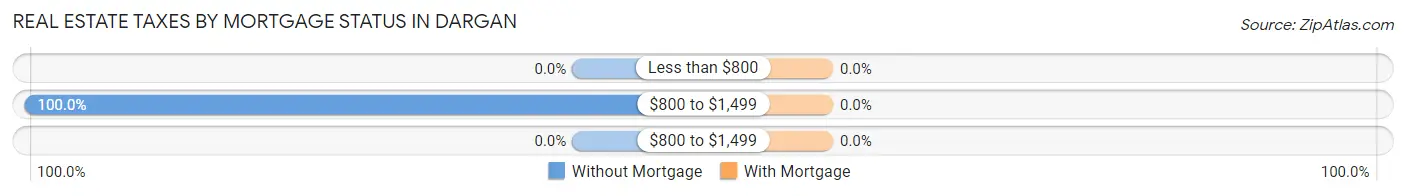
| Property Taxes | Without Mortgage | With Mortgage |
| Less than $800 | 0 (0.0%) | 0 (0.0%) |
| $800 to $1,499 | 24 (100.0%) | 0 (0.0%) |
| $800 to $1,499 | 0 (0.0%) | 0 (0.0%) |
| Total | 24 (100.0%) | 49 (100.0%) |
Health & Disability in Dargan
Health Insurance Coverage by Age in Dargan
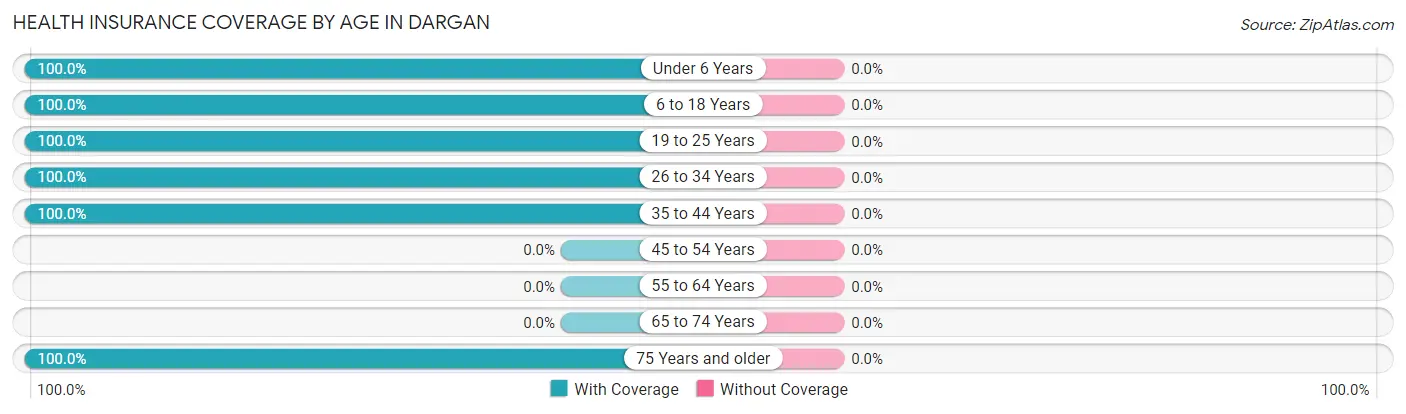
| Age Bracket | With Coverage | Without Coverage |
| Under 6 Years | 31 (100.0%) | 0 (0.0%) |
| 6 to 18 Years | 25 (100.0%) | 0 (0.0%) |
| 19 to 25 Years | 16 (100.0%) | 0 (0.0%) |
| 26 to 34 Years | 37 (100.0%) | 0 (0.0%) |
| 35 to 44 Years | 56 (100.0%) | 0 (0.0%) |
| 45 to 54 Years | 0 (0.0%) | 0 (0.0%) |
| 55 to 64 Years | 0 (0.0%) | 0 (0.0%) |
| 65 to 74 Years | 0 (0.0%) | 0 (0.0%) |
| 75 Years and older | 24 (100.0%) | 0 (0.0%) |
| Total | 189 (100.0%) | 0 (0.0%) |
Health Insurance Coverage by Citizenship Status in Dargan
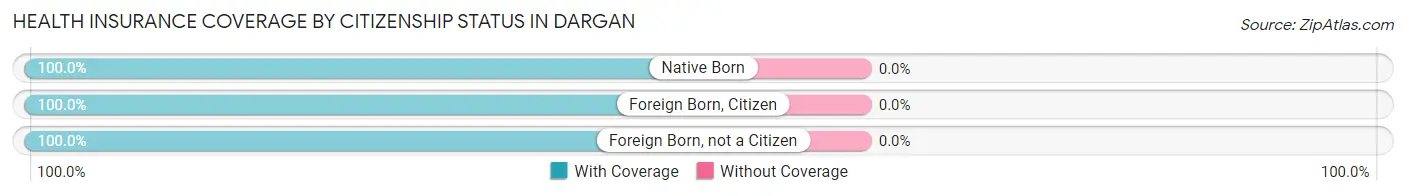
| Citizenship Status | With Coverage | Without Coverage |
| Native Born | 31 (100.0%) | 0 (0.0%) |
| Foreign Born, Citizen | 25 (100.0%) | 0 (0.0%) |
| Foreign Born, not a Citizen | 16 (100.0%) | 0 (0.0%) |
Health Insurance Coverage by Household Income in Dargan
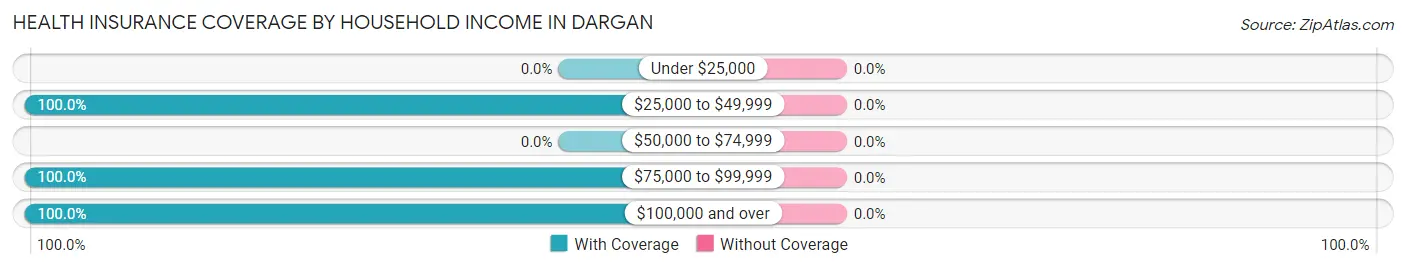
| Household Income | With Coverage | Without Coverage |
| Under $25,000 | 0 (0.0%) | 0 (0.0%) |
| $25,000 to $49,999 | 24 (100.0%) | 0 (0.0%) |
| $50,000 to $74,999 | 0 (0.0%) | 0 (0.0%) |
| $75,000 to $99,999 | 48 (100.0%) | 0 (0.0%) |
| $100,000 and over | 117 (100.0%) | 0 (0.0%) |
Public vs Private Health Insurance Coverage by Age in Dargan
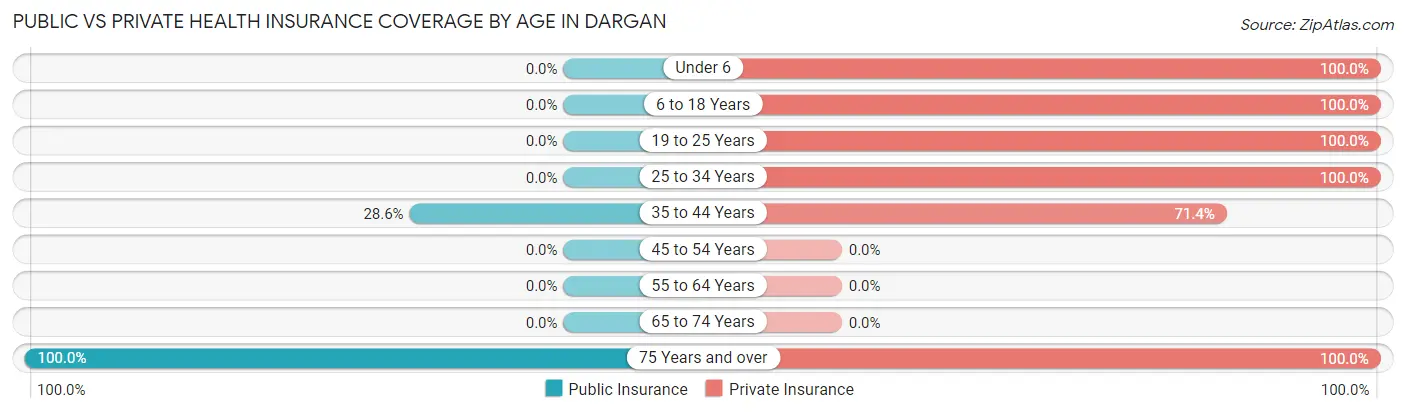
| Age Bracket | Public Insurance | Private Insurance |
| Under 6 | 0 (0.0%) | 31 (100.0%) |
| 6 to 18 Years | 0 (0.0%) | 25 (100.0%) |
| 19 to 25 Years | 0 (0.0%) | 16 (100.0%) |
| 25 to 34 Years | 0 (0.0%) | 37 (100.0%) |
| 35 to 44 Years | 16 (28.6%) | 40 (71.4%) |
| 45 to 54 Years | 0 (0.0%) | 0 (0.0%) |
| 55 to 64 Years | 0 (0.0%) | 0 (0.0%) |
| 65 to 74 Years | 0 (0.0%) | 0 (0.0%) |
| 75 Years and over | 24 (100.0%) | 24 (100.0%) |
| Total | 40 (21.2%) | 173 (91.5%) |
Disability Status by Sex by Age in Dargan
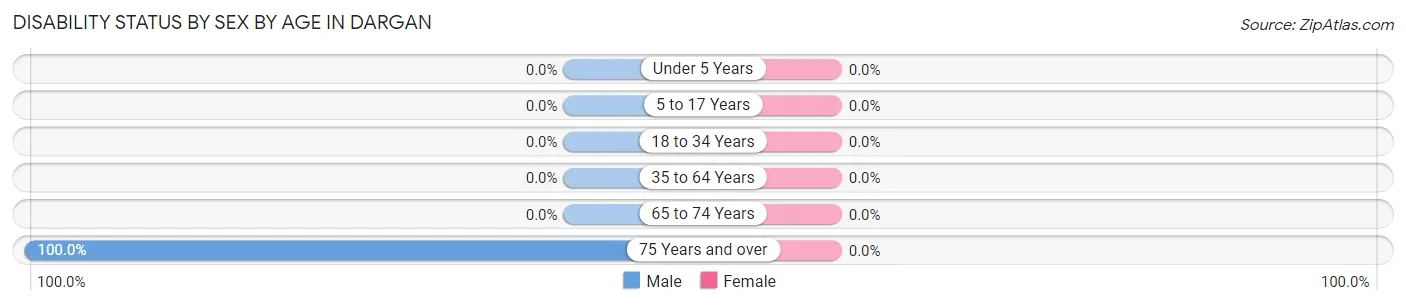
| Age Bracket | Male | Female |
| Under 5 Years | 0 (0.0%) | 0 (0.0%) |
| 5 to 17 Years | 0 (0.0%) | 0 (0.0%) |
| 18 to 34 Years | 0 (0.0%) | 0 (0.0%) |
| 35 to 64 Years | 0 (0.0%) | 0 (0.0%) |
| 65 to 74 Years | 0 (0.0%) | 0 (0.0%) |
| 75 Years and over | 24 (100.0%) | 0 (0.0%) |
Disability Class by Sex by Age in Dargan
Disability Class: Hearing Difficulty
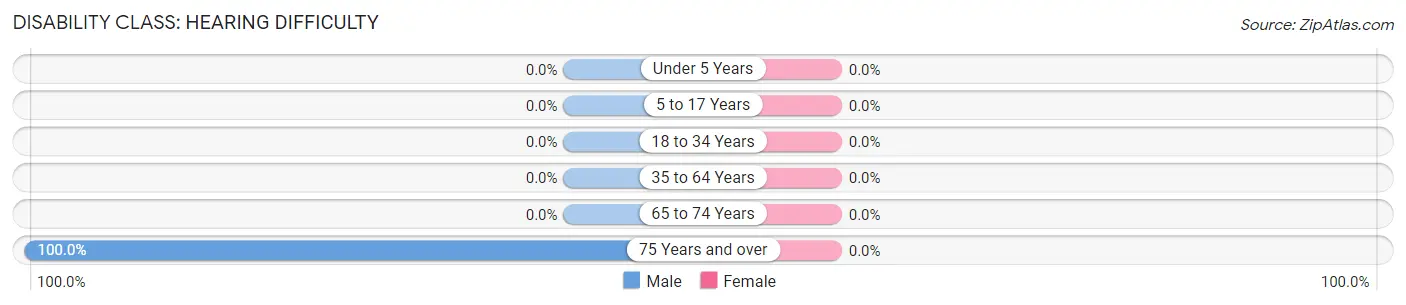
| Age Bracket | Male | Female |
| Under 5 Years | 0 (0.0%) | 0 (0.0%) |
| 5 to 17 Years | 0 (0.0%) | 0 (0.0%) |
| 18 to 34 Years | 0 (0.0%) | 0 (0.0%) |
| 35 to 64 Years | 0 (0.0%) | 0 (0.0%) |
| 65 to 74 Years | 0 (0.0%) | 0 (0.0%) |
| 75 Years and over | 24 (100.0%) | 0 (0.0%) |
Disability Class: Vision Difficulty
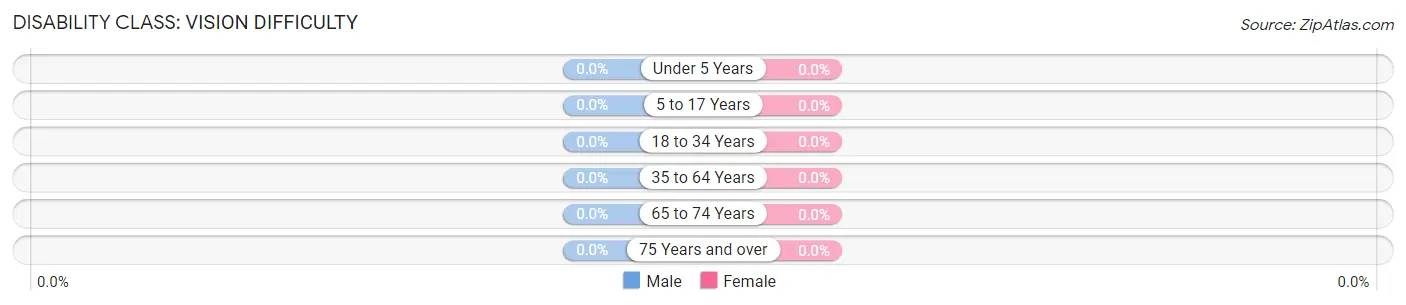
| Age Bracket | Male | Female |
| Under 5 Years | 0 (0.0%) | 0 (0.0%) |
| 5 to 17 Years | 0 (0.0%) | 0 (0.0%) |
| 18 to 34 Years | 0 (0.0%) | 0 (0.0%) |
| 35 to 64 Years | 0 (0.0%) | 0 (0.0%) |
| 65 to 74 Years | 0 (0.0%) | 0 (0.0%) |
| 75 Years and over | 0 (0.0%) | 0 (0.0%) |
Disability Class: Cognitive Difficulty

| Age Bracket | Male | Female |
| 5 to 17 Years | 0 (0.0%) | 0 (0.0%) |
| 18 to 34 Years | 0 (0.0%) | 0 (0.0%) |
| 35 to 64 Years | 0 (0.0%) | 0 (0.0%) |
| 65 to 74 Years | 0 (0.0%) | 0 (0.0%) |
| 75 Years and over | 0 (0.0%) | 0 (0.0%) |
Disability Class: Ambulatory Difficulty
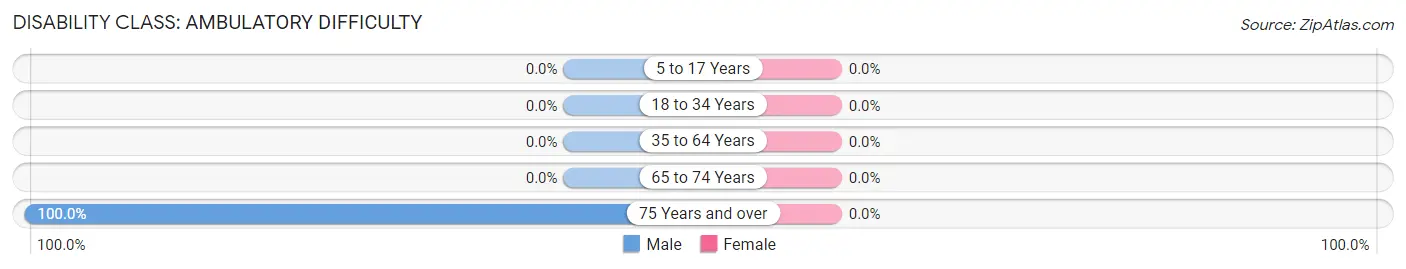
| Age Bracket | Male | Female |
| 5 to 17 Years | 0 (0.0%) | 0 (0.0%) |
| 18 to 34 Years | 0 (0.0%) | 0 (0.0%) |
| 35 to 64 Years | 0 (0.0%) | 0 (0.0%) |
| 65 to 74 Years | 0 (0.0%) | 0 (0.0%) |
| 75 Years and over | 24 (100.0%) | 0 (0.0%) |
Disability Class: Self-Care Difficulty
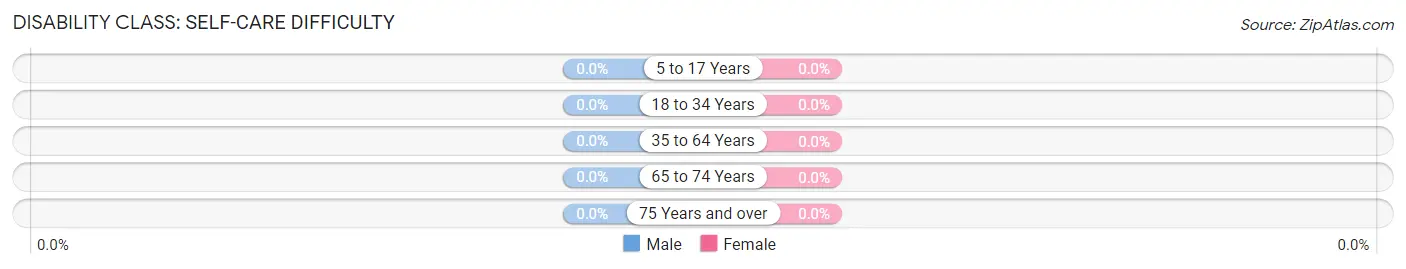
| Age Bracket | Male | Female |
| 5 to 17 Years | 0 (0.0%) | 0 (0.0%) |
| 18 to 34 Years | 0 (0.0%) | 0 (0.0%) |
| 35 to 64 Years | 0 (0.0%) | 0 (0.0%) |
| 65 to 74 Years | 0 (0.0%) | 0 (0.0%) |
| 75 Years and over | 0 (0.0%) | 0 (0.0%) |
Technology Access in Dargan
Computing Device Access in Dargan
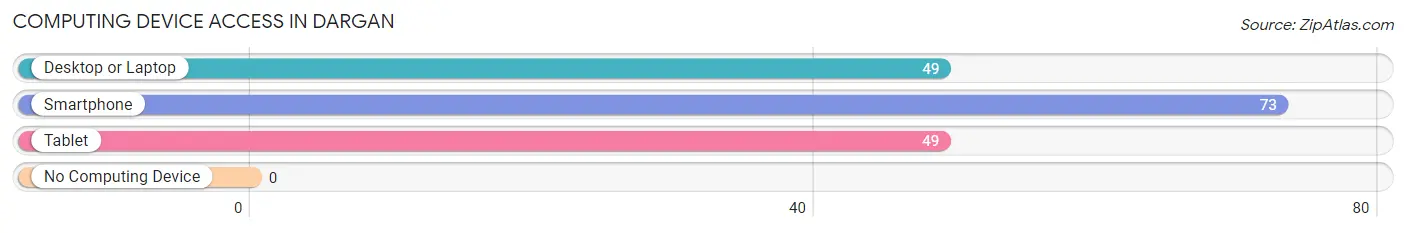
| Device Type | # Households | % Households |
| Desktop or Laptop | 49 | 67.1% |
| Smartphone | 73 | 100.0% |
| Tablet | 49 | 67.1% |
| No Computing Device | 0 | 0.0% |
| Total | 73 | 100.0% |
Internet Access in Dargan
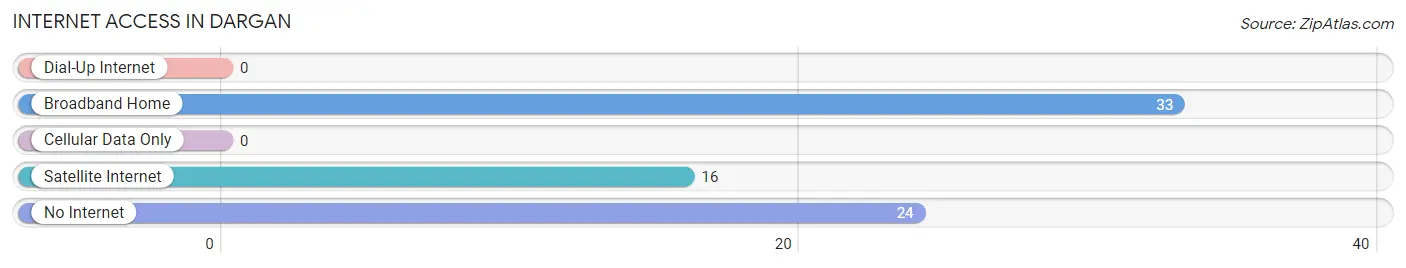
| Internet Type | # Households | % Households |
| Dial-Up Internet | 0 | 0.0% |
| Broadband Home | 33 | 45.2% |
| Cellular Data Only | 0 | 0.0% |
| Satellite Internet | 16 | 21.9% |
| No Internet | 24 | 32.9% |
| Total | 73 | 100.0% |
Dargan Summary
History
Dargan is a small town located in the state of Maryland, United States. It was founded in 1790 by a group of settlers from Pennsylvania. The town was named after the local Native American tribe, the Dargan Indians. The town was originally a farming community, but over the years it has grown into a small but vibrant town.
The town has a rich history of industry and commerce. In the late 19th century, the town was home to several factories, including a paper mill, a sawmill, and a gristmill. These factories provided employment for many of the town’s residents. In the early 20th century, the town was home to a number of small businesses, including a general store, a blacksmith shop, and a post office.
The town has also been home to a number of notable people. In the late 19th century, the town was home to the famous abolitionist and civil rights leader, Frederick Douglass. In the early 20th century, the town was home to the renowned author, Zora Neale Hurston.
Geography
Dargan is located in the state of Maryland, in the United States. It is situated in the western part of the state, in the Appalachian Mountains. The town is located in a valley, surrounded by rolling hills and forests. The town is located near the Potomac River, which provides a source of water for the town.
The town has a total area of 1.2 square miles, all of which is land. The town is located at an elevation of 1,000 feet above sea level. The climate in Dargan is humid subtropical, with hot summers and mild winters.
Economy
The economy of Dargan is largely based on agriculture and tourism. The town is home to several farms, which produce a variety of crops, including corn, soybeans, and wheat. The town is also home to several wineries, which produce a variety of wines.
The town is also home to several small businesses, including restaurants, shops, and galleries. The town is also home to a number of bed and breakfasts, which provide lodging for tourists.
Demographics
As of the 2010 census, the population of Dargan was 1,845. The racial makeup of the town was 94.3% White, 2.2% African American, 0.3% Native American, 0.7% Asian, 0.1% Pacific Islander, and 2.4% from other races. The median household income in the town was $45,000. The median age of the town’s residents was 42.5 years.
Common Questions
What is Per Capita Income in Dargan?
Per Capita income in Dargan is $34,740.
What is Inequality or Gini Index in Dargan?
Inequality or Gini Index in Dargan is 0.24.
What is the Total Population of Dargan?
Total Population of Dargan is 189.
What is the Total Male Population of Dargan?
Total Male Population of Dargan is 104.
What is the Total Female Population of Dargan?
Total Female Population of Dargan is 85.
What is the Ratio of Males per 100 Females in Dargan?
There are 122.35 Males per 100 Females in Dargan.
What is the Ratio of Females per 100 Males in Dargan?
There are 81.73 Females per 100 Males in Dargan.
What is the Median Population Age in Dargan?
Median Population Age in Dargan is 32.3 Years.
What is the Average Family Size in Dargan
Average Family Size in Dargan is 2.8 People.
What is the Average Household Size in Dargan
Average Household Size in Dargan is 2.6 People.
How Large is the Labor Force in Dargan?
There are 109 People in the Labor Forcein in Dargan.
What is the Percentage of People in the Labor Force in Dargan?
82.0% of People are in the Labor Force in Dargan.
What is the Unemployment Rate in Dargan?
Unemployment Rate in Dargan is 29.4%.