Pikesville, MD Map & Demographics
Pikesville Map
Pikesville Overview
$58,795
PER CAPITA INCOME
$126,796
AVG FAMILY INCOME
$94,408
AVG HOUSEHOLD INCOME
26.9%
WAGE / INCOME GAP [ % ]
73.1¢/ $1
WAGE / INCOME GAP [ $ ]
0.52
INEQUALITY / GINI INDEX
34,101
TOTAL POPULATION
15,833
MALE POPULATION
18,268
FEMALE POPULATION
86.67
MALES / 100 FEMALES
115.38
FEMALES / 100 MALES
42.1
MEDIAN AGE
3.2
AVG FAMILY SIZE
2.5
AVG HOUSEHOLD SIZE
16,869
LABOR FORCE [ PEOPLE ]
63.2%
PERCENT IN LABOR FORCE
4.7%
UNEMPLOYMENT RATE
Pikesville Zip Codes
Income in Pikesville
Income Overview in Pikesville
Per Capita Income in Pikesville is $58,795, while median incomes of families and households are $126,796 and $94,408 respectively.
| Characteristic | Number | Measure |
| Per Capita Income | 34,101 | $58,795 |
| Median Family Income | 8,288 | $126,796 |
| Mean Family Income | 8,288 | $188,822 |
| Median Household Income | 13,681 | $94,408 |
| Mean Household Income | 13,681 | $143,601 |
| Income Deficit | 8,288 | $0 |
| Wage / Income Gap (%) | 34,101 | 26.91% |
| Wage / Income Gap ($) | 34,101 | 73.09¢ per $1 |
| Gini / Inequality Index | 34,101 | 0.52 |
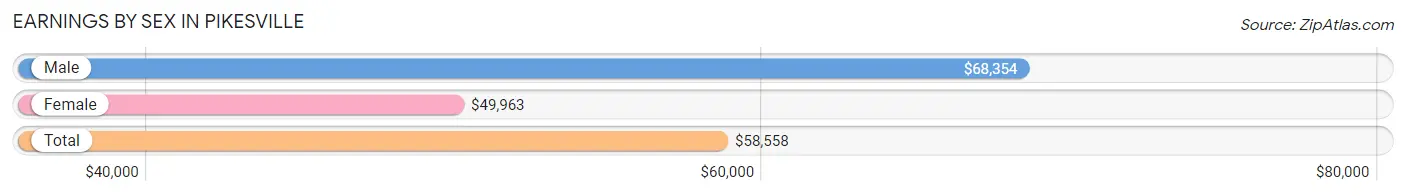
Earnings by Sex in Pikesville
Average Earnings in Pikesville are $58,558, $68,354 for men and $49,963 for women, a difference of 26.9%.
| Sex | Number | Average Earnings |
| Male | 8,436 (49.0%) | $68,354 |
| Female | 8,790 (51.0%) | $49,963 |
| Total | 17,226 (100.0%) | $58,558 |
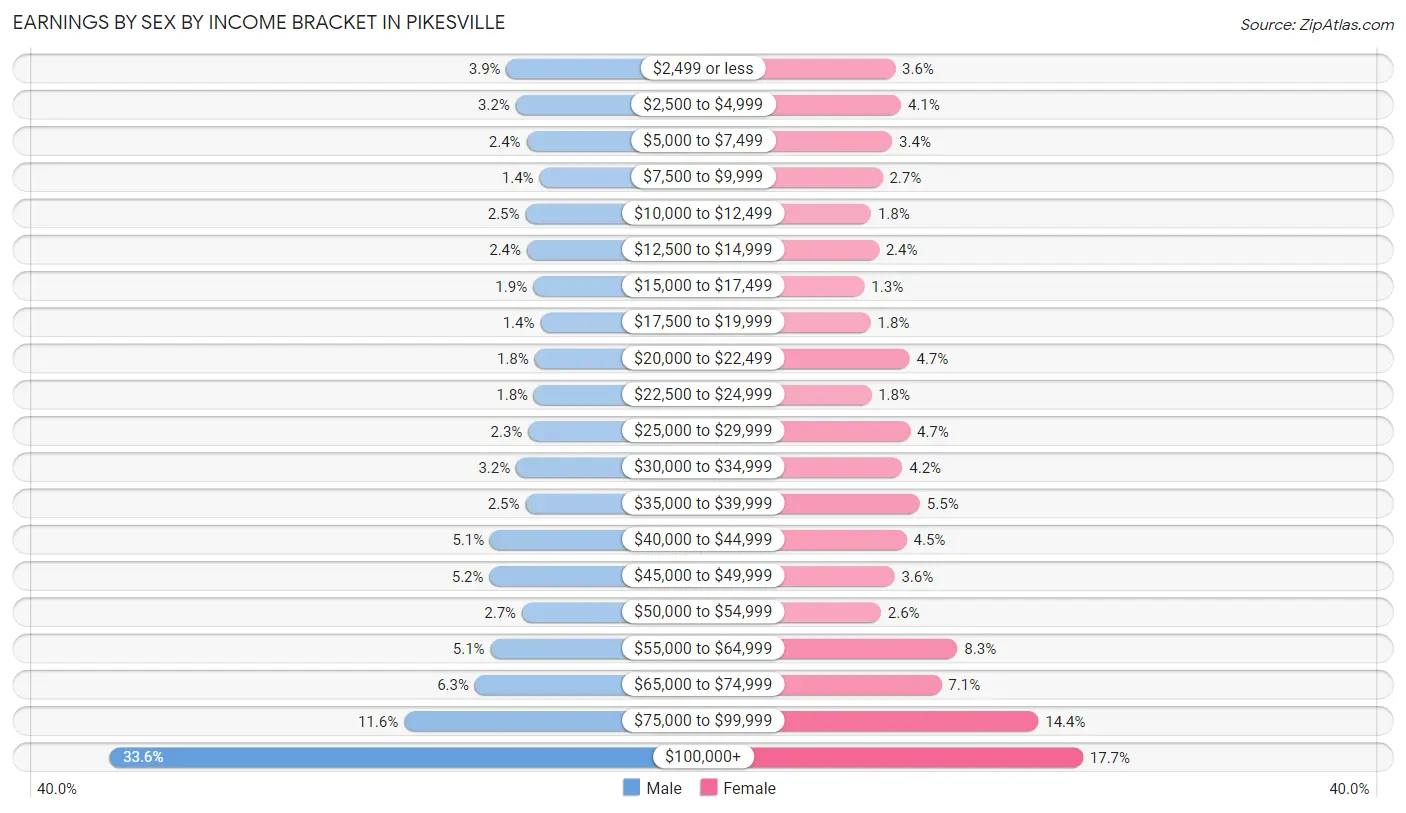
Earnings by Sex by Income Bracket in Pikesville
The most common earnings brackets in Pikesville are $100,000+ for men (2,834 | 33.6%) and $100,000+ for women (1,555 | 17.7%).
| Income | Male | Female |
| $2,499 or less | 328 (3.9%) | 318 (3.6%) |
| $2,500 to $4,999 | 270 (3.2%) | 357 (4.1%) |
| $5,000 to $7,499 | 202 (2.4%) | 299 (3.4%) |
| $7,500 to $9,999 | 120 (1.4%) | 235 (2.7%) |
| $10,000 to $12,499 | 208 (2.5%) | 159 (1.8%) |
| $12,500 to $14,999 | 199 (2.4%) | 210 (2.4%) |
| $15,000 to $17,499 | 160 (1.9%) | 116 (1.3%) |
| $17,500 to $19,999 | 114 (1.3%) | 157 (1.8%) |
| $20,000 to $22,499 | 150 (1.8%) | 413 (4.7%) |
| $22,500 to $24,999 | 154 (1.8%) | 161 (1.8%) |
| $25,000 to $29,999 | 191 (2.3%) | 417 (4.7%) |
| $30,000 to $34,999 | 267 (3.2%) | 366 (4.2%) |
| $35,000 to $39,999 | 208 (2.5%) | 482 (5.5%) |
| $40,000 to $44,999 | 432 (5.1%) | 394 (4.5%) |
| $45,000 to $49,999 | 436 (5.2%) | 314 (3.6%) |
| $50,000 to $54,999 | 230 (2.7%) | 224 (2.5%) |
| $55,000 to $64,999 | 429 (5.1%) | 729 (8.3%) |
| $65,000 to $74,999 | 528 (6.3%) | 623 (7.1%) |
| $75,000 to $99,999 | 976 (11.6%) | 1,261 (14.3%) |
| $100,000+ | 2,834 (33.6%) | 1,555 (17.7%) |
| Total | 8,436 (100.0%) | 8,790 (100.0%) |
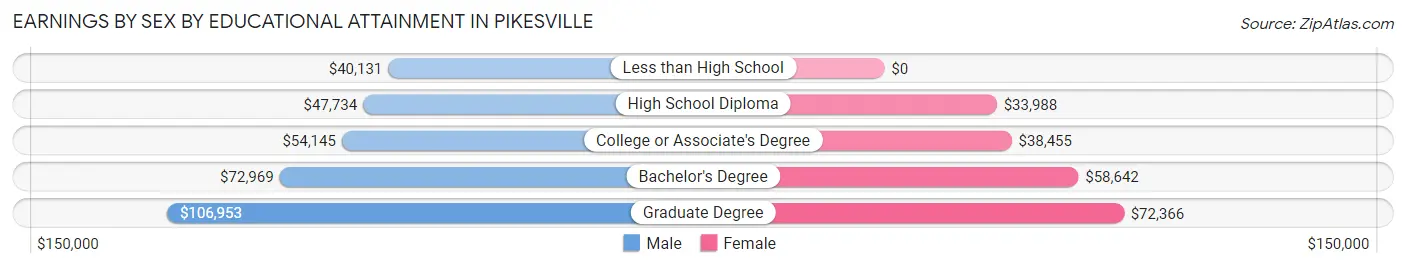
Earnings by Sex by Educational Attainment in Pikesville
Average earnings in Pikesville are $72,583 for men and $57,035 for women, a difference of 21.4%. Men with an educational attainment of graduate degree enjoy the highest average annual earnings of $106,953, while those with less than high school education earn the least with $40,131. Women with an educational attainment of graduate degree earn the most with the average annual earnings of $72,366, while those with high school diploma education have the smallest earnings of $33,988.
| Educational Attainment | Male Income | Female Income |
| Less than High School | $40,131 | $0 |
| High School Diploma | $47,734 | $33,988 |
| College or Associate's Degree | $54,145 | $38,455 |
| Bachelor's Degree | $72,969 | $58,642 |
| Graduate Degree | $106,953 | $72,366 |
| Total | $72,583 | $57,035 |
Family Income in Pikesville
Family Income Brackets in Pikesville
According to the Pikesville family income data, there are 2,354 families falling into the $200,000+ income range, which is the most common income bracket and makes up 28.4% of all families. Conversely, the $10,000 to $14,999 income bracket is the least frequent group with only 66 families (0.8%) belonging to this category.
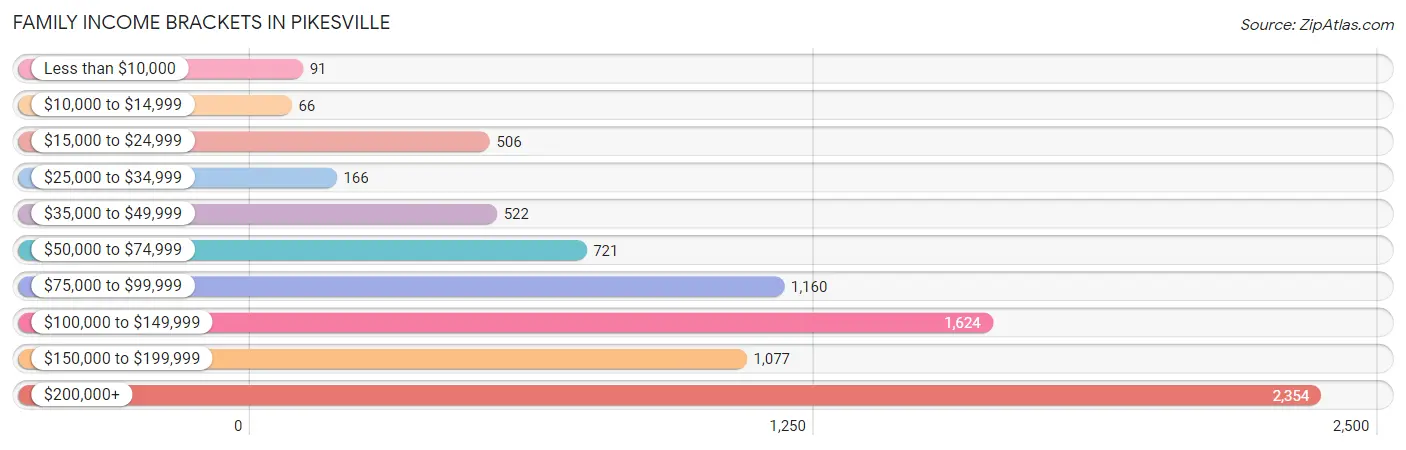
| Income Bracket | # Families | % Families |
| Less than $10,000 | 91 | 1.1% |
| $10,000 to $14,999 | 66 | 0.8% |
| $15,000 to $24,999 | 506 | 6.1% |
| $25,000 to $34,999 | 166 | 2.0% |
| $35,000 to $49,999 | 522 | 6.3% |
| $50,000 to $74,999 | 721 | 8.7% |
| $75,000 to $99,999 | 1,160 | 14.0% |
| $100,000 to $149,999 | 1,624 | 19.6% |
| $150,000 to $199,999 | 1,077 | 13.0% |
| $200,000+ | 2,354 | 28.4% |
Family Income by Famaliy Size in Pikesville
7+ person families (189 | 2.3%) account for the highest median family income in Pikesville with $250,001 per family, while 2-person families (4,183 | 50.5%) have the highest median income of $51,625 per family member.
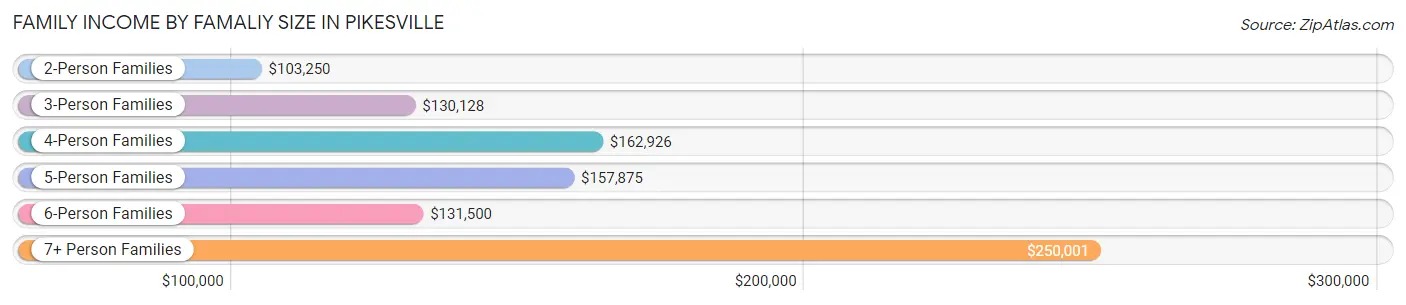
| Income Bracket | # Families | Median Income |
| 2-Person Families | 4,183 (50.5%) | $103,250 |
| 3-Person Families | 1,598 (19.3%) | $130,128 |
| 4-Person Families | 1,220 (14.7%) | $162,926 |
| 5-Person Families | 624 (7.5%) | $157,875 |
| 6-Person Families | 474 (5.7%) | $131,500 |
| 7+ Person Families | 189 (2.3%) | $250,001 |
| Total | 8,288 (100.0%) | $126,796 |
Family Income by Number of Earners in Pikesville
The median family income in Pikesville is $126,796, with families comprising 3+ earners (557) having the highest median family income of $212,361, while families with no earners (911) have the lowest median family income of $70,304, accounting for 6.7% and 11.0% of families, respectively.
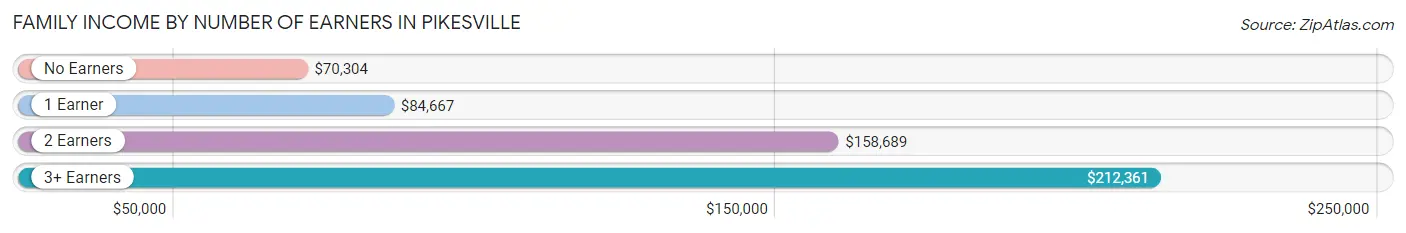
| Number of Earners | # Families | Median Income |
| No Earners | 911 (11.0%) | $70,304 |
| 1 Earner | 2,428 (29.3%) | $84,667 |
| 2 Earners | 4,392 (53.0%) | $158,689 |
| 3+ Earners | 557 (6.7%) | $212,361 |
| Total | 8,288 (100.0%) | $126,796 |
Household Income in Pikesville
Household Income Brackets in Pikesville
With 2,572 households falling in the category, the $200,000+ income range is the most frequent in Pikesville, accounting for 18.8% of all households. In contrast, only 493 households (3.6%) fall into the $10,000 to $14,999 income bracket, making it the least populous group.
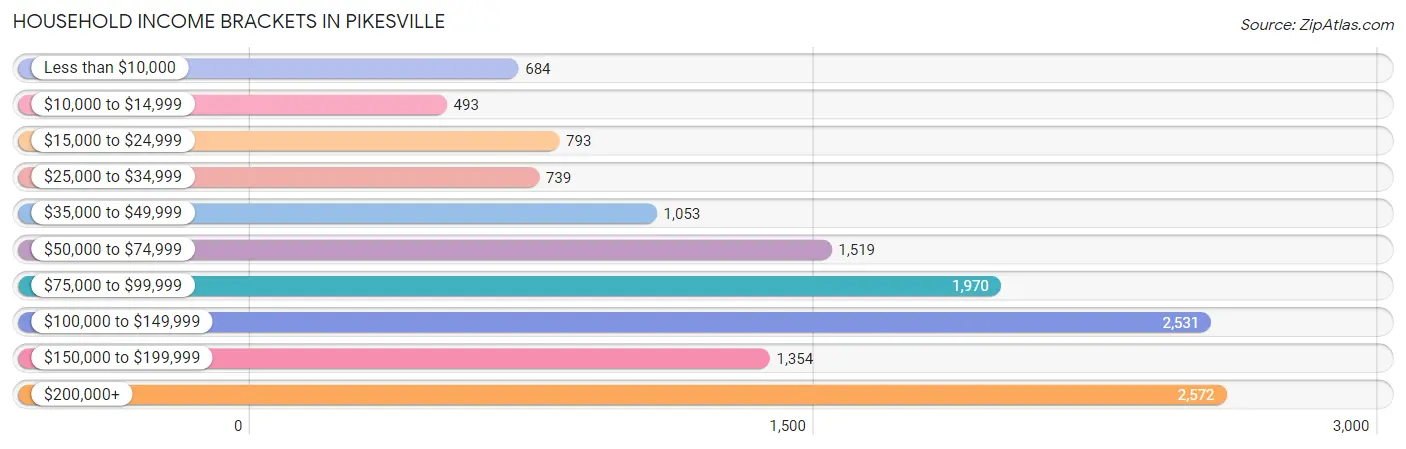
| Income Bracket | # Households | % Households |
| Less than $10,000 | 684 | 5.0% |
| $10,000 to $14,999 | 493 | 3.6% |
| $15,000 to $24,999 | 793 | 5.8% |
| $25,000 to $34,999 | 739 | 5.4% |
| $35,000 to $49,999 | 1,053 | 7.7% |
| $50,000 to $74,999 | 1,519 | 11.1% |
| $75,000 to $99,999 | 1,970 | 14.4% |
| $100,000 to $149,999 | 2,531 | 18.5% |
| $150,000 to $199,999 | 1,354 | 9.9% |
| $200,000+ | 2,572 | 18.8% |
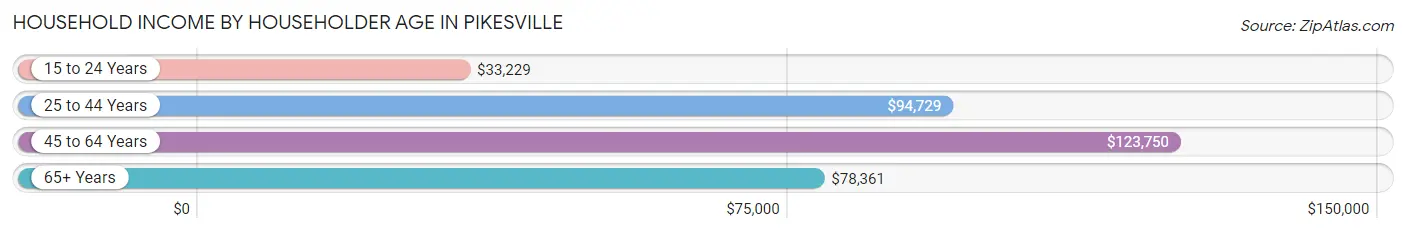
Household Income by Householder Age in Pikesville
The median household income in Pikesville is $94,408, with the highest median household income of $123,750 found in the 45 to 64 years age bracket for the primary householder. A total of 4,860 households (35.5%) fall into this category. Meanwhile, the 15 to 24 years age bracket for the primary householder has the lowest median household income of $33,229, with 151 households (1.1%) in this group.
| Income Bracket | # Households | Median Income |
| 15 to 24 Years | 151 (1.1%) | $33,229 |
| 25 to 44 Years | 3,441 (25.2%) | $94,729 |
| 45 to 64 Years | 4,860 (35.5%) | $123,750 |
| 65+ Years | 5,229 (38.2%) | $78,361 |
| Total | 13,681 (100.0%) | $94,408 |
Poverty in Pikesville
Income Below Poverty by Sex and Age in Pikesville
With 10.8% poverty level for males and 8.2% for females among the residents of Pikesville, 65 to 74 year old males and 18 to 24 year old females are the most vulnerable to poverty, with 293 males (17.3%) and 160 females (22.6%) in their respective age groups living below the poverty level.
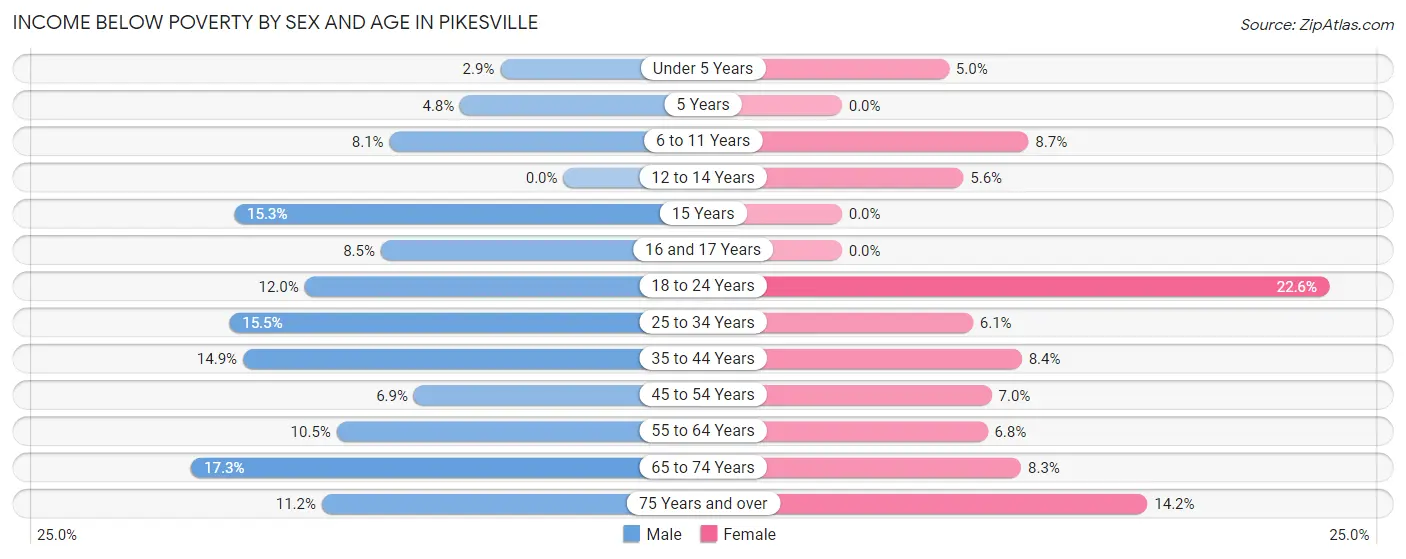
| Age Bracket | Male | Female |
| Under 5 Years | 25 (2.9%) | 50 (5.0%) |
| 5 Years | 14 (4.8%) | 0 (0.0%) |
| 6 to 11 Years | 113 (8.1%) | 149 (8.7%) |
| 12 to 14 Years | 0 (0.0%) | 42 (5.6%) |
| 15 Years | 11 (15.3%) | 0 (0.0%) |
| 16 and 17 Years | 61 (8.5%) | 0 (0.0%) |
| 18 to 24 Years | 114 (12.0%) | 160 (22.6%) |
| 25 to 34 Years | 313 (15.5%) | 152 (6.1%) |
| 35 to 44 Years | 263 (14.9%) | 142 (8.4%) |
| 45 to 54 Years | 130 (6.9%) | 149 (7.0%) |
| 55 to 64 Years | 192 (10.5%) | 157 (6.8%) |
| 65 to 74 Years | 293 (17.3%) | 185 (8.3%) |
| 75 Years and over | 168 (11.2%) | 301 (14.2%) |
| Total | 1,697 (10.8%) | 1,487 (8.2%) |
Income Above Poverty by Sex and Age in Pikesville
According to the poverty statistics in Pikesville, males aged 12 to 14 years and females aged 5 years are the age groups that are most secure financially, with 100.0% of males and 100.0% of females in these age groups living above the poverty line.
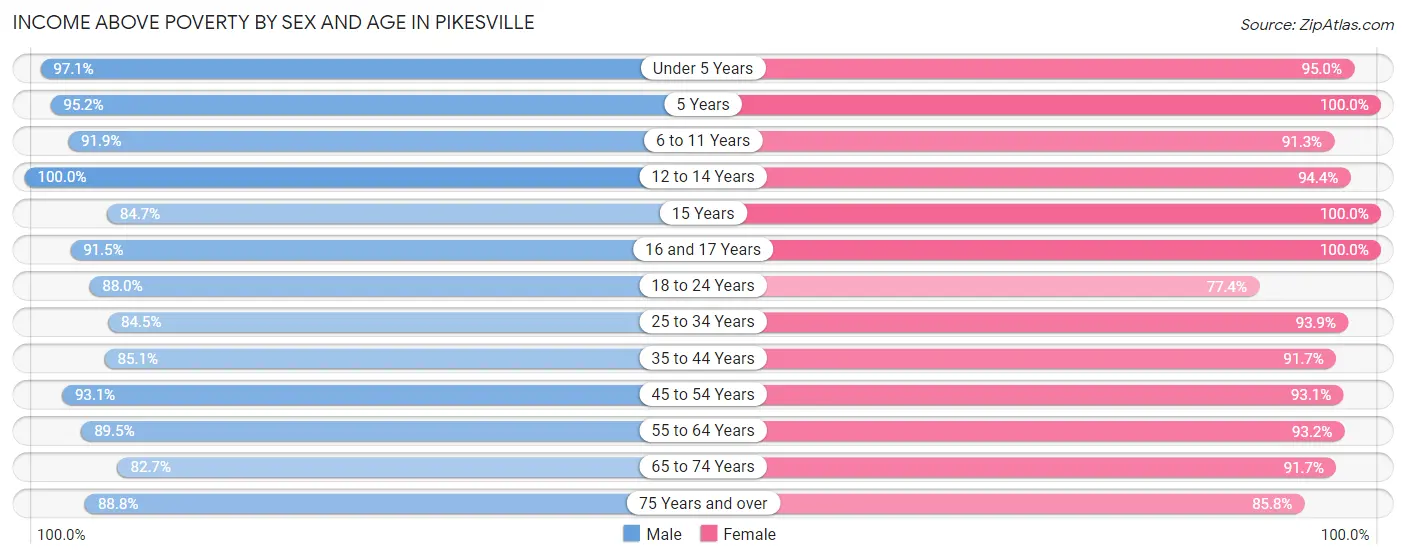
| Age Bracket | Male | Female |
| Under 5 Years | 829 (97.1%) | 956 (95.0%) |
| 5 Years | 278 (95.2%) | 130 (100.0%) |
| 6 to 11 Years | 1,288 (91.9%) | 1,571 (91.3%) |
| 12 to 14 Years | 726 (100.0%) | 703 (94.4%) |
| 15 Years | 61 (84.7%) | 377 (100.0%) |
| 16 and 17 Years | 659 (91.5%) | 343 (100.0%) |
| 18 to 24 Years | 835 (88.0%) | 548 (77.4%) |
| 25 to 34 Years | 1,706 (84.5%) | 2,349 (93.9%) |
| 35 to 44 Years | 1,506 (85.1%) | 1,558 (91.6%) |
| 45 to 54 Years | 1,742 (93.1%) | 1,995 (93.0%) |
| 55 to 64 Years | 1,633 (89.5%) | 2,166 (93.2%) |
| 65 to 74 Years | 1,404 (82.7%) | 2,039 (91.7%) |
| 75 Years and over | 1,331 (88.8%) | 1,822 (85.8%) |
| Total | 13,998 (89.2%) | 16,557 (91.8%) |
Income Below Poverty Among Married-Couple Families in Pikesville
The poverty statistics for married-couple families in Pikesville show that 4.9% or 306 of the total 6,275 families live below the poverty line. Families with 5 or more children have the highest poverty rate of 9.0%, comprising of 11 families. On the other hand, families with 3 or 4 children have the lowest poverty rate of 2.4%, which includes 20 families.
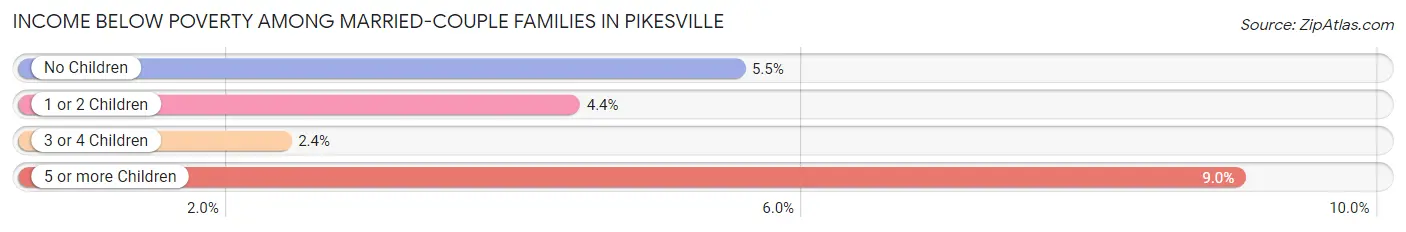
| Children | Above Poverty | Below Poverty |
| No Children | 3,483 (94.5%) | 204 (5.5%) |
| 1 or 2 Children | 1,551 (95.6%) | 71 (4.4%) |
| 3 or 4 Children | 824 (97.6%) | 20 (2.4%) |
| 5 or more Children | 111 (91.0%) | 11 (9.0%) |
| Total | 5,969 (95.1%) | 306 (4.9%) |
Income Below Poverty Among Single-Parent Households in Pikesville
According to the poverty data in Pikesville, 10.4% or 37 single-father households and 11.4% or 188 single-mother households are living below the poverty line. Among single-father households, those with no children have the highest poverty rate, with 29 households (12.7%) experiencing poverty. Likewise, among single-mother households, those with 1 or 2 children have the highest poverty rate, with 134 households (16.3%) falling below the poverty line.
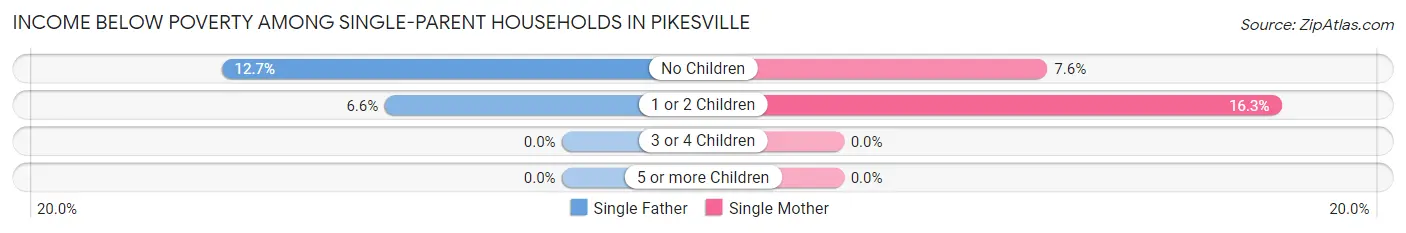
| Children | Single Father | Single Mother |
| No Children | 29 (12.7%) | 54 (7.6%) |
| 1 or 2 Children | 8 (6.6%) | 134 (16.3%) |
| 3 or 4 Children | 0 (0.0%) | 0 (0.0%) |
| 5 or more Children | 0 (0.0%) | 0 (0.0%) |
| Total | 37 (10.4%) | 188 (11.4%) |
Income Below Poverty Among Married-Couple vs Single-Parent Households in Pikesville
The poverty data for Pikesville shows that 306 of the married-couple family households (4.9%) and 225 of the single-parent households (11.2%) are living below the poverty level. Within the married-couple family households, those with 5 or more children have the highest poverty rate, with 11 households (9.0%) falling below the poverty line. Among the single-parent households, those with 1 or 2 children have the highest poverty rate, with 142 household (15.1%) living below poverty.
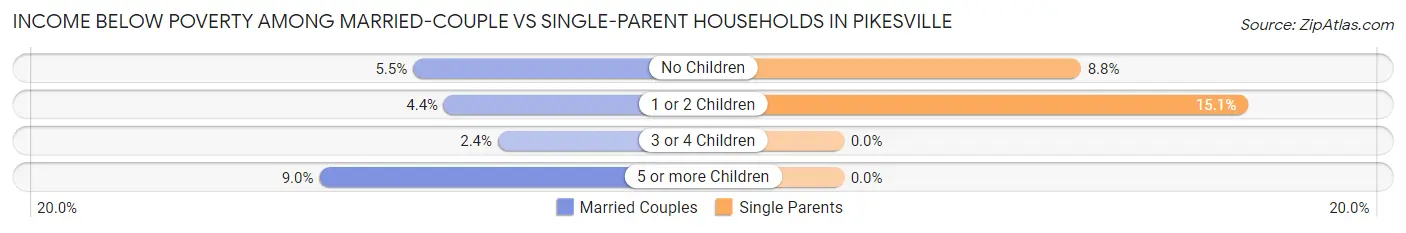
| Children | Married-Couple Families | Single-Parent Households |
| No Children | 204 (5.5%) | 83 (8.8%) |
| 1 or 2 Children | 71 (4.4%) | 142 (15.1%) |
| 3 or 4 Children | 20 (2.4%) | 0 (0.0%) |
| 5 or more Children | 11 (9.0%) | 0 (0.0%) |
| Total | 306 (4.9%) | 225 (11.2%) |
Race in Pikesville
The most populous races in Pikesville are White / Caucasian (25,228 | 74.0%), Black / African American (5,745 | 16.9%), and Two or more Races (1,282 | 3.8%).
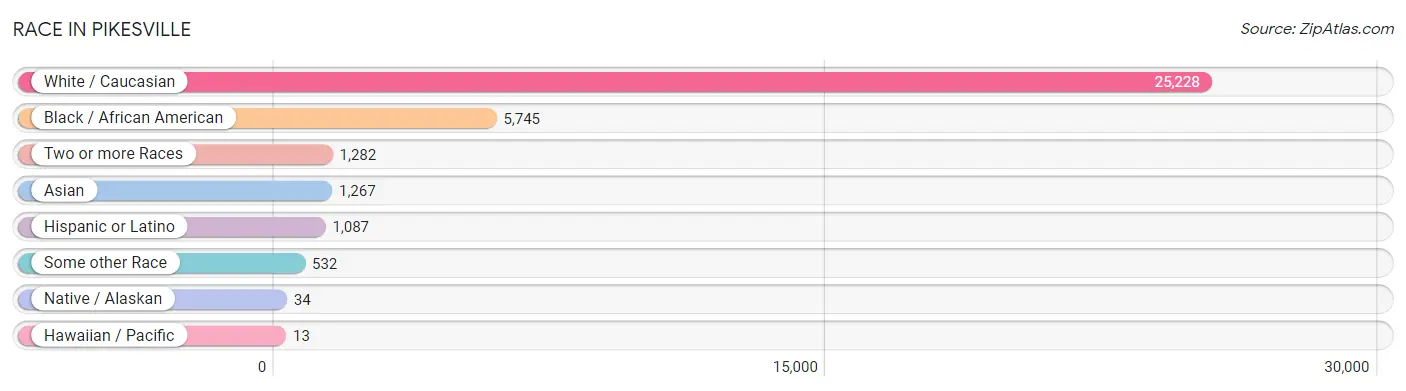
| Race | # Population | % Population |
| Asian | 1,267 | 3.7% |
| Black / African American | 5,745 | 16.9% |
| Hawaiian / Pacific | 13 | 0.0% |
| Hispanic or Latino | 1,087 | 3.2% |
| Native / Alaskan | 34 | 0.1% |
| White / Caucasian | 25,228 | 74.0% |
| Two or more Races | 1,282 | 3.8% |
| Some other Race | 532 | 1.6% |
| Total | 34,101 | 100.0% |
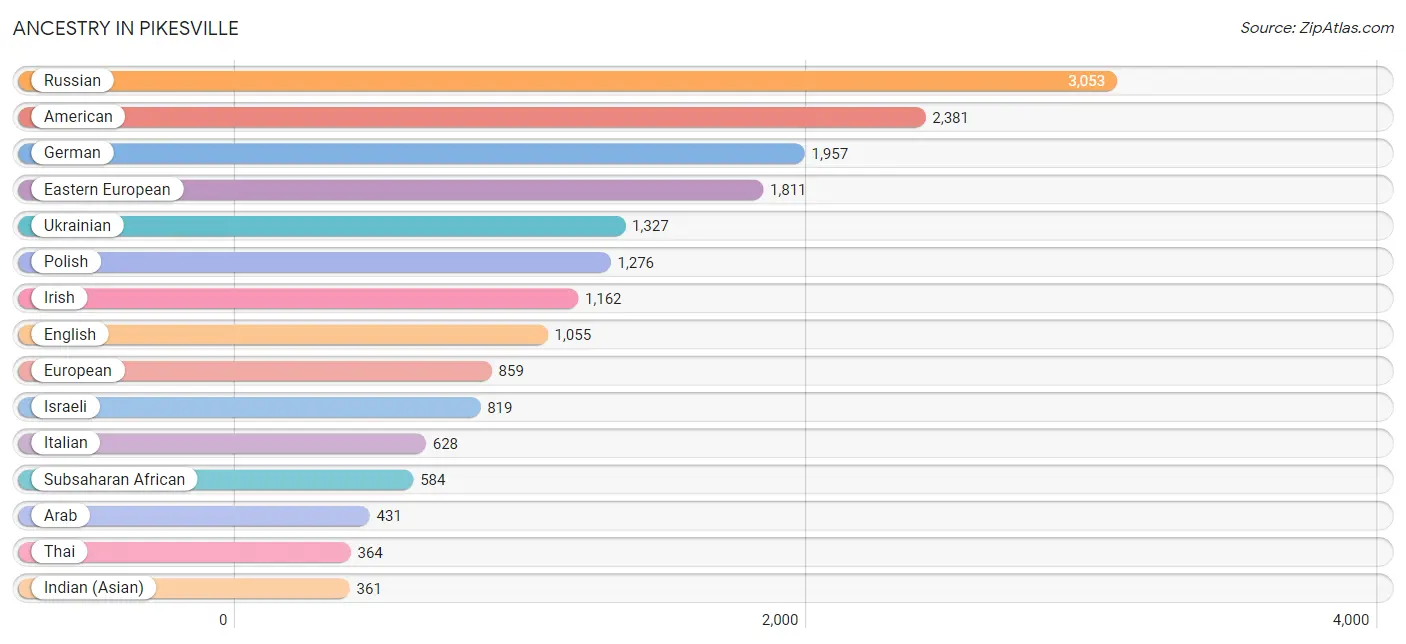
Ancestry in Pikesville
The most populous ancestries reported in Pikesville are Russian (3,053 | 8.9%), American (2,381 | 7.0%), German (1,957 | 5.7%), Eastern European (1,811 | 5.3%), and Ukrainian (1,327 | 3.9%), together accounting for 30.9% of all Pikesville residents.
| Ancestry | # Population | % Population |
| African | 320 | 0.9% |
| American | 2,381 | 7.0% |
| Arab | 431 | 1.3% |
| Argentinean | 1 | 0.0% |
| Armenian | 33 | 0.1% |
| Austrian | 82 | 0.2% |
| Belgian | 3 | 0.0% |
| Bhutanese | 64 | 0.2% |
| Bolivian | 63 | 0.2% |
| Brazilian | 106 | 0.3% |
| British | 145 | 0.4% |
| Burmese | 179 | 0.5% |
| Canadian | 83 | 0.2% |
| Central American | 219 | 0.6% |
| Chilean | 20 | 0.1% |
| Croatian | 54 | 0.2% |
| Czech | 61 | 0.2% |
| Czechoslovakian | 7 | 0.0% |
| Danish | 66 | 0.2% |
| Dominican | 277 | 0.8% |
| Dutch | 32 | 0.1% |
| Dutch West Indian | 6 | 0.0% |
| Eastern European | 1,811 | 5.3% |
| Egyptian | 165 | 0.5% |
| English | 1,055 | 3.1% |
| Ethiopian | 49 | 0.1% |
| European | 859 | 2.5% |
| Filipino | 218 | 0.6% |
| French | 148 | 0.4% |
| French Canadian | 21 | 0.1% |
| German | 1,957 | 5.7% |
| Greek | 104 | 0.3% |
| Guatemalan | 107 | 0.3% |
| Guyanese | 18 | 0.1% |
| Hungarian | 313 | 0.9% |
| Indian (Asian) | 361 | 1.1% |
| Iranian | 252 | 0.7% |
| Irish | 1,162 | 3.4% |
| Israeli | 819 | 2.4% |
| Italian | 628 | 1.8% |
| Jamaican | 245 | 0.7% |
| Korean | 247 | 0.7% |
| Latvian | 140 | 0.4% |
| Lebanese | 15 | 0.0% |
| Lithuanian | 226 | 0.7% |
| Lumbee | 31 | 0.1% |
| Mexican | 209 | 0.6% |
| Native Hawaiian | 64 | 0.2% |
| Nigerian | 185 | 0.5% |
| Northern European | 20 | 0.1% |
| Norwegian | 36 | 0.1% |
| Pakistani | 75 | 0.2% |
| Palestinian | 17 | 0.1% |
| Peruvian | 7 | 0.0% |
| Polish | 1,276 | 3.7% |
| Puerto Rican | 127 | 0.4% |
| Romanian | 231 | 0.7% |
| Russian | 3,053 | 8.9% |
| Salvadoran | 112 | 0.3% |
| Samoan | 13 | 0.0% |
| Scandinavian | 8 | 0.0% |
| Scotch-Irish | 42 | 0.1% |
| Scottish | 290 | 0.9% |
| Slovak | 6 | 0.0% |
| South African | 16 | 0.1% |
| South American | 91 | 0.3% |
| Soviet Union | 35 | 0.1% |
| Spaniard | 13 | 0.0% |
| Spanish | 20 | 0.1% |
| Sri Lankan | 35 | 0.1% |
| Subsaharan African | 584 | 1.7% |
| Swedish | 136 | 0.4% |
| Swiss | 68 | 0.2% |
| Syrian | 16 | 0.1% |
| Thai | 364 | 1.1% |
| Turkish | 37 | 0.1% |
| Ukrainian | 1,327 | 3.9% |
| Welsh | 80 | 0.2% |
| West Indian | 12 | 0.0% |
| Zimbabwean | 14 | 0.0% | View All 80 Rows |
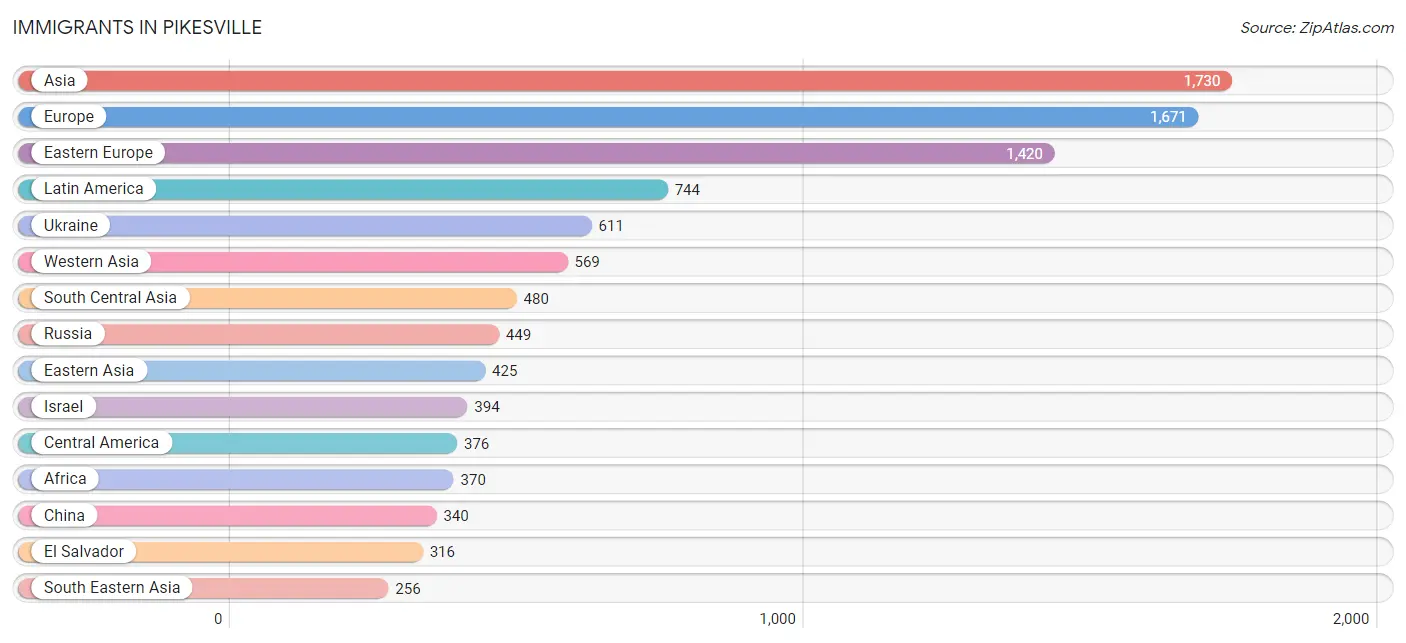
Immigrants in Pikesville
The most numerous immigrant groups reported in Pikesville came from Asia (1,730 | 5.1%), Europe (1,671 | 4.9%), Eastern Europe (1,420 | 4.2%), Latin America (744 | 2.2%), and Ukraine (611 | 1.8%), together accounting for 18.1% of all Pikesville residents.
| Immigration Origin | # Population | % Population |
| Africa | 370 | 1.1% |
| Argentina | 48 | 0.1% |
| Asia | 1,730 | 5.1% |
| Austria | 30 | 0.1% |
| Belarus | 127 | 0.4% |
| Belgium | 3 | 0.0% |
| Bolivia | 17 | 0.1% |
| Brazil | 45 | 0.1% |
| Canada | 149 | 0.4% |
| Caribbean | 251 | 0.7% |
| Central America | 376 | 1.1% |
| China | 340 | 1.0% |
| Czechoslovakia | 35 | 0.1% |
| Dominican Republic | 149 | 0.4% |
| Eastern Africa | 24 | 0.1% |
| Eastern Asia | 425 | 1.3% |
| Eastern Europe | 1,420 | 4.2% |
| Egypt | 138 | 0.4% |
| El Salvador | 316 | 0.9% |
| England | 45 | 0.1% |
| Ethiopia | 24 | 0.1% |
| Europe | 1,671 | 4.9% |
| Germany | 34 | 0.1% |
| Greece | 17 | 0.1% |
| Guatemala | 60 | 0.2% |
| India | 98 | 0.3% |
| Iran | 79 | 0.2% |
| Ireland | 9 | 0.0% |
| Israel | 394 | 1.2% |
| Italy | 24 | 0.1% |
| Jamaica | 89 | 0.3% |
| Korea | 85 | 0.3% |
| Latin America | 744 | 2.2% |
| Moldova | 31 | 0.1% |
| Netherlands | 11 | 0.0% |
| Nigeria | 157 | 0.5% |
| Northern Africa | 157 | 0.5% |
| Northern Europe | 132 | 0.4% |
| Norway | 11 | 0.0% |
| Pakistan | 76 | 0.2% |
| Peru | 7 | 0.0% |
| Philippines | 169 | 0.5% |
| Poland | 41 | 0.1% |
| Romania | 41 | 0.1% |
| Russia | 449 | 1.3% |
| South Africa | 32 | 0.1% |
| South America | 117 | 0.3% |
| South Central Asia | 480 | 1.4% |
| South Eastern Asia | 256 | 0.7% |
| Southern Europe | 41 | 0.1% |
| Taiwan | 84 | 0.3% |
| Thailand | 75 | 0.2% |
| Trinidad and Tobago | 13 | 0.0% |
| Turkey | 23 | 0.1% |
| Ukraine | 611 | 1.8% |
| Uzbekistan | 183 | 0.5% |
| Vietnam | 12 | 0.0% |
| Western Africa | 157 | 0.5% |
| Western Asia | 569 | 1.7% |
| Western Europe | 78 | 0.2% | View All 60 Rows |
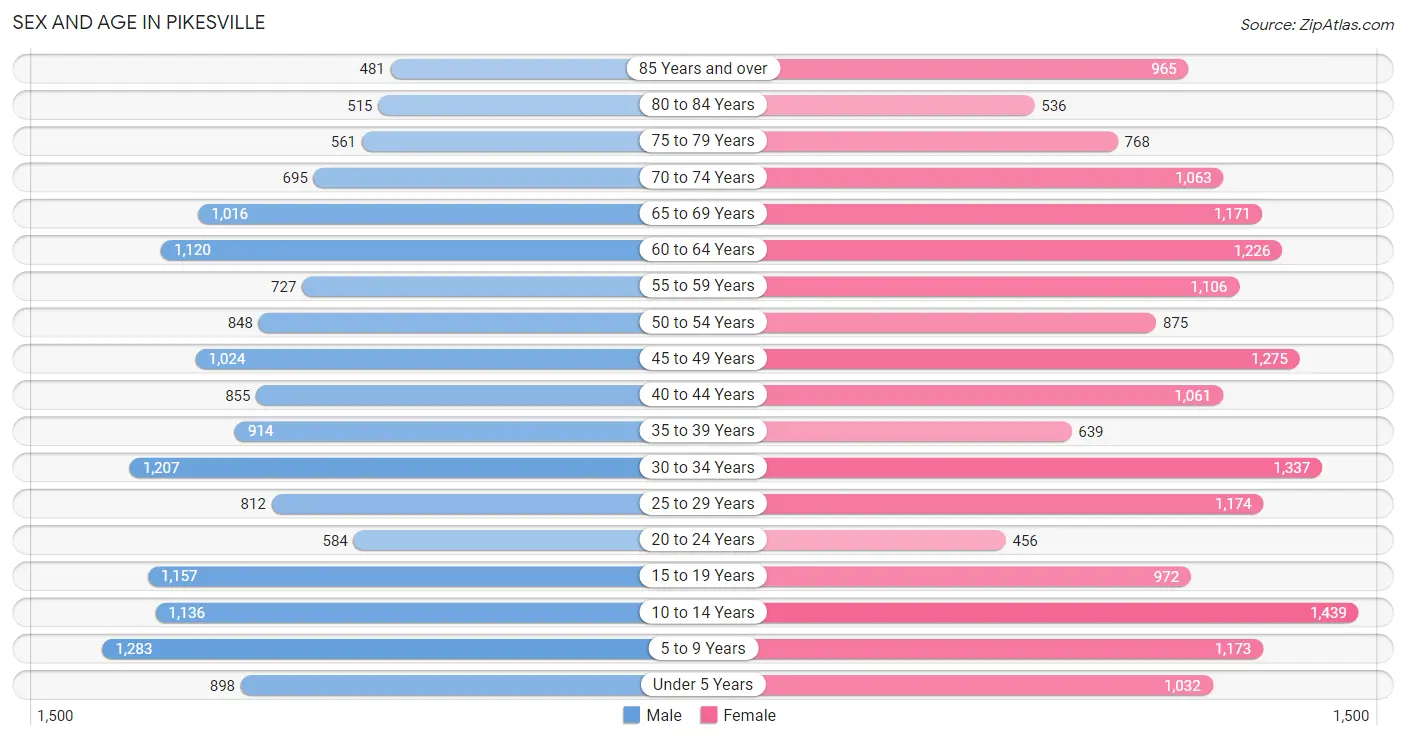
Sex and Age in Pikesville
Sex and Age in Pikesville
The most populous age groups in Pikesville are 5 to 9 Years (1,283 | 8.1%) for men and 10 to 14 Years (1,439 | 7.9%) for women.
| Age Bracket | Male | Female |
| Under 5 Years | 898 (5.7%) | 1,032 (5.7%) |
| 5 to 9 Years | 1,283 (8.1%) | 1,173 (6.4%) |
| 10 to 14 Years | 1,136 (7.2%) | 1,439 (7.9%) |
| 15 to 19 Years | 1,157 (7.3%) | 972 (5.3%) |
| 20 to 24 Years | 584 (3.7%) | 456 (2.5%) |
| 25 to 29 Years | 812 (5.1%) | 1,174 (6.4%) |
| 30 to 34 Years | 1,207 (7.6%) | 1,337 (7.3%) |
| 35 to 39 Years | 914 (5.8%) | 639 (3.5%) |
| 40 to 44 Years | 855 (5.4%) | 1,061 (5.8%) |
| 45 to 49 Years | 1,024 (6.5%) | 1,275 (7.0%) |
| 50 to 54 Years | 848 (5.4%) | 875 (4.8%) |
| 55 to 59 Years | 727 (4.6%) | 1,106 (6.0%) |
| 60 to 64 Years | 1,120 (7.1%) | 1,226 (6.7%) |
| 65 to 69 Years | 1,016 (6.4%) | 1,171 (6.4%) |
| 70 to 74 Years | 695 (4.4%) | 1,063 (5.8%) |
| 75 to 79 Years | 561 (3.5%) | 768 (4.2%) |
| 80 to 84 Years | 515 (3.3%) | 536 (2.9%) |
| 85 Years and over | 481 (3.0%) | 965 (5.3%) |
| Total | 15,833 (100.0%) | 18,268 (100.0%) |
Families and Households in Pikesville
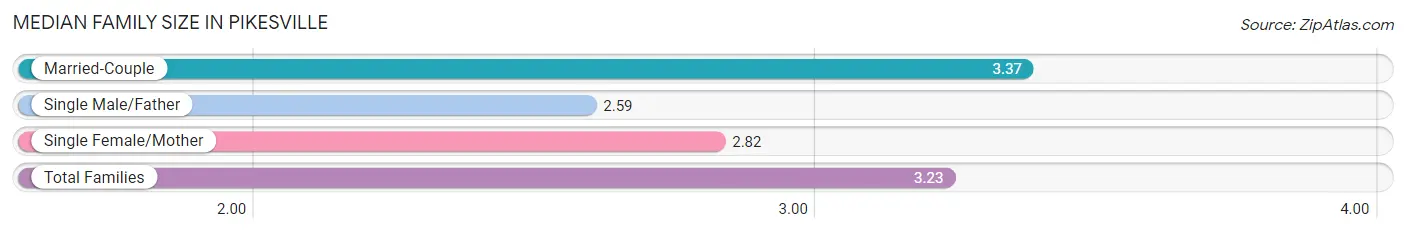
Median Family Size in Pikesville
The median family size in Pikesville is 3.23 persons per family, with married-couple families (6,275 | 75.7%) accounting for the largest median family size of 3.37 persons per family. On the other hand, single male/father families (357 | 4.3%) represent the smallest median family size with 2.59 persons per family.
| Family Type | # Families | Family Size |
| Married-Couple | 6,275 (75.7%) | 3.37 |
| Single Male/Father | 357 (4.3%) | 2.59 |
| Single Female/Mother | 1,656 (20.0%) | 2.82 |
| Total Families | 8,288 (100.0%) | 3.23 |
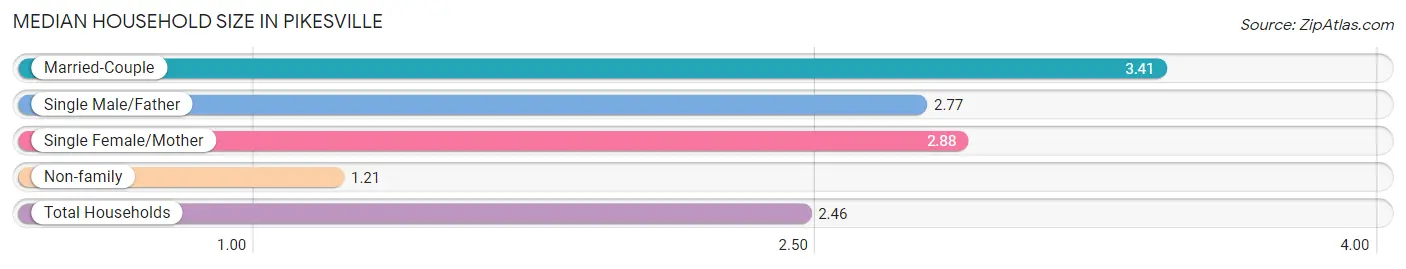
Median Household Size in Pikesville
The median household size in Pikesville is 2.46 persons per household, with married-couple households (6,275 | 45.9%) accounting for the largest median household size of 3.41 persons per household. non-family households (5,393 | 39.4%) represent the smallest median household size with 1.21 persons per household.
| Household Type | # Households | Household Size |
| Married-Couple | 6,275 (45.9%) | 3.41 |
| Single Male/Father | 357 (2.6%) | 2.77 |
| Single Female/Mother | 1,656 (12.1%) | 2.88 |
| Non-family | 5,393 (39.4%) | 1.21 |
| Total Households | 13,681 (100.0%) | 2.46 |
Household Size by Marriage Status in Pikesville
Out of a total of 13,681 households in Pikesville, 8,288 (60.6%) are family households, while 5,393 (39.4%) are nonfamily households. The most numerous type of family households are 2-person households, comprising 4,090, and the most common type of nonfamily households are 1-person households, comprising 4,626.
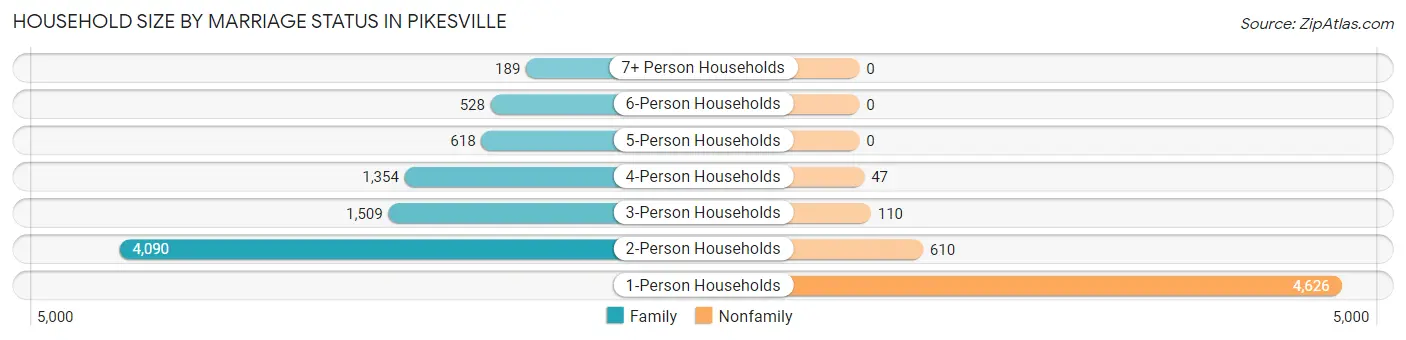
| Household Size | Family Households | Nonfamily Households |
| 1-Person Households | - | 4,626 (33.8%) |
| 2-Person Households | 4,090 (29.9%) | 610 (4.5%) |
| 3-Person Households | 1,509 (11.0%) | 110 (0.8%) |
| 4-Person Households | 1,354 (9.9%) | 47 (0.3%) |
| 5-Person Households | 618 (4.5%) | 0 (0.0%) |
| 6-Person Households | 528 (3.9%) | 0 (0.0%) |
| 7+ Person Households | 189 (1.4%) | 0 (0.0%) |
| Total | 8,288 (60.6%) | 5,393 (39.4%) |
Female Fertility in Pikesville
Fertility by Age in Pikesville
Average fertility rate in Pikesville is 47.0 births per 1,000 women. Women in the age bracket of 20 to 34 years have the highest fertility rate with 93.0 births per 1,000 women. Women in the age bracket of 20 to 34 years acount for 83.1% of all women with births.
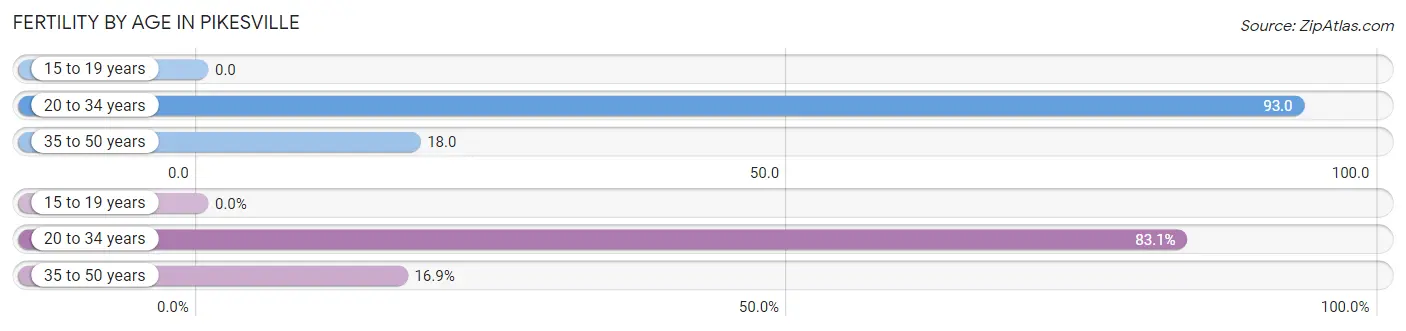
| Age Bracket | Women with Births | Births / 1,000 Women |
| 15 to 19 years | 0 (0.0%) | 0.0 |
| 20 to 34 years | 275 (83.1%) | 93.0 |
| 35 to 50 years | 56 (16.9%) | 18.0 |
| Total | 331 (100.0%) | 47.0 |
Fertility by Age by Marriage Status in Pikesville
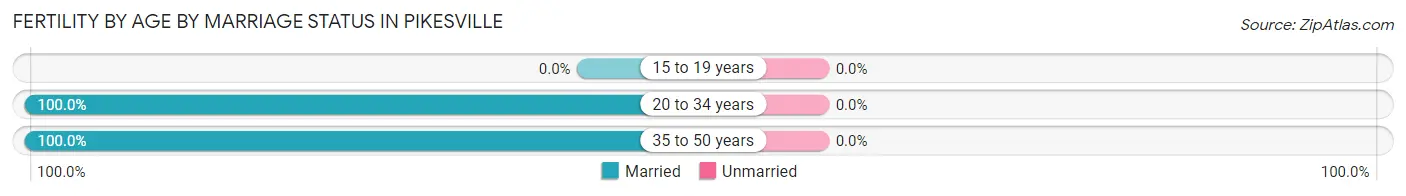
| Age Bracket | Married | Unmarried |
| 15 to 19 years | 0 (0.0%) | 0 (0.0%) |
| 20 to 34 years | 275 (100.0%) | 0 (0.0%) |
| 35 to 50 years | 56 (100.0%) | 0 (0.0%) |
| Total | 331 (100.0%) | 0 (0.0%) |
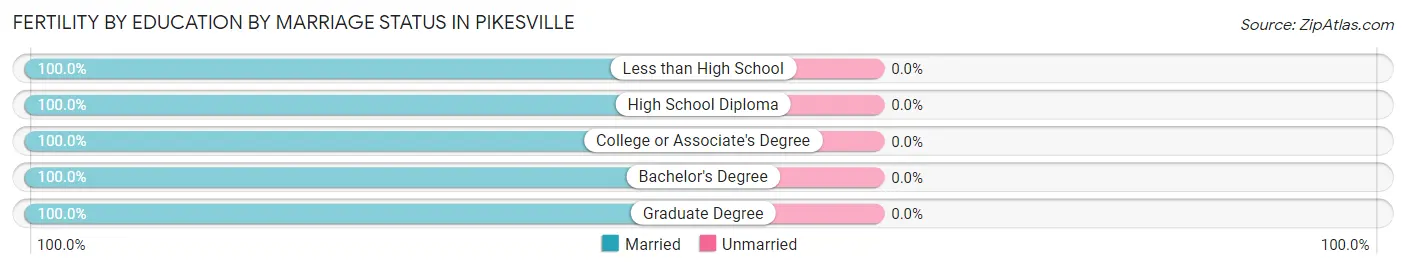
Fertility by Education in Pikesville
Average fertility rate in Pikesville is 47.0 births per 1,000 women. Women with the education attainment of graduate degree have the highest fertility rate of 76.0 births per 1,000 women, while women with the education attainment of bachelor's degree have the lowest fertility at 29.0 births per 1,000 women. Women with the education attainment of graduate degree represent 44.1% of all women with births.
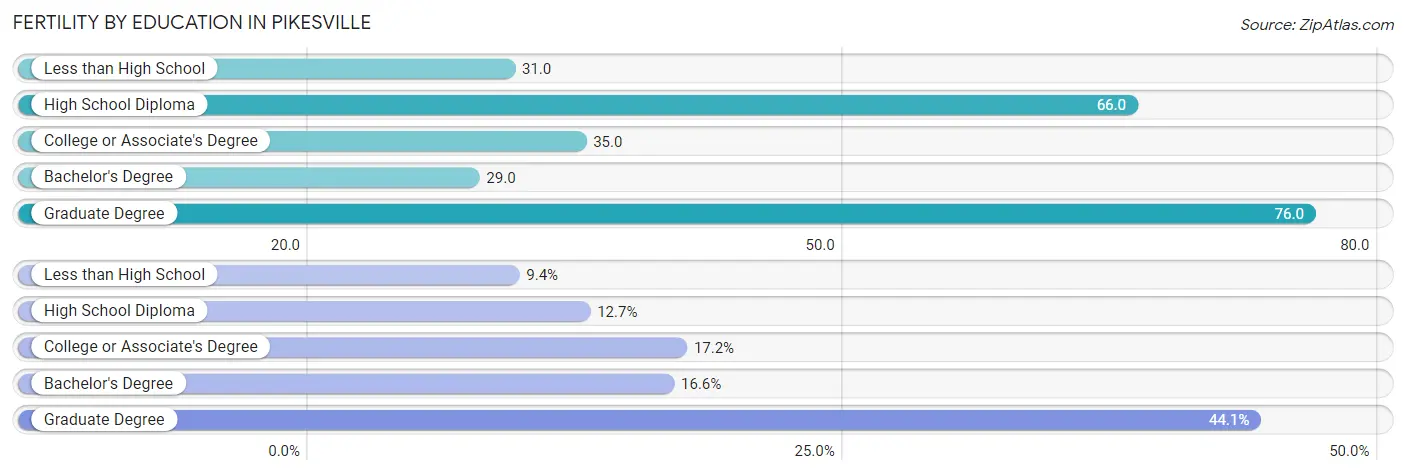
| Educational Attainment | Women with Births | Births / 1,000 Women |
| Less than High School | 31 (9.4%) | 31.0 |
| High School Diploma | 42 (12.7%) | 66.0 |
| College or Associate's Degree | 57 (17.2%) | 35.0 |
| Bachelor's Degree | 55 (16.6%) | 29.0 |
| Graduate Degree | 146 (44.1%) | 76.0 |
| Total | 331 (100.0%) | 47.0 |
Fertility by Education by Marriage Status in Pikesville
| Educational Attainment | Married | Unmarried |
| Less than High School | 31 (100.0%) | 0 (0.0%) |
| High School Diploma | 42 (100.0%) | 0 (0.0%) |
| College or Associate's Degree | 57 (100.0%) | 0 (0.0%) |
| Bachelor's Degree | 55 (100.0%) | 0 (0.0%) |
| Graduate Degree | 146 (100.0%) | 0 (0.0%) |
| Total | 331 (100.0%) | 0 (0.0%) |
Employment Characteristics in Pikesville
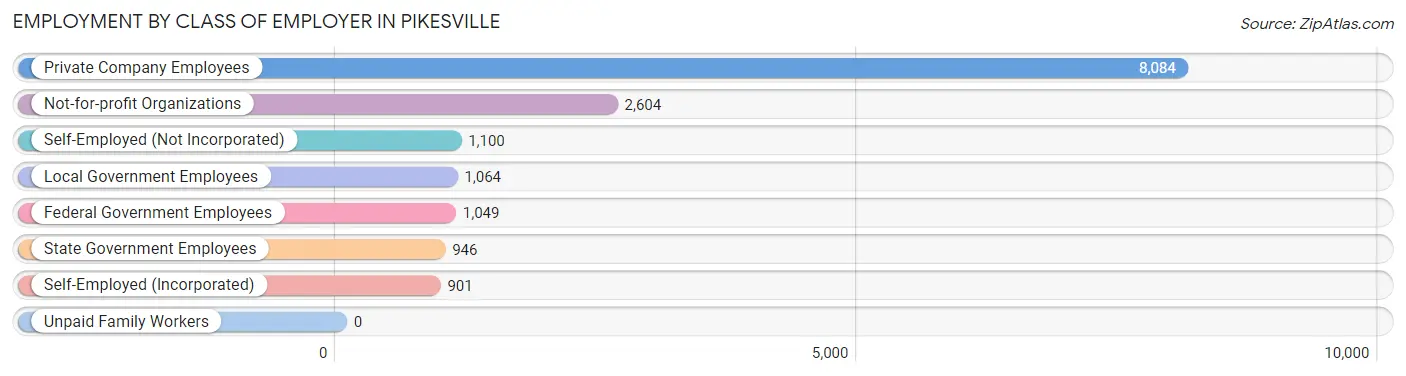
Employment by Class of Employer in Pikesville
Among the 15,748 employed individuals in Pikesville, private company employees (8,084 | 51.3%), not-for-profit organizations (2,604 | 16.5%), and self-employed (not incorporated) (1,100 | 7.0%) make up the most common classes of employment.
| Employer Class | # Employees | % Employees |
| Private Company Employees | 8,084 | 51.3% |
| Self-Employed (Incorporated) | 901 | 5.7% |
| Self-Employed (Not Incorporated) | 1,100 | 7.0% |
| Not-for-profit Organizations | 2,604 | 16.5% |
| Local Government Employees | 1,064 | 6.8% |
| State Government Employees | 946 | 6.0% |
| Federal Government Employees | 1,049 | 6.7% |
| Unpaid Family Workers | 0 | 0.0% |
| Total | 15,748 | 100.0% |
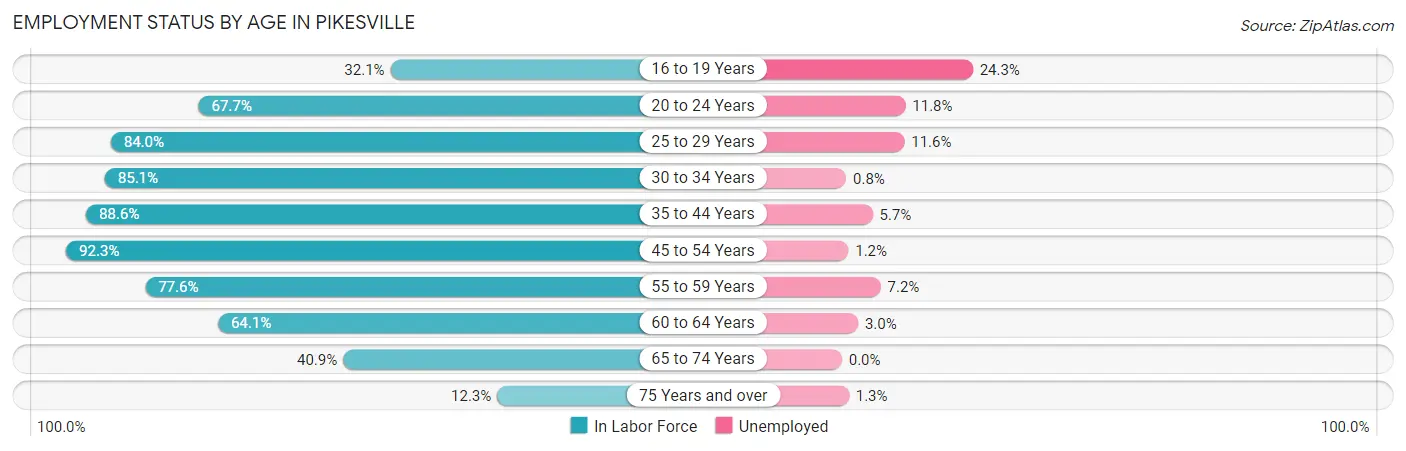
Employment Status by Age in Pikesville
According to the labor force statistics for Pikesville, out of the total population over 16 years of age (26,691), 63.2% or 16,869 individuals are in the labor force, with 4.7% or 793 of them unemployed. The age group with the highest labor force participation rate is 45 to 54 years, with 92.3% or 3,712 individuals in the labor force. Within the labor force, the 16 to 19 years age range has the highest percentage of unemployed individuals, with 24.3% or 131 of them being unemployed.
| Age Bracket | In Labor Force | Unemployed |
| 16 to 19 Years | 539 (32.1%) | 131 (24.3%) |
| 20 to 24 Years | 704 (67.7%) | 83 (11.8%) |
| 25 to 29 Years | 1,668 (84.0%) | 193 (11.6%) |
| 30 to 34 Years | 2,165 (85.1%) | 17 (0.8%) |
| 35 to 44 Years | 3,074 (88.6%) | 175 (5.7%) |
| 45 to 54 Years | 3,712 (92.3%) | 45 (1.2%) |
| 55 to 59 Years | 1,422 (77.6%) | 102 (7.2%) |
| 60 to 64 Years | 1,504 (64.1%) | 45 (3.0%) |
| 65 to 74 Years | 1,614 (40.9%) | 0 (0.0%) |
| 75 Years and over | 471 (12.3%) | 6 (1.3%) |
| Total | 16,869 (63.2%) | 793 (4.7%) |
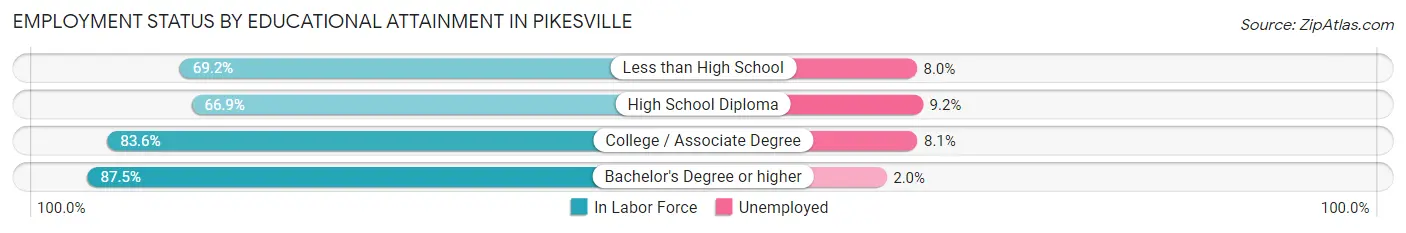
Employment Status by Educational Attainment in Pikesville
According to labor force statistics for Pikesville, 83.6% of individuals (13,543) out of the total population between 25 and 64 years of age (16,200) are in the labor force, with 4.3% or 582 of them being unemployed. The group with the highest labor force participation rate are those with the educational attainment of bachelor's degree or higher, with 87.5% or 8,692 individuals in the labor force. Within the labor force, individuals with high school diploma education have the highest percentage of unemployment, with 9.2% or 104 of them being unemployed.
| Educational Attainment | In Labor Force | Unemployed |
| Less than High School | 487 (69.2%) | 56 (8.0%) |
| High School Diploma | 1,132 (66.9%) | 156 (9.2%) |
| College / Associate Degree | 3,235 (83.6%) | 313 (8.1%) |
| Bachelor's Degree or higher | 8,692 (87.5%) | 199 (2.0%) |
| Total | 13,543 (83.6%) | 697 (4.3%) |
Employment Occupations by Sex in Pikesville
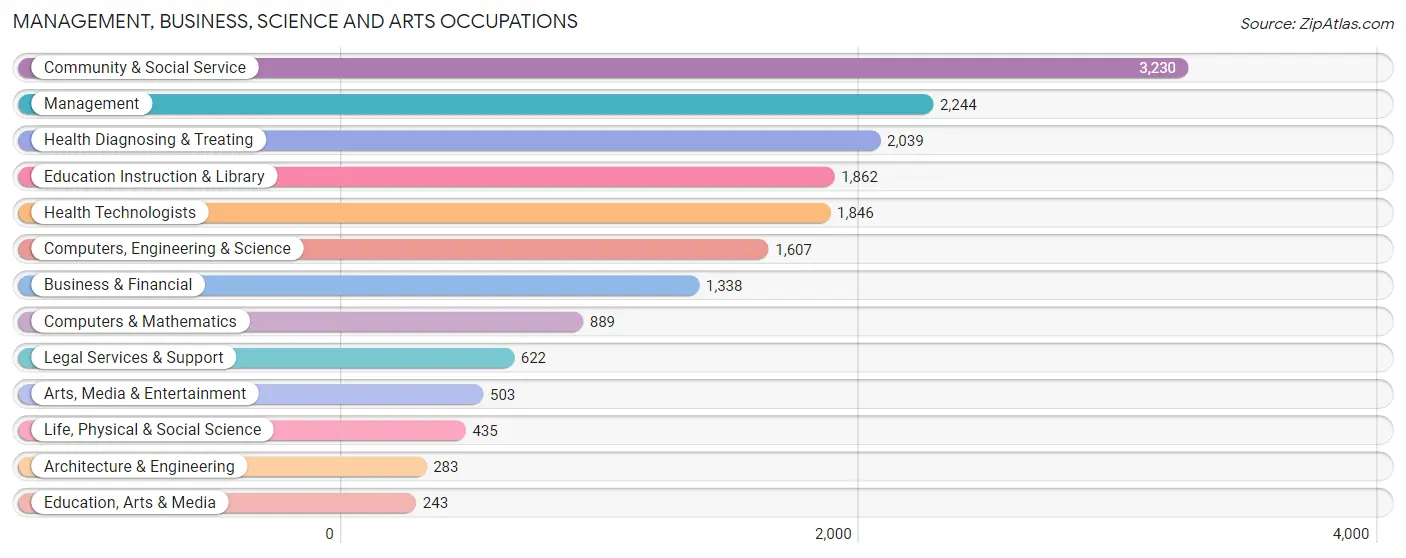
Management, Business, Science and Arts Occupations
The most common Management, Business, Science and Arts occupations in Pikesville are Community & Social Service (3,230 | 20.1%), Management (2,244 | 14.0%), Health Diagnosing & Treating (2,039 | 12.7%), Education Instruction & Library (1,862 | 11.6%), and Health Technologists (1,846 | 11.5%).
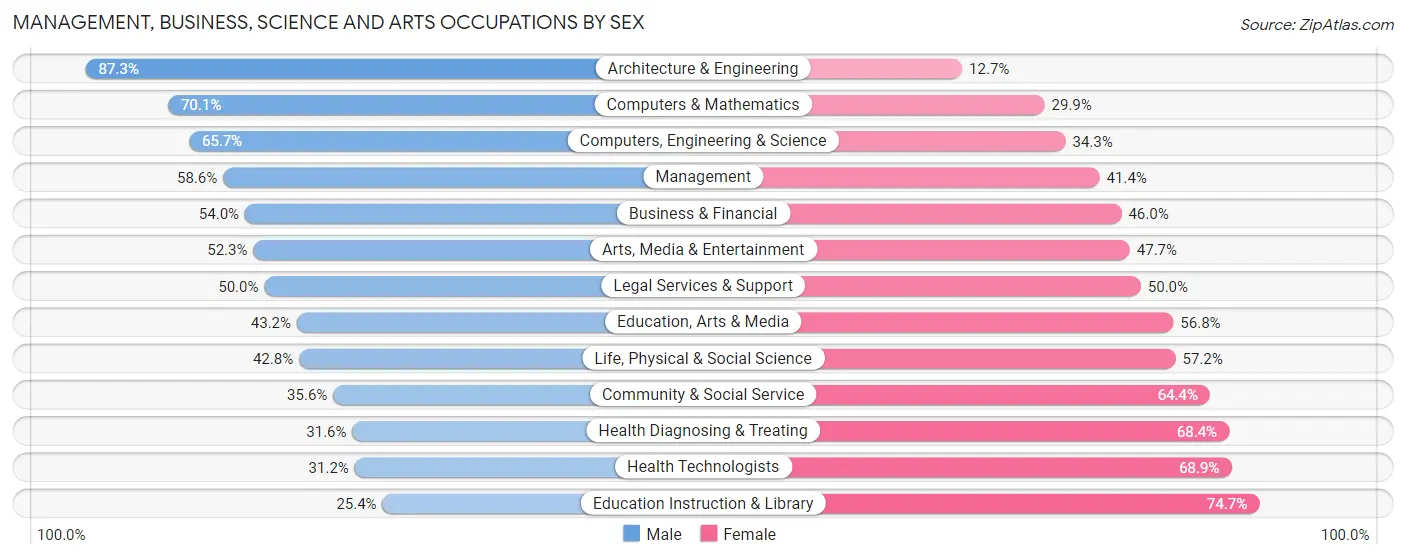
Management, Business, Science and Arts Occupations by Sex
Within the Management, Business, Science and Arts occupations in Pikesville, the most male-oriented occupations are Architecture & Engineering (87.3%), Computers & Mathematics (70.1%), and Computers, Engineering & Science (65.7%), while the most female-oriented occupations are Education Instruction & Library (74.7%), Health Technologists (68.9%), and Health Diagnosing & Treating (68.4%).
| Occupation | Male | Female |
| Management | 1,315 (58.6%) | 929 (41.4%) |
| Business & Financial | 723 (54.0%) | 615 (46.0%) |
| Computers, Engineering & Science | 1,056 (65.7%) | 551 (34.3%) |
| Computers & Mathematics | 623 (70.1%) | 266 (29.9%) |
| Architecture & Engineering | 247 (87.3%) | 36 (12.7%) |
| Life, Physical & Social Science | 186 (42.8%) | 249 (57.2%) |
| Community & Social Service | 1,151 (35.6%) | 2,079 (64.4%) |
| Education, Arts & Media | 105 (43.2%) | 138 (56.8%) |
| Legal Services & Support | 311 (50.0%) | 311 (50.0%) |
| Education Instruction & Library | 472 (25.4%) | 1,390 (74.7%) |
| Arts, Media & Entertainment | 263 (52.3%) | 240 (47.7%) |
| Health Diagnosing & Treating | 645 (31.6%) | 1,394 (68.4%) |
| Health Technologists | 575 (31.1%) | 1,271 (68.9%) |
| Total (Category) | 4,890 (46.8%) | 5,568 (53.2%) |
| Total (Overall) | 7,836 (48.8%) | 8,222 (51.2%) |
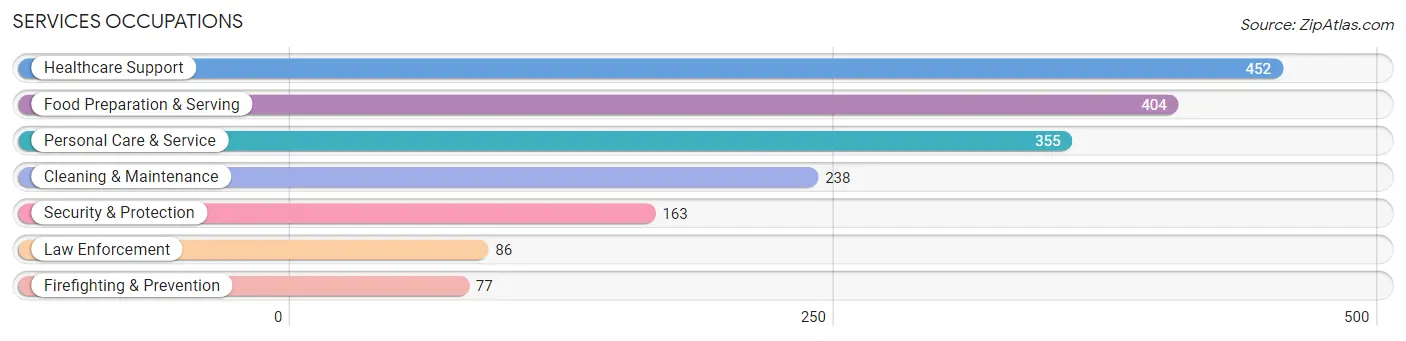
Services Occupations
The most common Services occupations in Pikesville are Healthcare Support (452 | 2.8%), Food Preparation & Serving (404 | 2.5%), Personal Care & Service (355 | 2.2%), Cleaning & Maintenance (238 | 1.5%), and Security & Protection (163 | 1.0%).
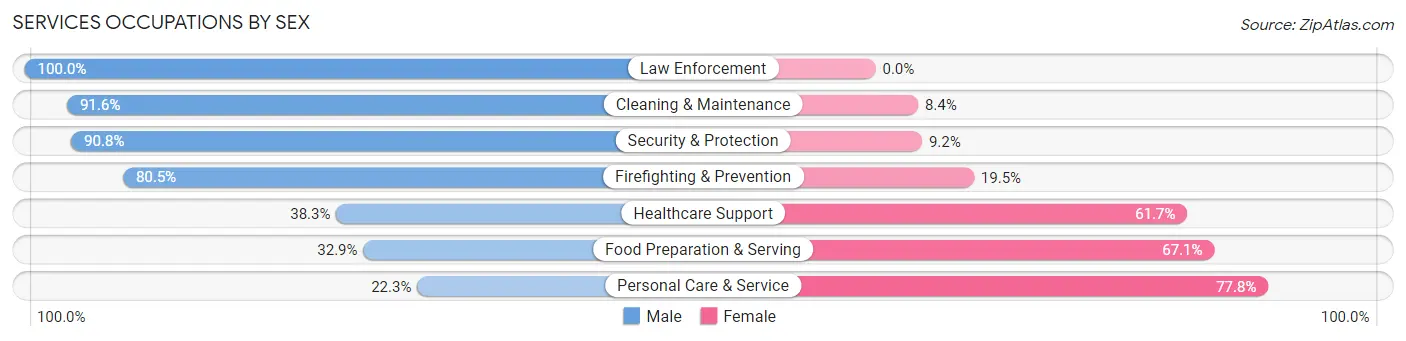
Services Occupations by Sex
Within the Services occupations in Pikesville, the most male-oriented occupations are Law Enforcement (100.0%), Cleaning & Maintenance (91.6%), and Security & Protection (90.8%), while the most female-oriented occupations are Personal Care & Service (77.7%), Food Preparation & Serving (67.1%), and Healthcare Support (61.7%).
| Occupation | Male | Female |
| Healthcare Support | 173 (38.3%) | 279 (61.7%) |
| Security & Protection | 148 (90.8%) | 15 (9.2%) |
| Firefighting & Prevention | 62 (80.5%) | 15 (19.5%) |
| Law Enforcement | 86 (100.0%) | 0 (0.0%) |
| Food Preparation & Serving | 133 (32.9%) | 271 (67.1%) |
| Cleaning & Maintenance | 218 (91.6%) | 20 (8.4%) |
| Personal Care & Service | 79 (22.3%) | 276 (77.7%) |
| Total (Category) | 751 (46.6%) | 861 (53.4%) |
| Total (Overall) | 7,836 (48.8%) | 8,222 (51.2%) |
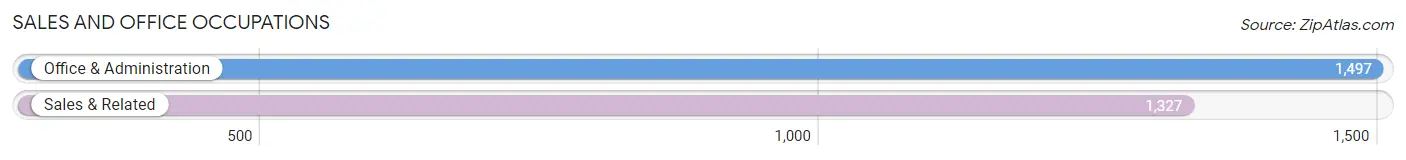
Sales and Office Occupations
The most common Sales and Office occupations in Pikesville are Office & Administration (1,497 | 9.3%), and Sales & Related (1,327 | 8.3%).
Sales and Office Occupations by Sex
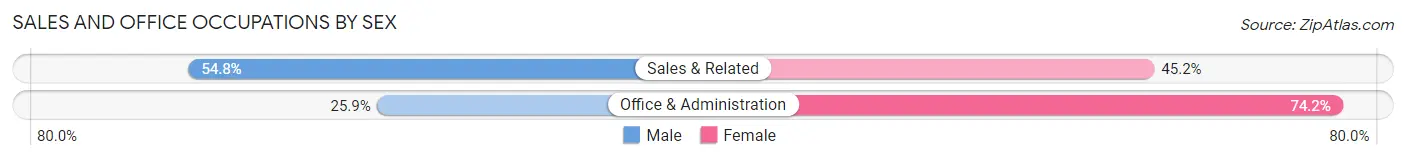
| Occupation | Male | Female |
| Sales & Related | 727 (54.8%) | 600 (45.2%) |
| Office & Administration | 387 (25.9%) | 1,110 (74.2%) |
| Total (Category) | 1,114 (39.5%) | 1,710 (60.6%) |
| Total (Overall) | 7,836 (48.8%) | 8,222 (51.2%) |
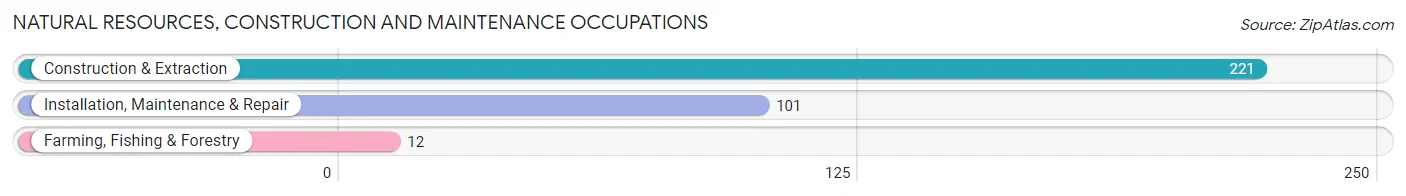
Natural Resources, Construction and Maintenance Occupations
The most common Natural Resources, Construction and Maintenance occupations in Pikesville are Construction & Extraction (221 | 1.4%), Installation, Maintenance & Repair (101 | 0.6%), and Farming, Fishing & Forestry (12 | 0.1%).
Natural Resources, Construction and Maintenance Occupations by Sex
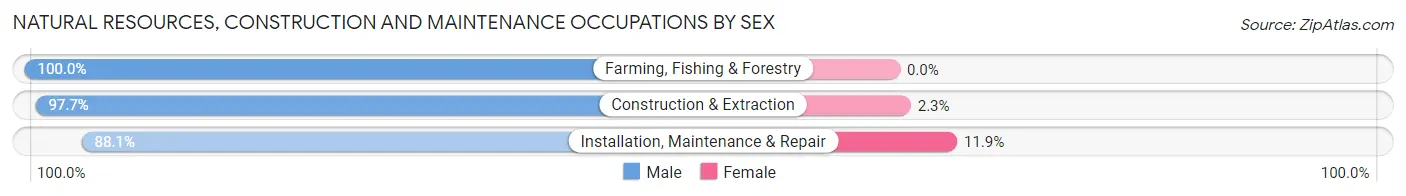
| Occupation | Male | Female |
| Farming, Fishing & Forestry | 12 (100.0%) | 0 (0.0%) |
| Construction & Extraction | 216 (97.7%) | 5 (2.3%) |
| Installation, Maintenance & Repair | 89 (88.1%) | 12 (11.9%) |
| Total (Category) | 317 (94.9%) | 17 (5.1%) |
| Total (Overall) | 7,836 (48.8%) | 8,222 (51.2%) |
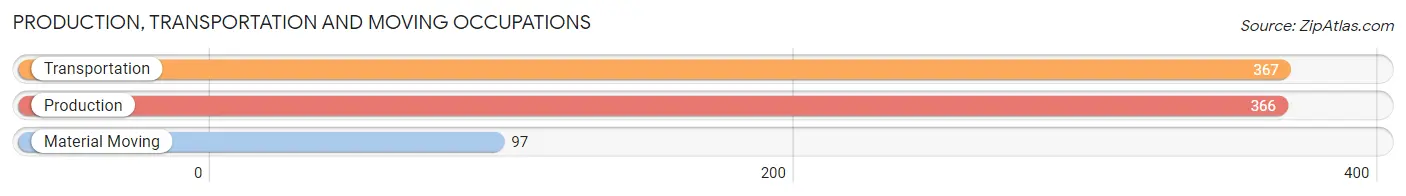
Production, Transportation and Moving Occupations
The most common Production, Transportation and Moving occupations in Pikesville are Transportation (367 | 2.3%), Production (366 | 2.3%), and Material Moving (97 | 0.6%).
Production, Transportation and Moving Occupations by Sex
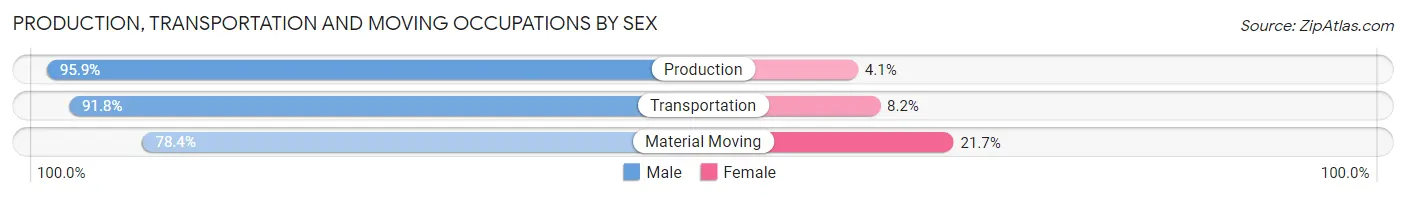
| Occupation | Male | Female |
| Production | 351 (95.9%) | 15 (4.1%) |
| Transportation | 337 (91.8%) | 30 (8.2%) |
| Material Moving | 76 (78.3%) | 21 (21.6%) |
| Total (Category) | 764 (92.0%) | 66 (8.0%) |
| Total (Overall) | 7,836 (48.8%) | 8,222 (51.2%) |
Employment Industries by Sex in Pikesville
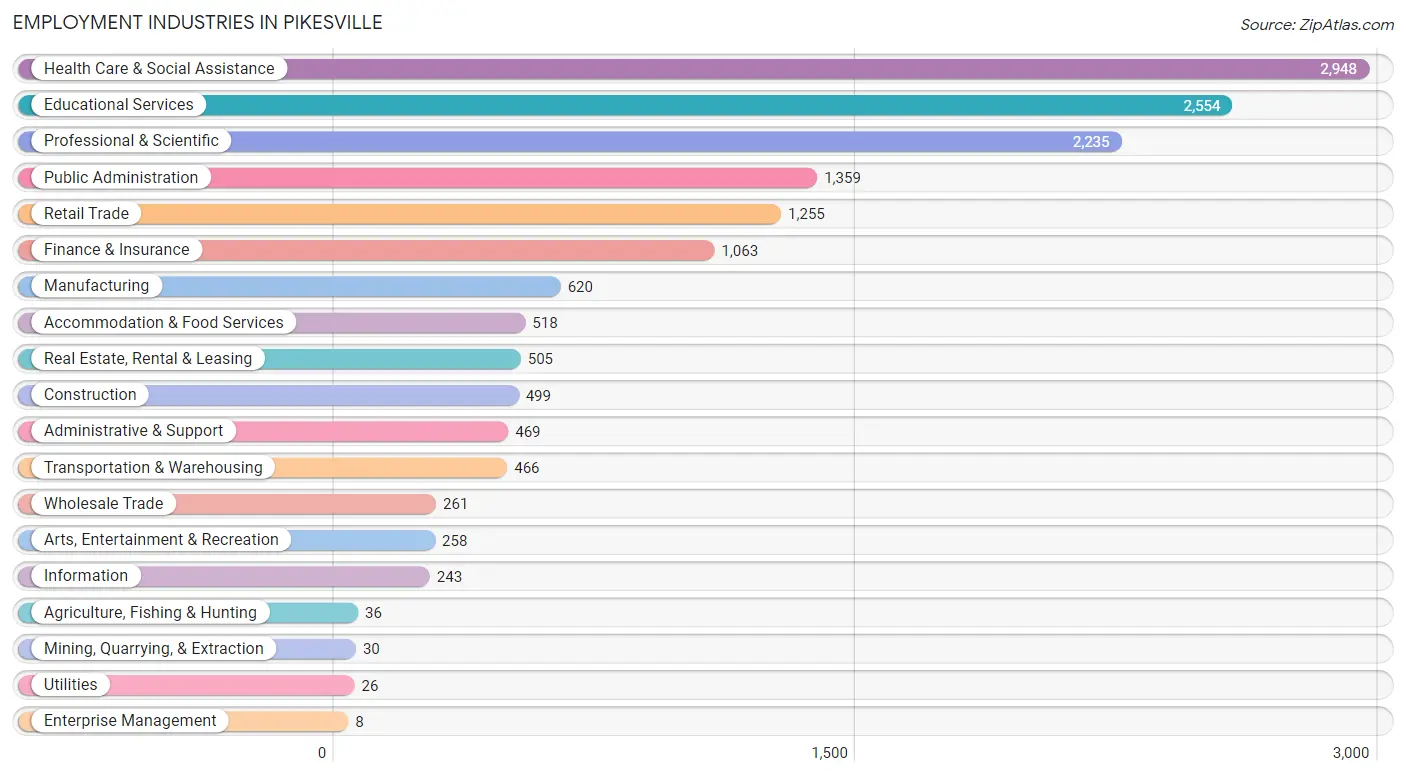
Employment Industries in Pikesville
The major employment industries in Pikesville include Health Care & Social Assistance (2,948 | 18.4%), Educational Services (2,554 | 15.9%), Professional & Scientific (2,235 | 13.9%), Public Administration (1,359 | 8.5%), and Retail Trade (1,255 | 7.8%).
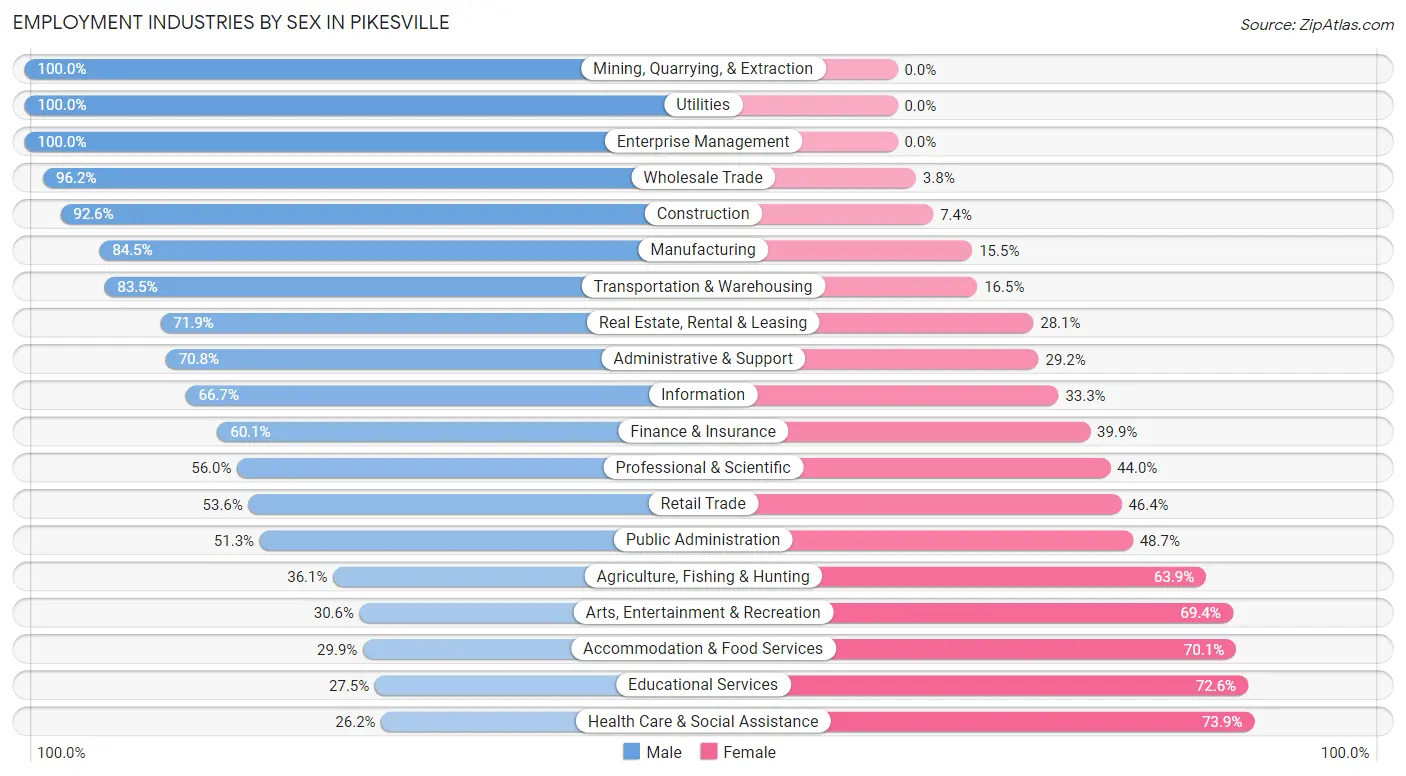
Employment Industries by Sex in Pikesville
The Pikesville industries that see more men than women are Mining, Quarrying, & Extraction (100.0%), Utilities (100.0%), and Enterprise Management (100.0%), whereas the industries that tend to have a higher number of women are Health Care & Social Assistance (73.9%), Educational Services (72.6%), and Accommodation & Food Services (70.1%).
| Industry | Male | Female |
| Agriculture, Fishing & Hunting | 13 (36.1%) | 23 (63.9%) |
| Mining, Quarrying, & Extraction | 30 (100.0%) | 0 (0.0%) |
| Construction | 462 (92.6%) | 37 (7.4%) |
| Manufacturing | 524 (84.5%) | 96 (15.5%) |
| Wholesale Trade | 251 (96.2%) | 10 (3.8%) |
| Retail Trade | 673 (53.6%) | 582 (46.4%) |
| Transportation & Warehousing | 389 (83.5%) | 77 (16.5%) |
| Utilities | 26 (100.0%) | 0 (0.0%) |
| Information | 162 (66.7%) | 81 (33.3%) |
| Finance & Insurance | 639 (60.1%) | 424 (39.9%) |
| Real Estate, Rental & Leasing | 363 (71.9%) | 142 (28.1%) |
| Professional & Scientific | 1,251 (56.0%) | 984 (44.0%) |
| Enterprise Management | 8 (100.0%) | 0 (0.0%) |
| Administrative & Support | 332 (70.8%) | 137 (29.2%) |
| Educational Services | 701 (27.5%) | 1,853 (72.6%) |
| Health Care & Social Assistance | 771 (26.2%) | 2,177 (73.9%) |
| Arts, Entertainment & Recreation | 79 (30.6%) | 179 (69.4%) |
| Accommodation & Food Services | 155 (29.9%) | 363 (70.1%) |
| Public Administration | 697 (51.3%) | 662 (48.7%) |
| Total | 7,836 (48.8%) | 8,222 (51.2%) |
Education in Pikesville
School Enrollment in Pikesville
The most common levels of schooling among the 9,020 students in Pikesville are high school (2,080 | 23.1%), elementary school (2,001 | 22.2%), and middle school (1,717 | 19.0%).
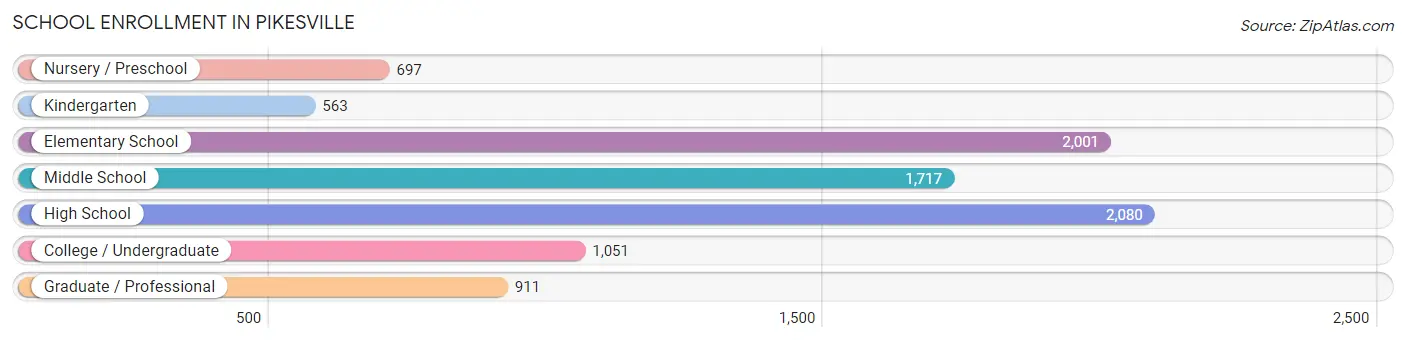
| School Level | # Students | % Students |
| Nursery / Preschool | 697 | 7.7% |
| Kindergarten | 563 | 6.2% |
| Elementary School | 2,001 | 22.2% |
| Middle School | 1,717 | 19.0% |
| High School | 2,080 | 23.1% |
| College / Undergraduate | 1,051 | 11.7% |
| Graduate / Professional | 911 | 10.1% |
| Total | 9,020 | 100.0% |
School Enrollment by Age by Funding Source in Pikesville
Out of a total of 9,020 students who are enrolled in schools in Pikesville, 4,844 (53.7%) attend a private institution, while the remaining 4,176 (46.3%) are enrolled in public schools. The age group of 3 to 4 year olds has the highest likelihood of being enrolled in private schools, with 383 (84.4% in the age bracket) enrolled. Conversely, the age group of 35 years and over has the lowest likelihood of being enrolled in a private school, with 458 (79.2% in the age bracket) attending a public institution.
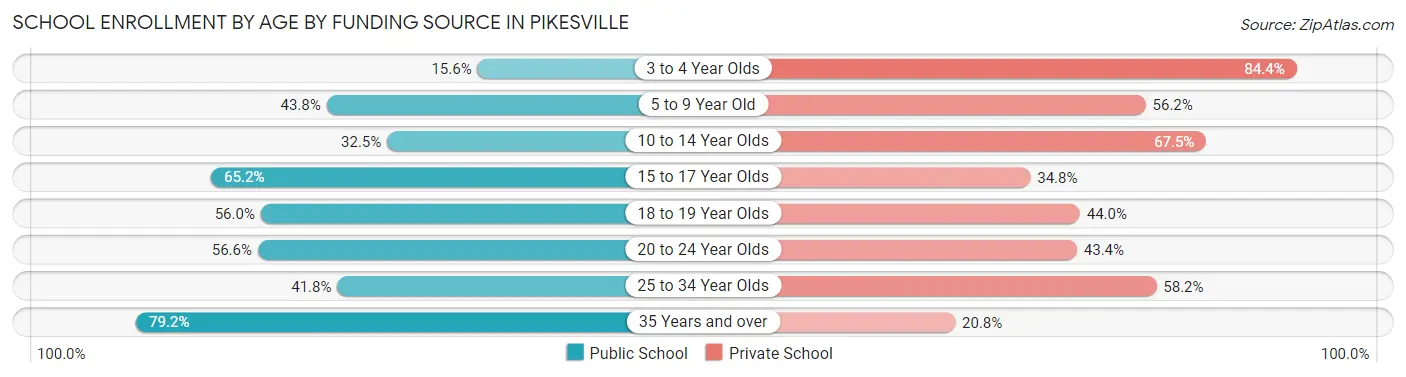
| Age Bracket | Public School | Private School |
| 3 to 4 Year Olds | 71 (15.6%) | 383 (84.4%) |
| 5 to 9 Year Old | 975 (43.8%) | 1,253 (56.2%) |
| 10 to 14 Year Olds | 821 (32.5%) | 1,707 (67.5%) |
| 15 to 17 Year Olds | 978 (65.2%) | 521 (34.8%) |
| 18 to 19 Year Olds | 293 (56.0%) | 230 (44.0%) |
| 20 to 24 Year Olds | 293 (56.6%) | 225 (43.4%) |
| 25 to 34 Year Olds | 289 (41.8%) | 403 (58.2%) |
| 35 Years and over | 458 (79.2%) | 120 (20.8%) |
| Total | 4,176 (46.3%) | 4,844 (53.7%) |
Educational Attainment by Field of Study in Pikesville
Business (2,207 | 14.2%), education (1,817 | 11.7%), science & technology (1,499 | 9.6%), social sciences (1,413 | 9.1%), and liberal arts & history (1,366 | 8.8%) are the most common fields of study among 15,550 individuals in Pikesville who have obtained a bachelor's degree or higher.
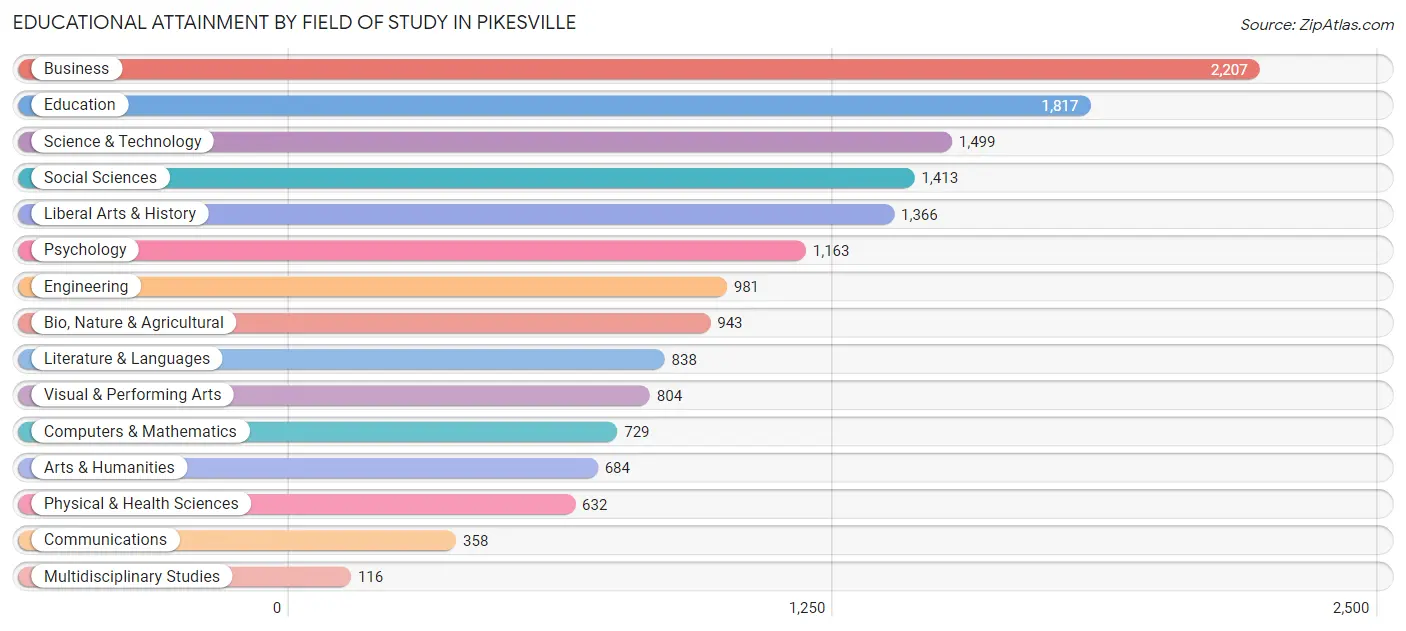
| Field of Study | # Graduates | % Graduates |
| Computers & Mathematics | 729 | 4.7% |
| Bio, Nature & Agricultural | 943 | 6.1% |
| Physical & Health Sciences | 632 | 4.1% |
| Psychology | 1,163 | 7.5% |
| Social Sciences | 1,413 | 9.1% |
| Engineering | 981 | 6.3% |
| Multidisciplinary Studies | 116 | 0.7% |
| Science & Technology | 1,499 | 9.6% |
| Business | 2,207 | 14.2% |
| Education | 1,817 | 11.7% |
| Literature & Languages | 838 | 5.4% |
| Liberal Arts & History | 1,366 | 8.8% |
| Visual & Performing Arts | 804 | 5.2% |
| Communications | 358 | 2.3% |
| Arts & Humanities | 684 | 4.4% |
| Total | 15,550 | 100.0% |
Transportation & Commute in Pikesville
Vehicle Availability by Sex in Pikesville
The most prevalent vehicle ownership categories in Pikesville are males with 2 vehicles (4,028, accounting for 52.7%) and females with 2 vehicles (3,999, making up 49.7%).
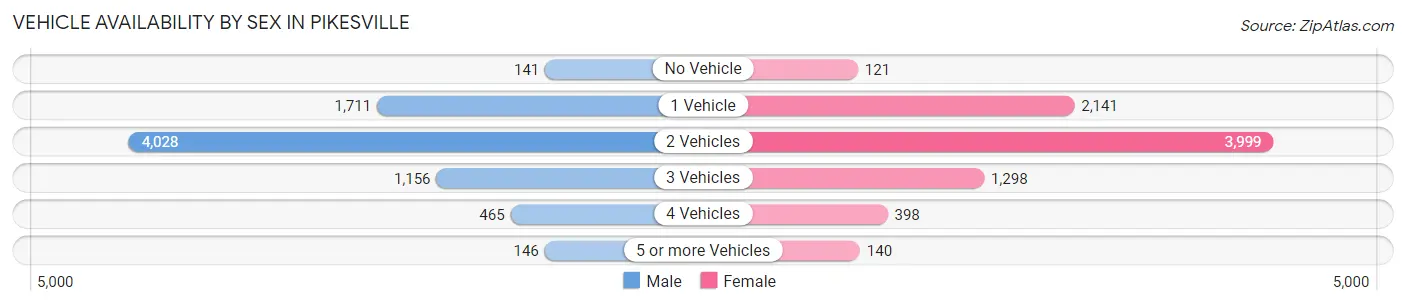
| Vehicles Available | Male | Female |
| No Vehicle | 141 (1.8%) | 121 (1.5%) |
| 1 Vehicle | 1,711 (22.4%) | 2,141 (26.4%) |
| 2 Vehicles | 4,028 (52.7%) | 3,999 (49.4%) |
| 3 Vehicles | 1,156 (15.1%) | 1,298 (16.0%) |
| 4 Vehicles | 465 (6.1%) | 398 (4.9%) |
| 5 or more Vehicles | 146 (1.9%) | 140 (1.7%) |
| Total | 7,647 (100.0%) | 8,097 (100.0%) |
Commute Time in Pikesville
The most frequently occuring commute durations in Pikesville are 15 to 19 minutes (2,335 commuters, 18.4%), 20 to 24 minutes (2,073 commuters, 16.3%), and 30 to 34 minutes (1,814 commuters, 14.3%).
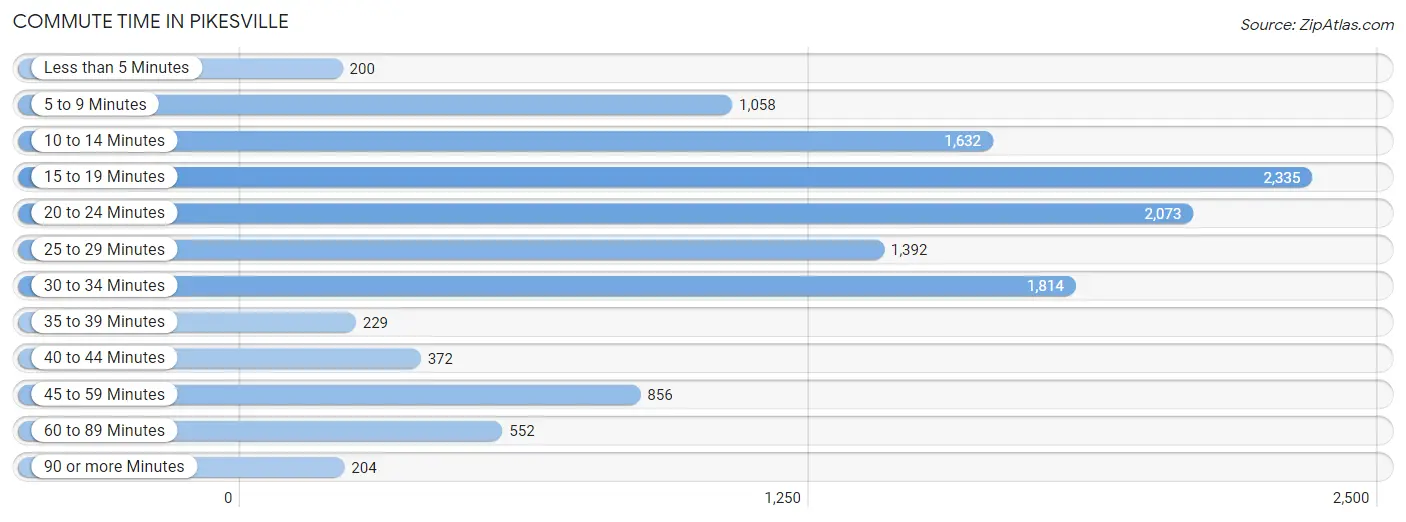
| Commute Time | # Commuters | % Commuters |
| Less than 5 Minutes | 200 | 1.6% |
| 5 to 9 Minutes | 1,058 | 8.3% |
| 10 to 14 Minutes | 1,632 | 12.8% |
| 15 to 19 Minutes | 2,335 | 18.4% |
| 20 to 24 Minutes | 2,073 | 16.3% |
| 25 to 29 Minutes | 1,392 | 11.0% |
| 30 to 34 Minutes | 1,814 | 14.3% |
| 35 to 39 Minutes | 229 | 1.8% |
| 40 to 44 Minutes | 372 | 2.9% |
| 45 to 59 Minutes | 856 | 6.7% |
| 60 to 89 Minutes | 552 | 4.3% |
| 90 or more Minutes | 204 | 1.6% |
Commute Time by Sex in Pikesville
The most common commute times in Pikesville are 20 to 24 minutes (1,130 commuters, 17.9%) for males and 15 to 19 minutes (1,341 commuters, 20.9%) for females.
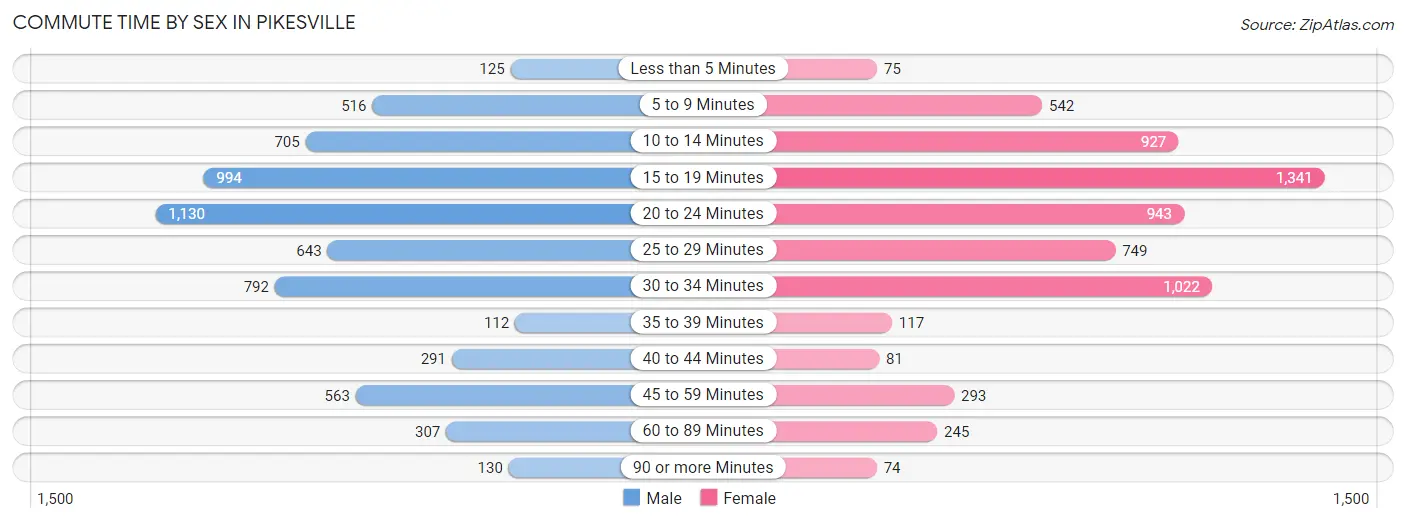
| Commute Time | Male | Female |
| Less than 5 Minutes | 125 (2.0%) | 75 (1.2%) |
| 5 to 9 Minutes | 516 (8.2%) | 542 (8.5%) |
| 10 to 14 Minutes | 705 (11.2%) | 927 (14.5%) |
| 15 to 19 Minutes | 994 (15.8%) | 1,341 (20.9%) |
| 20 to 24 Minutes | 1,130 (17.9%) | 943 (14.7%) |
| 25 to 29 Minutes | 643 (10.2%) | 749 (11.7%) |
| 30 to 34 Minutes | 792 (12.6%) | 1,022 (16.0%) |
| 35 to 39 Minutes | 112 (1.8%) | 117 (1.8%) |
| 40 to 44 Minutes | 291 (4.6%) | 81 (1.3%) |
| 45 to 59 Minutes | 563 (8.9%) | 293 (4.6%) |
| 60 to 89 Minutes | 307 (4.9%) | 245 (3.8%) |
| 90 or more Minutes | 130 (2.1%) | 74 (1.1%) |
Time of Departure to Work by Sex in Pikesville
The most frequent times of departure to work in Pikesville are 8:00 AM to 8:29 AM (1,002, 15.9%) for males and 8:00 AM to 8:29 AM (997, 15.6%) for females.
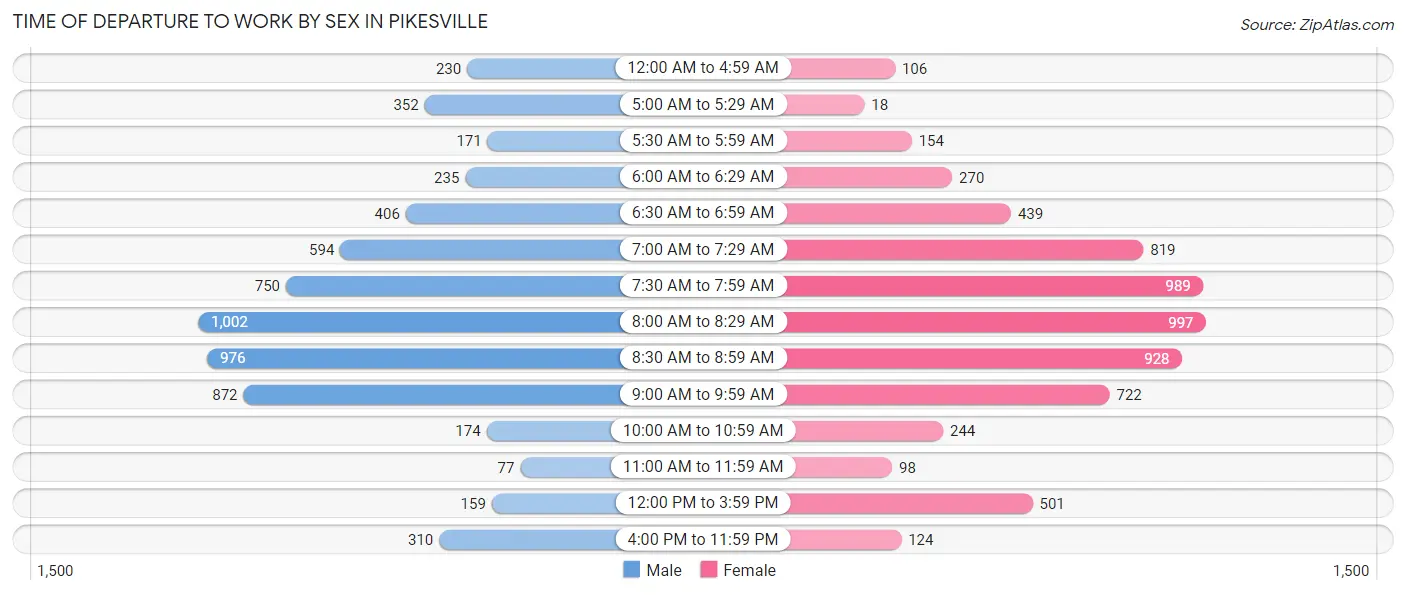
| Time of Departure | Male | Female |
| 12:00 AM to 4:59 AM | 230 (3.6%) | 106 (1.7%) |
| 5:00 AM to 5:29 AM | 352 (5.6%) | 18 (0.3%) |
| 5:30 AM to 5:59 AM | 171 (2.7%) | 154 (2.4%) |
| 6:00 AM to 6:29 AM | 235 (3.7%) | 270 (4.2%) |
| 6:30 AM to 6:59 AM | 406 (6.4%) | 439 (6.9%) |
| 7:00 AM to 7:29 AM | 594 (9.4%) | 819 (12.8%) |
| 7:30 AM to 7:59 AM | 750 (11.9%) | 989 (15.4%) |
| 8:00 AM to 8:29 AM | 1,002 (15.9%) | 997 (15.6%) |
| 8:30 AM to 8:59 AM | 976 (15.5%) | 928 (14.5%) |
| 9:00 AM to 9:59 AM | 872 (13.8%) | 722 (11.3%) |
| 10:00 AM to 10:59 AM | 174 (2.8%) | 244 (3.8%) |
| 11:00 AM to 11:59 AM | 77 (1.2%) | 98 (1.5%) |
| 12:00 PM to 3:59 PM | 159 (2.5%) | 501 (7.8%) |
| 4:00 PM to 11:59 PM | 310 (4.9%) | 124 (1.9%) |
| Total | 6,308 (100.0%) | 6,409 (100.0%) |
Housing Occupancy in Pikesville
Occupancy by Ownership in Pikesville
Of the total 13,681 dwellings in Pikesville, owner-occupied units account for 9,326 (68.2%), while renter-occupied units make up 4,355 (31.8%).
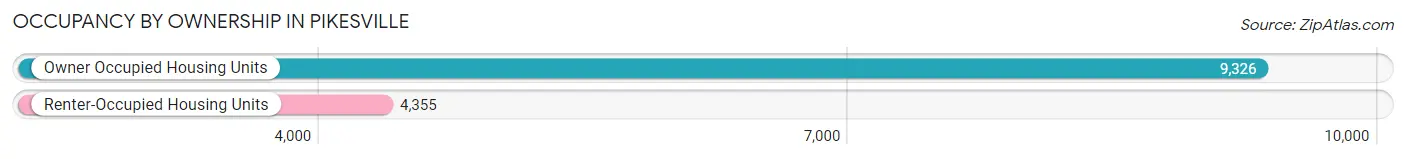
| Occupancy | # Housing Units | % Housing Units |
| Owner Occupied Housing Units | 9,326 | 68.2% |
| Renter-Occupied Housing Units | 4,355 | 31.8% |
| Total Occupied Housing Units | 13,681 | 100.0% |
Occupancy by Household Size in Pikesville
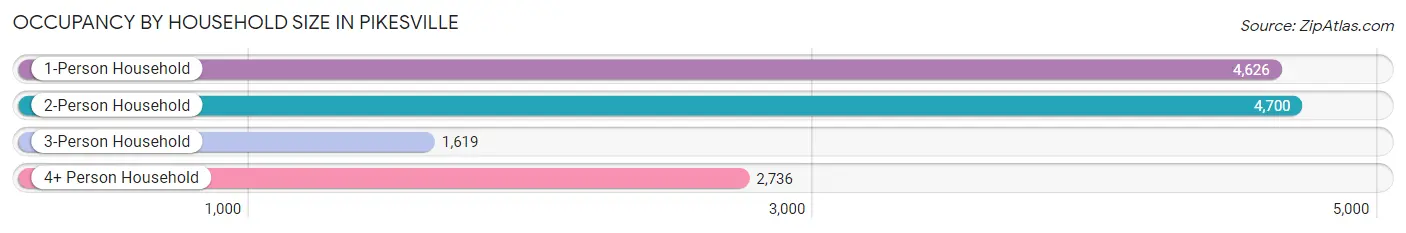
| Household Size | # Housing Units | % Housing Units |
| 1-Person Household | 4,626 | 33.8% |
| 2-Person Household | 4,700 | 34.4% |
| 3-Person Household | 1,619 | 11.8% |
| 4+ Person Household | 2,736 | 20.0% |
| Total Housing Units | 13,681 | 100.0% |
Occupancy by Ownership by Household Size in Pikesville
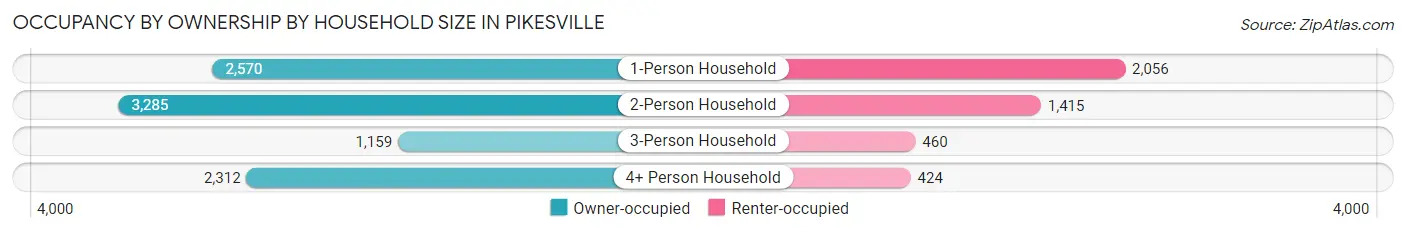
| Household Size | Owner-occupied | Renter-occupied |
| 1-Person Household | 2,570 (55.6%) | 2,056 (44.4%) |
| 2-Person Household | 3,285 (69.9%) | 1,415 (30.1%) |
| 3-Person Household | 1,159 (71.6%) | 460 (28.4%) |
| 4+ Person Household | 2,312 (84.5%) | 424 (15.5%) |
| Total Housing Units | 9,326 (68.2%) | 4,355 (31.8%) |
Occupancy by Educational Attainment in Pikesville
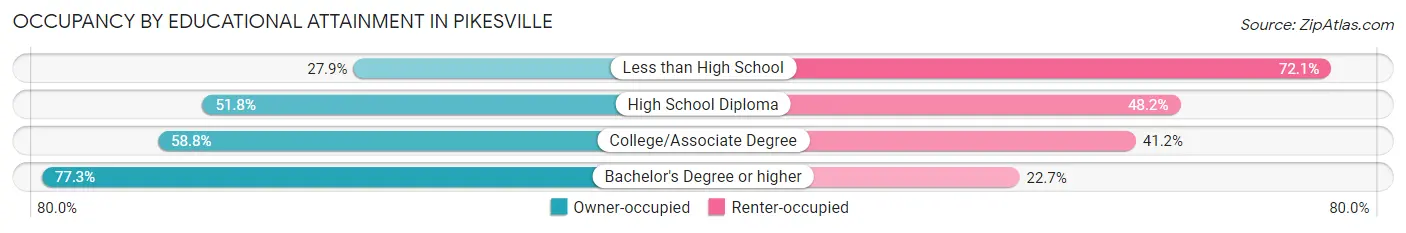
| Household Size | Owner-occupied | Renter-occupied |
| Less than High School | 107 (27.9%) | 277 (72.1%) |
| High School Diploma | 860 (51.8%) | 801 (48.2%) |
| College/Associate Degree | 2,010 (58.8%) | 1,408 (41.2%) |
| Bachelor's Degree or higher | 6,349 (77.3%) | 1,869 (22.7%) |
Occupancy by Age of Householder in Pikesville
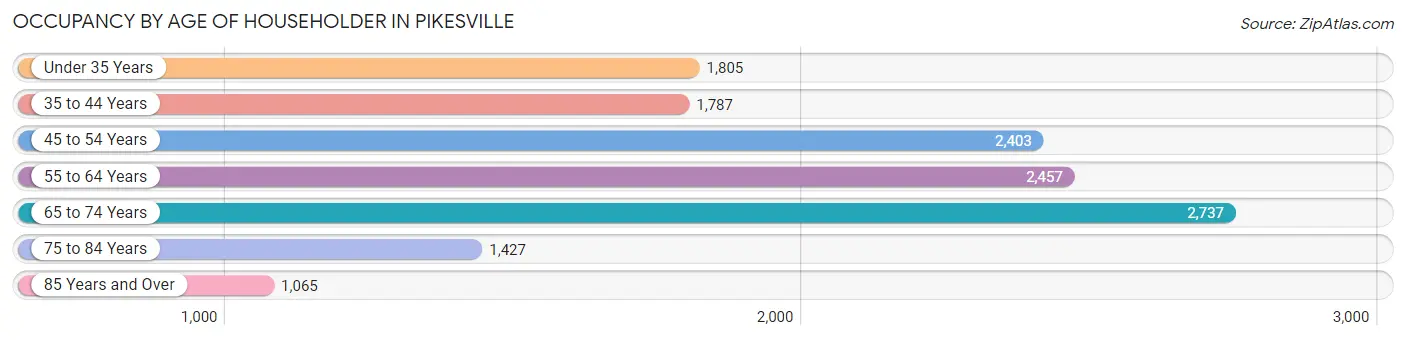
| Age Bracket | # Households | % Households |
| Under 35 Years | 1,805 | 13.2% |
| 35 to 44 Years | 1,787 | 13.1% |
| 45 to 54 Years | 2,403 | 17.6% |
| 55 to 64 Years | 2,457 | 18.0% |
| 65 to 74 Years | 2,737 | 20.0% |
| 75 to 84 Years | 1,427 | 10.4% |
| 85 Years and Over | 1,065 | 7.8% |
| Total | 13,681 | 100.0% |
Housing Finances in Pikesville
Median Income by Occupancy in Pikesville
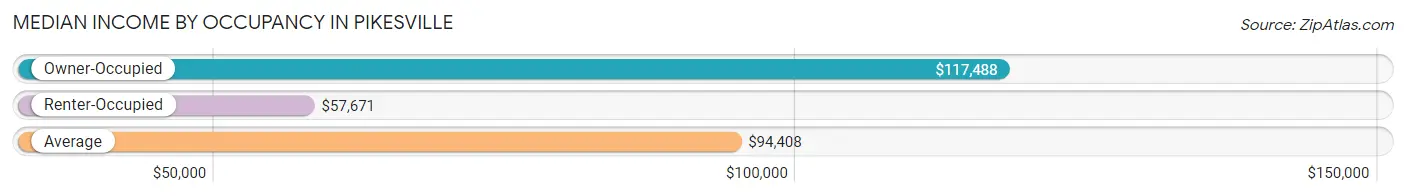
| Occupancy Type | # Households | Median Income |
| Owner-Occupied | 9,326 (68.2%) | $117,488 |
| Renter-Occupied | 4,355 (31.8%) | $57,671 |
| Average | 13,681 (100.0%) | $94,408 |
Occupancy by Householder Income Bracket in Pikesville
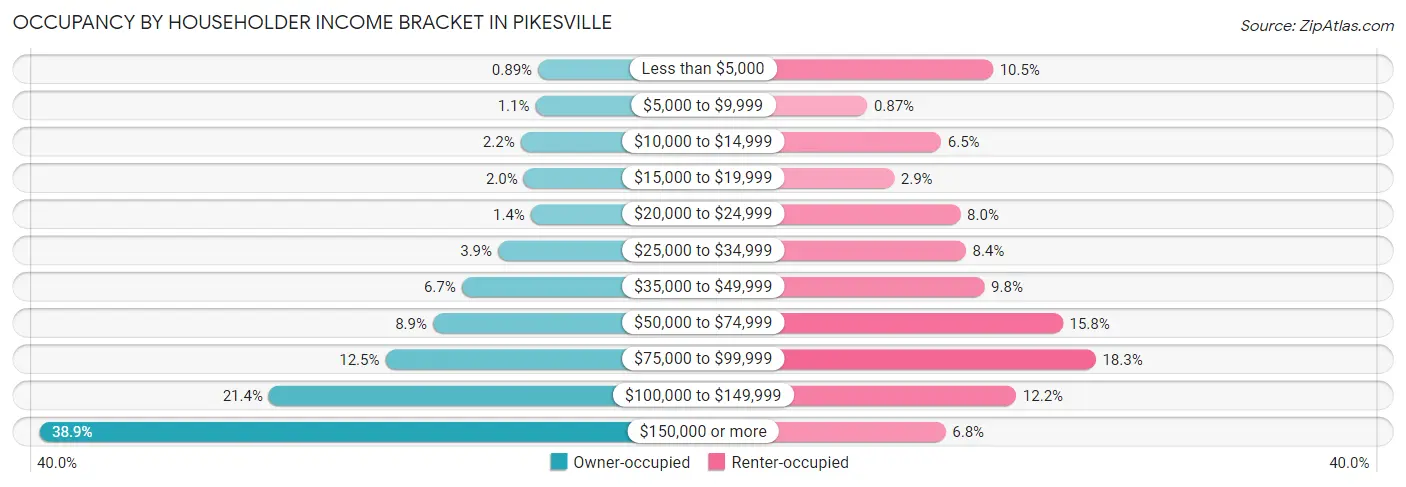
| Income Bracket | Owner-occupied | Renter-occupied |
| Less than $5,000 | 83 (0.9%) | 455 (10.4%) |
| $5,000 to $9,999 | 102 (1.1%) | 38 (0.9%) |
| $10,000 to $14,999 | 207 (2.2%) | 283 (6.5%) |
| $15,000 to $19,999 | 185 (2.0%) | 127 (2.9%) |
| $20,000 to $24,999 | 134 (1.4%) | 347 (8.0%) |
| $25,000 to $34,999 | 367 (3.9%) | 365 (8.4%) |
| $35,000 to $49,999 | 626 (6.7%) | 427 (9.8%) |
| $50,000 to $74,999 | 830 (8.9%) | 687 (15.8%) |
| $75,000 to $99,999 | 1,168 (12.5%) | 796 (18.3%) |
| $100,000 to $149,999 | 1,996 (21.4%) | 532 (12.2%) |
| $150,000 or more | 3,628 (38.9%) | 298 (6.8%) |
| Total | 9,326 (100.0%) | 4,355 (100.0%) |
Monthly Housing Cost Tiers in Pikesville
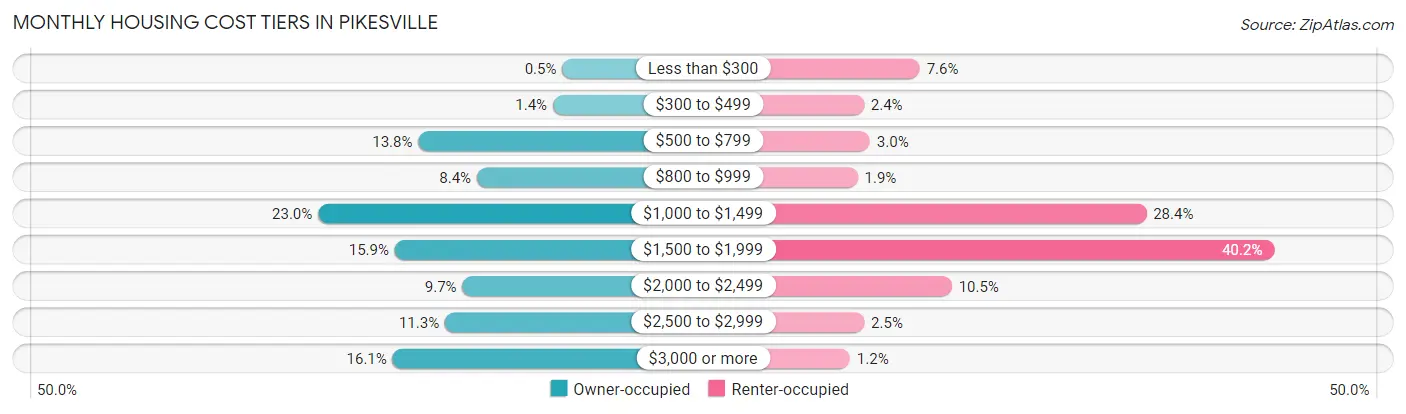
| Monthly Cost | Owner-occupied | Renter-occupied |
| Less than $300 | 47 (0.5%) | 330 (7.6%) |
| $300 to $499 | 127 (1.4%) | 106 (2.4%) |
| $500 to $799 | 1,283 (13.8%) | 130 (3.0%) |
| $800 to $999 | 780 (8.4%) | 81 (1.9%) |
| $1,000 to $1,499 | 2,143 (23.0%) | 1,238 (28.4%) |
| $1,500 to $1,999 | 1,485 (15.9%) | 1,751 (40.2%) |
| $2,000 to $2,499 | 904 (9.7%) | 458 (10.5%) |
| $2,500 to $2,999 | 1,054 (11.3%) | 107 (2.5%) |
| $3,000 or more | 1,503 (16.1%) | 50 (1.1%) |
| Total | 9,326 (100.0%) | 4,355 (100.0%) |
Physical Housing Characteristics in Pikesville
Housing Structures in Pikesville
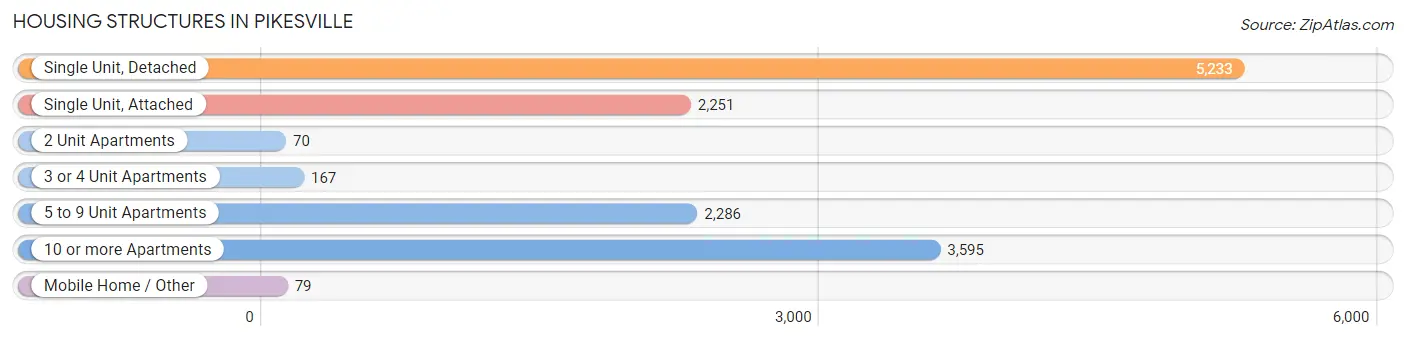
| Structure Type | # Housing Units | % Housing Units |
| Single Unit, Detached | 5,233 | 38.3% |
| Single Unit, Attached | 2,251 | 16.5% |
| 2 Unit Apartments | 70 | 0.5% |
| 3 or 4 Unit Apartments | 167 | 1.2% |
| 5 to 9 Unit Apartments | 2,286 | 16.7% |
| 10 or more Apartments | 3,595 | 26.3% |
| Mobile Home / Other | 79 | 0.6% |
| Total | 13,681 | 100.0% |
Housing Structures by Occupancy in Pikesville
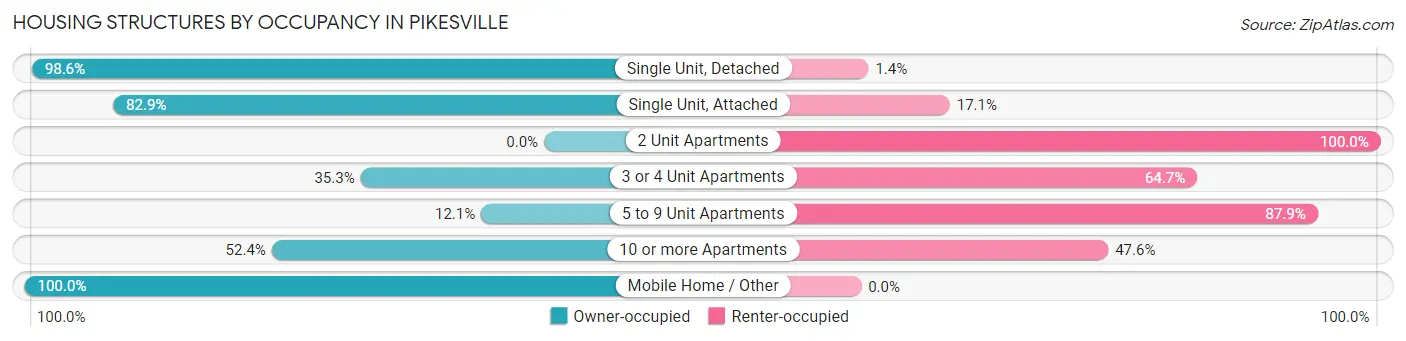
| Structure Type | Owner-occupied | Renter-occupied |
| Single Unit, Detached | 5,159 (98.6%) | 74 (1.4%) |
| Single Unit, Attached | 1,867 (82.9%) | 384 (17.1%) |
| 2 Unit Apartments | 0 (0.0%) | 70 (100.0%) |
| 3 or 4 Unit Apartments | 59 (35.3%) | 108 (64.7%) |
| 5 to 9 Unit Apartments | 277 (12.1%) | 2,009 (87.9%) |
| 10 or more Apartments | 1,885 (52.4%) | 1,710 (47.6%) |
| Mobile Home / Other | 79 (100.0%) | 0 (0.0%) |
| Total | 9,326 (68.2%) | 4,355 (31.8%) |
Housing Structures by Number of Rooms in Pikesville
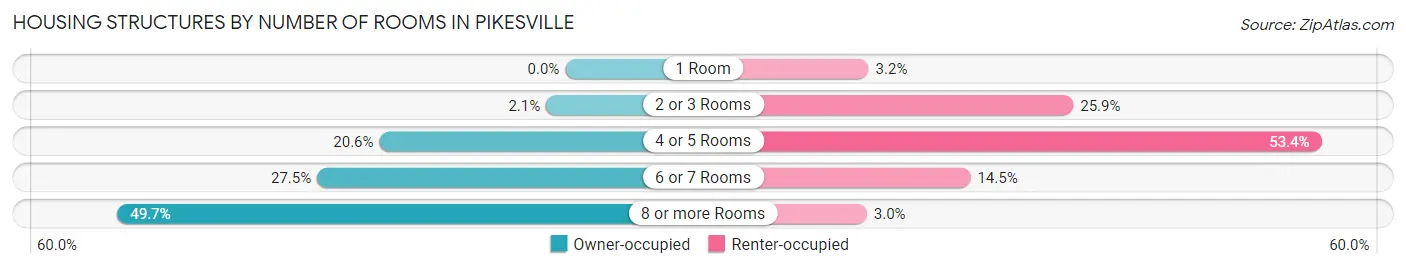
| Number of Rooms | Owner-occupied | Renter-occupied |
| 1 Room | 0 (0.0%) | 139 (3.2%) |
| 2 or 3 Rooms | 199 (2.1%) | 1,128 (25.9%) |
| 4 or 5 Rooms | 1,924 (20.6%) | 2,327 (53.4%) |
| 6 or 7 Rooms | 2,568 (27.5%) | 631 (14.5%) |
| 8 or more Rooms | 4,635 (49.7%) | 130 (3.0%) |
| Total | 9,326 (100.0%) | 4,355 (100.0%) |
Housing Structure by Heating Type in Pikesville
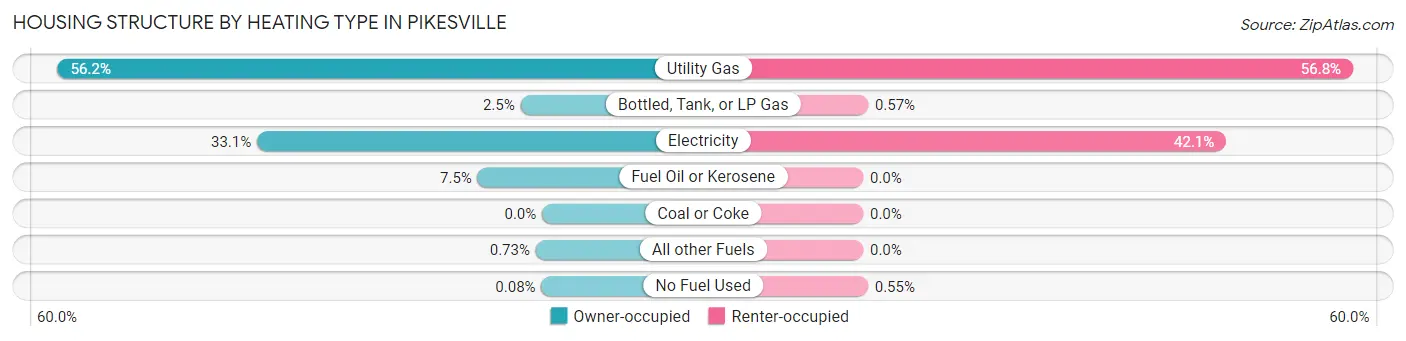
| Heating Type | Owner-occupied | Renter-occupied |
| Utility Gas | 5,239 (56.2%) | 2,473 (56.8%) |
| Bottled, Tank, or LP Gas | 233 (2.5%) | 25 (0.6%) |
| Electricity | 3,082 (33.1%) | 1,833 (42.1%) |
| Fuel Oil or Kerosene | 697 (7.5%) | 0 (0.0%) |
| Coal or Coke | 0 (0.0%) | 0 (0.0%) |
| All other Fuels | 68 (0.7%) | 0 (0.0%) |
| No Fuel Used | 7 (0.1%) | 24 (0.5%) |
| Total | 9,326 (100.0%) | 4,355 (100.0%) |
Household Vehicle Usage in Pikesville
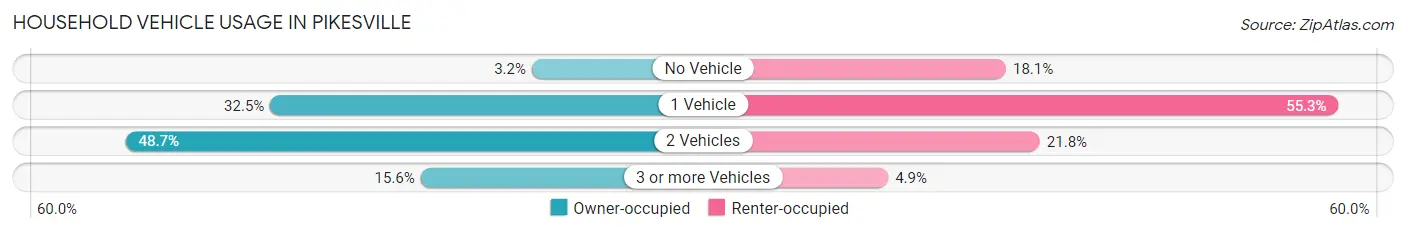
| Vehicles per Household | Owner-occupied | Renter-occupied |
| No Vehicle | 297 (3.2%) | 786 (18.0%) |
| 1 Vehicle | 3,030 (32.5%) | 2,407 (55.3%) |
| 2 Vehicles | 4,540 (48.7%) | 951 (21.8%) |
| 3 or more Vehicles | 1,459 (15.6%) | 211 (4.9%) |
| Total | 9,326 (100.0%) | 4,355 (100.0%) |
Real Estate & Mortgages in Pikesville
Real Estate and Mortgage Overview in Pikesville
| Characteristic | Without Mortgage | With Mortgage |
| Housing Units | 3,931 | 5,395 |
| Median Property Value | $374,000 | $411,900 |
| Median Household Income | $104,640 | $2,345 |
| Monthly Housing Costs | $995 | $1,431 |
| Real Estate Taxes | $4,333 | $81 |
Property Value by Mortgage Status in Pikesville
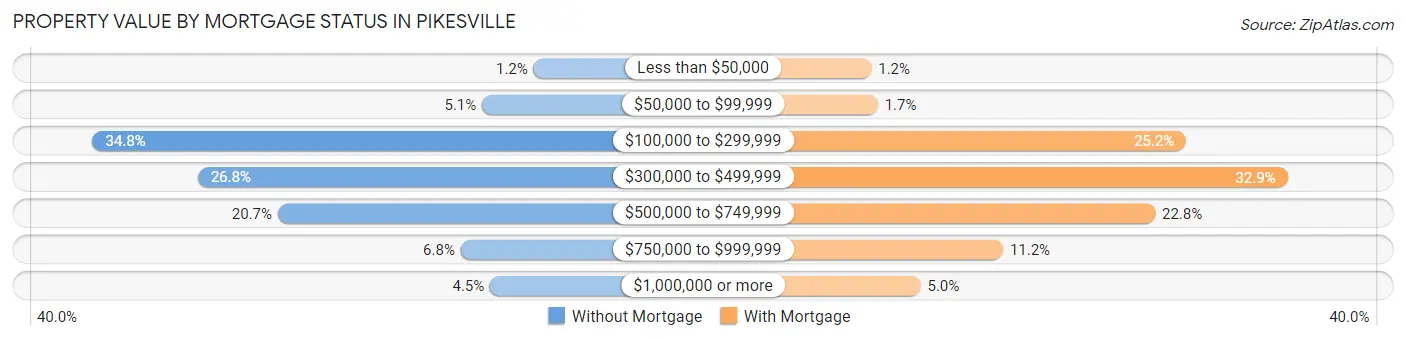
| Property Value | Without Mortgage | With Mortgage |
| Less than $50,000 | 48 (1.2%) | 65 (1.2%) |
| $50,000 to $99,999 | 202 (5.1%) | 91 (1.7%) |
| $100,000 to $299,999 | 1,369 (34.8%) | 1,359 (25.2%) |
| $300,000 to $499,999 | 1,054 (26.8%) | 1,776 (32.9%) |
| $500,000 to $749,999 | 814 (20.7%) | 1,231 (22.8%) |
| $750,000 to $999,999 | 266 (6.8%) | 606 (11.2%) |
| $1,000,000 or more | 178 (4.5%) | 267 (5.0%) |
| Total | 3,931 (100.0%) | 5,395 (100.0%) |
Household Income by Mortgage Status in Pikesville
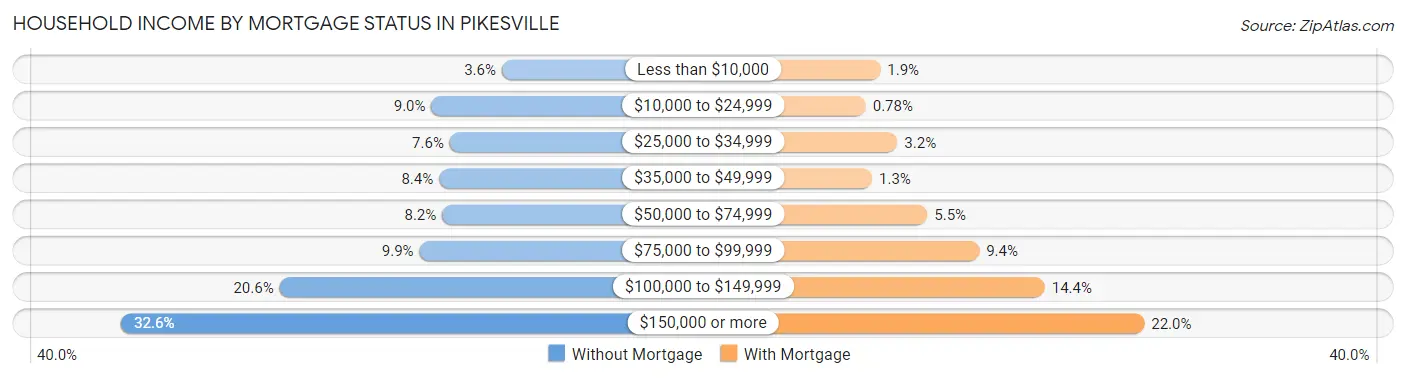
| Household Income | Without Mortgage | With Mortgage |
| Less than $10,000 | 143 (3.6%) | 102 (1.9%) |
| $10,000 to $24,999 | 354 (9.0%) | 42 (0.8%) |
| $25,000 to $34,999 | 299 (7.6%) | 172 (3.2%) |
| $35,000 to $49,999 | 331 (8.4%) | 68 (1.3%) |
| $50,000 to $74,999 | 322 (8.2%) | 295 (5.5%) |
| $75,000 to $99,999 | 390 (9.9%) | 508 (9.4%) |
| $100,000 to $149,999 | 809 (20.6%) | 778 (14.4%) |
| $150,000 or more | 1,283 (32.6%) | 1,187 (22.0%) |
| Total | 3,931 (100.0%) | 5,395 (100.0%) |
Property Value to Household Income Ratio in Pikesville
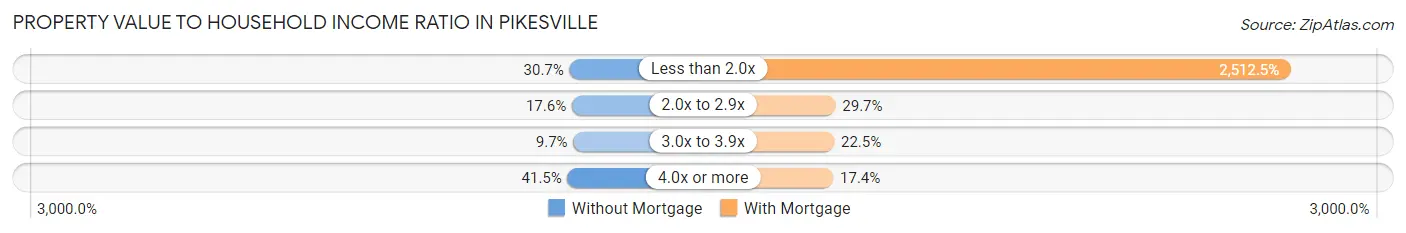
| Value-to-Income Ratio | Without Mortgage | With Mortgage |
| Less than 2.0x | 1,206 (30.7%) | 135,549 (2,512.5%) |
| 2.0x to 2.9x | 693 (17.6%) | 1,604 (29.7%) |
| 3.0x to 3.9x | 380 (9.7%) | 1,212 (22.5%) |
| 4.0x or more | 1,630 (41.5%) | 937 (17.4%) |
| Total | 3,931 (100.0%) | 5,395 (100.0%) |
Real Estate Taxes by Mortgage Status in Pikesville
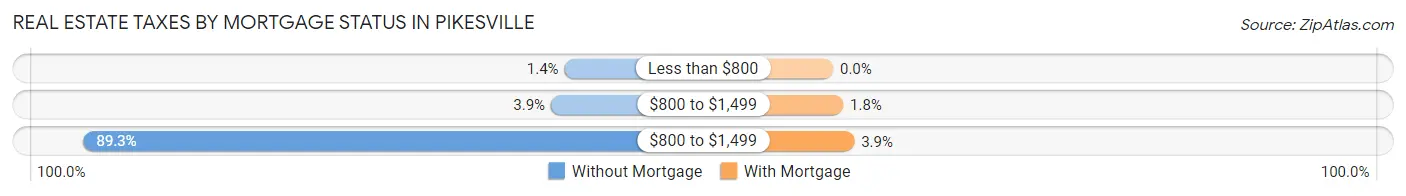
| Property Taxes | Without Mortgage | With Mortgage |
| Less than $800 | 55 (1.4%) | 0 (0.0%) |
| $800 to $1,499 | 152 (3.9%) | 99 (1.8%) |
| $800 to $1,499 | 3,509 (89.3%) | 209 (3.9%) |
| Total | 3,931 (100.0%) | 5,395 (100.0%) |
Health & Disability in Pikesville
Health Insurance Coverage by Age in Pikesville
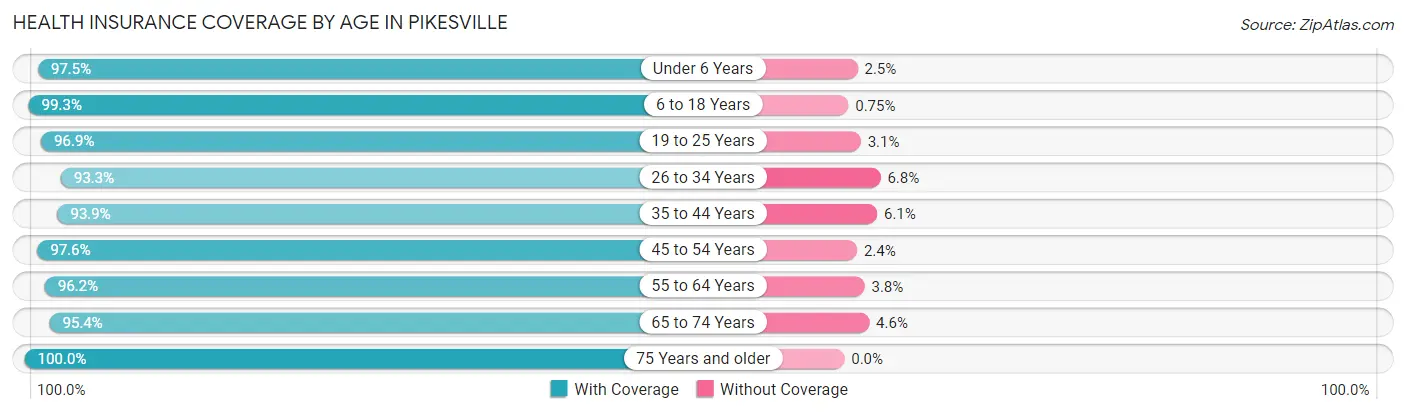
| Age Bracket | With Coverage | Without Coverage |
| Under 6 Years | 2,294 (97.5%) | 58 (2.5%) |
| 6 to 18 Years | 6,503 (99.3%) | 49 (0.7%) |
| 19 to 25 Years | 1,585 (96.9%) | 50 (3.1%) |
| 26 to 34 Years | 3,811 (93.2%) | 276 (6.8%) |
| 35 to 44 Years | 3,257 (93.9%) | 212 (6.1%) |
| 45 to 54 Years | 3,921 (97.6%) | 95 (2.4%) |
| 55 to 64 Years | 3,991 (96.2%) | 157 (3.8%) |
| 65 to 74 Years | 3,739 (95.4%) | 182 (4.6%) |
| 75 Years and older | 3,622 (100.0%) | 0 (0.0%) |
| Total | 32,723 (96.8%) | 1,079 (3.2%) |
Health Insurance Coverage by Citizenship Status in Pikesville
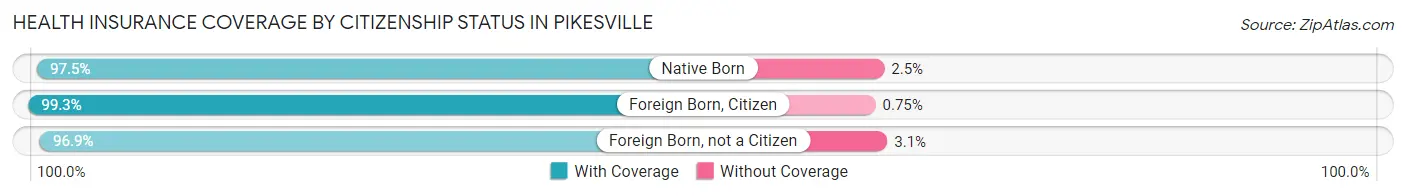
| Citizenship Status | With Coverage | Without Coverage |
| Native Born | 2,294 (97.5%) | 58 (2.5%) |
| Foreign Born, Citizen | 6,503 (99.3%) | 49 (0.7%) |
| Foreign Born, not a Citizen | 1,585 (96.9%) | 50 (3.1%) |
Health Insurance Coverage by Household Income in Pikesville
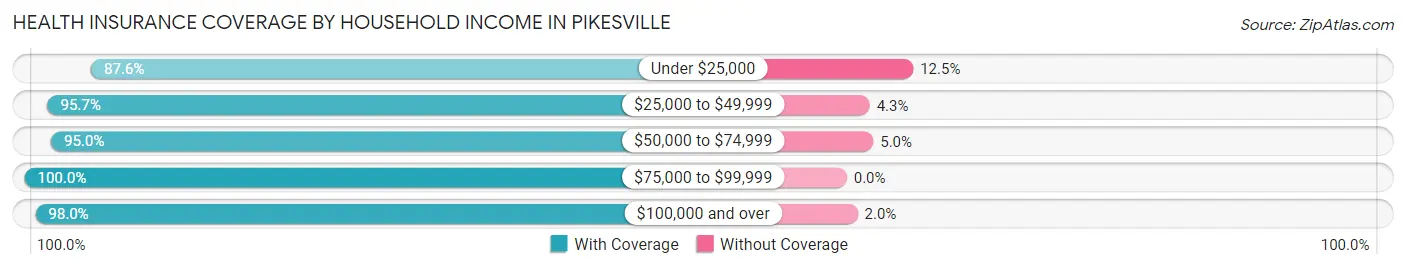
| Household Income | With Coverage | Without Coverage |
| Under $25,000 | 2,643 (87.5%) | 376 (12.4%) |
| $25,000 to $49,999 | 3,116 (95.7%) | 140 (4.3%) |
| $50,000 to $74,999 | 3,049 (95.0%) | 159 (5.0%) |
| $75,000 to $99,999 | 4,232 (100.0%) | 0 (0.0%) |
| $100,000 and over | 19,537 (98.0%) | 404 (2.0%) |
Public vs Private Health Insurance Coverage by Age in Pikesville
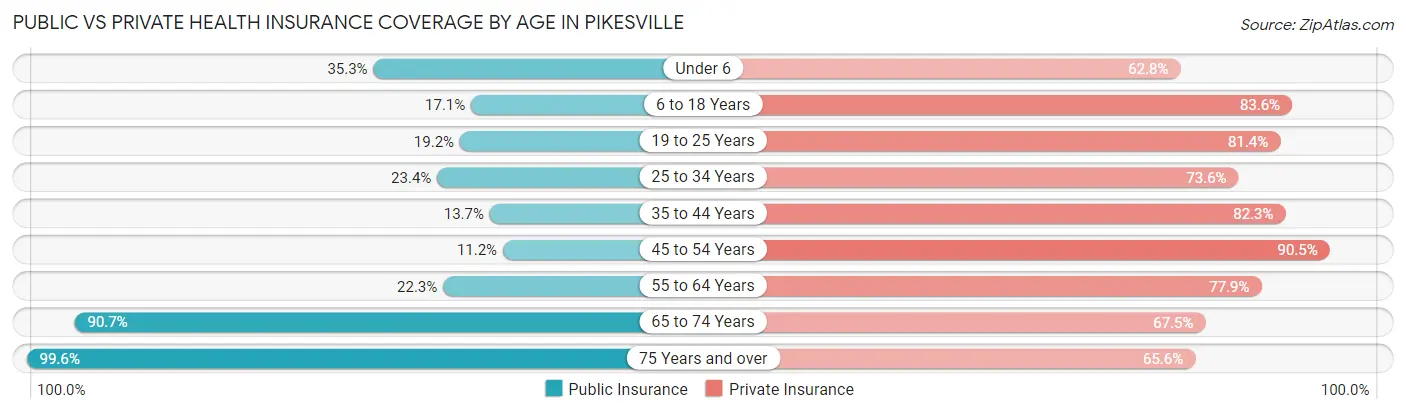
| Age Bracket | Public Insurance | Private Insurance |
| Under 6 | 829 (35.2%) | 1,478 (62.8%) |
| 6 to 18 Years | 1,122 (17.1%) | 5,474 (83.6%) |
| 19 to 25 Years | 314 (19.2%) | 1,330 (81.4%) |
| 25 to 34 Years | 957 (23.4%) | 3,009 (73.6%) |
| 35 to 44 Years | 474 (13.7%) | 2,856 (82.3%) |
| 45 to 54 Years | 450 (11.2%) | 3,636 (90.5%) |
| 55 to 64 Years | 926 (22.3%) | 3,230 (77.9%) |
| 65 to 74 Years | 3,558 (90.7%) | 2,646 (67.5%) |
| 75 Years and over | 3,609 (99.6%) | 2,375 (65.6%) |
| Total | 12,239 (36.2%) | 26,034 (77.0%) |
Disability Status by Sex by Age in Pikesville
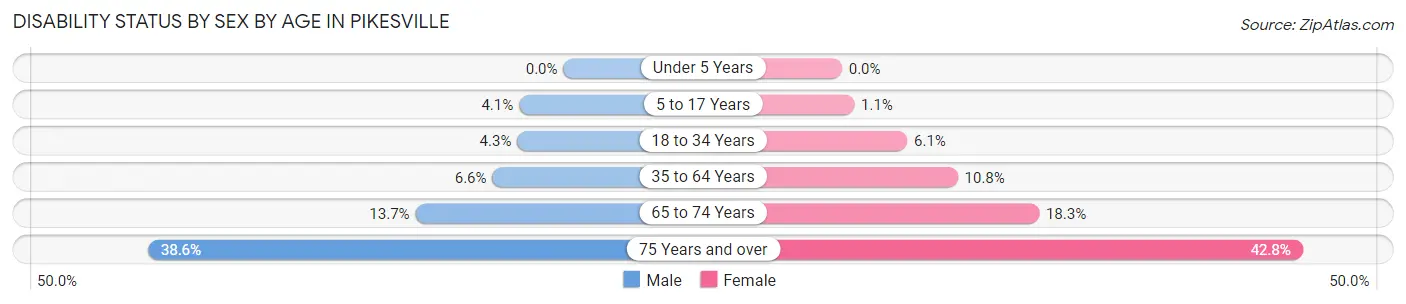
| Age Bracket | Male | Female |
| Under 5 Years | 0 (0.0%) | 0 (0.0%) |
| 5 to 17 Years | 132 (4.1%) | 38 (1.1%) |
| 18 to 34 Years | 127 (4.3%) | 193 (6.1%) |
| 35 to 64 Years | 360 (6.6%) | 663 (10.7%) |
| 65 to 74 Years | 233 (13.7%) | 407 (18.3%) |
| 75 Years and over | 578 (38.6%) | 908 (42.8%) |
Disability Class by Sex by Age in Pikesville
Disability Class: Hearing Difficulty
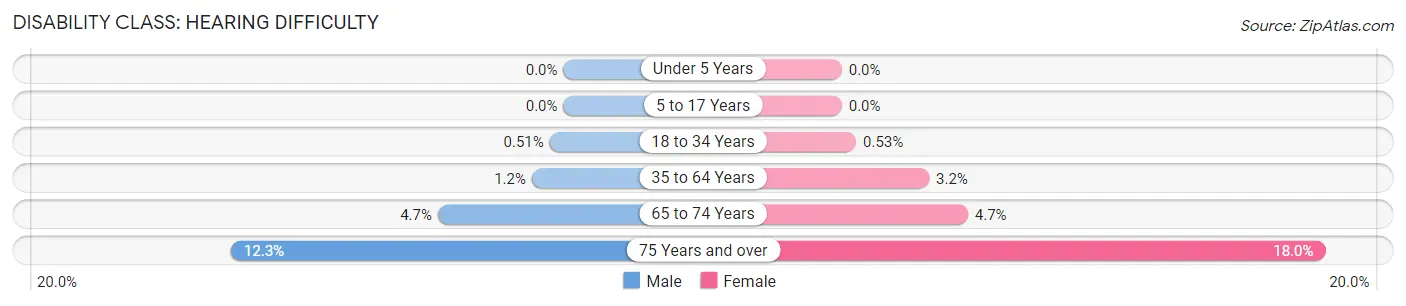
| Age Bracket | Male | Female |
| Under 5 Years | 0 (0.0%) | 0 (0.0%) |
| 5 to 17 Years | 0 (0.0%) | 0 (0.0%) |
| 18 to 34 Years | 15 (0.5%) | 17 (0.5%) |
| 35 to 64 Years | 64 (1.2%) | 200 (3.2%) |
| 65 to 74 Years | 79 (4.7%) | 104 (4.7%) |
| 75 Years and over | 185 (12.3%) | 381 (17.9%) |
Disability Class: Vision Difficulty
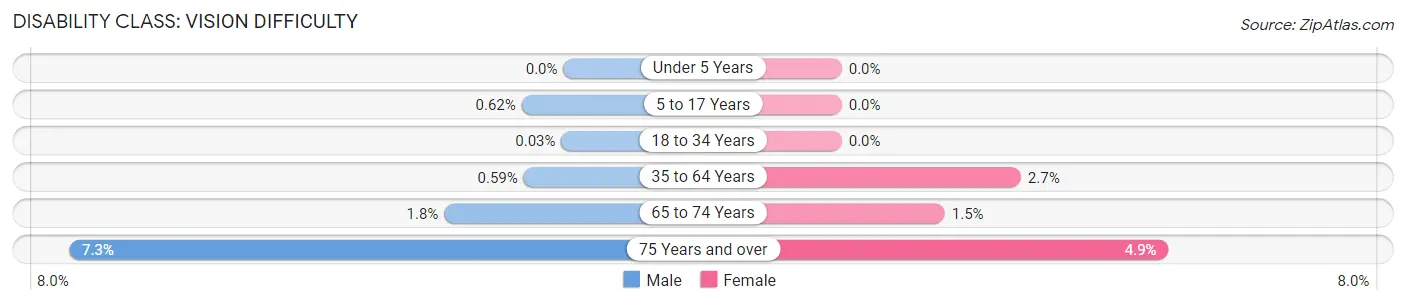
| Age Bracket | Male | Female |
| Under 5 Years | 0 (0.0%) | 0 (0.0%) |
| 5 to 17 Years | 20 (0.6%) | 0 (0.0%) |
| 18 to 34 Years | 1 (0.0%) | 0 (0.0%) |
| 35 to 64 Years | 32 (0.6%) | 164 (2.7%) |
| 65 to 74 Years | 30 (1.8%) | 34 (1.5%) |
| 75 Years and over | 110 (7.3%) | 103 (4.9%) |
Disability Class: Cognitive Difficulty
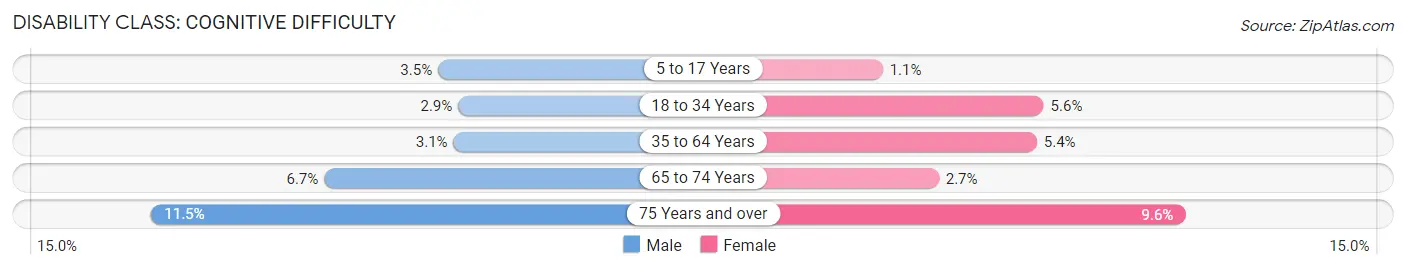
| Age Bracket | Male | Female |
| 5 to 17 Years | 112 (3.5%) | 38 (1.1%) |
| 18 to 34 Years | 87 (2.9%) | 179 (5.6%) |
| 35 to 64 Years | 167 (3.1%) | 335 (5.4%) |
| 65 to 74 Years | 113 (6.7%) | 60 (2.7%) |
| 75 Years and over | 172 (11.5%) | 203 (9.6%) |
Disability Class: Ambulatory Difficulty
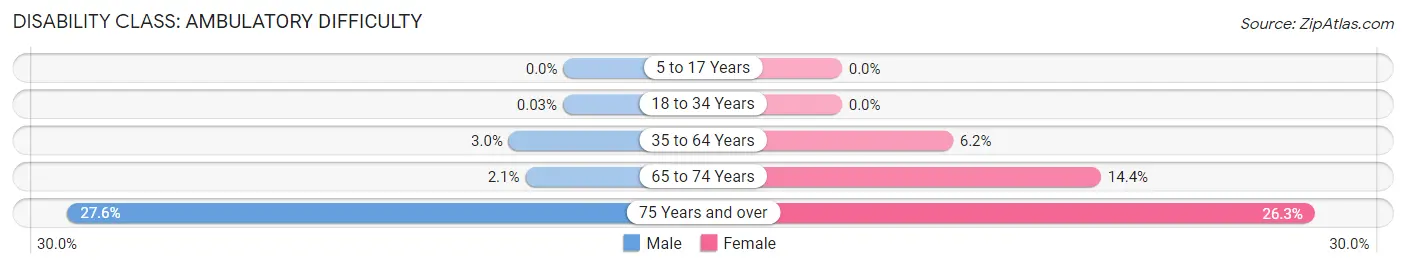
| Age Bracket | Male | Female |
| 5 to 17 Years | 0 (0.0%) | 0 (0.0%) |
| 18 to 34 Years | 1 (0.0%) | 0 (0.0%) |
| 35 to 64 Years | 166 (3.0%) | 381 (6.2%) |
| 65 to 74 Years | 36 (2.1%) | 321 (14.4%) |
| 75 Years and over | 414 (27.6%) | 559 (26.3%) |
Disability Class: Self-Care Difficulty
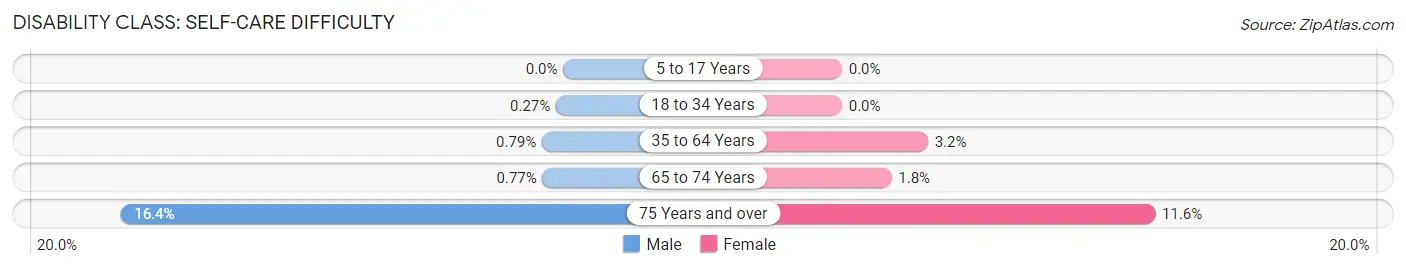
| Age Bracket | Male | Female |
| 5 to 17 Years | 0 (0.0%) | 0 (0.0%) |
| 18 to 34 Years | 8 (0.3%) | 0 (0.0%) |
| 35 to 64 Years | 43 (0.8%) | 197 (3.2%) |
| 65 to 74 Years | 13 (0.8%) | 41 (1.8%) |
| 75 Years and over | 246 (16.4%) | 247 (11.6%) |
Technology Access in Pikesville
Computing Device Access in Pikesville
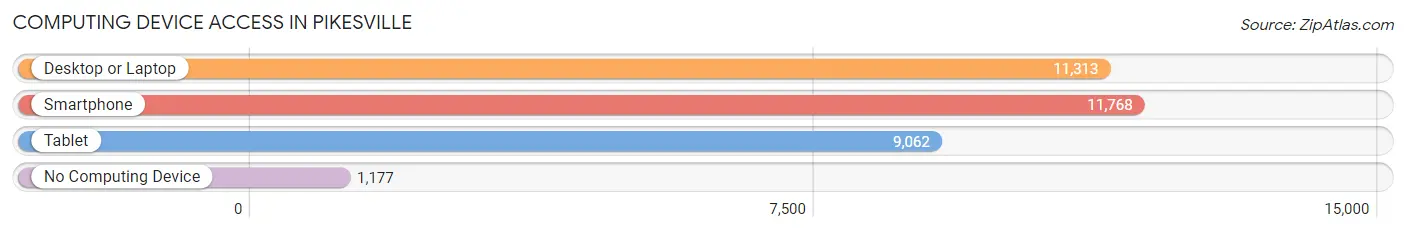
| Device Type | # Households | % Households |
| Desktop or Laptop | 11,313 | 82.7% |
| Smartphone | 11,768 | 86.0% |
| Tablet | 9,062 | 66.2% |
| No Computing Device | 1,177 | 8.6% |
| Total | 13,681 | 100.0% |
Internet Access in Pikesville
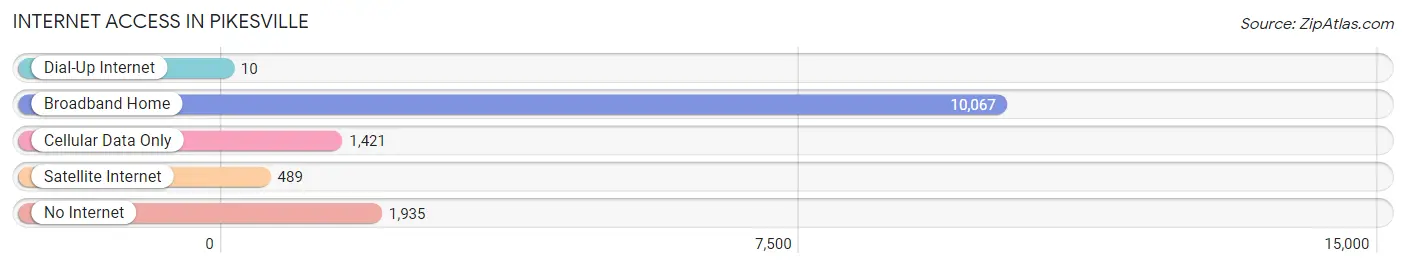
| Internet Type | # Households | % Households |
| Dial-Up Internet | 10 | 0.1% |
| Broadband Home | 10,067 | 73.6% |
| Cellular Data Only | 1,421 | 10.4% |
| Satellite Internet | 489 | 3.6% |
| No Internet | 1,935 | 14.1% |
| Total | 13,681 | 100.0% |
Pikesville Summary
Pikesville is a census-designated place (CDP) located in Baltimore County, Maryland, United States. It is located just northwest of the city of Baltimore and is part of the Baltimore metropolitan area. As of the 2010 census, the population of Pikesville was 30,764.
History
The area now known as Pikesville was first settled in the late 1700s by the Pikes, a family of German immigrants. The family established a farm and a mill on the banks of the nearby Gwynns Falls. The area was known as Pikesville for many years, and the name was officially adopted in 1875 when the post office was established.
In the late 1800s, Pikesville began to grow as a residential suburb of Baltimore. The area was served by the Baltimore and Ohio Railroad, which provided easy access to the city. The area also became home to a number of wealthy families, who built large estates in the area.
In the early 1900s, Pikesville continued to grow as a residential suburb of Baltimore. The area was served by the Baltimore and Ohio Railroad, which provided easy access to the city. The area also became home to a number of wealthy families, who built large estates in the area.
In the mid-1900s, Pikesville began to experience a period of decline. The area was hit hard by the Great Depression and the decline of the railroad industry. The area also experienced a period of racial tension in the 1950s and 1960s, as the area became increasingly integrated.
In the late 1900s, Pikesville began to experience a period of revitalization. The area was designated as an urban renewal area in the 1970s, and the area has since seen a resurgence in population and development.
Geography
Pikesville is located in Baltimore County, Maryland, just northwest of the city of Baltimore. It is bordered to the north by the city of Baltimore, to the east by the city of Towson, to the south by the city of Randallstown, and to the west by the city of Reisterstown.
The area is mostly flat, with an elevation of about 200 feet above sea level. The area is drained by the Gwynns Falls and its tributaries.
Economy
Pikesville is home to a number of businesses and industries. The area is home to a number of retail stores, restaurants, and other businesses. The area is also home to a number of medical facilities, including Sinai Hospital and the University of Maryland Medical Center.
The area is also home to a number of corporate headquarters, including Under Armour, McCormick & Company, and T. Rowe Price.
Demographics
As of the 2010 census, the population of Pikesville was 30,764. The racial makeup of the area was 63.3% White, 28.2% African American, 0.3% Native American, 3.2% Asian, 0.1% Pacific Islander, and 4.9% from other races. Hispanic or Latino of any race were 8.2% of the population.
The median household income in Pikesville was $68,945, and the median family income was $77,845. The per capita income was $35,945. About 8.2% of families and 10.2% of the population were below the poverty line.
Common Questions
What is Per Capita Income in Pikesville?
Per Capita income in Pikesville is $58,795.
What is the Median Family Income in Pikesville?
Median Family Income in Pikesville is $126,796.
What is the Median Household income in Pikesville?
Median Household Income in Pikesville is $94,408.
What is Income or Wage Gap in Pikesville?
Income or Wage Gap in Pikesville is 26.9%.
Women in Pikesville earn 73.1 cents for every dollar earned by a man.
What is Inequality or Gini Index in Pikesville?
Inequality or Gini Index in Pikesville is 0.52.
What is the Total Population of Pikesville?
Total Population of Pikesville is 34,101.
What is the Total Male Population of Pikesville?
Total Male Population of Pikesville is 15,833.
What is the Total Female Population of Pikesville?
Total Female Population of Pikesville is 18,268.
What is the Ratio of Males per 100 Females in Pikesville?
There are 86.67 Males per 100 Females in Pikesville.
What is the Ratio of Females per 100 Males in Pikesville?
There are 115.38 Females per 100 Males in Pikesville.
What is the Median Population Age in Pikesville?
Median Population Age in Pikesville is 42.1 Years.
What is the Average Family Size in Pikesville
Average Family Size in Pikesville is 3.2 People.
What is the Average Household Size in Pikesville
Average Household Size in Pikesville is 2.5 People.
How Large is the Labor Force in Pikesville?
There are 16,869 People in the Labor Forcein in Pikesville.
What is the Percentage of People in the Labor Force in Pikesville?
63.2% of People are in the Labor Force in Pikesville.
What is the Unemployment Rate in Pikesville?
Unemployment Rate in Pikesville is 4.7%.