Friendship Heights Village, MD Map & Demographics
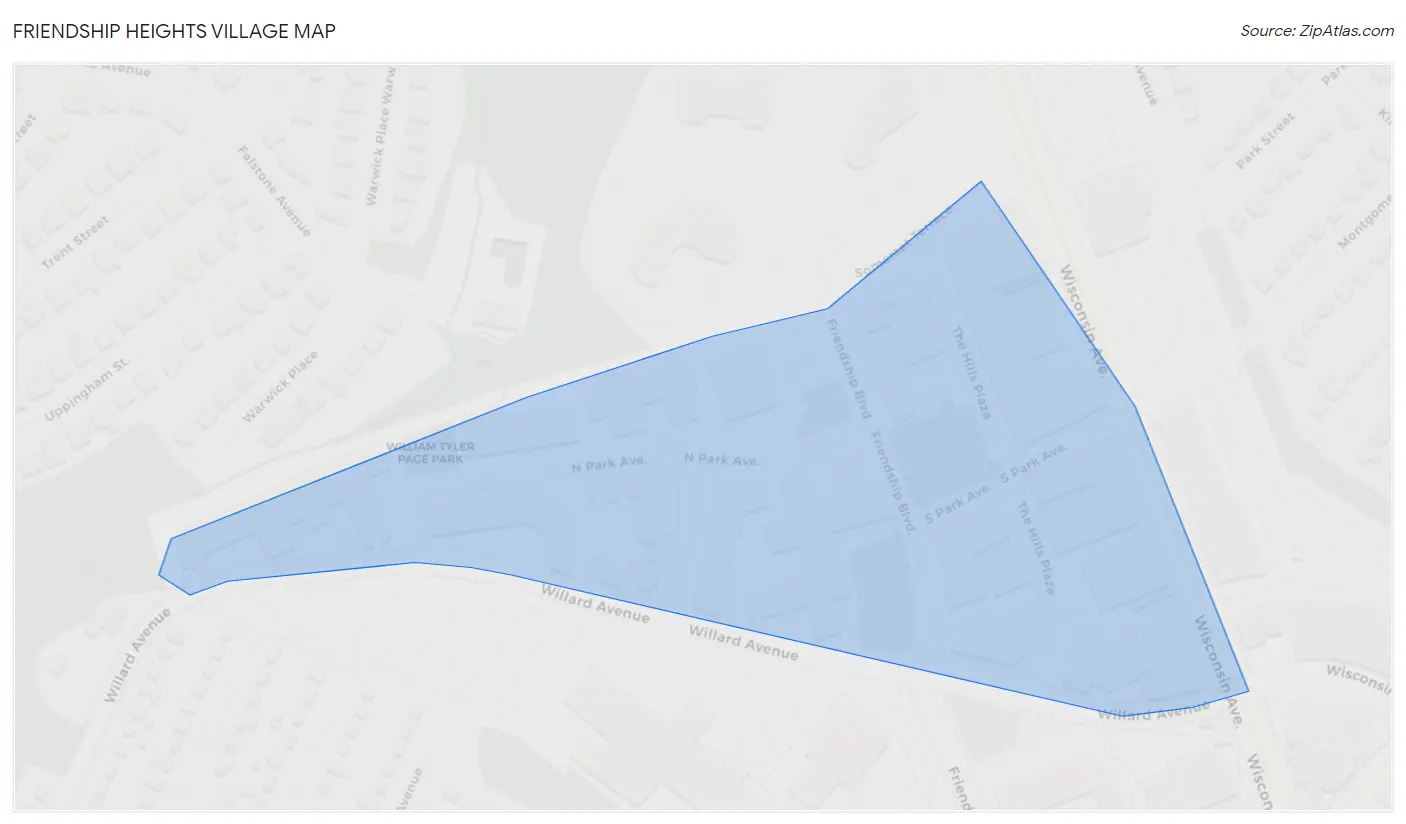
Friendship Heights Village Map
Friendship Heights Village Overview
$98,596
PER CAPITA INCOME
$189,196
AVG FAMILY INCOME
$113,063
AVG HOUSEHOLD INCOME
1.7%
WAGE / INCOME GAP [ % ]
98.3¢/ $1
WAGE / INCOME GAP [ $ ]
0.51
INEQUALITY / GINI INDEX
4,315
TOTAL POPULATION
1,649
MALE POPULATION
2,666
FEMALE POPULATION
61.85
MALES / 100 FEMALES
161.67
FEMALES / 100 MALES
47.9
MEDIAN AGE
2.5
AVG FAMILY SIZE
1.6
AVG HOUSEHOLD SIZE
2,528
LABOR FORCE [ PEOPLE ]
63.9%
PERCENT IN LABOR FORCE
2.9%
UNEMPLOYMENT RATE
Income in Friendship Heights Village
Income Overview in Friendship Heights Village
Per Capita Income in Friendship Heights Village is $98,596, while median incomes of families and households are $189,196 and $113,063 respectively.
| Characteristic | Number | Measure |
| Per Capita Income | 4,315 | $98,596 |
| Median Family Income | 874 | $189,196 |
| Mean Family Income | 874 | $280,000 |
| Median Household Income | 2,694 | $113,063 |
| Mean Household Income | 2,694 | $156,663 |
| Income Deficit | 874 | $0 |
| Wage / Income Gap (%) | 4,315 | 1.70% |
| Wage / Income Gap ($) | 4,315 | 98.30¢ per $1 |
| Gini / Inequality Index | 4,315 | 0.51 |
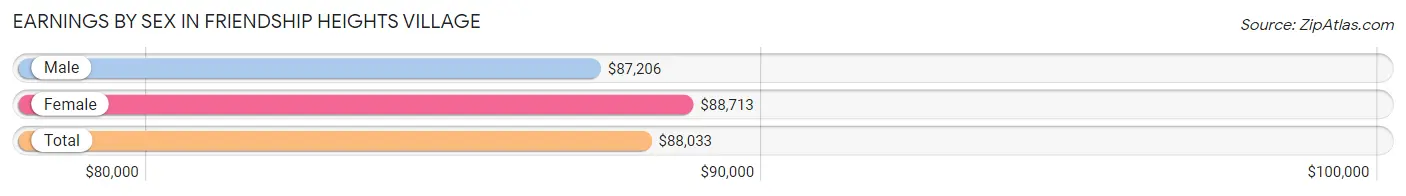
Earnings by Sex in Friendship Heights Village
Average Earnings in Friendship Heights Village are $88,033, $87,206 for men and $88,713 for women, a difference of 1.7%.
| Sex | Number | Average Earnings |
| Male | 1,076 (40.3%) | $87,206 |
| Female | 1,595 (59.7%) | $88,713 |
| Total | 2,671 (100.0%) | $88,033 |
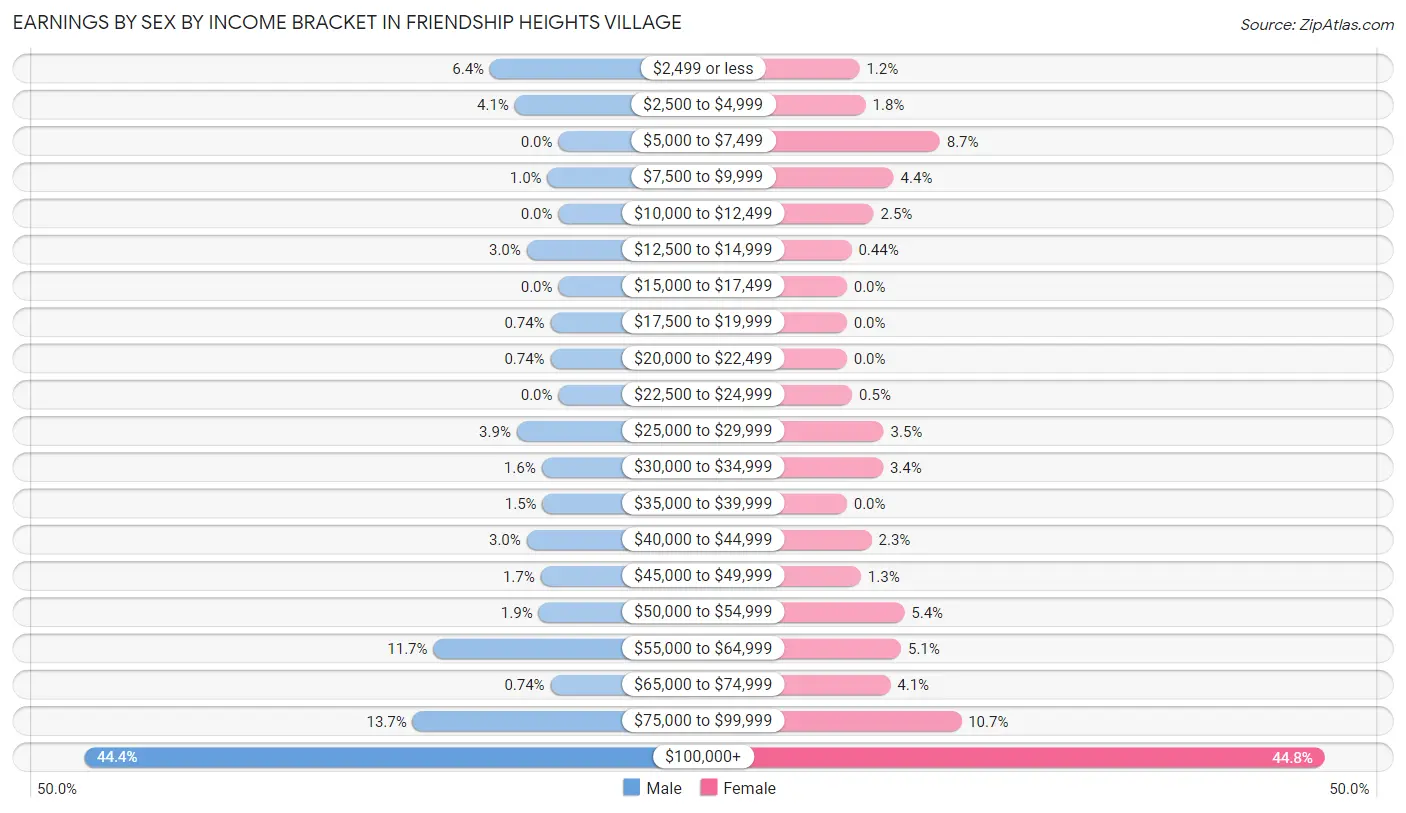
Earnings by Sex by Income Bracket in Friendship Heights Village
The most common earnings brackets in Friendship Heights Village are $100,000+ for men (478 | 44.4%) and $100,000+ for women (714 | 44.8%).
| Income | Male | Female |
| $2,499 or less | 69 (6.4%) | 19 (1.2%) |
| $2,500 to $4,999 | 44 (4.1%) | 28 (1.8%) |
| $5,000 to $7,499 | 0 (0.0%) | 139 (8.7%) |
| $7,500 to $9,999 | 11 (1.0%) | 70 (4.4%) |
| $10,000 to $12,499 | 0 (0.0%) | 40 (2.5%) |
| $12,500 to $14,999 | 32 (3.0%) | 7 (0.4%) |
| $15,000 to $17,499 | 0 (0.0%) | 0 (0.0%) |
| $17,500 to $19,999 | 8 (0.7%) | 0 (0.0%) |
| $20,000 to $22,499 | 8 (0.7%) | 0 (0.0%) |
| $22,500 to $24,999 | 0 (0.0%) | 8 (0.5%) |
| $25,000 to $29,999 | 42 (3.9%) | 55 (3.5%) |
| $30,000 to $34,999 | 17 (1.6%) | 54 (3.4%) |
| $35,000 to $39,999 | 16 (1.5%) | 0 (0.0%) |
| $40,000 to $44,999 | 32 (3.0%) | 37 (2.3%) |
| $45,000 to $49,999 | 18 (1.7%) | 21 (1.3%) |
| $50,000 to $54,999 | 20 (1.9%) | 86 (5.4%) |
| $55,000 to $64,999 | 126 (11.7%) | 81 (5.1%) |
| $65,000 to $74,999 | 8 (0.7%) | 65 (4.1%) |
| $75,000 to $99,999 | 147 (13.7%) | 171 (10.7%) |
| $100,000+ | 478 (44.4%) | 714 (44.8%) |
| Total | 1,076 (100.0%) | 1,595 (100.0%) |
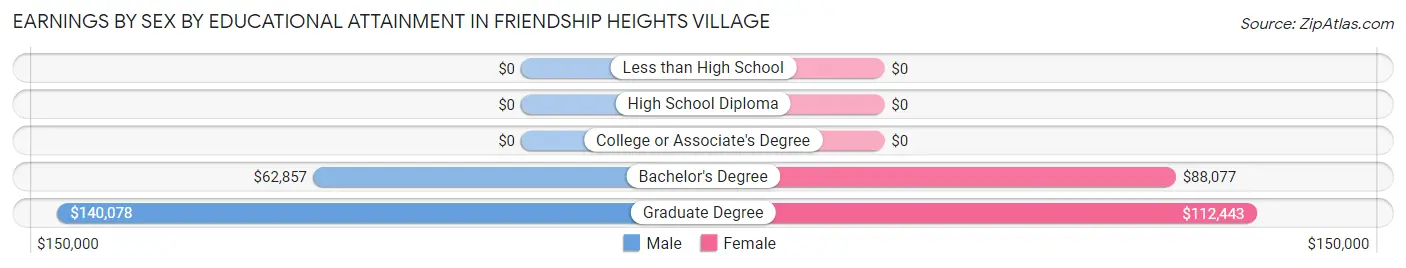
Earnings by Sex by Educational Attainment in Friendship Heights Village
Average earnings in Friendship Heights Village are $91,518 for men and $104,583 for women, a difference of 12.5%. Men with an educational attainment of graduate degree enjoy the highest average annual earnings of $140,078, while those with bachelor's degree education earn the least with $62,857. Women with an educational attainment of graduate degree earn the most with the average annual earnings of $112,443, while those with bachelor's degree education have the smallest earnings of $88,077.
| Educational Attainment | Male Income | Female Income |
| Less than High School | - | - |
| High School Diploma | - | - |
| College or Associate's Degree | - | - |
| Bachelor's Degree | $62,857 | $88,077 |
| Graduate Degree | $140,078 | $112,443 |
| Total | $91,518 | $104,583 |
Family Income in Friendship Heights Village
Family Income Brackets in Friendship Heights Village
According to the Friendship Heights Village family income data, there are 407 families falling into the $200,000+ income range, which is the most common income bracket and makes up 46.6% of all families.
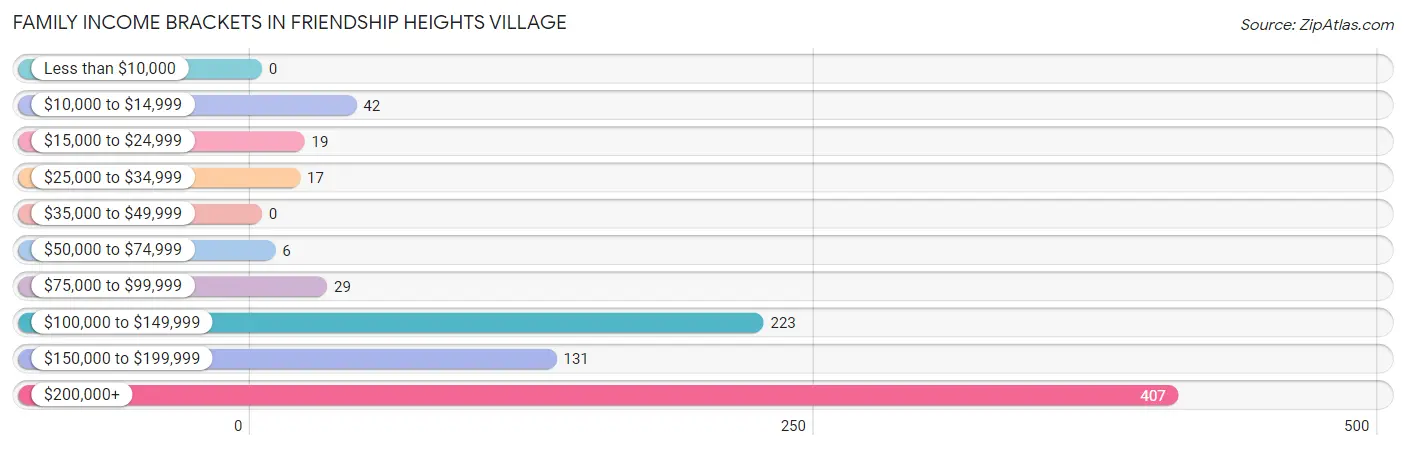
| Income Bracket | # Families | % Families |
| Less than $10,000 | 0 | 0.0% |
| $10,000 to $14,999 | 42 | 4.8% |
| $15,000 to $24,999 | 19 | 2.2% |
| $25,000 to $34,999 | 17 | 1.9% |
| $35,000 to $49,999 | 0 | 0.0% |
| $50,000 to $74,999 | 6 | 0.7% |
| $75,000 to $99,999 | 29 | 3.3% |
| $100,000 to $149,999 | 223 | 25.5% |
| $150,000 to $199,999 | 131 | 15.0% |
| $200,000+ | 407 | 46.6% |
Family Income by Famaliy Size in Friendship Heights Village
4-person families (96 | 11.0%) account for the highest median family income in Friendship Heights Village with $250,001 per family, while 2-person families (597 | 68.3%) have the highest median income of $93,716 per family member.
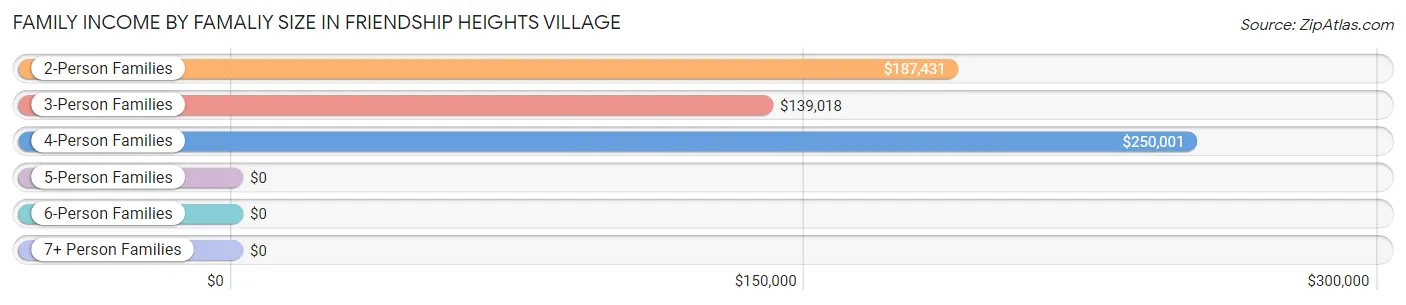
| Income Bracket | # Families | Median Income |
| 2-Person Families | 597 (68.3%) | $187,431 |
| 3-Person Families | 181 (20.7%) | $139,018 |
| 4-Person Families | 96 (11.0%) | $250,001 |
| 5-Person Families | 0 (0.0%) | $0 |
| 6-Person Families | 0 (0.0%) | $0 |
| 7+ Person Families | 0 (0.0%) | $0 |
| Total | 874 (100.0%) | $189,196 |
Family Income by Number of Earners in Friendship Heights Village
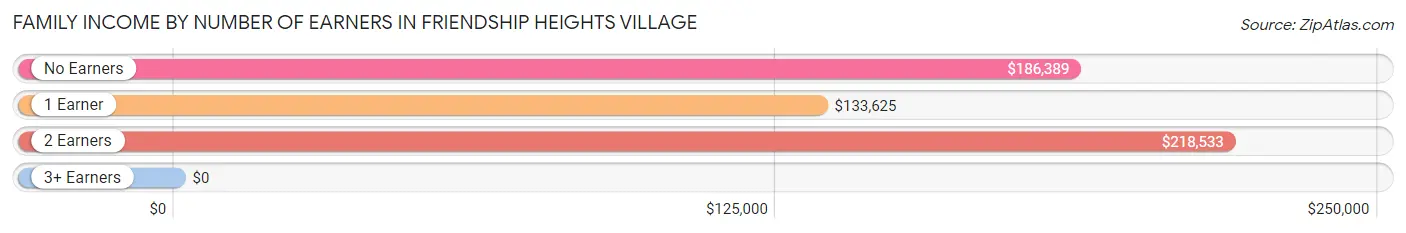
| Number of Earners | # Families | Median Income |
| No Earners | 150 (17.2%) | $186,389 |
| 1 Earner | 223 (25.5%) | $133,625 |
| 2 Earners | 501 (57.3%) | $218,533 |
| 3+ Earners | 0 (0.0%) | $0 |
| Total | 874 (100.0%) | $189,196 |
Household Income in Friendship Heights Village
Household Income Brackets in Friendship Heights Village
With 746 households falling in the category, the $100,000 to $149,999 income range is the most frequent in Friendship Heights Village, accounting for 27.7% of all households. In contrast, only 108 households (4.0%) fall into the $25,000 to $34,999 income bracket, making it the least populous group.
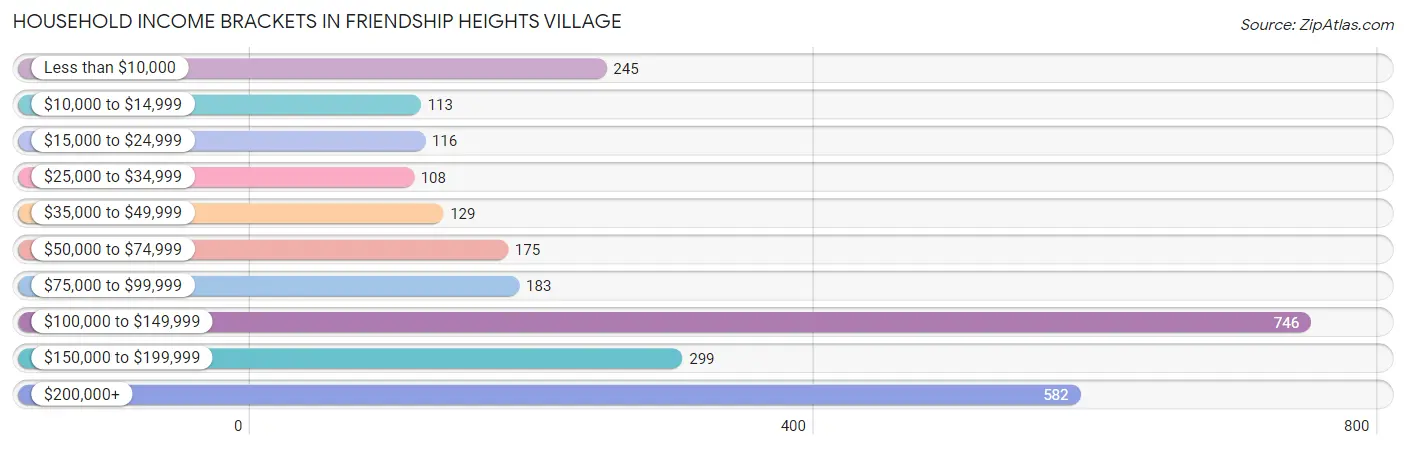
| Income Bracket | # Households | % Households |
| Less than $10,000 | 245 | 9.1% |
| $10,000 to $14,999 | 113 | 4.2% |
| $15,000 to $24,999 | 116 | 4.3% |
| $25,000 to $34,999 | 108 | 4.0% |
| $35,000 to $49,999 | 129 | 4.8% |
| $50,000 to $74,999 | 175 | 6.5% |
| $75,000 to $99,999 | 183 | 6.8% |
| $100,000 to $149,999 | 746 | 27.7% |
| $150,000 to $199,999 | 299 | 11.1% |
| $200,000+ | 582 | 21.6% |
Household Income by Householder Age in Friendship Heights Village
The median household income in Friendship Heights Village is $113,063, with the highest median household income of $138,036 found in the 45 to 64 years age bracket for the primary householder. A total of 636 households (23.6%) fall into this category. Meanwhile, the 15 to 24 years age bracket for the primary householder has the lowest median household income of $0, with 218 households (8.1%) in this group.
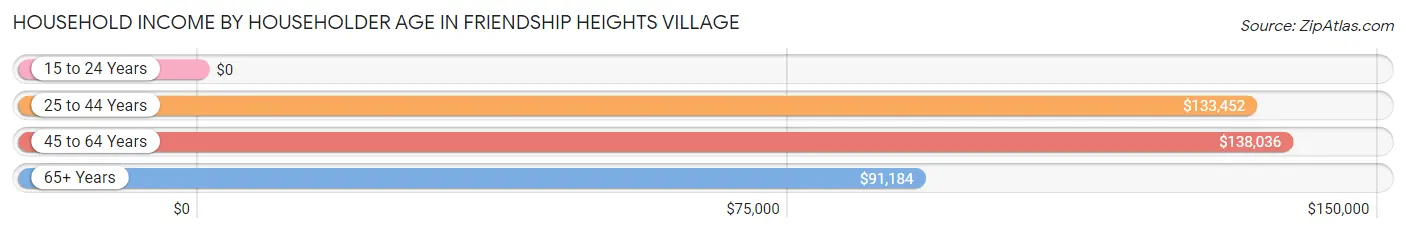
| Income Bracket | # Households | Median Income |
| 15 to 24 Years | 218 (8.1%) | $0 |
| 25 to 44 Years | 798 (29.6%) | $133,452 |
| 45 to 64 Years | 636 (23.6%) | $138,036 |
| 65+ Years | 1,042 (38.7%) | $91,184 |
| Total | 2,694 (100.0%) | $113,063 |
Poverty in Friendship Heights Village
Income Below Poverty by Sex and Age in Friendship Heights Village
With 9.0% poverty level for males and 13.1% for females among the residents of Friendship Heights Village, 12 to 14 year old males and 18 to 24 year old females are the most vulnerable to poverty, with 31 males (75.6%) and 136 females (55.5%) in their respective age groups living below the poverty level.
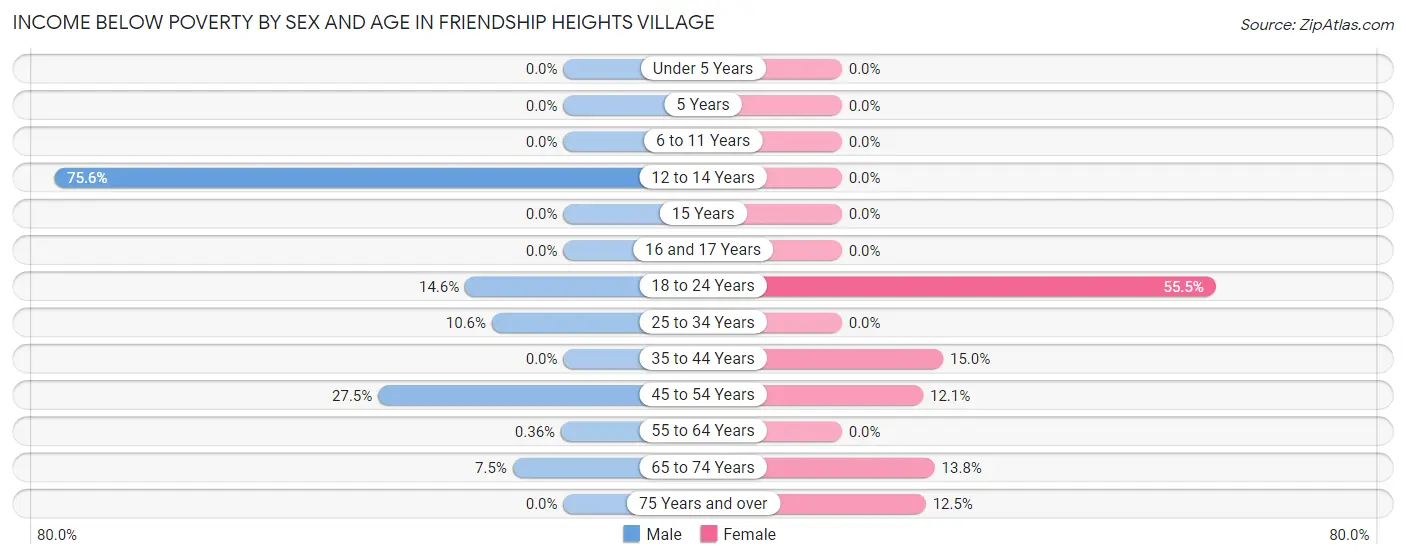
| Age Bracket | Male | Female |
| Under 5 Years | 0 (0.0%) | 0 (0.0%) |
| 5 Years | 0 (0.0%) | 0 (0.0%) |
| 6 to 11 Years | 0 (0.0%) | 0 (0.0%) |
| 12 to 14 Years | 31 (75.6%) | 0 (0.0%) |
| 15 Years | 0 (0.0%) | 0 (0.0%) |
| 16 and 17 Years | 0 (0.0%) | 0 (0.0%) |
| 18 to 24 Years | 20 (14.6%) | 136 (55.5%) |
| 25 to 34 Years | 34 (10.6%) | 0 (0.0%) |
| 35 to 44 Years | 0 (0.0%) | 55 (15.0%) |
| 45 to 54 Years | 52 (27.5%) | 31 (12.1%) |
| 55 to 64 Years | 1 (0.4%) | 0 (0.0%) |
| 65 to 74 Years | 10 (7.5%) | 52 (13.8%) |
| 75 Years and over | 0 (0.0%) | 75 (12.5%) |
| Total | 148 (9.0%) | 349 (13.1%) |
Income Above Poverty by Sex and Age in Friendship Heights Village
According to the poverty statistics in Friendship Heights Village, males aged under 5 years and females aged under 5 years are the age groups that are most secure financially, with 100.0% of males and 100.0% of females in these age groups living above the poverty line.
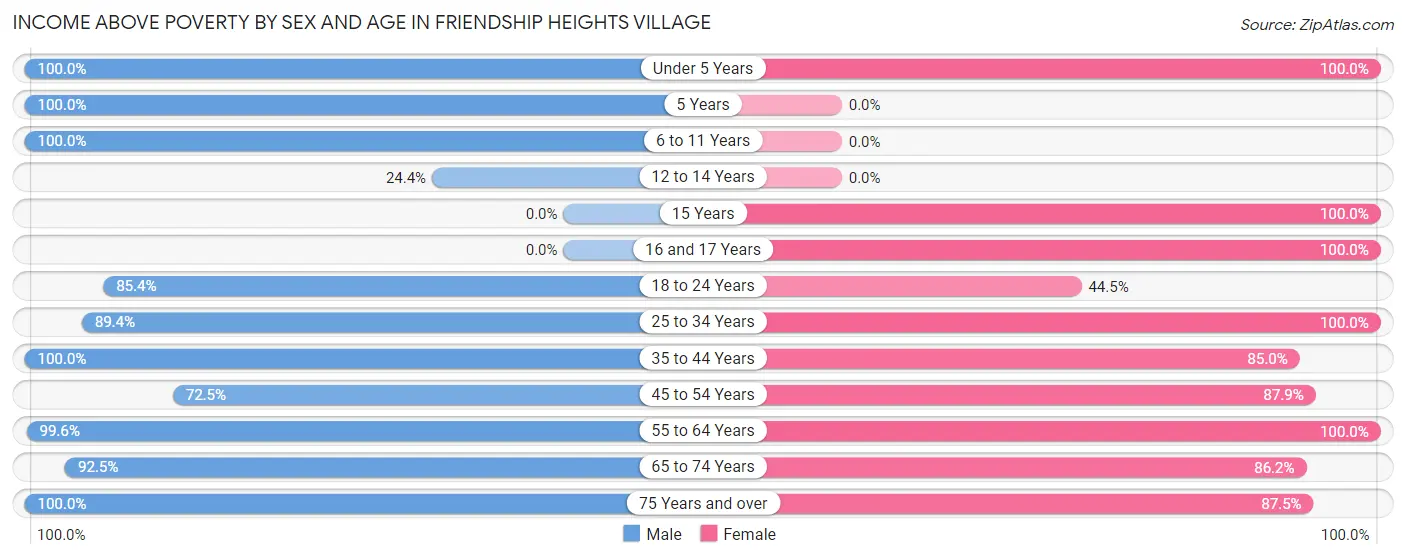
| Age Bracket | Male | Female |
| Under 5 Years | 27 (100.0%) | 154 (100.0%) |
| 5 Years | 22 (100.0%) | 0 (0.0%) |
| 6 to 11 Years | 100 (100.0%) | 0 (0.0%) |
| 12 to 14 Years | 10 (24.4%) | 0 (0.0%) |
| 15 Years | 0 (0.0%) | 15 (100.0%) |
| 16 and 17 Years | 0 (0.0%) | 16 (100.0%) |
| 18 to 24 Years | 117 (85.4%) | 109 (44.5%) |
| 25 to 34 Years | 286 (89.4%) | 409 (100.0%) |
| 35 to 44 Years | 150 (100.0%) | 311 (85.0%) |
| 45 to 54 Years | 137 (72.5%) | 226 (87.9%) |
| 55 to 64 Years | 278 (99.6%) | 225 (100.0%) |
| 65 to 74 Years | 123 (92.5%) | 325 (86.2%) |
| 75 Years and over | 251 (100.0%) | 527 (87.5%) |
| Total | 1,501 (91.0%) | 2,317 (86.9%) |
Income Below Poverty Among Married-Couple Families in Friendship Heights Village
The poverty statistics for married-couple families in Friendship Heights Village show that 5.5% or 42 of the total 759 families live below the poverty line. Families with 1 or 2 children have the highest poverty rate of 12.4%, comprising of 32 families. On the other hand, families with no children have the lowest poverty rate of 2.0%, which includes 10 families.
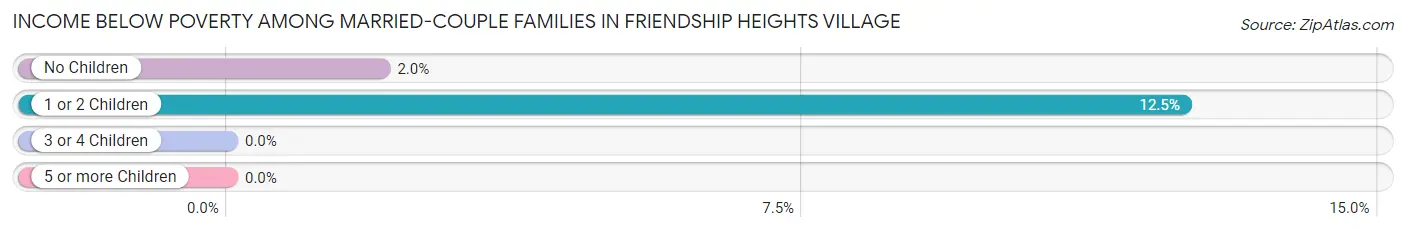
| Children | Above Poverty | Below Poverty |
| No Children | 492 (98.0%) | 10 (2.0%) |
| 1 or 2 Children | 225 (87.5%) | 32 (12.4%) |
| 3 or 4 Children | 0 (0.0%) | 0 (0.0%) |
| 5 or more Children | 0 (0.0%) | 0 (0.0%) |
| Total | 717 (94.5%) | 42 (5.5%) |
Income Below Poverty Among Single-Parent Households in Friendship Heights Village
| Children | Single Father | Single Mother |
| No Children | 0 (0.0%) | 0 (0.0%) |
| 1 or 2 Children | 0 (0.0%) | 0 (0.0%) |
| 3 or 4 Children | 0 (0.0%) | 0 (0.0%) |
| 5 or more Children | 0 (0.0%) | 0 (0.0%) |
| Total | 0 (0.0%) | 0 (0.0%) |
Income Below Poverty Among Married-Couple vs Single-Parent Households in Friendship Heights Village
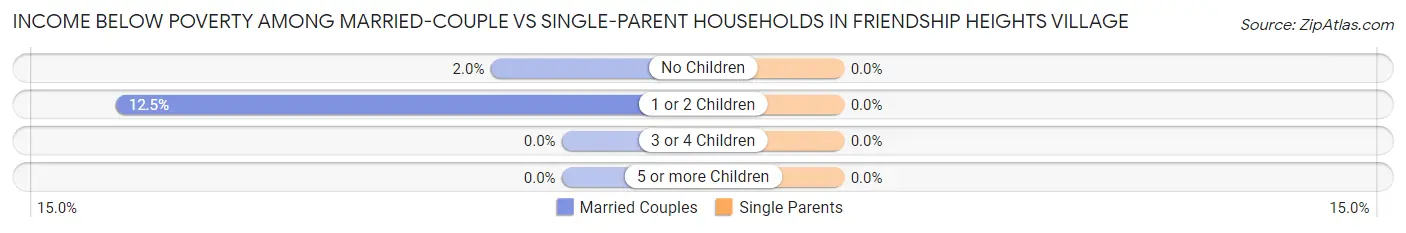
| Children | Married-Couple Families | Single-Parent Households |
| No Children | 10 (2.0%) | 0 (0.0%) |
| 1 or 2 Children | 32 (12.4%) | 0 (0.0%) |
| 3 or 4 Children | 0 (0.0%) | 0 (0.0%) |
| 5 or more Children | 0 (0.0%) | 0 (0.0%) |
| Total | 42 (5.5%) | 0 (0.0%) |
Race in Friendship Heights Village
The most populous races in Friendship Heights Village are White / Caucasian (3,092 | 71.7%), Asian (588 | 13.6%), and Hispanic or Latino (484 | 11.2%).
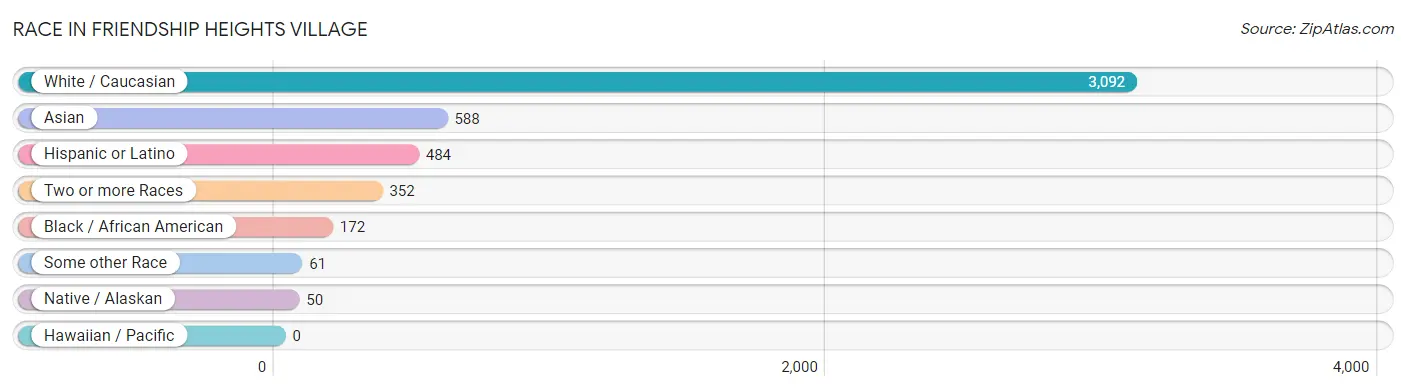
| Race | # Population | % Population |
| Asian | 588 | 13.6% |
| Black / African American | 172 | 4.0% |
| Hawaiian / Pacific | 0 | 0.0% |
| Hispanic or Latino | 484 | 11.2% |
| Native / Alaskan | 50 | 1.2% |
| White / Caucasian | 3,092 | 71.7% |
| Two or more Races | 352 | 8.2% |
| Some other Race | 61 | 1.4% |
| Total | 4,315 | 100.0% |
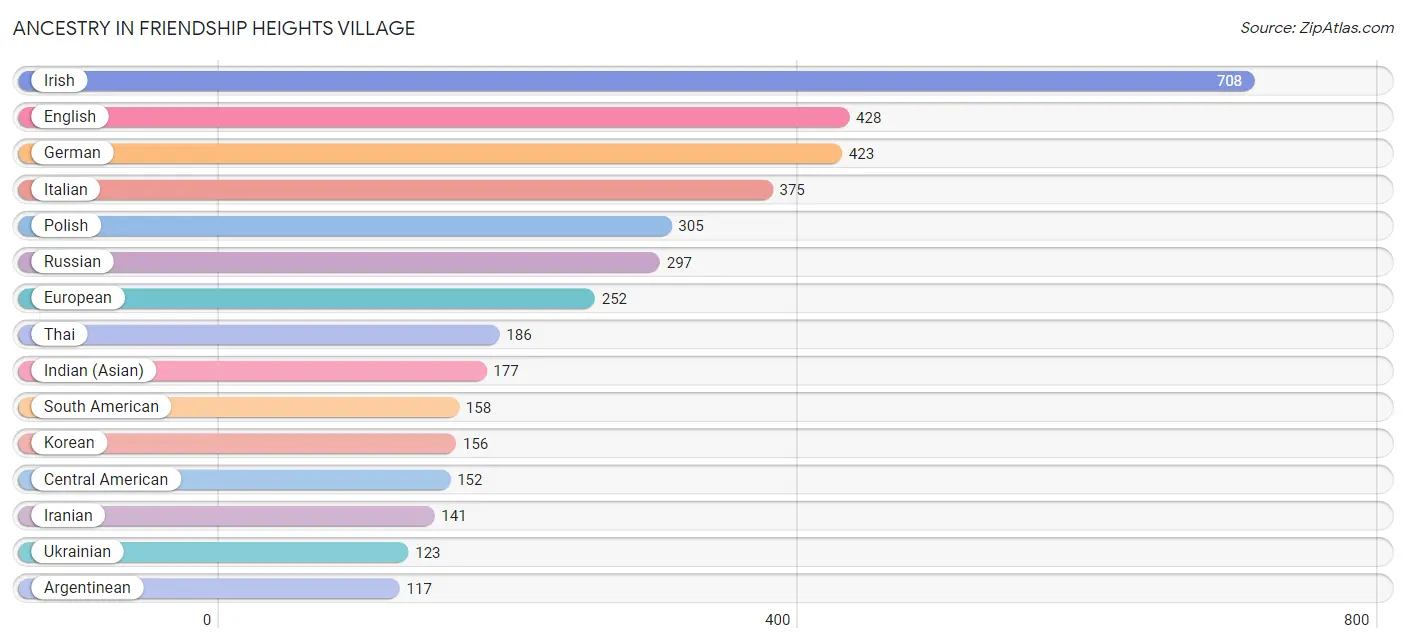
Ancestry in Friendship Heights Village
The most populous ancestries reported in Friendship Heights Village are Irish (708 | 16.4%), English (428 | 9.9%), German (423 | 9.8%), Italian (375 | 8.7%), and Polish (305 | 7.1%), together accounting for 51.9% of all Friendship Heights Village residents.
| Ancestry | # Population | % Population |
| African | 22 | 0.5% |
| Albanian | 35 | 0.8% |
| American | 75 | 1.7% |
| Arab | 115 | 2.7% |
| Argentinean | 117 | 2.7% |
| Armenian | 10 | 0.2% |
| Austrian | 7 | 0.2% |
| Bolivian | 4 | 0.1% |
| British | 55 | 1.3% |
| Burmese | 97 | 2.2% |
| Canadian | 28 | 0.6% |
| Central American | 152 | 3.5% |
| Czechoslovakian | 19 | 0.4% |
| Danish | 17 | 0.4% |
| Dominican | 18 | 0.4% |
| Dutch | 20 | 0.5% |
| Eastern European | 70 | 1.6% |
| Egyptian | 57 | 1.3% |
| English | 428 | 9.9% |
| European | 252 | 5.8% |
| Finnish | 39 | 0.9% |
| French | 95 | 2.2% |
| German | 423 | 9.8% |
| Ghanaian | 11 | 0.3% |
| Greek | 30 | 0.7% |
| Guatemalan | 37 | 0.9% |
| Guyanese | 11 | 0.3% |
| Hungarian | 10 | 0.2% |
| Indian (Asian) | 177 | 4.1% |
| Iranian | 141 | 3.3% |
| Irish | 708 | 16.4% |
| Italian | 375 | 8.7% |
| Korean | 156 | 3.6% |
| Latvian | 43 | 1.0% |
| Lebanese | 37 | 0.9% |
| Lithuanian | 93 | 2.2% |
| Macedonian | 30 | 0.7% |
| Mexican | 12 | 0.3% |
| Mongolian | 55 | 1.3% |
| Moroccan | 21 | 0.5% |
| Native Hawaiian | 55 | 1.3% |
| Nicaraguan | 65 | 1.5% |
| Norwegian | 28 | 0.6% |
| Pakistani | 24 | 0.6% |
| Peruvian | 11 | 0.3% |
| Polish | 305 | 7.1% |
| Portuguese | 43 | 1.0% |
| Puerto Rican | 40 | 0.9% |
| Romanian | 54 | 1.3% |
| Russian | 297 | 6.9% |
| Salvadoran | 50 | 1.2% |
| Scandinavian | 13 | 0.3% |
| Scotch-Irish | 41 | 0.9% |
| Scottish | 90 | 2.1% |
| Serbian | 30 | 0.7% |
| Slavic | 16 | 0.4% |
| Slovak | 17 | 0.4% |
| Slovene | 21 | 0.5% |
| South African | 14 | 0.3% |
| South American | 158 | 3.7% |
| Spaniard | 63 | 1.5% |
| Spanish | 9 | 0.2% |
| Subsaharan African | 47 | 1.1% |
| Swedish | 20 | 0.5% |
| Swiss | 17 | 0.4% |
| Thai | 186 | 4.3% |
| Turkish | 21 | 0.5% |
| Ukrainian | 123 | 2.9% |
| Venezuelan | 26 | 0.6% |
| Welsh | 21 | 0.5% | View All 70 Rows |
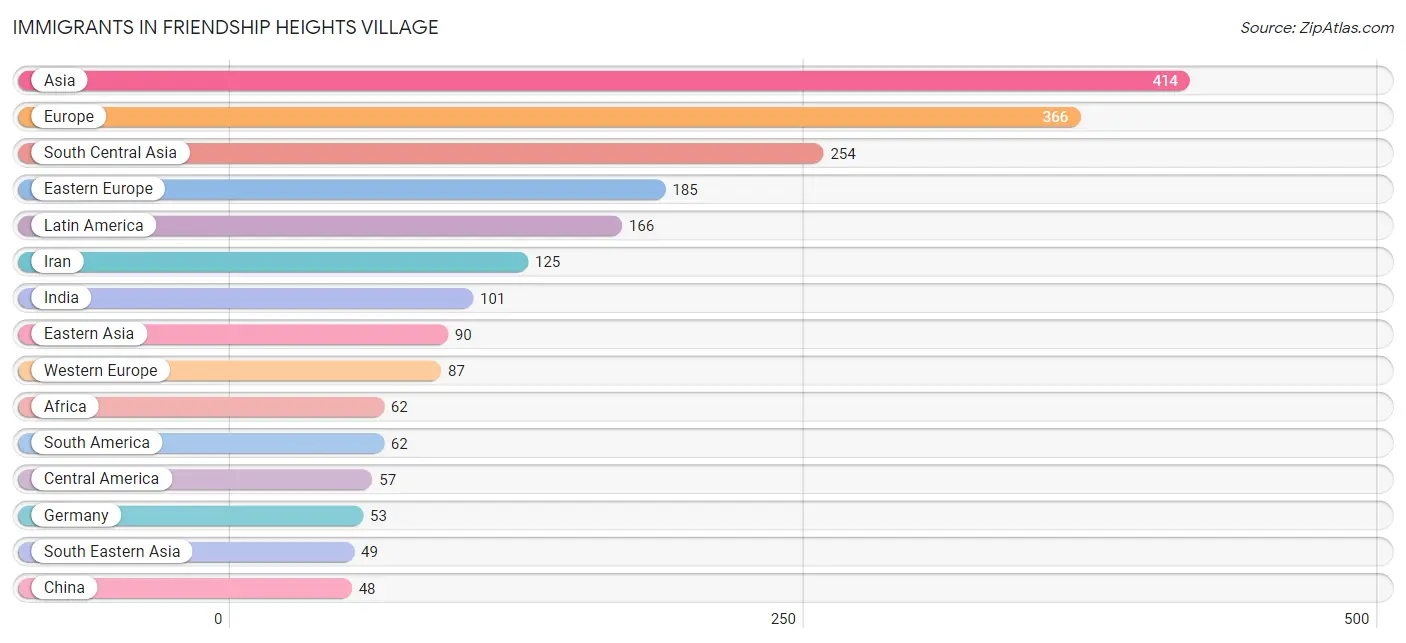
Immigrants in Friendship Heights Village
The most numerous immigrant groups reported in Friendship Heights Village came from Asia (414 | 9.6%), Europe (366 | 8.5%), South Central Asia (254 | 5.9%), Eastern Europe (185 | 4.3%), and Latin America (166 | 3.8%), together accounting for 32.1% of all Friendship Heights Village residents.
| Immigration Origin | # Population | % Population |
| Africa | 62 | 1.4% |
| Albania | 17 | 0.4% |
| Argentina | 35 | 0.8% |
| Asia | 414 | 9.6% |
| Bangladesh | 9 | 0.2% |
| Belgium | 10 | 0.2% |
| Canada | 35 | 0.8% |
| Caribbean | 47 | 1.1% |
| Central America | 57 | 1.3% |
| China | 48 | 1.1% |
| Colombia | 4 | 0.1% |
| Czechoslovakia | 16 | 0.4% |
| Denmark | 7 | 0.2% |
| Dominican Republic | 18 | 0.4% |
| Eastern Africa | 22 | 0.5% |
| Eastern Asia | 90 | 2.1% |
| Eastern Europe | 185 | 4.3% |
| El Salvador | 29 | 0.7% |
| Europe | 366 | 8.5% |
| France | 24 | 0.6% |
| Germany | 53 | 1.2% |
| Ghana | 11 | 0.3% |
| Guatemala | 10 | 0.2% |
| Haiti | 19 | 0.4% |
| Hong Kong | 14 | 0.3% |
| India | 101 | 2.3% |
| Iran | 125 | 2.9% |
| Korea | 42 | 1.0% |
| Latin America | 166 | 3.8% |
| Latvia | 43 | 1.0% |
| Lithuania | 13 | 0.3% |
| Mexico | 4 | 0.1% |
| Moldova | 12 | 0.3% |
| Morocco | 21 | 0.5% |
| Nicaragua | 14 | 0.3% |
| Nigeria | 8 | 0.2% |
| Northern Africa | 21 | 0.5% |
| Northern Europe | 47 | 1.1% |
| Peru | 11 | 0.3% |
| Philippines | 40 | 0.9% |
| Russia | 35 | 0.8% |
| Serbia | 10 | 0.2% |
| South America | 62 | 1.4% |
| South Central Asia | 254 | 5.9% |
| South Eastern Asia | 49 | 1.1% |
| Southern Europe | 47 | 1.1% |
| Spain | 47 | 1.1% |
| Sri Lanka | 19 | 0.4% |
| Trinidad and Tobago | 10 | 0.2% |
| Turkey | 21 | 0.5% |
| Ukraine | 18 | 0.4% |
| Venezuela | 12 | 0.3% |
| Vietnam | 9 | 0.2% |
| Western Africa | 19 | 0.4% |
| Western Asia | 21 | 0.5% |
| Western Europe | 87 | 2.0% |
| Zimbabwe | 22 | 0.5% | View All 57 Rows |
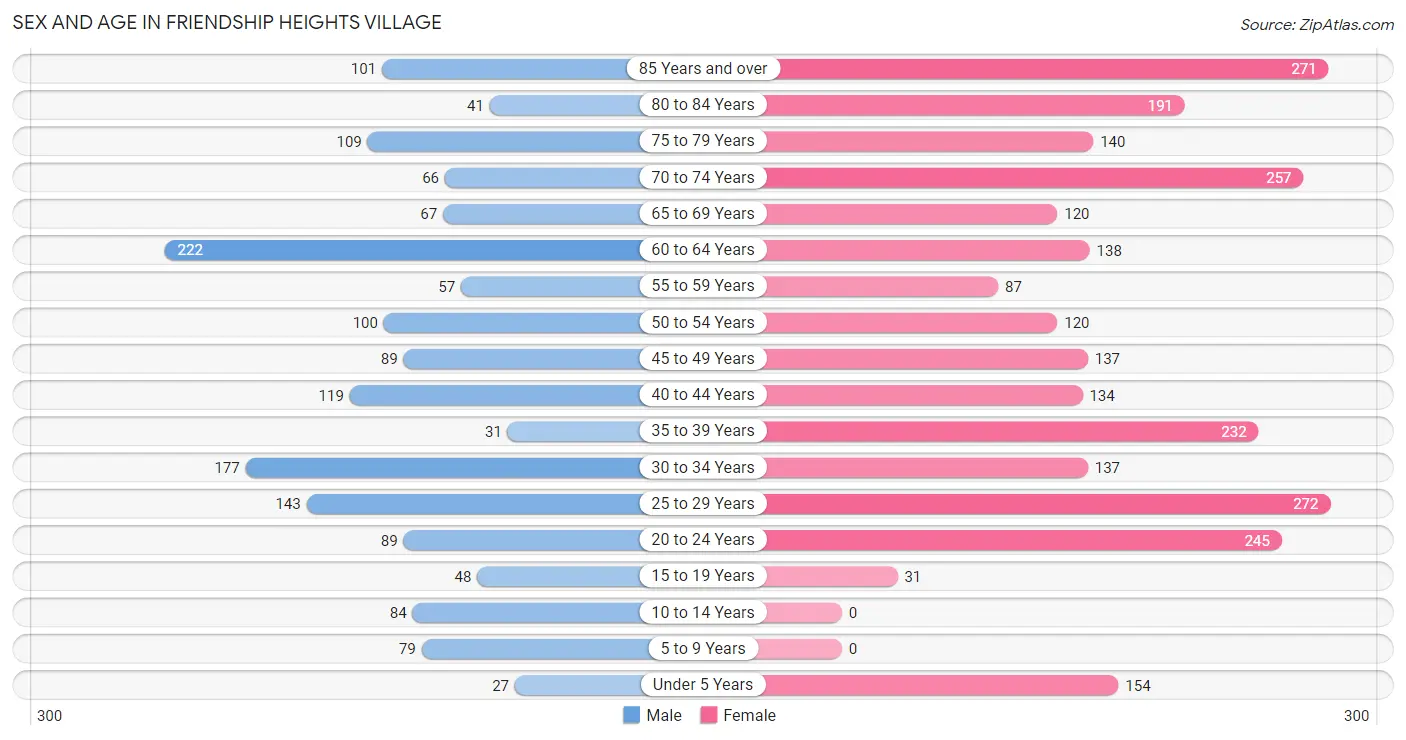
Sex and Age in Friendship Heights Village
Sex and Age in Friendship Heights Village
The most populous age groups in Friendship Heights Village are 60 to 64 Years (222 | 13.5%) for men and 25 to 29 Years (272 | 10.2%) for women.
| Age Bracket | Male | Female |
| Under 5 Years | 27 (1.6%) | 154 (5.8%) |
| 5 to 9 Years | 79 (4.8%) | 0 (0.0%) |
| 10 to 14 Years | 84 (5.1%) | 0 (0.0%) |
| 15 to 19 Years | 48 (2.9%) | 31 (1.2%) |
| 20 to 24 Years | 89 (5.4%) | 245 (9.2%) |
| 25 to 29 Years | 143 (8.7%) | 272 (10.2%) |
| 30 to 34 Years | 177 (10.7%) | 137 (5.1%) |
| 35 to 39 Years | 31 (1.9%) | 232 (8.7%) |
| 40 to 44 Years | 119 (7.2%) | 134 (5.0%) |
| 45 to 49 Years | 89 (5.4%) | 137 (5.1%) |
| 50 to 54 Years | 100 (6.1%) | 120 (4.5%) |
| 55 to 59 Years | 57 (3.5%) | 87 (3.3%) |
| 60 to 64 Years | 222 (13.5%) | 138 (5.2%) |
| 65 to 69 Years | 67 (4.1%) | 120 (4.5%) |
| 70 to 74 Years | 66 (4.0%) | 257 (9.6%) |
| 75 to 79 Years | 109 (6.6%) | 140 (5.2%) |
| 80 to 84 Years | 41 (2.5%) | 191 (7.2%) |
| 85 Years and over | 101 (6.1%) | 271 (10.2%) |
| Total | 1,649 (100.0%) | 2,666 (100.0%) |
Families and Households in Friendship Heights Village
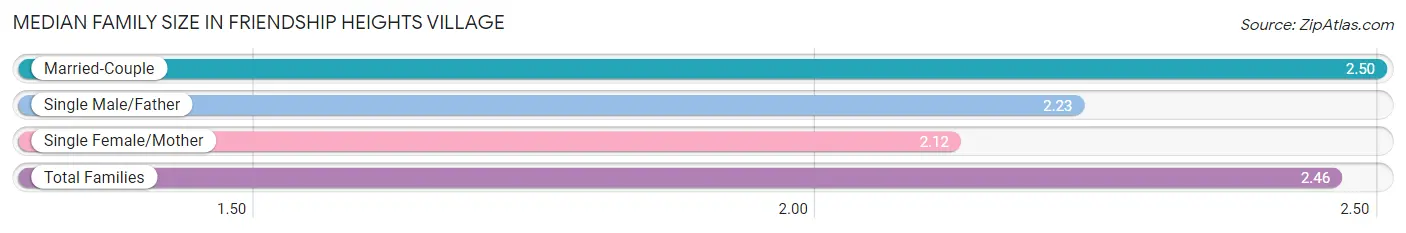
Median Family Size in Friendship Heights Village
The median family size in Friendship Heights Village is 2.46 persons per family, with married-couple families (759 | 86.8%) accounting for the largest median family size of 2.5 persons per family. On the other hand, single female/mother families (58 | 6.6%) represent the smallest median family size with 2.12 persons per family.
| Family Type | # Families | Family Size |
| Married-Couple | 759 (86.8%) | 2.50 |
| Single Male/Father | 57 (6.5%) | 2.23 |
| Single Female/Mother | 58 (6.6%) | 2.12 |
| Total Families | 874 (100.0%) | 2.46 |
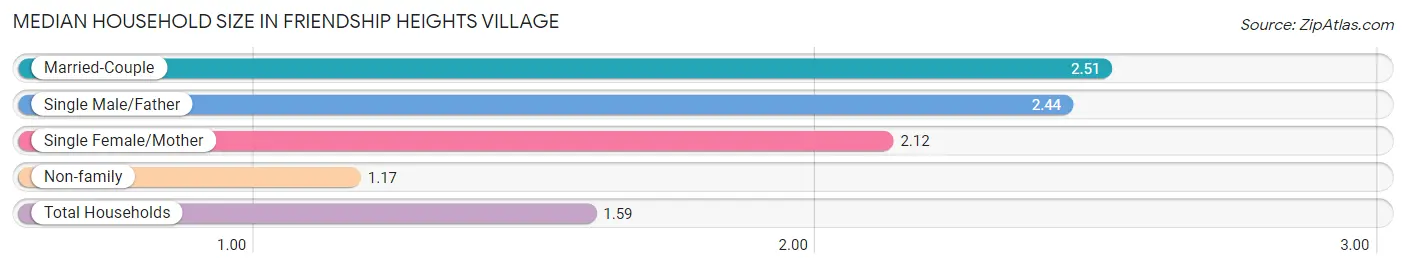
Median Household Size in Friendship Heights Village
The median household size in Friendship Heights Village is 1.59 persons per household, with married-couple households (759 | 28.2%) accounting for the largest median household size of 2.51 persons per household. non-family households (1,820 | 67.6%) represent the smallest median household size with 1.17 persons per household.
| Household Type | # Households | Household Size |
| Married-Couple | 759 (28.2%) | 2.51 |
| Single Male/Father | 57 (2.1%) | 2.44 |
| Single Female/Mother | 58 (2.1%) | 2.12 |
| Non-family | 1,820 (67.6%) | 1.17 |
| Total Households | 2,694 (100.0%) | 1.59 |
Household Size by Marriage Status in Friendship Heights Village
Out of a total of 2,694 households in Friendship Heights Village, 874 (32.4%) are family households, while 1,820 (67.6%) are nonfamily households. The most numerous type of family households are 2-person households, comprising 572, and the most common type of nonfamily households are 1-person households, comprising 1,564.
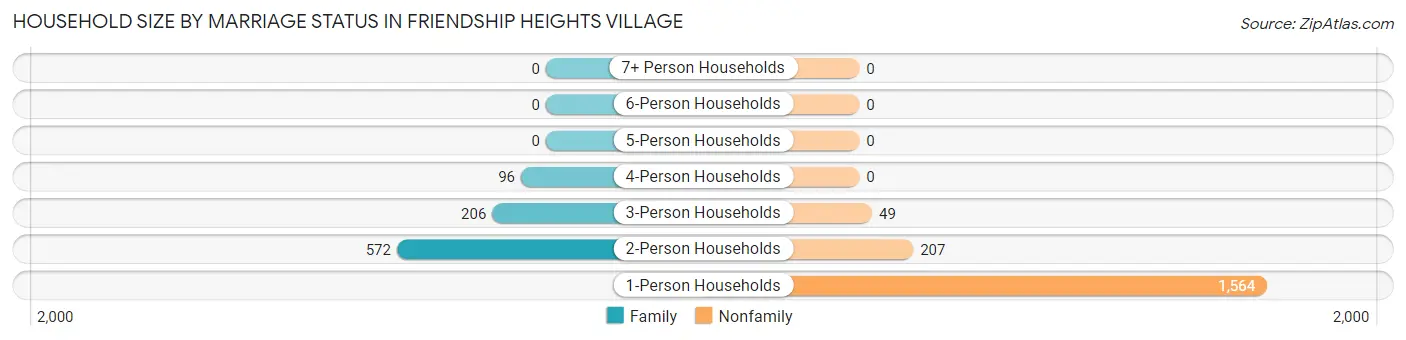
| Household Size | Family Households | Nonfamily Households |
| 1-Person Households | - | 1,564 (58.1%) |
| 2-Person Households | 572 (21.2%) | 207 (7.7%) |
| 3-Person Households | 206 (7.6%) | 49 (1.8%) |
| 4-Person Households | 96 (3.6%) | 0 (0.0%) |
| 5-Person Households | 0 (0.0%) | 0 (0.0%) |
| 6-Person Households | 0 (0.0%) | 0 (0.0%) |
| 7+ Person Households | 0 (0.0%) | 0 (0.0%) |
| Total | 874 (32.4%) | 1,820 (67.6%) |
Female Fertility in Friendship Heights Village
Fertility by Age in Friendship Heights Village
Average fertility rate in Friendship Heights Village is 10.0 births per 1,000 women. Women in the age bracket of 20 to 34 years have the highest fertility rate with 18.0 births per 1,000 women. Women in the age bracket of 20 to 34 years acount for 100.0% of all women with births.
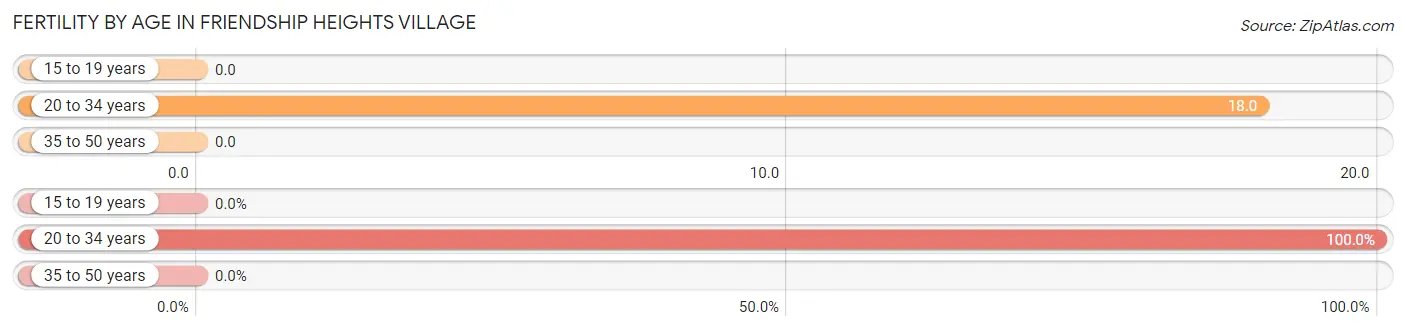
| Age Bracket | Women with Births | Births / 1,000 Women |
| 15 to 19 years | 0 (0.0%) | 0.0 |
| 20 to 34 years | 12 (100.0%) | 18.0 |
| 35 to 50 years | 0 (0.0%) | 0.0 |
| Total | 12 (100.0%) | 10.0 |
Fertility by Age by Marriage Status in Friendship Heights Village
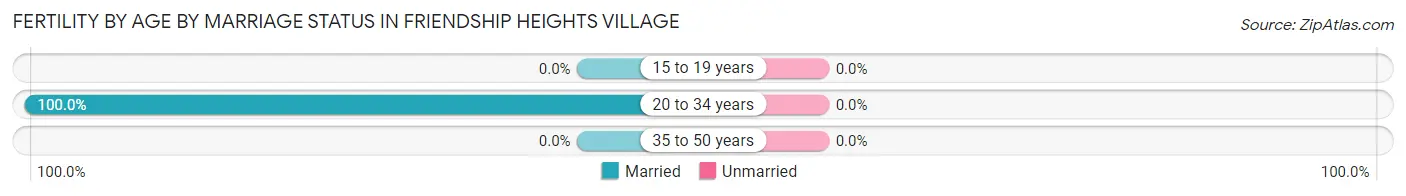
| Age Bracket | Married | Unmarried |
| 15 to 19 years | 0 (0.0%) | 0 (0.0%) |
| 20 to 34 years | 12 (100.0%) | 0 (0.0%) |
| 35 to 50 years | 0 (0.0%) | 0 (0.0%) |
| Total | 12 (100.0%) | 0 (0.0%) |
Fertility by Education in Friendship Heights Village
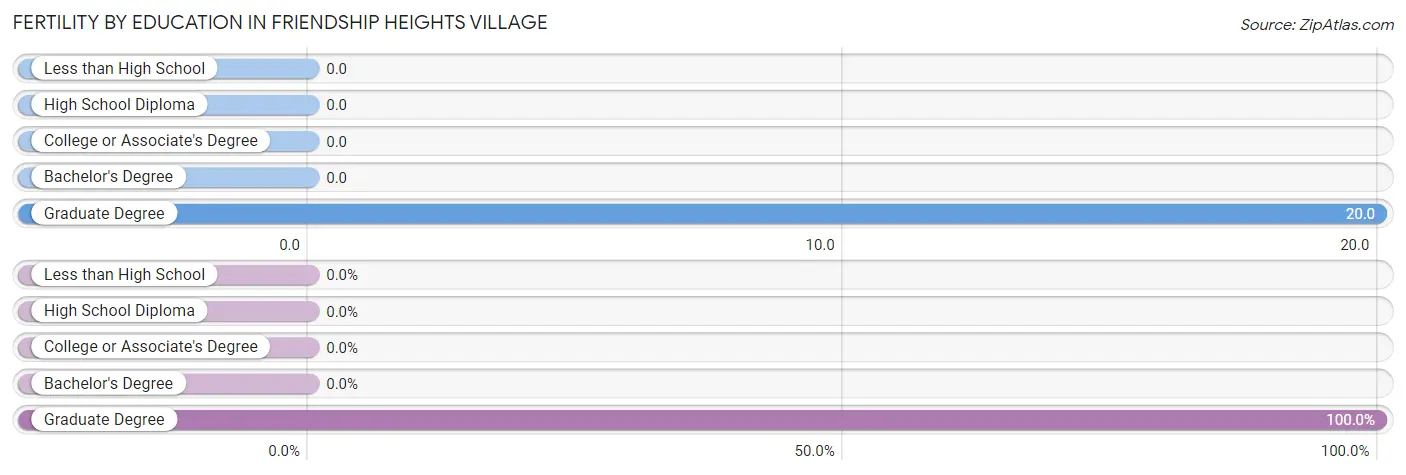
| Educational Attainment | Women with Births | Births / 1,000 Women |
| Less than High School | 0 (0.0%) | 0.0 |
| High School Diploma | 0 (0.0%) | 0.0 |
| College or Associate's Degree | 0 (0.0%) | 0.0 |
| Bachelor's Degree | 0 (0.0%) | 0.0 |
| Graduate Degree | 12 (100.0%) | 20.0 |
| Total | 12 (100.0%) | 10.0 |
Fertility by Education by Marriage Status in Friendship Heights Village
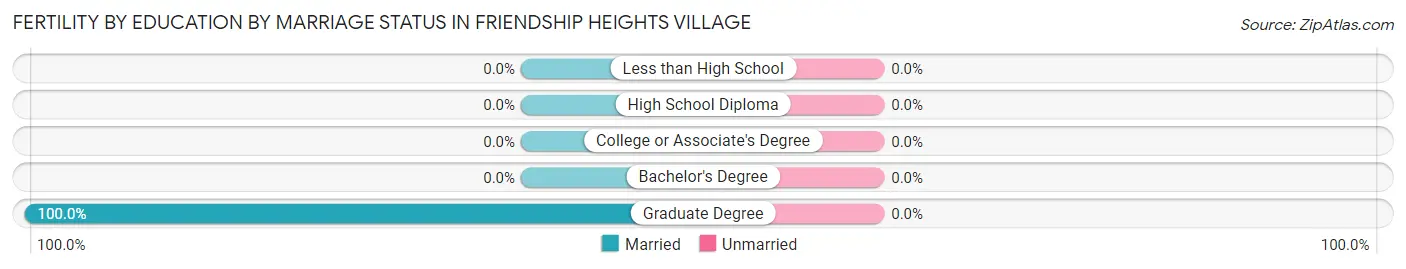
| Educational Attainment | Married | Unmarried |
| Less than High School | 0 (0.0%) | 0 (0.0%) |
| High School Diploma | 0 (0.0%) | 0 (0.0%) |
| College or Associate's Degree | 0 (0.0%) | 0 (0.0%) |
| Bachelor's Degree | 0 (0.0%) | 0 (0.0%) |
| Graduate Degree | 12 (100.0%) | 0 (0.0%) |
| Total | 12 (100.0%) | 0 (0.0%) |
Employment Characteristics in Friendship Heights Village
Employment by Class of Employer in Friendship Heights Village
Among the 2,422 employed individuals in Friendship Heights Village, private company employees (1,023 | 42.2%), federal government employees (580 | 23.9%), and not-for-profit organizations (500 | 20.6%) make up the most common classes of employment.
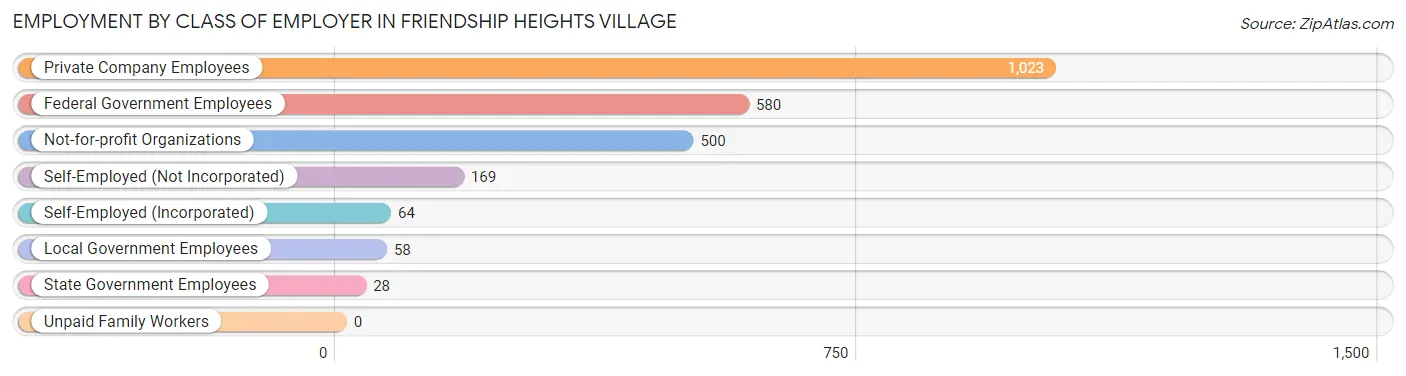
| Employer Class | # Employees | % Employees |
| Private Company Employees | 1,023 | 42.2% |
| Self-Employed (Incorporated) | 64 | 2.6% |
| Self-Employed (Not Incorporated) | 169 | 7.0% |
| Not-for-profit Organizations | 500 | 20.6% |
| Local Government Employees | 58 | 2.4% |
| State Government Employees | 28 | 1.2% |
| Federal Government Employees | 580 | 23.9% |
| Unpaid Family Workers | 0 | 0.0% |
| Total | 2,422 | 100.0% |
Employment Status by Age in Friendship Heights Village
According to the labor force statistics for Friendship Heights Village, out of the total population over 16 years of age (3,956), 63.9% or 2,528 individuals are in the labor force, with 2.9% or 73 of them unemployed. The age group with the highest labor force participation rate is 35 to 44 years, with 100.0% or 516 individuals in the labor force. Within the labor force, the 65 to 74 years age range has the highest percentage of unemployed individuals, with 26.9% or 43 of them being unemployed.
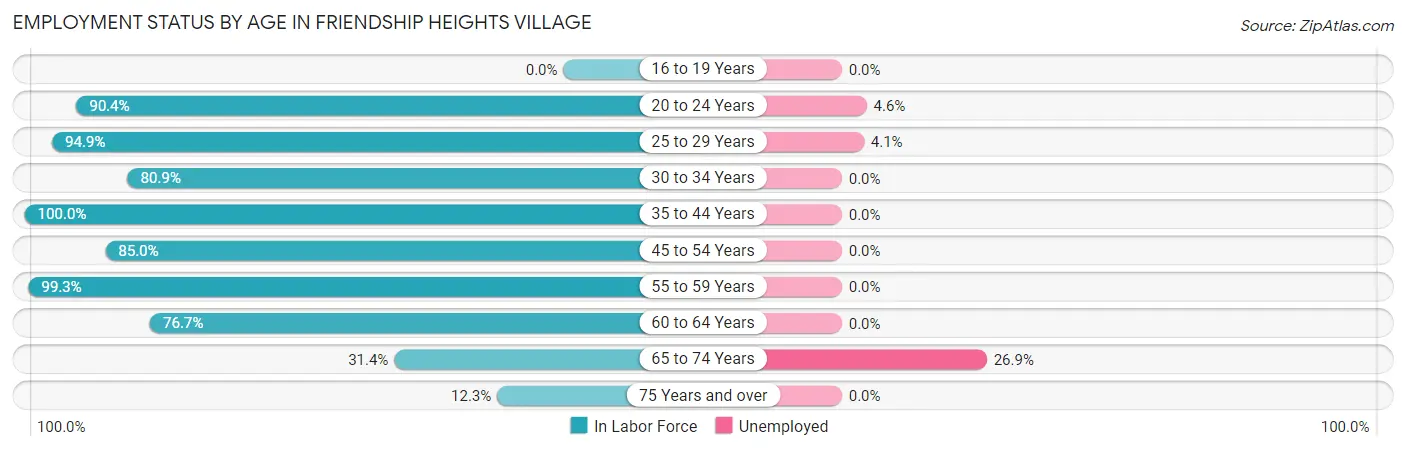
| Age Bracket | In Labor Force | Unemployed |
| 16 to 19 Years | 0 (0.0%) | 0 (0.0%) |
| 20 to 24 Years | 302 (90.4%) | 14 (4.6%) |
| 25 to 29 Years | 394 (94.9%) | 16 (4.1%) |
| 30 to 34 Years | 254 (80.9%) | 0 (0.0%) |
| 35 to 44 Years | 516 (100.0%) | 0 (0.0%) |
| 45 to 54 Years | 379 (85.0%) | 0 (0.0%) |
| 55 to 59 Years | 143 (99.3%) | 0 (0.0%) |
| 60 to 64 Years | 276 (76.7%) | 0 (0.0%) |
| 65 to 74 Years | 160 (31.4%) | 43 (26.9%) |
| 75 Years and over | 105 (12.3%) | 0 (0.0%) |
| Total | 2,528 (63.9%) | 73 (2.9%) |
Employment Status by Educational Attainment in Friendship Heights Village
According to labor force statistics for Friendship Heights Village, 89.4% of individuals (1,962) out of the total population between 25 and 64 years of age (2,195) are in the labor force, with 0.8% or 16 of them being unemployed. The group with the highest labor force participation rate are those with the educational attainment of high school diploma, with 100.0% or 31 individuals in the labor force. Within the labor force, individuals with bachelor's degree or higher education have the highest percentage of unemployment, with 0.9% or 16 of them being unemployed.
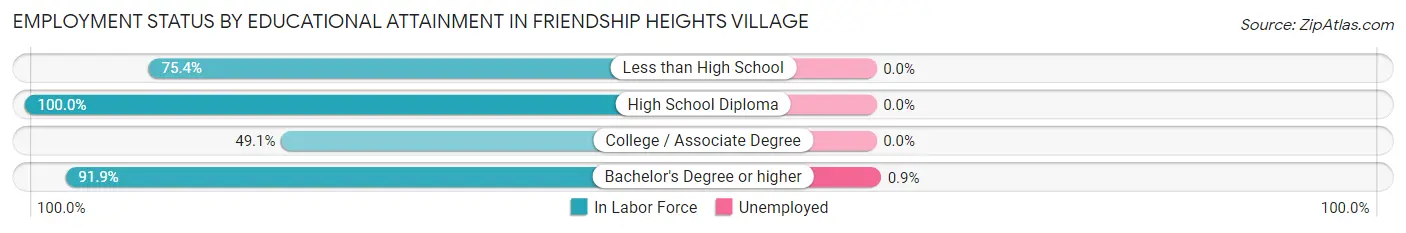
| Educational Attainment | In Labor Force | Unemployed |
| Less than High School | 43 (75.4%) | 0 (0.0%) |
| High School Diploma | 31 (100.0%) | 0 (0.0%) |
| College / Associate Degree | 55 (49.1%) | 0 (0.0%) |
| Bachelor's Degree or higher | 1,833 (91.9%) | 18 (0.9%) |
| Total | 1,962 (89.4%) | 18 (0.8%) |
Employment Occupations by Sex in Friendship Heights Village
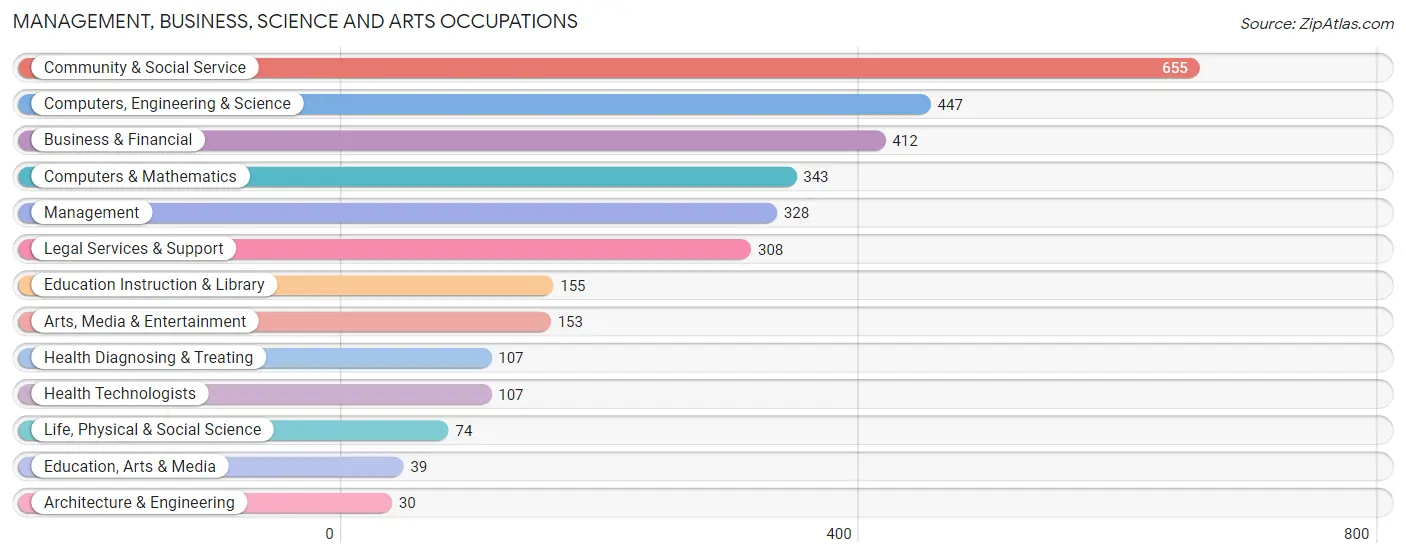
Management, Business, Science and Arts Occupations
The most common Management, Business, Science and Arts occupations in Friendship Heights Village are Community & Social Service (655 | 27.0%), Computers, Engineering & Science (447 | 18.4%), Business & Financial (412 | 17.0%), Computers & Mathematics (343 | 14.1%), and Management (328 | 13.5%).
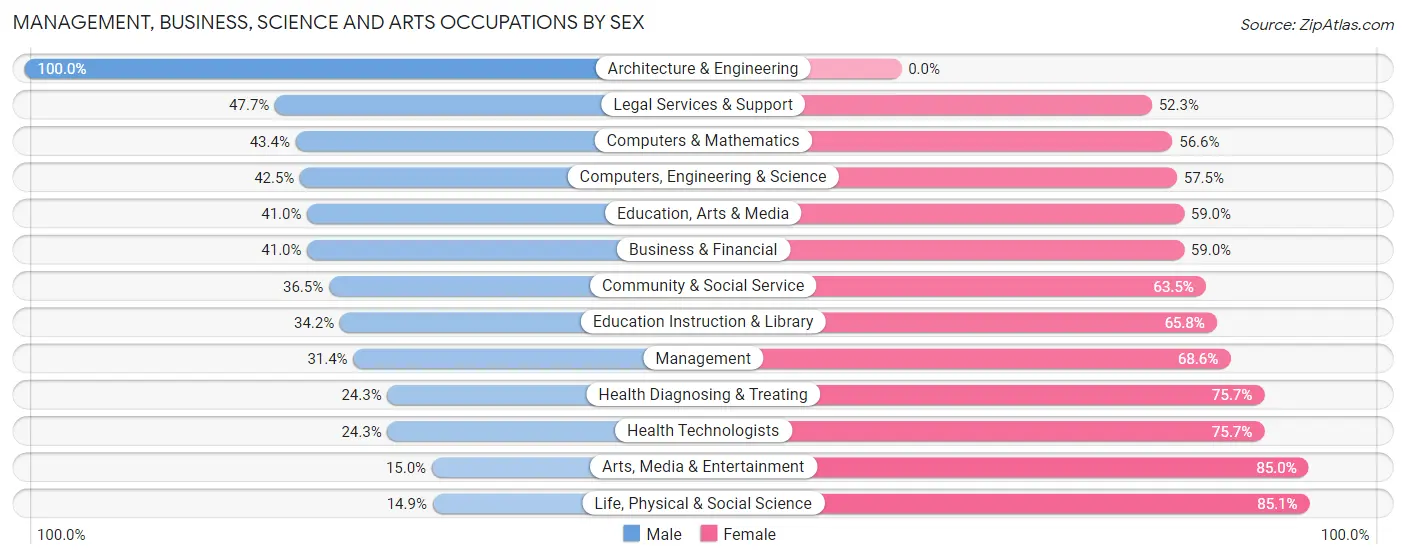
Management, Business, Science and Arts Occupations by Sex
Within the Management, Business, Science and Arts occupations in Friendship Heights Village, the most male-oriented occupations are Architecture & Engineering (100.0%), Legal Services & Support (47.7%), and Computers & Mathematics (43.4%), while the most female-oriented occupations are Life, Physical & Social Science (85.1%), Arts, Media & Entertainment (85.0%), and Health Diagnosing & Treating (75.7%).
| Occupation | Male | Female |
| Management | 103 (31.4%) | 225 (68.6%) |
| Business & Financial | 169 (41.0%) | 243 (59.0%) |
| Computers, Engineering & Science | 190 (42.5%) | 257 (57.5%) |
| Computers & Mathematics | 149 (43.4%) | 194 (56.6%) |
| Architecture & Engineering | 30 (100.0%) | 0 (0.0%) |
| Life, Physical & Social Science | 11 (14.9%) | 63 (85.1%) |
| Community & Social Service | 239 (36.5%) | 416 (63.5%) |
| Education, Arts & Media | 16 (41.0%) | 23 (59.0%) |
| Legal Services & Support | 147 (47.7%) | 161 (52.3%) |
| Education Instruction & Library | 53 (34.2%) | 102 (65.8%) |
| Arts, Media & Entertainment | 23 (15.0%) | 130 (85.0%) |
| Health Diagnosing & Treating | 26 (24.3%) | 81 (75.7%) |
| Health Technologists | 26 (24.3%) | 81 (75.7%) |
| Total (Category) | 727 (37.3%) | 1,222 (62.7%) |
| Total (Overall) | 901 (37.1%) | 1,526 (62.9%) |
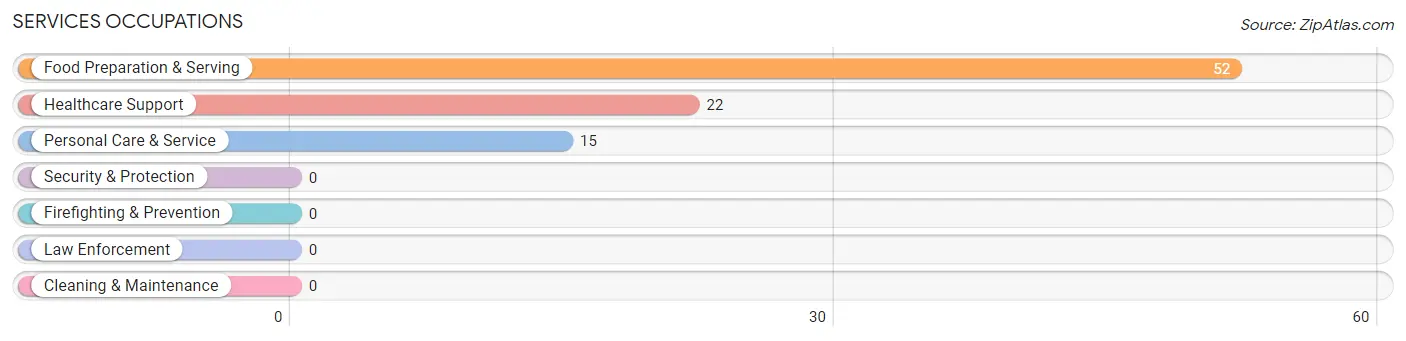
Services Occupations
The most common Services occupations in Friendship Heights Village are Food Preparation & Serving (52 | 2.1%), Healthcare Support (22 | 0.9%), and Personal Care & Service (15 | 0.6%).
Services Occupations by Sex
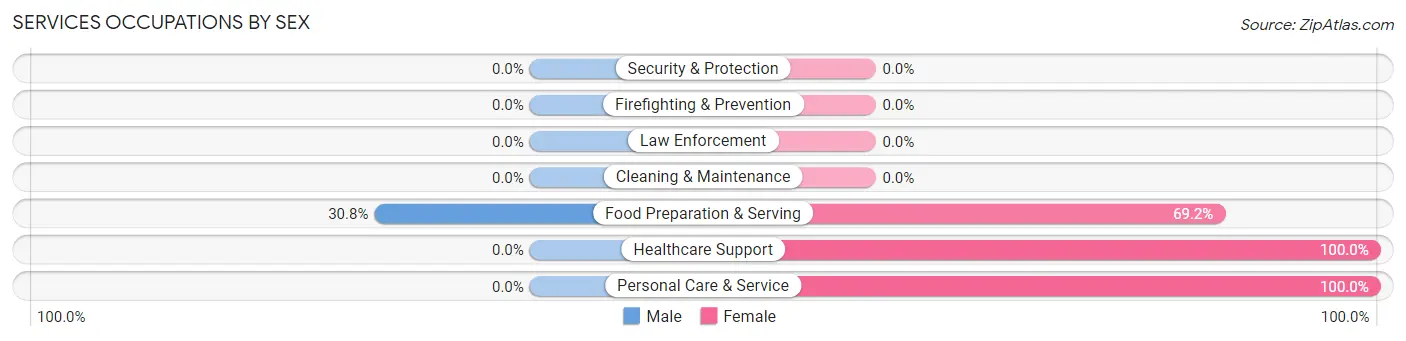
| Occupation | Male | Female |
| Healthcare Support | 0 (0.0%) | 22 (100.0%) |
| Security & Protection | 0 (0.0%) | 0 (0.0%) |
| Firefighting & Prevention | 0 (0.0%) | 0 (0.0%) |
| Law Enforcement | 0 (0.0%) | 0 (0.0%) |
| Food Preparation & Serving | 16 (30.8%) | 36 (69.2%) |
| Cleaning & Maintenance | 0 (0.0%) | 0 (0.0%) |
| Personal Care & Service | 0 (0.0%) | 15 (100.0%) |
| Total (Category) | 16 (18.0%) | 73 (82.0%) |
| Total (Overall) | 901 (37.1%) | 1,526 (62.9%) |
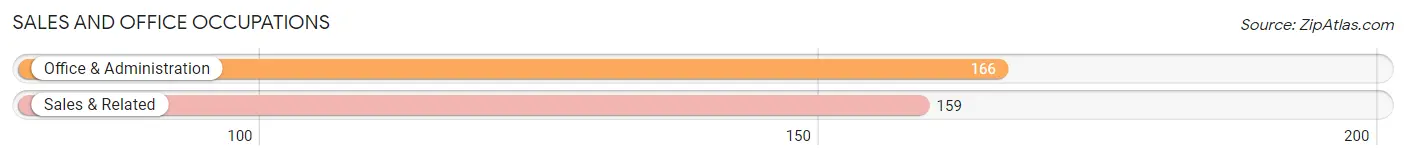
Sales and Office Occupations
The most common Sales and Office occupations in Friendship Heights Village are Office & Administration (166 | 6.8%), and Sales & Related (159 | 6.6%).
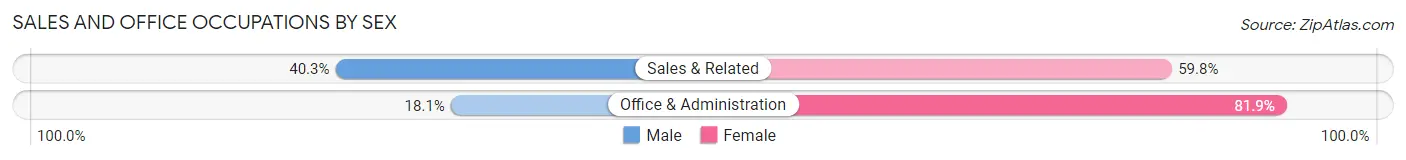
Sales and Office Occupations by Sex
| Occupation | Male | Female |
| Sales & Related | 64 (40.3%) | 95 (59.8%) |
| Office & Administration | 30 (18.1%) | 136 (81.9%) |
| Total (Category) | 94 (28.9%) | 231 (71.1%) |
| Total (Overall) | 901 (37.1%) | 1,526 (62.9%) |
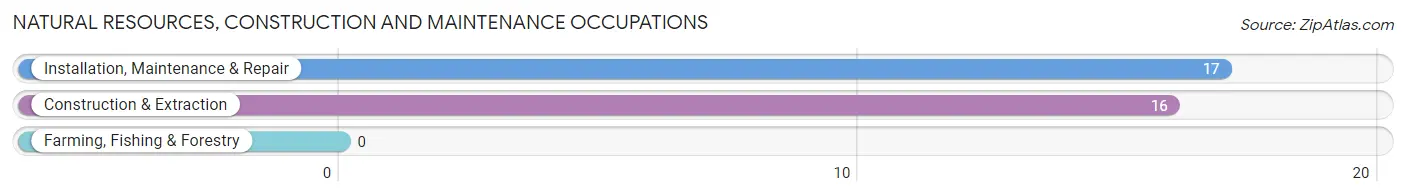
Natural Resources, Construction and Maintenance Occupations
The most common Natural Resources, Construction and Maintenance occupations in Friendship Heights Village are Installation, Maintenance & Repair (17 | 0.7%), and Construction & Extraction (16 | 0.7%).
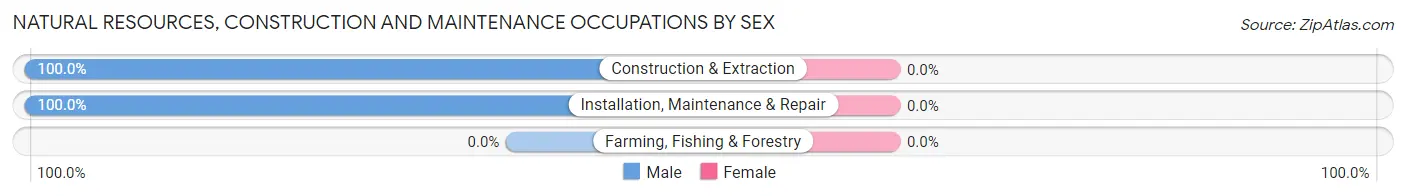
Natural Resources, Construction and Maintenance Occupations by Sex
| Occupation | Male | Female |
| Farming, Fishing & Forestry | 0 (0.0%) | 0 (0.0%) |
| Construction & Extraction | 16 (100.0%) | 0 (0.0%) |
| Installation, Maintenance & Repair | 17 (100.0%) | 0 (0.0%) |
| Total (Category) | 33 (100.0%) | 0 (0.0%) |
| Total (Overall) | 901 (37.1%) | 1,526 (62.9%) |
Production, Transportation and Moving Occupations
The most common Production, Transportation and Moving occupations in Friendship Heights Village are Transportation (27 | 1.1%), and Production (4 | 0.2%).
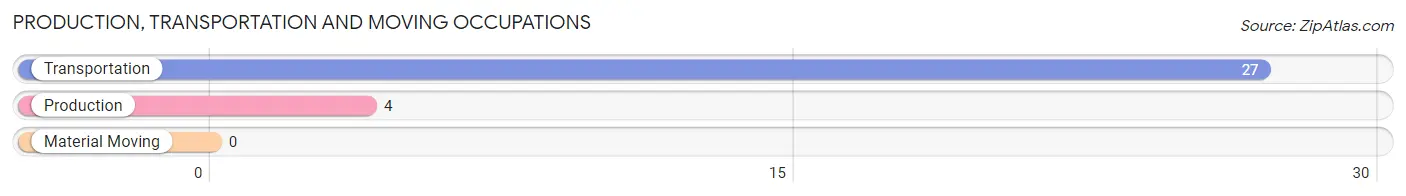
Production, Transportation and Moving Occupations by Sex
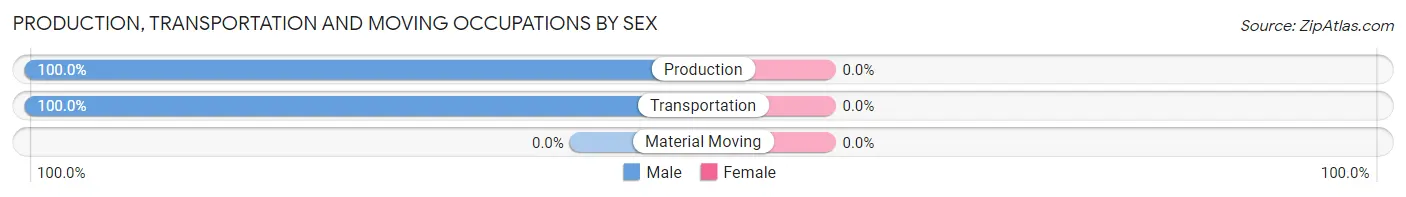
| Occupation | Male | Female |
| Production | 4 (100.0%) | 0 (0.0%) |
| Transportation | 27 (100.0%) | 0 (0.0%) |
| Material Moving | 0 (0.0%) | 0 (0.0%) |
| Total (Category) | 31 (100.0%) | 0 (0.0%) |
| Total (Overall) | 901 (37.1%) | 1,526 (62.9%) |
Employment Industries by Sex in Friendship Heights Village
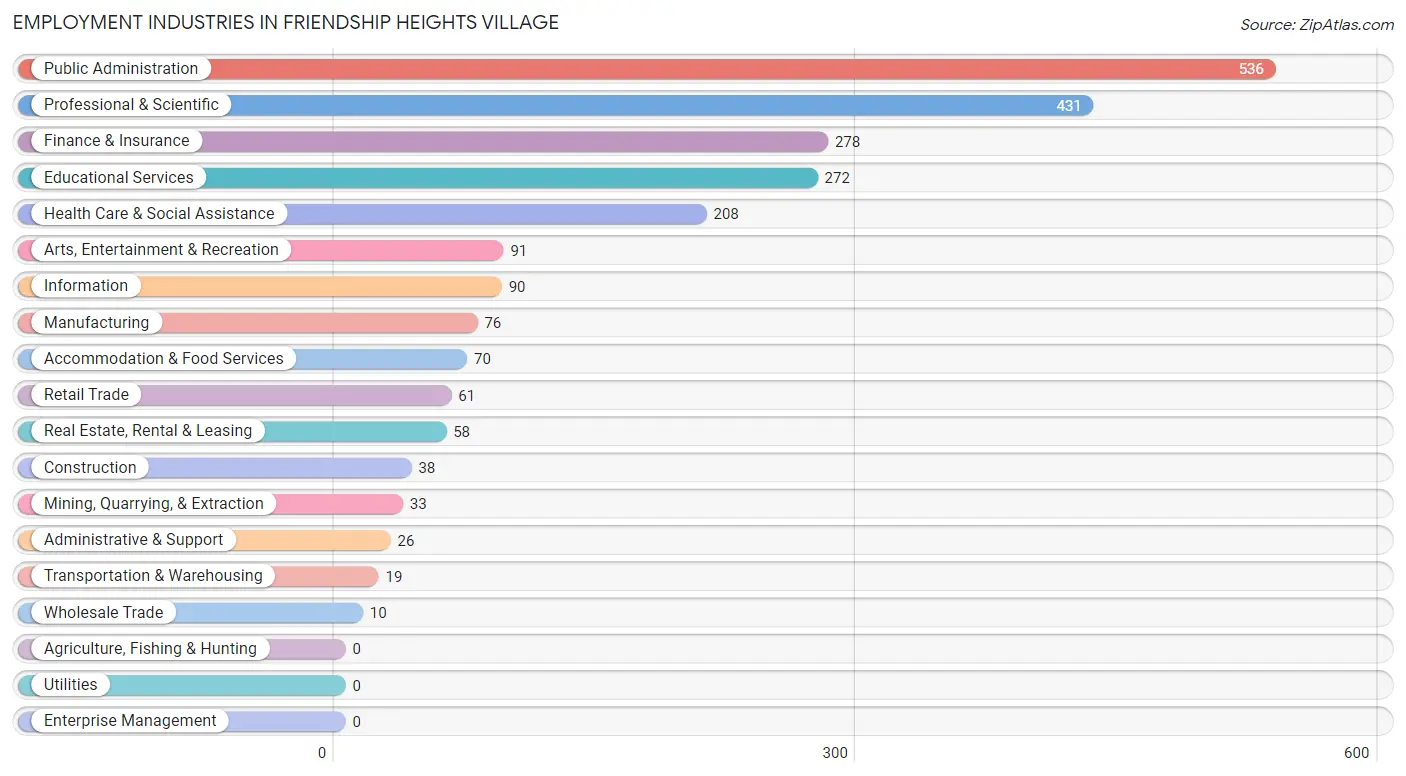
Employment Industries in Friendship Heights Village
The major employment industries in Friendship Heights Village include Public Administration (536 | 22.1%), Professional & Scientific (431 | 17.8%), Finance & Insurance (278 | 11.5%), Educational Services (272 | 11.2%), and Health Care & Social Assistance (208 | 8.6%).
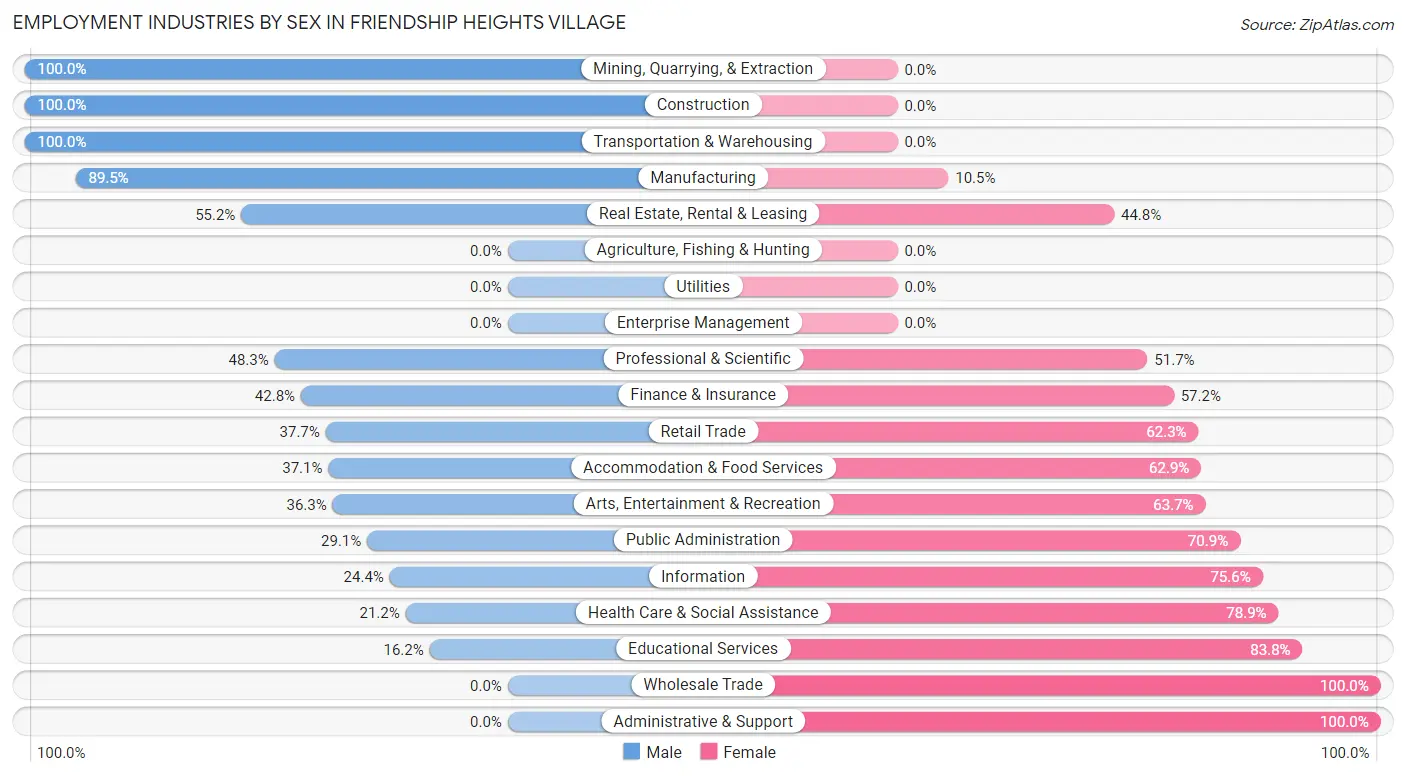
Employment Industries by Sex in Friendship Heights Village
The Friendship Heights Village industries that see more men than women are Mining, Quarrying, & Extraction (100.0%), Construction (100.0%), and Transportation & Warehousing (100.0%), whereas the industries that tend to have a higher number of women are Wholesale Trade (100.0%), Administrative & Support (100.0%), and Educational Services (83.8%).
| Industry | Male | Female |
| Agriculture, Fishing & Hunting | 0 (0.0%) | 0 (0.0%) |
| Mining, Quarrying, & Extraction | 33 (100.0%) | 0 (0.0%) |
| Construction | 38 (100.0%) | 0 (0.0%) |
| Manufacturing | 68 (89.5%) | 8 (10.5%) |
| Wholesale Trade | 0 (0.0%) | 10 (100.0%) |
| Retail Trade | 23 (37.7%) | 38 (62.3%) |
| Transportation & Warehousing | 19 (100.0%) | 0 (0.0%) |
| Utilities | 0 (0.0%) | 0 (0.0%) |
| Information | 22 (24.4%) | 68 (75.6%) |
| Finance & Insurance | 119 (42.8%) | 159 (57.2%) |
| Real Estate, Rental & Leasing | 32 (55.2%) | 26 (44.8%) |
| Professional & Scientific | 208 (48.3%) | 223 (51.7%) |
| Enterprise Management | 0 (0.0%) | 0 (0.0%) |
| Administrative & Support | 0 (0.0%) | 26 (100.0%) |
| Educational Services | 44 (16.2%) | 228 (83.8%) |
| Health Care & Social Assistance | 44 (21.1%) | 164 (78.8%) |
| Arts, Entertainment & Recreation | 33 (36.3%) | 58 (63.7%) |
| Accommodation & Food Services | 26 (37.1%) | 44 (62.9%) |
| Public Administration | 156 (29.1%) | 380 (70.9%) |
| Total | 901 (37.1%) | 1,526 (62.9%) |
Education in Friendship Heights Village
School Enrollment in Friendship Heights Village
The most common levels of schooling among the 523 students in Friendship Heights Village are college / undergraduate (158 | 30.2%), graduate / professional (117 | 22.4%), and high school (83 | 15.9%).
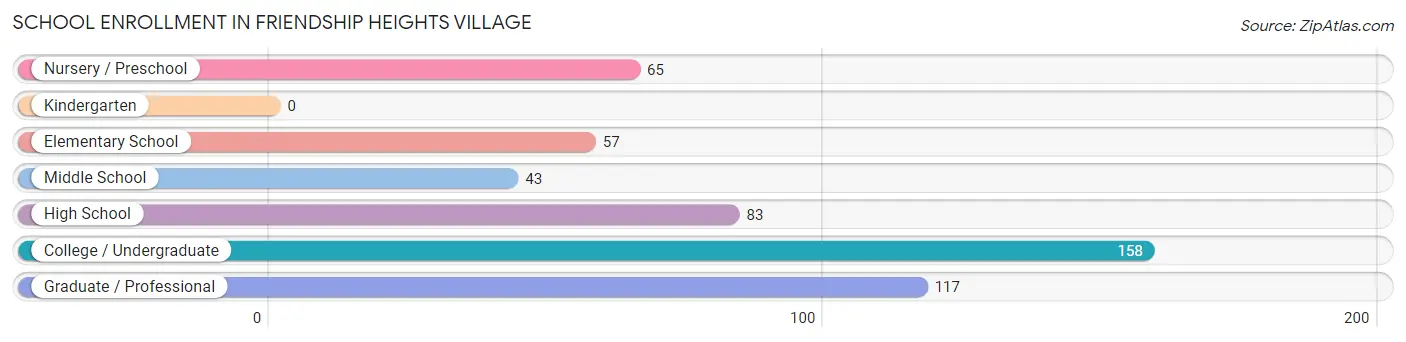
| School Level | # Students | % Students |
| Nursery / Preschool | 65 | 12.4% |
| Kindergarten | 0 | 0.0% |
| Elementary School | 57 | 10.9% |
| Middle School | 43 | 8.2% |
| High School | 83 | 15.9% |
| College / Undergraduate | 158 | 30.2% |
| Graduate / Professional | 117 | 22.4% |
| Total | 523 | 100.0% |
School Enrollment by Age by Funding Source in Friendship Heights Village
Out of a total of 523 students who are enrolled in schools in Friendship Heights Village, 300 (57.4%) attend a private institution, while the remaining 223 (42.6%) are enrolled in public schools. The age group of 3 to 4 year olds has the highest likelihood of being enrolled in private schools, with 43 (100.0% in the age bracket) enrolled. Conversely, the age group of 35 years and over has the lowest likelihood of being enrolled in a private school, with 60 (100.0% in the age bracket) attending a public institution.
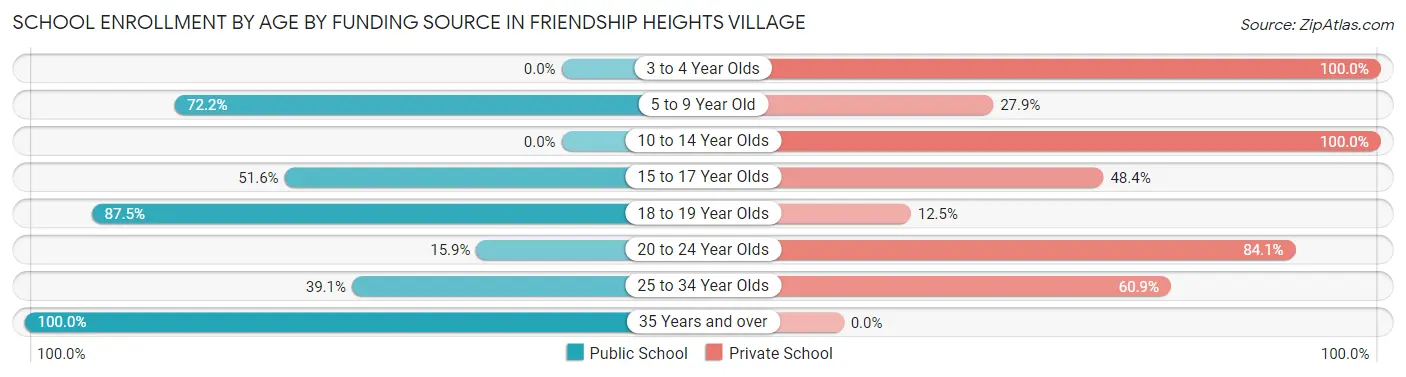
| Age Bracket | Public School | Private School |
| 3 to 4 Year Olds | 0 (0.0%) | 43 (100.0%) |
| 5 to 9 Year Old | 57 (72.2%) | 22 (27.9%) |
| 10 to 14 Year Olds | 0 (0.0%) | 53 (100.0%) |
| 15 to 17 Year Olds | 16 (51.6%) | 15 (48.4%) |
| 18 to 19 Year Olds | 42 (87.5%) | 6 (12.5%) |
| 20 to 24 Year Olds | 23 (15.9%) | 122 (84.1%) |
| 25 to 34 Year Olds | 25 (39.1%) | 39 (60.9%) |
| 35 Years and over | 60 (100.0%) | 0 (0.0%) |
| Total | 223 (42.6%) | 300 (57.4%) |
Educational Attainment by Field of Study in Friendship Heights Village
Social sciences (782 | 21.9%), business (439 | 12.3%), literature & languages (341 | 9.5%), liberal arts & history (341 | 9.5%), and visual & performing arts (299 | 8.4%) are the most common fields of study among 3,574 individuals in Friendship Heights Village who have obtained a bachelor's degree or higher.
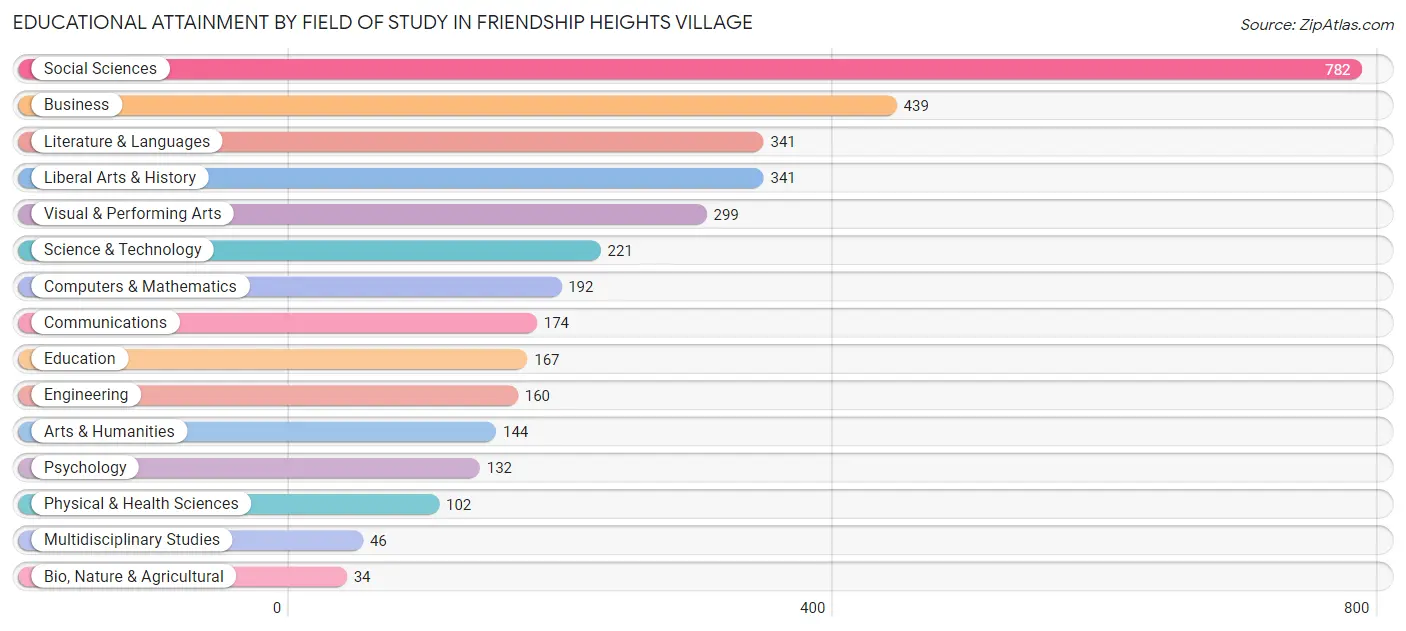
| Field of Study | # Graduates | % Graduates |
| Computers & Mathematics | 192 | 5.4% |
| Bio, Nature & Agricultural | 34 | 0.9% |
| Physical & Health Sciences | 102 | 2.9% |
| Psychology | 132 | 3.7% |
| Social Sciences | 782 | 21.9% |
| Engineering | 160 | 4.5% |
| Multidisciplinary Studies | 46 | 1.3% |
| Science & Technology | 221 | 6.2% |
| Business | 439 | 12.3% |
| Education | 167 | 4.7% |
| Literature & Languages | 341 | 9.5% |
| Liberal Arts & History | 341 | 9.5% |
| Visual & Performing Arts | 299 | 8.4% |
| Communications | 174 | 4.9% |
| Arts & Humanities | 144 | 4.0% |
| Total | 3,574 | 100.0% |
Transportation & Commute in Friendship Heights Village
Vehicle Availability by Sex in Friendship Heights Village
The most prevalent vehicle ownership categories in Friendship Heights Village are males with 1 vehicle (508, accounting for 55.3%) and females with 1 vehicle (731, making up 33.8%).
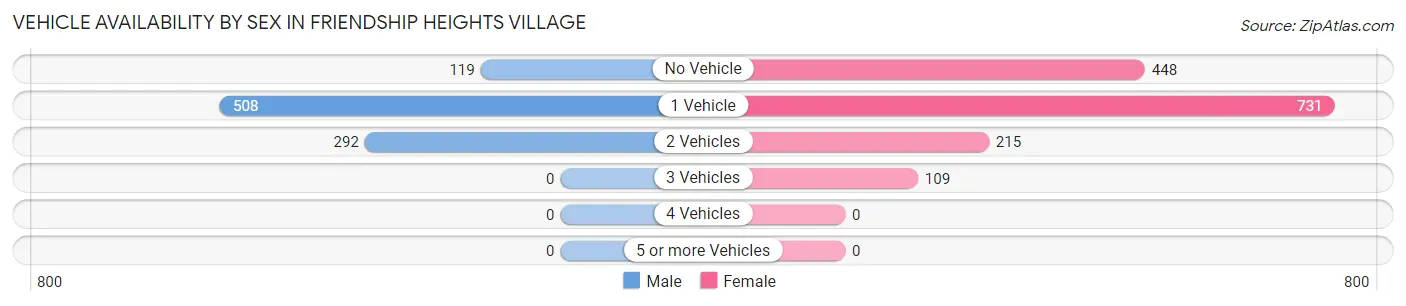
| Vehicles Available | Male | Female |
| No Vehicle | 119 (13.0%) | 448 (29.8%) |
| 1 Vehicle | 508 (55.3%) | 731 (48.6%) |
| 2 Vehicles | 292 (31.8%) | 215 (14.3%) |
| 3 Vehicles | 0 (0.0%) | 109 (7.2%) |
| 4 Vehicles | 0 (0.0%) | 0 (0.0%) |
| 5 or more Vehicles | 0 (0.0%) | 0 (0.0%) |
| Total | 919 (100.0%) | 1,503 (100.0%) |
Commute Time in Friendship Heights Village
The most frequently occuring commute durations in Friendship Heights Village are 30 to 34 minutes (403 commuters, 23.5%), 45 to 59 minutes (253 commuters, 14.7%), and 40 to 44 minutes (215 commuters, 12.5%).
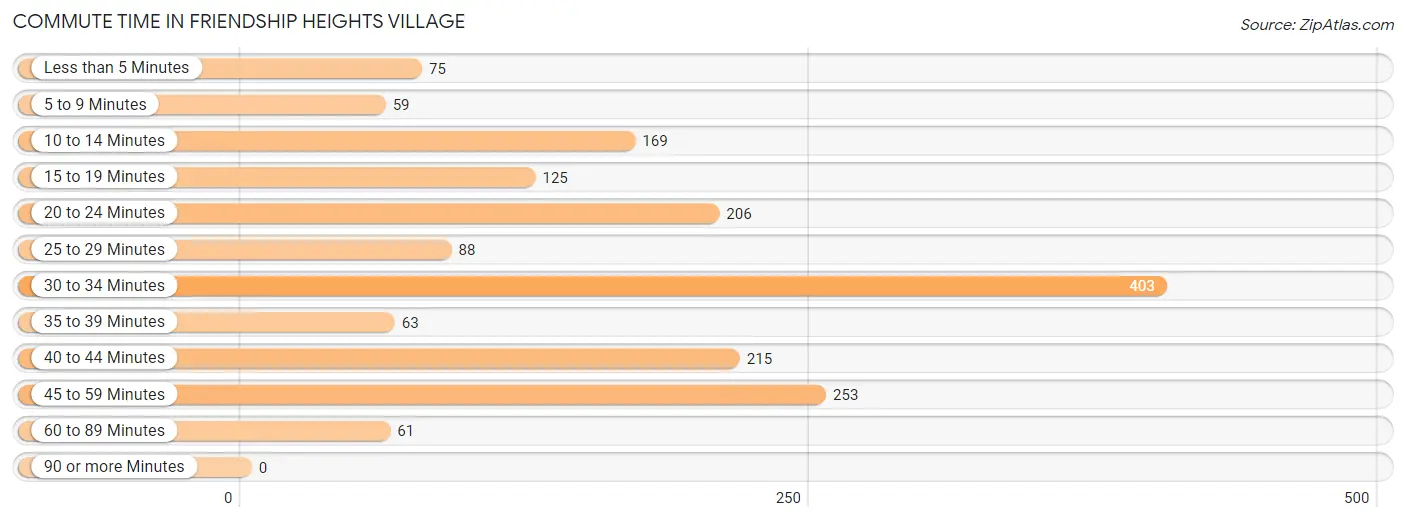
| Commute Time | # Commuters | % Commuters |
| Less than 5 Minutes | 75 | 4.4% |
| 5 to 9 Minutes | 59 | 3.4% |
| 10 to 14 Minutes | 169 | 9.8% |
| 15 to 19 Minutes | 125 | 7.3% |
| 20 to 24 Minutes | 206 | 12.0% |
| 25 to 29 Minutes | 88 | 5.1% |
| 30 to 34 Minutes | 403 | 23.5% |
| 35 to 39 Minutes | 63 | 3.7% |
| 40 to 44 Minutes | 215 | 12.5% |
| 45 to 59 Minutes | 253 | 14.7% |
| 60 to 89 Minutes | 61 | 3.5% |
| 90 or more Minutes | 0 | 0.0% |
Commute Time by Sex in Friendship Heights Village
The most common commute times in Friendship Heights Village are 30 to 34 minutes (146 commuters, 23.3%) for males and 30 to 34 minutes (257 commuters, 23.6%) for females.
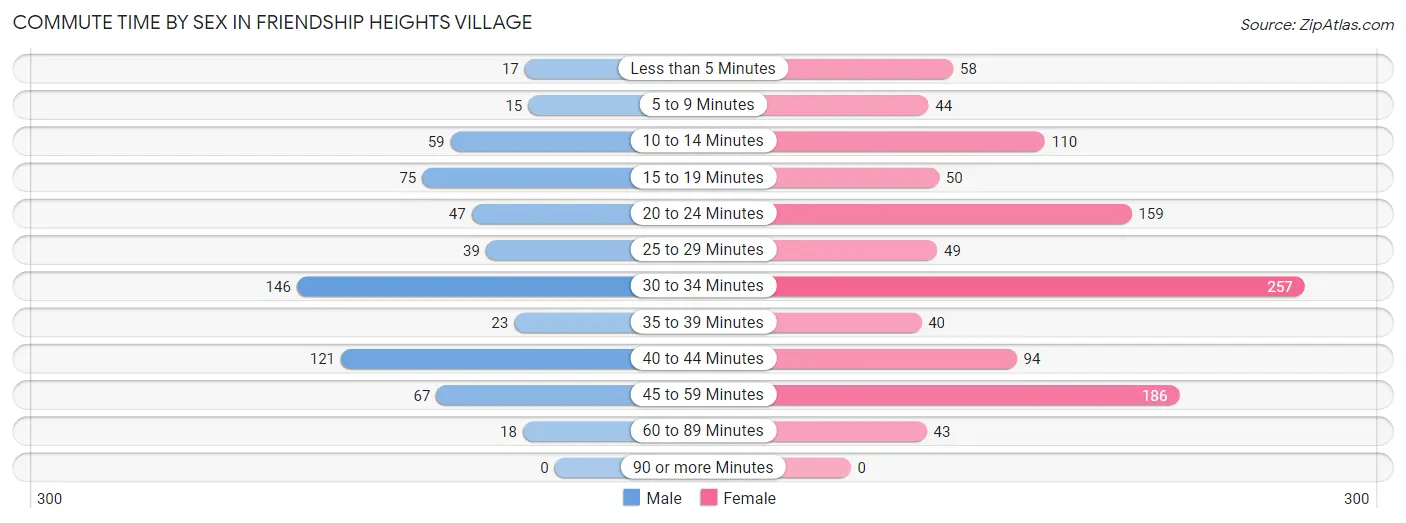
| Commute Time | Male | Female |
| Less than 5 Minutes | 17 (2.7%) | 58 (5.3%) |
| 5 to 9 Minutes | 15 (2.4%) | 44 (4.0%) |
| 10 to 14 Minutes | 59 (9.4%) | 110 (10.1%) |
| 15 to 19 Minutes | 75 (12.0%) | 50 (4.6%) |
| 20 to 24 Minutes | 47 (7.5%) | 159 (14.6%) |
| 25 to 29 Minutes | 39 (6.2%) | 49 (4.5%) |
| 30 to 34 Minutes | 146 (23.3%) | 257 (23.6%) |
| 35 to 39 Minutes | 23 (3.7%) | 40 (3.7%) |
| 40 to 44 Minutes | 121 (19.3%) | 94 (8.6%) |
| 45 to 59 Minutes | 67 (10.7%) | 186 (17.1%) |
| 60 to 89 Minutes | 18 (2.9%) | 43 (3.9%) |
| 90 or more Minutes | 0 (0.0%) | 0 (0.0%) |
Time of Departure to Work by Sex in Friendship Heights Village
The most frequent times of departure to work in Friendship Heights Village are 8:00 AM to 8:29 AM (187, 29.8%) for males and 8:00 AM to 8:29 AM (257, 23.6%) for females.
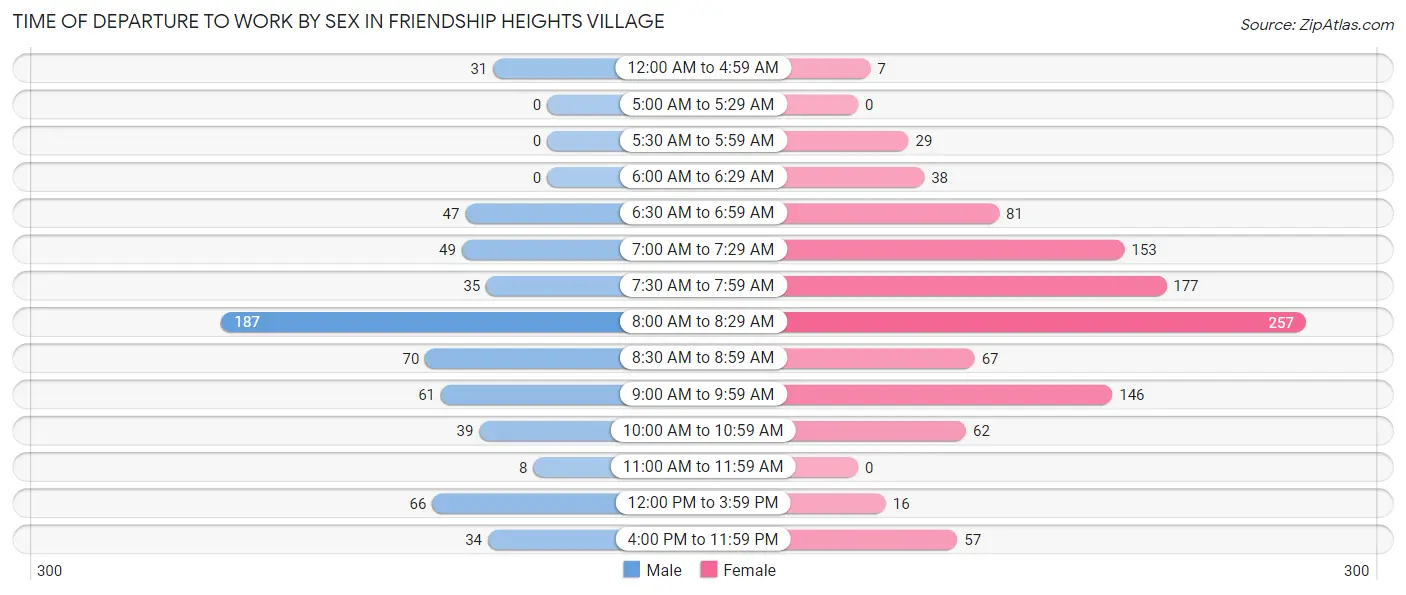
| Time of Departure | Male | Female |
| 12:00 AM to 4:59 AM | 31 (4.9%) | 7 (0.6%) |
| 5:00 AM to 5:29 AM | 0 (0.0%) | 0 (0.0%) |
| 5:30 AM to 5:59 AM | 0 (0.0%) | 29 (2.7%) |
| 6:00 AM to 6:29 AM | 0 (0.0%) | 38 (3.5%) |
| 6:30 AM to 6:59 AM | 47 (7.5%) | 81 (7.4%) |
| 7:00 AM to 7:29 AM | 49 (7.8%) | 153 (14.0%) |
| 7:30 AM to 7:59 AM | 35 (5.6%) | 177 (16.2%) |
| 8:00 AM to 8:29 AM | 187 (29.8%) | 257 (23.6%) |
| 8:30 AM to 8:59 AM | 70 (11.2%) | 67 (6.1%) |
| 9:00 AM to 9:59 AM | 61 (9.7%) | 146 (13.4%) |
| 10:00 AM to 10:59 AM | 39 (6.2%) | 62 (5.7%) |
| 11:00 AM to 11:59 AM | 8 (1.3%) | 0 (0.0%) |
| 12:00 PM to 3:59 PM | 66 (10.5%) | 16 (1.5%) |
| 4:00 PM to 11:59 PM | 34 (5.4%) | 57 (5.2%) |
| Total | 627 (100.0%) | 1,090 (100.0%) |
Housing Occupancy in Friendship Heights Village
Occupancy by Ownership in Friendship Heights Village
Of the total 2,694 dwellings in Friendship Heights Village, owner-occupied units account for 1,076 (39.9%), while renter-occupied units make up 1,618 (60.1%).
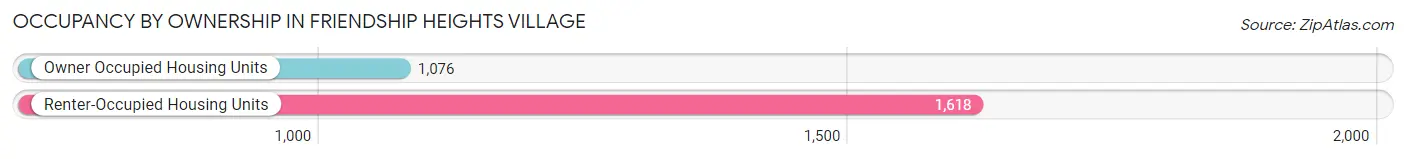
| Occupancy | # Housing Units | % Housing Units |
| Owner Occupied Housing Units | 1,076 | 39.9% |
| Renter-Occupied Housing Units | 1,618 | 60.1% |
| Total Occupied Housing Units | 2,694 | 100.0% |
Occupancy by Household Size in Friendship Heights Village
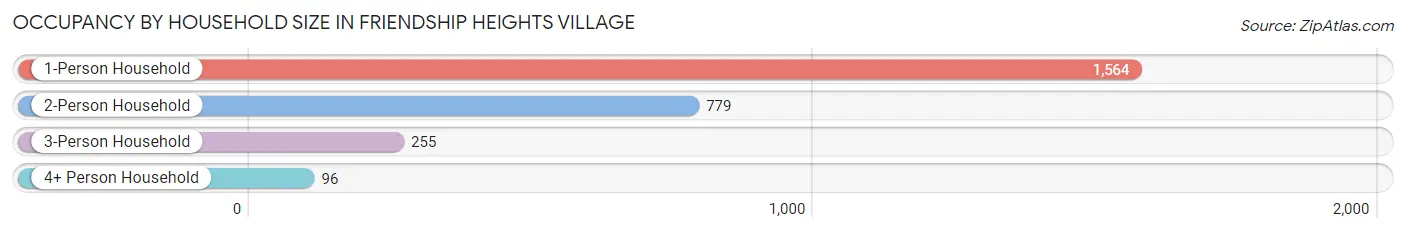
| Household Size | # Housing Units | % Housing Units |
| 1-Person Household | 1,564 | 58.1% |
| 2-Person Household | 779 | 28.9% |
| 3-Person Household | 255 | 9.5% |
| 4+ Person Household | 96 | 3.6% |
| Total Housing Units | 2,694 | 100.0% |
Occupancy by Ownership by Household Size in Friendship Heights Village
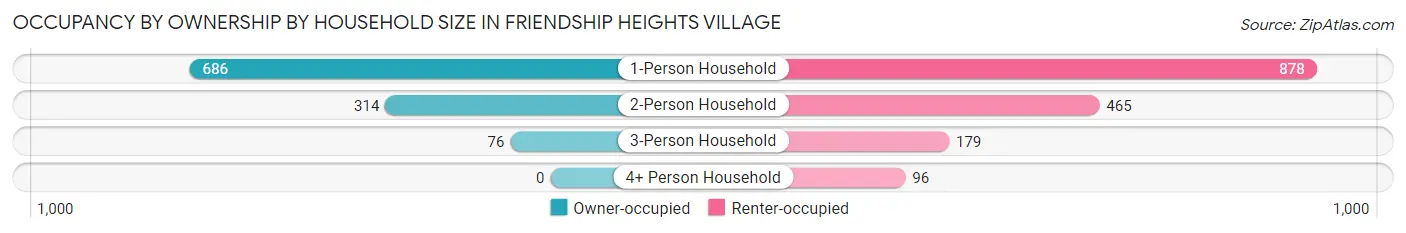
| Household Size | Owner-occupied | Renter-occupied |
| 1-Person Household | 686 (43.9%) | 878 (56.1%) |
| 2-Person Household | 314 (40.3%) | 465 (59.7%) |
| 3-Person Household | 76 (29.8%) | 179 (70.2%) |
| 4+ Person Household | 0 (0.0%) | 96 (100.0%) |
| Total Housing Units | 1,076 (39.9%) | 1,618 (60.1%) |
Occupancy by Educational Attainment in Friendship Heights Village
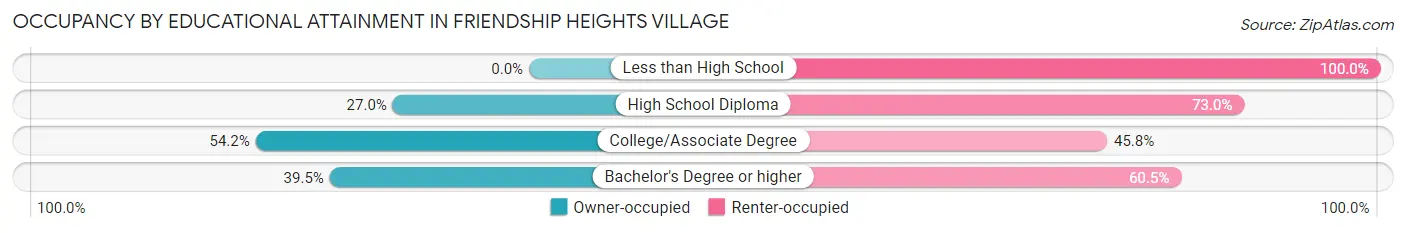
| Household Size | Owner-occupied | Renter-occupied |
| Less than High School | 0 (0.0%) | 17 (100.0%) |
| High School Diploma | 40 (27.0%) | 108 (73.0%) |
| College/Associate Degree | 135 (54.2%) | 114 (45.8%) |
| Bachelor's Degree or higher | 901 (39.5%) | 1,379 (60.5%) |
Occupancy by Age of Householder in Friendship Heights Village
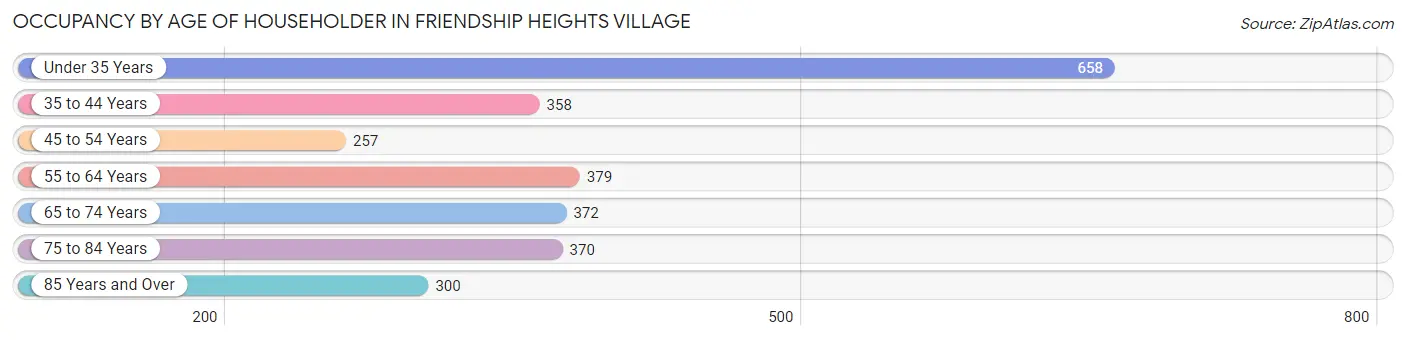
| Age Bracket | # Households | % Households |
| Under 35 Years | 658 | 24.4% |
| 35 to 44 Years | 358 | 13.3% |
| 45 to 54 Years | 257 | 9.5% |
| 55 to 64 Years | 379 | 14.1% |
| 65 to 74 Years | 372 | 13.8% |
| 75 to 84 Years | 370 | 13.7% |
| 85 Years and Over | 300 | 11.1% |
| Total | 2,694 | 100.0% |
Housing Finances in Friendship Heights Village
Median Income by Occupancy in Friendship Heights Village
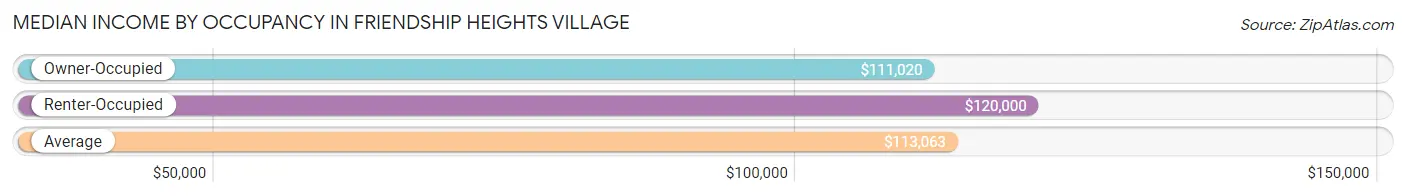
| Occupancy Type | # Households | Median Income |
| Owner-Occupied | 1,076 (39.9%) | $111,020 |
| Renter-Occupied | 1,618 (60.1%) | $120,000 |
| Average | 2,694 (100.0%) | $113,063 |
Occupancy by Householder Income Bracket in Friendship Heights Village
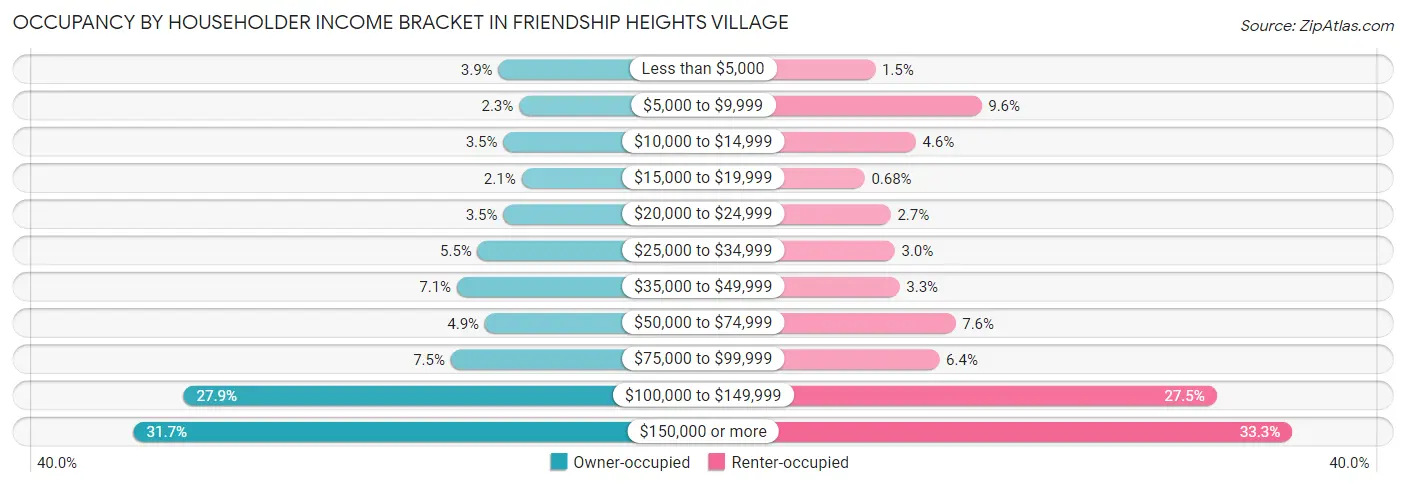
| Income Bracket | Owner-occupied | Renter-occupied |
| Less than $5,000 | 42 (3.9%) | 24 (1.5%) |
| $5,000 to $9,999 | 25 (2.3%) | 155 (9.6%) |
| $10,000 to $14,999 | 38 (3.5%) | 74 (4.6%) |
| $15,000 to $19,999 | 23 (2.1%) | 11 (0.7%) |
| $20,000 to $24,999 | 38 (3.5%) | 43 (2.7%) |
| $25,000 to $34,999 | 59 (5.5%) | 48 (3.0%) |
| $35,000 to $49,999 | 76 (7.1%) | 54 (3.3%) |
| $50,000 to $74,999 | 53 (4.9%) | 123 (7.6%) |
| $75,000 to $99,999 | 81 (7.5%) | 103 (6.4%) |
| $100,000 to $149,999 | 300 (27.9%) | 445 (27.5%) |
| $150,000 or more | 341 (31.7%) | 538 (33.3%) |
| Total | 1,076 (100.0%) | 1,618 (100.0%) |
Monthly Housing Cost Tiers in Friendship Heights Village
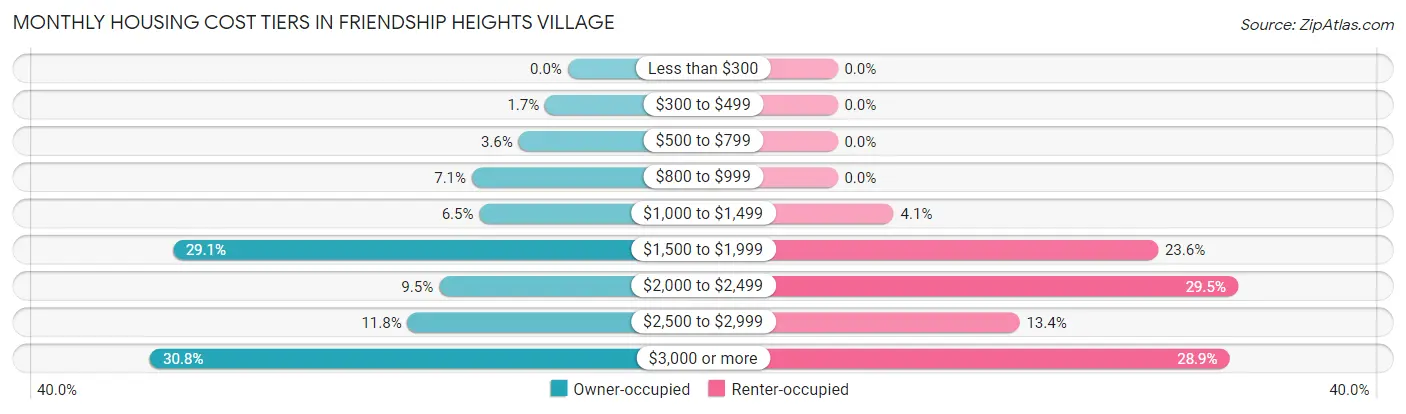
| Monthly Cost | Owner-occupied | Renter-occupied |
| Less than $300 | 0 (0.0%) | 0 (0.0%) |
| $300 to $499 | 18 (1.7%) | 0 (0.0%) |
| $500 to $799 | 39 (3.6%) | 0 (0.0%) |
| $800 to $999 | 76 (7.1%) | 0 (0.0%) |
| $1,000 to $1,499 | 70 (6.5%) | 67 (4.1%) |
| $1,500 to $1,999 | 313 (29.1%) | 382 (23.6%) |
| $2,000 to $2,499 | 102 (9.5%) | 477 (29.5%) |
| $2,500 to $2,999 | 127 (11.8%) | 217 (13.4%) |
| $3,000 or more | 331 (30.8%) | 467 (28.9%) |
| Total | 1,076 (100.0%) | 1,618 (100.0%) |
Physical Housing Characteristics in Friendship Heights Village
Housing Structures in Friendship Heights Village
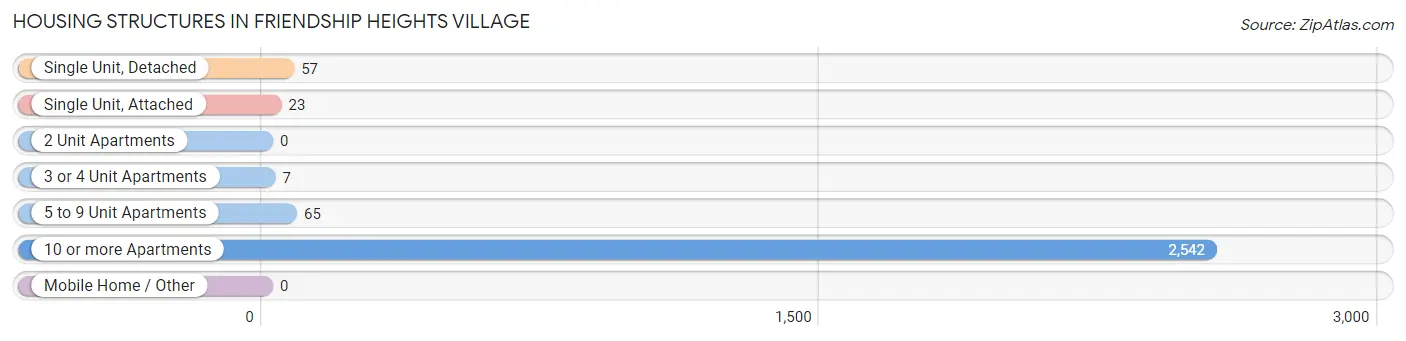
| Structure Type | # Housing Units | % Housing Units |
| Single Unit, Detached | 57 | 2.1% |
| Single Unit, Attached | 23 | 0.9% |
| 2 Unit Apartments | 0 | 0.0% |
| 3 or 4 Unit Apartments | 7 | 0.3% |
| 5 to 9 Unit Apartments | 65 | 2.4% |
| 10 or more Apartments | 2,542 | 94.4% |
| Mobile Home / Other | 0 | 0.0% |
| Total | 2,694 | 100.0% |
Housing Structures by Occupancy in Friendship Heights Village
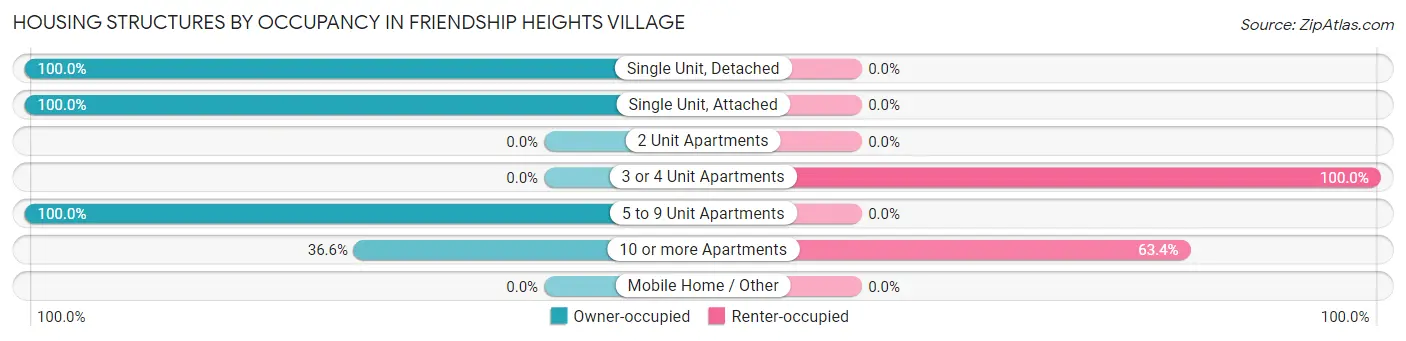
| Structure Type | Owner-occupied | Renter-occupied |
| Single Unit, Detached | 57 (100.0%) | 0 (0.0%) |
| Single Unit, Attached | 23 (100.0%) | 0 (0.0%) |
| 2 Unit Apartments | 0 (0.0%) | 0 (0.0%) |
| 3 or 4 Unit Apartments | 0 (0.0%) | 7 (100.0%) |
| 5 to 9 Unit Apartments | 65 (100.0%) | 0 (0.0%) |
| 10 or more Apartments | 931 (36.6%) | 1,611 (63.4%) |
| Mobile Home / Other | 0 (0.0%) | 0 (0.0%) |
| Total | 1,076 (39.9%) | 1,618 (60.1%) |
Housing Structures by Number of Rooms in Friendship Heights Village
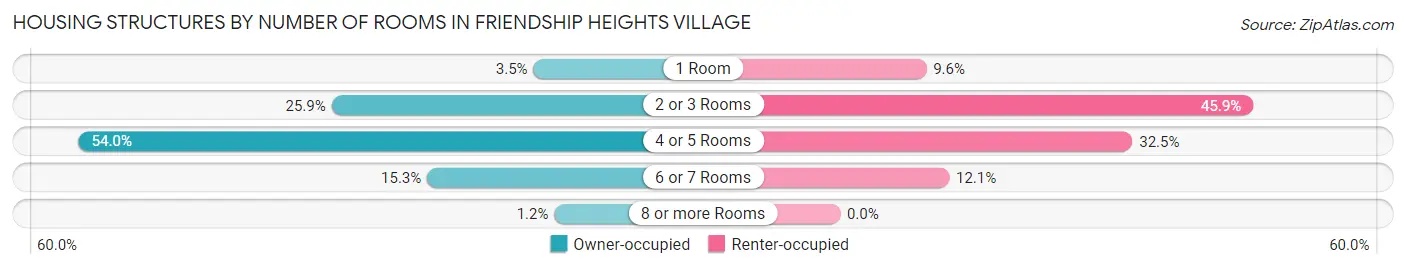
| Number of Rooms | Owner-occupied | Renter-occupied |
| 1 Room | 38 (3.5%) | 155 (9.6%) |
| 2 or 3 Rooms | 279 (25.9%) | 742 (45.9%) |
| 4 or 5 Rooms | 581 (54.0%) | 525 (32.5%) |
| 6 or 7 Rooms | 165 (15.3%) | 196 (12.1%) |
| 8 or more Rooms | 13 (1.2%) | 0 (0.0%) |
| Total | 1,076 (100.0%) | 1,618 (100.0%) |
Housing Structure by Heating Type in Friendship Heights Village
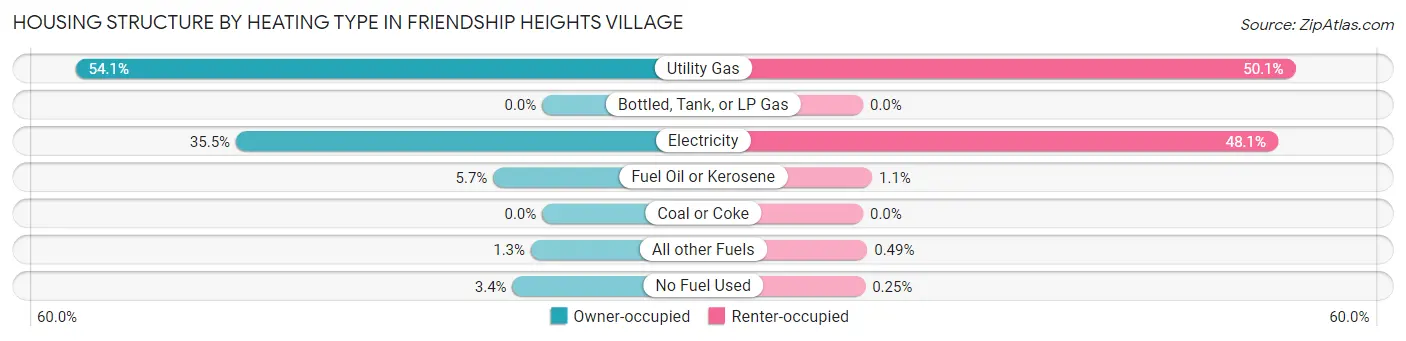
| Heating Type | Owner-occupied | Renter-occupied |
| Utility Gas | 582 (54.1%) | 811 (50.1%) |
| Bottled, Tank, or LP Gas | 0 (0.0%) | 0 (0.0%) |
| Electricity | 382 (35.5%) | 778 (48.1%) |
| Fuel Oil or Kerosene | 61 (5.7%) | 17 (1.1%) |
| Coal or Coke | 0 (0.0%) | 0 (0.0%) |
| All other Fuels | 14 (1.3%) | 8 (0.5%) |
| No Fuel Used | 37 (3.4%) | 4 (0.3%) |
| Total | 1,076 (100.0%) | 1,618 (100.0%) |
Household Vehicle Usage in Friendship Heights Village
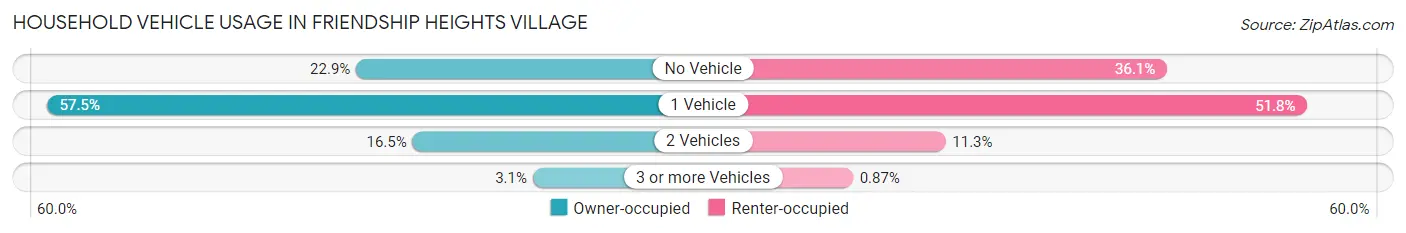
| Vehicles per Household | Owner-occupied | Renter-occupied |
| No Vehicle | 246 (22.9%) | 584 (36.1%) |
| 1 Vehicle | 619 (57.5%) | 838 (51.8%) |
| 2 Vehicles | 178 (16.5%) | 182 (11.3%) |
| 3 or more Vehicles | 33 (3.1%) | 14 (0.9%) |
| Total | 1,076 (100.0%) | 1,618 (100.0%) |
Real Estate & Mortgages in Friendship Heights Village
Real Estate and Mortgage Overview in Friendship Heights Village
| Characteristic | Without Mortgage | With Mortgage |
| Housing Units | 604 | 472 |
| Median Property Value | $468,300 | $542,100 |
| Median Household Income | $69,342 | $225 |
| Monthly Housing Costs | $1,501 | $291 |
| Real Estate Taxes | $5,006 | $0 |
Property Value by Mortgage Status in Friendship Heights Village
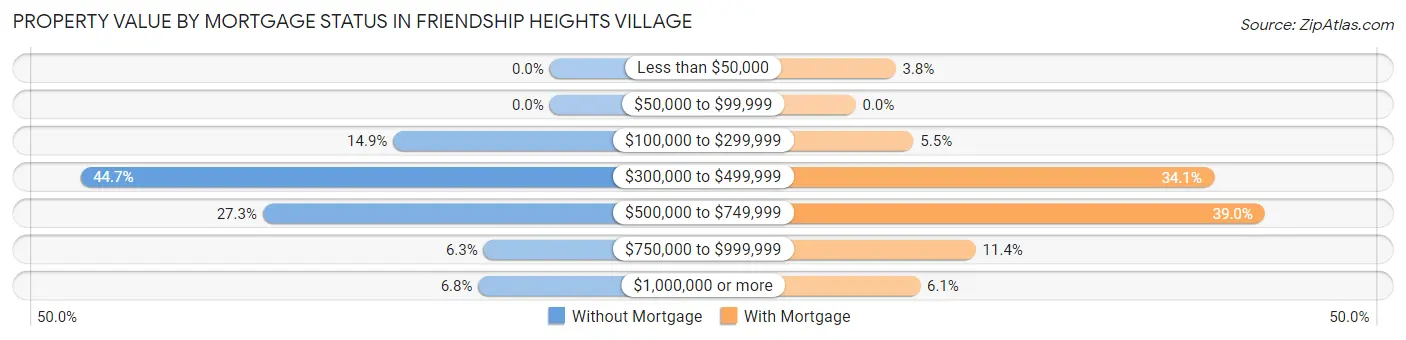
| Property Value | Without Mortgage | With Mortgage |
| Less than $50,000 | 0 (0.0%) | 18 (3.8%) |
| $50,000 to $99,999 | 0 (0.0%) | 0 (0.0%) |
| $100,000 to $299,999 | 90 (14.9%) | 26 (5.5%) |
| $300,000 to $499,999 | 270 (44.7%) | 161 (34.1%) |
| $500,000 to $749,999 | 165 (27.3%) | 184 (39.0%) |
| $750,000 to $999,999 | 38 (6.3%) | 54 (11.4%) |
| $1,000,000 or more | 41 (6.8%) | 29 (6.1%) |
| Total | 604 (100.0%) | 472 (100.0%) |
Household Income by Mortgage Status in Friendship Heights Village
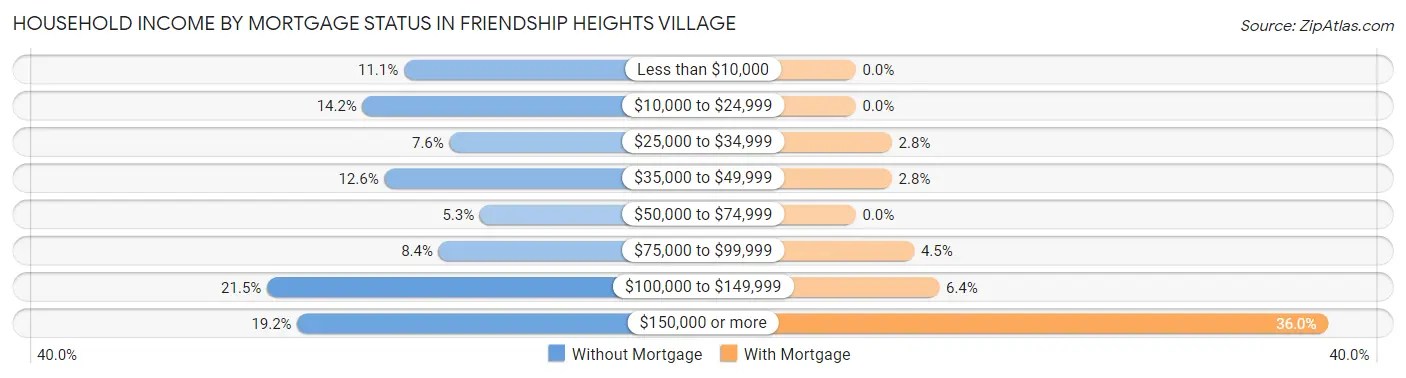
| Household Income | Without Mortgage | With Mortgage |
| Less than $10,000 | 67 (11.1%) | 0 (0.0%) |
| $10,000 to $24,999 | 86 (14.2%) | 0 (0.0%) |
| $25,000 to $34,999 | 46 (7.6%) | 13 (2.8%) |
| $35,000 to $49,999 | 76 (12.6%) | 13 (2.8%) |
| $50,000 to $74,999 | 32 (5.3%) | 0 (0.0%) |
| $75,000 to $99,999 | 51 (8.4%) | 21 (4.4%) |
| $100,000 to $149,999 | 130 (21.5%) | 30 (6.4%) |
| $150,000 or more | 116 (19.2%) | 170 (36.0%) |
| Total | 604 (100.0%) | 472 (100.0%) |
Property Value to Household Income Ratio in Friendship Heights Village
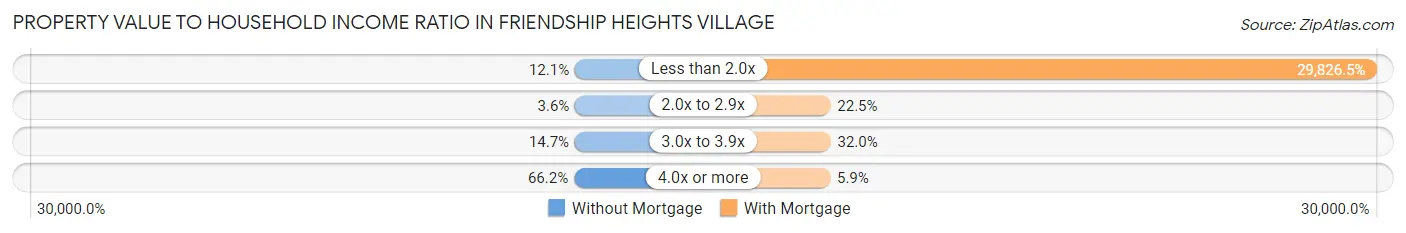
| Value-to-Income Ratio | Without Mortgage | With Mortgage |
| Less than 2.0x | 73 (12.1%) | 140,781 (29,826.5%) |
| 2.0x to 2.9x | 22 (3.6%) | 106 (22.5%) |
| 3.0x to 3.9x | 89 (14.7%) | 151 (32.0%) |
| 4.0x or more | 400 (66.2%) | 28 (5.9%) |
| Total | 604 (100.0%) | 472 (100.0%) |
Real Estate Taxes by Mortgage Status in Friendship Heights Village
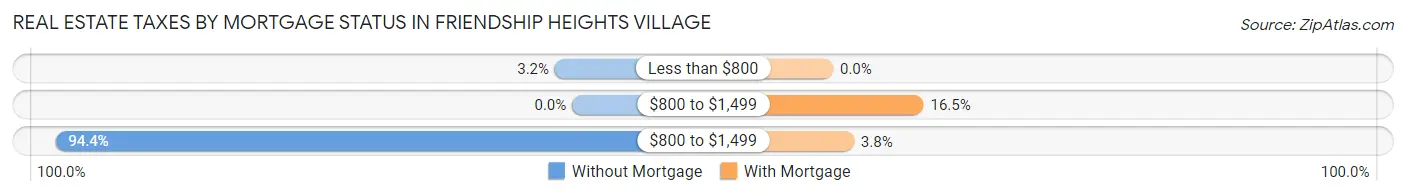
| Property Taxes | Without Mortgage | With Mortgage |
| Less than $800 | 19 (3.2%) | 0 (0.0%) |
| $800 to $1,499 | 0 (0.0%) | 78 (16.5%) |
| $800 to $1,499 | 570 (94.4%) | 18 (3.8%) |
| Total | 604 (100.0%) | 472 (100.0%) |
Health & Disability in Friendship Heights Village
Health Insurance Coverage by Age in Friendship Heights Village
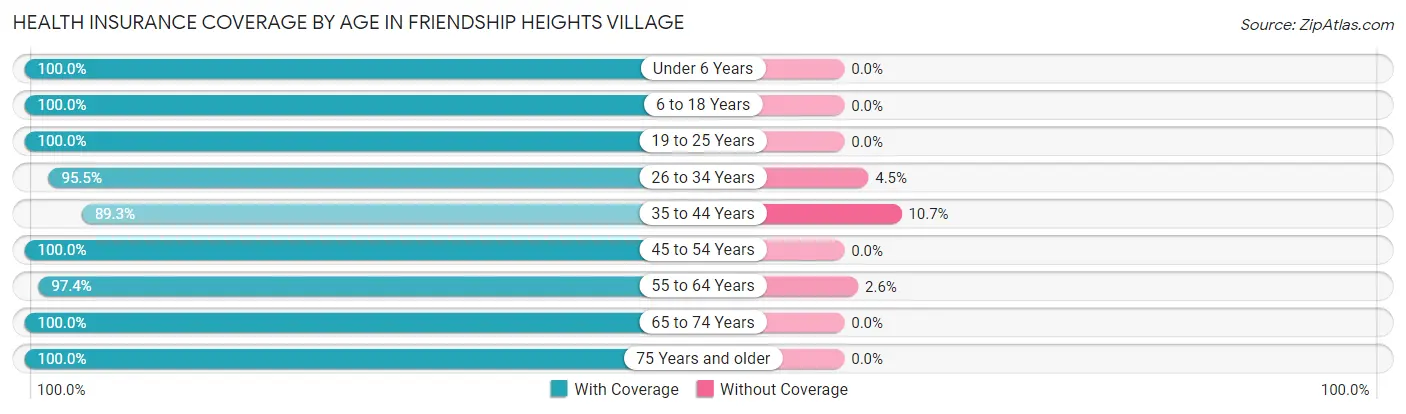
| Age Bracket | With Coverage | Without Coverage |
| Under 6 Years | 203 (100.0%) | 0 (0.0%) |
| 6 to 18 Years | 194 (100.0%) | 0 (0.0%) |
| 19 to 25 Years | 434 (100.0%) | 0 (0.0%) |
| 26 to 34 Years | 598 (95.5%) | 28 (4.5%) |
| 35 to 44 Years | 461 (89.3%) | 55 (10.7%) |
| 45 to 54 Years | 446 (100.0%) | 0 (0.0%) |
| 55 to 64 Years | 491 (97.4%) | 13 (2.6%) |
| 65 to 74 Years | 510 (100.0%) | 0 (0.0%) |
| 75 Years and older | 853 (100.0%) | 0 (0.0%) |
| Total | 4,190 (97.8%) | 96 (2.2%) |
Health Insurance Coverage by Citizenship Status in Friendship Heights Village
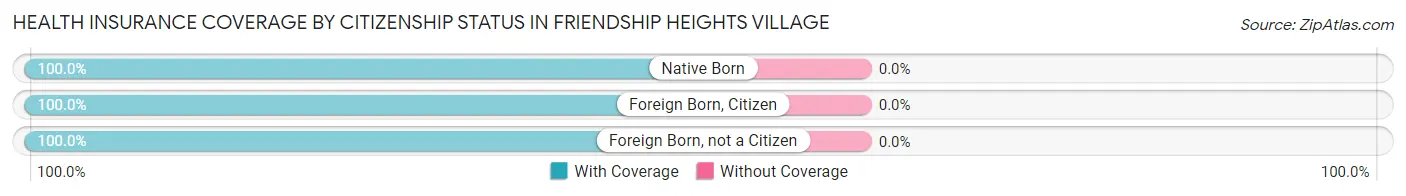
| Citizenship Status | With Coverage | Without Coverage |
| Native Born | 203 (100.0%) | 0 (0.0%) |
| Foreign Born, Citizen | 194 (100.0%) | 0 (0.0%) |
| Foreign Born, not a Citizen | 434 (100.0%) | 0 (0.0%) |
Health Insurance Coverage by Household Income in Friendship Heights Village
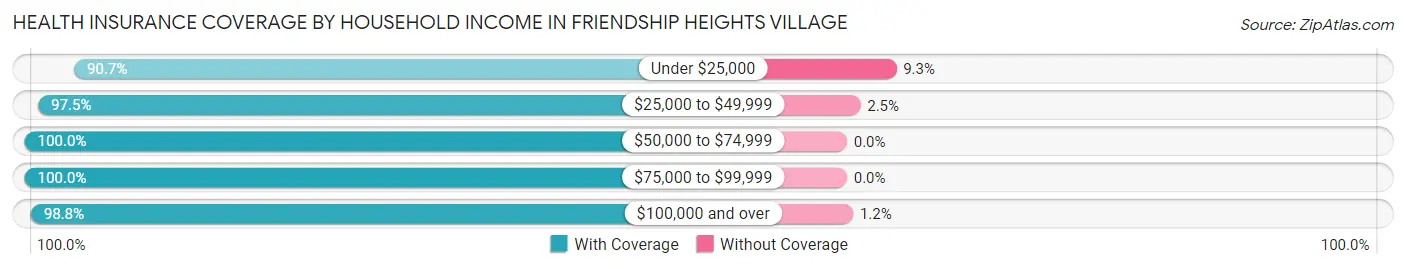
| Household Income | With Coverage | Without Coverage |
| Under $25,000 | 539 (90.7%) | 55 (9.3%) |
| $25,000 to $49,999 | 231 (97.5%) | 6 (2.5%) |
| $50,000 to $74,999 | 220 (100.0%) | 0 (0.0%) |
| $75,000 to $99,999 | 197 (100.0%) | 0 (0.0%) |
| $100,000 and over | 2,979 (98.8%) | 35 (1.2%) |
Public vs Private Health Insurance Coverage by Age in Friendship Heights Village
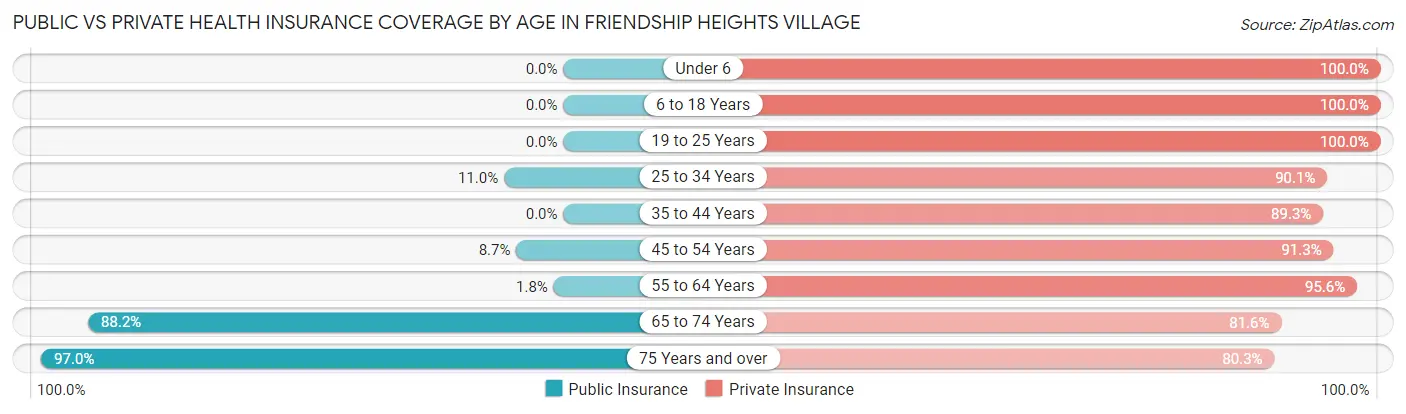
| Age Bracket | Public Insurance | Private Insurance |
| Under 6 | 0 (0.0%) | 203 (100.0%) |
| 6 to 18 Years | 0 (0.0%) | 194 (100.0%) |
| 19 to 25 Years | 0 (0.0%) | 434 (100.0%) |
| 25 to 34 Years | 69 (11.0%) | 564 (90.1%) |
| 35 to 44 Years | 0 (0.0%) | 461 (89.3%) |
| 45 to 54 Years | 39 (8.7%) | 407 (91.3%) |
| 55 to 64 Years | 9 (1.8%) | 482 (95.6%) |
| 65 to 74 Years | 450 (88.2%) | 416 (81.6%) |
| 75 Years and over | 827 (97.0%) | 685 (80.3%) |
| Total | 1,394 (32.5%) | 3,846 (89.7%) |
Disability Status by Sex by Age in Friendship Heights Village
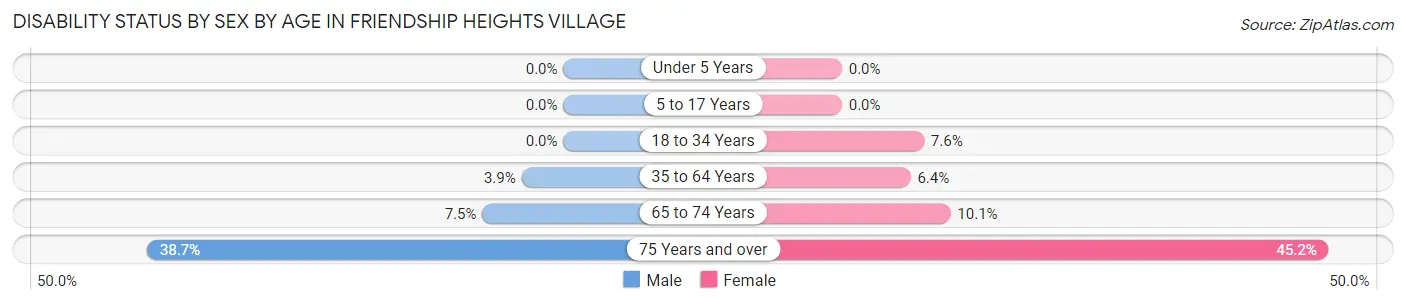
| Age Bracket | Male | Female |
| Under 5 Years | 0 (0.0%) | 0 (0.0%) |
| 5 to 17 Years | 0 (0.0%) | 0 (0.0%) |
| 18 to 34 Years | 0 (0.0%) | 49 (7.6%) |
| 35 to 64 Years | 24 (3.9%) | 54 (6.4%) |
| 65 to 74 Years | 10 (7.5%) | 38 (10.1%) |
| 75 Years and over | 97 (38.7%) | 272 (45.2%) |
Disability Class by Sex by Age in Friendship Heights Village
Disability Class: Hearing Difficulty
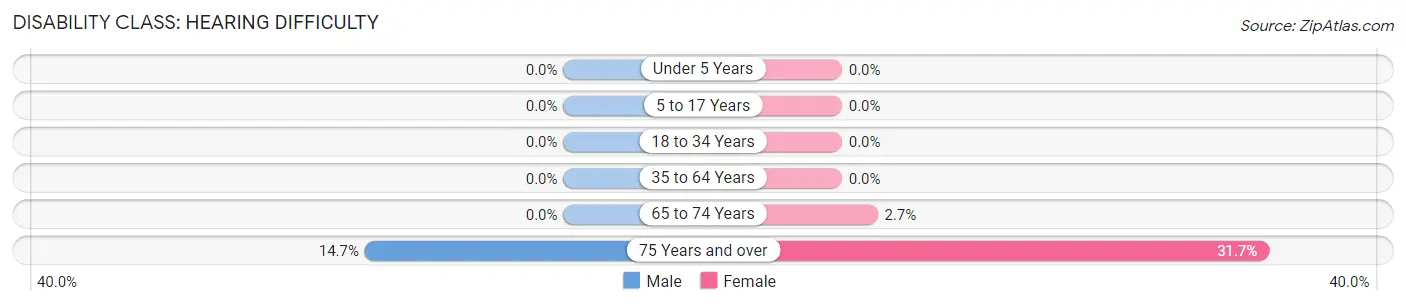
| Age Bracket | Male | Female |
| Under 5 Years | 0 (0.0%) | 0 (0.0%) |
| 5 to 17 Years | 0 (0.0%) | 0 (0.0%) |
| 18 to 34 Years | 0 (0.0%) | 0 (0.0%) |
| 35 to 64 Years | 0 (0.0%) | 0 (0.0%) |
| 65 to 74 Years | 0 (0.0%) | 10 (2.6%) |
| 75 Years and over | 37 (14.7%) | 191 (31.7%) |
Disability Class: Vision Difficulty
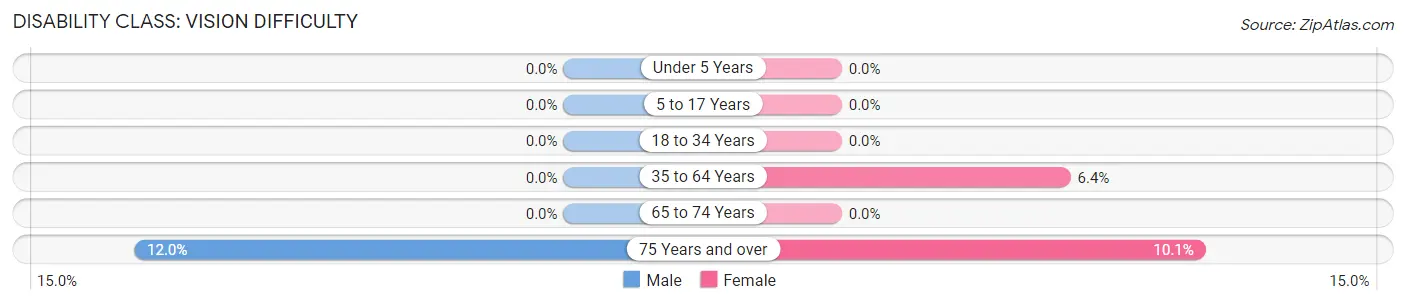
| Age Bracket | Male | Female |
| Under 5 Years | 0 (0.0%) | 0 (0.0%) |
| 5 to 17 Years | 0 (0.0%) | 0 (0.0%) |
| 18 to 34 Years | 0 (0.0%) | 0 (0.0%) |
| 35 to 64 Years | 0 (0.0%) | 54 (6.4%) |
| 65 to 74 Years | 0 (0.0%) | 0 (0.0%) |
| 75 Years and over | 30 (11.9%) | 61 (10.1%) |
Disability Class: Cognitive Difficulty
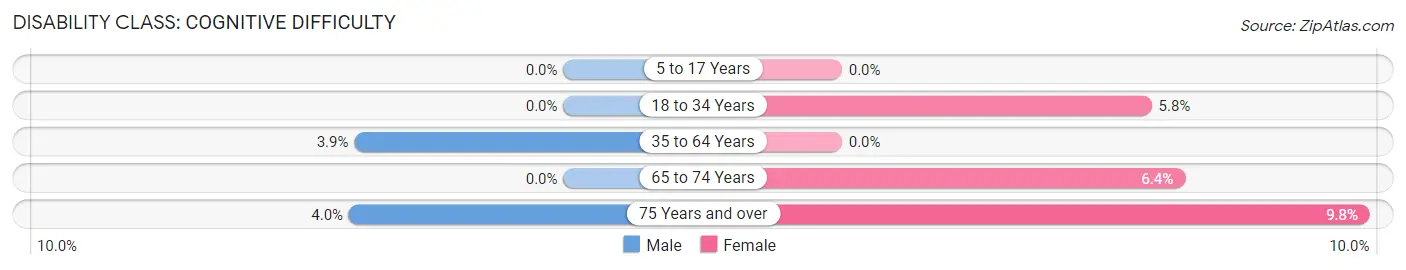
| Age Bracket | Male | Female |
| 5 to 17 Years | 0 (0.0%) | 0 (0.0%) |
| 18 to 34 Years | 0 (0.0%) | 37 (5.8%) |
| 35 to 64 Years | 24 (3.9%) | 0 (0.0%) |
| 65 to 74 Years | 0 (0.0%) | 24 (6.4%) |
| 75 Years and over | 10 (4.0%) | 59 (9.8%) |
Disability Class: Ambulatory Difficulty
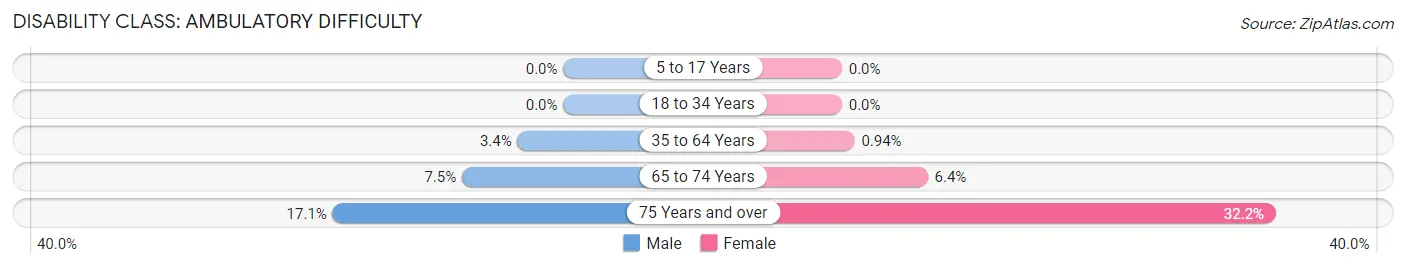
| Age Bracket | Male | Female |
| 5 to 17 Years | 0 (0.0%) | 0 (0.0%) |
| 18 to 34 Years | 0 (0.0%) | 0 (0.0%) |
| 35 to 64 Years | 21 (3.4%) | 8 (0.9%) |
| 65 to 74 Years | 10 (7.5%) | 24 (6.4%) |
| 75 Years and over | 43 (17.1%) | 194 (32.2%) |
Disability Class: Self-Care Difficulty
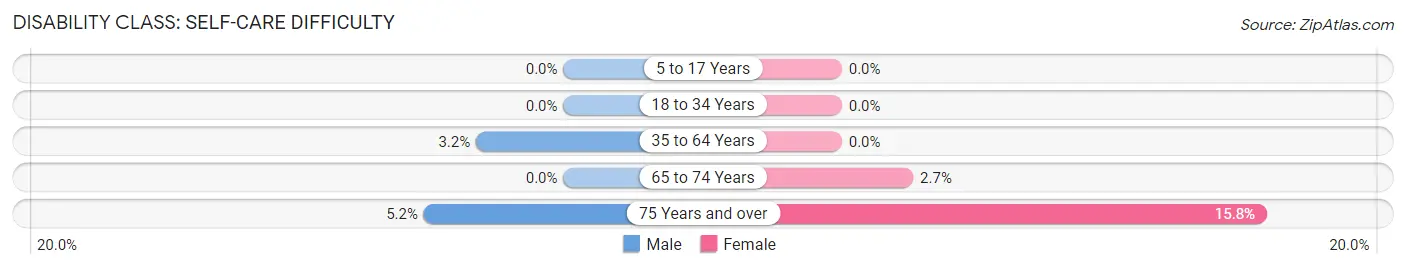
| Age Bracket | Male | Female |
| 5 to 17 Years | 0 (0.0%) | 0 (0.0%) |
| 18 to 34 Years | 0 (0.0%) | 0 (0.0%) |
| 35 to 64 Years | 20 (3.2%) | 0 (0.0%) |
| 65 to 74 Years | 0 (0.0%) | 10 (2.6%) |
| 75 Years and over | 13 (5.2%) | 95 (15.8%) |
Technology Access in Friendship Heights Village
Computing Device Access in Friendship Heights Village
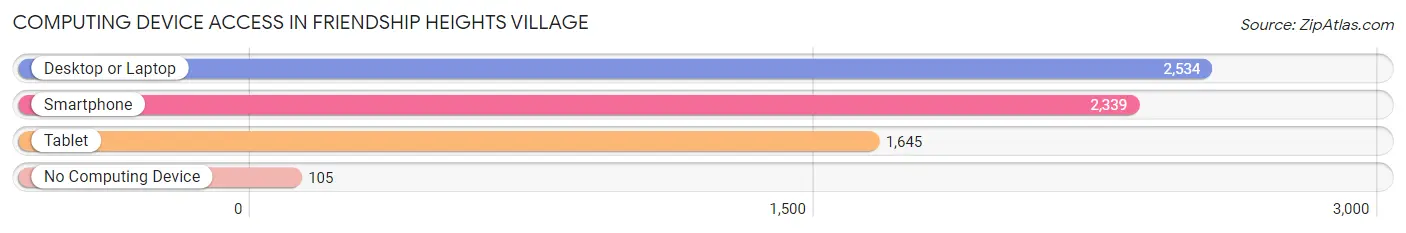
| Device Type | # Households | % Households |
| Desktop or Laptop | 2,534 | 94.1% |
| Smartphone | 2,339 | 86.8% |
| Tablet | 1,645 | 61.1% |
| No Computing Device | 105 | 3.9% |
| Total | 2,694 | 100.0% |
Internet Access in Friendship Heights Village
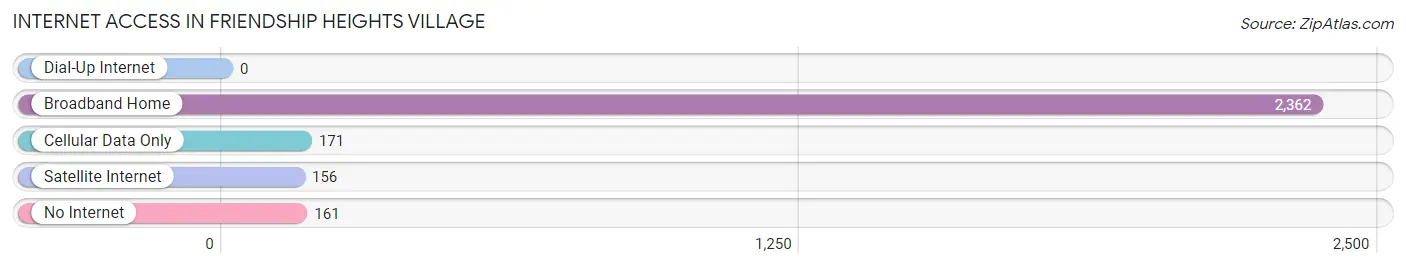
| Internet Type | # Households | % Households |
| Dial-Up Internet | 0 | 0.0% |
| Broadband Home | 2,362 | 87.7% |
| Cellular Data Only | 171 | 6.4% |
| Satellite Internet | 156 | 5.8% |
| No Internet | 161 | 6.0% |
| Total | 2,694 | 100.0% |
Friendship Heights Village Summary
Friendship Heights Village is a small, unincorporated community located in Montgomery County, Maryland. It is situated along the border of Washington, D.C. and Maryland, and is part of the larger Friendship Heights-Chevy Chase area. The village is home to a variety of businesses, including upscale shopping centers, restaurants, and a variety of other services.
History
Friendship Heights Village was first established in the early 1900s as a small farming community. The area was largely rural until the 1950s, when the construction of the Capital Beltway and the development of the Friendship Heights Metro station brought an influx of people and businesses to the area. The village was officially incorporated in 1960, and has since become a popular destination for shopping, dining, and entertainment.
Geography
Friendship Heights Village is located in Montgomery County, Maryland, along the border of Washington, D.C. and Maryland. The village is situated on the western edge of the Friendship Heights-Chevy Chase area, and is bordered by the Capital Beltway to the north, Wisconsin Avenue to the east, and the Maryland-Washington, D.C. border to the south. The village is home to a variety of businesses, including upscale shopping centers, restaurants, and a variety of other services.
Economy
Friendship Heights Village is home to a variety of businesses, including upscale shopping centers, restaurants, and a variety of other services. The village is also home to a number of corporate offices, including those of Marriott International, Lockheed Martin, and the National Institutes of Health. The village is also home to a number of medical facilities, including the Washington Hospital Center and the National Institutes of Health Clinical Center.
Demographics
As of the 2010 census, Friendship Heights Village had a population of 2,717. The population was predominantly white (83.3%), with African Americans (7.3%), Asians (4.7%), and Hispanics (2.7%) making up the remainder of the population. The median household income was $117,917, and the median age was 44.7 years. The village is home to a variety of businesses, including upscale shopping centers, restaurants, and a variety of other services.
Common Questions
What is Per Capita Income in Friendship Heights Village?
Per Capita income in Friendship Heights Village is $98,596.
What is the Median Family Income in Friendship Heights Village?
Median Family Income in Friendship Heights Village is $189,196.
What is the Median Household income in Friendship Heights Village?
Median Household Income in Friendship Heights Village is $113,063.
What is Income or Wage Gap in Friendship Heights Village?
Income or Wage Gap in Friendship Heights Village is 1.7%.
Women in Friendship Heights Village earn 98.3 cents for every dollar earned by a man.
What is Inequality or Gini Index in Friendship Heights Village?
Inequality or Gini Index in Friendship Heights Village is 0.51.
What is the Total Population of Friendship Heights Village?
Total Population of Friendship Heights Village is 4,315.
What is the Total Male Population of Friendship Heights Village?
Total Male Population of Friendship Heights Village is 1,649.
What is the Total Female Population of Friendship Heights Village?
Total Female Population of Friendship Heights Village is 2,666.
What is the Ratio of Males per 100 Females in Friendship Heights Village?
There are 61.85 Males per 100 Females in Friendship Heights Village.
What is the Ratio of Females per 100 Males in Friendship Heights Village?
There are 161.67 Females per 100 Males in Friendship Heights Village.
What is the Median Population Age in Friendship Heights Village?
Median Population Age in Friendship Heights Village is 47.9 Years.
What is the Average Family Size in Friendship Heights Village
Average Family Size in Friendship Heights Village is 2.5 People.
What is the Average Household Size in Friendship Heights Village
Average Household Size in Friendship Heights Village is 1.6 People.
How Large is the Labor Force in Friendship Heights Village?
There are 2,528 People in the Labor Forcein in Friendship Heights Village.
What is the Percentage of People in the Labor Force in Friendship Heights Village?
63.9% of People are in the Labor Force in Friendship Heights Village.
What is the Unemployment Rate in Friendship Heights Village?
Unemployment Rate in Friendship Heights Village is 2.9%.