Somerset, MD Map & Demographics
Somerset Map
Somerset Overview
$154,723
PER CAPITA INCOME
$250,001
AVG FAMILY INCOME
$250,001
AVG HOUSEHOLD INCOME
37.9%
WAGE / INCOME GAP [ % ]
62.1¢/ $1
WAGE / INCOME GAP [ $ ]
0.43
INEQUALITY / GINI INDEX
1,028
TOTAL POPULATION
482
MALE POPULATION
546
FEMALE POPULATION
88.28
MALES / 100 FEMALES
113.28
FEMALES / 100 MALES
49.6
MEDIAN AGE
3.2
AVG FAMILY SIZE
2.8
AVG HOUSEHOLD SIZE
508
LABOR FORCE [ PEOPLE ]
64.9%
PERCENT IN LABOR FORCE
0.6%
UNEMPLOYMENT RATE
Income in Somerset
Income Overview in Somerset
Per Capita Income in Somerset is $154,723, while median incomes of families and households are $250,001 and $250,001 respectively.
| Characteristic | Number | Measure |
| Per Capita Income | 1,028 | $154,723 |
| Median Family Income | 287 | $250,001 |
| Mean Family Income | 287 | $499,472 |
| Median Household Income | 368 | $250,001 |
| Mean Household Income | 368 | $419,599 |
| Income Deficit | 287 | $0 |
| Wage / Income Gap (%) | 1,028 | 37.88% |
| Wage / Income Gap ($) | 1,028 | 62.12¢ per $1 |
| Gini / Inequality Index | 1,028 | 0.43 |
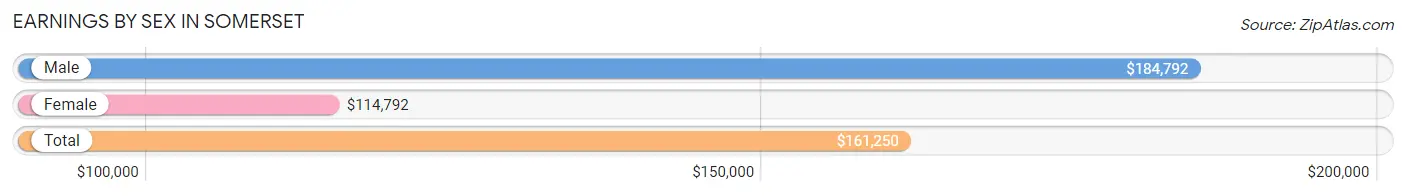
Earnings by Sex in Somerset
Average Earnings in Somerset are $161,250, $184,792 for men and $114,792 for women, a difference of 37.9%.
| Sex | Number | Average Earnings |
| Male | 321 (59.2%) | $184,792 |
| Female | 221 (40.8%) | $114,792 |
| Total | 542 (100.0%) | $161,250 |
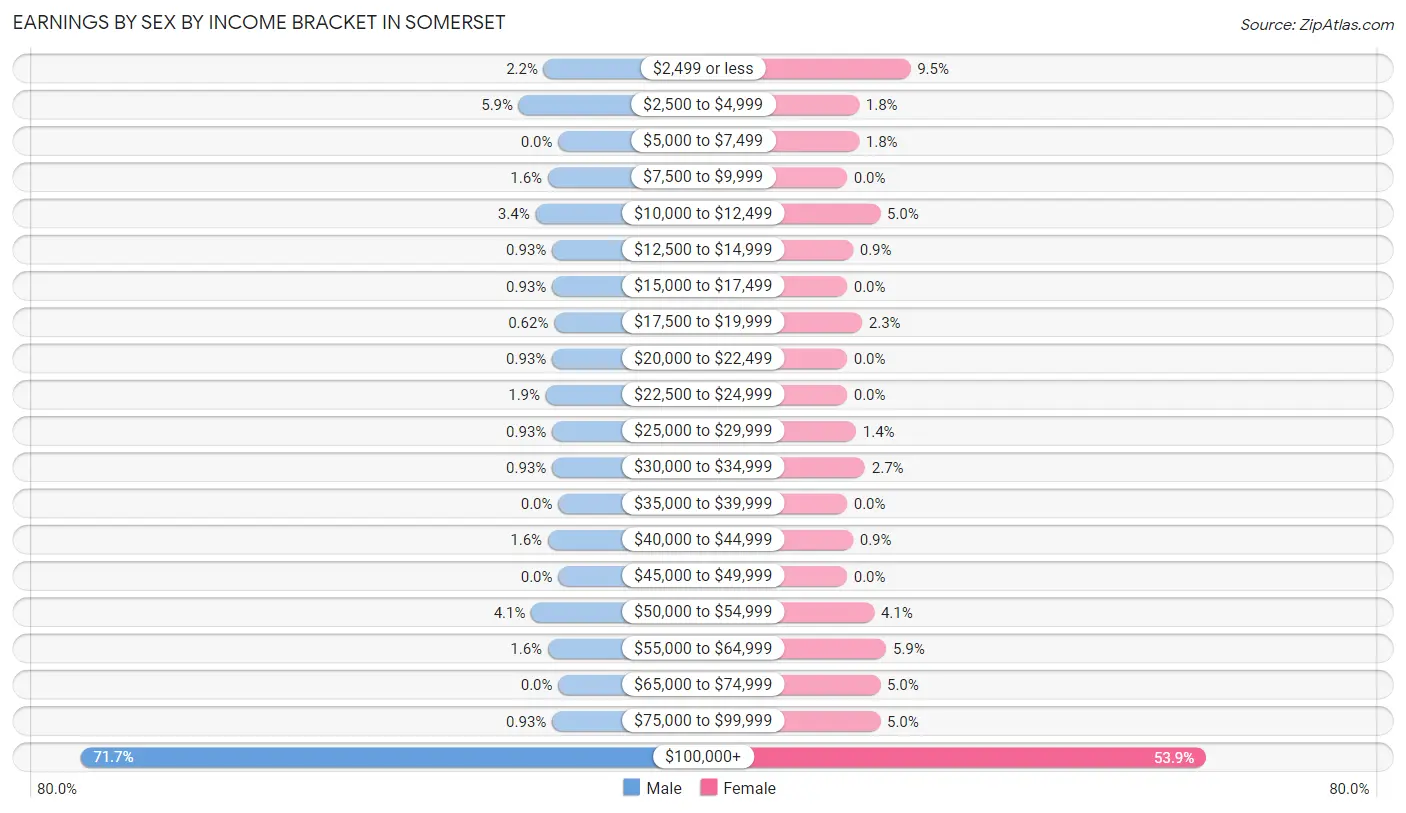
Earnings by Sex by Income Bracket in Somerset
The most common earnings brackets in Somerset are $100,000+ for men (230 | 71.7%) and $100,000+ for women (119 | 53.8%).
| Income | Male | Female |
| $2,499 or less | 7 (2.2%) | 21 (9.5%) |
| $2,500 to $4,999 | 19 (5.9%) | 4 (1.8%) |
| $5,000 to $7,499 | 0 (0.0%) | 4 (1.8%) |
| $7,500 to $9,999 | 5 (1.6%) | 0 (0.0%) |
| $10,000 to $12,499 | 11 (3.4%) | 11 (5.0%) |
| $12,500 to $14,999 | 3 (0.9%) | 2 (0.9%) |
| $15,000 to $17,499 | 3 (0.9%) | 0 (0.0%) |
| $17,500 to $19,999 | 2 (0.6%) | 5 (2.3%) |
| $20,000 to $22,499 | 3 (0.9%) | 0 (0.0%) |
| $22,500 to $24,999 | 6 (1.9%) | 0 (0.0%) |
| $25,000 to $29,999 | 3 (0.9%) | 3 (1.4%) |
| $30,000 to $34,999 | 3 (0.9%) | 6 (2.7%) |
| $35,000 to $39,999 | 0 (0.0%) | 0 (0.0%) |
| $40,000 to $44,999 | 5 (1.6%) | 2 (0.9%) |
| $45,000 to $49,999 | 0 (0.0%) | 0 (0.0%) |
| $50,000 to $54,999 | 13 (4.1%) | 9 (4.1%) |
| $55,000 to $64,999 | 5 (1.6%) | 13 (5.9%) |
| $65,000 to $74,999 | 0 (0.0%) | 11 (5.0%) |
| $75,000 to $99,999 | 3 (0.9%) | 11 (5.0%) |
| $100,000+ | 230 (71.7%) | 119 (53.8%) |
| Total | 321 (100.0%) | 221 (100.0%) |
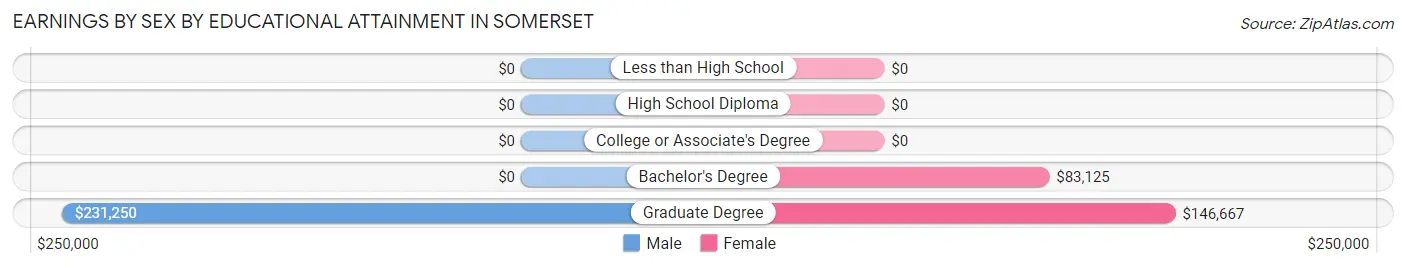
Earnings by Sex by Educational Attainment in Somerset
Average earnings in Somerset are $199,583 for men and $130,714 for women, a difference of 34.5%. Men with an educational attainment of graduate degree enjoy the highest average annual earnings of $231,250, while those with graduate degree education earn the least with $231,250. Women with an educational attainment of graduate degree earn the most with the average annual earnings of $146,667, while those with bachelor's degree education have the smallest earnings of $83,125.
| Educational Attainment | Male Income | Female Income |
| Less than High School | - | - |
| High School Diploma | - | - |
| College or Associate's Degree | - | - |
| Bachelor's Degree | - | - |
| Graduate Degree | $231,250 | $146,667 |
| Total | $199,583 | $130,714 |
Family Income in Somerset
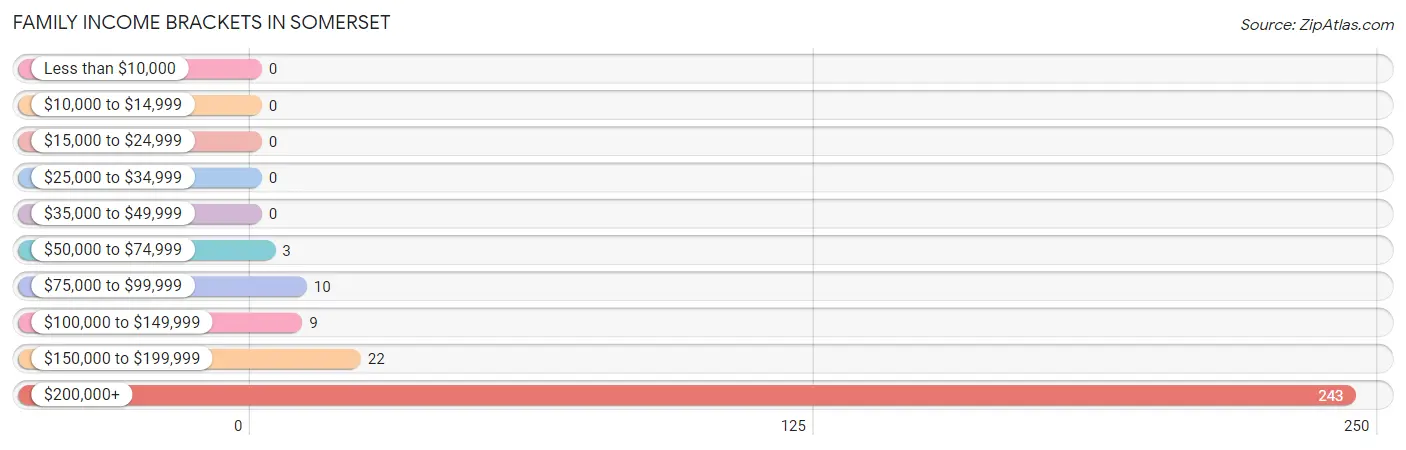
Family Income Brackets in Somerset
According to the Somerset family income data, there are 243 families falling into the $200,000+ income range, which is the most common income bracket and makes up 84.7% of all families.
| Income Bracket | # Families | % Families |
| Less than $10,000 | 0 | 0.0% |
| $10,000 to $14,999 | 0 | 0.0% |
| $15,000 to $24,999 | 0 | 0.0% |
| $25,000 to $34,999 | 0 | 0.0% |
| $35,000 to $49,999 | 0 | 0.0% |
| $50,000 to $74,999 | 3 | 1.0% |
| $75,000 to $99,999 | 10 | 3.5% |
| $100,000 to $149,999 | 9 | 3.1% |
| $150,000 to $199,999 | 22 | 7.7% |
| $200,000+ | 243 | 84.7% |
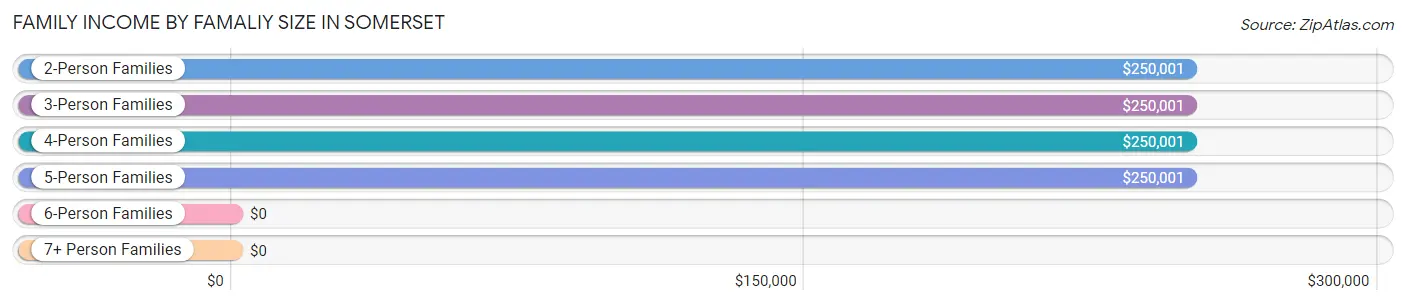
Family Income by Famaliy Size in Somerset
2-person families (114 | 39.7%) account for the highest median family income in Somerset with $250,001 per family, while 2-person families (114 | 39.7%) have the highest median income of $125,000 per family member.
| Income Bracket | # Families | Median Income |
| 2-Person Families | 114 (39.7%) | $250,001 |
| 3-Person Families | 59 (20.6%) | $250,001 |
| 4-Person Families | 91 (31.7%) | $250,001 |
| 5-Person Families | 20 (7.0%) | $250,001 |
| 6-Person Families | 0 (0.0%) | $0 |
| 7+ Person Families | 3 (1.1%) | $0 |
| Total | 287 (100.0%) | $250,001 |
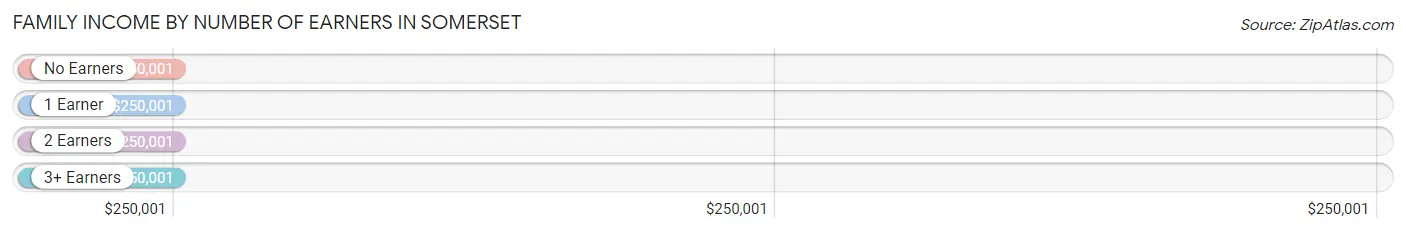
Family Income by Number of Earners in Somerset
The median family income in Somerset is $250,001, with families comprising no earners (20) having the highest median family income of $250,001, while families with no earners (20) have the lowest median family income of $250,001, accounting for 7.0% and 7.0% of families, respectively.
| Number of Earners | # Families | Median Income |
| No Earners | 20 (7.0%) | $250,001 |
| 1 Earner | 84 (29.3%) | $250,001 |
| 2 Earners | 166 (57.8%) | $250,001 |
| 3+ Earners | 17 (5.9%) | $250,001 |
| Total | 287 (100.0%) | $250,001 |
Household Income in Somerset
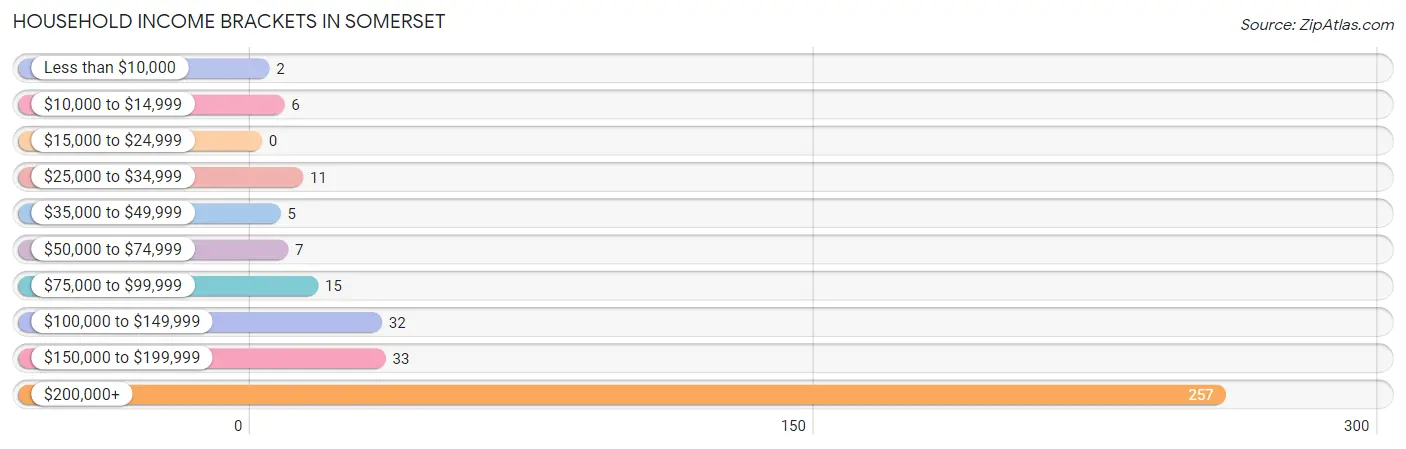
Household Income Brackets in Somerset
With 257 households falling in the category, the $200,000+ income range is the most frequent in Somerset, accounting for 69.8% of all households.
| Income Bracket | # Households | % Households |
| Less than $10,000 | 2 | 0.5% |
| $10,000 to $14,999 | 6 | 1.6% |
| $15,000 to $24,999 | 0 | 0.0% |
| $25,000 to $34,999 | 11 | 3.0% |
| $35,000 to $49,999 | 5 | 1.4% |
| $50,000 to $74,999 | 7 | 1.9% |
| $75,000 to $99,999 | 15 | 4.1% |
| $100,000 to $149,999 | 32 | 8.7% |
| $150,000 to $199,999 | 33 | 9.0% |
| $200,000+ | 257 | 69.8% |
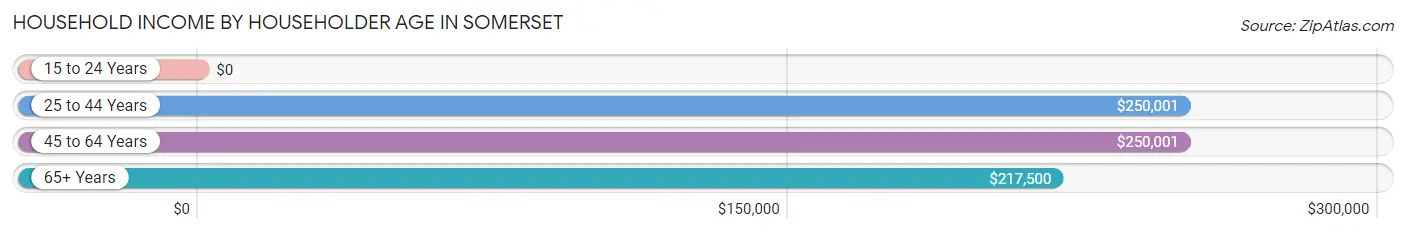
Household Income by Householder Age in Somerset
The median household income in Somerset is $250,001, with the highest median household income of $250,001 found in the 25 to 44 years age bracket for the primary householder. A total of 33 households (9.0%) fall into this category.
| Income Bracket | # Households | Median Income |
| 15 to 24 Years | 0 (0.0%) | $0 |
| 25 to 44 Years | 33 (9.0%) | $250,001 |
| 45 to 64 Years | 215 (58.4%) | $250,001 |
| 65+ Years | 120 (32.6%) | $217,500 |
| Total | 368 (100.0%) | $250,001 |
Poverty in Somerset
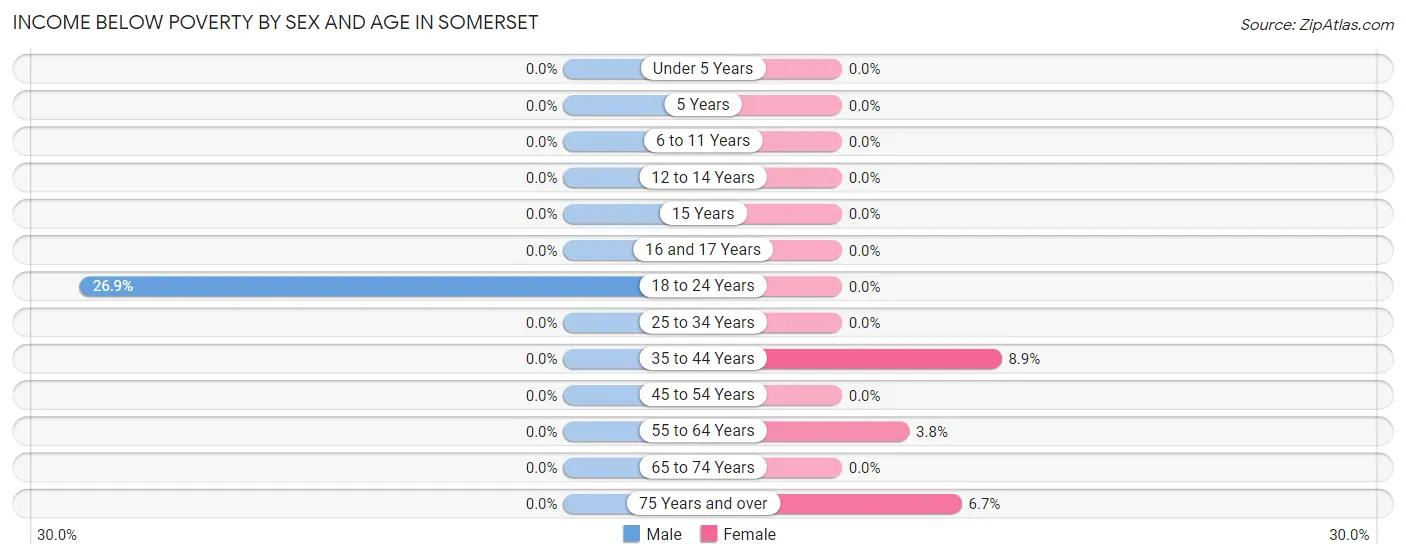
Income Below Poverty by Sex and Age in Somerset
With 1.5% poverty level for males and 2.0% for females among the residents of Somerset, 18 to 24 year old males and 35 to 44 year old females are the most vulnerable to poverty, with 7 males (26.9%) and 4 females (8.9%) in their respective age groups living below the poverty level.
| Age Bracket | Male | Female |
| Under 5 Years | 0 (0.0%) | 0 (0.0%) |
| 5 Years | 0 (0.0%) | 0 (0.0%) |
| 6 to 11 Years | 0 (0.0%) | 0 (0.0%) |
| 12 to 14 Years | 0 (0.0%) | 0 (0.0%) |
| 15 Years | 0 (0.0%) | 0 (0.0%) |
| 16 and 17 Years | 0 (0.0%) | 0 (0.0%) |
| 18 to 24 Years | 7 (26.9%) | 0 (0.0%) |
| 25 to 34 Years | 0 (0.0%) | 0 (0.0%) |
| 35 to 44 Years | 0 (0.0%) | 4 (8.9%) |
| 45 to 54 Years | 0 (0.0%) | 0 (0.0%) |
| 55 to 64 Years | 0 (0.0%) | 3 (3.7%) |
| 65 to 74 Years | 0 (0.0%) | 0 (0.0%) |
| 75 Years and over | 0 (0.0%) | 4 (6.7%) |
| Total | 7 (1.5%) | 11 (2.0%) |
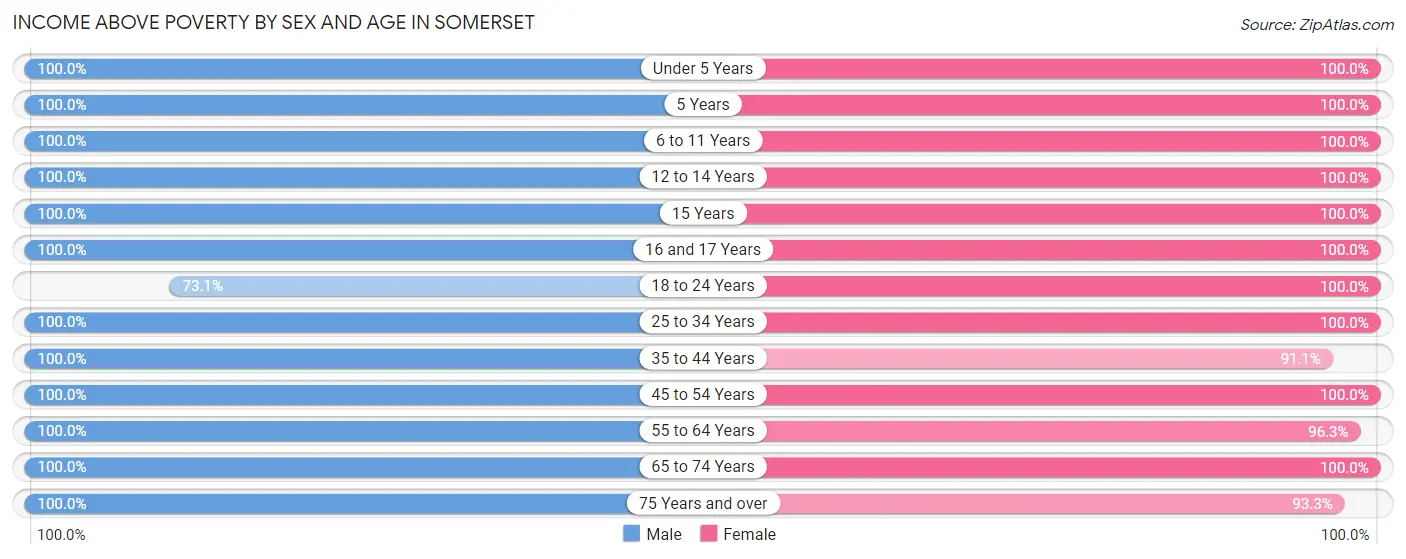
Income Above Poverty by Sex and Age in Somerset
According to the poverty statistics in Somerset, males aged under 5 years and females aged under 5 years are the age groups that are most secure financially, with 100.0% of males and 100.0% of females in these age groups living above the poverty line.
| Age Bracket | Male | Female |
| Under 5 Years | 8 (100.0%) | 18 (100.0%) |
| 5 Years | 7 (100.0%) | 6 (100.0%) |
| 6 to 11 Years | 38 (100.0%) | 70 (100.0%) |
| 12 to 14 Years | 28 (100.0%) | 36 (100.0%) |
| 15 Years | 20 (100.0%) | 14 (100.0%) |
| 16 and 17 Years | 20 (100.0%) | 9 (100.0%) |
| 18 to 24 Years | 19 (73.1%) | 24 (100.0%) |
| 25 to 34 Years | 10 (100.0%) | 15 (100.0%) |
| 35 to 44 Years | 23 (100.0%) | 41 (91.1%) |
| 45 to 54 Years | 95 (100.0%) | 110 (100.0%) |
| 55 to 64 Years | 103 (100.0%) | 77 (96.3%) |
| 65 to 74 Years | 67 (100.0%) | 59 (100.0%) |
| 75 Years and over | 37 (100.0%) | 56 (93.3%) |
| Total | 475 (98.6%) | 535 (98.0%) |
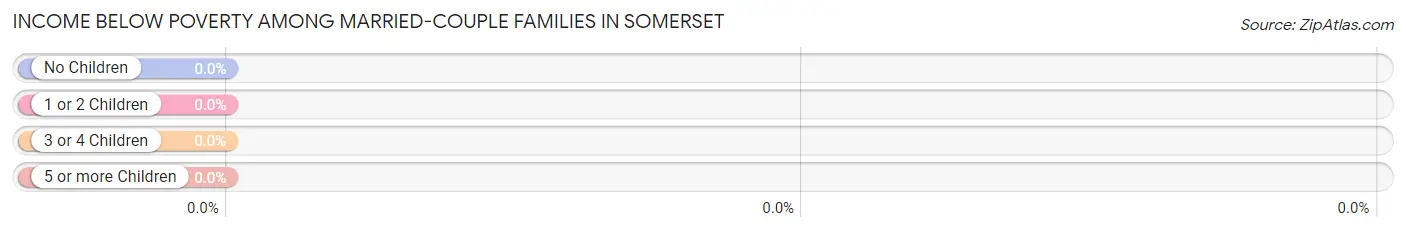
Income Below Poverty Among Married-Couple Families in Somerset
| Children | Above Poverty | Below Poverty |
| No Children | 135 (100.0%) | 0 (0.0%) |
| 1 or 2 Children | 118 (100.0%) | 0 (0.0%) |
| 3 or 4 Children | 18 (100.0%) | 0 (0.0%) |
| 5 or more Children | 0 (0.0%) | 0 (0.0%) |
| Total | 271 (100.0%) | 0 (0.0%) |
Income Below Poverty Among Single-Parent Households in Somerset
| Children | Single Father | Single Mother |
| No Children | 0 (0.0%) | 0 (0.0%) |
| 1 or 2 Children | 0 (0.0%) | 0 (0.0%) |
| 3 or 4 Children | 0 (0.0%) | 0 (0.0%) |
| 5 or more Children | 0 (0.0%) | 0 (0.0%) |
| Total | 0 (0.0%) | 0 (0.0%) |
Income Below Poverty Among Married-Couple vs Single-Parent Households in Somerset
| Children | Married-Couple Families | Single-Parent Households |
| No Children | 0 (0.0%) | 0 (0.0%) |
| 1 or 2 Children | 0 (0.0%) | 0 (0.0%) |
| 3 or 4 Children | 0 (0.0%) | 0 (0.0%) |
| 5 or more Children | 0 (0.0%) | 0 (0.0%) |
| Total | 0 (0.0%) | 0 (0.0%) |
Race in Somerset
The most populous races in Somerset are White / Caucasian (869 | 84.5%), Hispanic or Latino (75 | 7.3%), and Two or more Races (69 | 6.7%).
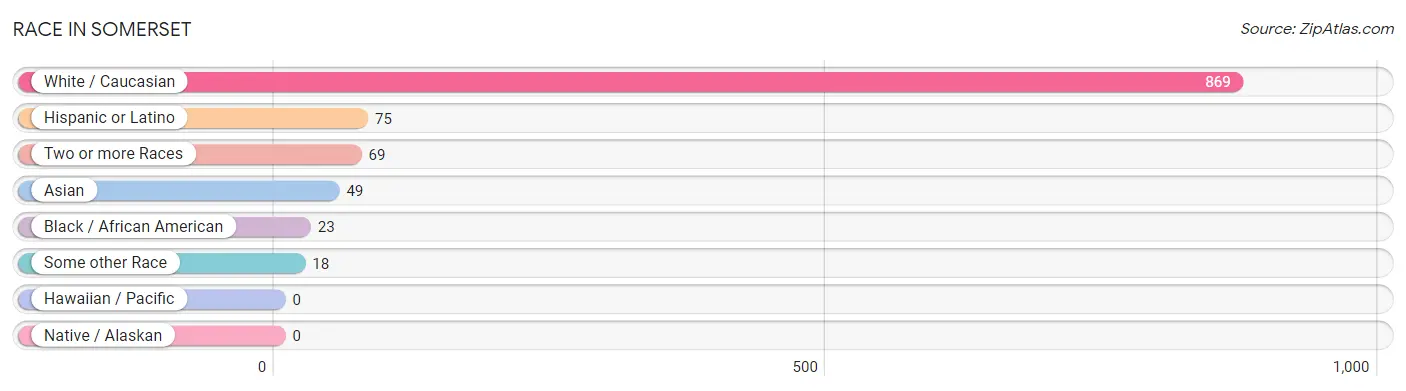
| Race | # Population | % Population |
| Asian | 49 | 4.8% |
| Black / African American | 23 | 2.2% |
| Hawaiian / Pacific | 0 | 0.0% |
| Hispanic or Latino | 75 | 7.3% |
| Native / Alaskan | 0 | 0.0% |
| White / Caucasian | 869 | 84.5% |
| Two or more Races | 69 | 6.7% |
| Some other Race | 18 | 1.8% |
| Total | 1,028 | 100.0% |
Ancestry in Somerset
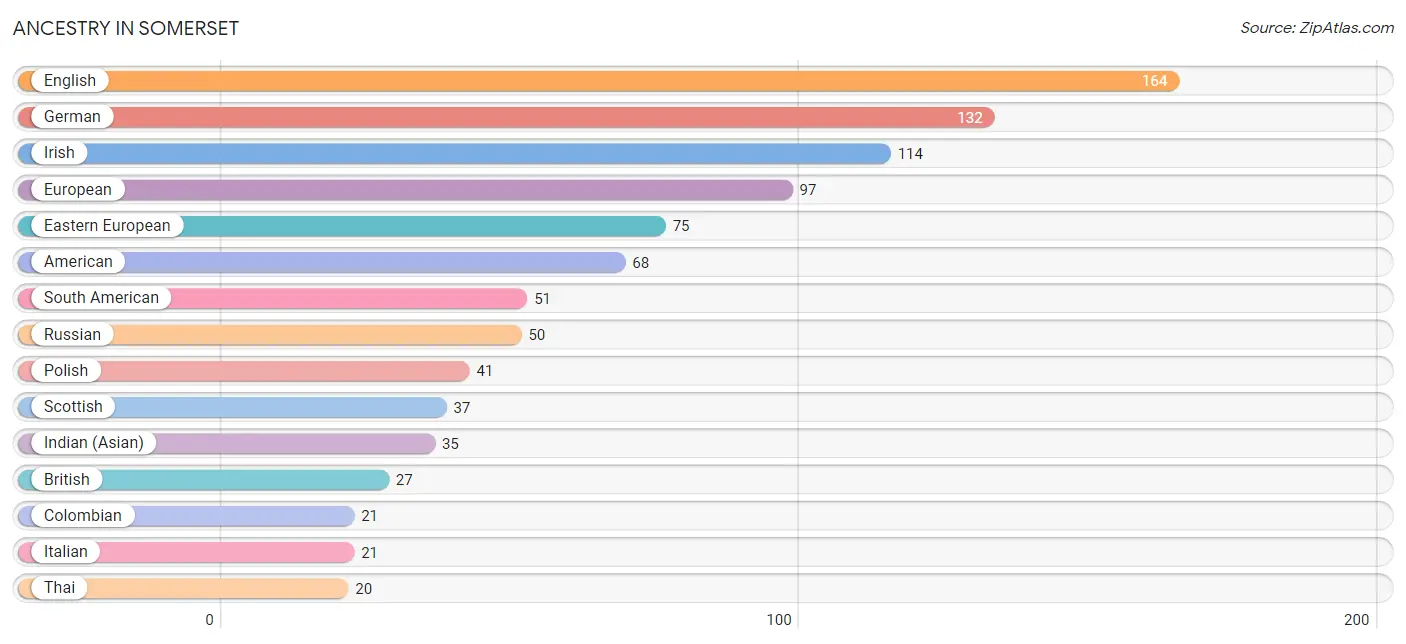
The most populous ancestries reported in Somerset are English (164 | 16.0%), German (132 | 12.8%), Irish (114 | 11.1%), European (97 | 9.4%), and Eastern European (75 | 7.3%), together accounting for 56.6% of all Somerset residents.
| Ancestry | # Population | % Population |
| African | 4 | 0.4% |
| American | 68 | 6.6% |
| Arab | 18 | 1.8% |
| Argentinean | 8 | 0.8% |
| Armenian | 15 | 1.5% |
| Australian | 15 | 1.5% |
| Austrian | 2 | 0.2% |
| Belgian | 6 | 0.6% |
| Bhutanese | 4 | 0.4% |
| British | 27 | 2.6% |
| Bulgarian | 10 | 1.0% |
| Burmese | 12 | 1.2% |
| Canadian | 10 | 1.0% |
| Central American | 3 | 0.3% |
| Colombian | 21 | 2.0% |
| Czech | 3 | 0.3% |
| Danish | 3 | 0.3% |
| Dutch | 10 | 1.0% |
| Eastern European | 75 | 7.3% |
| Egyptian | 15 | 1.5% |
| English | 164 | 16.0% |
| European | 97 | 9.4% |
| French | 10 | 1.0% |
| German | 132 | 12.8% |
| Greek | 4 | 0.4% |
| Honduran | 3 | 0.3% |
| Hungarian | 3 | 0.3% |
| Icelander | 7 | 0.7% |
| Indian (Asian) | 35 | 3.4% |
| Iranian | 9 | 0.9% |
| Irish | 114 | 11.1% |
| Italian | 21 | 2.0% |
| Korean | 2 | 0.2% |
| Lithuanian | 5 | 0.5% |
| Mexican | 14 | 1.4% |
| Norwegian | 5 | 0.5% |
| Peruvian | 3 | 0.3% |
| Polish | 41 | 4.0% |
| Puerto Rican | 7 | 0.7% |
| Romanian | 3 | 0.3% |
| Russian | 50 | 4.9% |
| Scotch-Irish | 16 | 1.6% |
| Scottish | 37 | 3.6% |
| Slovak | 6 | 0.6% |
| South American | 51 | 5.0% |
| Sri Lankan | 2 | 0.2% |
| Subsaharan African | 4 | 0.4% |
| Swiss | 7 | 0.7% |
| Thai | 20 | 1.9% |
| Ukrainian | 3 | 0.3% |
| Venezuelan | 9 | 0.9% |
| Welsh | 11 | 1.1% |
| West Indian | 2 | 0.2% | View All 53 Rows |
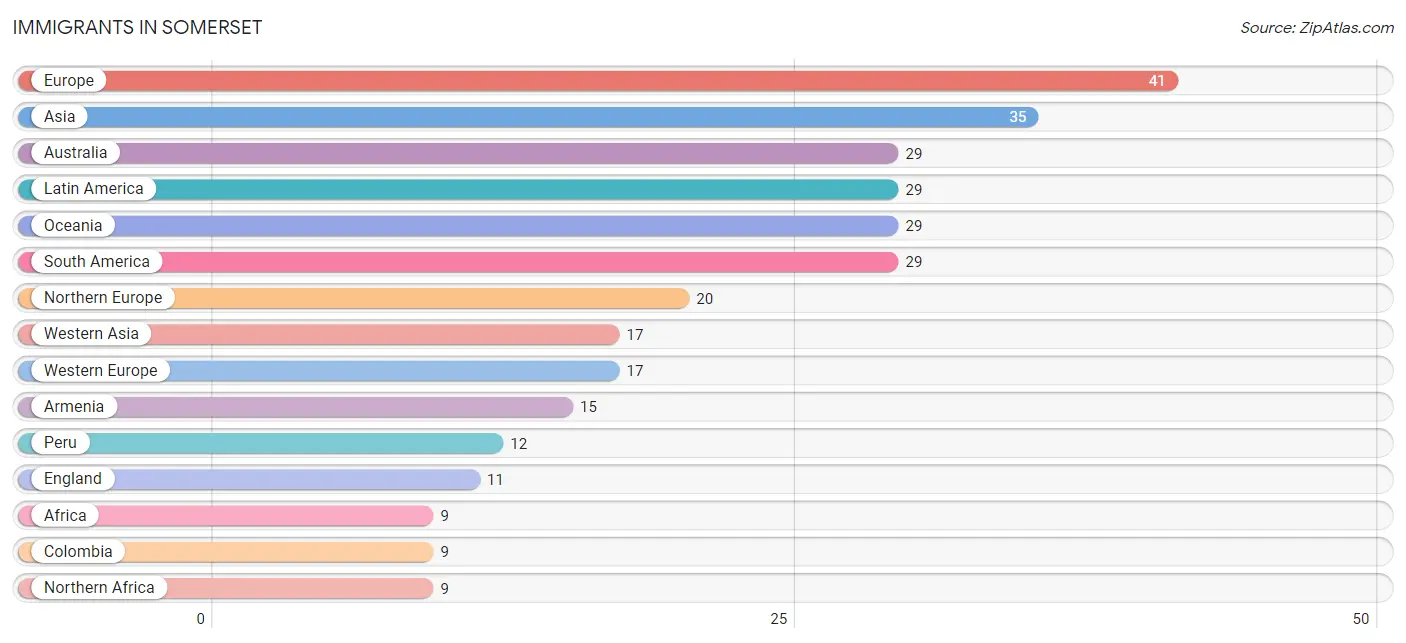
Immigrants in Somerset
The most numerous immigrant groups reported in Somerset came from Europe (41 | 4.0%), Asia (35 | 3.4%), Australia (29 | 2.8%), Latin America (29 | 2.8%), and Oceania (29 | 2.8%), together accounting for 15.9% of all Somerset residents.
| Immigration Origin | # Population | % Population |
| Africa | 9 | 0.9% |
| Argentina | 5 | 0.5% |
| Armenia | 15 | 1.5% |
| Asia | 35 | 3.4% |
| Australia | 29 | 2.8% |
| Belgium | 6 | 0.6% |
| Canada | 8 | 0.8% |
| Colombia | 9 | 0.9% |
| Denmark | 3 | 0.3% |
| Eastern Asia | 6 | 0.6% |
| Eastern Europe | 4 | 0.4% |
| Egypt | 6 | 0.6% |
| England | 11 | 1.1% |
| Europe | 41 | 4.0% |
| France | 3 | 0.3% |
| Germany | 8 | 0.8% |
| Hungary | 4 | 0.4% |
| India | 1 | 0.1% |
| Iran | 5 | 0.5% |
| Israel | 2 | 0.2% |
| Korea | 6 | 0.6% |
| Latin America | 29 | 2.8% |
| Northern Africa | 9 | 0.9% |
| Northern Europe | 20 | 1.9% |
| Oceania | 29 | 2.8% |
| Peru | 12 | 1.2% |
| South America | 29 | 2.8% |
| South Central Asia | 6 | 0.6% |
| South Eastern Asia | 6 | 0.6% |
| Venezuela | 3 | 0.3% |
| Vietnam | 6 | 0.6% |
| Western Asia | 17 | 1.7% |
| Western Europe | 17 | 1.7% | View All 33 Rows |
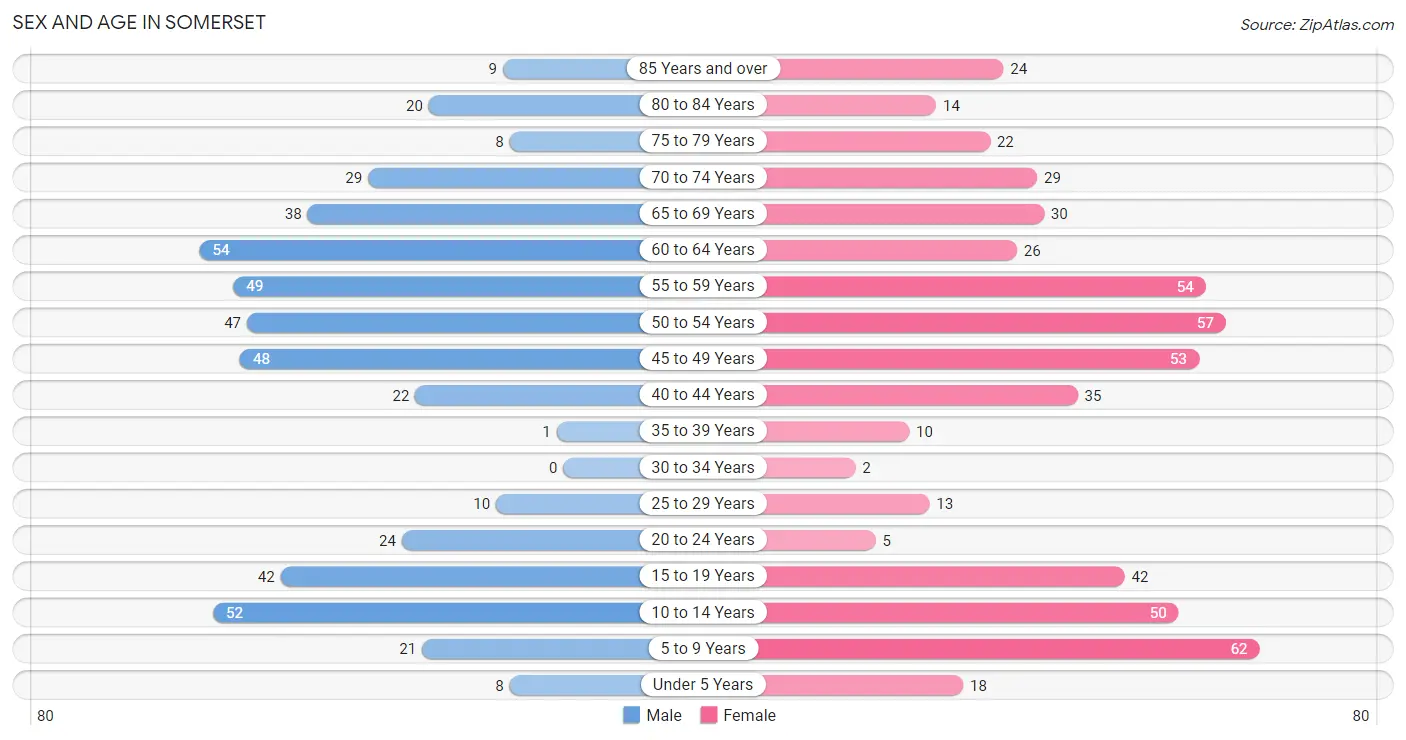
Sex and Age in Somerset
Sex and Age in Somerset
The most populous age groups in Somerset are 60 to 64 Years (54 | 11.2%) for men and 5 to 9 Years (62 | 11.4%) for women.
| Age Bracket | Male | Female |
| Under 5 Years | 8 (1.7%) | 18 (3.3%) |
| 5 to 9 Years | 21 (4.4%) | 62 (11.4%) |
| 10 to 14 Years | 52 (10.8%) | 50 (9.2%) |
| 15 to 19 Years | 42 (8.7%) | 42 (7.7%) |
| 20 to 24 Years | 24 (5.0%) | 5 (0.9%) |
| 25 to 29 Years | 10 (2.1%) | 13 (2.4%) |
| 30 to 34 Years | 0 (0.0%) | 2 (0.4%) |
| 35 to 39 Years | 1 (0.2%) | 10 (1.8%) |
| 40 to 44 Years | 22 (4.6%) | 35 (6.4%) |
| 45 to 49 Years | 48 (10.0%) | 53 (9.7%) |
| 50 to 54 Years | 47 (9.8%) | 57 (10.4%) |
| 55 to 59 Years | 49 (10.2%) | 54 (9.9%) |
| 60 to 64 Years | 54 (11.2%) | 26 (4.8%) |
| 65 to 69 Years | 38 (7.9%) | 30 (5.5%) |
| 70 to 74 Years | 29 (6.0%) | 29 (5.3%) |
| 75 to 79 Years | 8 (1.7%) | 22 (4.0%) |
| 80 to 84 Years | 20 (4.2%) | 14 (2.6%) |
| 85 Years and over | 9 (1.9%) | 24 (4.4%) |
| Total | 482 (100.0%) | 546 (100.0%) |
Families and Households in Somerset
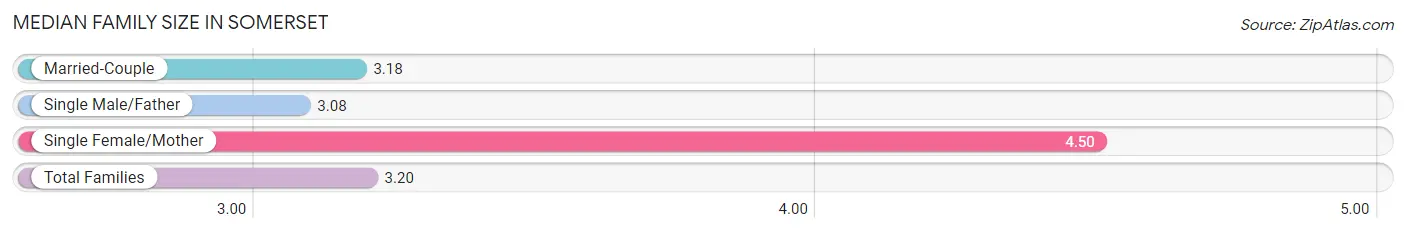
Median Family Size in Somerset
The median family size in Somerset is 3.20 persons per family, with single female/mother families (4 | 1.4%) accounting for the largest median family size of 4.5 persons per family. On the other hand, single male/father families (12 | 4.2%) represent the smallest median family size with 3.08 persons per family.
| Family Type | # Families | Family Size |
| Married-Couple | 271 (94.4%) | 3.18 |
| Single Male/Father | 12 (4.2%) | 3.08 |
| Single Female/Mother | 4 (1.4%) | 4.50 |
| Total Families | 287 (100.0%) | 3.20 |
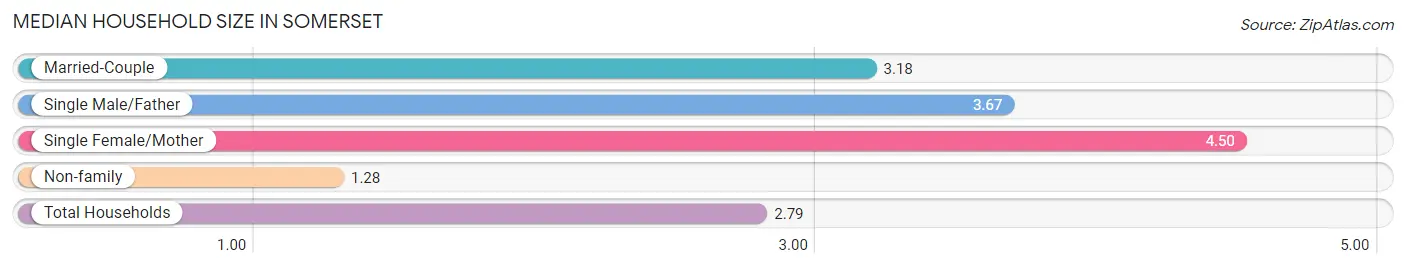
Median Household Size in Somerset
The median household size in Somerset is 2.79 persons per household, with single female/mother households (4 | 1.1%) accounting for the largest median household size of 4.5 persons per household. non-family households (81 | 22.0%) represent the smallest median household size with 1.28 persons per household.
| Household Type | # Households | Household Size |
| Married-Couple | 271 (73.6%) | 3.18 |
| Single Male/Father | 12 (3.3%) | 3.67 |
| Single Female/Mother | 4 (1.1%) | 4.50 |
| Non-family | 81 (22.0%) | 1.28 |
| Total Households | 368 (100.0%) | 2.79 |
Household Size by Marriage Status in Somerset
Out of a total of 368 households in Somerset, 287 (78.0%) are family households, while 81 (22.0%) are nonfamily households. The most numerous type of family households are 2-person households, comprising 114, and the most common type of nonfamily households are 1-person households, comprising 70.
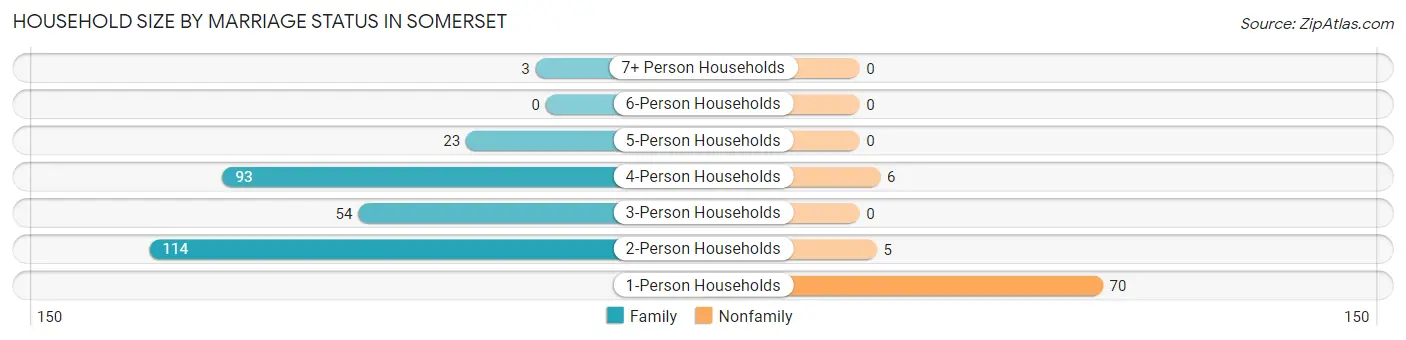
| Household Size | Family Households | Nonfamily Households |
| 1-Person Households | - | 70 (19.0%) |
| 2-Person Households | 114 (31.0%) | 5 (1.4%) |
| 3-Person Households | 54 (14.7%) | 0 (0.0%) |
| 4-Person Households | 93 (25.3%) | 6 (1.6%) |
| 5-Person Households | 23 (6.2%) | 0 (0.0%) |
| 6-Person Households | 0 (0.0%) | 0 (0.0%) |
| 7+ Person Households | 3 (0.8%) | 0 (0.0%) |
| Total | 287 (78.0%) | 81 (22.0%) |
Female Fertility in Somerset
Fertility by Age in Somerset
Average fertility rate in Somerset is 27.0 births per 1,000 women. Women in the age bracket of 35 to 50 years have the highest fertility rate with 41.0 births per 1,000 women. Women in the age bracket of 35 to 50 years acount for 100.0% of all women with births.
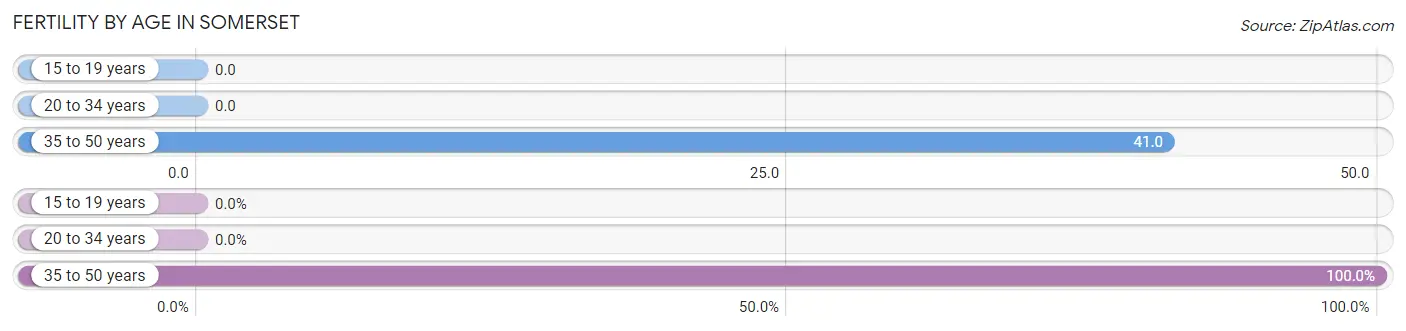
| Age Bracket | Women with Births | Births / 1,000 Women |
| 15 to 19 years | 0 (0.0%) | 0.0 |
| 20 to 34 years | 0 (0.0%) | 0.0 |
| 35 to 50 years | 5 (100.0%) | 41.0 |
| Total | 5 (100.0%) | 27.0 |
Fertility by Age by Marriage Status in Somerset
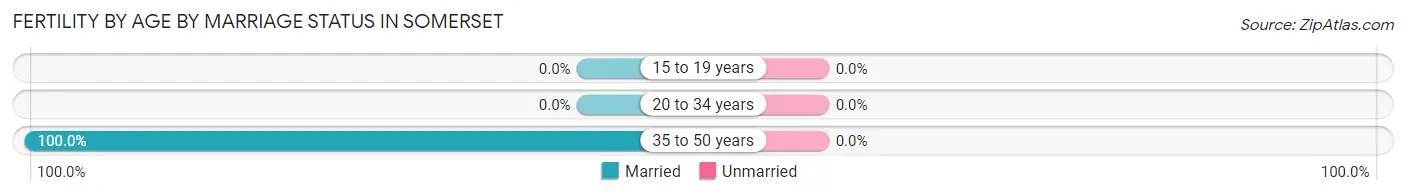
| Age Bracket | Married | Unmarried |
| 15 to 19 years | 0 (0.0%) | 0 (0.0%) |
| 20 to 34 years | 0 (0.0%) | 0 (0.0%) |
| 35 to 50 years | 5 (100.0%) | 0 (0.0%) |
| Total | 5 (100.0%) | 0 (0.0%) |
Fertility by Education in Somerset
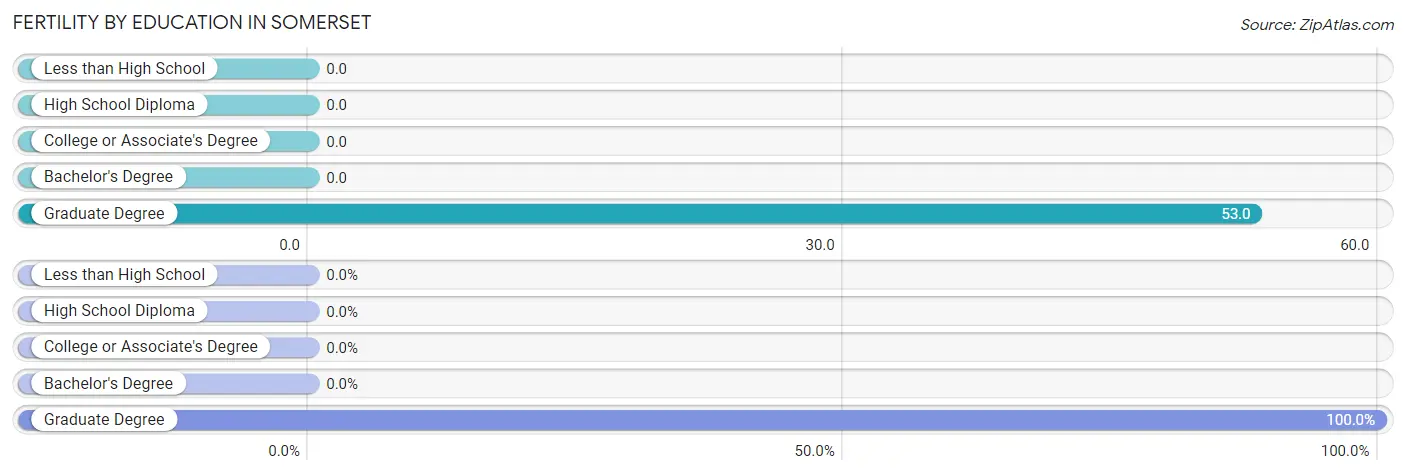
| Educational Attainment | Women with Births | Births / 1,000 Women |
| Less than High School | 0 (0.0%) | 0.0 |
| High School Diploma | 0 (0.0%) | 0.0 |
| College or Associate's Degree | 0 (0.0%) | 0.0 |
| Bachelor's Degree | 0 (0.0%) | 0.0 |
| Graduate Degree | 5 (100.0%) | 53.0 |
| Total | 5 (100.0%) | 27.0 |
Fertility by Education by Marriage Status in Somerset
| Educational Attainment | Married | Unmarried |
| Less than High School | 0 (0.0%) | 0 (0.0%) |
| High School Diploma | 0 (0.0%) | 0 (0.0%) |
| College or Associate's Degree | 0 (0.0%) | 0 (0.0%) |
| Bachelor's Degree | 0 (0.0%) | 0 (0.0%) |
| Graduate Degree | 5 (100.0%) | 0 (0.0%) |
| Total | 5 (100.0%) | 0 (0.0%) |
Employment Characteristics in Somerset
Employment by Class of Employer in Somerset
Among the 505 employed individuals in Somerset, private company employees (201 | 39.8%), not-for-profit organizations (107 | 21.2%), and federal government employees (84 | 16.6%) make up the most common classes of employment.
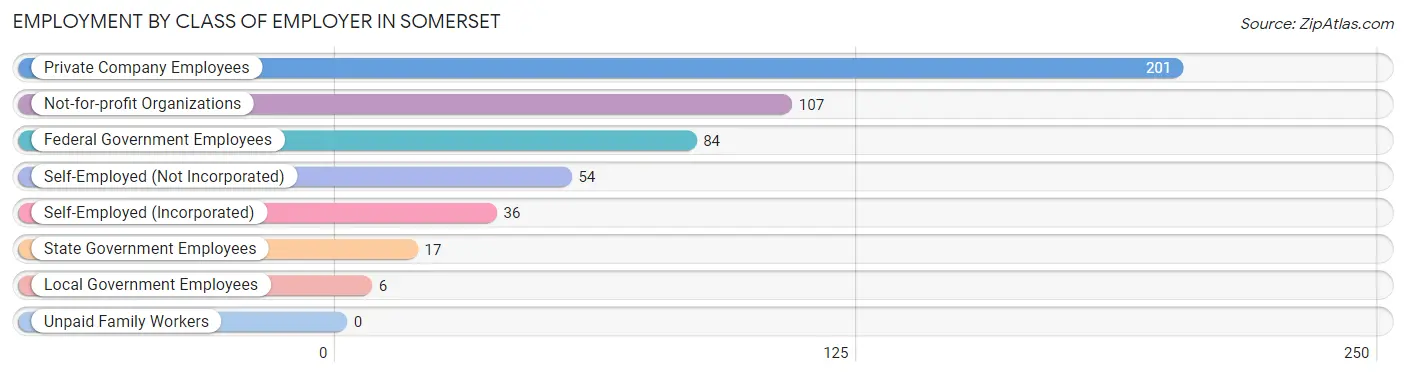
| Employer Class | # Employees | % Employees |
| Private Company Employees | 201 | 39.8% |
| Self-Employed (Incorporated) | 36 | 7.1% |
| Self-Employed (Not Incorporated) | 54 | 10.7% |
| Not-for-profit Organizations | 107 | 21.2% |
| Local Government Employees | 6 | 1.2% |
| State Government Employees | 17 | 3.4% |
| Federal Government Employees | 84 | 16.6% |
| Unpaid Family Workers | 0 | 0.0% |
| Total | 505 | 100.0% |
Employment Status by Age in Somerset
According to the labor force statistics for Somerset, out of the total population over 16 years of age (783), 64.9% or 508 individuals are in the labor force, with 0.6% or 3 of them unemployed. The age group with the highest labor force participation rate is 30 to 34 years, with 100.0% or 2 individuals in the labor force. Within the labor force, the 20 to 24 years age range has the highest percentage of unemployed individuals, with 17.6% or 3 of them being unemployed.
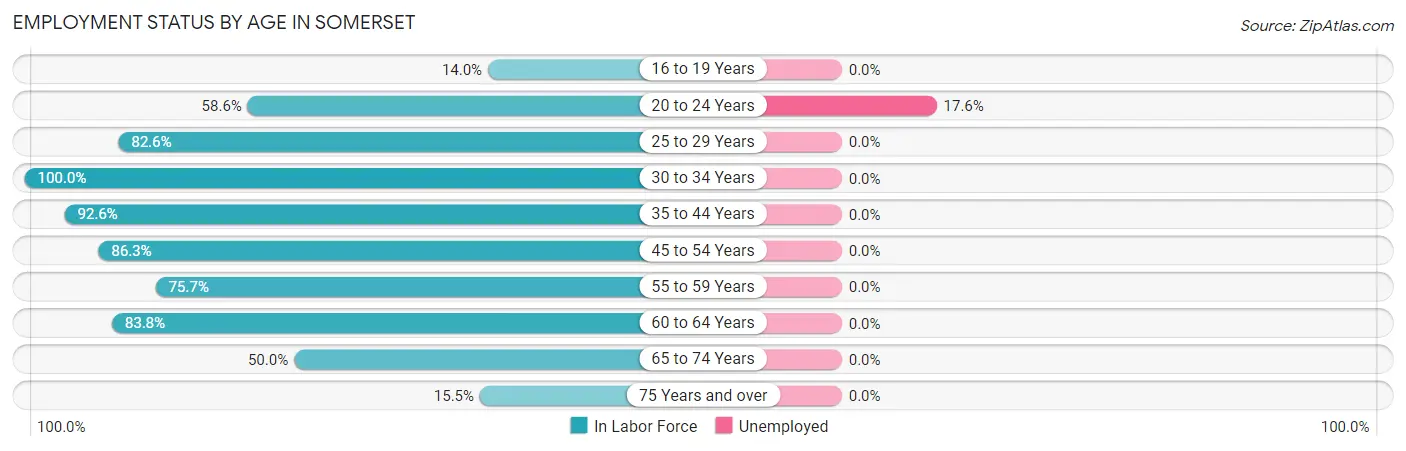
| Age Bracket | In Labor Force | Unemployed |
| 16 to 19 Years | 7 (14.0%) | 0 (0.0%) |
| 20 to 24 Years | 17 (58.6%) | 3 (17.6%) |
| 25 to 29 Years | 19 (82.6%) | 0 (0.0%) |
| 30 to 34 Years | 2 (100.0%) | 0 (0.0%) |
| 35 to 44 Years | 63 (92.6%) | 0 (0.0%) |
| 45 to 54 Years | 177 (86.3%) | 0 (0.0%) |
| 55 to 59 Years | 78 (75.7%) | 0 (0.0%) |
| 60 to 64 Years | 67 (83.8%) | 0 (0.0%) |
| 65 to 74 Years | 63 (50.0%) | 0 (0.0%) |
| 75 Years and over | 15 (15.5%) | 0 (0.0%) |
| Total | 508 (64.9%) | 3 (0.6%) |
Employment Status by Educational Attainment in Somerset
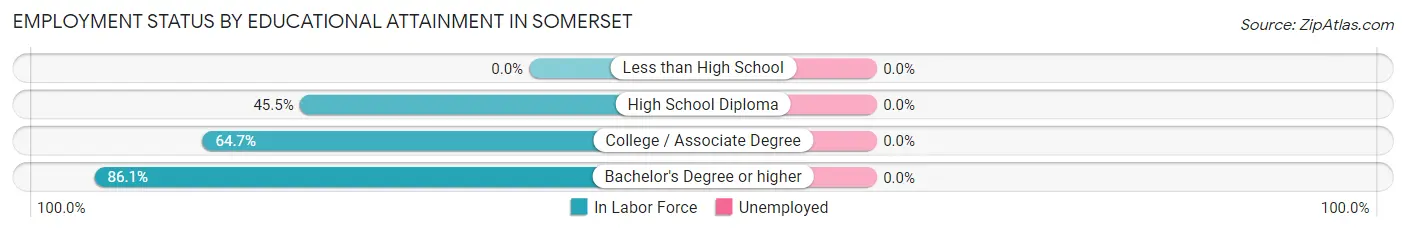
| Educational Attainment | In Labor Force | Unemployed |
| Less than High School | 0 (0.0%) | 0 (0.0%) |
| High School Diploma | 5 (45.5%) | 0 (0.0%) |
| College / Associate Degree | 11 (64.7%) | 0 (0.0%) |
| Bachelor's Degree or higher | 390 (86.1%) | 0 (0.0%) |
| Total | 406 (84.4%) | 0 (0.0%) |
Employment Occupations by Sex in Somerset
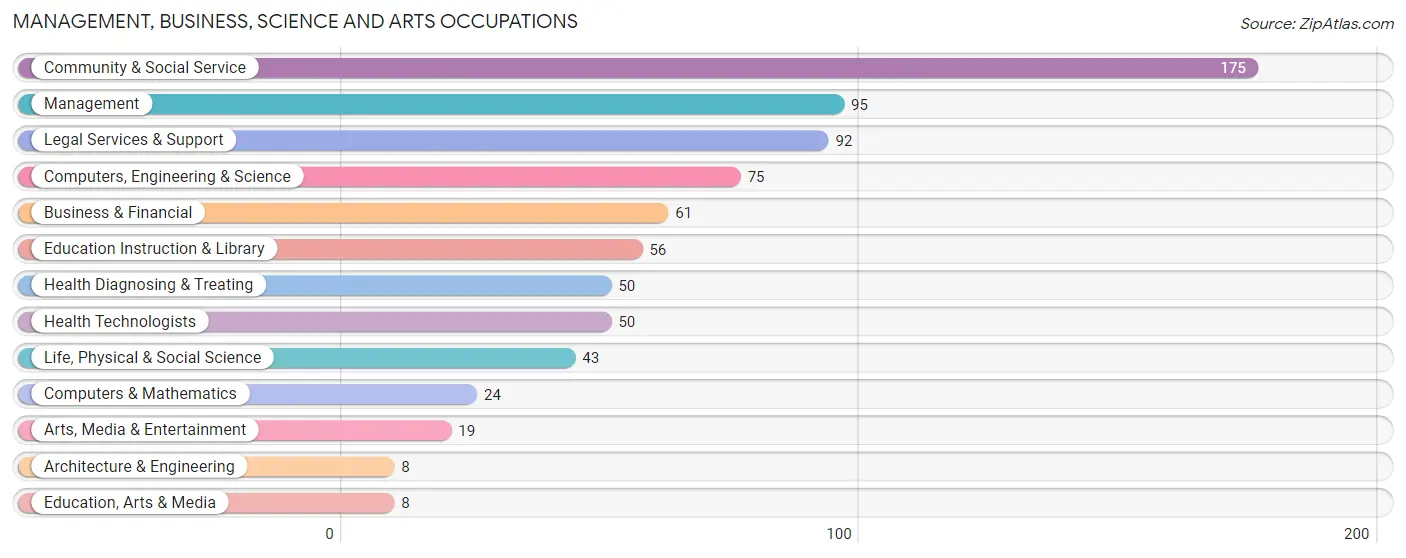
Management, Business, Science and Arts Occupations
The most common Management, Business, Science and Arts occupations in Somerset are Community & Social Service (175 | 34.6%), Management (95 | 18.8%), Legal Services & Support (92 | 18.2%), Computers, Engineering & Science (75 | 14.8%), and Business & Financial (61 | 12.1%).
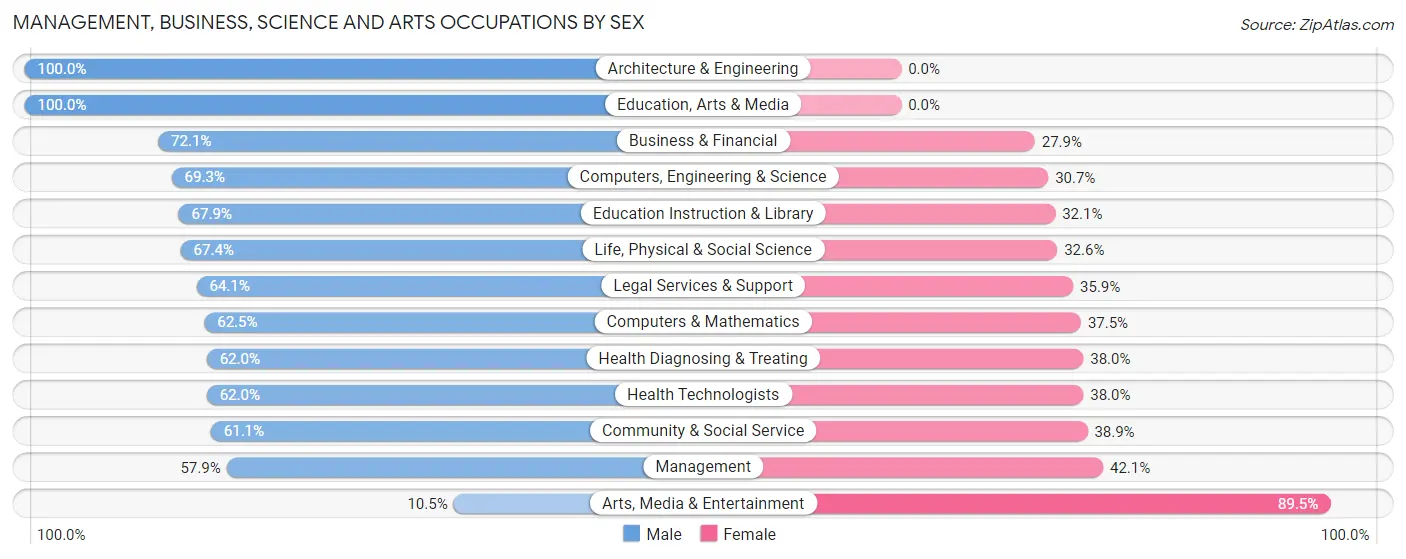
Management, Business, Science and Arts Occupations by Sex
Within the Management, Business, Science and Arts occupations in Somerset, the most male-oriented occupations are Architecture & Engineering (100.0%), Education, Arts & Media (100.0%), and Business & Financial (72.1%), while the most female-oriented occupations are Arts, Media & Entertainment (89.5%), Management (42.1%), and Community & Social Service (38.9%).
| Occupation | Male | Female |
| Management | 55 (57.9%) | 40 (42.1%) |
| Business & Financial | 44 (72.1%) | 17 (27.9%) |
| Computers, Engineering & Science | 52 (69.3%) | 23 (30.7%) |
| Computers & Mathematics | 15 (62.5%) | 9 (37.5%) |
| Architecture & Engineering | 8 (100.0%) | 0 (0.0%) |
| Life, Physical & Social Science | 29 (67.4%) | 14 (32.6%) |
| Community & Social Service | 107 (61.1%) | 68 (38.9%) |
| Education, Arts & Media | 8 (100.0%) | 0 (0.0%) |
| Legal Services & Support | 59 (64.1%) | 33 (35.9%) |
| Education Instruction & Library | 38 (67.9%) | 18 (32.1%) |
| Arts, Media & Entertainment | 2 (10.5%) | 17 (89.5%) |
| Health Diagnosing & Treating | 31 (62.0%) | 19 (38.0%) |
| Health Technologists | 31 (62.0%) | 19 (38.0%) |
| Total (Category) | 289 (63.4%) | 167 (36.6%) |
| Total (Overall) | 301 (59.6%) | 204 (40.4%) |
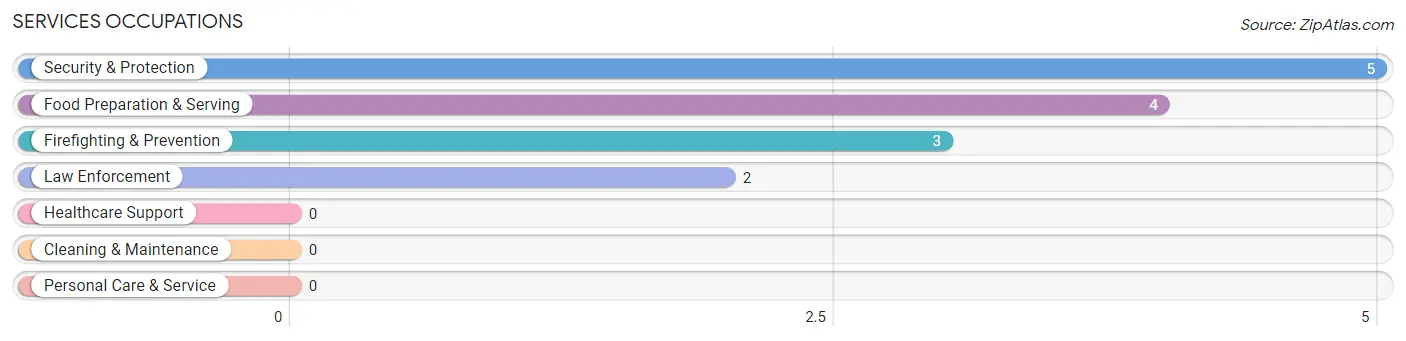
Services Occupations
The most common Services occupations in Somerset are Security & Protection (5 | 1.0%), Food Preparation & Serving (4 | 0.8%), Firefighting & Prevention (3 | 0.6%), and Law Enforcement (2 | 0.4%).
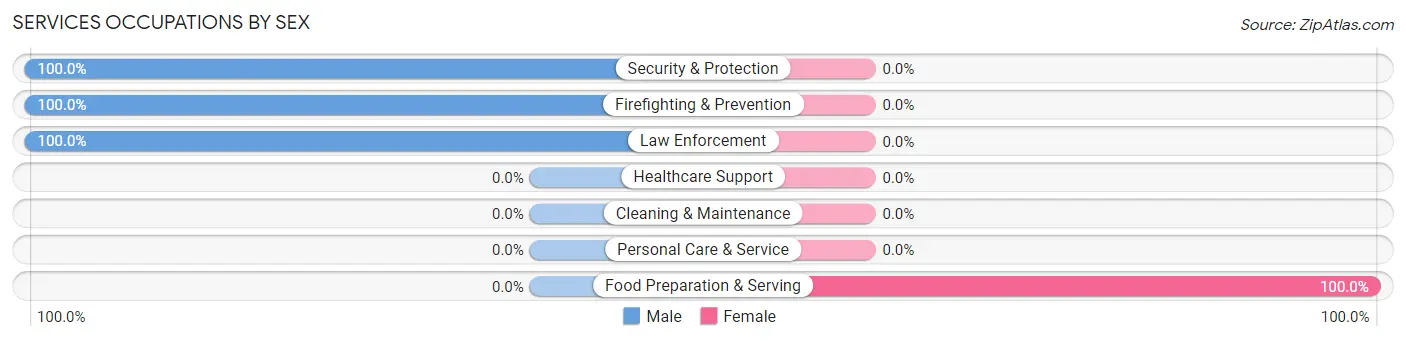
Services Occupations by Sex
| Occupation | Male | Female |
| Healthcare Support | 0 (0.0%) | 0 (0.0%) |
| Security & Protection | 5 (100.0%) | 0 (0.0%) |
| Firefighting & Prevention | 3 (100.0%) | 0 (0.0%) |
| Law Enforcement | 2 (100.0%) | 0 (0.0%) |
| Food Preparation & Serving | 0 (0.0%) | 4 (100.0%) |
| Cleaning & Maintenance | 0 (0.0%) | 0 (0.0%) |
| Personal Care & Service | 0 (0.0%) | 0 (0.0%) |
| Total (Category) | 5 (55.6%) | 4 (44.4%) |
| Total (Overall) | 301 (59.6%) | 204 (40.4%) |
Sales and Office Occupations
The most common Sales and Office occupations in Somerset are Sales & Related (21 | 4.2%), and Office & Administration (15 | 3.0%).
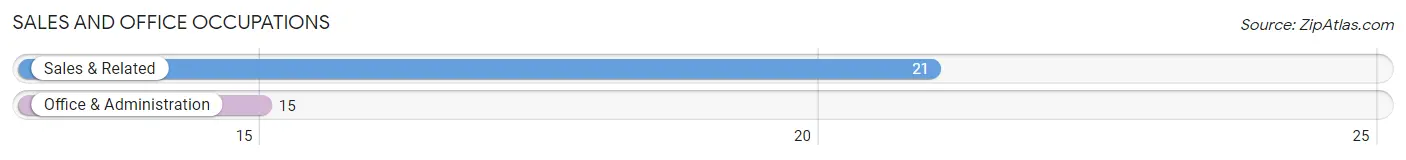
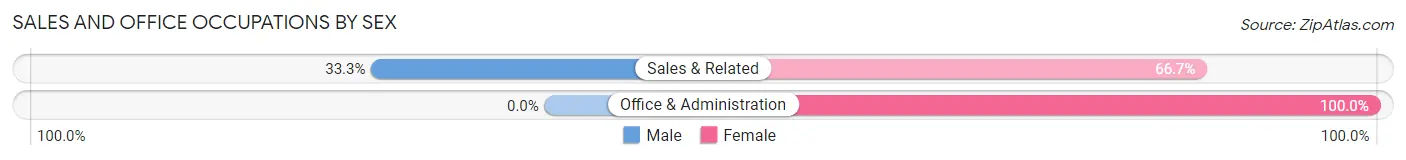
Sales and Office Occupations by Sex
| Occupation | Male | Female |
| Sales & Related | 7 (33.3%) | 14 (66.7%) |
| Office & Administration | 0 (0.0%) | 15 (100.0%) |
| Total (Category) | 7 (19.4%) | 29 (80.6%) |
| Total (Overall) | 301 (59.6%) | 204 (40.4%) |
Natural Resources, Construction and Maintenance Occupations
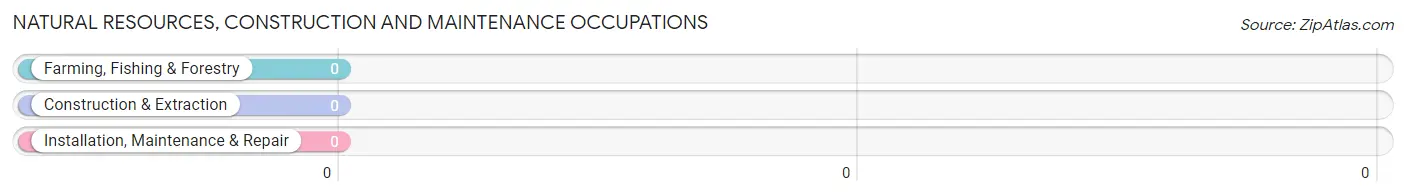
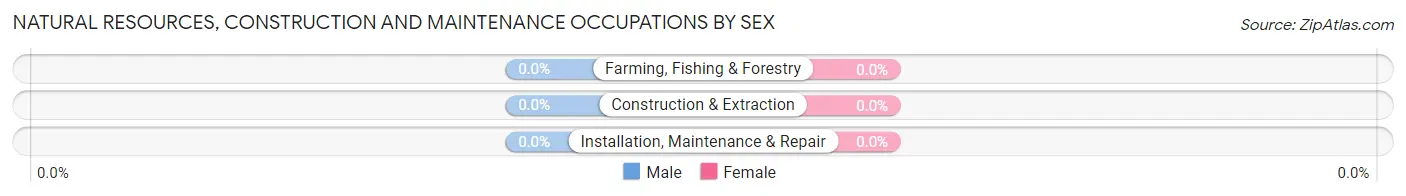
Natural Resources, Construction and Maintenance Occupations by Sex
| Occupation | Male | Female |
| Farming, Fishing & Forestry | 0 (0.0%) | 0 (0.0%) |
| Construction & Extraction | 0 (0.0%) | 0 (0.0%) |
| Installation, Maintenance & Repair | 0 (0.0%) | 0 (0.0%) |
| Total (Category) | 0 (0.0%) | 0 (0.0%) |
| Total (Overall) | 301 (59.6%) | 204 (40.4%) |
Production, Transportation and Moving Occupations
The most common Production, Transportation and Moving occupations in Somerset are , and Production (4 | 0.8%).
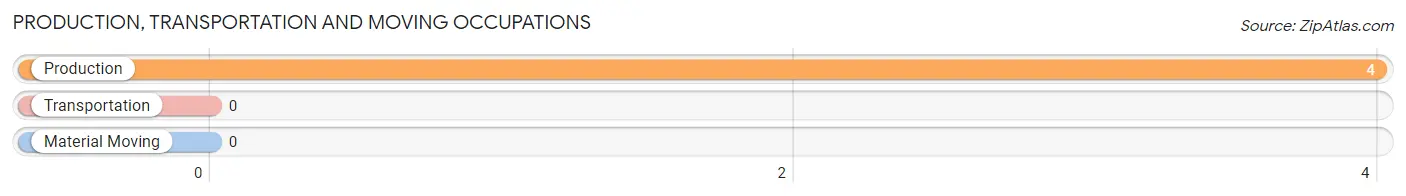
Production, Transportation and Moving Occupations by Sex
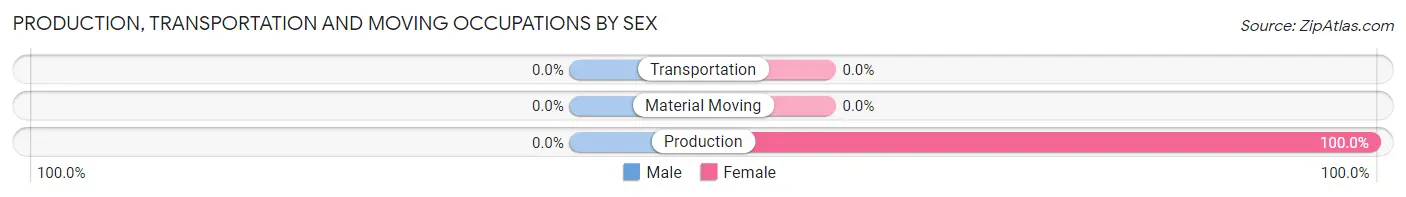
| Occupation | Male | Female |
| Production | 0 (0.0%) | 4 (100.0%) |
| Transportation | 0 (0.0%) | 0 (0.0%) |
| Material Moving | 0 (0.0%) | 0 (0.0%) |
| Total (Category) | 0 (0.0%) | 4 (100.0%) |
| Total (Overall) | 301 (59.6%) | 204 (40.4%) |
Employment Industries by Sex in Somerset
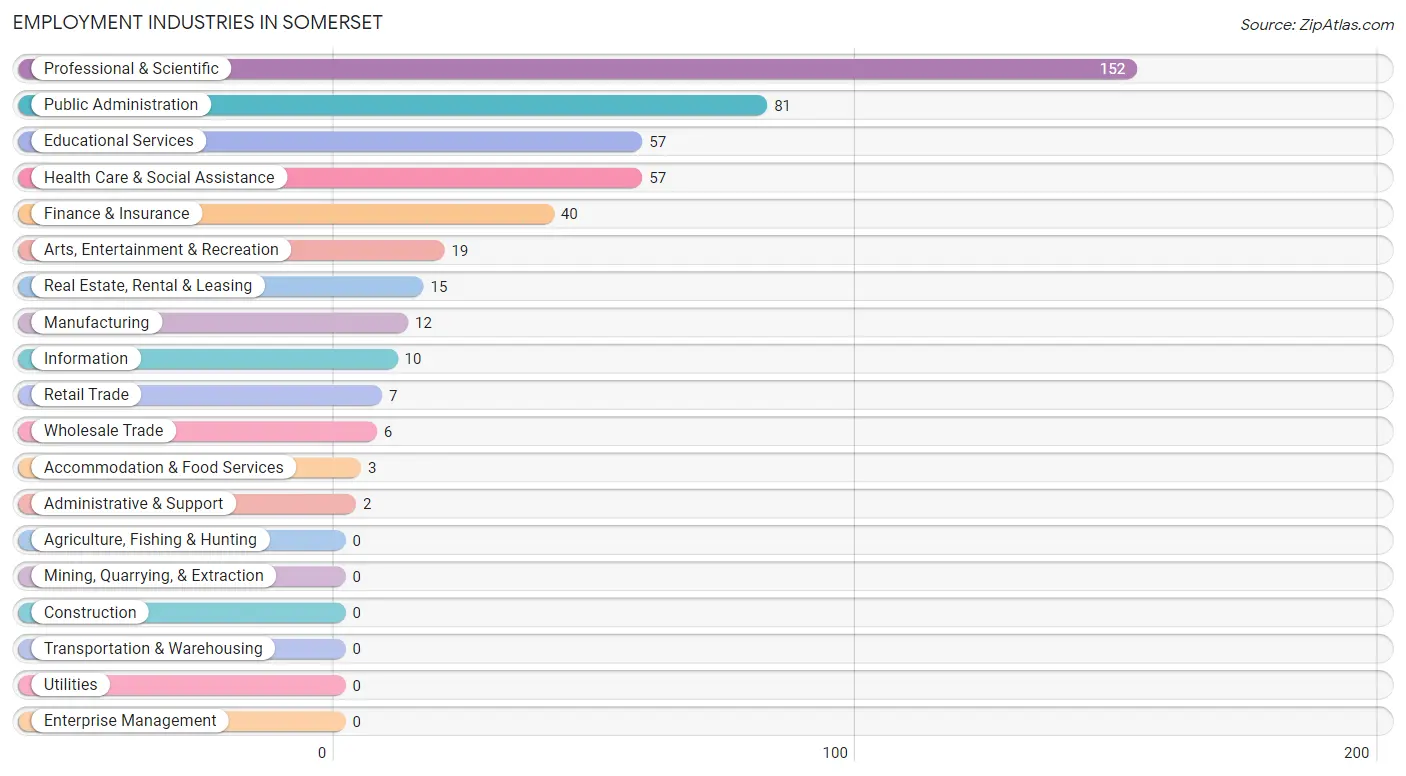
Employment Industries in Somerset
The major employment industries in Somerset include Professional & Scientific (152 | 30.1%), Public Administration (81 | 16.0%), Educational Services (57 | 11.3%), Health Care & Social Assistance (57 | 11.3%), and Finance & Insurance (40 | 7.9%).
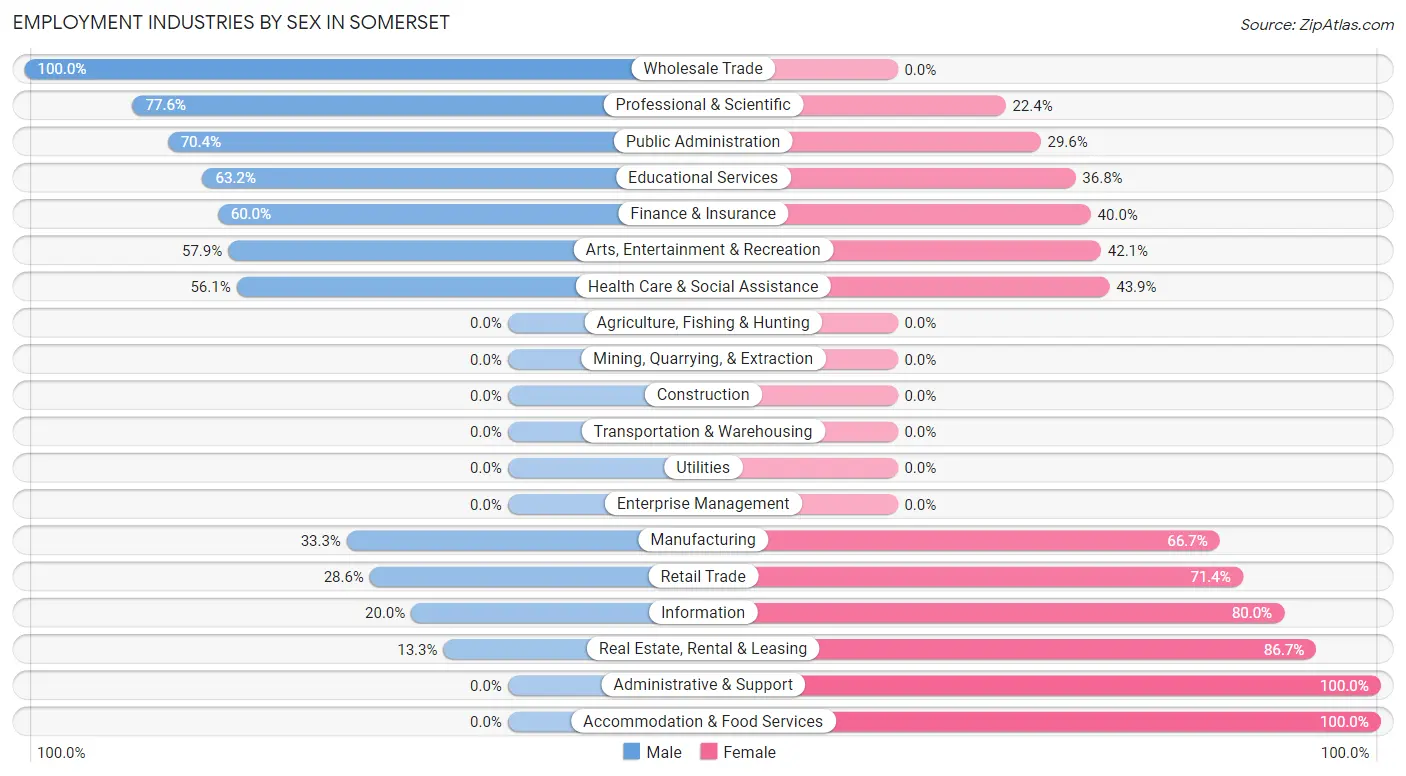
Employment Industries by Sex in Somerset
The Somerset industries that see more men than women are Wholesale Trade (100.0%), Professional & Scientific (77.6%), and Public Administration (70.4%), whereas the industries that tend to have a higher number of women are Administrative & Support (100.0%), Accommodation & Food Services (100.0%), and Real Estate, Rental & Leasing (86.7%).
| Industry | Male | Female |
| Agriculture, Fishing & Hunting | 0 (0.0%) | 0 (0.0%) |
| Mining, Quarrying, & Extraction | 0 (0.0%) | 0 (0.0%) |
| Construction | 0 (0.0%) | 0 (0.0%) |
| Manufacturing | 4 (33.3%) | 8 (66.7%) |
| Wholesale Trade | 6 (100.0%) | 0 (0.0%) |
| Retail Trade | 2 (28.6%) | 5 (71.4%) |
| Transportation & Warehousing | 0 (0.0%) | 0 (0.0%) |
| Utilities | 0 (0.0%) | 0 (0.0%) |
| Information | 2 (20.0%) | 8 (80.0%) |
| Finance & Insurance | 24 (60.0%) | 16 (40.0%) |
| Real Estate, Rental & Leasing | 2 (13.3%) | 13 (86.7%) |
| Professional & Scientific | 118 (77.6%) | 34 (22.4%) |
| Enterprise Management | 0 (0.0%) | 0 (0.0%) |
| Administrative & Support | 0 (0.0%) | 2 (100.0%) |
| Educational Services | 36 (63.2%) | 21 (36.8%) |
| Health Care & Social Assistance | 32 (56.1%) | 25 (43.9%) |
| Arts, Entertainment & Recreation | 11 (57.9%) | 8 (42.1%) |
| Accommodation & Food Services | 0 (0.0%) | 3 (100.0%) |
| Public Administration | 57 (70.4%) | 24 (29.6%) |
| Total | 301 (59.6%) | 204 (40.4%) |
Education in Somerset
School Enrollment in Somerset
The most common levels of schooling among the 316 students in Somerset are high school (91 | 28.8%), elementary school (88 | 27.9%), and middle school (70 | 22.2%).
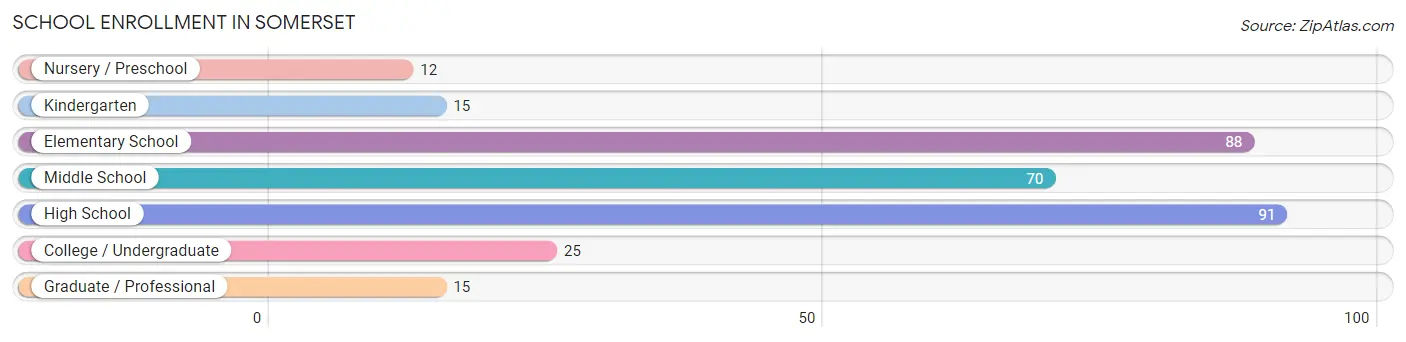
| School Level | # Students | % Students |
| Nursery / Preschool | 12 | 3.8% |
| Kindergarten | 15 | 4.8% |
| Elementary School | 88 | 27.9% |
| Middle School | 70 | 22.2% |
| High School | 91 | 28.8% |
| College / Undergraduate | 25 | 7.9% |
| Graduate / Professional | 15 | 4.8% |
| Total | 316 | 100.0% |
School Enrollment by Age by Funding Source in Somerset
Out of a total of 316 students who are enrolled in schools in Somerset, 147 (46.5%) attend a private institution, while the remaining 169 (53.5%) are enrolled in public schools. The age group of 3 to 4 year olds has the highest likelihood of being enrolled in private schools, with 12 (100.0% in the age bracket) enrolled. Conversely, the age group of 20 to 24 year olds has the lowest likelihood of being enrolled in a private school, with 10 (66.7% in the age bracket) attending a public institution.
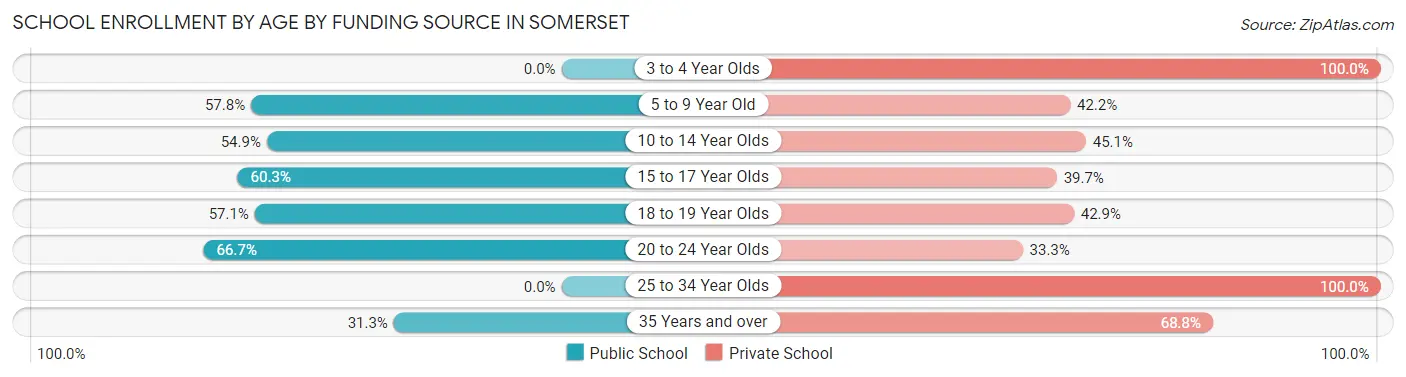
| Age Bracket | Public School | Private School |
| 3 to 4 Year Olds | 0 (0.0%) | 12 (100.0%) |
| 5 to 9 Year Old | 48 (57.8%) | 35 (42.2%) |
| 10 to 14 Year Olds | 56 (54.9%) | 46 (45.1%) |
| 15 to 17 Year Olds | 38 (60.3%) | 25 (39.7%) |
| 18 to 19 Year Olds | 12 (57.1%) | 9 (42.9%) |
| 20 to 24 Year Olds | 10 (66.7%) | 5 (33.3%) |
| 25 to 34 Year Olds | 0 (0.0%) | 4 (100.0%) |
| 35 Years and over | 5 (31.2%) | 11 (68.8%) |
| Total | 169 (53.5%) | 147 (46.5%) |
Educational Attainment by Field of Study in Somerset
Social sciences (249 | 34.6%), liberal arts & history (88 | 12.2%), literature & languages (87 | 12.1%), bio, nature & agricultural (34 | 4.7%), and physical & health sciences (34 | 4.7%) are the most common fields of study among 720 individuals in Somerset who have obtained a bachelor's degree or higher.
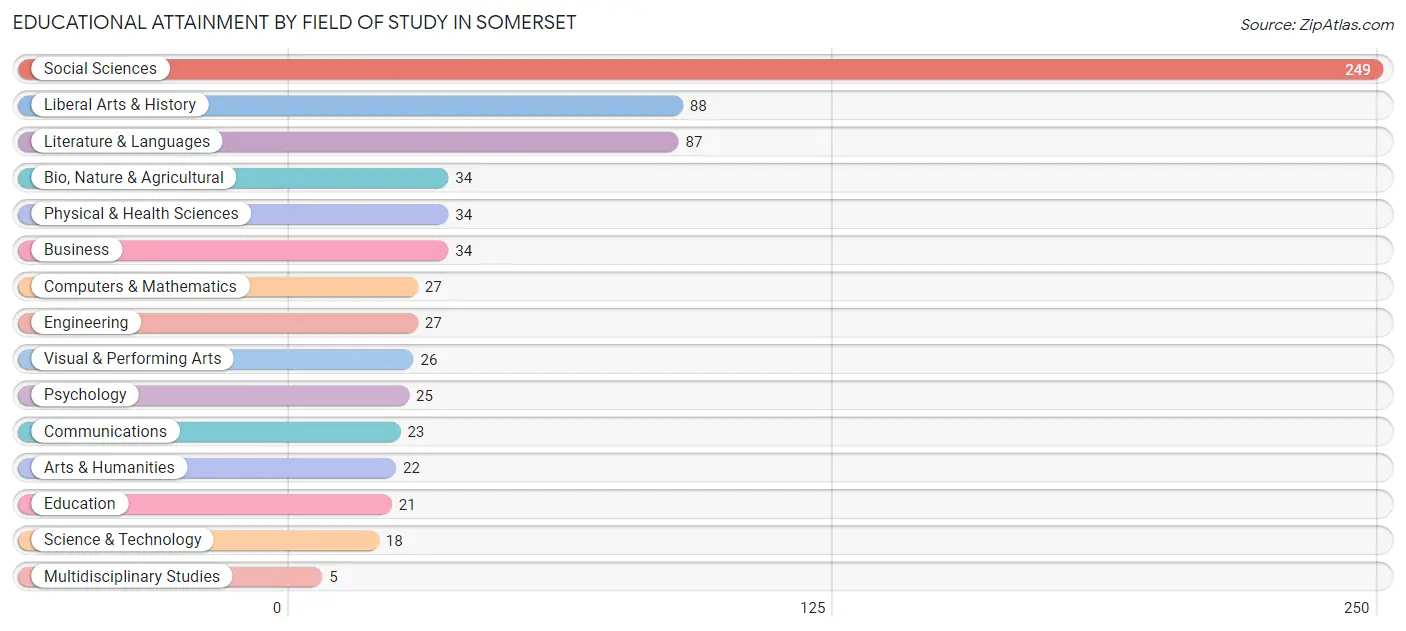
| Field of Study | # Graduates | % Graduates |
| Computers & Mathematics | 27 | 3.7% |
| Bio, Nature & Agricultural | 34 | 4.7% |
| Physical & Health Sciences | 34 | 4.7% |
| Psychology | 25 | 3.5% |
| Social Sciences | 249 | 34.6% |
| Engineering | 27 | 3.7% |
| Multidisciplinary Studies | 5 | 0.7% |
| Science & Technology | 18 | 2.5% |
| Business | 34 | 4.7% |
| Education | 21 | 2.9% |
| Literature & Languages | 87 | 12.1% |
| Liberal Arts & History | 88 | 12.2% |
| Visual & Performing Arts | 26 | 3.6% |
| Communications | 23 | 3.2% |
| Arts & Humanities | 22 | 3.1% |
| Total | 720 | 100.0% |
Transportation & Commute in Somerset
Vehicle Availability by Sex in Somerset
The most prevalent vehicle ownership categories in Somerset are males with 2 vehicles (154, accounting for 51.2%) and females with 2 vehicles (104, making up 75.5%).
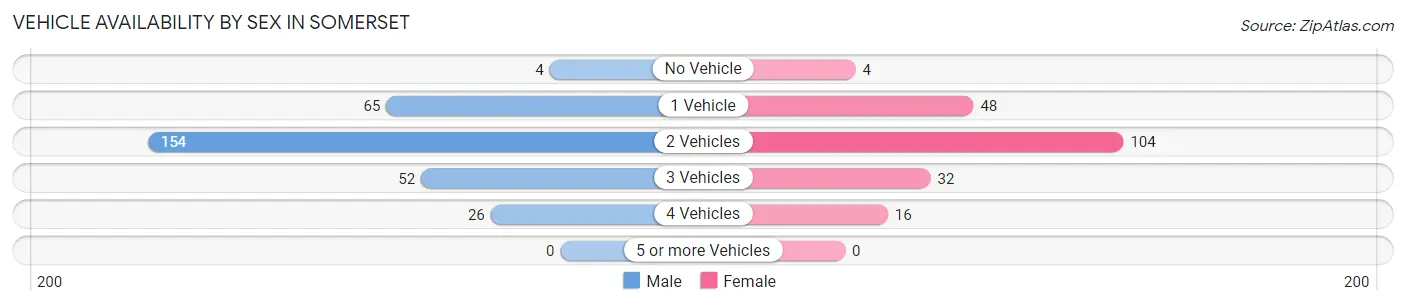
| Vehicles Available | Male | Female |
| No Vehicle | 4 (1.3%) | 4 (2.0%) |
| 1 Vehicle | 65 (21.6%) | 48 (23.5%) |
| 2 Vehicles | 154 (51.2%) | 104 (51.0%) |
| 3 Vehicles | 52 (17.3%) | 32 (15.7%) |
| 4 Vehicles | 26 (8.6%) | 16 (7.8%) |
| 5 or more Vehicles | 0 (0.0%) | 0 (0.0%) |
| Total | 301 (100.0%) | 204 (100.0%) |
Commute Time in Somerset
The most frequently occuring commute durations in Somerset are 45 to 59 minutes (56 commuters, 19.4%), 30 to 34 minutes (48 commuters, 16.7%), and 20 to 24 minutes (33 commuters, 11.5%).
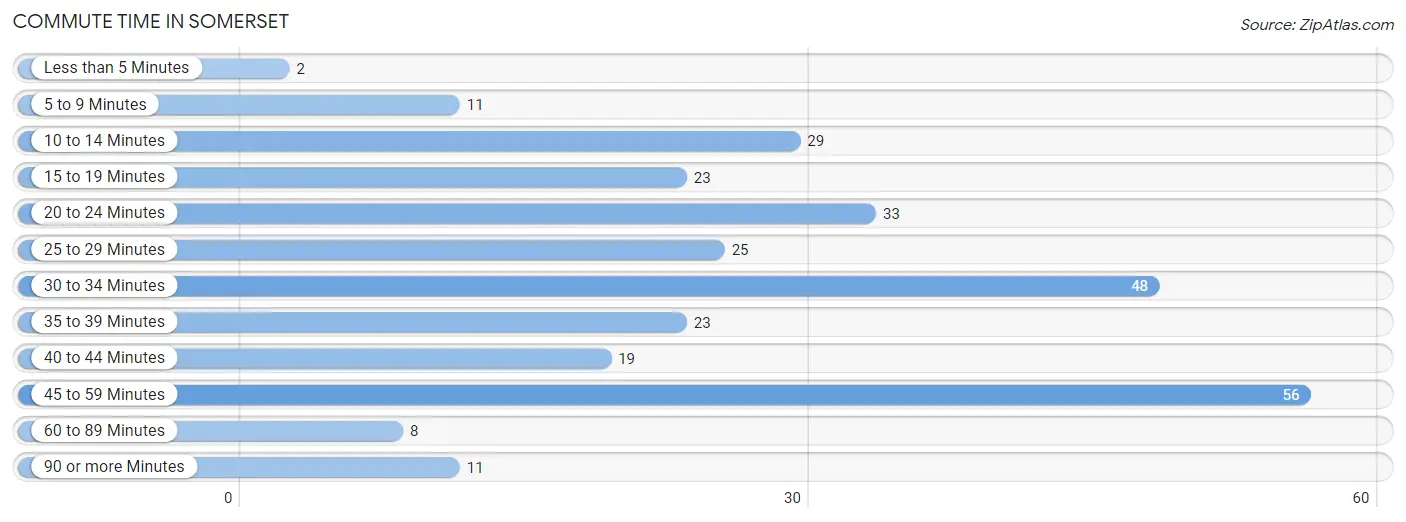
| Commute Time | # Commuters | % Commuters |
| Less than 5 Minutes | 2 | 0.7% |
| 5 to 9 Minutes | 11 | 3.8% |
| 10 to 14 Minutes | 29 | 10.1% |
| 15 to 19 Minutes | 23 | 8.0% |
| 20 to 24 Minutes | 33 | 11.5% |
| 25 to 29 Minutes | 25 | 8.7% |
| 30 to 34 Minutes | 48 | 16.7% |
| 35 to 39 Minutes | 23 | 8.0% |
| 40 to 44 Minutes | 19 | 6.6% |
| 45 to 59 Minutes | 56 | 19.4% |
| 60 to 89 Minutes | 8 | 2.8% |
| 90 or more Minutes | 11 | 3.8% |
Commute Time by Sex in Somerset
The most common commute times in Somerset are 30 to 34 minutes (33 commuters, 19.4%) for males and 45 to 59 minutes (23 commuters, 19.5%) for females.
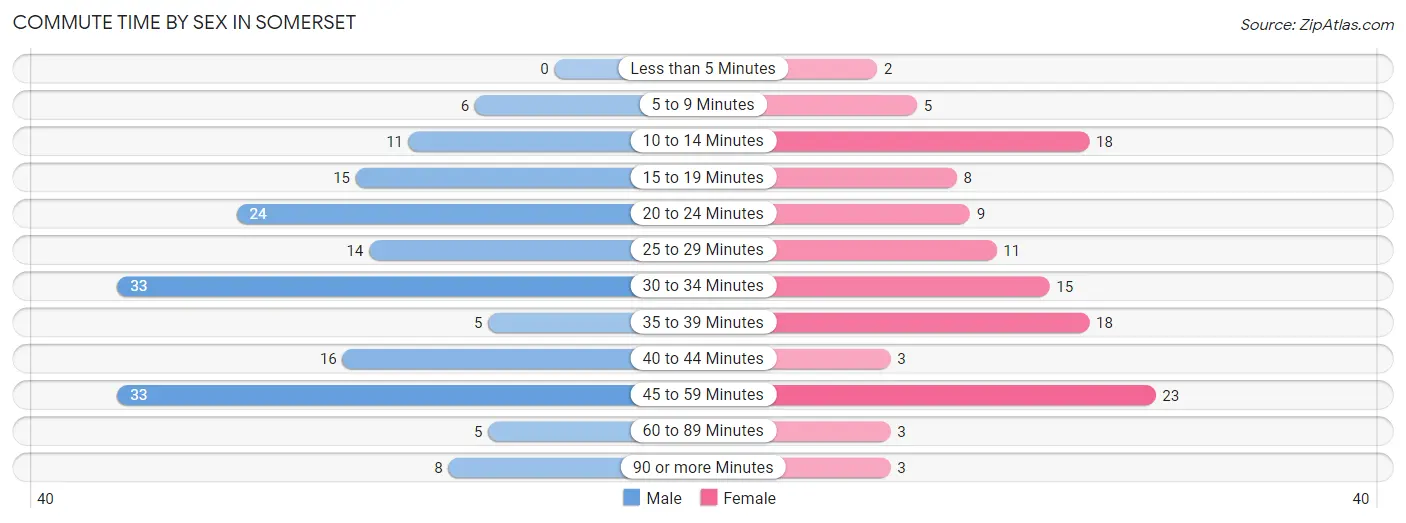
| Commute Time | Male | Female |
| Less than 5 Minutes | 0 (0.0%) | 2 (1.7%) |
| 5 to 9 Minutes | 6 (3.5%) | 5 (4.2%) |
| 10 to 14 Minutes | 11 (6.5%) | 18 (15.2%) |
| 15 to 19 Minutes | 15 (8.8%) | 8 (6.8%) |
| 20 to 24 Minutes | 24 (14.1%) | 9 (7.6%) |
| 25 to 29 Minutes | 14 (8.2%) | 11 (9.3%) |
| 30 to 34 Minutes | 33 (19.4%) | 15 (12.7%) |
| 35 to 39 Minutes | 5 (2.9%) | 18 (15.2%) |
| 40 to 44 Minutes | 16 (9.4%) | 3 (2.5%) |
| 45 to 59 Minutes | 33 (19.4%) | 23 (19.5%) |
| 60 to 89 Minutes | 5 (2.9%) | 3 (2.5%) |
| 90 or more Minutes | 8 (4.7%) | 3 (2.5%) |
Time of Departure to Work by Sex in Somerset
The most frequent times of departure to work in Somerset are 8:00 AM to 8:29 AM (36, 21.2%) for males and 7:30 AM to 7:59 AM (28, 23.7%) for females.
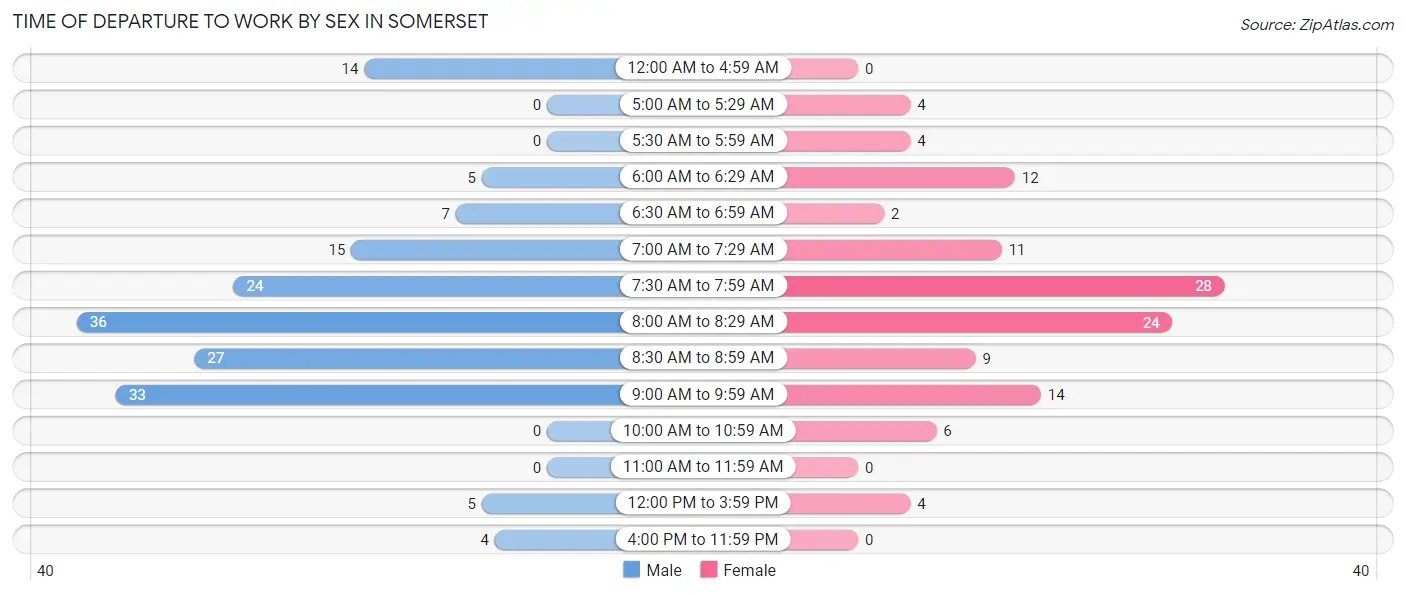
| Time of Departure | Male | Female |
| 12:00 AM to 4:59 AM | 14 (8.2%) | 0 (0.0%) |
| 5:00 AM to 5:29 AM | 0 (0.0%) | 4 (3.4%) |
| 5:30 AM to 5:59 AM | 0 (0.0%) | 4 (3.4%) |
| 6:00 AM to 6:29 AM | 5 (2.9%) | 12 (10.2%) |
| 6:30 AM to 6:59 AM | 7 (4.1%) | 2 (1.7%) |
| 7:00 AM to 7:29 AM | 15 (8.8%) | 11 (9.3%) |
| 7:30 AM to 7:59 AM | 24 (14.1%) | 28 (23.7%) |
| 8:00 AM to 8:29 AM | 36 (21.2%) | 24 (20.3%) |
| 8:30 AM to 8:59 AM | 27 (15.9%) | 9 (7.6%) |
| 9:00 AM to 9:59 AM | 33 (19.4%) | 14 (11.9%) |
| 10:00 AM to 10:59 AM | 0 (0.0%) | 6 (5.1%) |
| 11:00 AM to 11:59 AM | 0 (0.0%) | 0 (0.0%) |
| 12:00 PM to 3:59 PM | 5 (2.9%) | 4 (3.4%) |
| 4:00 PM to 11:59 PM | 4 (2.4%) | 0 (0.0%) |
| Total | 170 (100.0%) | 118 (100.0%) |
Housing Occupancy in Somerset
Occupancy by Ownership in Somerset
Of the total 368 dwellings in Somerset, owner-occupied units account for 341 (92.7%), while renter-occupied units make up 27 (7.3%).
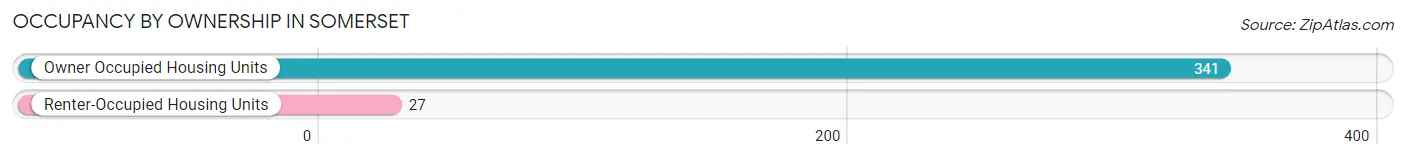
| Occupancy | # Housing Units | % Housing Units |
| Owner Occupied Housing Units | 341 | 92.7% |
| Renter-Occupied Housing Units | 27 | 7.3% |
| Total Occupied Housing Units | 368 | 100.0% |
Occupancy by Household Size in Somerset
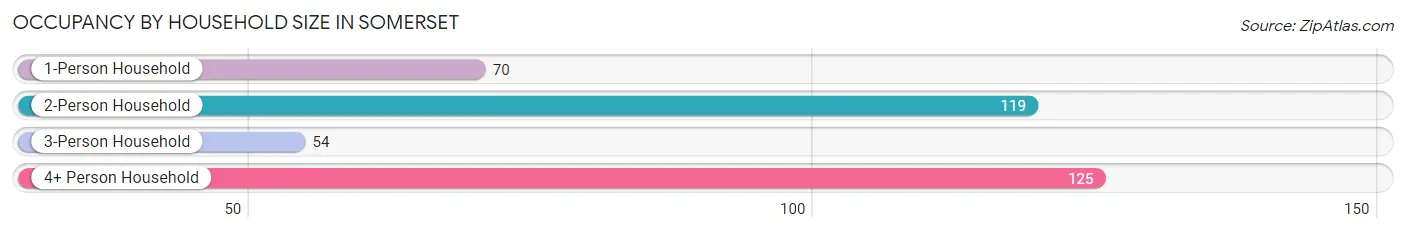
| Household Size | # Housing Units | % Housing Units |
| 1-Person Household | 70 | 19.0% |
| 2-Person Household | 119 | 32.3% |
| 3-Person Household | 54 | 14.7% |
| 4+ Person Household | 125 | 34.0% |
| Total Housing Units | 368 | 100.0% |
Occupancy by Ownership by Household Size in Somerset
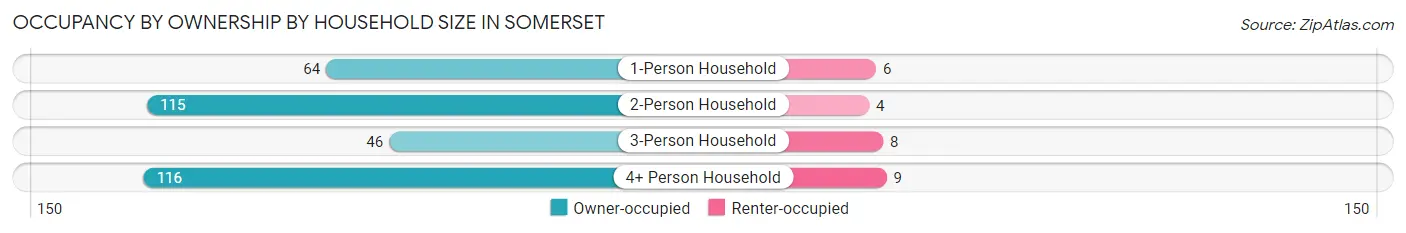
| Household Size | Owner-occupied | Renter-occupied |
| 1-Person Household | 64 (91.4%) | 6 (8.6%) |
| 2-Person Household | 115 (96.6%) | 4 (3.4%) |
| 3-Person Household | 46 (85.2%) | 8 (14.8%) |
| 4+ Person Household | 116 (92.8%) | 9 (7.2%) |
| Total Housing Units | 341 (92.7%) | 27 (7.3%) |
Occupancy by Educational Attainment in Somerset
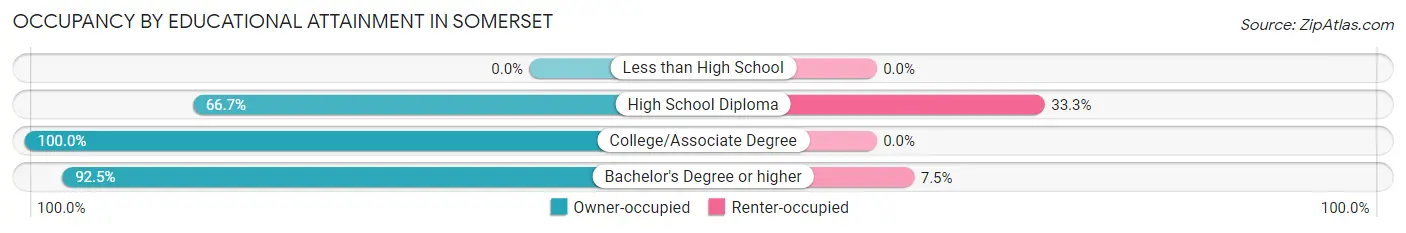
| Household Size | Owner-occupied | Renter-occupied |
| Less than High School | 0 (0.0%) | 0 (0.0%) |
| High School Diploma | 4 (66.7%) | 2 (33.3%) |
| College/Associate Degree | 27 (100.0%) | 0 (0.0%) |
| Bachelor's Degree or higher | 310 (92.5%) | 25 (7.5%) |
Occupancy by Age of Householder in Somerset
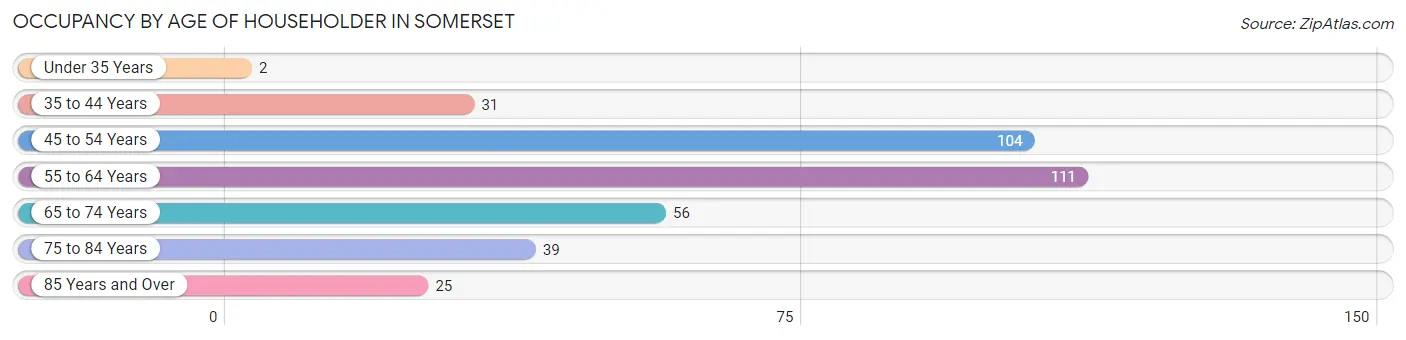
| Age Bracket | # Households | % Households |
| Under 35 Years | 2 | 0.5% |
| 35 to 44 Years | 31 | 8.4% |
| 45 to 54 Years | 104 | 28.3% |
| 55 to 64 Years | 111 | 30.2% |
| 65 to 74 Years | 56 | 15.2% |
| 75 to 84 Years | 39 | 10.6% |
| 85 Years and Over | 25 | 6.8% |
| Total | 368 | 100.0% |
Housing Finances in Somerset
Median Income by Occupancy in Somerset
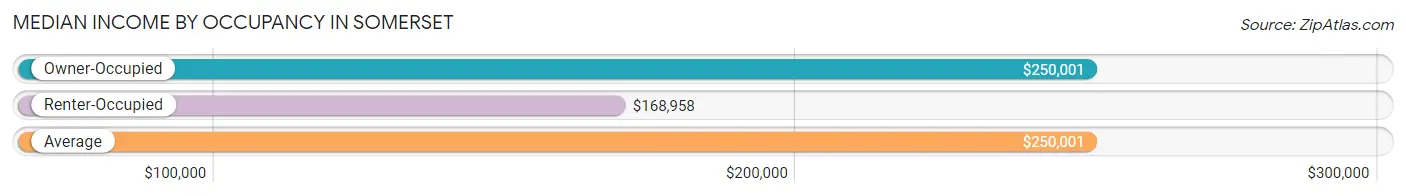
| Occupancy Type | # Households | Median Income |
| Owner-Occupied | 341 (92.7%) | $250,001 |
| Renter-Occupied | 27 (7.3%) | $168,958 |
| Average | 368 (100.0%) | $250,001 |
Occupancy by Householder Income Bracket in Somerset
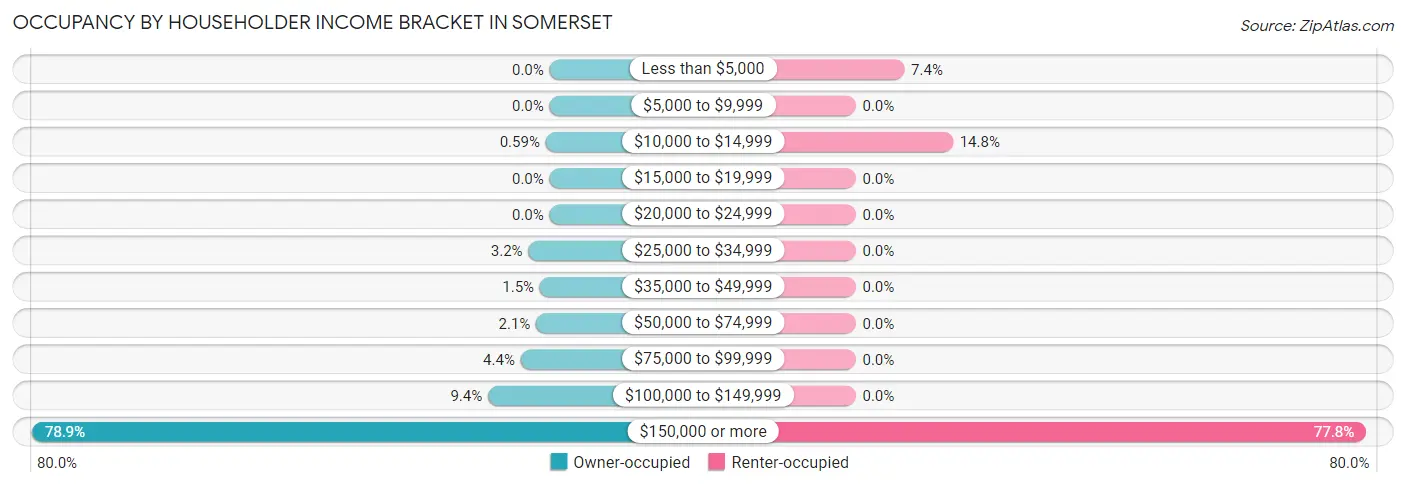
| Income Bracket | Owner-occupied | Renter-occupied |
| Less than $5,000 | 0 (0.0%) | 2 (7.4%) |
| $5,000 to $9,999 | 0 (0.0%) | 0 (0.0%) |
| $10,000 to $14,999 | 2 (0.6%) | 4 (14.8%) |
| $15,000 to $19,999 | 0 (0.0%) | 0 (0.0%) |
| $20,000 to $24,999 | 0 (0.0%) | 0 (0.0%) |
| $25,000 to $34,999 | 11 (3.2%) | 0 (0.0%) |
| $35,000 to $49,999 | 5 (1.5%) | 0 (0.0%) |
| $50,000 to $74,999 | 7 (2.1%) | 0 (0.0%) |
| $75,000 to $99,999 | 15 (4.4%) | 0 (0.0%) |
| $100,000 to $149,999 | 32 (9.4%) | 0 (0.0%) |
| $150,000 or more | 269 (78.9%) | 21 (77.8%) |
| Total | 341 (100.0%) | 27 (100.0%) |
Monthly Housing Cost Tiers in Somerset
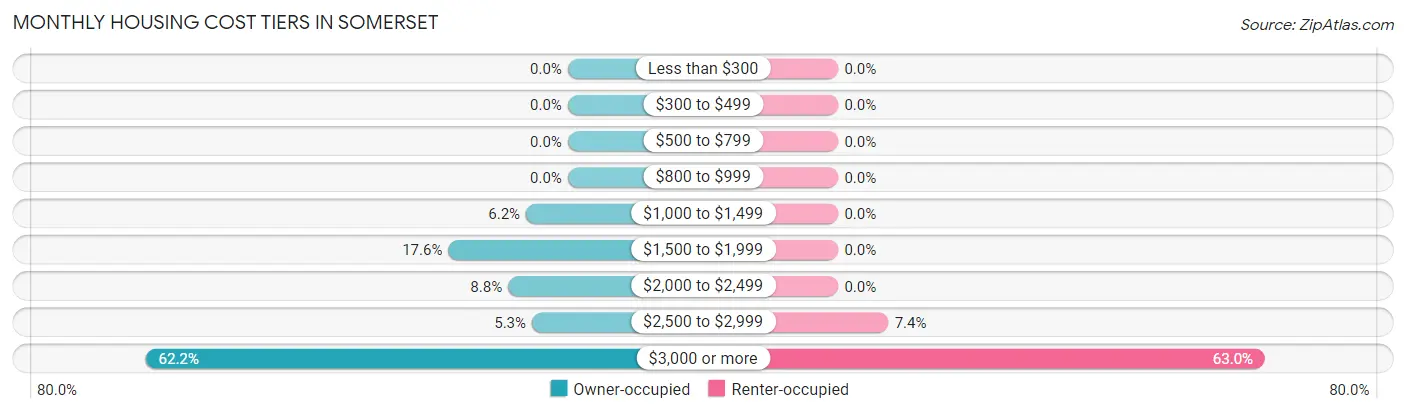
| Monthly Cost | Owner-occupied | Renter-occupied |
| Less than $300 | 0 (0.0%) | 0 (0.0%) |
| $300 to $499 | 0 (0.0%) | 0 (0.0%) |
| $500 to $799 | 0 (0.0%) | 0 (0.0%) |
| $800 to $999 | 0 (0.0%) | 0 (0.0%) |
| $1,000 to $1,499 | 21 (6.2%) | 0 (0.0%) |
| $1,500 to $1,999 | 60 (17.6%) | 0 (0.0%) |
| $2,000 to $2,499 | 30 (8.8%) | 0 (0.0%) |
| $2,500 to $2,999 | 18 (5.3%) | 2 (7.4%) |
| $3,000 or more | 212 (62.2%) | 17 (63.0%) |
| Total | 341 (100.0%) | 27 (100.0%) |
Physical Housing Characteristics in Somerset
Housing Structures in Somerset
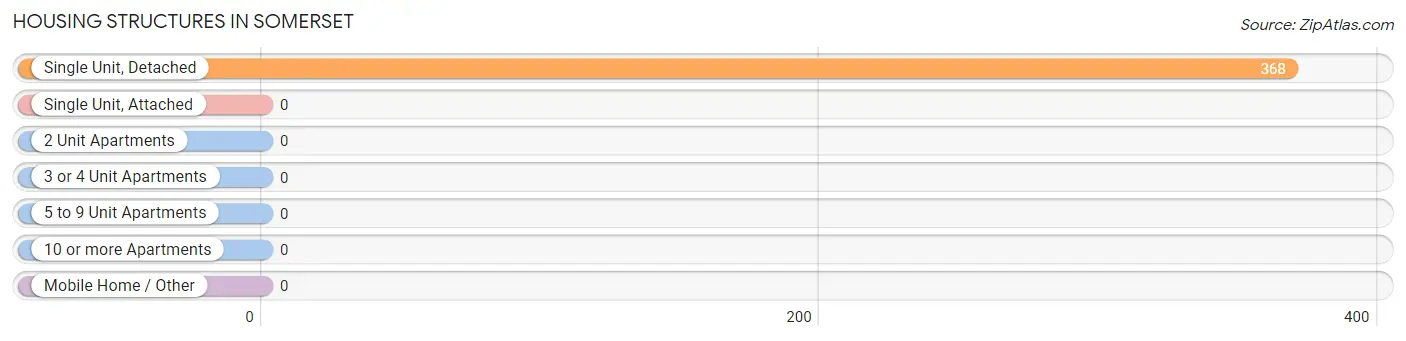
| Structure Type | # Housing Units | % Housing Units |
| Single Unit, Detached | 368 | 100.0% |
| Single Unit, Attached | 0 | 0.0% |
| 2 Unit Apartments | 0 | 0.0% |
| 3 or 4 Unit Apartments | 0 | 0.0% |
| 5 to 9 Unit Apartments | 0 | 0.0% |
| 10 or more Apartments | 0 | 0.0% |
| Mobile Home / Other | 0 | 0.0% |
| Total | 368 | 100.0% |
Housing Structures by Occupancy in Somerset
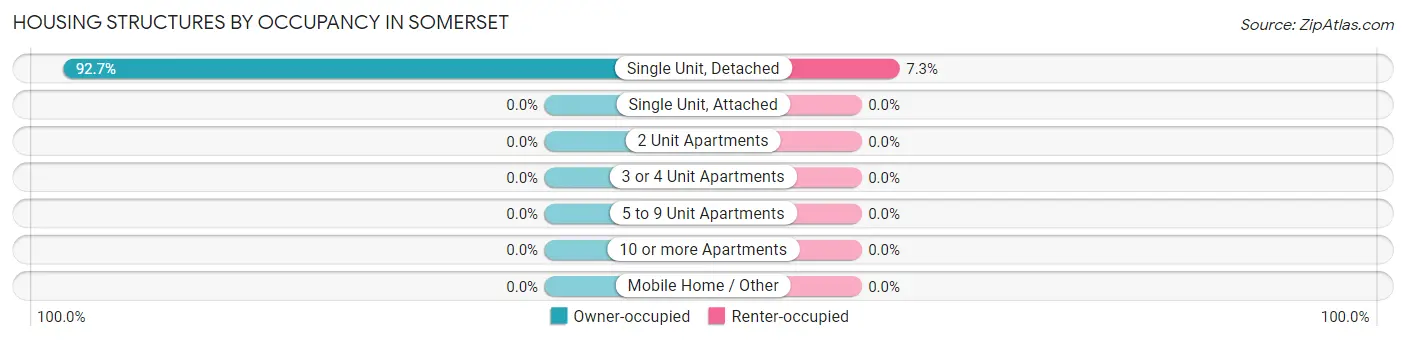
| Structure Type | Owner-occupied | Renter-occupied |
| Single Unit, Detached | 341 (92.7%) | 27 (7.3%) |
| Single Unit, Attached | 0 (0.0%) | 0 (0.0%) |
| 2 Unit Apartments | 0 (0.0%) | 0 (0.0%) |
| 3 or 4 Unit Apartments | 0 (0.0%) | 0 (0.0%) |
| 5 to 9 Unit Apartments | 0 (0.0%) | 0 (0.0%) |
| 10 or more Apartments | 0 (0.0%) | 0 (0.0%) |
| Mobile Home / Other | 0 (0.0%) | 0 (0.0%) |
| Total | 341 (92.7%) | 27 (7.3%) |
Housing Structures by Number of Rooms in Somerset
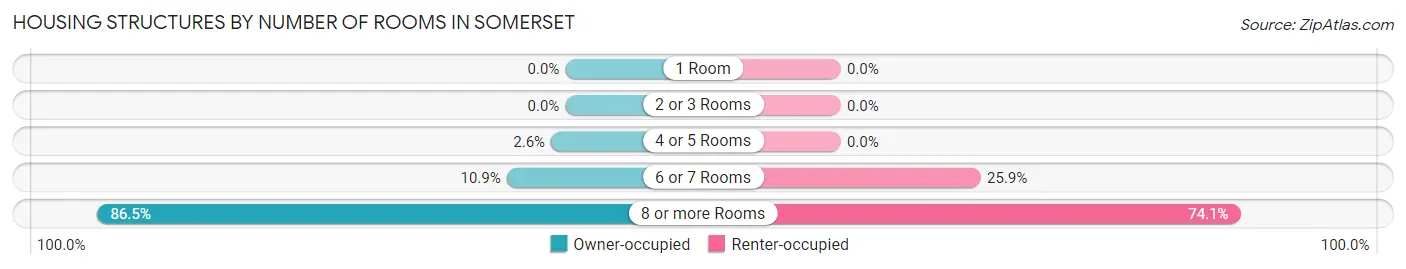
| Number of Rooms | Owner-occupied | Renter-occupied |
| 1 Room | 0 (0.0%) | 0 (0.0%) |
| 2 or 3 Rooms | 0 (0.0%) | 0 (0.0%) |
| 4 or 5 Rooms | 9 (2.6%) | 0 (0.0%) |
| 6 or 7 Rooms | 37 (10.8%) | 7 (25.9%) |
| 8 or more Rooms | 295 (86.5%) | 20 (74.1%) |
| Total | 341 (100.0%) | 27 (100.0%) |
Housing Structure by Heating Type in Somerset
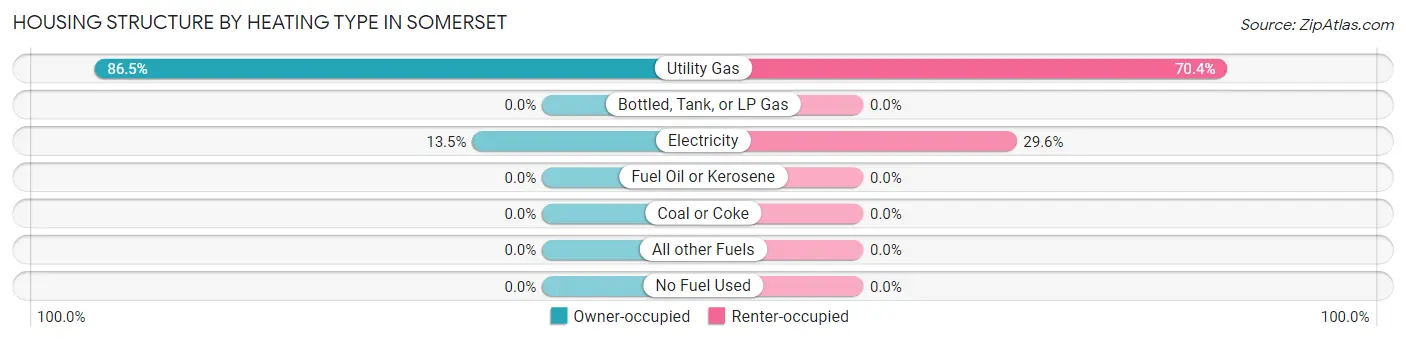
| Heating Type | Owner-occupied | Renter-occupied |
| Utility Gas | 295 (86.5%) | 19 (70.4%) |
| Bottled, Tank, or LP Gas | 0 (0.0%) | 0 (0.0%) |
| Electricity | 46 (13.5%) | 8 (29.6%) |
| Fuel Oil or Kerosene | 0 (0.0%) | 0 (0.0%) |
| Coal or Coke | 0 (0.0%) | 0 (0.0%) |
| All other Fuels | 0 (0.0%) | 0 (0.0%) |
| No Fuel Used | 0 (0.0%) | 0 (0.0%) |
| Total | 341 (100.0%) | 27 (100.0%) |
Household Vehicle Usage in Somerset
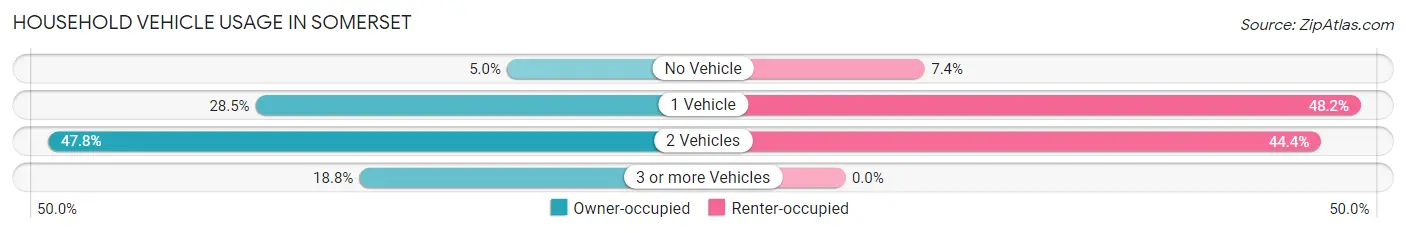
| Vehicles per Household | Owner-occupied | Renter-occupied |
| No Vehicle | 17 (5.0%) | 2 (7.4%) |
| 1 Vehicle | 97 (28.4%) | 13 (48.1%) |
| 2 Vehicles | 163 (47.8%) | 12 (44.4%) |
| 3 or more Vehicles | 64 (18.8%) | 0 (0.0%) |
| Total | 341 (100.0%) | 27 (100.0%) |
Real Estate & Mortgages in Somerset
Real Estate and Mortgage Overview in Somerset
| Characteristic | Without Mortgage | With Mortgage |
| Housing Units | 123 | 218 |
| Median Property Value | $1,423,400 | $1,775,000 |
| Median Household Income | $169,375 | $203 |
| Monthly Housing Costs | $1,501 | $195 |
| Real Estate Taxes | $10,001 | $3 |
Property Value by Mortgage Status in Somerset
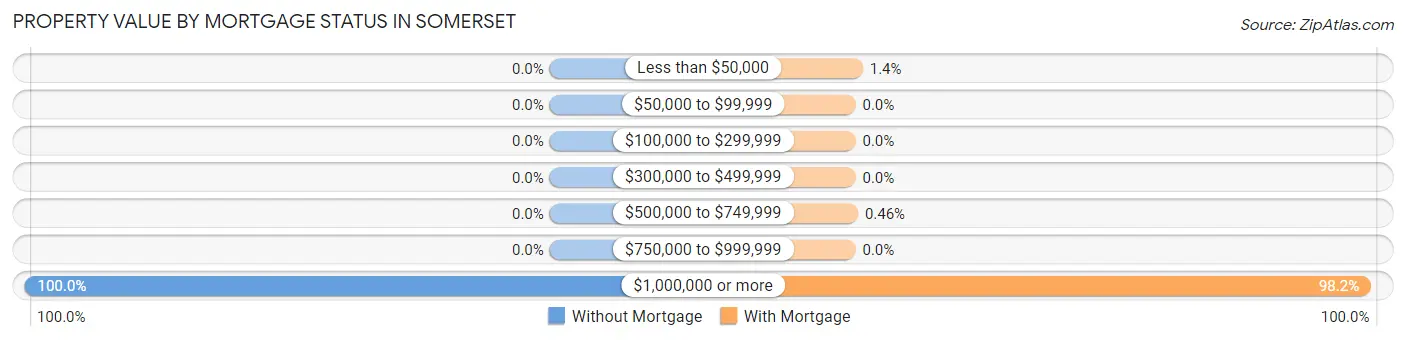
| Property Value | Without Mortgage | With Mortgage |
| Less than $50,000 | 0 (0.0%) | 3 (1.4%) |
| $50,000 to $99,999 | 0 (0.0%) | 0 (0.0%) |
| $100,000 to $299,999 | 0 (0.0%) | 0 (0.0%) |
| $300,000 to $499,999 | 0 (0.0%) | 0 (0.0%) |
| $500,000 to $749,999 | 0 (0.0%) | 1 (0.5%) |
| $750,000 to $999,999 | 0 (0.0%) | 0 (0.0%) |
| $1,000,000 or more | 123 (100.0%) | 214 (98.2%) |
| Total | 123 (100.0%) | 218 (100.0%) |
Household Income by Mortgage Status in Somerset
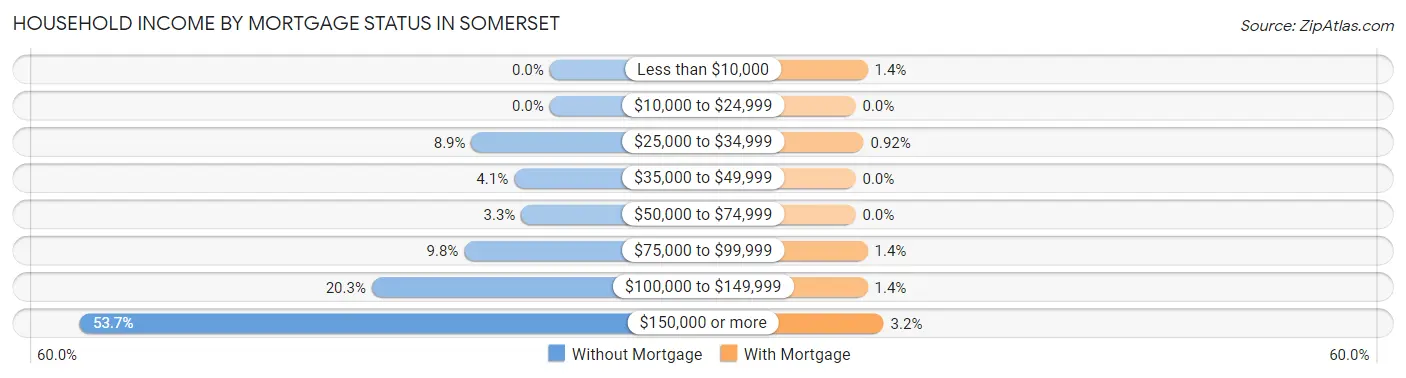
| Household Income | Without Mortgage | With Mortgage |
| Less than $10,000 | 0 (0.0%) | 3 (1.4%) |
| $10,000 to $24,999 | 0 (0.0%) | 0 (0.0%) |
| $25,000 to $34,999 | 11 (8.9%) | 2 (0.9%) |
| $35,000 to $49,999 | 5 (4.1%) | 0 (0.0%) |
| $50,000 to $74,999 | 4 (3.3%) | 0 (0.0%) |
| $75,000 to $99,999 | 12 (9.8%) | 3 (1.4%) |
| $100,000 to $149,999 | 25 (20.3%) | 3 (1.4%) |
| $150,000 or more | 66 (53.7%) | 7 (3.2%) |
| Total | 123 (100.0%) | 218 (100.0%) |
Property Value to Household Income Ratio in Somerset
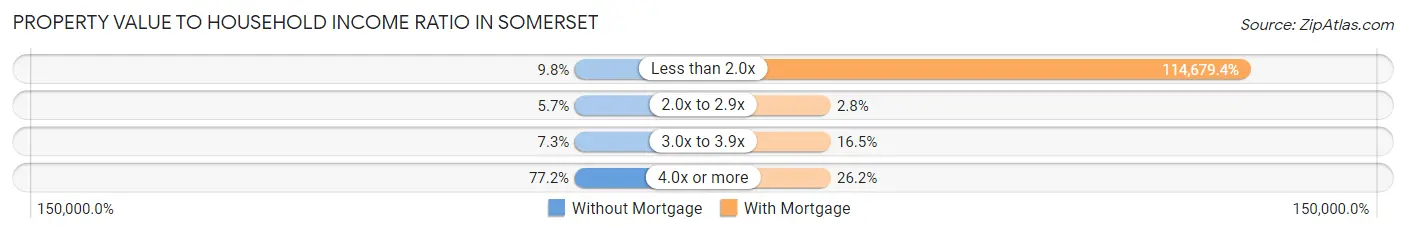
| Value-to-Income Ratio | Without Mortgage | With Mortgage |
| Less than 2.0x | 12 (9.8%) | 250,001 (114,679.4%) |
| 2.0x to 2.9x | 7 (5.7%) | 6 (2.8%) |
| 3.0x to 3.9x | 9 (7.3%) | 36 (16.5%) |
| 4.0x or more | 95 (77.2%) | 57 (26.2%) |
| Total | 123 (100.0%) | 218 (100.0%) |
Real Estate Taxes by Mortgage Status in Somerset
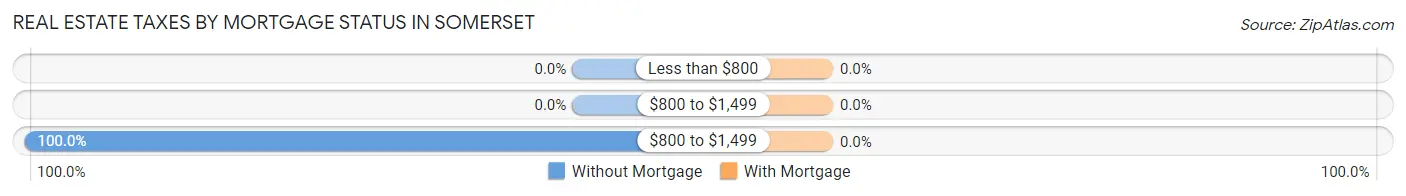
| Property Taxes | Without Mortgage | With Mortgage |
| Less than $800 | 0 (0.0%) | 0 (0.0%) |
| $800 to $1,499 | 0 (0.0%) | 0 (0.0%) |
| $800 to $1,499 | 123 (100.0%) | 0 (0.0%) |
| Total | 123 (100.0%) | 218 (100.0%) |
Health & Disability in Somerset
Health Insurance Coverage by Age in Somerset
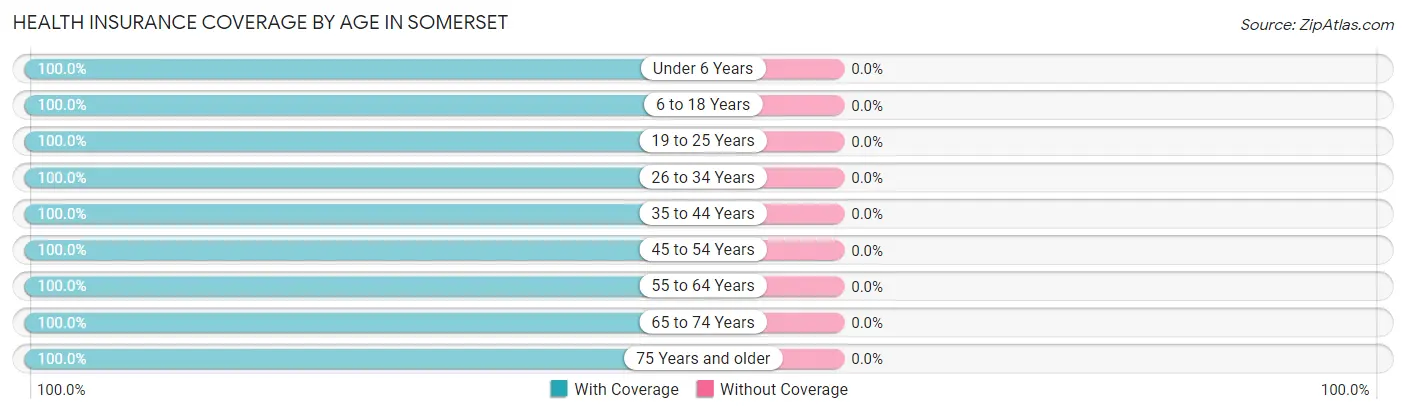
| Age Bracket | With Coverage | Without Coverage |
| Under 6 Years | 39 (100.0%) | 0 (0.0%) |
| 6 to 18 Years | 251 (100.0%) | 0 (0.0%) |
| 19 to 25 Years | 41 (100.0%) | 0 (0.0%) |
| 26 to 34 Years | 18 (100.0%) | 0 (0.0%) |
| 35 to 44 Years | 68 (100.0%) | 0 (0.0%) |
| 45 to 54 Years | 205 (100.0%) | 0 (0.0%) |
| 55 to 64 Years | 183 (100.0%) | 0 (0.0%) |
| 65 to 74 Years | 126 (100.0%) | 0 (0.0%) |
| 75 Years and older | 97 (100.0%) | 0 (0.0%) |
| Total | 1,028 (100.0%) | 0 (0.0%) |
Health Insurance Coverage by Citizenship Status in Somerset
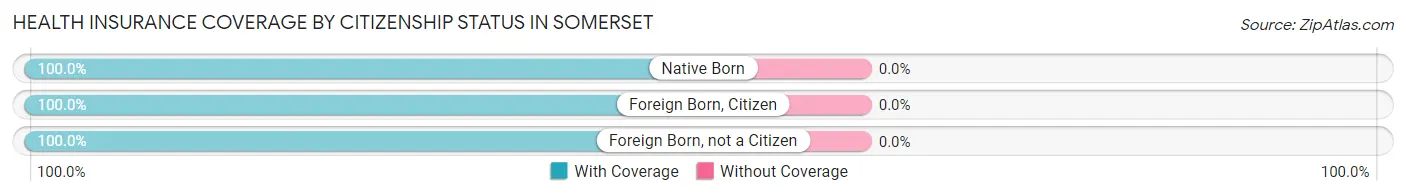
| Citizenship Status | With Coverage | Without Coverage |
| Native Born | 39 (100.0%) | 0 (0.0%) |
| Foreign Born, Citizen | 251 (100.0%) | 0 (0.0%) |
| Foreign Born, not a Citizen | 41 (100.0%) | 0 (0.0%) |
Health Insurance Coverage by Household Income in Somerset
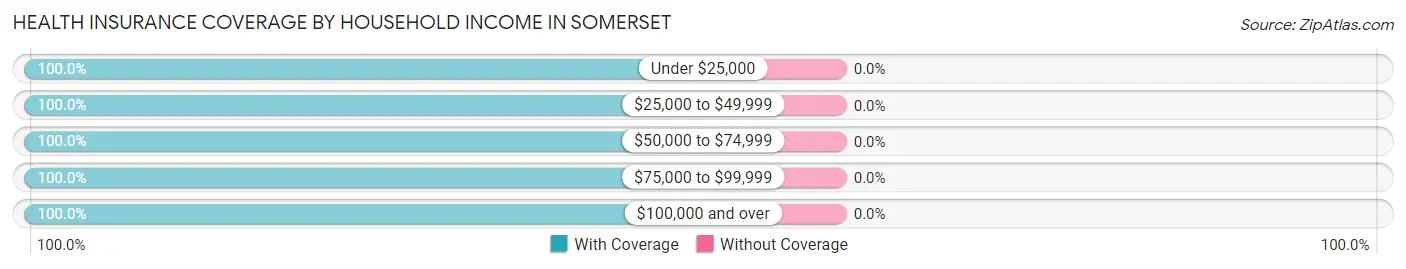
| Household Income | With Coverage | Without Coverage |
| Under $25,000 | 8 (100.0%) | 0 (0.0%) |
| $25,000 to $49,999 | 16 (100.0%) | 0 (0.0%) |
| $50,000 to $74,999 | 14 (100.0%) | 0 (0.0%) |
| $75,000 to $99,999 | 34 (100.0%) | 0 (0.0%) |
| $100,000 and over | 956 (100.0%) | 0 (0.0%) |
Public vs Private Health Insurance Coverage by Age in Somerset
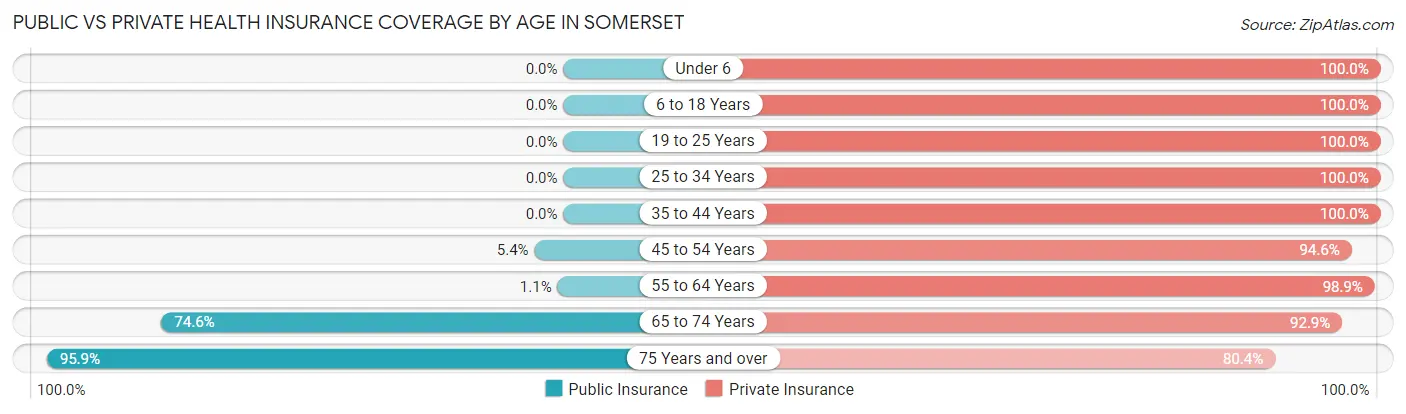
| Age Bracket | Public Insurance | Private Insurance |
| Under 6 | 0 (0.0%) | 39 (100.0%) |
| 6 to 18 Years | 0 (0.0%) | 251 (100.0%) |
| 19 to 25 Years | 0 (0.0%) | 41 (100.0%) |
| 25 to 34 Years | 0 (0.0%) | 18 (100.0%) |
| 35 to 44 Years | 0 (0.0%) | 68 (100.0%) |
| 45 to 54 Years | 11 (5.4%) | 194 (94.6%) |
| 55 to 64 Years | 2 (1.1%) | 181 (98.9%) |
| 65 to 74 Years | 94 (74.6%) | 117 (92.9%) |
| 75 Years and over | 93 (95.9%) | 78 (80.4%) |
| Total | 200 (19.5%) | 987 (96.0%) |
Disability Status by Sex by Age in Somerset
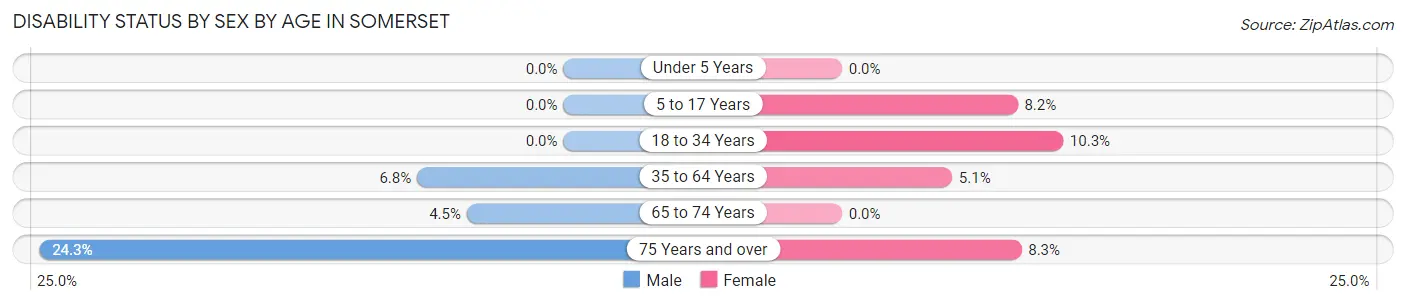
| Age Bracket | Male | Female |
| Under 5 Years | 0 (0.0%) | 0 (0.0%) |
| 5 to 17 Years | 0 (0.0%) | 11 (8.2%) |
| 18 to 34 Years | 0 (0.0%) | 4 (10.3%) |
| 35 to 64 Years | 15 (6.8%) | 12 (5.1%) |
| 65 to 74 Years | 3 (4.5%) | 0 (0.0%) |
| 75 Years and over | 9 (24.3%) | 5 (8.3%) |
Disability Class by Sex by Age in Somerset
Disability Class: Hearing Difficulty
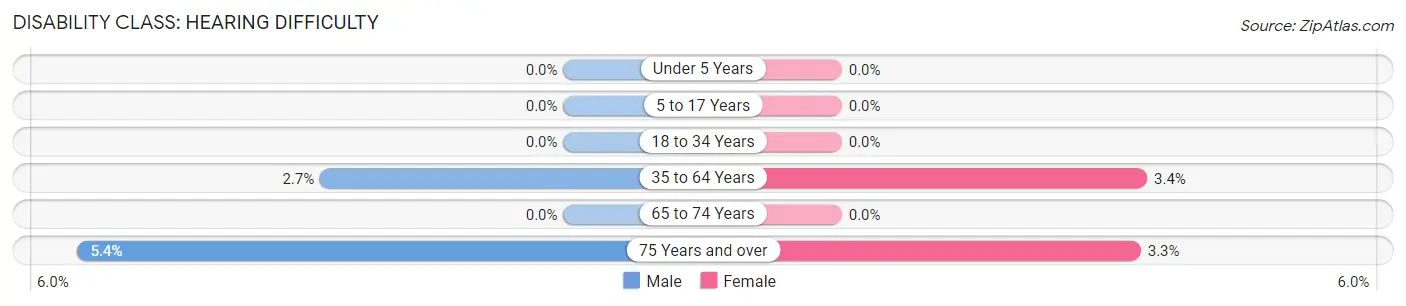
| Age Bracket | Male | Female |
| Under 5 Years | 0 (0.0%) | 0 (0.0%) |
| 5 to 17 Years | 0 (0.0%) | 0 (0.0%) |
| 18 to 34 Years | 0 (0.0%) | 0 (0.0%) |
| 35 to 64 Years | 6 (2.7%) | 8 (3.4%) |
| 65 to 74 Years | 0 (0.0%) | 0 (0.0%) |
| 75 Years and over | 2 (5.4%) | 2 (3.3%) |
Disability Class: Vision Difficulty
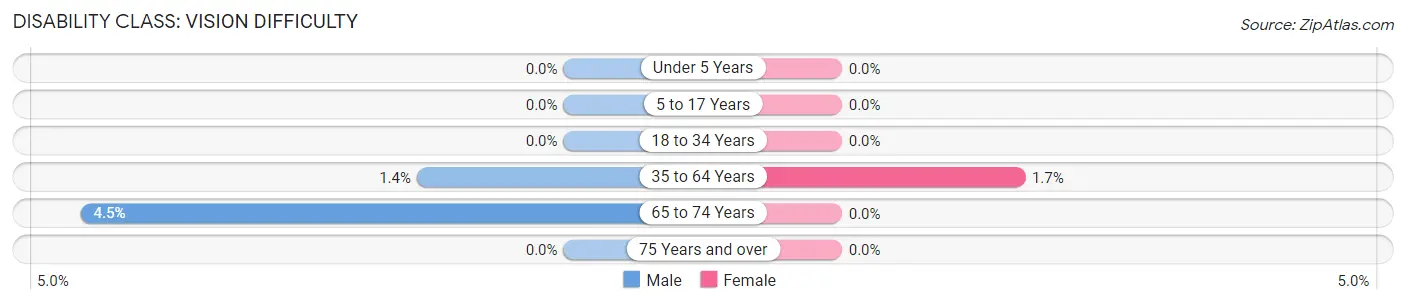
| Age Bracket | Male | Female |
| Under 5 Years | 0 (0.0%) | 0 (0.0%) |
| 5 to 17 Years | 0 (0.0%) | 0 (0.0%) |
| 18 to 34 Years | 0 (0.0%) | 0 (0.0%) |
| 35 to 64 Years | 3 (1.4%) | 4 (1.7%) |
| 65 to 74 Years | 3 (4.5%) | 0 (0.0%) |
| 75 Years and over | 0 (0.0%) | 0 (0.0%) |
Disability Class: Cognitive Difficulty
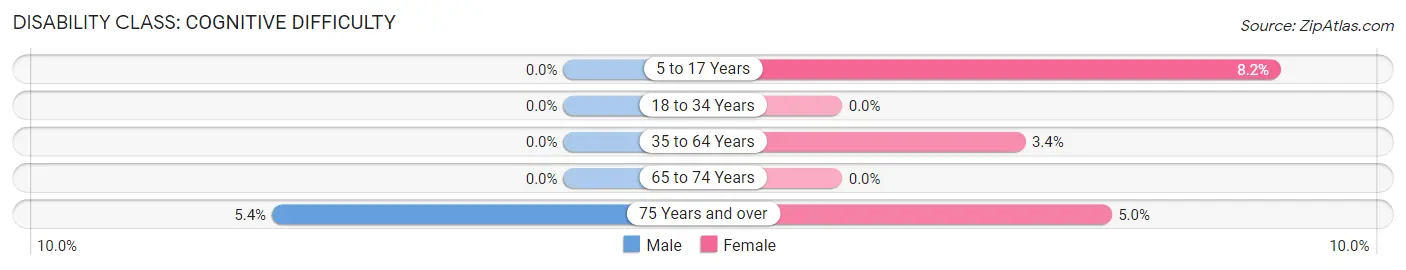
| Age Bracket | Male | Female |
| 5 to 17 Years | 0 (0.0%) | 11 (8.2%) |
| 18 to 34 Years | 0 (0.0%) | 0 (0.0%) |
| 35 to 64 Years | 0 (0.0%) | 8 (3.4%) |
| 65 to 74 Years | 0 (0.0%) | 0 (0.0%) |
| 75 Years and over | 2 (5.4%) | 3 (5.0%) |
Disability Class: Ambulatory Difficulty
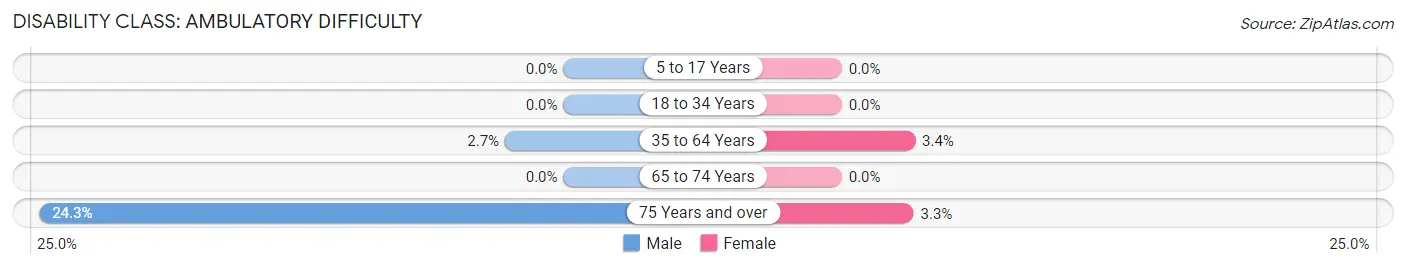
| Age Bracket | Male | Female |
| 5 to 17 Years | 0 (0.0%) | 0 (0.0%) |
| 18 to 34 Years | 0 (0.0%) | 0 (0.0%) |
| 35 to 64 Years | 6 (2.7%) | 8 (3.4%) |
| 65 to 74 Years | 0 (0.0%) | 0 (0.0%) |
| 75 Years and over | 9 (24.3%) | 2 (3.3%) |
Disability Class: Self-Care Difficulty
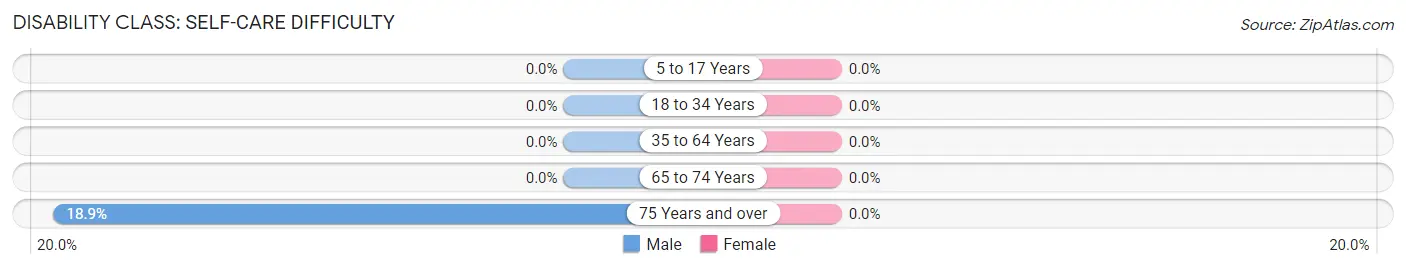
| Age Bracket | Male | Female |
| 5 to 17 Years | 0 (0.0%) | 0 (0.0%) |
| 18 to 34 Years | 0 (0.0%) | 0 (0.0%) |
| 35 to 64 Years | 0 (0.0%) | 0 (0.0%) |
| 65 to 74 Years | 0 (0.0%) | 0 (0.0%) |
| 75 Years and over | 7 (18.9%) | 0 (0.0%) |
Technology Access in Somerset
Computing Device Access in Somerset
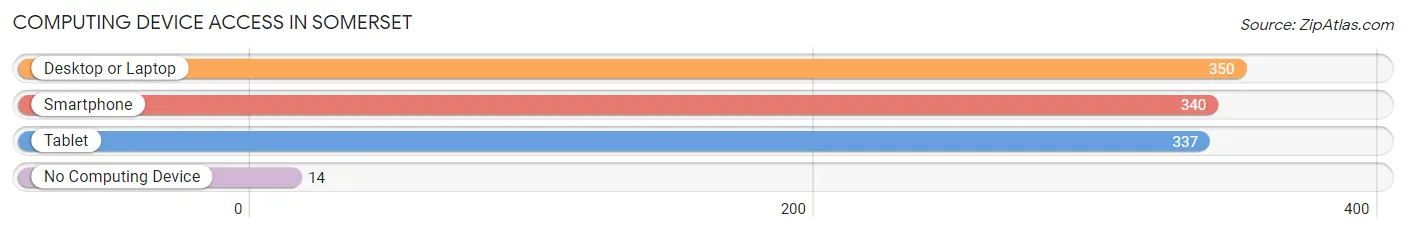
| Device Type | # Households | % Households |
| Desktop or Laptop | 350 | 95.1% |
| Smartphone | 340 | 92.4% |
| Tablet | 337 | 91.6% |
| No Computing Device | 14 | 3.8% |
| Total | 368 | 100.0% |
Internet Access in Somerset
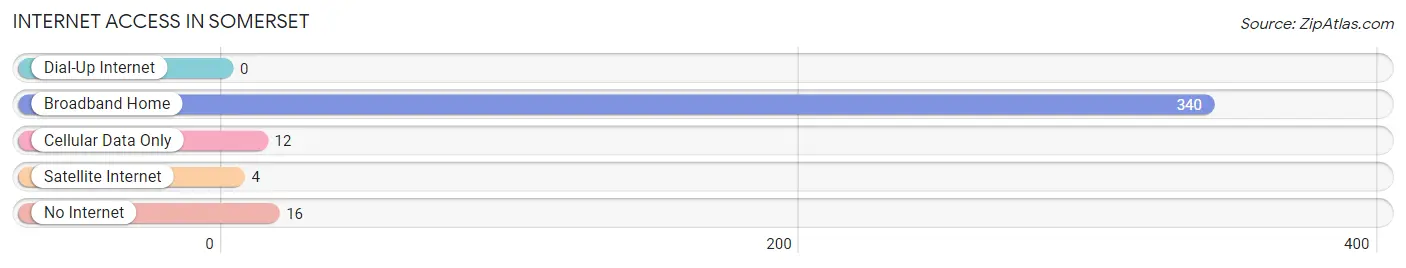
| Internet Type | # Households | % Households |
| Dial-Up Internet | 0 | 0.0% |
| Broadband Home | 340 | 92.4% |
| Cellular Data Only | 12 | 3.3% |
| Satellite Internet | 4 | 1.1% |
| No Internet | 16 | 4.3% |
| Total | 368 | 100.0% |
Somerset Summary
Somerset is a small town located in Maryland, United States. It is situated in the western part of the state, in the county of Somerset. The town has a population of approximately 2,000 people and is located on the banks of the Nanticoke River.
History
Somerset was first settled in the early 1700s by English settlers. The town was originally known as “Somerset Town” and was part of the Somerset County. The town was named after the English county of Somerset. In 1790, the town was incorporated as a town and was renamed “Somerset”.
In the early 1800s, the town was a major port for the shipping of tobacco and other goods. The town was also a major center for the production of lumber and other wood products. In the late 1800s, the town was a major center for the production of oysters.
In the early 1900s, the town was a major center for the production of seafood. The town was also a major center for the production of poultry and eggs. In the mid-1900s, the town was a major center for the production of dairy products.
Geography
Somerset is located in the western part of Maryland, in the county of Somerset. The town is situated on the banks of the Nanticoke River. The town is surrounded by the towns of Princess Anne, Crisfield, and Salisbury. The town is located approximately 30 miles from the Atlantic Ocean.
The town has a total area of 1.2 square miles, all of which is land. The town has a humid subtropical climate, with hot and humid summers and mild winters. The town receives an average of 44 inches of precipitation per year.
Economy
The economy of Somerset is largely based on agriculture and tourism. The town is home to several farms, which produce a variety of crops, including corn, soybeans, wheat, and hay. The town is also home to several seafood processing plants, which process and package seafood for sale.
The town is also home to several tourist attractions, including the Nanticoke River Museum, the Somerset County Historical Society, and the Somerset County Fair. The town is also home to several restaurants, bars, and shops.
Demographics
As of the 2010 census, the population of Somerset was 2,000. The town has a population density of 1,636 people per square mile. The median age of the population is 43.7 years. The median household income is $37,500. The town has a poverty rate of 16.7%.
The town is predominantly white, with a population that is 97.2% white. The town also has a small African American population, which makes up 1.2% of the population. The town also has a small Hispanic population, which makes up 1.6% of the population.
Conclusion
Somerset is a small town located in Maryland, United States. It is situated in the western part of the state, in the county of Somerset. The town has a population of approximately 2,000 people and is located on the banks of the Nanticoke River. The town has a long history, with a strong agricultural and tourism-based economy. The town is predominantly white, with a population that is 97.2% white. The town also has a small African American population, which makes up 1.2% of the population. The town also has a small Hispanic population, which makes up 1.6% of the population.
Common Questions
What is Per Capita Income in Somerset?
Per Capita income in Somerset is $154,723.
What is the Median Family Income in Somerset?
Median Family Income in Somerset is $250,001.
What is the Median Household income in Somerset?
Median Household Income in Somerset is $250,001.
What is Income or Wage Gap in Somerset?
Income or Wage Gap in Somerset is 37.9%.
Women in Somerset earn 62.1 cents for every dollar earned by a man.
What is Inequality or Gini Index in Somerset?
Inequality or Gini Index in Somerset is 0.43.
What is the Total Population of Somerset?
Total Population of Somerset is 1,028.
What is the Total Male Population of Somerset?
Total Male Population of Somerset is 482.
What is the Total Female Population of Somerset?
Total Female Population of Somerset is 546.
What is the Ratio of Males per 100 Females in Somerset?
There are 88.28 Males per 100 Females in Somerset.
What is the Ratio of Females per 100 Males in Somerset?
There are 113.28 Females per 100 Males in Somerset.
What is the Median Population Age in Somerset?
Median Population Age in Somerset is 49.6 Years.
What is the Average Family Size in Somerset
Average Family Size in Somerset is 3.2 People.
What is the Average Household Size in Somerset
Average Household Size in Somerset is 2.8 People.
How Large is the Labor Force in Somerset?
There are 508 People in the Labor Forcein in Somerset.
What is the Percentage of People in the Labor Force in Somerset?
64.9% of People are in the Labor Force in Somerset.
What is the Unemployment Rate in Somerset?
Unemployment Rate in Somerset is 0.6%.