Melwood, MD Map & Demographics
Melwood Map
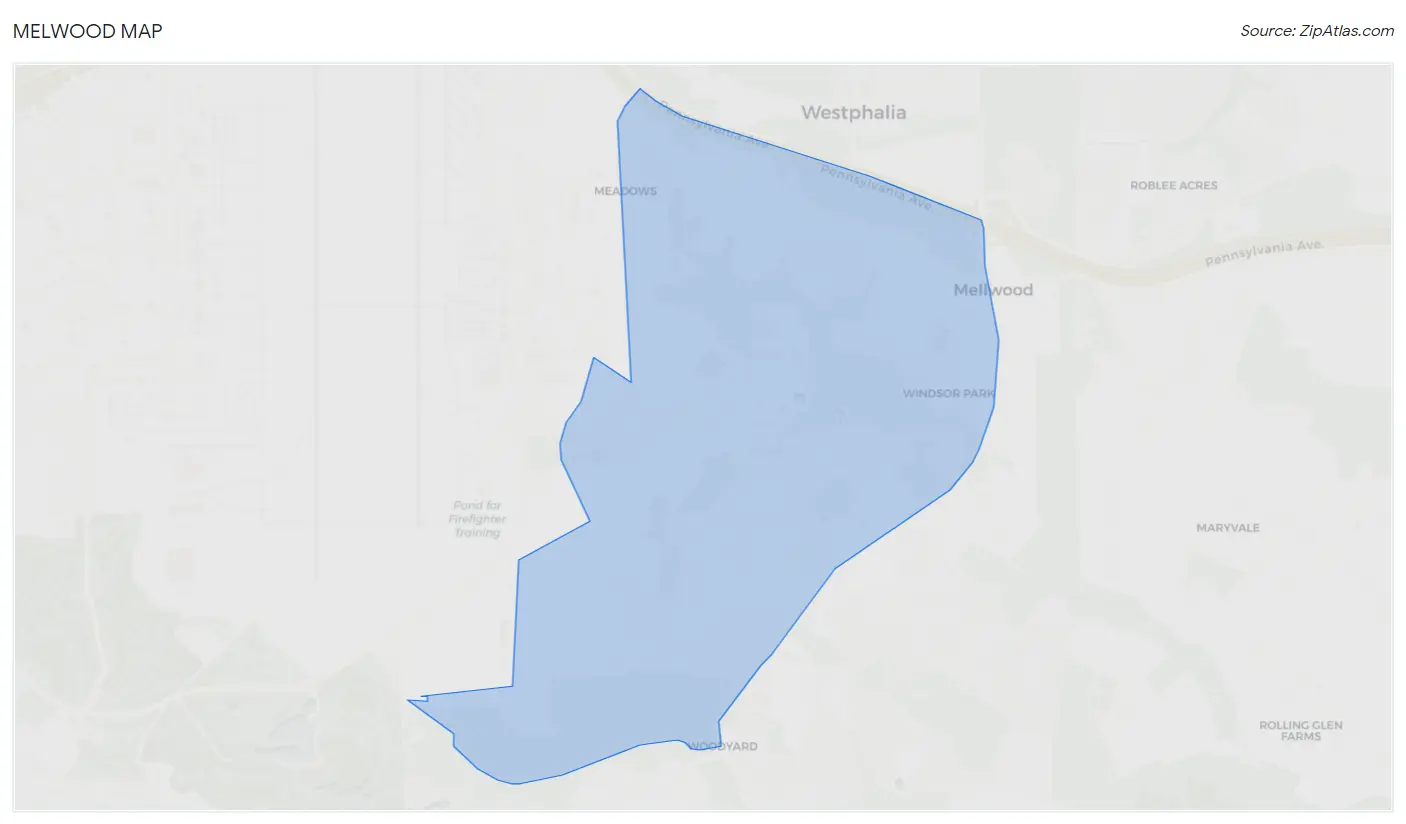
Melwood Overview
$47,798
PER CAPITA INCOME
$131,544
AVG FAMILY INCOME
$76,625
AVG HOUSEHOLD INCOME
8.5%
WAGE / INCOME GAP [ % ]
91.5¢/ $1
WAGE / INCOME GAP [ $ ]
0.48
INEQUALITY / GINI INDEX
3,438
TOTAL POPULATION
1,454
MALE POPULATION
1,984
FEMALE POPULATION
73.29
MALES / 100 FEMALES
136.45
FEMALES / 100 MALES
46.0
MEDIAN AGE
3.1
AVG FAMILY SIZE
2.2
AVG HOUSEHOLD SIZE
1,594
LABOR FORCE [ PEOPLE ]
54.5%
PERCENT IN LABOR FORCE
5.2%
UNEMPLOYMENT RATE
Income in Melwood
Income Overview in Melwood
Per Capita Income in Melwood is $47,798, while median incomes of families and households are $131,544 and $76,625 respectively.
| Characteristic | Number | Measure |
| Per Capita Income | 3,438 | $47,798 |
| Median Family Income | 815 | $131,544 |
| Mean Family Income | 815 | $146,669 |
| Median Household Income | 1,557 | $76,625 |
| Mean Household Income | 1,557 | $103,759 |
| Income Deficit | 815 | $0 |
| Wage / Income Gap (%) | 3,438 | 8.45% |
| Wage / Income Gap ($) | 3,438 | 91.55¢ per $1 |
| Gini / Inequality Index | 3,438 | 0.48 |
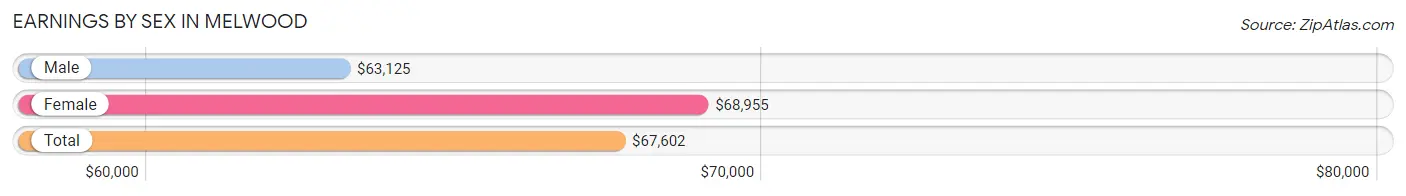
Earnings by Sex in Melwood
Average Earnings in Melwood are $67,602, $63,125 for men and $68,955 for women, a difference of 8.5%.
| Sex | Number | Average Earnings |
| Male | 738 (47.2%) | $63,125 |
| Female | 825 (52.8%) | $68,955 |
| Total | 1,563 (100.0%) | $67,602 |
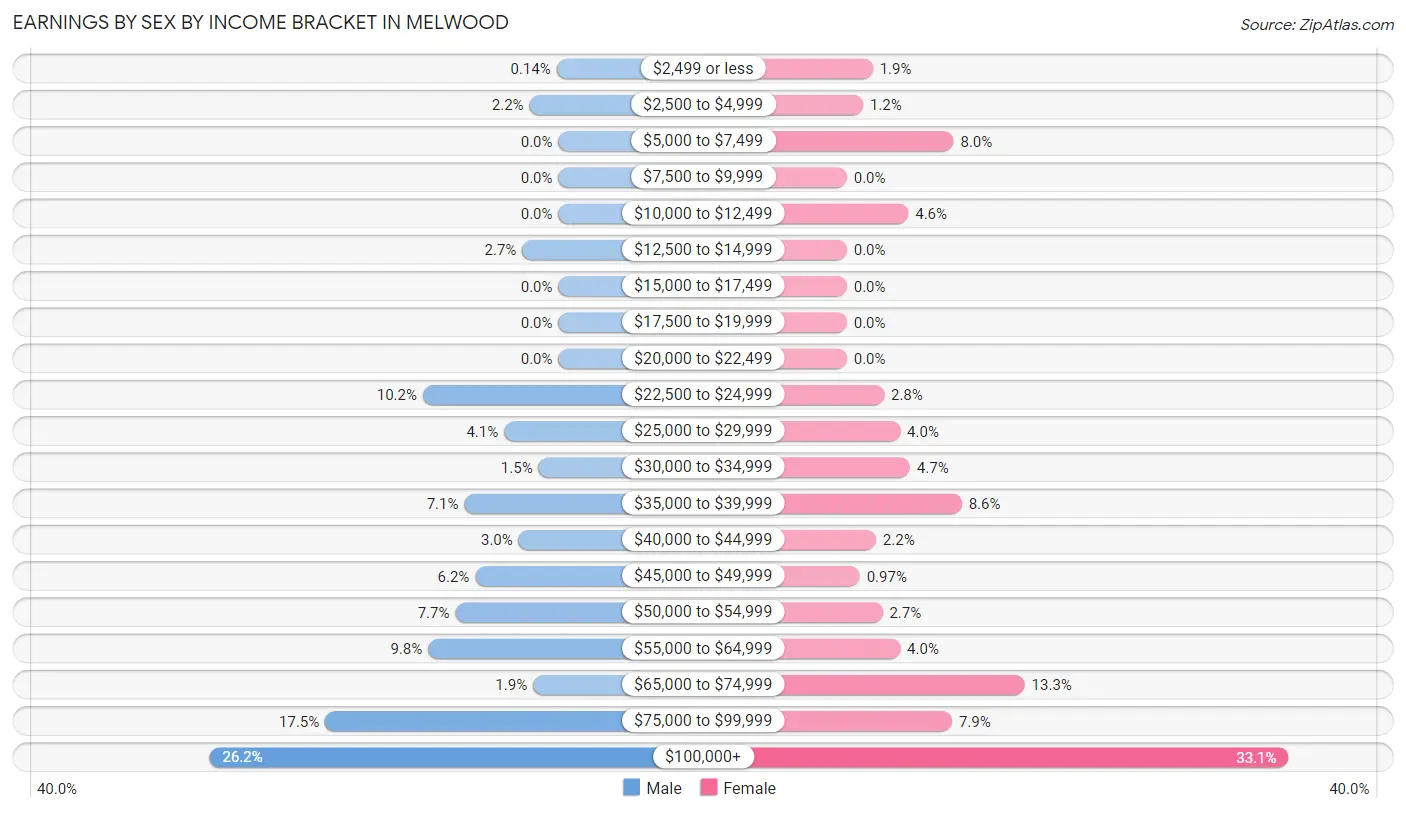
Earnings by Sex by Income Bracket in Melwood
The most common earnings brackets in Melwood are $100,000+ for men (193 | 26.2%) and $100,000+ for women (273 | 33.1%).
| Income | Male | Female |
| $2,499 or less | 1 (0.1%) | 16 (1.9%) |
| $2,500 to $4,999 | 16 (2.2%) | 10 (1.2%) |
| $5,000 to $7,499 | 0 (0.0%) | 66 (8.0%) |
| $7,500 to $9,999 | 0 (0.0%) | 0 (0.0%) |
| $10,000 to $12,499 | 0 (0.0%) | 38 (4.6%) |
| $12,500 to $14,999 | 20 (2.7%) | 0 (0.0%) |
| $15,000 to $17,499 | 0 (0.0%) | 0 (0.0%) |
| $17,500 to $19,999 | 0 (0.0%) | 0 (0.0%) |
| $20,000 to $22,499 | 0 (0.0%) | 0 (0.0%) |
| $22,500 to $24,999 | 75 (10.2%) | 23 (2.8%) |
| $25,000 to $29,999 | 30 (4.1%) | 33 (4.0%) |
| $30,000 to $34,999 | 11 (1.5%) | 39 (4.7%) |
| $35,000 to $39,999 | 52 (7.0%) | 71 (8.6%) |
| $40,000 to $44,999 | 22 (3.0%) | 18 (2.2%) |
| $45,000 to $49,999 | 46 (6.2%) | 8 (1.0%) |
| $50,000 to $54,999 | 57 (7.7%) | 22 (2.7%) |
| $55,000 to $64,999 | 72 (9.8%) | 33 (4.0%) |
| $65,000 to $74,999 | 14 (1.9%) | 110 (13.3%) |
| $75,000 to $99,999 | 129 (17.5%) | 65 (7.9%) |
| $100,000+ | 193 (26.2%) | 273 (33.1%) |
| Total | 738 (100.0%) | 825 (100.0%) |
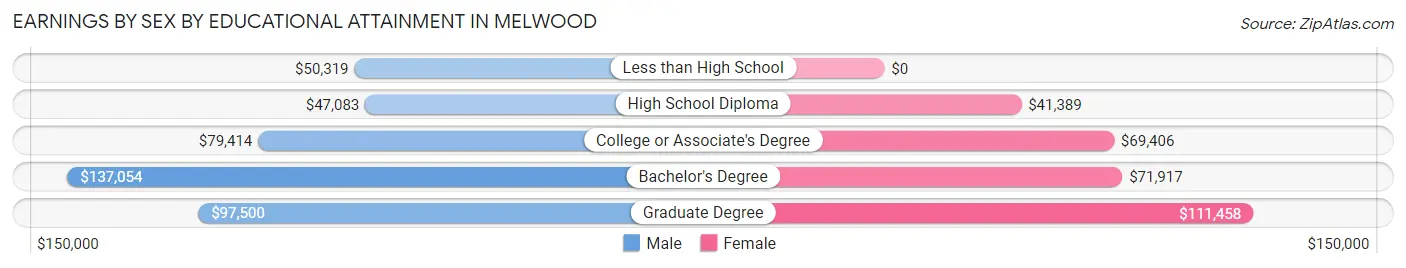
Earnings by Sex by Educational Attainment in Melwood
Average earnings in Melwood are $70,357 for men and $69,918 for women, a difference of 0.6%. Men with an educational attainment of bachelor's degree enjoy the highest average annual earnings of $137,054, while those with high school diploma education earn the least with $47,083. Women with an educational attainment of graduate degree earn the most with the average annual earnings of $111,458, while those with high school diploma education have the smallest earnings of $41,389.
| Educational Attainment | Male Income | Female Income |
| Less than High School | $50,319 | $0 |
| High School Diploma | $47,083 | $41,389 |
| College or Associate's Degree | $79,414 | $69,406 |
| Bachelor's Degree | $137,054 | $71,917 |
| Graduate Degree | $97,500 | $111,458 |
| Total | $70,357 | $69,918 |
Family Income in Melwood
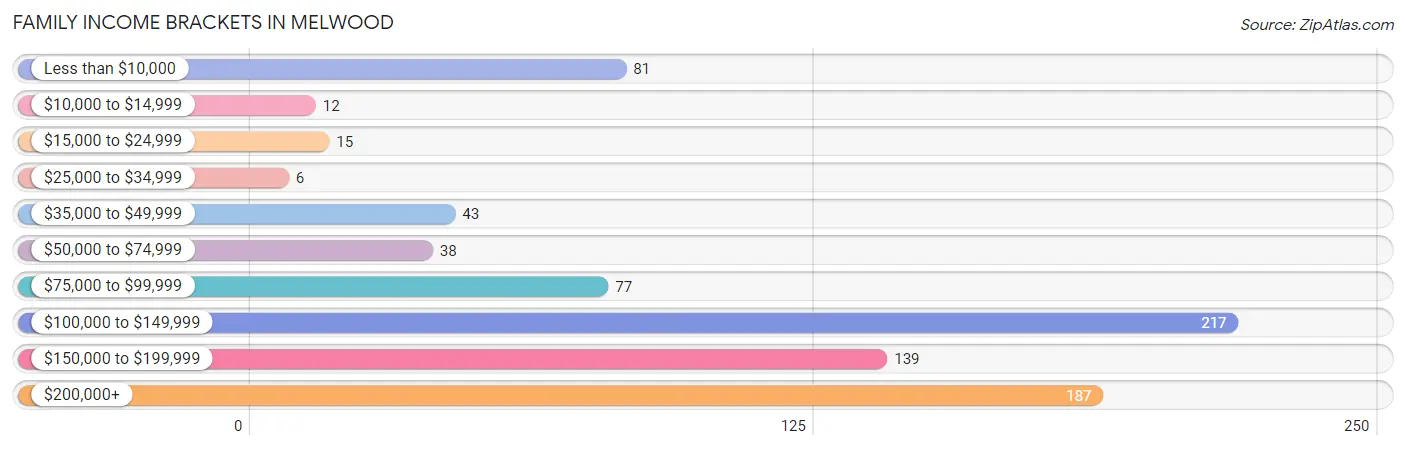
Family Income Brackets in Melwood
According to the Melwood family income data, there are 217 families falling into the $100,000 to $149,999 income range, which is the most common income bracket and makes up 26.6% of all families. Conversely, the $25,000 to $34,999 income bracket is the least frequent group with only 6 families (0.7%) belonging to this category.
| Income Bracket | # Families | % Families |
| Less than $10,000 | 81 | 9.9% |
| $10,000 to $14,999 | 12 | 1.5% |
| $15,000 to $24,999 | 15 | 1.8% |
| $25,000 to $34,999 | 6 | 0.7% |
| $35,000 to $49,999 | 43 | 5.3% |
| $50,000 to $74,999 | 38 | 4.7% |
| $75,000 to $99,999 | 77 | 9.4% |
| $100,000 to $149,999 | 217 | 26.6% |
| $150,000 to $199,999 | 139 | 17.1% |
| $200,000+ | 187 | 22.9% |
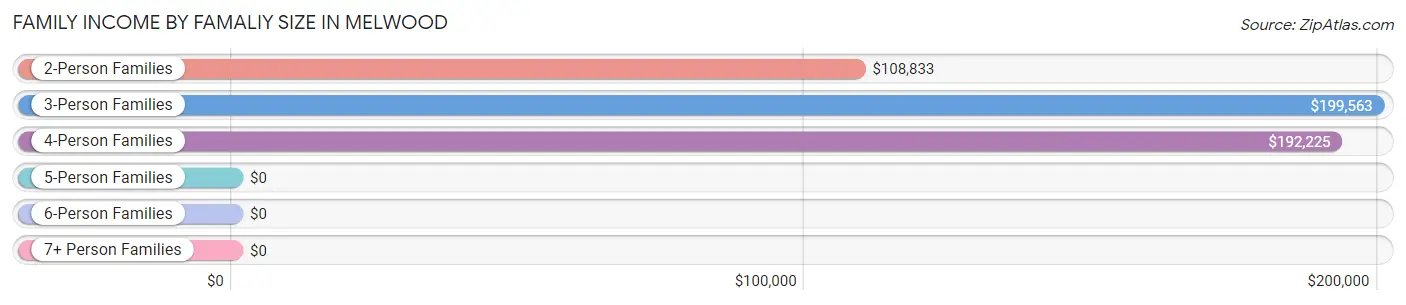
Family Income by Famaliy Size in Melwood
3-person families (155 | 19.0%) account for the highest median family income in Melwood with $199,563 per family, while 3-person families (155 | 19.0%) have the highest median income of $66,521 per family member.
| Income Bracket | # Families | Median Income |
| 2-Person Families | 426 (52.3%) | $108,833 |
| 3-Person Families | 155 (19.0%) | $199,563 |
| 4-Person Families | 133 (16.3%) | $192,225 |
| 5-Person Families | 86 (10.5%) | $0 |
| 6-Person Families | 15 (1.8%) | $0 |
| 7+ Person Families | 0 (0.0%) | $0 |
| Total | 815 (100.0%) | $131,544 |
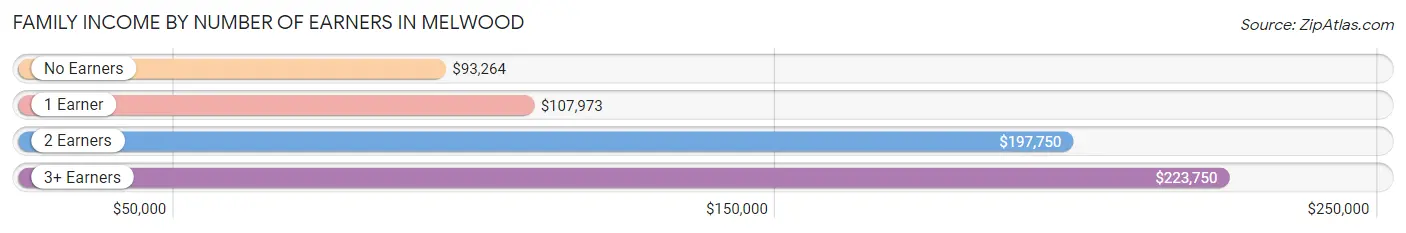
Family Income by Number of Earners in Melwood
The median family income in Melwood is $131,544, with families comprising 3+ earners (144) having the highest median family income of $223,750, while families with no earners (217) have the lowest median family income of $93,264, accounting for 17.7% and 26.6% of families, respectively.
| Number of Earners | # Families | Median Income |
| No Earners | 217 (26.6%) | $93,264 |
| 1 Earner | 210 (25.8%) | $107,973 |
| 2 Earners | 244 (29.9%) | $197,750 |
| 3+ Earners | 144 (17.7%) | $223,750 |
| Total | 815 (100.0%) | $131,544 |
Household Income in Melwood
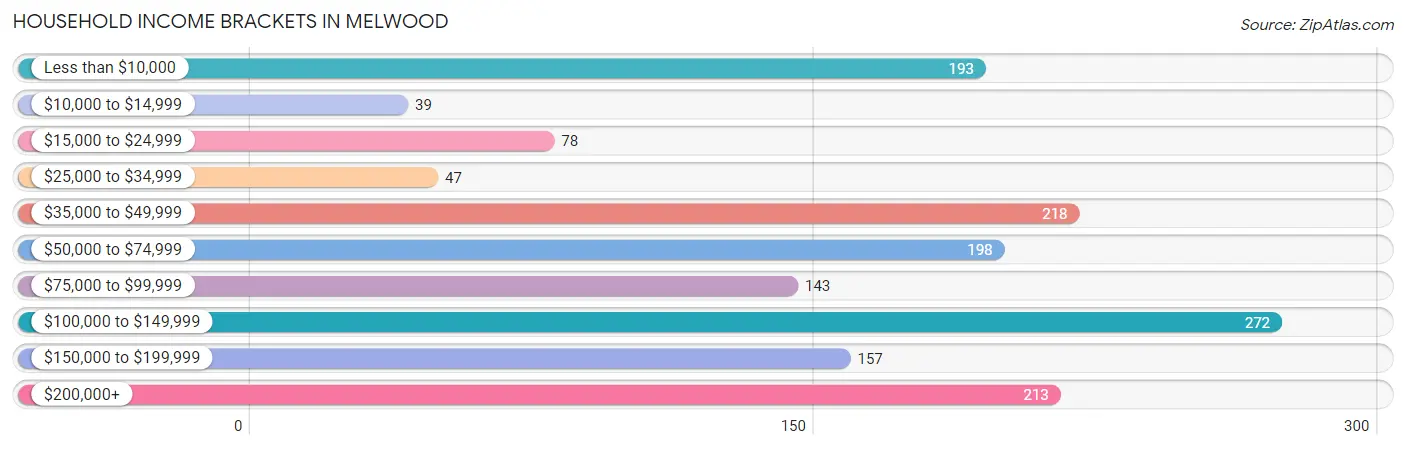
Household Income Brackets in Melwood
With 272 households falling in the category, the $100,000 to $149,999 income range is the most frequent in Melwood, accounting for 17.5% of all households. In contrast, only 39 households (2.5%) fall into the $10,000 to $14,999 income bracket, making it the least populous group.
| Income Bracket | # Households | % Households |
| Less than $10,000 | 193 | 12.4% |
| $10,000 to $14,999 | 39 | 2.5% |
| $15,000 to $24,999 | 78 | 5.0% |
| $25,000 to $34,999 | 47 | 3.0% |
| $35,000 to $49,999 | 218 | 14.0% |
| $50,000 to $74,999 | 198 | 12.7% |
| $75,000 to $99,999 | 143 | 9.2% |
| $100,000 to $149,999 | 272 | 17.5% |
| $150,000 to $199,999 | 157 | 10.1% |
| $200,000+ | 213 | 13.7% |
Household Income by Householder Age in Melwood
The median household income in Melwood is $76,625, with the highest median household income of $130,625 found in the 45 to 64 years age bracket for the primary householder. A total of 511 households (32.8%) fall into this category.
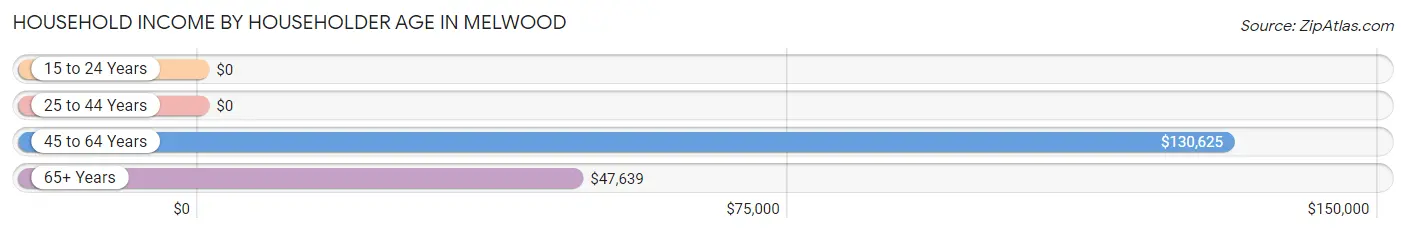
| Income Bracket | # Households | Median Income |
| 15 to 24 Years | 0 (0.0%) | $0 |
| 25 to 44 Years | 349 (22.4%) | $0 |
| 45 to 64 Years | 511 (32.8%) | $130,625 |
| 65+ Years | 697 (44.8%) | $47,639 |
| Total | 1,557 (100.0%) | $76,625 |
Poverty in Melwood
Income Below Poverty by Sex and Age in Melwood
With 9.0% poverty level for males and 16.9% for females among the residents of Melwood, under 5 year old males and 18 to 24 year old females are the most vulnerable to poverty, with 19 males (52.8%) and 97 females (49.7%) in their respective age groups living below the poverty level.
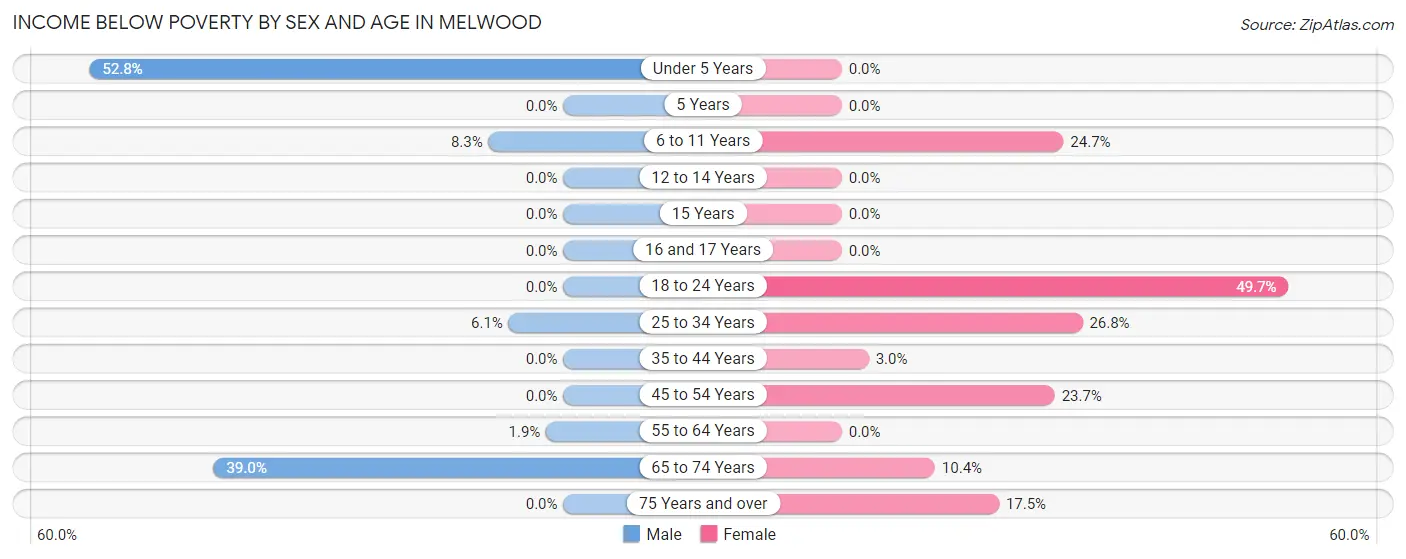
| Age Bracket | Male | Female |
| Under 5 Years | 19 (52.8%) | 0 (0.0%) |
| 5 Years | 0 (0.0%) | 0 (0.0%) |
| 6 to 11 Years | 12 (8.3%) | 19 (24.7%) |
| 12 to 14 Years | 0 (0.0%) | 0 (0.0%) |
| 15 Years | 0 (0.0%) | 0 (0.0%) |
| 16 and 17 Years | 0 (0.0%) | 0 (0.0%) |
| 18 to 24 Years | 0 (0.0%) | 97 (49.7%) |
| 25 to 34 Years | 7 (6.1%) | 67 (26.8%) |
| 35 to 44 Years | 0 (0.0%) | 6 (3.0%) |
| 45 to 54 Years | 0 (0.0%) | 69 (23.7%) |
| 55 to 64 Years | 3 (1.9%) | 0 (0.0%) |
| 65 to 74 Years | 90 (39.0%) | 42 (10.4%) |
| 75 Years and over | 0 (0.0%) | 35 (17.5%) |
| Total | 131 (9.0%) | 335 (16.9%) |
Income Above Poverty by Sex and Age in Melwood
According to the poverty statistics in Melwood, males aged 12 to 14 years and females aged under 5 years are the age groups that are most secure financially, with 100.0% of males and 100.0% of females in these age groups living above the poverty line.
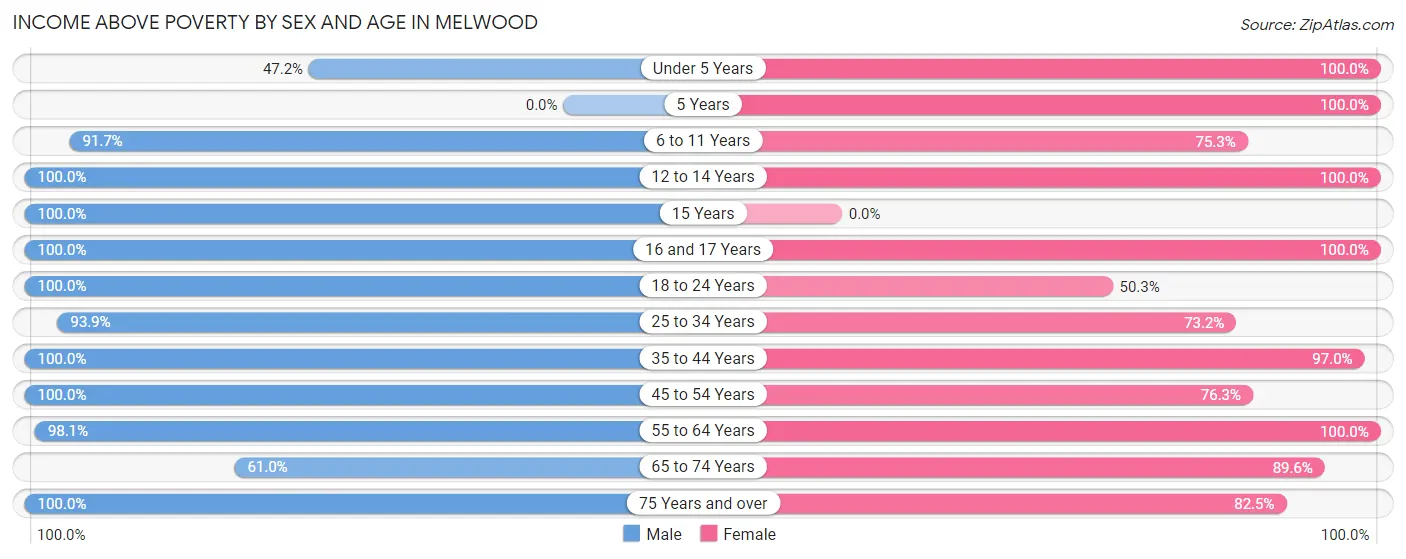
| Age Bracket | Male | Female |
| Under 5 Years | 17 (47.2%) | 115 (100.0%) |
| 5 Years | 0 (0.0%) | 8 (100.0%) |
| 6 to 11 Years | 132 (91.7%) | 58 (75.3%) |
| 12 to 14 Years | 28 (100.0%) | 86 (100.0%) |
| 15 Years | 19 (100.0%) | 0 (0.0%) |
| 16 and 17 Years | 23 (100.0%) | 7 (100.0%) |
| 18 to 24 Years | 99 (100.0%) | 98 (50.3%) |
| 25 to 34 Years | 108 (93.9%) | 183 (73.2%) |
| 35 to 44 Years | 253 (100.0%) | 194 (97.0%) |
| 45 to 54 Years | 207 (100.0%) | 222 (76.3%) |
| 55 to 64 Years | 154 (98.1%) | 150 (100.0%) |
| 65 to 74 Years | 141 (61.0%) | 363 (89.6%) |
| 75 Years and over | 142 (100.0%) | 165 (82.5%) |
| Total | 1,323 (91.0%) | 1,649 (83.1%) |
Income Below Poverty Among Married-Couple Families in Melwood
The poverty statistics for married-couple families in Melwood show that 3.3% or 19 of the total 583 families live below the poverty line. Families with no children have the highest poverty rate of 4.8%, comprising of 19 families. On the other hand, families with 1 or 2 children have the lowest poverty rate of 0.0%, which includes 0 families.
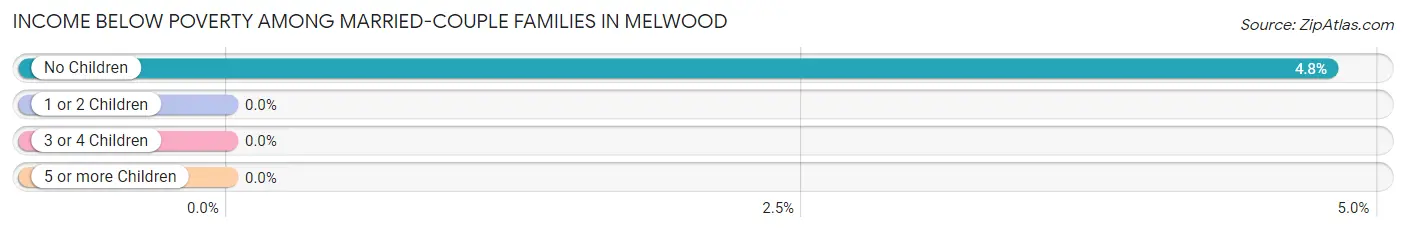
| Children | Above Poverty | Below Poverty |
| No Children | 378 (95.2%) | 19 (4.8%) |
| 1 or 2 Children | 128 (100.0%) | 0 (0.0%) |
| 3 or 4 Children | 58 (100.0%) | 0 (0.0%) |
| 5 or more Children | 0 (0.0%) | 0 (0.0%) |
| Total | 564 (96.7%) | 19 (3.3%) |
Income Below Poverty Among Single-Parent Households in Melwood
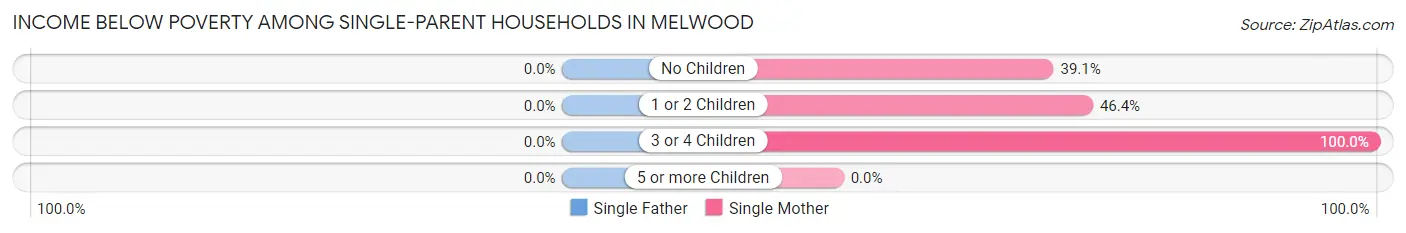
| Children | Single Father | Single Mother |
| No Children | 0 (0.0%) | 61 (39.1%) |
| 1 or 2 Children | 0 (0.0%) | 13 (46.4%) |
| 3 or 4 Children | 0 (0.0%) | 6 (100.0%) |
| 5 or more Children | 0 (0.0%) | 0 (0.0%) |
| Total | 0 (0.0%) | 80 (42.1%) |
Income Below Poverty Among Married-Couple vs Single-Parent Households in Melwood
The poverty data for Melwood shows that 19 of the married-couple family households (3.3%) and 80 of the single-parent households (34.5%) are living below the poverty level. Within the married-couple family households, those with no children have the highest poverty rate, with 19 households (4.8%) falling below the poverty line. Among the single-parent households, those with 3 or 4 children have the highest poverty rate, with 6 household (100.0%) living below poverty.
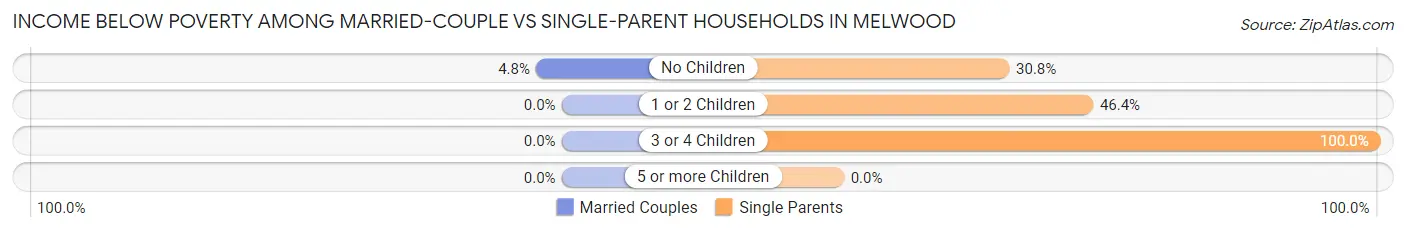
| Children | Married-Couple Families | Single-Parent Households |
| No Children | 19 (4.8%) | 61 (30.8%) |
| 1 or 2 Children | 0 (0.0%) | 13 (46.4%) |
| 3 or 4 Children | 0 (0.0%) | 6 (100.0%) |
| 5 or more Children | 0 (0.0%) | 0 (0.0%) |
| Total | 19 (3.3%) | 80 (34.5%) |
Race in Melwood
The most populous races in Melwood are Black / African American (2,041 | 59.4%), Hispanic or Latino (678 | 19.7%), and White / Caucasian (578 | 16.8%).
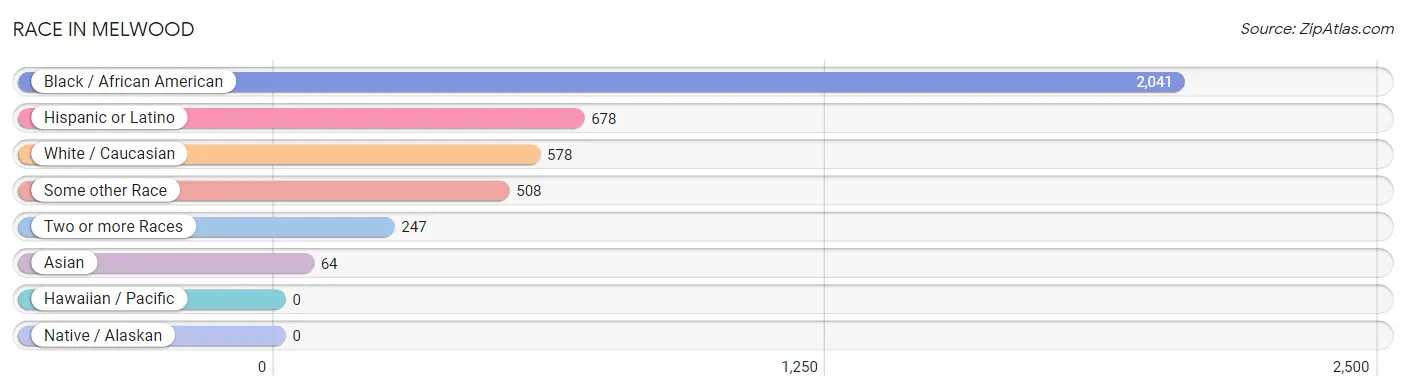
| Race | # Population | % Population |
| Asian | 64 | 1.9% |
| Black / African American | 2,041 | 59.4% |
| Hawaiian / Pacific | 0 | 0.0% |
| Hispanic or Latino | 678 | 19.7% |
| Native / Alaskan | 0 | 0.0% |
| White / Caucasian | 578 | 16.8% |
| Two or more Races | 247 | 7.2% |
| Some other Race | 508 | 14.8% |
| Total | 3,438 | 100.0% |
Ancestry in Melwood
The most populous ancestries reported in Melwood are Subsaharan African (295 | 8.6%), Mexican (288 | 8.4%), American (204 | 5.9%), Central American (170 | 4.9%), and Irish (165 | 4.8%), together accounting for 32.6% of all Melwood residents.
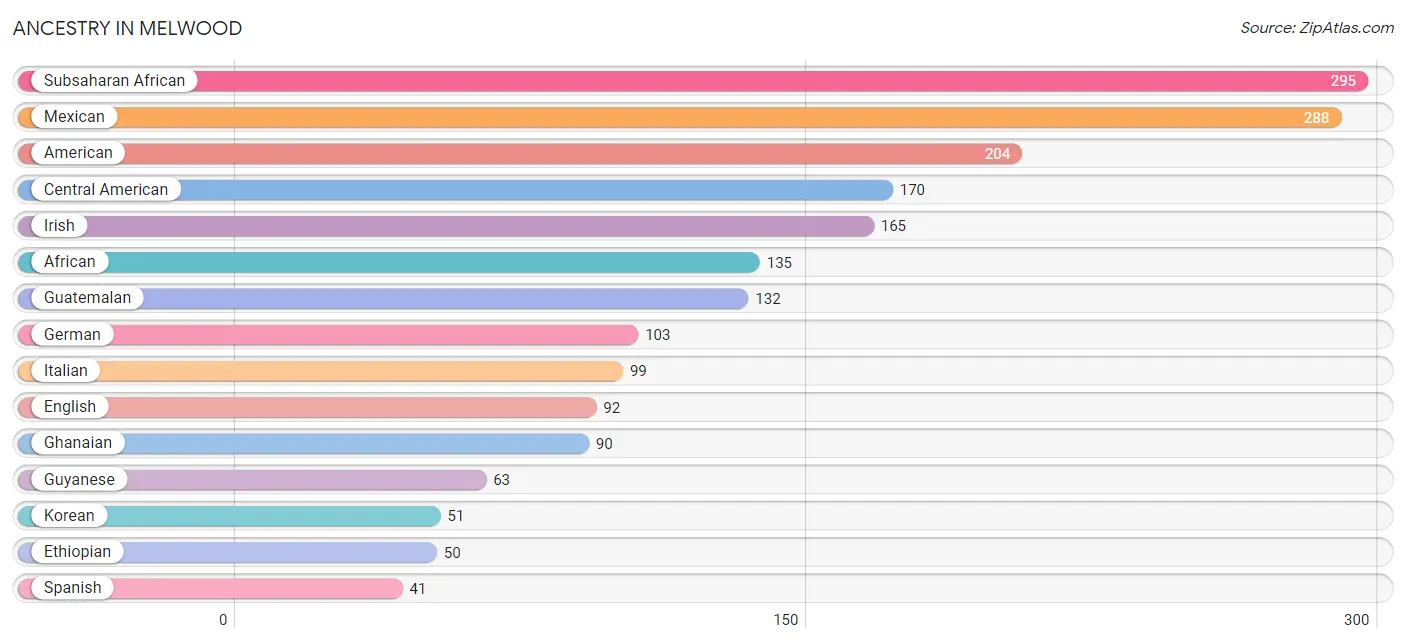
| Ancestry | # Population | % Population |
| African | 135 | 3.9% |
| American | 204 | 5.9% |
| Central American | 170 | 4.9% |
| Cherokee | 11 | 0.3% |
| Colombian | 31 | 0.9% |
| Creek | 11 | 0.3% |
| Dutch | 1 | 0.0% |
| English | 92 | 2.7% |
| Ethiopian | 50 | 1.5% |
| German | 103 | 3.0% |
| Ghanaian | 90 | 2.6% |
| Guatemalan | 132 | 3.8% |
| Guyanese | 63 | 1.8% |
| Honduran | 25 | 0.7% |
| Indian (Asian) | 9 | 0.3% |
| Inupiat | 25 | 0.7% |
| Irish | 165 | 4.8% |
| Italian | 99 | 2.9% |
| Korean | 51 | 1.5% |
| Laotian | 10 | 0.3% |
| Mexican | 288 | 8.4% |
| Nigerian | 20 | 0.6% |
| Northern European | 14 | 0.4% |
| Pakistani | 10 | 0.3% |
| Portuguese | 25 | 0.7% |
| Puerto Rican | 29 | 0.8% |
| Salvadoran | 13 | 0.4% |
| Scotch-Irish | 8 | 0.2% |
| Seminole | 10 | 0.3% |
| South American | 31 | 0.9% |
| Spaniard | 14 | 0.4% |
| Spanish | 41 | 1.2% |
| Subsaharan African | 295 | 8.6% |
| Trinidadian and Tobagonian | 8 | 0.2% |
| Welsh | 17 | 0.5% |
| West Indian | 7 | 0.2% | View All 36 Rows |
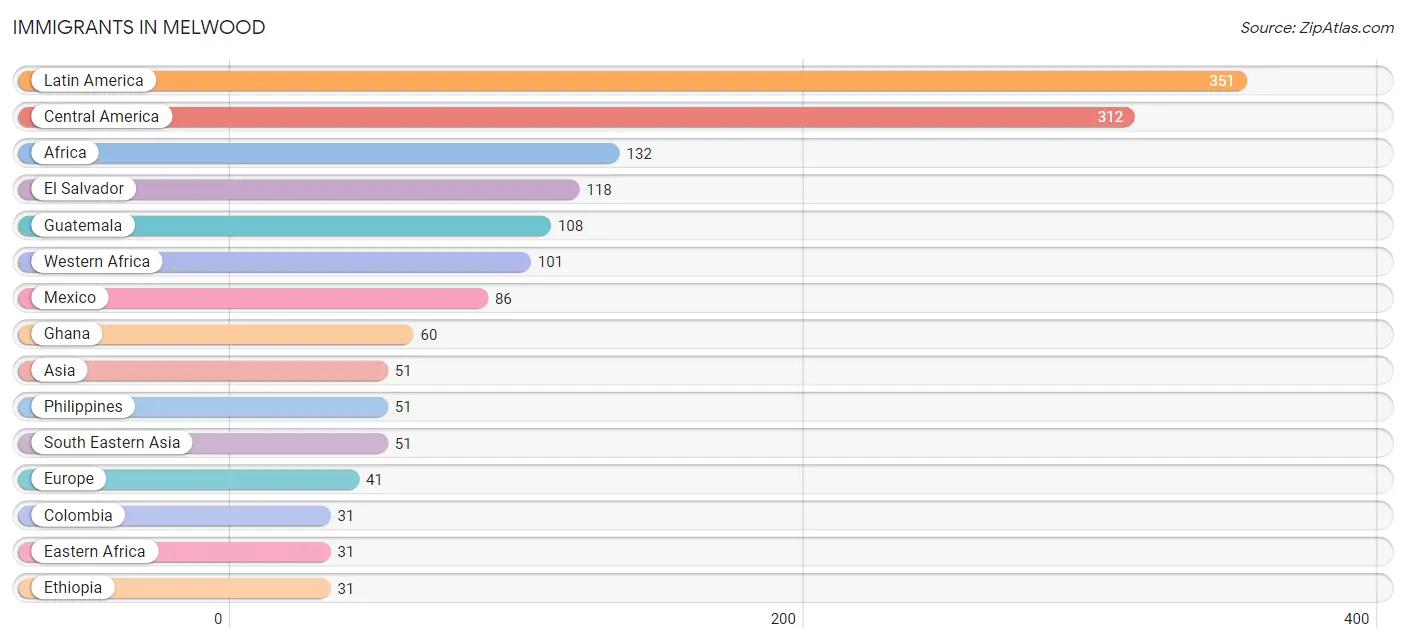
Immigrants in Melwood
The most numerous immigrant groups reported in Melwood came from Latin America (351 | 10.2%), Central America (312 | 9.1%), Africa (132 | 3.8%), El Salvador (118 | 3.4%), and Guatemala (108 | 3.1%), together accounting for 29.7% of all Melwood residents.
| Immigration Origin | # Population | % Population |
| Africa | 132 | 3.8% |
| Asia | 51 | 1.5% |
| Caribbean | 8 | 0.2% |
| Central America | 312 | 9.1% |
| Colombia | 31 | 0.9% |
| Eastern Africa | 31 | 0.9% |
| El Salvador | 118 | 3.4% |
| Ethiopia | 31 | 0.9% |
| Europe | 41 | 1.2% |
| Ghana | 60 | 1.8% |
| Guatemala | 108 | 3.1% |
| Latin America | 351 | 10.2% |
| Liberia | 7 | 0.2% |
| Mexico | 86 | 2.5% |
| Nigeria | 20 | 0.6% |
| Northern Europe | 16 | 0.5% |
| Philippines | 51 | 1.5% |
| Portugal | 25 | 0.7% |
| South America | 31 | 0.9% |
| South Eastern Asia | 51 | 1.5% |
| Southern Europe | 25 | 0.7% |
| Trinidad and Tobago | 8 | 0.2% |
| Western Africa | 101 | 2.9% | View All 23 Rows |
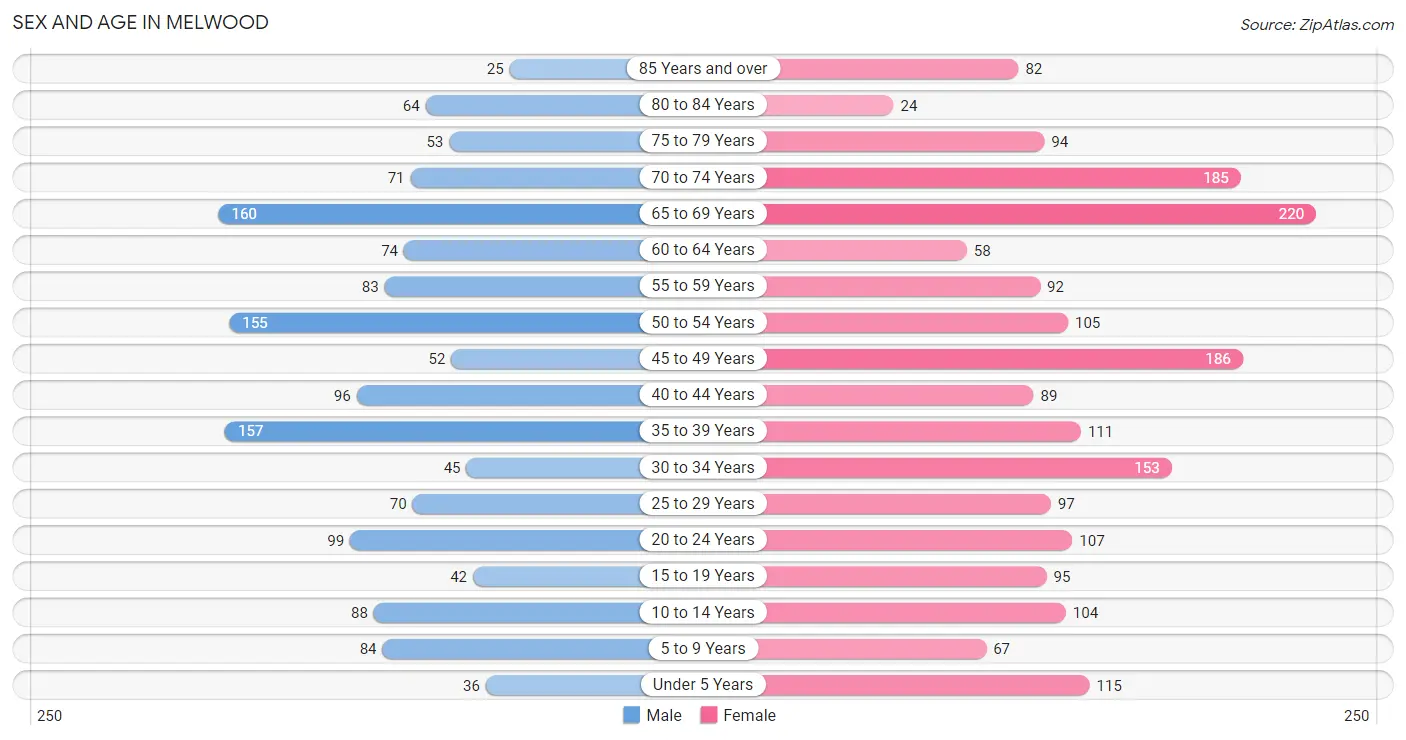
Sex and Age in Melwood
Sex and Age in Melwood
The most populous age groups in Melwood are 65 to 69 Years (160 | 11.0%) for men and 65 to 69 Years (220 | 11.1%) for women.
| Age Bracket | Male | Female |
| Under 5 Years | 36 (2.5%) | 115 (5.8%) |
| 5 to 9 Years | 84 (5.8%) | 67 (3.4%) |
| 10 to 14 Years | 88 (6.0%) | 104 (5.2%) |
| 15 to 19 Years | 42 (2.9%) | 95 (4.8%) |
| 20 to 24 Years | 99 (6.8%) | 107 (5.4%) |
| 25 to 29 Years | 70 (4.8%) | 97 (4.9%) |
| 30 to 34 Years | 45 (3.1%) | 153 (7.7%) |
| 35 to 39 Years | 157 (10.8%) | 111 (5.6%) |
| 40 to 44 Years | 96 (6.6%) | 89 (4.5%) |
| 45 to 49 Years | 52 (3.6%) | 186 (9.4%) |
| 50 to 54 Years | 155 (10.7%) | 105 (5.3%) |
| 55 to 59 Years | 83 (5.7%) | 92 (4.6%) |
| 60 to 64 Years | 74 (5.1%) | 58 (2.9%) |
| 65 to 69 Years | 160 (11.0%) | 220 (11.1%) |
| 70 to 74 Years | 71 (4.9%) | 185 (9.3%) |
| 75 to 79 Years | 53 (3.6%) | 94 (4.7%) |
| 80 to 84 Years | 64 (4.4%) | 24 (1.2%) |
| 85 Years and over | 25 (1.7%) | 82 (4.1%) |
| Total | 1,454 (100.0%) | 1,984 (100.0%) |
Families and Households in Melwood
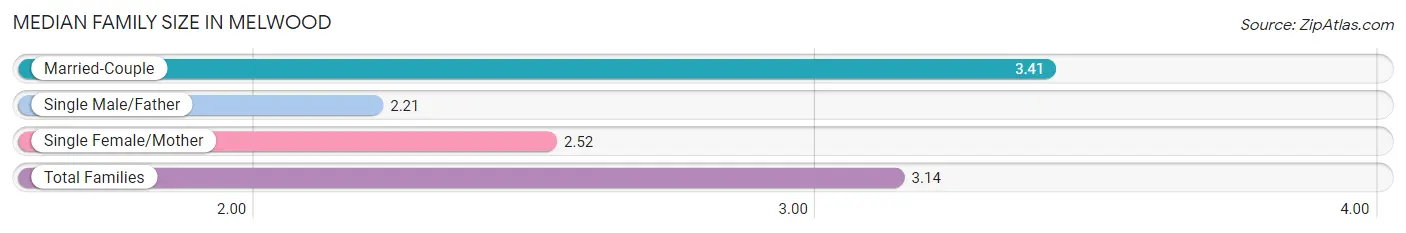
Median Family Size in Melwood
The median family size in Melwood is 3.14 persons per family, with married-couple families (583 | 71.5%) accounting for the largest median family size of 3.41 persons per family. On the other hand, single male/father families (42 | 5.1%) represent the smallest median family size with 2.21 persons per family.
| Family Type | # Families | Family Size |
| Married-Couple | 583 (71.5%) | 3.41 |
| Single Male/Father | 42 (5.1%) | 2.21 |
| Single Female/Mother | 190 (23.3%) | 2.52 |
| Total Families | 815 (100.0%) | 3.14 |
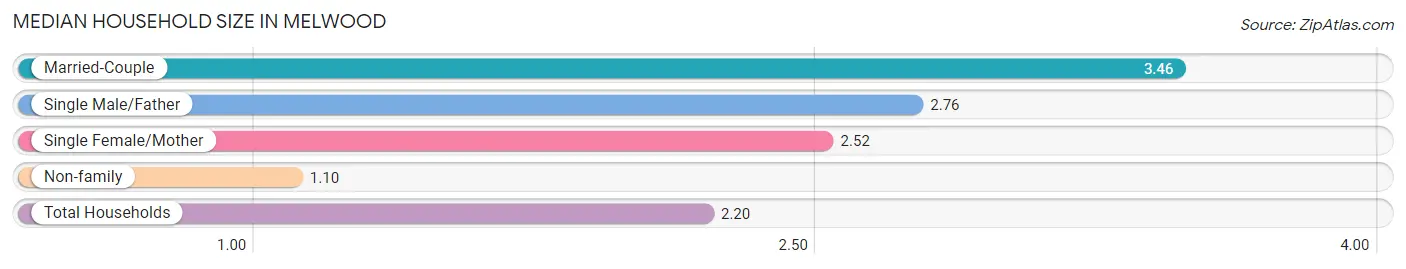
Median Household Size in Melwood
The median household size in Melwood is 2.20 persons per household, with married-couple households (583 | 37.4%) accounting for the largest median household size of 3.46 persons per household. non-family households (742 | 47.7%) represent the smallest median household size with 1.10 persons per household.
| Household Type | # Households | Household Size |
| Married-Couple | 583 (37.4%) | 3.46 |
| Single Male/Father | 42 (2.7%) | 2.76 |
| Single Female/Mother | 190 (12.2%) | 2.52 |
| Non-family | 742 (47.7%) | 1.10 |
| Total Households | 1,557 (100.0%) | 2.20 |
Household Size by Marriage Status in Melwood
Out of a total of 1,557 households in Melwood, 815 (52.3%) are family households, while 742 (47.7%) are nonfamily households. The most numerous type of family households are 2-person households, comprising 408, and the most common type of nonfamily households are 1-person households, comprising 669.
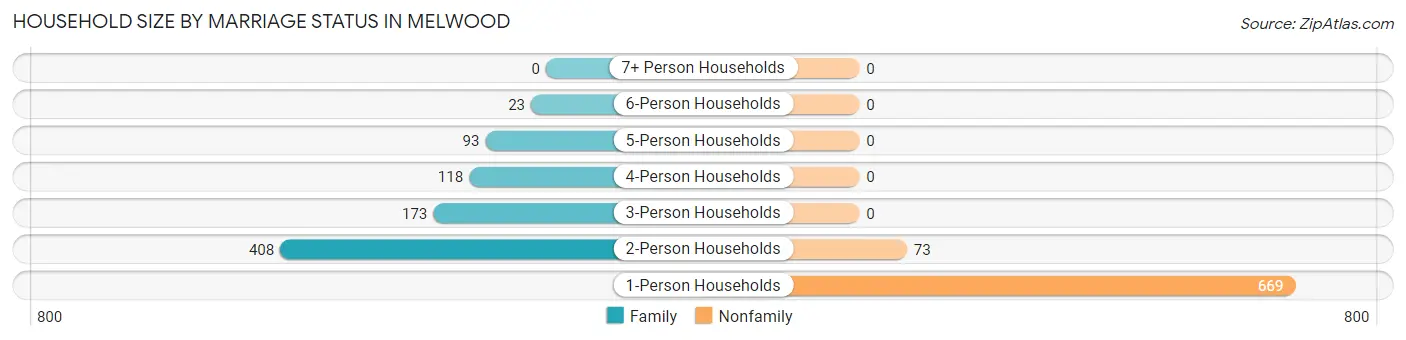
| Household Size | Family Households | Nonfamily Households |
| 1-Person Households | - | 669 (43.0%) |
| 2-Person Households | 408 (26.2%) | 73 (4.7%) |
| 3-Person Households | 173 (11.1%) | 0 (0.0%) |
| 4-Person Households | 118 (7.6%) | 0 (0.0%) |
| 5-Person Households | 93 (6.0%) | 0 (0.0%) |
| 6-Person Households | 23 (1.5%) | 0 (0.0%) |
| 7+ Person Households | 0 (0.0%) | 0 (0.0%) |
| Total | 815 (52.3%) | 742 (47.7%) |
Female Fertility in Melwood
Fertility by Age in Melwood
Average fertility rate in Melwood is 34.0 births per 1,000 women. Women in the age bracket of 35 to 50 years have the highest fertility rate with 71.0 births per 1,000 women. Women in the age bracket of 35 to 50 years acount for 100.0% of all women with births.
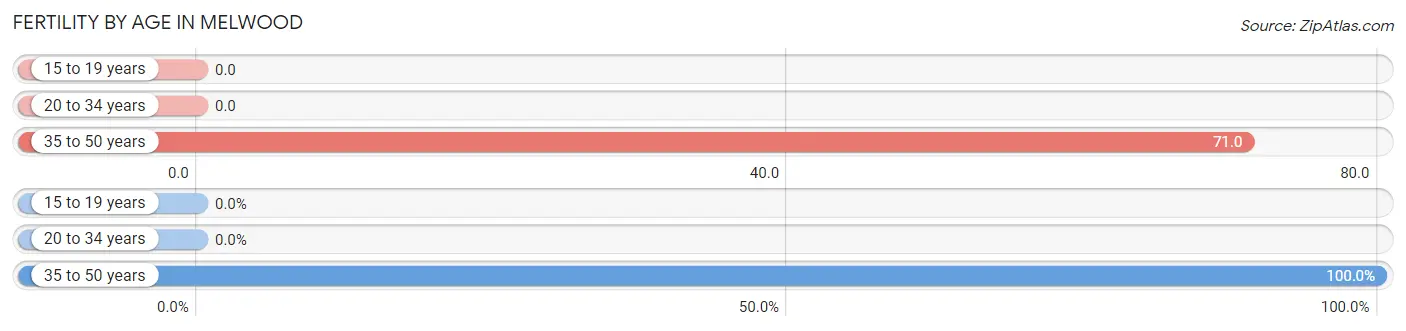
| Age Bracket | Women with Births | Births / 1,000 Women |
| 15 to 19 years | 0 (0.0%) | 0.0 |
| 20 to 34 years | 0 (0.0%) | 0.0 |
| 35 to 50 years | 30 (100.0%) | 71.0 |
| Total | 30 (100.0%) | 34.0 |
Fertility by Age by Marriage Status in Melwood
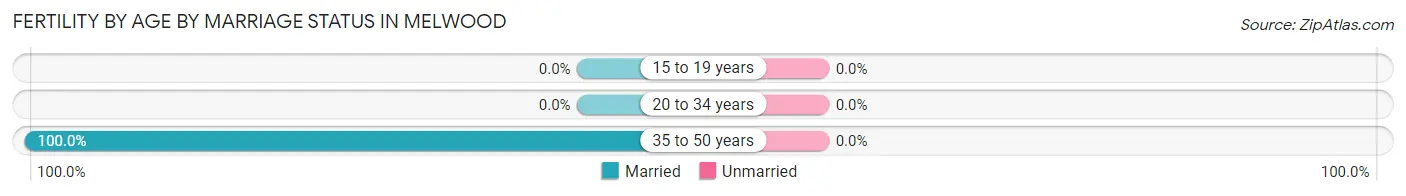
| Age Bracket | Married | Unmarried |
| 15 to 19 years | 0 (0.0%) | 0 (0.0%) |
| 20 to 34 years | 0 (0.0%) | 0 (0.0%) |
| 35 to 50 years | 30 (100.0%) | 0 (0.0%) |
| Total | 30 (100.0%) | 0 (0.0%) |
Fertility by Education in Melwood
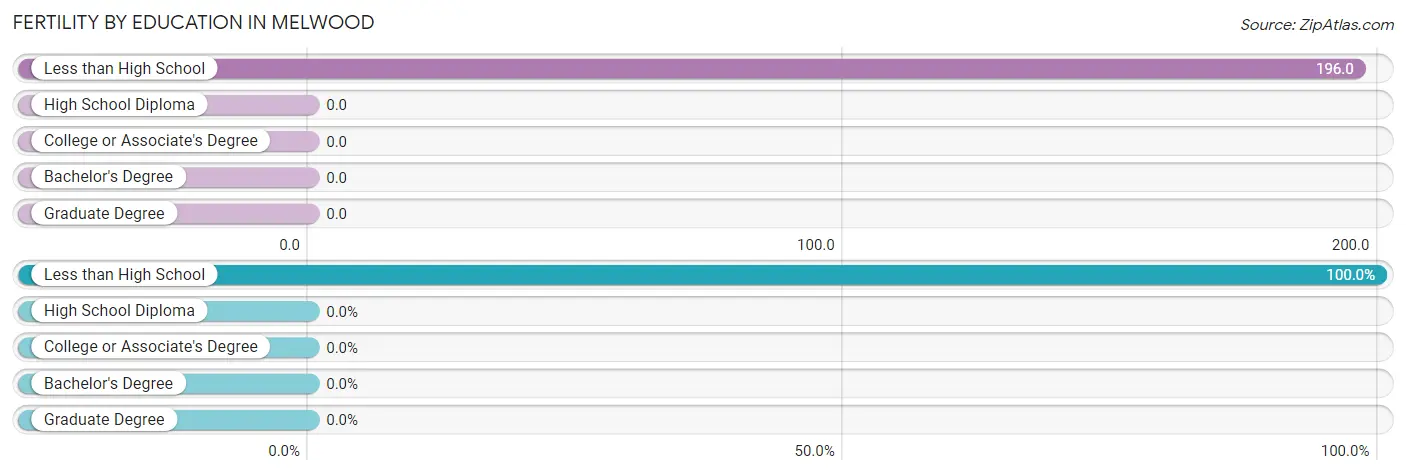
| Educational Attainment | Women with Births | Births / 1,000 Women |
| Less than High School | 30 (100.0%) | 196.0 |
| High School Diploma | 0 (0.0%) | 0.0 |
| College or Associate's Degree | 0 (0.0%) | 0.0 |
| Bachelor's Degree | 0 (0.0%) | 0.0 |
| Graduate Degree | 0 (0.0%) | 0.0 |
| Total | 30 (100.0%) | 34.0 |
Fertility by Education by Marriage Status in Melwood
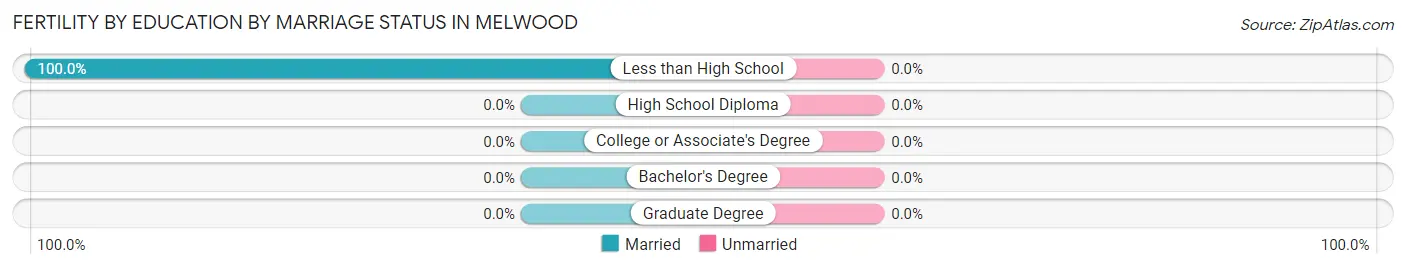
| Educational Attainment | Married | Unmarried |
| Less than High School | 30 (100.0%) | 0 (0.0%) |
| High School Diploma | 0 (0.0%) | 0 (0.0%) |
| College or Associate's Degree | 0 (0.0%) | 0 (0.0%) |
| Bachelor's Degree | 0 (0.0%) | 0 (0.0%) |
| Graduate Degree | 0 (0.0%) | 0 (0.0%) |
| Total | 30 (100.0%) | 0 (0.0%) |
Employment Characteristics in Melwood
Employment by Class of Employer in Melwood
Among the 1,483 employed individuals in Melwood, private company employees (718 | 48.4%), federal government employees (418 | 28.2%), and state government employees (119 | 8.0%) make up the most common classes of employment.
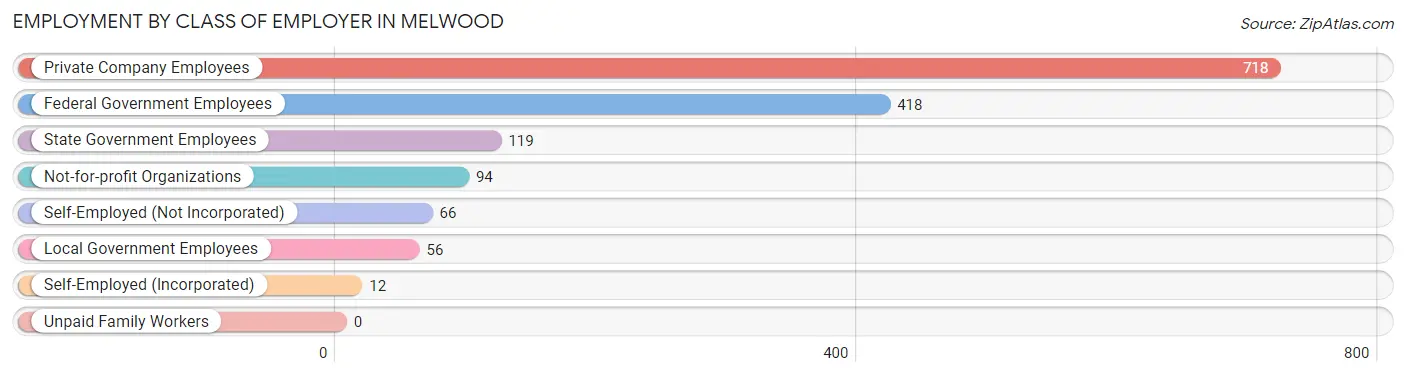
| Employer Class | # Employees | % Employees |
| Private Company Employees | 718 | 48.4% |
| Self-Employed (Incorporated) | 12 | 0.8% |
| Self-Employed (Not Incorporated) | 66 | 4.4% |
| Not-for-profit Organizations | 94 | 6.3% |
| Local Government Employees | 56 | 3.8% |
| State Government Employees | 119 | 8.0% |
| Federal Government Employees | 418 | 28.2% |
| Unpaid Family Workers | 0 | 0.0% |
| Total | 1,483 | 100.0% |
Employment Status by Age in Melwood
According to the labor force statistics for Melwood, out of the total population over 16 years of age (2,925), 54.5% or 1,594 individuals are in the labor force, with 5.2% or 83 of them unemployed. The age group with the highest labor force participation rate is 35 to 44 years, with 91.2% or 413 individuals in the labor force. Within the labor force, the 16 to 19 years age range has the highest percentage of unemployed individuals, with 14.0% or 7 of them being unemployed.
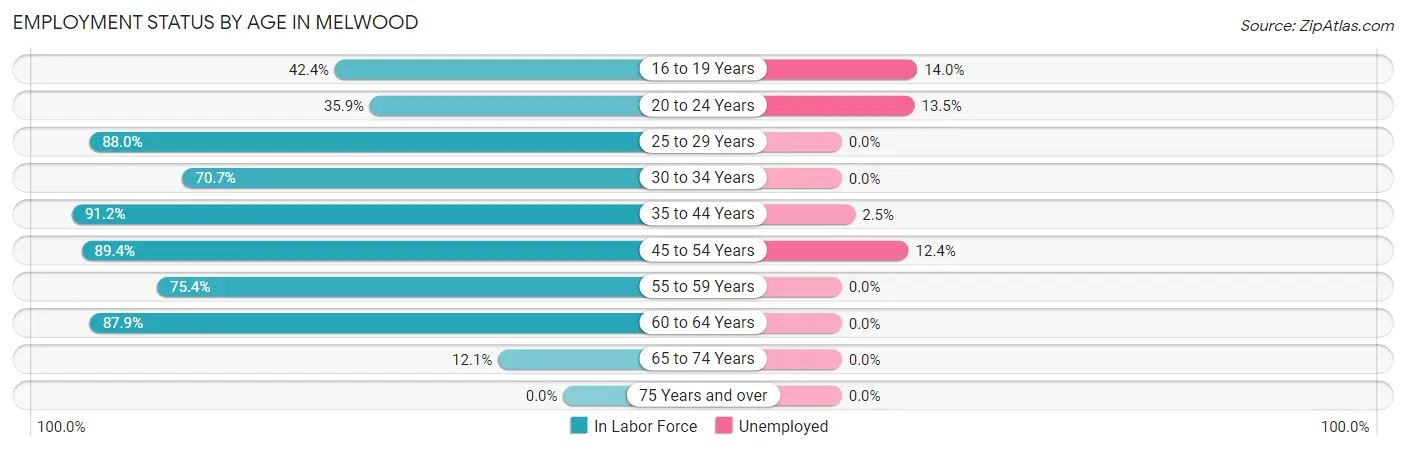
| Age Bracket | In Labor Force | Unemployed |
| 16 to 19 Years | 50 (42.4%) | 7 (14.0%) |
| 20 to 24 Years | 74 (35.9%) | 10 (13.5%) |
| 25 to 29 Years | 147 (88.0%) | 0 (0.0%) |
| 30 to 34 Years | 140 (70.7%) | 0 (0.0%) |
| 35 to 44 Years | 413 (91.2%) | 10 (2.5%) |
| 45 to 54 Years | 445 (89.4%) | 55 (12.4%) |
| 55 to 59 Years | 132 (75.4%) | 0 (0.0%) |
| 60 to 64 Years | 116 (87.9%) | 0 (0.0%) |
| 65 to 74 Years | 77 (12.1%) | 0 (0.0%) |
| 75 Years and over | 0 (0.0%) | 0 (0.0%) |
| Total | 1,594 (54.5%) | 83 (5.2%) |
Employment Status by Educational Attainment in Melwood
According to labor force statistics for Melwood, 85.8% of individuals (1,393) out of the total population between 25 and 64 years of age (1,623) are in the labor force, with 4.8% or 67 of them being unemployed. The group with the highest labor force participation rate are those with the educational attainment of bachelor's degree or higher, with 95.9% or 648 individuals in the labor force. Within the labor force, individuals with high school diploma education have the highest percentage of unemployment, with 8.0% or 24 of them being unemployed.
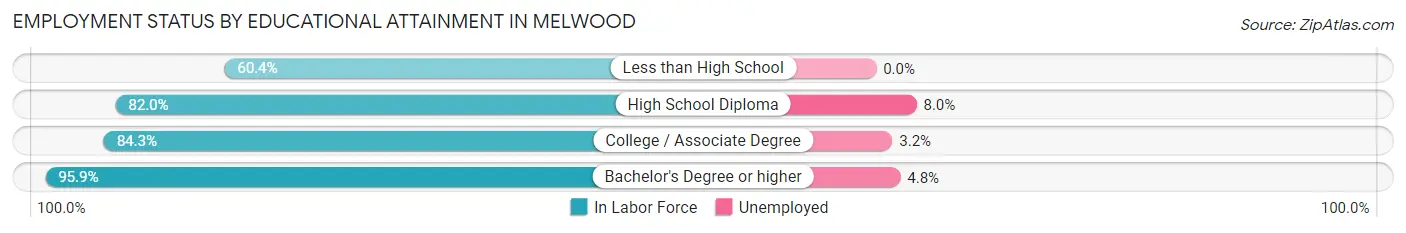
| Educational Attainment | In Labor Force | Unemployed |
| Less than High School | 113 (60.4%) | 0 (0.0%) |
| High School Diploma | 300 (82.0%) | 29 (8.0%) |
| College / Associate Degree | 332 (84.3%) | 13 (3.2%) |
| Bachelor's Degree or higher | 648 (95.9%) | 32 (4.8%) |
| Total | 1,393 (85.8%) | 78 (4.8%) |
Employment Occupations by Sex in Melwood
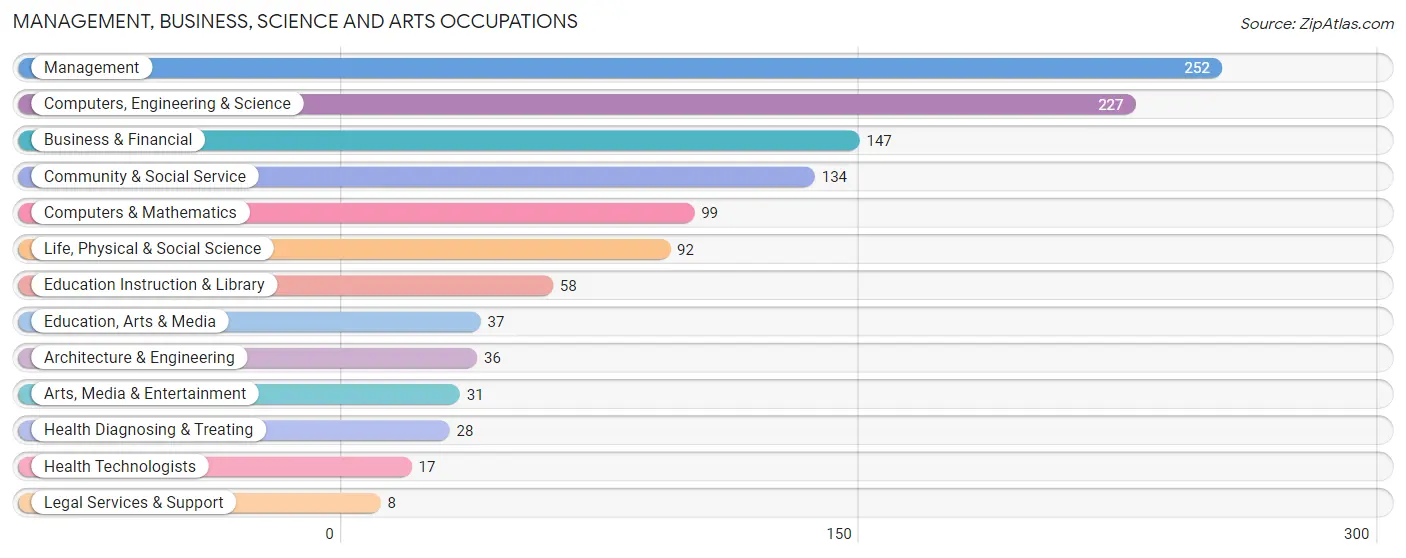
Management, Business, Science and Arts Occupations
The most common Management, Business, Science and Arts occupations in Melwood are Management (252 | 17.2%), Computers, Engineering & Science (227 | 15.5%), Business & Financial (147 | 10.0%), Community & Social Service (134 | 9.1%), and Computers & Mathematics (99 | 6.8%).
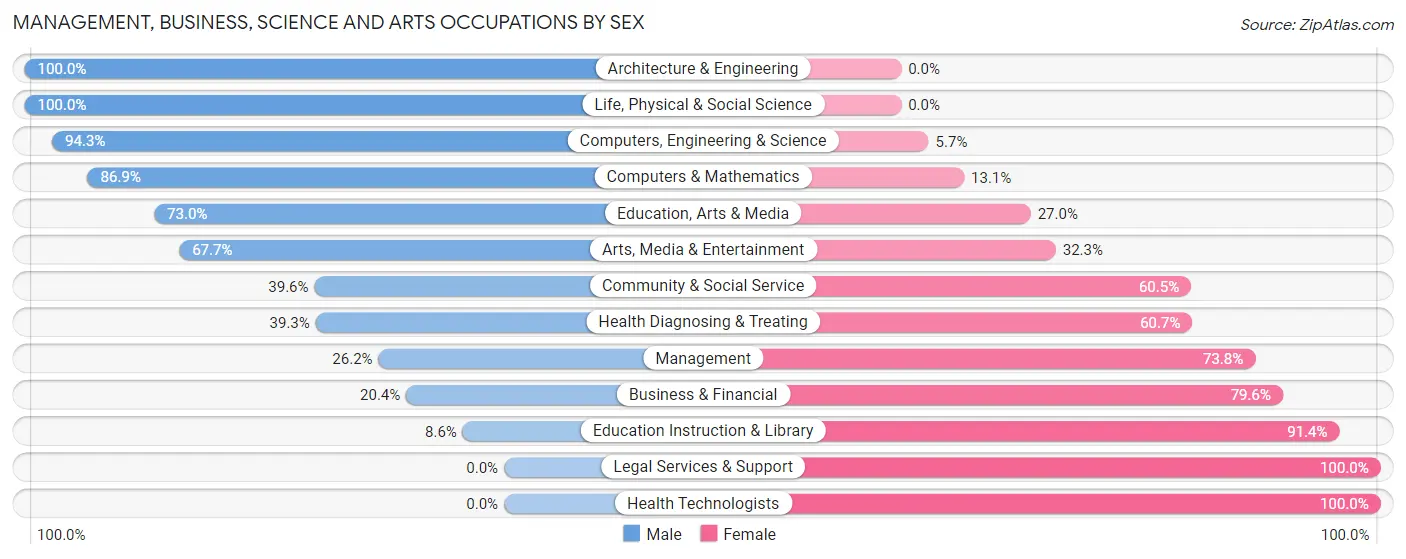
Management, Business, Science and Arts Occupations by Sex
Within the Management, Business, Science and Arts occupations in Melwood, the most male-oriented occupations are Architecture & Engineering (100.0%), Life, Physical & Social Science (100.0%), and Computers, Engineering & Science (94.3%), while the most female-oriented occupations are Legal Services & Support (100.0%), Health Technologists (100.0%), and Education Instruction & Library (91.4%).
| Occupation | Male | Female |
| Management | 66 (26.2%) | 186 (73.8%) |
| Business & Financial | 30 (20.4%) | 117 (79.6%) |
| Computers, Engineering & Science | 214 (94.3%) | 13 (5.7%) |
| Computers & Mathematics | 86 (86.9%) | 13 (13.1%) |
| Architecture & Engineering | 36 (100.0%) | 0 (0.0%) |
| Life, Physical & Social Science | 92 (100.0%) | 0 (0.0%) |
| Community & Social Service | 53 (39.6%) | 81 (60.5%) |
| Education, Arts & Media | 27 (73.0%) | 10 (27.0%) |
| Legal Services & Support | 0 (0.0%) | 8 (100.0%) |
| Education Instruction & Library | 5 (8.6%) | 53 (91.4%) |
| Arts, Media & Entertainment | 21 (67.7%) | 10 (32.3%) |
| Health Diagnosing & Treating | 11 (39.3%) | 17 (60.7%) |
| Health Technologists | 0 (0.0%) | 17 (100.0%) |
| Total (Category) | 374 (47.5%) | 414 (52.5%) |
| Total (Overall) | 710 (48.5%) | 754 (51.5%) |
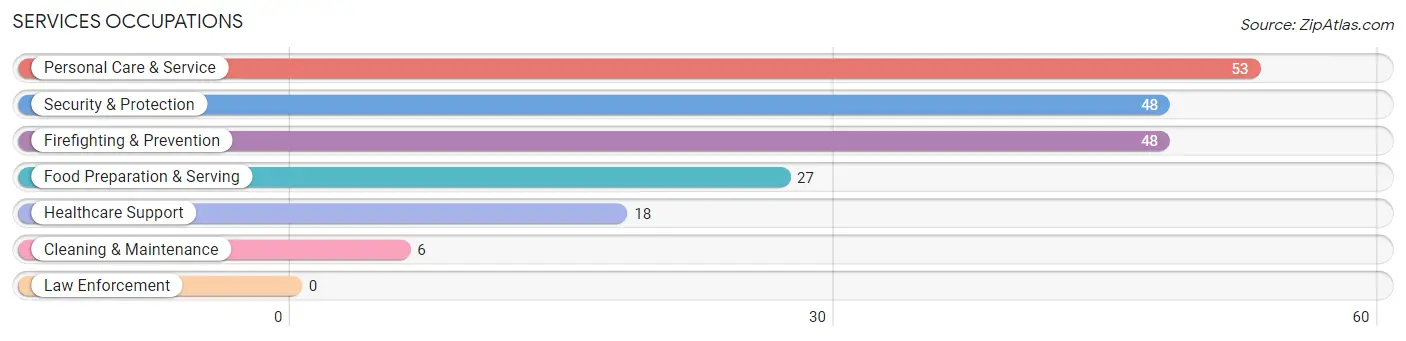
Services Occupations
The most common Services occupations in Melwood are Personal Care & Service (53 | 3.6%), Security & Protection (48 | 3.3%), Firefighting & Prevention (48 | 3.3%), Food Preparation & Serving (27 | 1.8%), and Healthcare Support (18 | 1.2%).
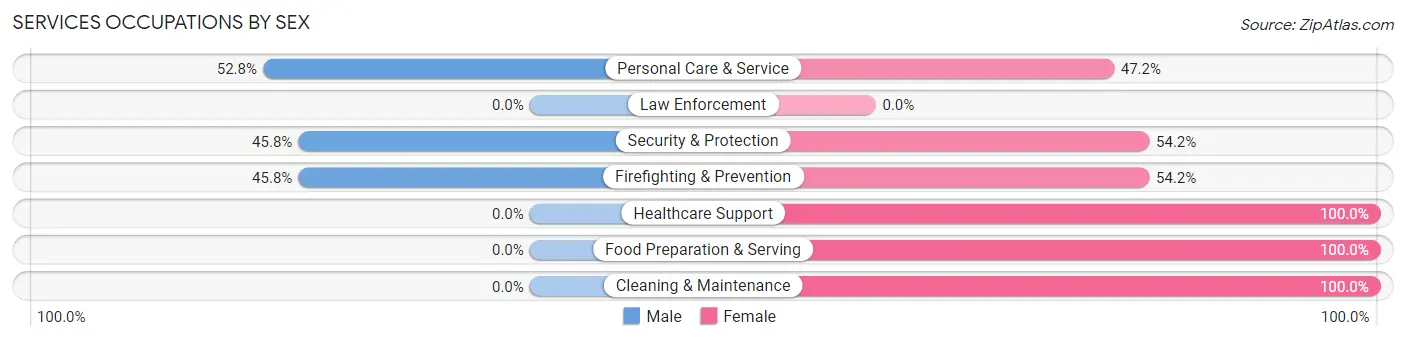
Services Occupations by Sex
Within the Services occupations in Melwood, the most male-oriented occupations are Personal Care & Service (52.8%), Security & Protection (45.8%), and Firefighting & Prevention (45.8%), while the most female-oriented occupations are Healthcare Support (100.0%), Food Preparation & Serving (100.0%), and Cleaning & Maintenance (100.0%).
| Occupation | Male | Female |
| Healthcare Support | 0 (0.0%) | 18 (100.0%) |
| Security & Protection | 22 (45.8%) | 26 (54.2%) |
| Firefighting & Prevention | 22 (45.8%) | 26 (54.2%) |
| Law Enforcement | 0 (0.0%) | 0 (0.0%) |
| Food Preparation & Serving | 0 (0.0%) | 27 (100.0%) |
| Cleaning & Maintenance | 0 (0.0%) | 6 (100.0%) |
| Personal Care & Service | 28 (52.8%) | 25 (47.2%) |
| Total (Category) | 50 (32.9%) | 102 (67.1%) |
| Total (Overall) | 710 (48.5%) | 754 (51.5%) |
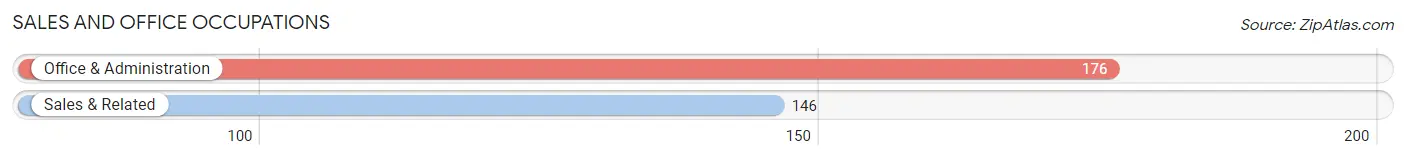
Sales and Office Occupations
The most common Sales and Office occupations in Melwood are Office & Administration (176 | 12.0%), and Sales & Related (146 | 10.0%).
Sales and Office Occupations by Sex
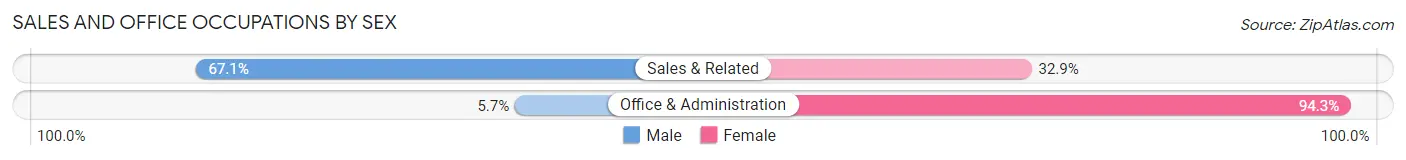
| Occupation | Male | Female |
| Sales & Related | 98 (67.1%) | 48 (32.9%) |
| Office & Administration | 10 (5.7%) | 166 (94.3%) |
| Total (Category) | 108 (33.5%) | 214 (66.5%) |
| Total (Overall) | 710 (48.5%) | 754 (51.5%) |
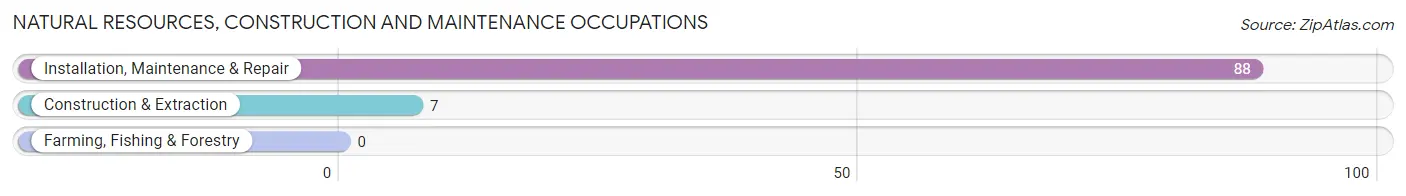
Natural Resources, Construction and Maintenance Occupations
The most common Natural Resources, Construction and Maintenance occupations in Melwood are Installation, Maintenance & Repair (88 | 6.0%), and Construction & Extraction (7 | 0.5%).
Natural Resources, Construction and Maintenance Occupations by Sex
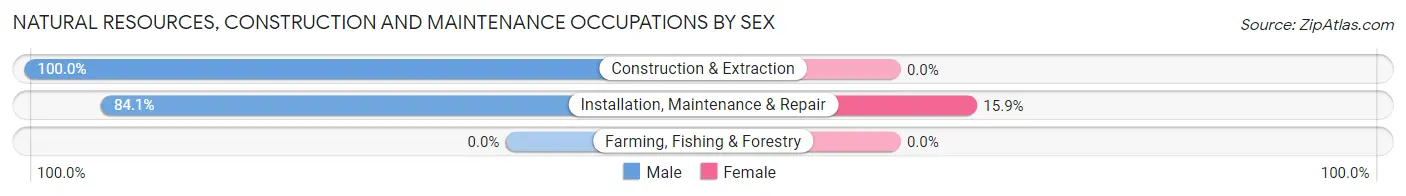
| Occupation | Male | Female |
| Farming, Fishing & Forestry | 0 (0.0%) | 0 (0.0%) |
| Construction & Extraction | 7 (100.0%) | 0 (0.0%) |
| Installation, Maintenance & Repair | 74 (84.1%) | 14 (15.9%) |
| Total (Category) | 81 (85.3%) | 14 (14.7%) |
| Total (Overall) | 710 (48.5%) | 754 (51.5%) |
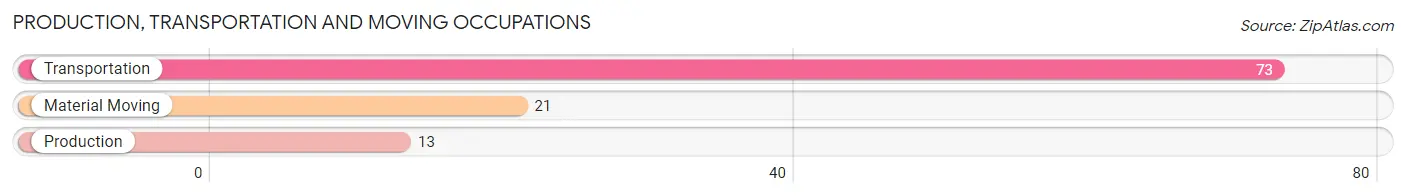
Production, Transportation and Moving Occupations
The most common Production, Transportation and Moving occupations in Melwood are Transportation (73 | 5.0%), Material Moving (21 | 1.4%), and Production (13 | 0.9%).
Production, Transportation and Moving Occupations by Sex
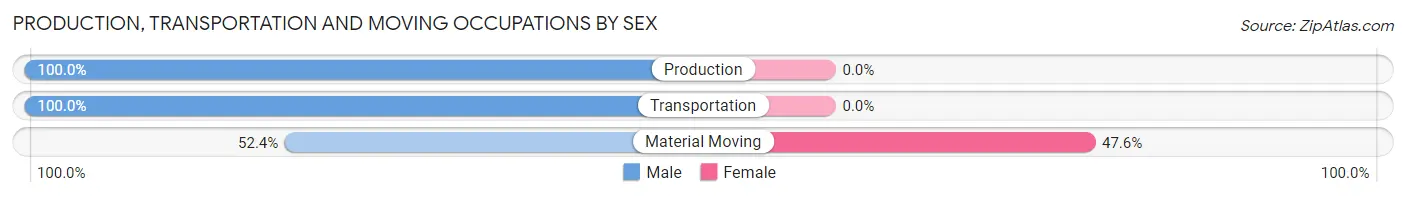
| Occupation | Male | Female |
| Production | 13 (100.0%) | 0 (0.0%) |
| Transportation | 73 (100.0%) | 0 (0.0%) |
| Material Moving | 11 (52.4%) | 10 (47.6%) |
| Total (Category) | 97 (90.6%) | 10 (9.3%) |
| Total (Overall) | 710 (48.5%) | 754 (51.5%) |
Employment Industries by Sex in Melwood
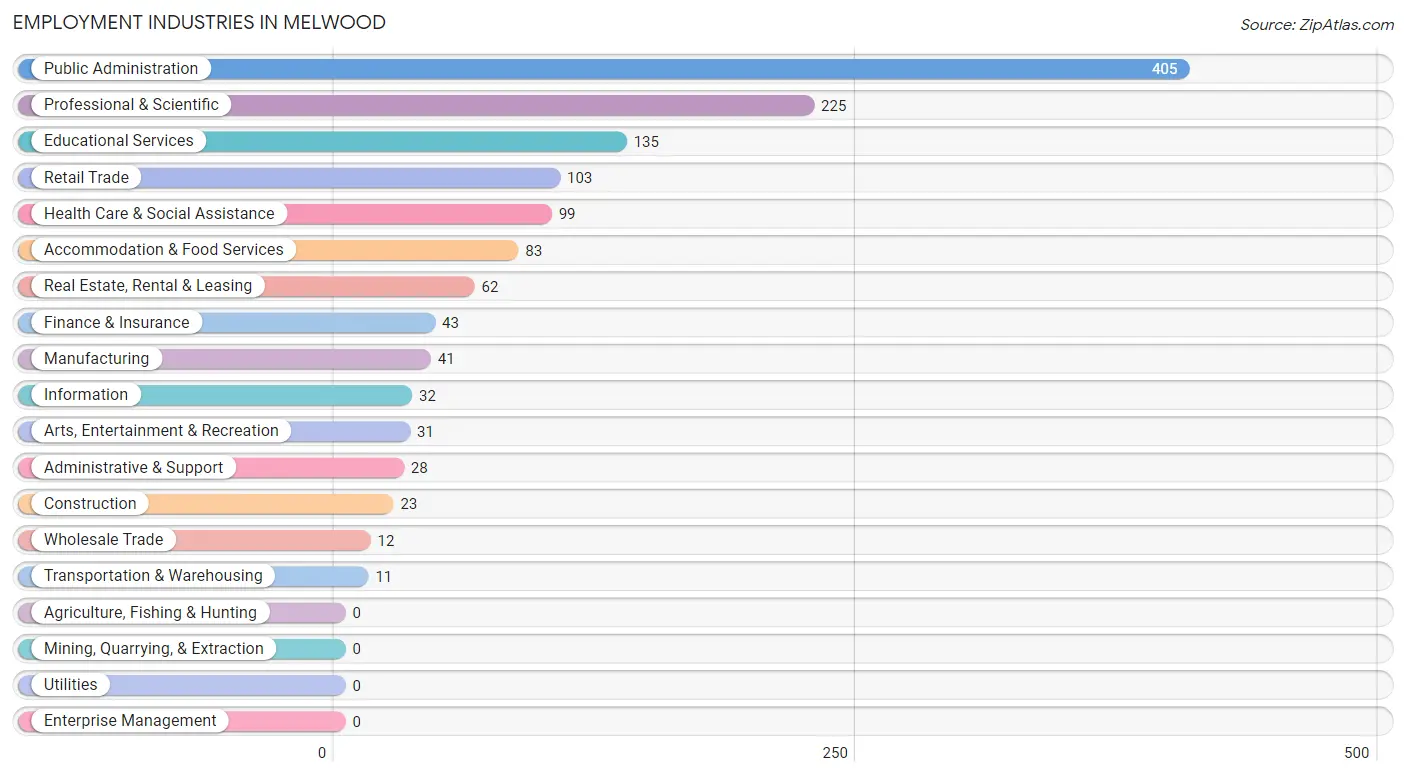
Employment Industries in Melwood
The major employment industries in Melwood include Public Administration (405 | 27.7%), Professional & Scientific (225 | 15.4%), Educational Services (135 | 9.2%), Retail Trade (103 | 7.0%), and Health Care & Social Assistance (99 | 6.8%).
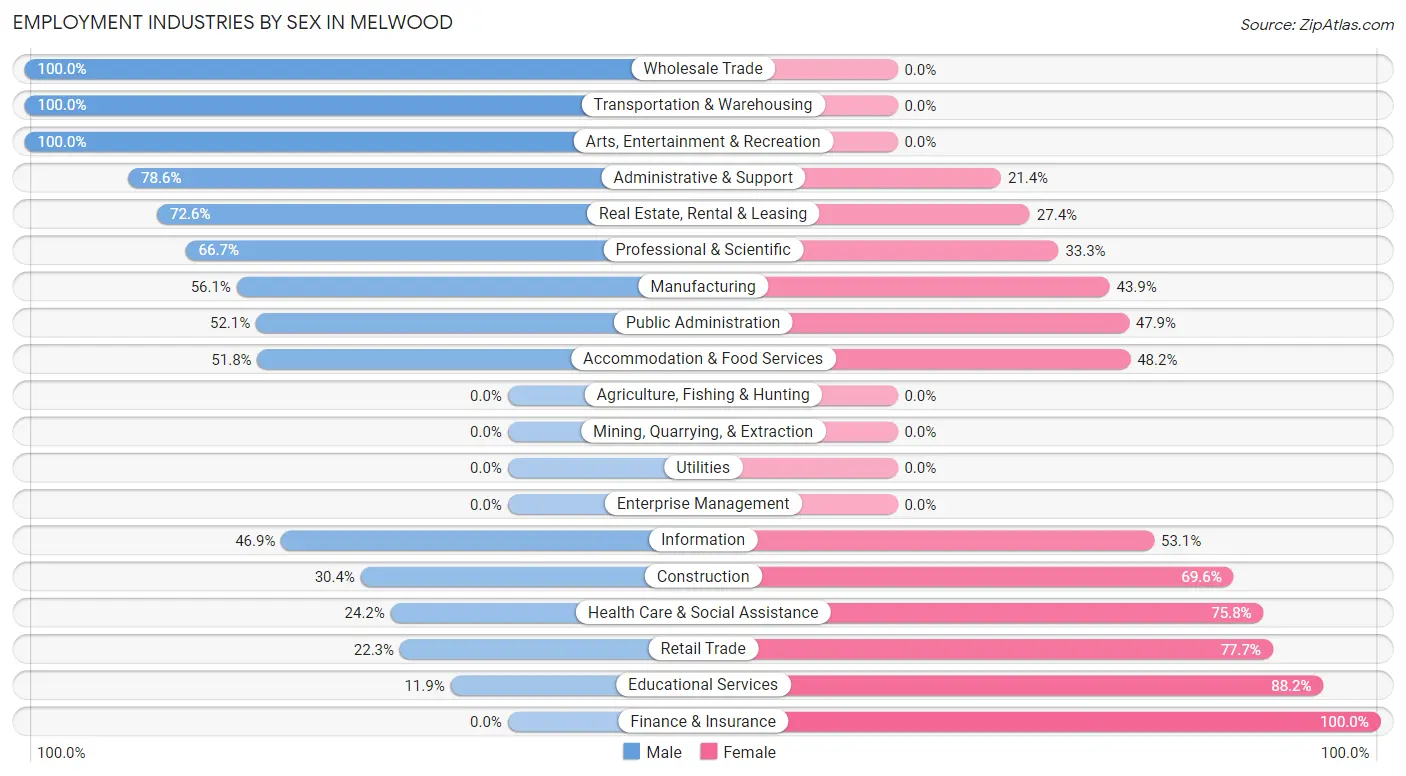
Employment Industries by Sex in Melwood
The Melwood industries that see more men than women are Wholesale Trade (100.0%), Transportation & Warehousing (100.0%), and Arts, Entertainment & Recreation (100.0%), whereas the industries that tend to have a higher number of women are Finance & Insurance (100.0%), Educational Services (88.1%), and Retail Trade (77.7%).
| Industry | Male | Female |
| Agriculture, Fishing & Hunting | 0 (0.0%) | 0 (0.0%) |
| Mining, Quarrying, & Extraction | 0 (0.0%) | 0 (0.0%) |
| Construction | 7 (30.4%) | 16 (69.6%) |
| Manufacturing | 23 (56.1%) | 18 (43.9%) |
| Wholesale Trade | 12 (100.0%) | 0 (0.0%) |
| Retail Trade | 23 (22.3%) | 80 (77.7%) |
| Transportation & Warehousing | 11 (100.0%) | 0 (0.0%) |
| Utilities | 0 (0.0%) | 0 (0.0%) |
| Information | 15 (46.9%) | 17 (53.1%) |
| Finance & Insurance | 0 (0.0%) | 43 (100.0%) |
| Real Estate, Rental & Leasing | 45 (72.6%) | 17 (27.4%) |
| Professional & Scientific | 150 (66.7%) | 75 (33.3%) |
| Enterprise Management | 0 (0.0%) | 0 (0.0%) |
| Administrative & Support | 22 (78.6%) | 6 (21.4%) |
| Educational Services | 16 (11.8%) | 119 (88.1%) |
| Health Care & Social Assistance | 24 (24.2%) | 75 (75.8%) |
| Arts, Entertainment & Recreation | 31 (100.0%) | 0 (0.0%) |
| Accommodation & Food Services | 43 (51.8%) | 40 (48.2%) |
| Public Administration | 211 (52.1%) | 194 (47.9%) |
| Total | 710 (48.5%) | 754 (51.5%) |
Education in Melwood
School Enrollment in Melwood
The most common levels of schooling among the 651 students in Melwood are middle school (176 | 27.0%), college / undergraduate (167 | 25.7%), and elementary school (126 | 19.4%).
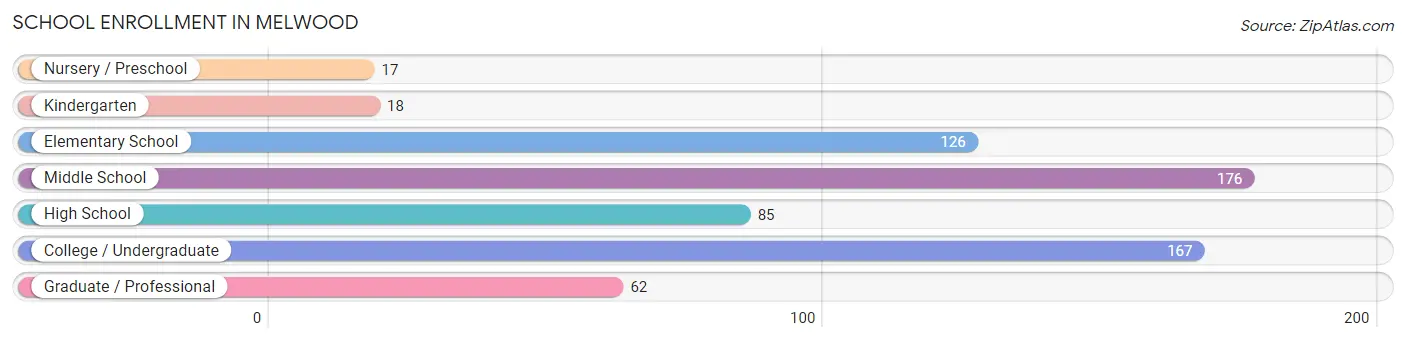
| School Level | # Students | % Students |
| Nursery / Preschool | 17 | 2.6% |
| Kindergarten | 18 | 2.8% |
| Elementary School | 126 | 19.4% |
| Middle School | 176 | 27.0% |
| High School | 85 | 13.1% |
| College / Undergraduate | 167 | 25.7% |
| Graduate / Professional | 62 | 9.5% |
| Total | 651 | 100.0% |
School Enrollment by Age by Funding Source in Melwood
Out of a total of 651 students who are enrolled in schools in Melwood, 60 (9.2%) attend a private institution, while the remaining 591 (90.8%) are enrolled in public schools. The age group of 20 to 24 year olds has the highest likelihood of being enrolled in private schools, with 10 (100.0% in the age bracket) enrolled. Conversely, the age group of 10 to 14 year olds has the lowest likelihood of being enrolled in a private school, with 192 (100.0% in the age bracket) attending a public institution.
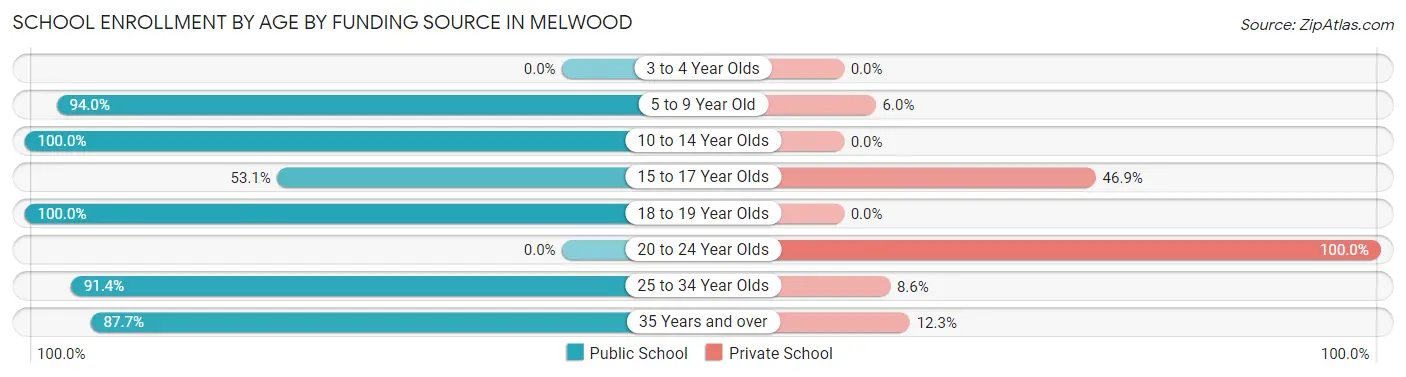
| Age Bracket | Public School | Private School |
| 3 to 4 Year Olds | 0 (0.0%) | 0 (0.0%) |
| 5 to 9 Year Old | 142 (94.0%) | 9 (6.0%) |
| 10 to 14 Year Olds | 192 (100.0%) | 0 (0.0%) |
| 15 to 17 Year Olds | 26 (53.1%) | 23 (46.9%) |
| 18 to 19 Year Olds | 68 (100.0%) | 0 (0.0%) |
| 20 to 24 Year Olds | 0 (0.0%) | 10 (100.0%) |
| 25 to 34 Year Olds | 106 (91.4%) | 10 (8.6%) |
| 35 Years and over | 57 (87.7%) | 8 (12.3%) |
| Total | 591 (90.8%) | 60 (9.2%) |
Educational Attainment by Field of Study in Melwood
Business (378 | 39.1%), education (102 | 10.5%), engineering (77 | 8.0%), computers & mathematics (74 | 7.6%), and social sciences (72 | 7.4%) are the most common fields of study among 967 individuals in Melwood who have obtained a bachelor's degree or higher.
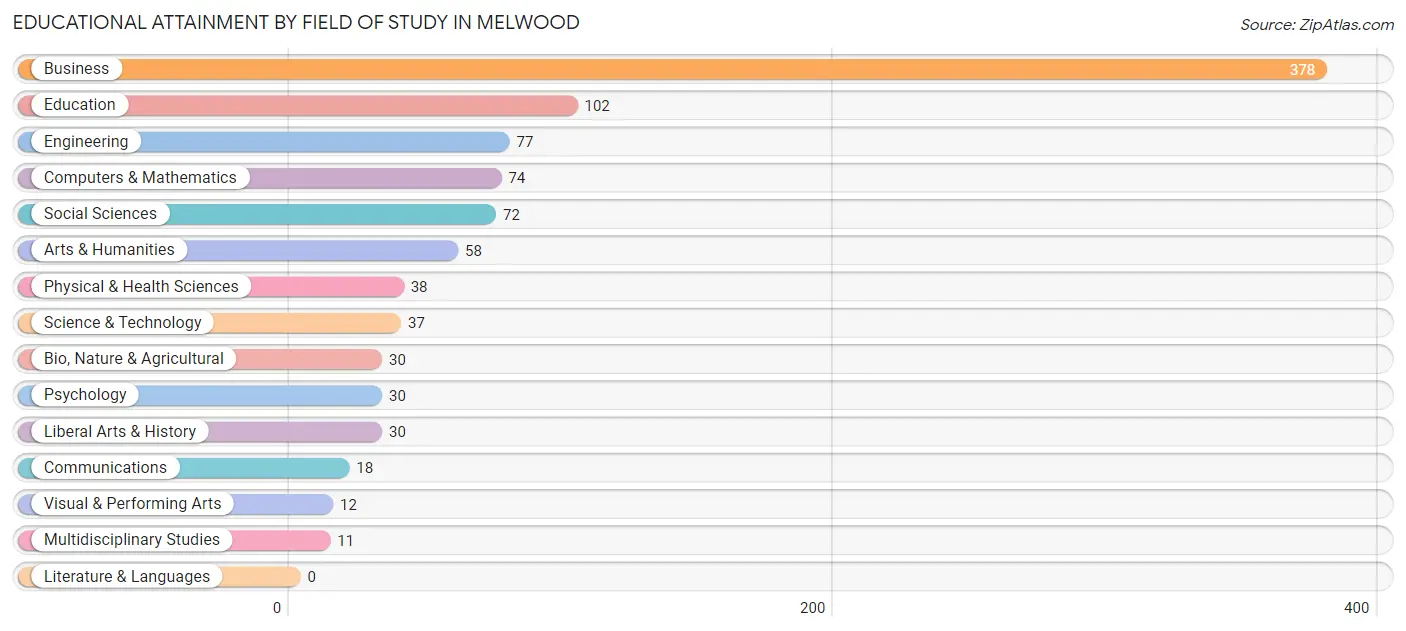
| Field of Study | # Graduates | % Graduates |
| Computers & Mathematics | 74 | 7.6% |
| Bio, Nature & Agricultural | 30 | 3.1% |
| Physical & Health Sciences | 38 | 3.9% |
| Psychology | 30 | 3.1% |
| Social Sciences | 72 | 7.4% |
| Engineering | 77 | 8.0% |
| Multidisciplinary Studies | 11 | 1.1% |
| Science & Technology | 37 | 3.8% |
| Business | 378 | 39.1% |
| Education | 102 | 10.5% |
| Literature & Languages | 0 | 0.0% |
| Liberal Arts & History | 30 | 3.1% |
| Visual & Performing Arts | 12 | 1.2% |
| Communications | 18 | 1.9% |
| Arts & Humanities | 58 | 6.0% |
| Total | 967 | 100.0% |
Transportation & Commute in Melwood
Vehicle Availability by Sex in Melwood
The most prevalent vehicle ownership categories in Melwood are males with 1 vehicle (203, accounting for 28.7%) and females with 1 vehicle (169, making up 26.2%).
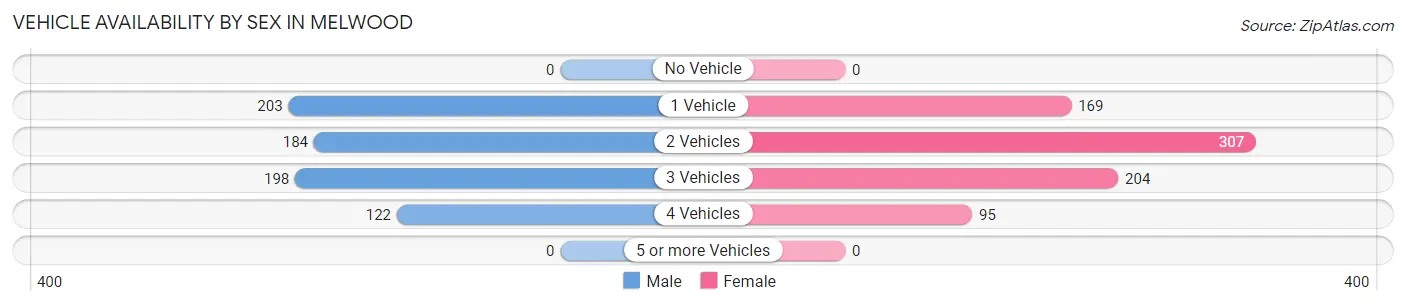
| Vehicles Available | Male | Female |
| No Vehicle | 0 (0.0%) | 0 (0.0%) |
| 1 Vehicle | 203 (28.7%) | 169 (21.8%) |
| 2 Vehicles | 184 (26.0%) | 307 (39.6%) |
| 3 Vehicles | 198 (28.0%) | 204 (26.3%) |
| 4 Vehicles | 122 (17.3%) | 95 (12.3%) |
| 5 or more Vehicles | 0 (0.0%) | 0 (0.0%) |
| Total | 707 (100.0%) | 775 (100.0%) |
Commute Time in Melwood
The most frequently occuring commute durations in Melwood are 60 to 89 minutes (224 commuters, 16.7%), 45 to 59 minutes (213 commuters, 15.9%), and 30 to 34 minutes (183 commuters, 13.6%).
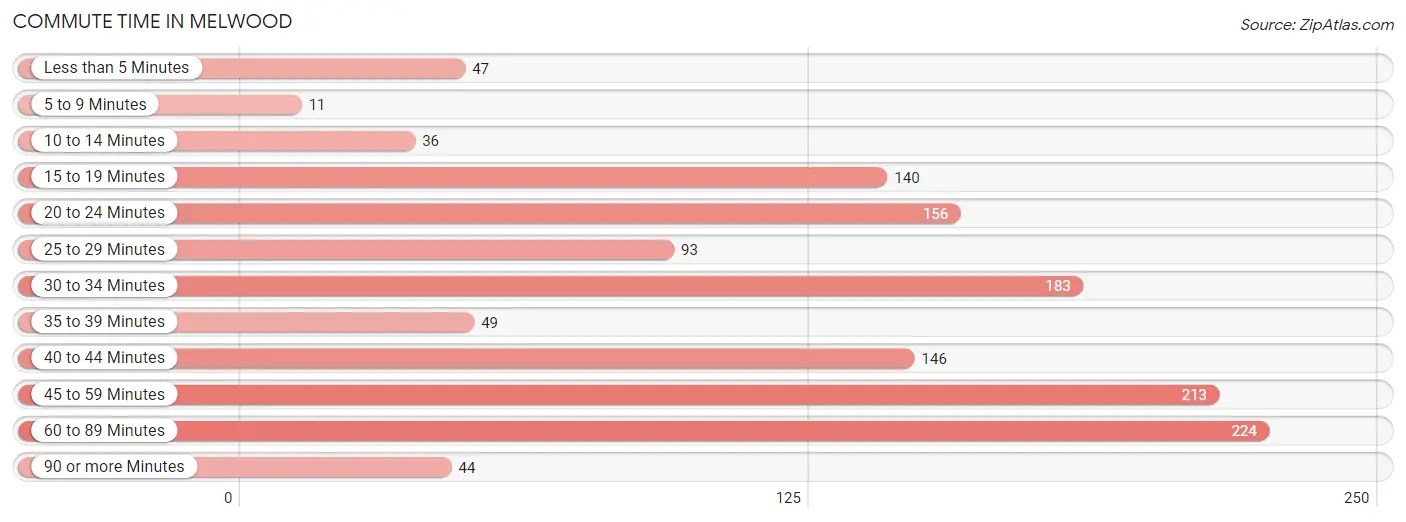
| Commute Time | # Commuters | % Commuters |
| Less than 5 Minutes | 47 | 3.5% |
| 5 to 9 Minutes | 11 | 0.8% |
| 10 to 14 Minutes | 36 | 2.7% |
| 15 to 19 Minutes | 140 | 10.4% |
| 20 to 24 Minutes | 156 | 11.6% |
| 25 to 29 Minutes | 93 | 6.9% |
| 30 to 34 Minutes | 183 | 13.6% |
| 35 to 39 Minutes | 49 | 3.6% |
| 40 to 44 Minutes | 146 | 10.9% |
| 45 to 59 Minutes | 213 | 15.9% |
| 60 to 89 Minutes | 224 | 16.7% |
| 90 or more Minutes | 44 | 3.3% |
Commute Time by Sex in Melwood
The most common commute times in Melwood are 60 to 89 minutes (129 commuters, 20.5%) for males and 45 to 59 minutes (123 commuters, 17.2%) for females.
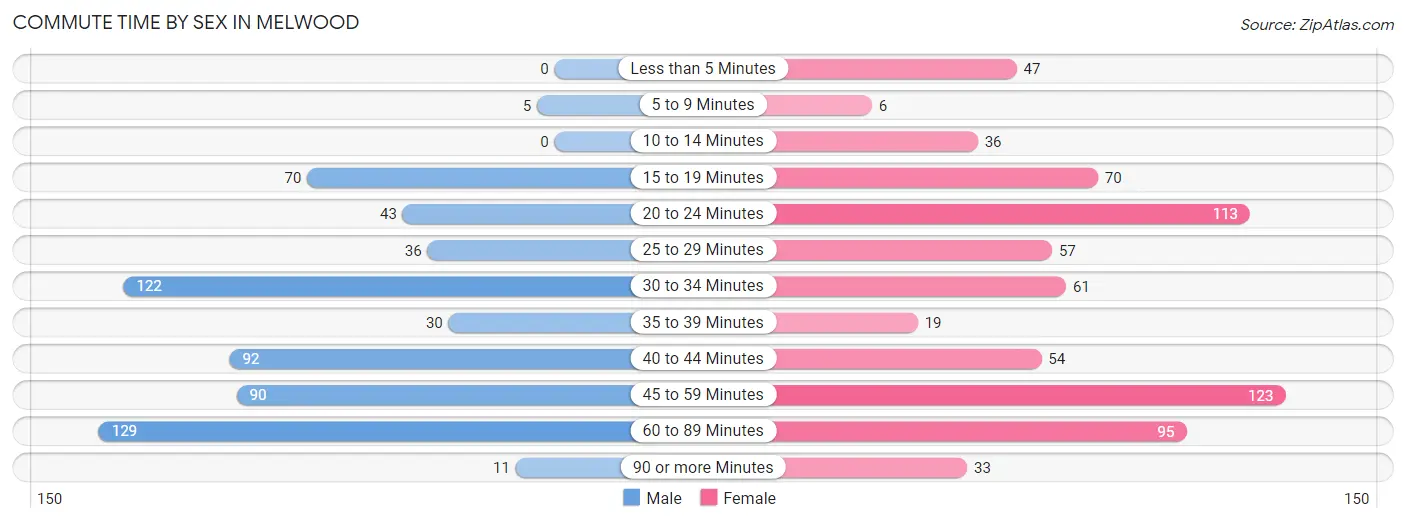
| Commute Time | Male | Female |
| Less than 5 Minutes | 0 (0.0%) | 47 (6.6%) |
| 5 to 9 Minutes | 5 (0.8%) | 6 (0.8%) |
| 10 to 14 Minutes | 0 (0.0%) | 36 (5.0%) |
| 15 to 19 Minutes | 70 (11.2%) | 70 (9.8%) |
| 20 to 24 Minutes | 43 (6.9%) | 113 (15.8%) |
| 25 to 29 Minutes | 36 (5.7%) | 57 (8.0%) |
| 30 to 34 Minutes | 122 (19.4%) | 61 (8.5%) |
| 35 to 39 Minutes | 30 (4.8%) | 19 (2.7%) |
| 40 to 44 Minutes | 92 (14.6%) | 54 (7.6%) |
| 45 to 59 Minutes | 90 (14.3%) | 123 (17.2%) |
| 60 to 89 Minutes | 129 (20.5%) | 95 (13.3%) |
| 90 or more Minutes | 11 (1.8%) | 33 (4.6%) |
Time of Departure to Work by Sex in Melwood
The most frequent times of departure to work in Melwood are 7:00 AM to 7:29 AM (204, 32.5%) for males and 5:30 AM to 5:59 AM (184, 25.8%) for females.
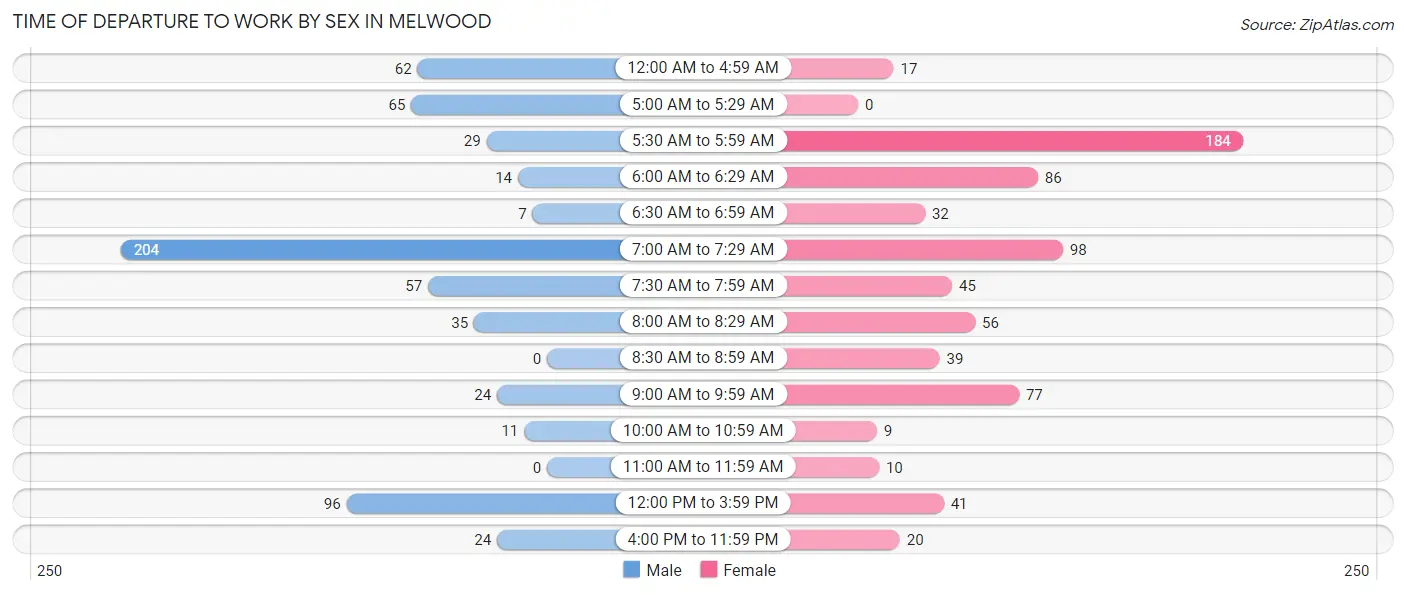
| Time of Departure | Male | Female |
| 12:00 AM to 4:59 AM | 62 (9.9%) | 17 (2.4%) |
| 5:00 AM to 5:29 AM | 65 (10.3%) | 0 (0.0%) |
| 5:30 AM to 5:59 AM | 29 (4.6%) | 184 (25.8%) |
| 6:00 AM to 6:29 AM | 14 (2.2%) | 86 (12.0%) |
| 6:30 AM to 6:59 AM | 7 (1.1%) | 32 (4.5%) |
| 7:00 AM to 7:29 AM | 204 (32.5%) | 98 (13.7%) |
| 7:30 AM to 7:59 AM | 57 (9.1%) | 45 (6.3%) |
| 8:00 AM to 8:29 AM | 35 (5.6%) | 56 (7.8%) |
| 8:30 AM to 8:59 AM | 0 (0.0%) | 39 (5.5%) |
| 9:00 AM to 9:59 AM | 24 (3.8%) | 77 (10.8%) |
| 10:00 AM to 10:59 AM | 11 (1.8%) | 9 (1.3%) |
| 11:00 AM to 11:59 AM | 0 (0.0%) | 10 (1.4%) |
| 12:00 PM to 3:59 PM | 96 (15.3%) | 41 (5.7%) |
| 4:00 PM to 11:59 PM | 24 (3.8%) | 20 (2.8%) |
| Total | 628 (100.0%) | 714 (100.0%) |
Housing Occupancy in Melwood
Occupancy by Ownership in Melwood
Of the total 1,557 dwellings in Melwood, owner-occupied units account for 1,285 (82.5%), while renter-occupied units make up 272 (17.5%).
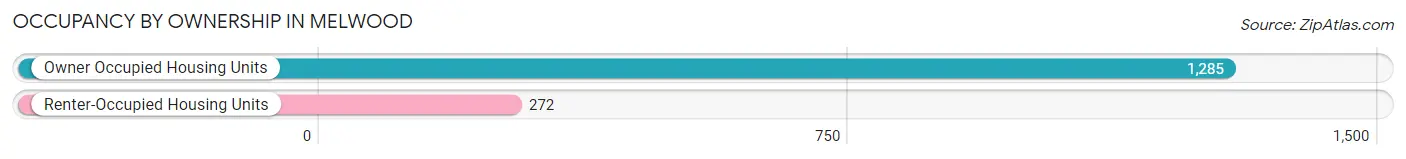
| Occupancy | # Housing Units | % Housing Units |
| Owner Occupied Housing Units | 1,285 | 82.5% |
| Renter-Occupied Housing Units | 272 | 17.5% |
| Total Occupied Housing Units | 1,557 | 100.0% |
Occupancy by Household Size in Melwood
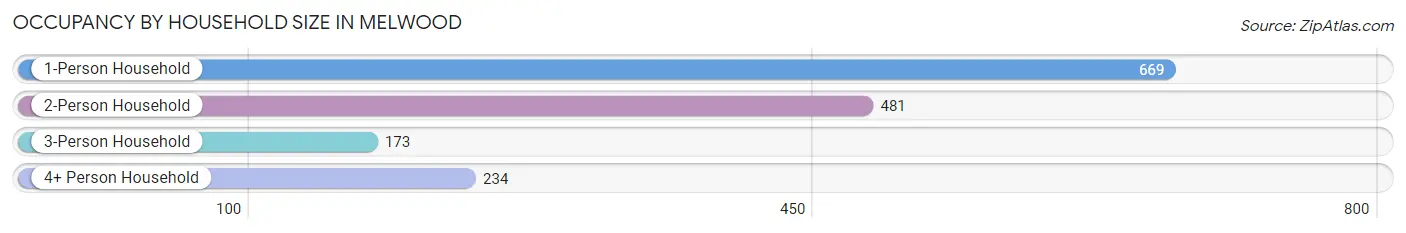
| Household Size | # Housing Units | % Housing Units |
| 1-Person Household | 669 | 43.0% |
| 2-Person Household | 481 | 30.9% |
| 3-Person Household | 173 | 11.1% |
| 4+ Person Household | 234 | 15.0% |
| Total Housing Units | 1,557 | 100.0% |
Occupancy by Ownership by Household Size in Melwood
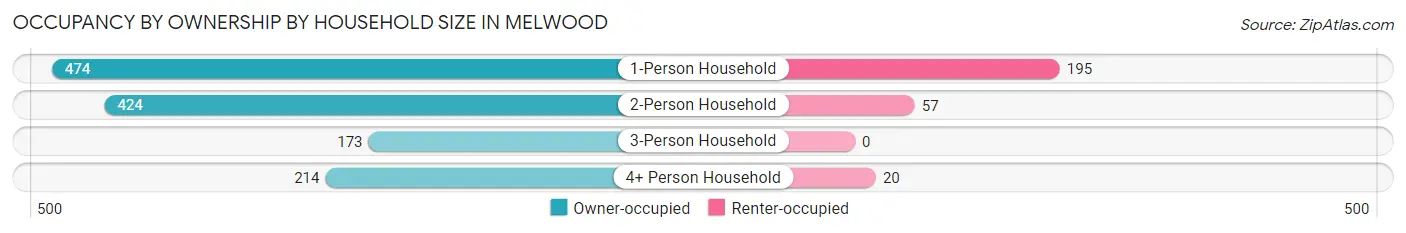
| Household Size | Owner-occupied | Renter-occupied |
| 1-Person Household | 474 (70.9%) | 195 (29.1%) |
| 2-Person Household | 424 (88.1%) | 57 (11.8%) |
| 3-Person Household | 173 (100.0%) | 0 (0.0%) |
| 4+ Person Household | 214 (91.4%) | 20 (8.6%) |
| Total Housing Units | 1,285 (82.5%) | 272 (17.5%) |
Occupancy by Educational Attainment in Melwood
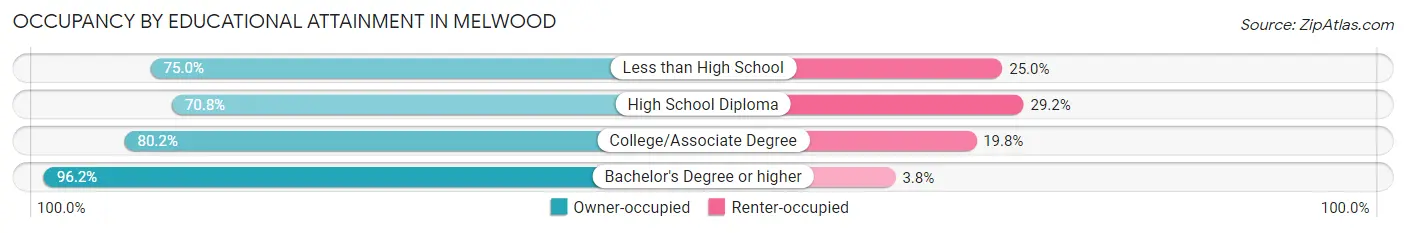
| Household Size | Owner-occupied | Renter-occupied |
| Less than High School | 201 (75.0%) | 67 (25.0%) |
| High School Diploma | 281 (70.8%) | 116 (29.2%) |
| College/Associate Degree | 275 (80.2%) | 68 (19.8%) |
| Bachelor's Degree or higher | 528 (96.2%) | 21 (3.8%) |
Occupancy by Age of Householder in Melwood
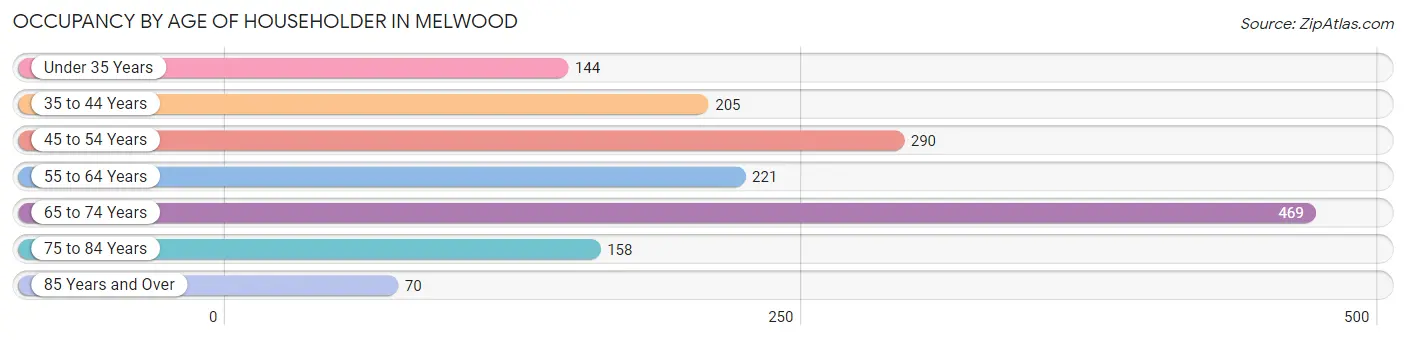
| Age Bracket | # Households | % Households |
| Under 35 Years | 144 | 9.2% |
| 35 to 44 Years | 205 | 13.2% |
| 45 to 54 Years | 290 | 18.6% |
| 55 to 64 Years | 221 | 14.2% |
| 65 to 74 Years | 469 | 30.1% |
| 75 to 84 Years | 158 | 10.2% |
| 85 Years and Over | 70 | 4.5% |
| Total | 1,557 | 100.0% |
Housing Finances in Melwood
Median Income by Occupancy in Melwood
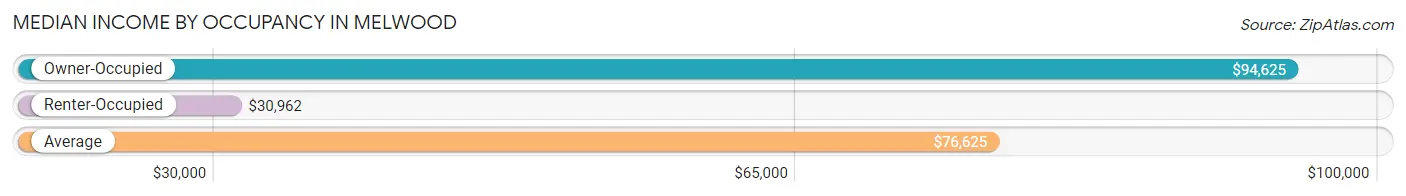
| Occupancy Type | # Households | Median Income |
| Owner-Occupied | 1,285 (82.5%) | $94,625 |
| Renter-Occupied | 272 (17.5%) | $30,962 |
| Average | 1,557 (100.0%) | $76,625 |
Occupancy by Householder Income Bracket in Melwood
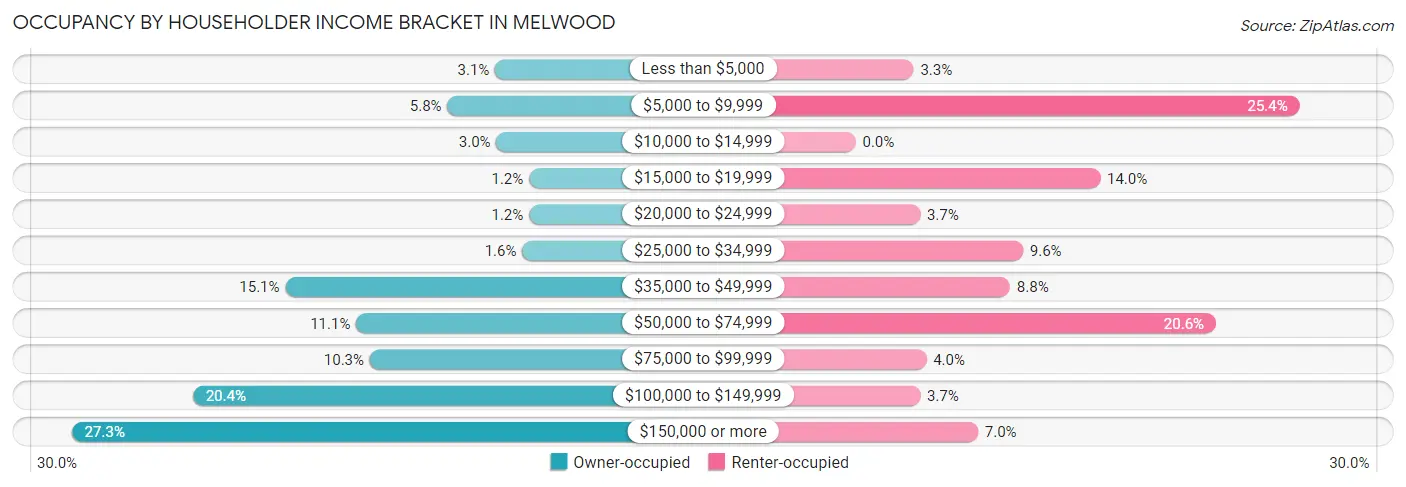
| Income Bracket | Owner-occupied | Renter-occupied |
| Less than $5,000 | 40 (3.1%) | 9 (3.3%) |
| $5,000 to $9,999 | 75 (5.8%) | 69 (25.4%) |
| $10,000 to $14,999 | 39 (3.0%) | 0 (0.0%) |
| $15,000 to $19,999 | 15 (1.2%) | 38 (14.0%) |
| $20,000 to $24,999 | 15 (1.2%) | 10 (3.7%) |
| $25,000 to $34,999 | 20 (1.6%) | 26 (9.6%) |
| $35,000 to $49,999 | 194 (15.1%) | 24 (8.8%) |
| $50,000 to $74,999 | 142 (11.1%) | 56 (20.6%) |
| $75,000 to $99,999 | 132 (10.3%) | 11 (4.0%) |
| $100,000 to $149,999 | 262 (20.4%) | 10 (3.7%) |
| $150,000 or more | 351 (27.3%) | 19 (7.0%) |
| Total | 1,285 (100.0%) | 272 (100.0%) |
Monthly Housing Cost Tiers in Melwood
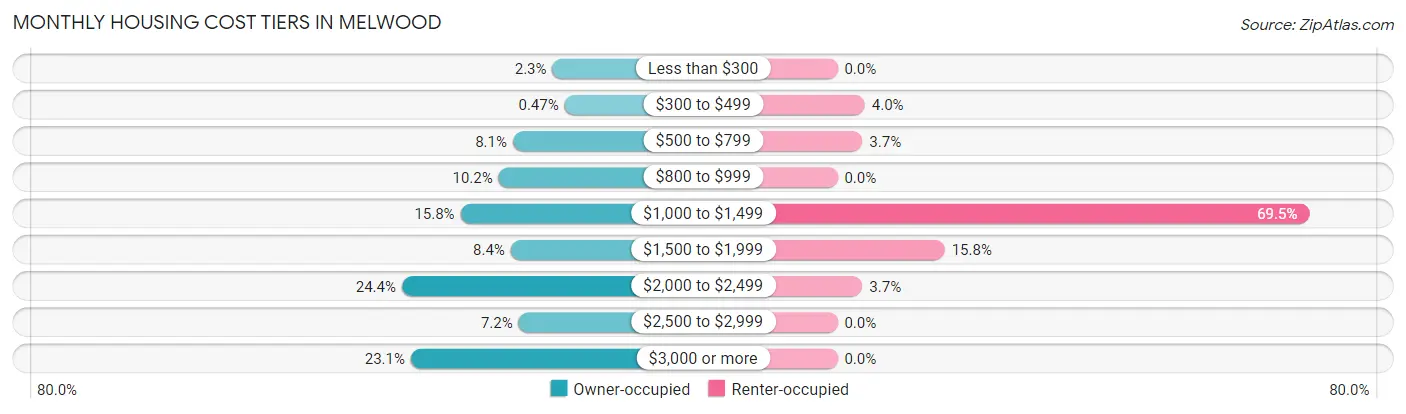
| Monthly Cost | Owner-occupied | Renter-occupied |
| Less than $300 | 29 (2.3%) | 0 (0.0%) |
| $300 to $499 | 6 (0.5%) | 11 (4.0%) |
| $500 to $799 | 104 (8.1%) | 10 (3.7%) |
| $800 to $999 | 131 (10.2%) | 0 (0.0%) |
| $1,000 to $1,499 | 203 (15.8%) | 189 (69.5%) |
| $1,500 to $1,999 | 108 (8.4%) | 43 (15.8%) |
| $2,000 to $2,499 | 314 (24.4%) | 10 (3.7%) |
| $2,500 to $2,999 | 93 (7.2%) | 0 (0.0%) |
| $3,000 or more | 297 (23.1%) | 0 (0.0%) |
| Total | 1,285 (100.0%) | 272 (100.0%) |
Physical Housing Characteristics in Melwood
Housing Structures in Melwood
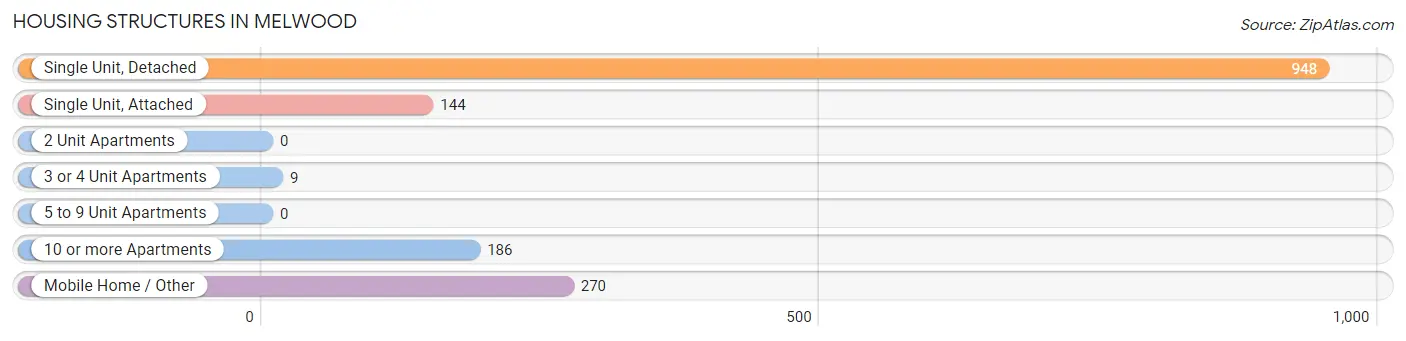
| Structure Type | # Housing Units | % Housing Units |
| Single Unit, Detached | 948 | 60.9% |
| Single Unit, Attached | 144 | 9.2% |
| 2 Unit Apartments | 0 | 0.0% |
| 3 or 4 Unit Apartments | 9 | 0.6% |
| 5 to 9 Unit Apartments | 0 | 0.0% |
| 10 or more Apartments | 186 | 11.9% |
| Mobile Home / Other | 270 | 17.3% |
| Total | 1,557 | 100.0% |
Housing Structures by Occupancy in Melwood

| Structure Type | Owner-occupied | Renter-occupied |
| Single Unit, Detached | 929 (98.0%) | 19 (2.0%) |
| Single Unit, Attached | 144 (100.0%) | 0 (0.0%) |
| 2 Unit Apartments | 0 (0.0%) | 0 (0.0%) |
| 3 or 4 Unit Apartments | 0 (0.0%) | 9 (100.0%) |
| 5 to 9 Unit Apartments | 0 (0.0%) | 0 (0.0%) |
| 10 or more Apartments | 0 (0.0%) | 186 (100.0%) |
| Mobile Home / Other | 212 (78.5%) | 58 (21.5%) |
| Total | 1,285 (82.5%) | 272 (17.5%) |
Housing Structures by Number of Rooms in Melwood
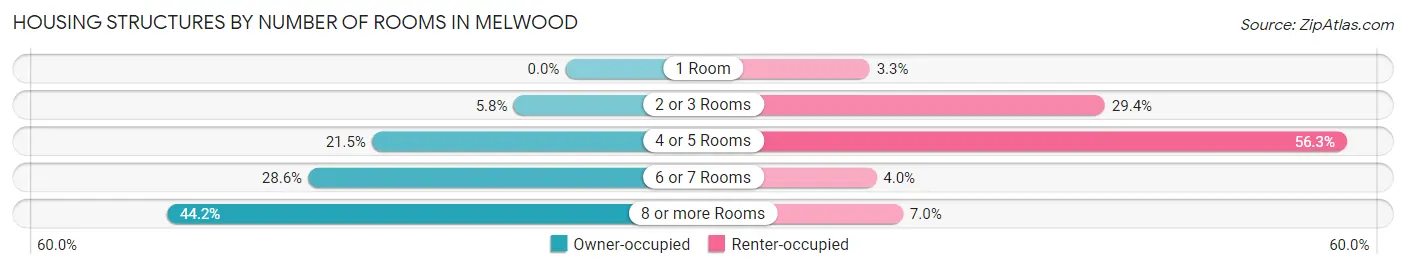
| Number of Rooms | Owner-occupied | Renter-occupied |
| 1 Room | 0 (0.0%) | 9 (3.3%) |
| 2 or 3 Rooms | 74 (5.8%) | 80 (29.4%) |
| 4 or 5 Rooms | 276 (21.5%) | 153 (56.2%) |
| 6 or 7 Rooms | 367 (28.6%) | 11 (4.0%) |
| 8 or more Rooms | 568 (44.2%) | 19 (7.0%) |
| Total | 1,285 (100.0%) | 272 (100.0%) |
Housing Structure by Heating Type in Melwood
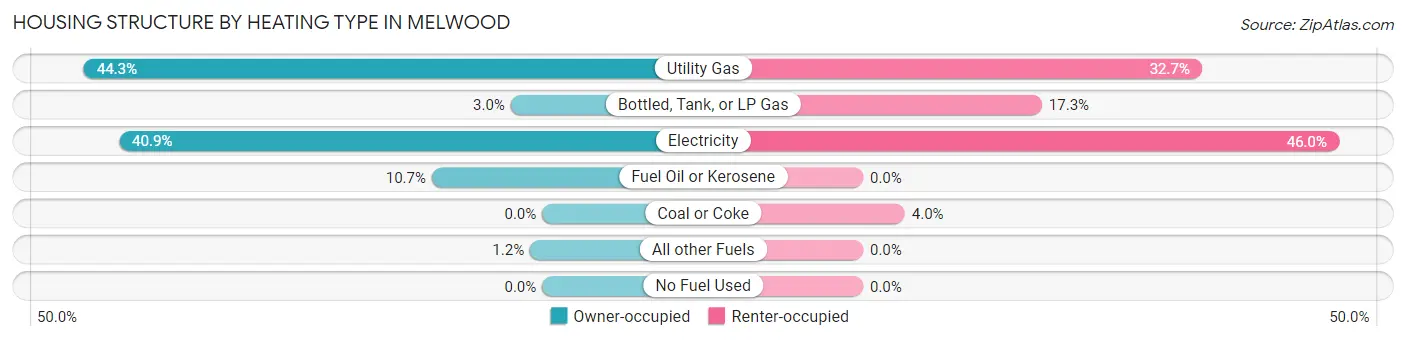
| Heating Type | Owner-occupied | Renter-occupied |
| Utility Gas | 569 (44.3%) | 89 (32.7%) |
| Bottled, Tank, or LP Gas | 39 (3.0%) | 47 (17.3%) |
| Electricity | 525 (40.9%) | 125 (46.0%) |
| Fuel Oil or Kerosene | 137 (10.7%) | 0 (0.0%) |
| Coal or Coke | 0 (0.0%) | 11 (4.0%) |
| All other Fuels | 15 (1.2%) | 0 (0.0%) |
| No Fuel Used | 0 (0.0%) | 0 (0.0%) |
| Total | 1,285 (100.0%) | 272 (100.0%) |
Household Vehicle Usage in Melwood
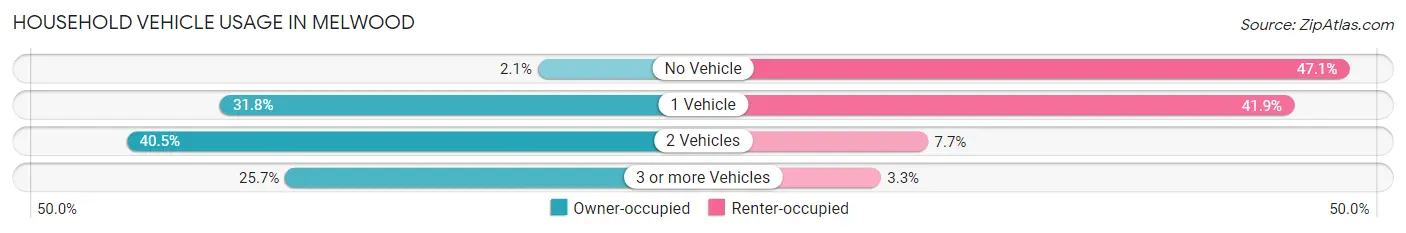
| Vehicles per Household | Owner-occupied | Renter-occupied |
| No Vehicle | 27 (2.1%) | 128 (47.1%) |
| 1 Vehicle | 408 (31.8%) | 114 (41.9%) |
| 2 Vehicles | 520 (40.5%) | 21 (7.7%) |
| 3 or more Vehicles | 330 (25.7%) | 9 (3.3%) |
| Total | 1,285 (100.0%) | 272 (100.0%) |
Real Estate & Mortgages in Melwood
Real Estate and Mortgage Overview in Melwood
| Characteristic | Without Mortgage | With Mortgage |
| Housing Units | 327 | 958 |
| Median Property Value | $265,800 | $440,500 |
| Median Household Income | $53,036 | $298 |
| Monthly Housing Costs | $873 | $297 |
| Real Estate Taxes | $4,455 | $91 |
Property Value by Mortgage Status in Melwood
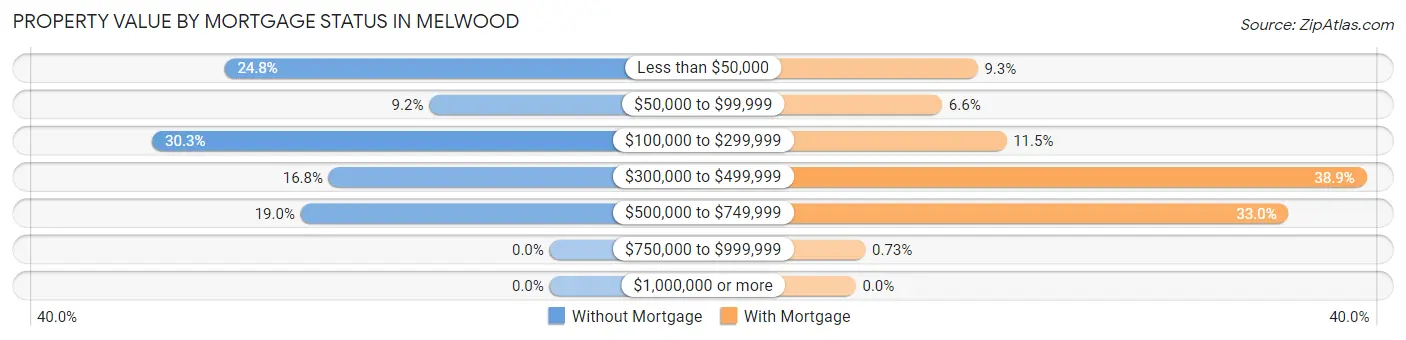
| Property Value | Without Mortgage | With Mortgage |
| Less than $50,000 | 81 (24.8%) | 89 (9.3%) |
| $50,000 to $99,999 | 30 (9.2%) | 63 (6.6%) |
| $100,000 to $299,999 | 99 (30.3%) | 110 (11.5%) |
| $300,000 to $499,999 | 55 (16.8%) | 373 (38.9%) |
| $500,000 to $749,999 | 62 (19.0%) | 316 (33.0%) |
| $750,000 to $999,999 | 0 (0.0%) | 7 (0.7%) |
| $1,000,000 or more | 0 (0.0%) | 0 (0.0%) |
| Total | 327 (100.0%) | 958 (100.0%) |
Household Income by Mortgage Status in Melwood
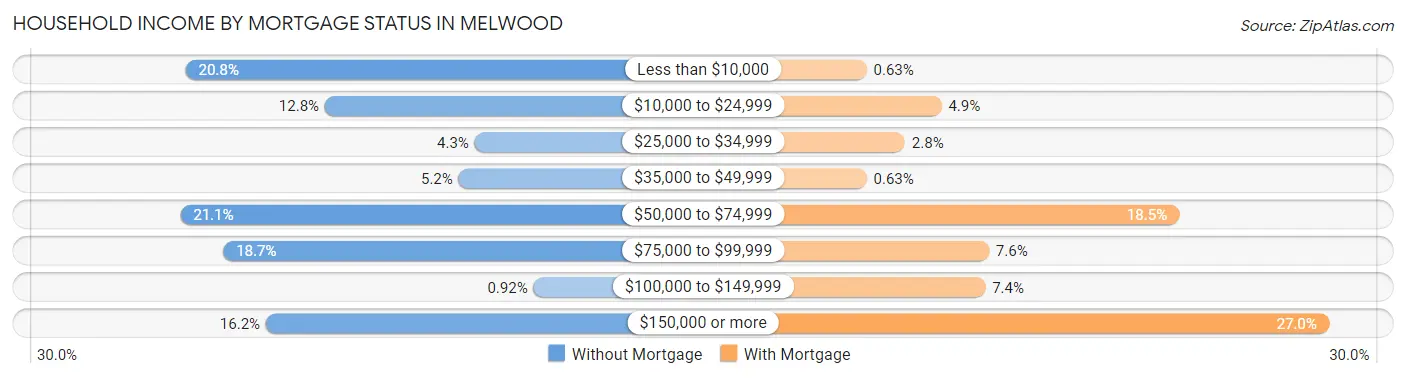
| Household Income | Without Mortgage | With Mortgage |
| Less than $10,000 | 68 (20.8%) | 6 (0.6%) |
| $10,000 to $24,999 | 42 (12.8%) | 47 (4.9%) |
| $25,000 to $34,999 | 14 (4.3%) | 27 (2.8%) |
| $35,000 to $49,999 | 17 (5.2%) | 6 (0.6%) |
| $50,000 to $74,999 | 69 (21.1%) | 177 (18.5%) |
| $75,000 to $99,999 | 61 (18.6%) | 73 (7.6%) |
| $100,000 to $149,999 | 3 (0.9%) | 71 (7.4%) |
| $150,000 or more | 53 (16.2%) | 259 (27.0%) |
| Total | 327 (100.0%) | 958 (100.0%) |
Property Value to Household Income Ratio in Melwood
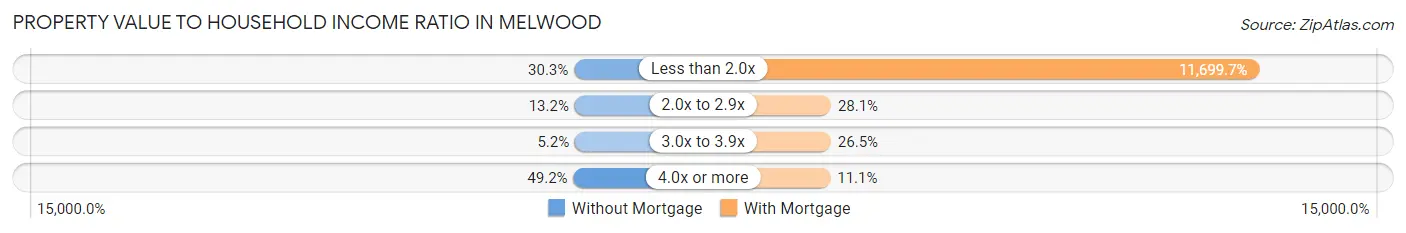
| Value-to-Income Ratio | Without Mortgage | With Mortgage |
| Less than 2.0x | 99 (30.3%) | 112,083 (11,699.7%) |
| 2.0x to 2.9x | 43 (13.2%) | 269 (28.1%) |
| 3.0x to 3.9x | 17 (5.2%) | 254 (26.5%) |
| 4.0x or more | 161 (49.2%) | 106 (11.1%) |
| Total | 327 (100.0%) | 958 (100.0%) |
Real Estate Taxes by Mortgage Status in Melwood
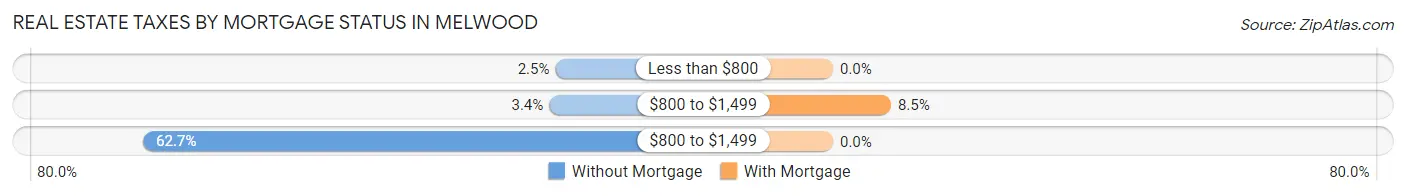
| Property Taxes | Without Mortgage | With Mortgage |
| Less than $800 | 8 (2.5%) | 0 (0.0%) |
| $800 to $1,499 | 11 (3.4%) | 81 (8.5%) |
| $800 to $1,499 | 205 (62.7%) | 0 (0.0%) |
| Total | 327 (100.0%) | 958 (100.0%) |
Health & Disability in Melwood
Health Insurance Coverage by Age in Melwood
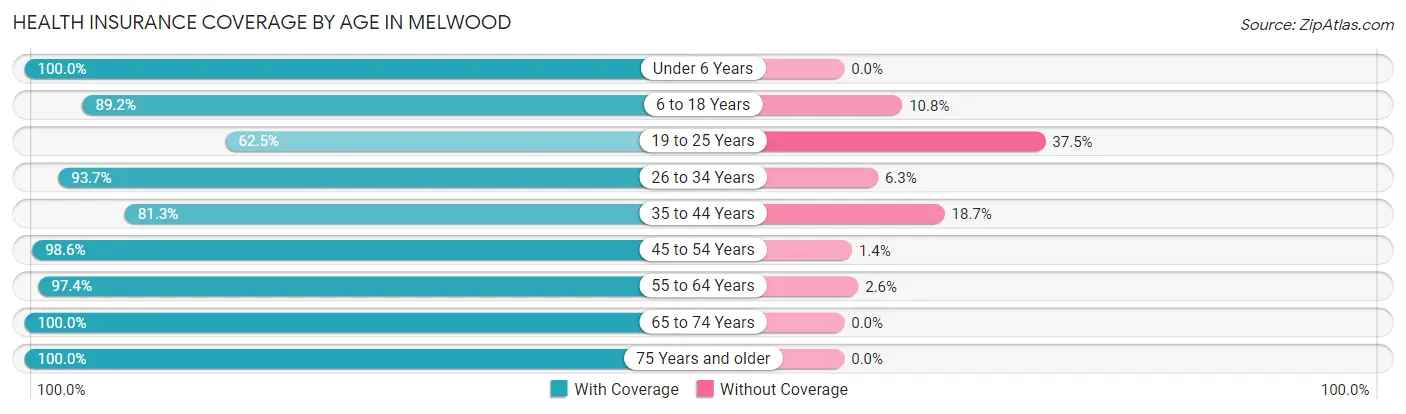
| Age Bracket | With Coverage | Without Coverage |
| Under 6 Years | 159 (100.0%) | 0 (0.0%) |
| 6 to 18 Years | 421 (89.2%) | 51 (10.8%) |
| 19 to 25 Years | 145 (62.5%) | 87 (37.5%) |
| 26 to 34 Years | 298 (93.7%) | 20 (6.3%) |
| 35 to 44 Years | 352 (81.3%) | 81 (18.7%) |
| 45 to 54 Years | 483 (98.6%) | 7 (1.4%) |
| 55 to 64 Years | 299 (97.4%) | 8 (2.6%) |
| 65 to 74 Years | 636 (100.0%) | 0 (0.0%) |
| 75 Years and older | 342 (100.0%) | 0 (0.0%) |
| Total | 3,135 (92.5%) | 254 (7.5%) |
Health Insurance Coverage by Citizenship Status in Melwood
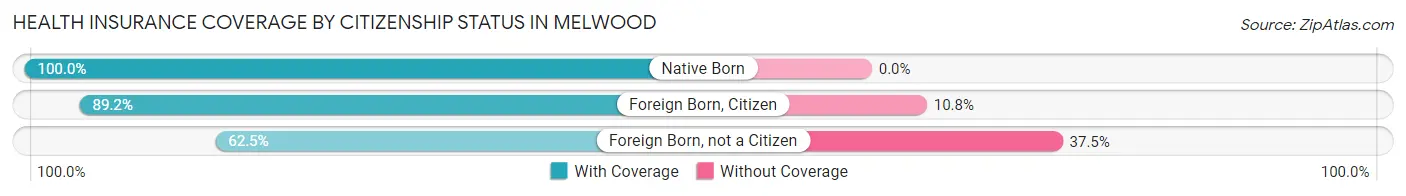
| Citizenship Status | With Coverage | Without Coverage |
| Native Born | 159 (100.0%) | 0 (0.0%) |
| Foreign Born, Citizen | 421 (89.2%) | 51 (10.8%) |
| Foreign Born, not a Citizen | 145 (62.5%) | 87 (37.5%) |
Health Insurance Coverage by Household Income in Melwood
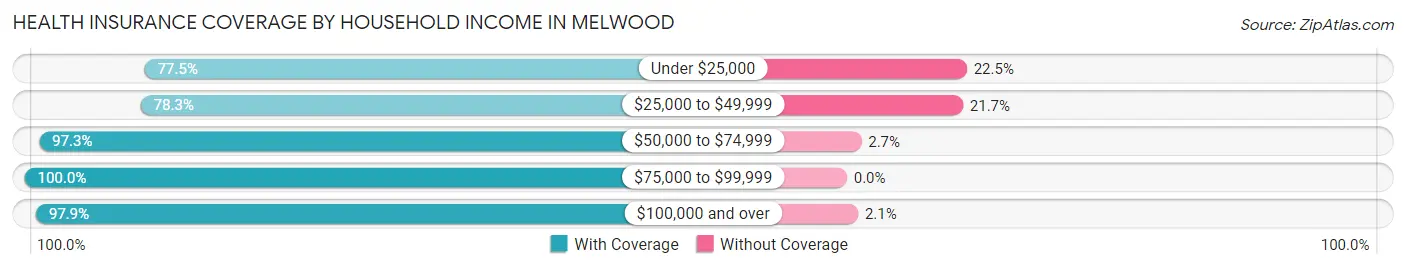
| Household Income | With Coverage | Without Coverage |
| Under $25,000 | 352 (77.5%) | 102 (22.5%) |
| $25,000 to $49,999 | 378 (78.3%) | 105 (21.7%) |
| $50,000 to $74,999 | 287 (97.3%) | 8 (2.7%) |
| $75,000 to $99,999 | 285 (100.0%) | 0 (0.0%) |
| $100,000 and over | 1,821 (97.9%) | 39 (2.1%) |
Public vs Private Health Insurance Coverage by Age in Melwood
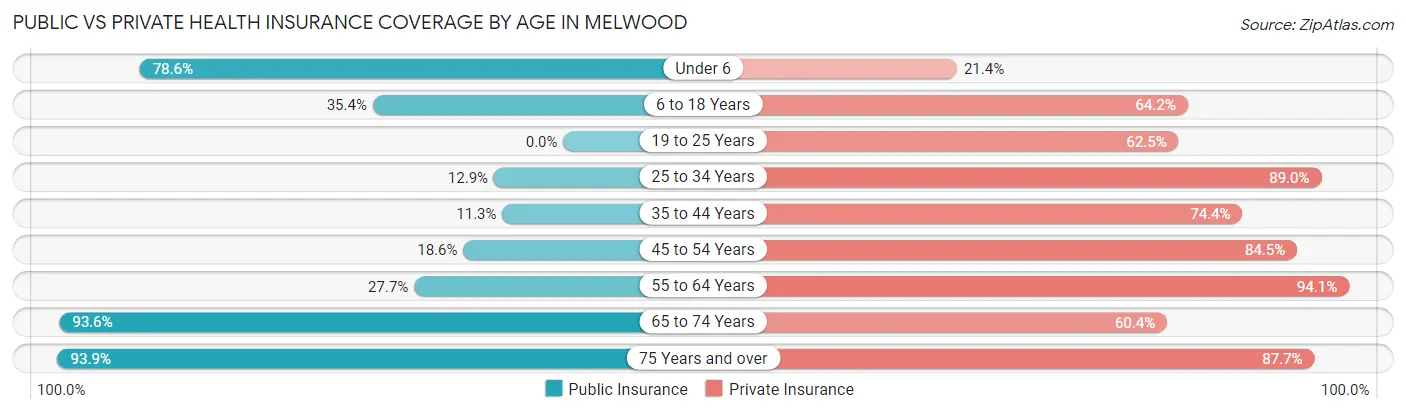
| Age Bracket | Public Insurance | Private Insurance |
| Under 6 | 125 (78.6%) | 34 (21.4%) |
| 6 to 18 Years | 167 (35.4%) | 303 (64.2%) |
| 19 to 25 Years | 0 (0.0%) | 145 (62.5%) |
| 25 to 34 Years | 41 (12.9%) | 283 (89.0%) |
| 35 to 44 Years | 49 (11.3%) | 322 (74.4%) |
| 45 to 54 Years | 91 (18.6%) | 414 (84.5%) |
| 55 to 64 Years | 85 (27.7%) | 289 (94.1%) |
| 65 to 74 Years | 595 (93.5%) | 384 (60.4%) |
| 75 Years and over | 321 (93.9%) | 300 (87.7%) |
| Total | 1,474 (43.5%) | 2,474 (73.0%) |
Disability Status by Sex by Age in Melwood
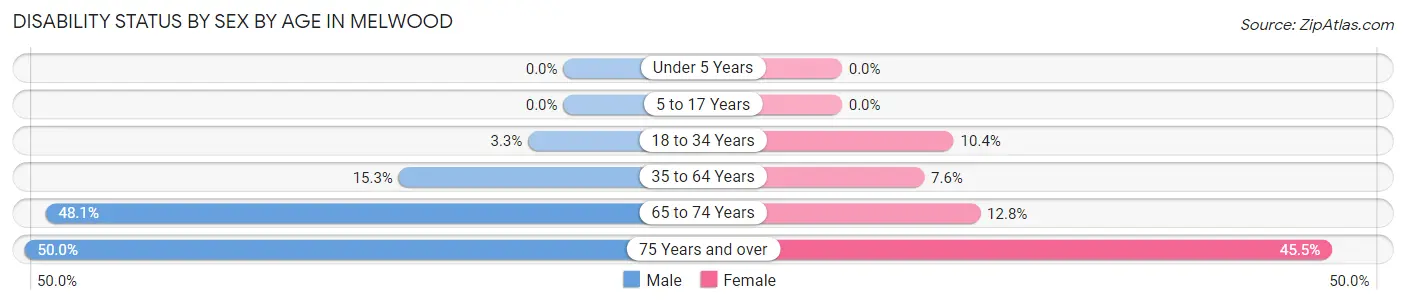
| Age Bracket | Male | Female |
| Under 5 Years | 0 (0.0%) | 0 (0.0%) |
| 5 to 17 Years | 0 (0.0%) | 0 (0.0%) |
| 18 to 34 Years | 7 (3.3%) | 44 (10.4%) |
| 35 to 64 Years | 90 (15.3%) | 49 (7.6%) |
| 65 to 74 Years | 111 (48.0%) | 52 (12.8%) |
| 75 Years and over | 71 (50.0%) | 91 (45.5%) |
Disability Class by Sex by Age in Melwood
Disability Class: Hearing Difficulty
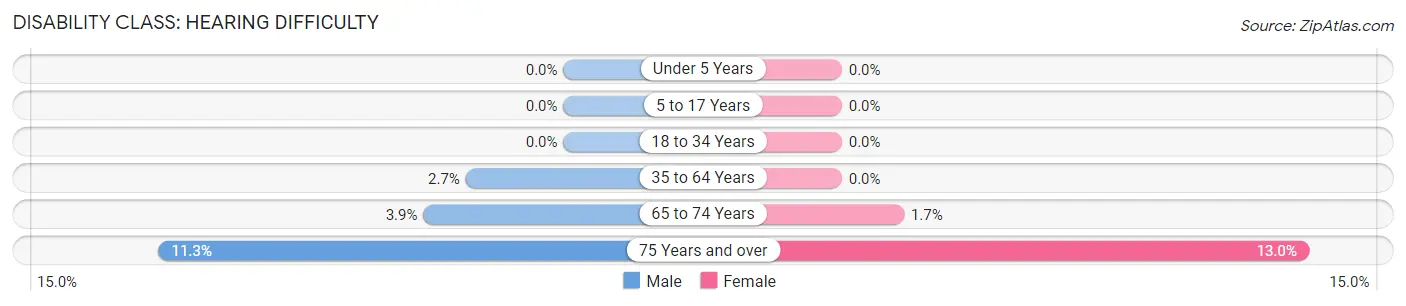
| Age Bracket | Male | Female |
| Under 5 Years | 0 (0.0%) | 0 (0.0%) |
| 5 to 17 Years | 0 (0.0%) | 0 (0.0%) |
| 18 to 34 Years | 0 (0.0%) | 0 (0.0%) |
| 35 to 64 Years | 16 (2.7%) | 0 (0.0%) |
| 65 to 74 Years | 9 (3.9%) | 7 (1.7%) |
| 75 Years and over | 16 (11.3%) | 26 (13.0%) |
Disability Class: Vision Difficulty
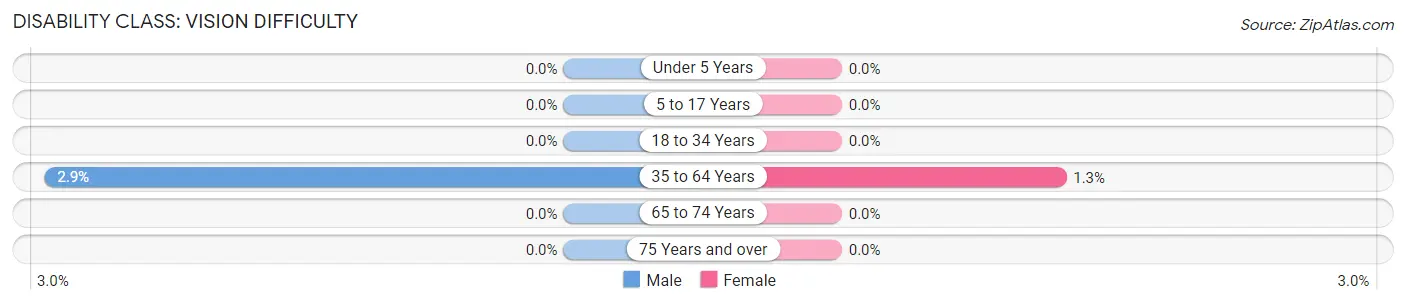
| Age Bracket | Male | Female |
| Under 5 Years | 0 (0.0%) | 0 (0.0%) |
| 5 to 17 Years | 0 (0.0%) | 0 (0.0%) |
| 18 to 34 Years | 0 (0.0%) | 0 (0.0%) |
| 35 to 64 Years | 17 (2.9%) | 8 (1.3%) |
| 65 to 74 Years | 0 (0.0%) | 0 (0.0%) |
| 75 Years and over | 0 (0.0%) | 0 (0.0%) |
Disability Class: Cognitive Difficulty
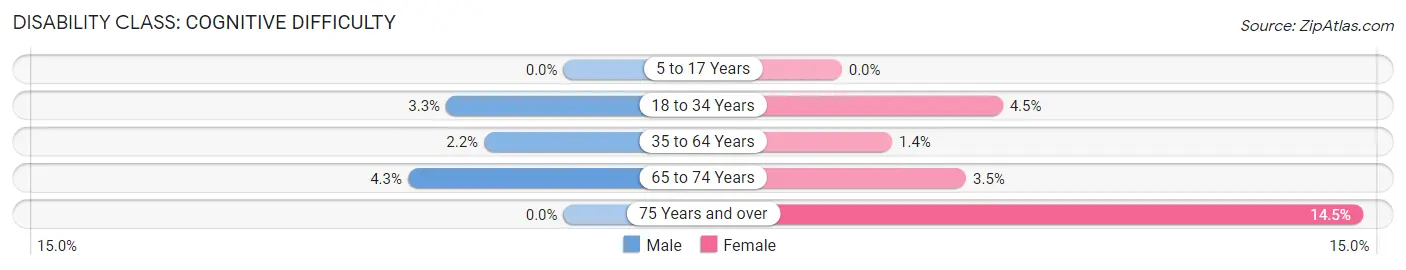
| Age Bracket | Male | Female |
| 5 to 17 Years | 0 (0.0%) | 0 (0.0%) |
| 18 to 34 Years | 7 (3.3%) | 19 (4.5%) |
| 35 to 64 Years | 13 (2.2%) | 9 (1.4%) |
| 65 to 74 Years | 10 (4.3%) | 14 (3.5%) |
| 75 Years and over | 0 (0.0%) | 29 (14.5%) |
Disability Class: Ambulatory Difficulty
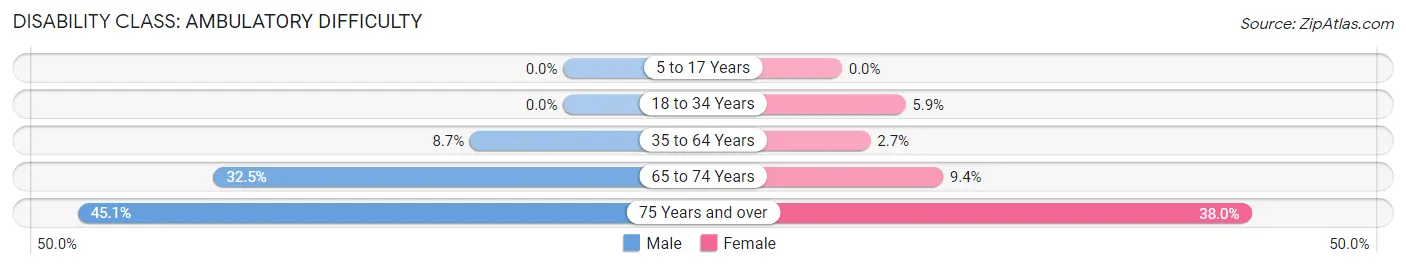
| Age Bracket | Male | Female |
| 5 to 17 Years | 0 (0.0%) | 0 (0.0%) |
| 18 to 34 Years | 0 (0.0%) | 25 (5.9%) |
| 35 to 64 Years | 51 (8.7%) | 17 (2.6%) |
| 65 to 74 Years | 75 (32.5%) | 38 (9.4%) |
| 75 Years and over | 64 (45.1%) | 76 (38.0%) |
Disability Class: Self-Care Difficulty
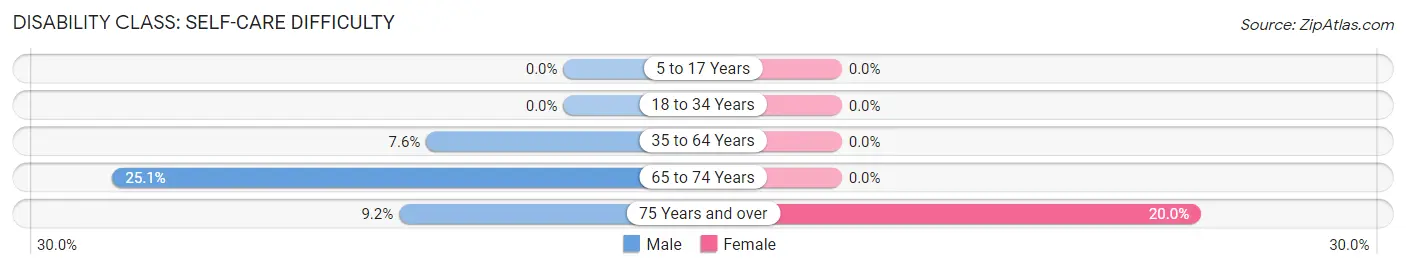
| Age Bracket | Male | Female |
| 5 to 17 Years | 0 (0.0%) | 0 (0.0%) |
| 18 to 34 Years | 0 (0.0%) | 0 (0.0%) |
| 35 to 64 Years | 45 (7.6%) | 0 (0.0%) |
| 65 to 74 Years | 58 (25.1%) | 0 (0.0%) |
| 75 Years and over | 13 (9.1%) | 40 (20.0%) |
Technology Access in Melwood
Computing Device Access in Melwood
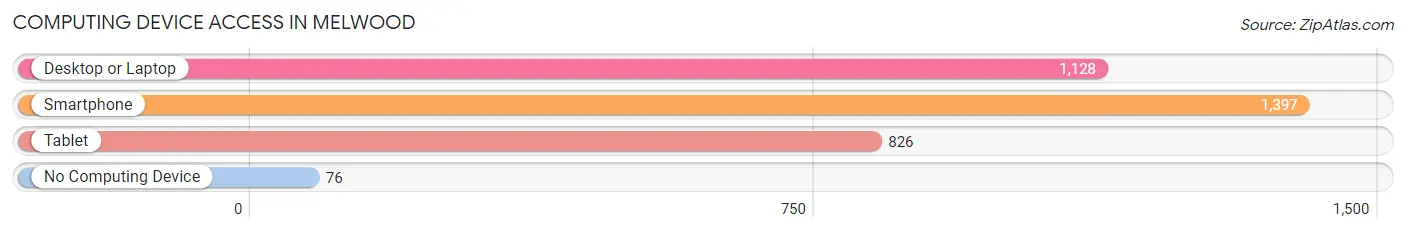
| Device Type | # Households | % Households |
| Desktop or Laptop | 1,128 | 72.5% |
| Smartphone | 1,397 | 89.7% |
| Tablet | 826 | 53.0% |
| No Computing Device | 76 | 4.9% |
| Total | 1,557 | 100.0% |
Internet Access in Melwood
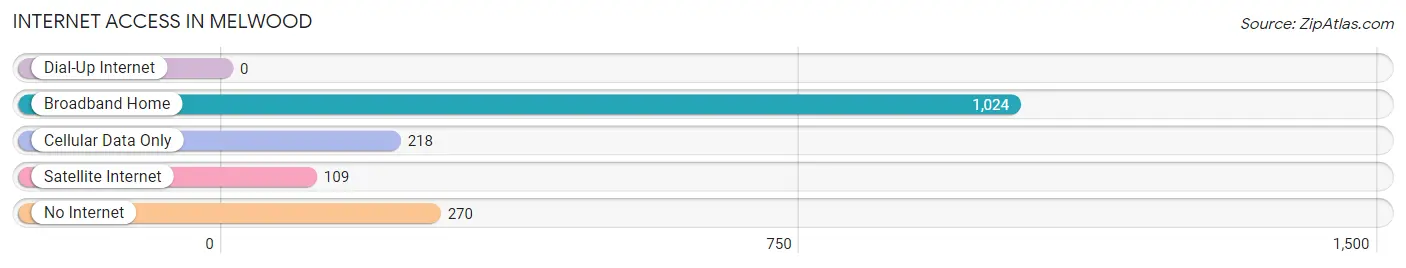
| Internet Type | # Households | % Households |
| Dial-Up Internet | 0 | 0.0% |
| Broadband Home | 1,024 | 65.8% |
| Cellular Data Only | 218 | 14.0% |
| Satellite Internet | 109 | 7.0% |
| No Internet | 270 | 17.3% |
| Total | 1,557 | 100.0% |
Melwood Summary
History
The area now known as Melwood, Maryland was first settled in the early 1700s by a group of English settlers. The area was originally part of Prince George's County, but was later annexed by Montgomery County in 1873. The area was originally known as "Melwood Station" due to the presence of a railroad station in the area. The station was built in 1873 and was used to transport goods and passengers between Washington, D.C. and Baltimore.
The area was largely rural until the 1950s, when the population began to grow rapidly due to the construction of the Washington Metro. The area was officially incorporated as the Town of Melwood in 1961. The town was named after the railroad station, which was named after a local landowner, Melville Wood.
Geography
Melwood is located in Montgomery County, Maryland, approximately 20 miles north of Washington, D.C. The town is situated on the banks of the Potomac River, and is bordered by the towns of Poolesville and Barnesville to the north, and the towns of Rockville and Gaithersburg to the south. The town covers an area of approximately 4.5 square miles, and has a population of approximately 5,000 people.
The town is located in a predominantly rural area, and is surrounded by rolling hills and farmland. The town is home to several parks and recreational areas, including the Melwood Recreation Center, which features a swimming pool, tennis courts, and a playground.
Economy
The economy of Melwood is largely based on the service industry. The town is home to several restaurants, retail stores, and other businesses. The town is also home to a number of government contractors, including Lockheed Martin and Northrop Grumman.
The town is also home to a number of small businesses, including a local brewery, a winery, and a number of antique stores. The town is also home to a number of farms, which produce a variety of fruits and vegetables.
Demographics
As of the 2010 census, the population of Melwood was 5,000 people. The racial makeup of the town was 79.2% White, 11.2% African American, 4.2% Asian, and 5.4% other. The median household income was $76,000, and the median home value was $400,000.
The town is home to a number of religious institutions, including a Catholic church, a Methodist church, and a Baptist church. The town is also home to a number of private schools, including the Melwood School, which serves students in grades K-8.
Conclusion
Melwood, Maryland is a small town located in Montgomery County, Maryland. The town is situated on the banks of the Potomac River, and is home to a population of approximately 5,000 people. The town is largely rural, and is home to a number of parks and recreational areas. The economy of the town is largely based on the service industry, and the town is home to a number of government contractors and small businesses. The town is also home to a number of religious institutions and private schools.
Common Questions
What is Per Capita Income in Melwood?
Per Capita income in Melwood is $47,798.
What is the Median Family Income in Melwood?
Median Family Income in Melwood is $131,544.
What is the Median Household income in Melwood?
Median Household Income in Melwood is $76,625.
What is Income or Wage Gap in Melwood?
Income or Wage Gap in Melwood is 8.5%.
Women in Melwood earn 91.5 cents for every dollar earned by a man.
What is Inequality or Gini Index in Melwood?
Inequality or Gini Index in Melwood is 0.48.
What is the Total Population of Melwood?
Total Population of Melwood is 3,438.
What is the Total Male Population of Melwood?
Total Male Population of Melwood is 1,454.
What is the Total Female Population of Melwood?
Total Female Population of Melwood is 1,984.
What is the Ratio of Males per 100 Females in Melwood?
There are 73.29 Males per 100 Females in Melwood.
What is the Ratio of Females per 100 Males in Melwood?
There are 136.45 Females per 100 Males in Melwood.
What is the Median Population Age in Melwood?
Median Population Age in Melwood is 46.0 Years.
What is the Average Family Size in Melwood
Average Family Size in Melwood is 3.1 People.
What is the Average Household Size in Melwood
Average Household Size in Melwood is 2.2 People.
How Large is the Labor Force in Melwood?
There are 1,594 People in the Labor Forcein in Melwood.
What is the Percentage of People in the Labor Force in Melwood?
54.5% of People are in the Labor Force in Melwood.
What is the Unemployment Rate in Melwood?
Unemployment Rate in Melwood is 5.2%.